
Assessing the Effects of Logistics Performance on Energy Trade


Abstract
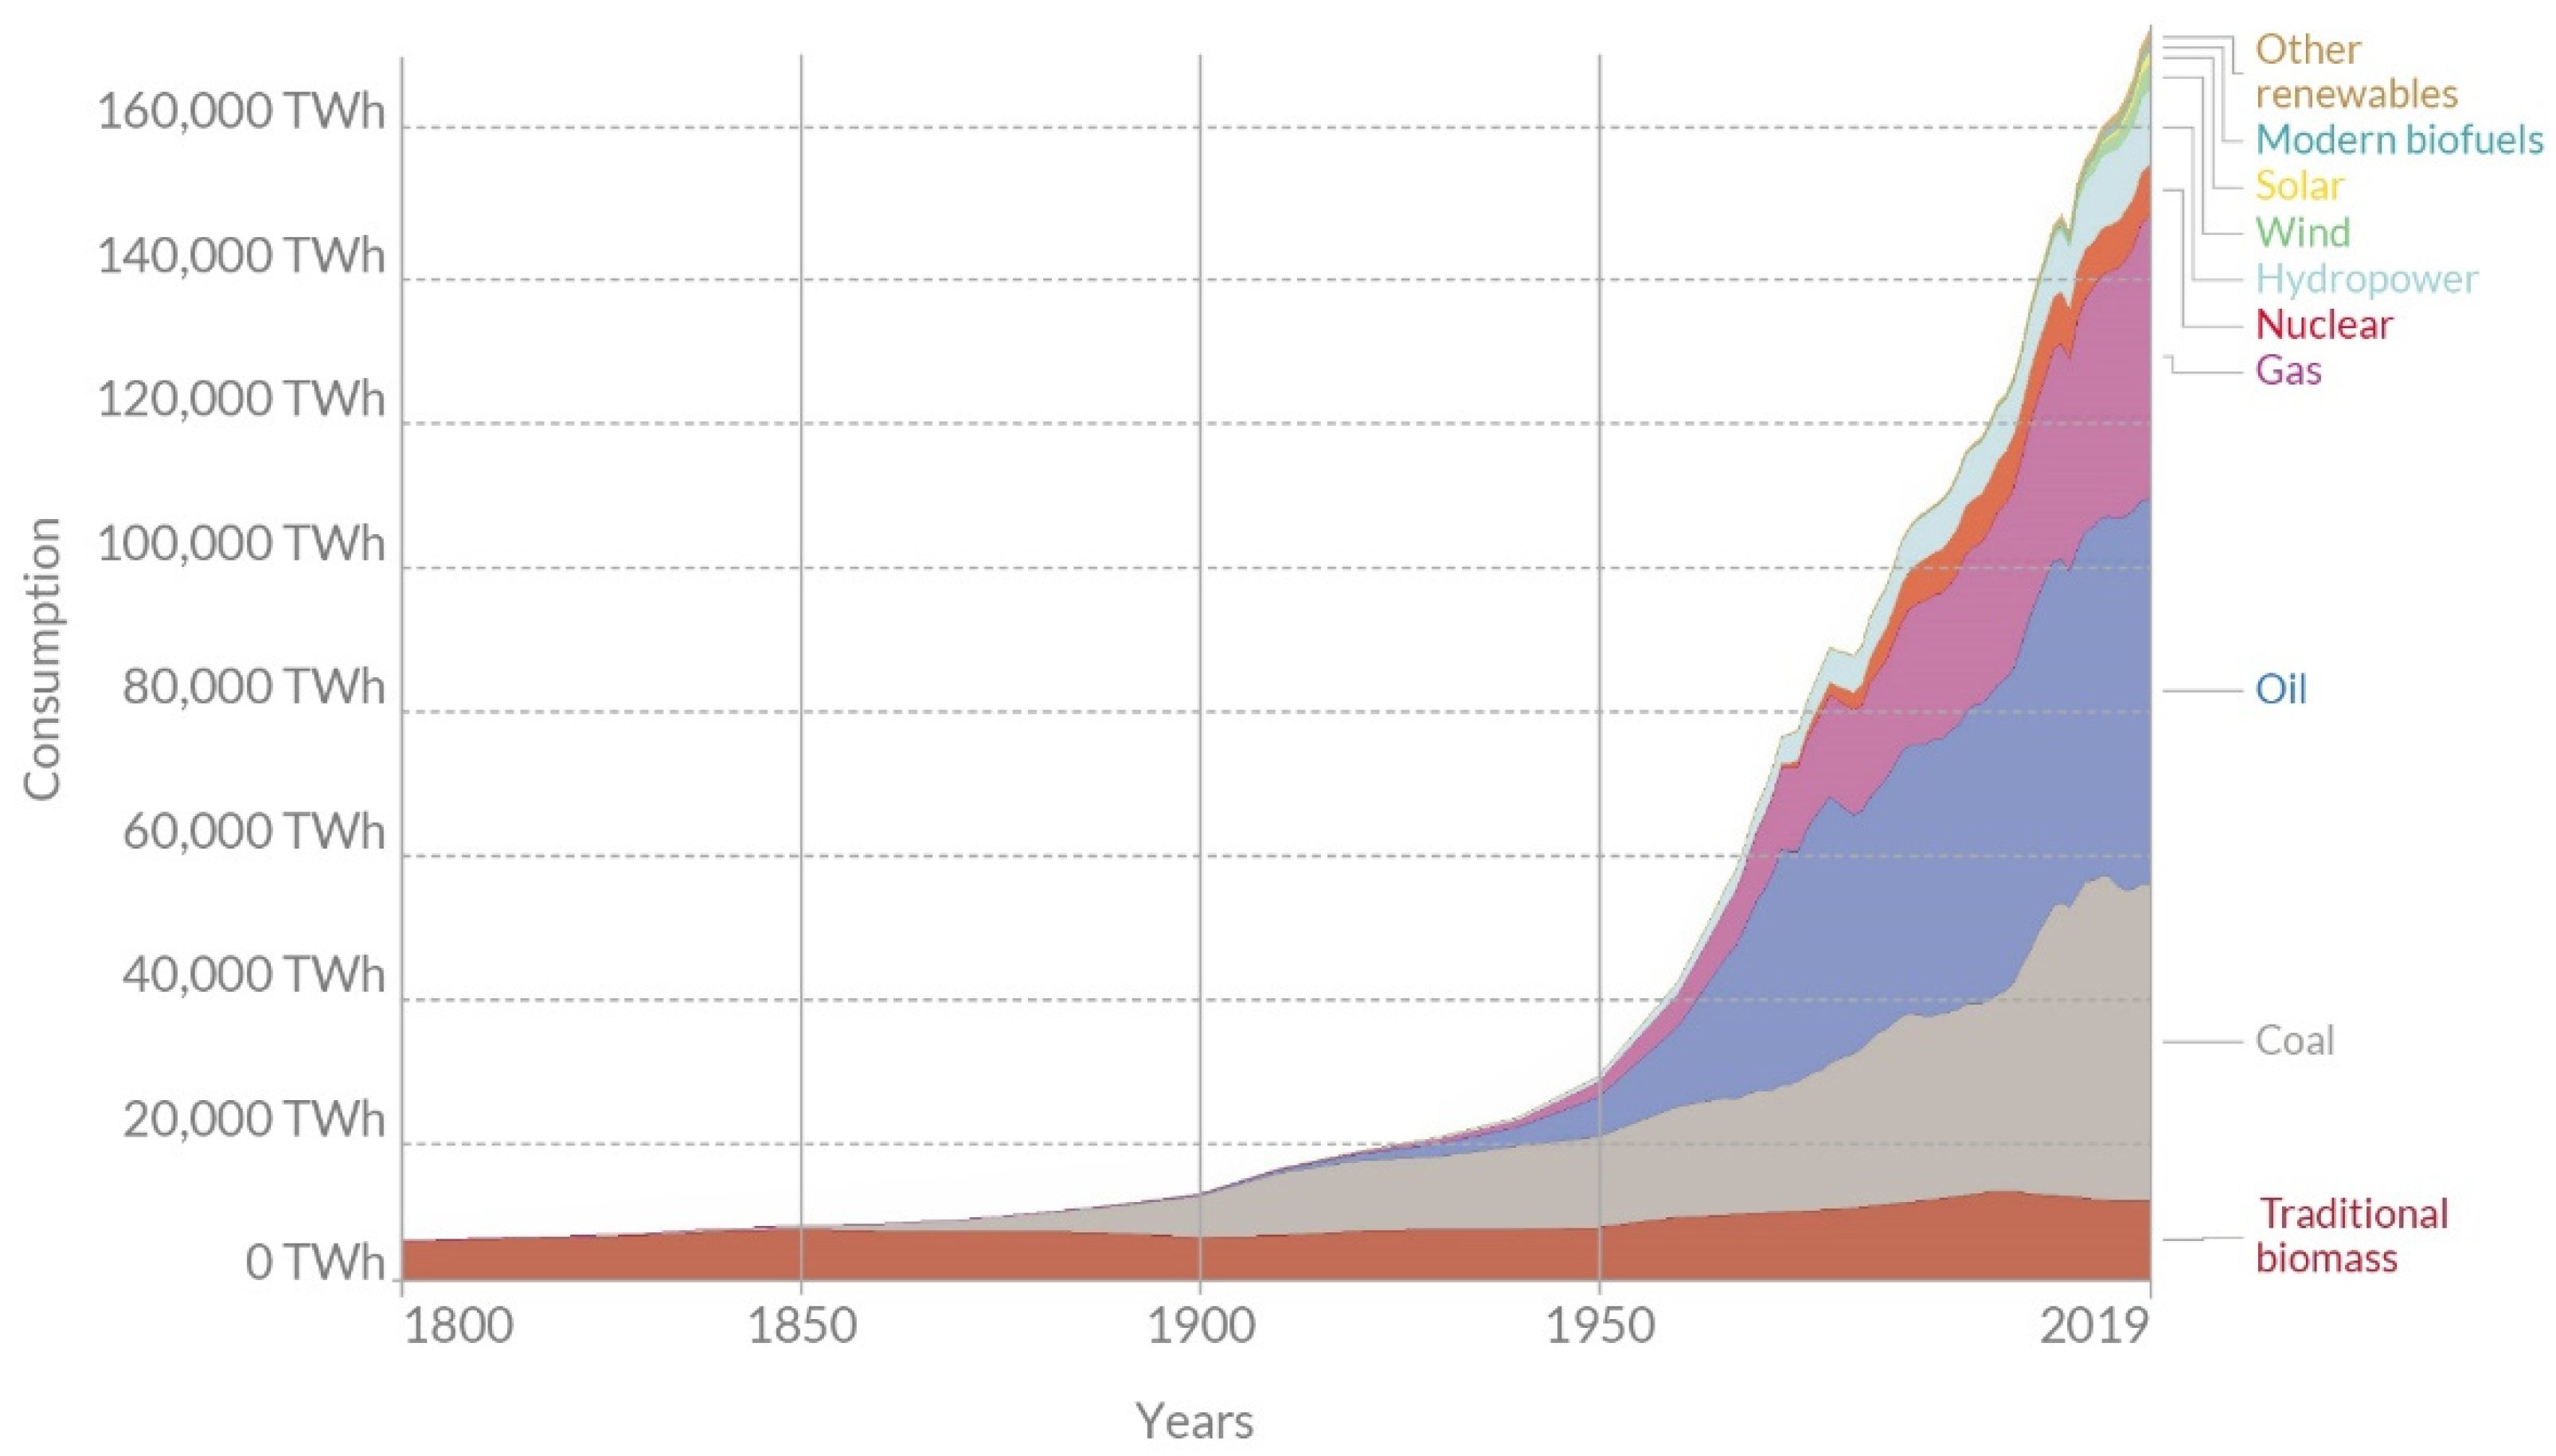
:1. Introduction
- -
- The good organization of customs clearance processes, such as speed, simplicity, and predictability;
- -
- The excellence of transport infrastructure: ports, railroads, roads, and information and communication technology, etc.;
- -
- The simplicity and affordability of handling shipments inside and outside the infrastructure;
- -
- The competence in the local logistics services industry, which measures the competence and quality of logistics service providers, such as transport operators and customs brokers;
- -
- The ability to track shipments throughout the logistics chain;
- -
- The regularity of when the deliveries reach the consignee within the scheduled or expected time.
2. Literature Review
3. Methodology
3.1. Research Methods
3.2. Data and Variables
4. Results
5. Discussion and Conclusions
Author Contributions
Funding
Institutional Review Board Statement
Informed Consent Statementt
Data Availability Statement
Conflicts of Interest
Appendix A

| Name of the Group | HS 4-Digit Heading |
|---|---|
| Solid | 2701, 2702, 2703, 2704, 2705, 2708, 2714, 2715 |
| Liquid | 2706, 2707, 2709, 2710, 2711, 2712, 2713 |
| Gas | 2705 |
References
- Li, X.; Chen, F. Impact of Logistics Development on Economic Growth: An Empirical Research from Guangdong Province in China. Complexity 2021, 2021, 1–12. [Google Scholar] [CrossRef]
- Guo, L.; Guo, H. Research on Granger causality between logistics industry and regional economic development in Yangtze River Delta. China Mark. 2020, 11, 1–4. [Google Scholar]
- Muslija, A.; Cinac, D.; Šahić, A. The relationship between economic growth and logistics sector in the case of G-7 countries. Transp. Res. Procedia 2021, 55, 326–333. [Google Scholar] [CrossRef]
- Domagała, J. Macro-logistics as tools for shaping today’s economy. Sci. J. Wars. Univ. Life Sci. Econ. Organ. Logist. 2020, 5, 31–44. [Google Scholar] [CrossRef]
- Saidi, S.; Mani, V.; Shahbaz, H.M.; Akhtar, P. Dynamic linkages between transport, logistics, foreign direct investment, and economic growth: Empirical evidence from developing countries. Transp. Res. Part A Policy Pract. 2020, 141, 277–293. [Google Scholar] [CrossRef]
- Baran, J.; Górecka, A.K. Economic and environmental aspects of inland transport in EU countries. Econ. Res.-Ekon. Istraživanja 2019, 32, 1037–1059. [Google Scholar] [CrossRef] [Green Version]
- Munimand, Z.H.; Schramm, H.-J. The impacts of port infrastructure and logistics performance on economic growth: The mediating role of seaborne trade. J. Shipp. Trade 2018, 3, 1–19. [Google Scholar] [CrossRef] [Green Version]
- Arvis, J.-F.; Ojala, L.; Wiederer, C.; Shepherd, B.; Raj, A.; Dairabayeva, K.; Kiiski, T. Connecting to Compete 2018 Trade Logistics in the Global Economy. The Logistics Performance Index and Its Indicators; The International Bank for Reconstruction and Development/The World Bank: Washington, DC, USA, 2018. [Google Scholar]
- Ritchie, H.; Roser, M. Energy. Available online: https://ourworldindata.org/energy (accessed on 19 November 2021).
- Fossil Fuels. Available online: https://ourworldindata.org/fossil-fuels (accessed on 19 November 2021).
- Zaninović, P.A.; Zaninović, V.; Skender, H.P. The effects of logistics performance on international trade: EU15 vs. CEMS. Econ. Res. -Ekon. Istraživanja 2021, 34, 1566–1582. [Google Scholar] [CrossRef]
- Kaplan, Z.; Bozyiğit, S. The effect of Turkey’s logistics performance on Turkey’s foreign trade. Int. J. Trade Glob. Mark. 2021, 14, 48–61. [Google Scholar] [CrossRef]
- Jouili, T.A.; Khemissi, F.M. The Impact of Logistics Performance on International Seaborne. Int. J. Comput. Sci. Netw. Secur. 2019, 19, 68–73. [Google Scholar]
- Zhan, C.; Wang, C. Study on the Relationship between Logistics Industry and Foreign Trade in Sichuan Based on VAR Model. In Proceedings of the International Academic Conference on Frontiers in Social Sciences and Management Innovation (IAFSM 2018), Beijing, China, 28–29 December 2019; pp. 178–182. [Google Scholar] [CrossRef] [Green Version]
- Çelebi, D. The role of logistics performance in promoting trade. Marit. Econ. Logist. 2019, 21, 307–323. [Google Scholar] [CrossRef]
- Katrakylidis, I.; Madas, M. International Trade and Logistics: An Empirical Panel Investigation of the Dynamic Linkages between the Logistics and Trade and their Contribution to Economic Growth. Int. J. Econ. Bus. Adm. 2019, 7, 3–21. [Google Scholar] [CrossRef] [Green Version]
- Wang, D.F.; Dong, Q.-L.; Peng, Z.-M.; Khan, S.A.R.; Tarasov, A. The Green Logistics Impact on International Trade: Evidence from Developed and Developing Countries. Sustainability 2018, 10, 2235. [Google Scholar] [CrossRef] [Green Version]
- Gani, A. The Logistics Performance Effect in International Trade. Asian J. Shipp. Logist. 2017, 33, 279–288. [Google Scholar] [CrossRef]
- Bensassi, S.; Márquez-Ramos, L.; Martínez-Zarzoso, I. Relationship between logistics infrastructure and trade: Evidence from Spanish regional exports. Transp. Res. Part A 2015, 72, 47–61. [Google Scholar] [CrossRef]
- Martí, L.; Puertas, R.; García, L. The importance of the Logistics Performance Index in international trade. Appl. Econ. 2014, 46, 2982–2992. [Google Scholar] [CrossRef]
- Puertas, R.; Marti, L.; Garcia, L. Logistics performance and export competitiveness: European experience. Empirica 2014, 41, 467–480. [Google Scholar] [CrossRef]
- Hausman, W.H.; Lee, H.L.; Subramanian, U. The impact of logistics performance on trade. Prod. Oper. Manag. 2013, 22, 236–252. [Google Scholar] [CrossRef]
- Xun, O.X.; Fuhua, H. Research on dynamic correlation between China’s logistics industry and domestic and foreign trade: Empirical evidence from VAR model and VEC model. Financ. Rev. 2012, 1, 9–14. [Google Scholar]
- Hoekman, B.B.; Nicita, A. Trade policy, trade costs, and developing country trade. World Dev. 2011, 39, 2069–2079. [Google Scholar] [CrossRef] [Green Version]
- Nguyen, H.O.O.; Tongzon, J. Casual nexus between the transport and logistics sector and trade: The case of Australia. Transp. Policy 2010, 17, 135–146. [Google Scholar] [CrossRef]
- Narayan, S.; Nguyen, T.T. Are Exports More Responsive to Clean or Dirty Energy? The Case of Vietnam’s Exports to 54 Countries. Energies 2019, 12, 1558. [Google Scholar] [CrossRef] [Green Version]
- Khan, N.; Dilshad, S.; Khalid, R.; Kalair, A.R.; Abas, N. Review of energy storage and transportation of energy. Energy Storage 2019, 1, e49. [Google Scholar] [CrossRef]
- Anderson, J.E.; van Wincoop, E. Trade Costs. J. Econ. Lit. 2004, 42, 691–751. [Google Scholar] [CrossRef]
- World Trade Organization. A Practical Guide to Trade Policy Analysis; UNCTAD/WTO Trade Policy Analysis Book Series; UNCTAD: Geneva, Switzerland, 2016; Available online: https://www.wto.org/english/res_e/publications_e/wto_unctad12_e.pdf (accessed on 2 December 2021).
- Tinbergen, J. An Analysis of World Trade Flows. In Shaping the World Economy; Tinbergen, J., Ed.; The Twentieth Century Fund: New York, NY, USA, 1962; pp. 27–30. [Google Scholar]
- Chaney, T. The Gravity Equation in International Trade: An Explanation. J. Political Econ. 2018, 126, 150–177. [Google Scholar] [CrossRef] [Green Version]
- Shepherd, B.; Doytchinova, H.S.; Kravchenko, A. The Gravity Model of International Trade: A User Guide [R Version]; United Nations ESCAP: Bangkok, Thailand, 2019; Available online: https://www.unescap.org/resources/gravity-model-international-trade-user-guide-r-version (accessed on 2 December 2021).
- Bugarčić, F.; Skvarciany, V.; Stanišić, N. Logistics performance index in international trade: Case of Central and Eastern European and Western Balkans countries. Bus. Theory Pract. 2020, 21, 452–459. [Google Scholar] [CrossRef]
- Host, A.; Skender, H.P.; Zaninović, P.A. Trade Logistics—the Gravity Model Approach. Zb. Rad. Ekon. Fak. U Rijeci/Proc. Rij. Fac. Econ. 2019, 37, 327–342. [Google Scholar] [CrossRef]
- Behar, A.; Manners, P. Logistics and Exports; CSAE Working Paper Series 2008–2013; Centre for the Study of African Economies, University of Oxford: Oxford, UK, 2008. [Google Scholar]
- Santos Silva, J.; Tenreyro, S. The log of gravity. Rev. Econ. Stat. 2006, 88, 641–658. [Google Scholar] [CrossRef] [Green Version]
- Kejžar, K.Z.; Kostevc, Č.; Zaninović, V. The role of regional economic integrations for trade margins: A case of Croatia. Zb. Rad. Ekon. Fak. U Rijeci/Proc. Rij. Fac. Econ. 2016, 34, 11–41. [Google Scholar] [CrossRef]
- Saslavsky, D.; Shepherd, B. Facilitating international production networks: The role of trade logistics. J. Int. Trade Econ. Dev. 2014, 23, 979–999. [Google Scholar] [CrossRef]


| Authors | Trade | Research Areas | Model/Estimator | Findings |
|---|---|---|---|---|
| Zaninović et al. [11] | international bilateral trade | UE-28 and its 129 trading countries | Structural gravity model, Poisson pseudo-maximum probability estimator LPI sub-groups |
|
| Kaplan and Bozyiğit [12] | foreign trade | Turkey and its 26 trade countries | Regression model |
|
| Jouili and Khemissi [13] | seaborne trade | Tunisia | Comparison analysis LPI sub-groups and Seaborne trade |
|
| Zhan and Wang [14] | foreign trade | Sichuan Province | VAR model |
|
| Çelebi [15] | international trade | low-, medium- and high-income economies | Gravity model |
|
| Katrakylidis and Madas [16] | 39 worldwide countries | Panel unit root tests, pooled mean group (PMG) models, Granger-causality analysis |
| |
| Wang et al. [17] | international trade | developing countries | Augmented gravity model with semi-economic and political variables Logistics CO2 intensity, Environmental logistics performance index |
|
| Gani [18] | international trade | 60 countries | Cross-sectional estimation, time-series data 6 LPI sub-groups |
|
| Bensassi et al. [19] | international trade | 19 Spanish regions to 64 destinations | Augmented gravity model including logistics and transport infrastructure indicators |
|
| Martí et al. [20] | international trade | Africa, South America, Far East, Middle East, and Eastern Europe | Gravity model LPI sub-groups |
|
| Puertas et al. [21] | international and domestic trade | Europe | Gravity models with the two-stage Heckman model LPI sub-groups |
|
| Hausman et al. [22] | international trade | 80 countries | Gravity model 3 sub-groups of LPI: time, cost, and reliability |
|
| Xun and Fuhua [23] | international and domestic trade | China | VAR model VEC model |
|
| Hoekman and Nicita [24] | international trade | low-income countries | Cross-section gravity model distance, adjacency, common language, access to the sea and trade policy variables |
|
| Nguyen and Tongzon [25] | bilateral trade | Australia–China Australia–Japan Australia–US | VAR model |
|
| Variable | Indicator | Description | Source |
|---|---|---|---|
| Dependent variable(s) | (export) (import) | The absolute values of export and import in US dollars | UN Comtrade database |
| Independent variables | (Gross domestic product) | The natural logarithm of gross domestic product | World Bank Open Data |
| (distance) | Geographical distance between capital cities of reporting country i and partner country j in kilometers | CEPII | |
| (contiguity) | Dummy variable with value 1 in the case when reporting country i and partner country j share a common border, and with value 0 if they do not | CEPII | |
| (Logistics Performance Index) | The Logistics Performance Index (LPI) is compiled based on a global survey of more than 5000 international freight forwarding and logistics companies. Each respondent rates their trade logistics experience (in six components, i.e., customs, infrastructure, international, logistics, tracking, timeliness) in the eight countries with which they trade the most. Based on their responses, LPI sub-components are constructed using principal component analysis (PCA). The indices can take values between zero and five, with zero being the worst and five being the best. For a detailed explanation of how the indices are constructed, see the Connecting to Compete Report [8]. | World Bank, Connecting to Compete Reports (2010–2018) | |
| group | Dummy variable which has the value 1 if the trade flows (export or import) take place within EU countries, or it has the value 0 if the trade flows (export or import) take place between EU countries and third countries (ROW-rest of the world). | CEPII |
| Variable | Observation | Mean | Standard Deviation | Minimum | Median | Maximum |
|---|---|---|---|---|---|---|
| 21,787 | 1.55 × 10⁸ | 1.13 × 10⁹ | 0 | 2625 | 4.36 × 10¹⁰ | |
| 21,787 | 6.38 × 10⁷ | 5.32 × 10⁸ | 0 | 145,862 | 3.08 × 10¹⁰ | |
| 21,787 | 8.73 × 10¹¹ | 1.08 × 10¹² | 8.75 × 10⁹ | 3.82 × 10¹¹ | 3.95 × 10¹² | |
| 21,572 | 8.64 × 10¹¹ | 2.42 × 10¹² | 2.53 × 10⁸ | 1.88 × 10¹¹ | 2.05 × 10¹³ | |
| 21,787 | 4461.87 | 3707.106 | 160.9283 | 3210.535 | 19,539.48 | |
| 21,787 | 0.05 | 0.221 | 0 | 0 | 1 | |
| (customs) | 21,787 | 3.42 | 0.448 | 2.36 | 3.47 | 4.12 |
| (infrastructure) | 21,787 | 3.58 | 0.540 | 2.25 | 3.72 | 4.44 |
| (international) | 21,787 | 3.45 | 0.331 | 2.69 | 3.51 | 4.24 |
| (logistics) | 21,787 | 3.59 | 0.464 | 2.53 | 3.71 | 4.31 |
| (tracking) | 21,787 | 3.67 | 0.440 | 2.54 | 3.82 | 4.38 |
| (timeliness) | 21,787 | 3.99 | 0.374 | 2.88 | 4.06 | 4.8 |
| Group | Trade Flow | Observation | Mean | Standard Deviation | Minimum | Maximum |
| EU-EU | export | 2986 | 10,751,887 | 57,784,968 | 0 | 1.28 × 10⁹ |
| EU-EU | import | 2986 | 9,910,905 | 50,684,146 | 0 | 1.26 × 10⁹ |
| EU-ROW | export | 4955 | 1,294,274 | 8,078,235 | 0 | 2.51 × 10⁸ |
| EU-ROW | import | 4955 | 20,455,249 | 1.1 × 10⁸ | 0 | 2.09 × 10⁹ |
| Total solid | export | 7941 | 4,850,556 | 36,290,815 | 0 | 1.28 × 10⁹ |
| Total solid | import | 7941 | 16,490,331 | 92,570,226 | 0 | 2.09 × 10⁹ |
| Group | Trade Flow | Observation | Mean | Standard Deviation | Minimum | Maximum |
| EU-EU | export | 3529 | 2.55 × 10⁸ | 1.23 × 10⁹ | 0 | 3.08 × 10¹⁰ |
| EU-EU | import | 3529 | 2.92 × 10⁸ | 1.72 × 10⁹ | 0 | 4.36 × 10¹⁰ |
| EU-ROW | export | 9856 | 46,007,173 | 2.65 × 10⁸ | 0 | 9.17 × 10⁹ |
| EU-ROW | import | 9856 | 2.24 ×10⁸ | 1.31 × 10⁹ | 0 | 3.22 × 10¹⁰ |
| Total liquid | export | 13,385 | 1.01 × 10⁸ | 6.76 × 10⁸ | 0 | 3.08 × 10¹⁰ |
| Total liquid | import | 13,385 | 2.42 × 10⁸ | 1.43 × 10⁹ | 0 | 4.36 × 10¹⁰ |
| Group | Trade Flow | Observation | Mean | Standard Deviation | Minimum | Maximum |
| EU-EU | export | 301 | 4172.867 | 43,440.04 | 0 | 742,721 |
| EU-EU | import | 301 | 98,966.79 | 676,183.9 | 0 | 10,664,415 |
| EU-ROW | export | 160 | 25,061.82 | 198,677.1 | 0 | 2,486,206 |
| EU-ROW | import | 160 | 16,650.13 | 67,017.59 | 0 | 480,552 |
| Total gas | export | 461 | 11,422.83 | 122,366.5 | 0 | 2,486,206 |
| Total gas | import | 461 | 70,397.02 | 548,891 | 0 | 10,664,415 |
| (1) | (2) | (3) | (4) | (5) | (6) | |
|---|---|---|---|---|---|---|
| Variables | ||||||
| 0.304 *** | 0.583 *** | 0.210 *** | 0.332 ** | 0.399 *** | 0.154 * | |
| (3.44) | (3.74) | (3.47) | (3.08) | (3.47) | (2.35) | |
| 0.445 *** | 0.466 *** | 0.430 *** | 0.448 *** | 0.455 *** | 0.421 *** | |
| (4.70) | (5.25) | (4.52) | (4.71) | (4.80) | (4.51) | |
| contig | 2.417 *** | 2.459 *** | 2.395 *** | 2.423 *** | 2.430 *** | 2.381 *** |
| (8.48) | (8.98) | (8.41) | (8.48) | (8.56) | (8.41) | |
| (customs) | −0.312 | |||||
| (−0.75) | ||||||
| (infrastructure) | −1.247 * | |||||
| (−2.39) | ||||||
| (international) | 0.373 | |||||
| (1.08) | ||||||
| (logistics) | −0.432 | |||||
| (−0.88) | ||||||
| (tracking) | −0.784 | |||||
| (−1.50) | ||||||
| (timeliness) | 0.764 ** | |||||
| (2.71) | ||||||
| group | 1.454 *** | 1.486 *** | 1.444 *** | 1.462 *** | 1.468 *** | 1.437 *** |
| (6.01) | (6.32) | (5.93) | (6.03) | (6.10) | (5.92) | |
| time fixed effects | Yes | Yes | Yes | Yes | Yes | Yes |
| Constant | −4.887 | −9.710 ** | −4.268 | −5.271 | −5.865 | −4.429 |
| (−1.55) | (−2.96) | (−1.33) | (−1.63) | (−1.85) | (−1.35) | |
| Observations | 7878 | 7878 | 7878 | 7878 | 7878 | 7878 |
| Pseudo R2 | 0.490 | 0.519 | 0.490 | 0.491 | 0.496 | 0.495 |
| RMSE | 3.494 | 3.074 | 3.559 | 3.471 | 3.369 | 3.530 |
| (1) | (2) | (3) | (4) | (5) | (6) | |
|---|---|---|---|---|---|---|
| Variables | ||||||
| 0.383 *** | 0.320 *** | 0.450 *** | 0.350 *** | 0.368 *** | 0.411 *** | |
| (4.69) | (3.36) | (5.97) | (3.92) | (4.44) | (5.56) | |
| 0.529 *** | 0.529 *** | 0.529 *** | 0.528 *** | 0.528 *** | 0.529 *** | |
| (10.74) | (10.76) | (10.72) | (10.82) | (10.79) | (10.72) | |
| contig | 1.711 *** | 1.699 *** | 1.712 *** | 1.705 *** | 1.711 *** | 1.709 *** |
| (5.93) | (5.93) | (5.90) | (5.96) | (5.94) | (5.90) | |
| (customs) | 0.999 *** | |||||
| (3.86) | ||||||
| (infrastructure) | 0.998 *** | |||||
| (4.02) | ||||||
| (international) | 1.038 *** | |||||
| (3.64) | ||||||
| (logistics) | 1.175 *** | |||||
| (4.04) | ||||||
| (tracking) | 1.107 *** | |||||
| (3.96) | ||||||
| (timeliness) | 1.182 *** | |||||
| (4.16) | ||||||
| groups | 1.115 *** | 1.116 *** | 1.115 *** | 1.113 *** | 1.114 *** | 1.114 *** |
| (5.17) | (5.14) | (5.16) | (5.13) | (5.16) | (5.16) | |
| Time fixed effects | Yes | Yes | Yes | Yes | Yes | Yes |
| Constant | −10.31 *** | −8.802 ** | −12.12 *** | −10.24 *** | −10.62 *** | −12.50 *** |
| (−3.84) | (−3.16) | (−4.60) | (−3.74) | (−3.96) | (−4.63) | |
| Observations | 13234 | 13234 | 13234 | 13234 | 13234 | 13234 |
| Pseudo R2 | 0.526 | 0.528 | 0.520 | 0.530 | 0.525 | 0.523 |
| RMSE | 3.144 | 3.096 | 3.115 | 3.142 | 3.119 | 3.084 |
| (1) | (2) | (3) | (4) | (5) | (6) | |
|---|---|---|---|---|---|---|
| Variables | ||||||
| 0.355 | 0.161 | 0.410 | 0.291 | 0.144 | 0.411 | |
| (0.97) | (0.44) | (1.75) | (0.89) | (0.41) | (1.52) | |
| 0.449 | 0.445 | 0.453 | 0.442 | 0.438 | 0.454 | |
| (1.72) | (1.72) | (1.67) | (1.73) | (1.72) | (1.74) | |
| contig | −0.739 | −0.747 | −0.754 | −0.696 | −0.799 | −0.763 |
| (−0.94) | (−1.03) | (−1.04) | (−0.91) | (−1.09) | (−1.00) | |
| (customs) | 0.460 | |||||
| (0.22) | ||||||
| (infrastructure) | 1.708 | |||||
| (0.93) | ||||||
| (international) | −0.188 | |||||
| (−0.13) | ||||||
| (logistics) | 1.415 | |||||
| (0.62) | ||||||
| (tracking) | 1.890 | |||||
| (1.15) | ||||||
| (timeliness) | −0.104 | |||||
| (−0.06) | ||||||
| Groups | −1.304 | −1.253 | −1.335 | −1.260 | −1.249 | −1.332 |
| (−1.71) | (−1.59) | (−1.67) | (−1.63) | (−1.56) | (−1.72) | |
| Time fixed effects | Yes | Yes | Yes | Yes | Yes | Yes |
| Constant | −14.48 | −13.86 | −13.82 | −16.24 | −14.15 | −14.08 |
| (−1.40) | (−1.36) | (−1.28) | (−1.42) | (−1.41) | (−1.22) | |
| Observations | 460 | 460 | 460 | 460 | 460 | 460 |
| Pseudo R2 | 0.397 | 0.419 | 0.396 | 0.407 | 0.414 | 0.396 |
| RMSE | 3.740 | 3.881 | 3.711 | 3.925 | 3.919 | 3.712 |
| (1) | (2) | (3) | (4) | (5) | (6) | |
|---|---|---|---|---|---|---|
| Variables | ||||||
| 0.669 *** | 0.676 *** | 0.674 *** | 0.649 *** | 0.686 *** | 0.667 *** | |
| (7.74) | (6.84) | (7.54) | (7.08) | (7.32) | (7.62) | |
| 0.626 *** | 0.626 *** | 0.626 *** | 0.626 *** | 0.626*** | 0.626 *** | |
| (14.49) | (14.50) | (14.46) | (14.48) | (14.49) | (14.49) | |
| contig | 1.672 *** | 1.671 *** | 1.673 *** | 1.676 *** | 1.673 *** | 1.671 *** |
| (5.51) | (5.48) | (5.53) | (5.49) | (5.53) | (5.55) | |
| (customs) | 0.267 | |||||
| (0.77) | ||||||
| (infrastructure) | 0.153 | |||||
| (0.47) | ||||||
| (international) | 0.451 | |||||
| (1.37) | ||||||
| (logistics) | 0.369 | |||||
| (1.08) | ||||||
| (tracking) | 0.162 | |||||
| (0.46) | ||||||
| (timeliness) | 0.373 | |||||
| (0.98) | ||||||
| Groups | −0.995 *** | −0.995 *** | −0.997 *** | −1.000 *** | −0.995 *** | −0.995 *** |
| (−4.22) | (−4.22) | (−4.24) | (−4.22) | (−4.24) | (−4.24) | |
| Time fixed effects | Yes | Yes | Yes | Yes | Yes | Yes |
| Constant | −19.15 *** | −18.97 *** | −19.87 *** | −19.05 *** | −19.30 *** | −19.71 *** |
| (−6.67) | (−6.63) | (−6.55) | (−6.49) | (−6.64) | (−6.45) | |
| Observations | 7878 | 7878 | 7878 | 7878 | 7878 | 7878 |
| Pseudo R2 | 0.415 | 0.415 | 0.416 | 0.416 | 0.415 | 0.415 |
| RMSE | 3.323 | 3.310 | 3.295 | 3.321 | 3.304 | 3.325 |
| (1) | (2) | (3) | (4) | (5) | (6) | |
|---|---|---|---|---|---|---|
| Variables | ||||||
| 0.603 *** | 0.567 *** | 0.608 *** | 0.581 *** | 0.588 *** | 0.601 *** | |
| (6.70) | (5.54) | (7.13) | (5.81) | (5.75) | (6.38) | |
| 0.485 *** | 0.485 *** | 0.485 *** | 0.484 *** | 0.485 *** | 0.485 *** | |
| (15.48) | (15.44) | (15.48) | (15.44) | (15.46) | (15.48) | |
| contig | 1.910 *** | 1.909 *** | 1.909 *** | 1.912 *** | 1.911 *** | 1.909 *** |
| (6.53) | (6.48) | (6.54) | (6.50) | (6.51) | (6.55) | |
| (customs) | 0.185 | |||||
| (0.61) | ||||||
| (infrastructure) | 0.281 | |||||
| (0.97) | ||||||
| (international) | 0.274 | |||||
| (0.73) | ||||||
| (logistics) | 0.305 | |||||
| (0.87) | ||||||
| (tracking) | 0.274 | |||||
| (0.73) | ||||||
| (timeliness) | 0.263 | |||||
| (0.65) | ||||||
| groups | −0.409 | −0.412 | −0.409 | −0.413 | −0.411 | −0.409 |
| (−1.91) | (−1.92) | (−1.91) | (−1.93) | (−1.92) | (−1.91) | |
| Time fixed effects | Yes | Yes | Yes | Yes | Yes | Yes |
| Constant | −10.50 *** | −9.927 *** | −10.94 *** | −10.39 *** | −10.50 *** | −10.91 *** |
| (−4.61) | (−4.10) | (−4.93) | (−4.45) | (−4.55) | (−4.91) | |
| Observations | 13234 | 13234 | 13234 | 13234 | 13234 | 13234 |
| Pseudo R2 | 0.370 | 0.370 | 0.370 | 0.370 | 0.370 | 0.370 |
| RMSE | 3.161 | 3.157 | 3.161 | 3.158 | 3.160 | 3.158 |
| (1) | (2) | (3) | (4) | (5) | (6) | |
|---|---|---|---|---|---|---|
| Variables | ||||||
| 0.314 | 0.133 | 0.301 | 0.236 | 0.126 | 0.356 | |
| (1.15) | (0.62) | (1.53) | (0.91) | (0.56) | (1.38) | |
| 0.881 * | 0.900 * | 0.867 * | 0.885 * | 0.876 * | 0.865 * | |
| (2.45) | (2.40) | (2.13) | (2.45) | (2.17) | (2.15) | |
| contig | 1.545 | 1.393 | 1.256 | 1.467 | 1.322 | 1.301 |
| (1.65) | (1.68) | (1.66) | (1.71) | (1.54) | (1.57) | |
| (customs) | 3.512 | |||||
| (1.57) | ||||||
| (infrastructure) | 3.087 | |||||
| (1.39) | ||||||
| (international) | 0.581 | |||||
| (0.63) | ||||||
| (logistics) | 3.856 | |||||
| (1.85) | ||||||
| (tracking) | 3.302 * | |||||
| (2.17) | ||||||
| (timeliness) | 1.671 | |||||
| (1.51) | ||||||
| Groups | 1.926 | 1.969 | 1.931 | 1.995 | 1.990 | 1.948 |
| (1.78) | (1.75) | (1.73) | (1.82) | (1.74) | (1.74) | |
| Time fixed effects | Yes | Yes | Yes | Yes | Yes | Yes |
| Constant | −37.65 | −32.23 | −25.83 | −37.58 | −32.54 | −32.55 |
| (−1.54) | (−1.43) | (−1.41) | (−1.59) | (−1.45) | (−1.46) | |
| Observations | 460 | 460 | 460 | 460 | 460 | 460 |
| Pseudo R2 | 0.436 | 0.431 | 0.349 | 0.445 | 0.414 | 0.366 |
| RMSE | 4.249 | 4.398 | 4.070 | 4.179 | 4.541 | 3.974 |
Publisher’s Note: MDPI stays neutral with regard to jurisdictional claims in published maps and institutional affiliations. |
© 2021 by the authors. Licensee MDPI, Basel, Switzerland. This article is an open access article distributed under the terms and conditions of the Creative Commons Attribution (CC BY) license (https://creativecommons.org/licenses/by/4.0/).
Share and Cite
Górecka, A.K.; Pavlić Skender, H.; Zaninović, P.A. Assessing the Effects of Logistics Performance on Energy Trade. Energies 2022, 15, 191. https://doi.org/10.3390/en15010191
Górecka AK, Pavlić Skender H, Zaninović PA. Assessing the Effects of Logistics Performance on Energy Trade. Energies. 2022; 15(1):191. https://doi.org/10.3390/en15010191
Chicago/Turabian StyleGórecka, Aleksandra Katarzyna, Helga Pavlić Skender, and Petra Adelajda Zaninović. 2022. "Assessing the Effects of Logistics Performance on Energy Trade" Energies 15, no. 1: 191. https://doi.org/10.3390/en15010191
APA StyleGórecka, A. K., Pavlić Skender, H., & Zaninović, P. A. (2022). Assessing the Effects of Logistics Performance on Energy Trade. Energies, 15(1), 191. https://doi.org/10.3390/en15010191