
Design Optimization of a Dual-Bleeding Recirculation Channel to Enhance Operating Stability of a Transonic Axial Compressor


Abstract
:
1. Introduction
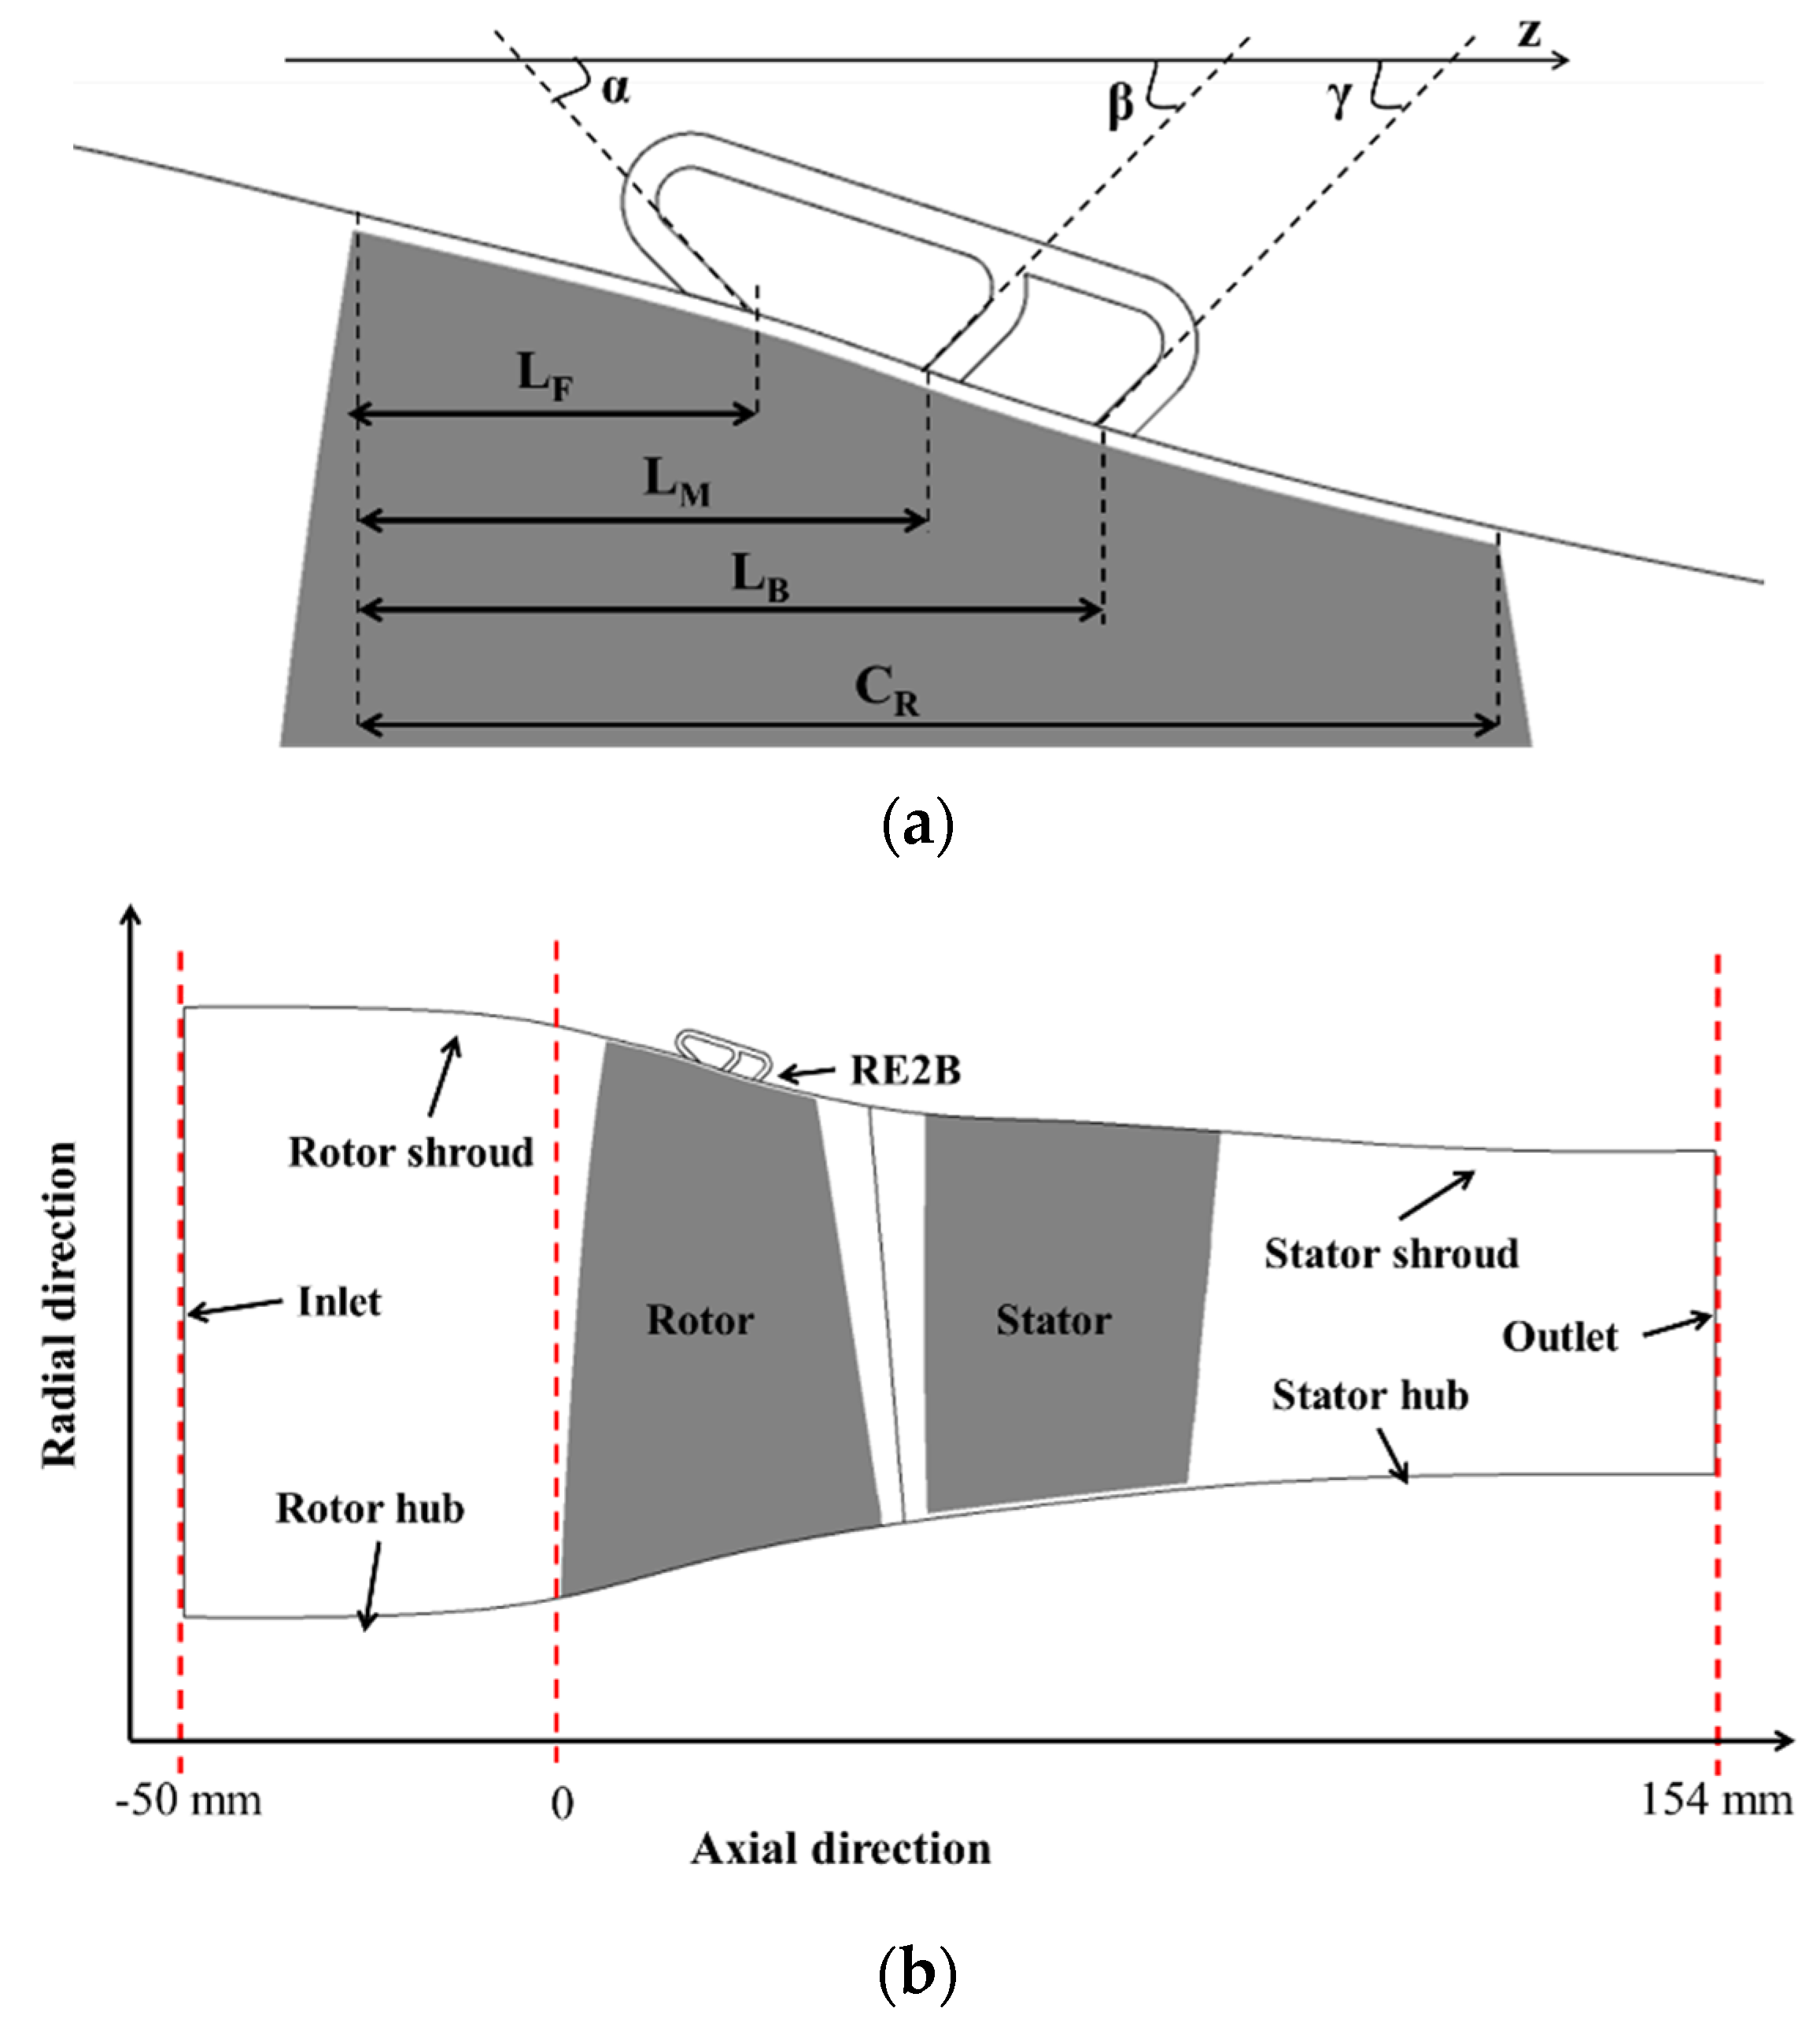
2. Compressor Model and Casing Treatment Design
3. Numerical Analysis
3.1. Numerical Methods
3.2. Performance Parameters
3.3. Validation and Grid-Dependency Test
3.4. Optimization Methods
4. Results and Discussion
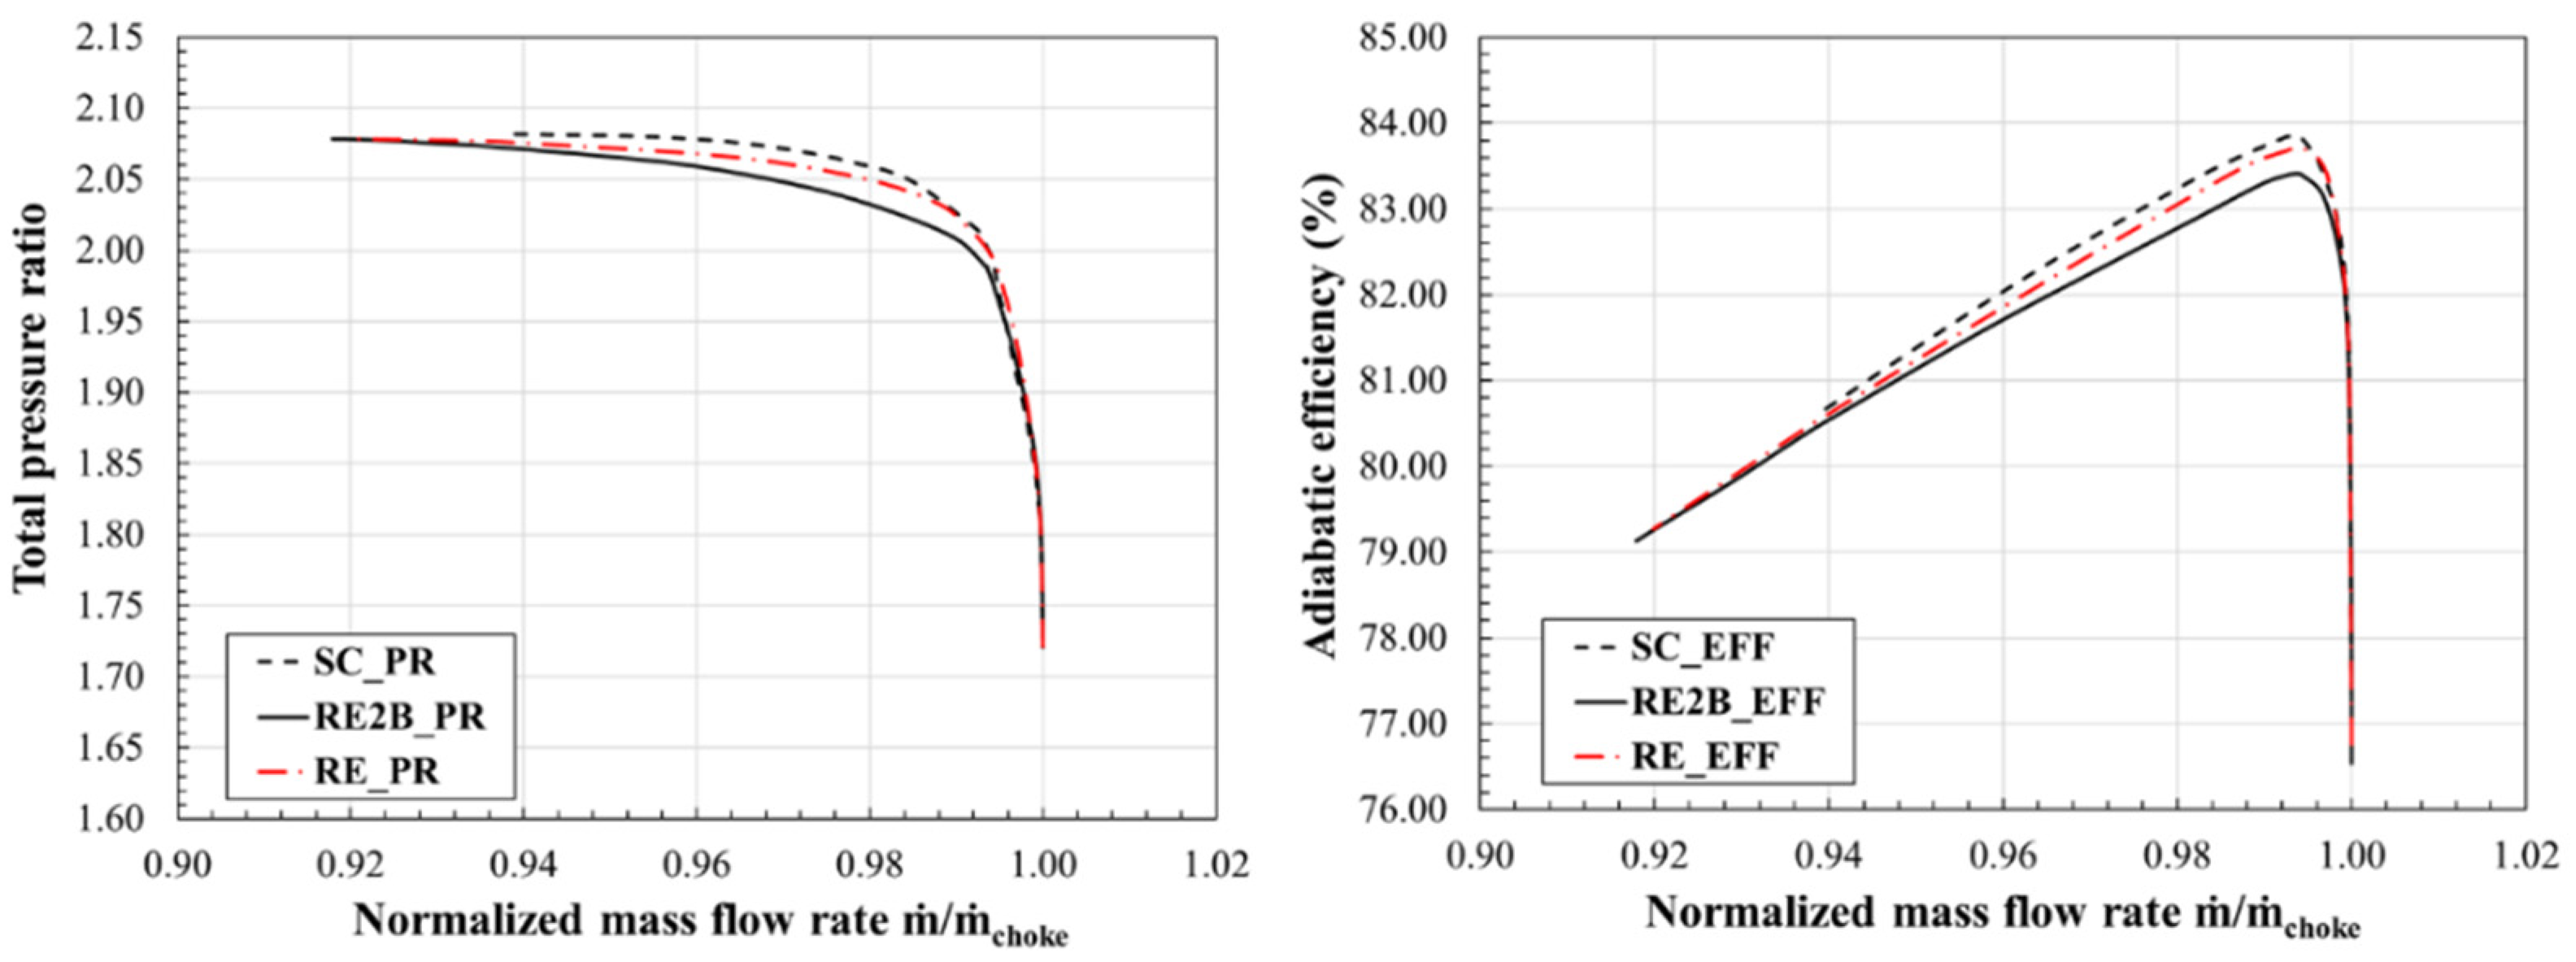
4.1. Results with the Reference Design of RE2B
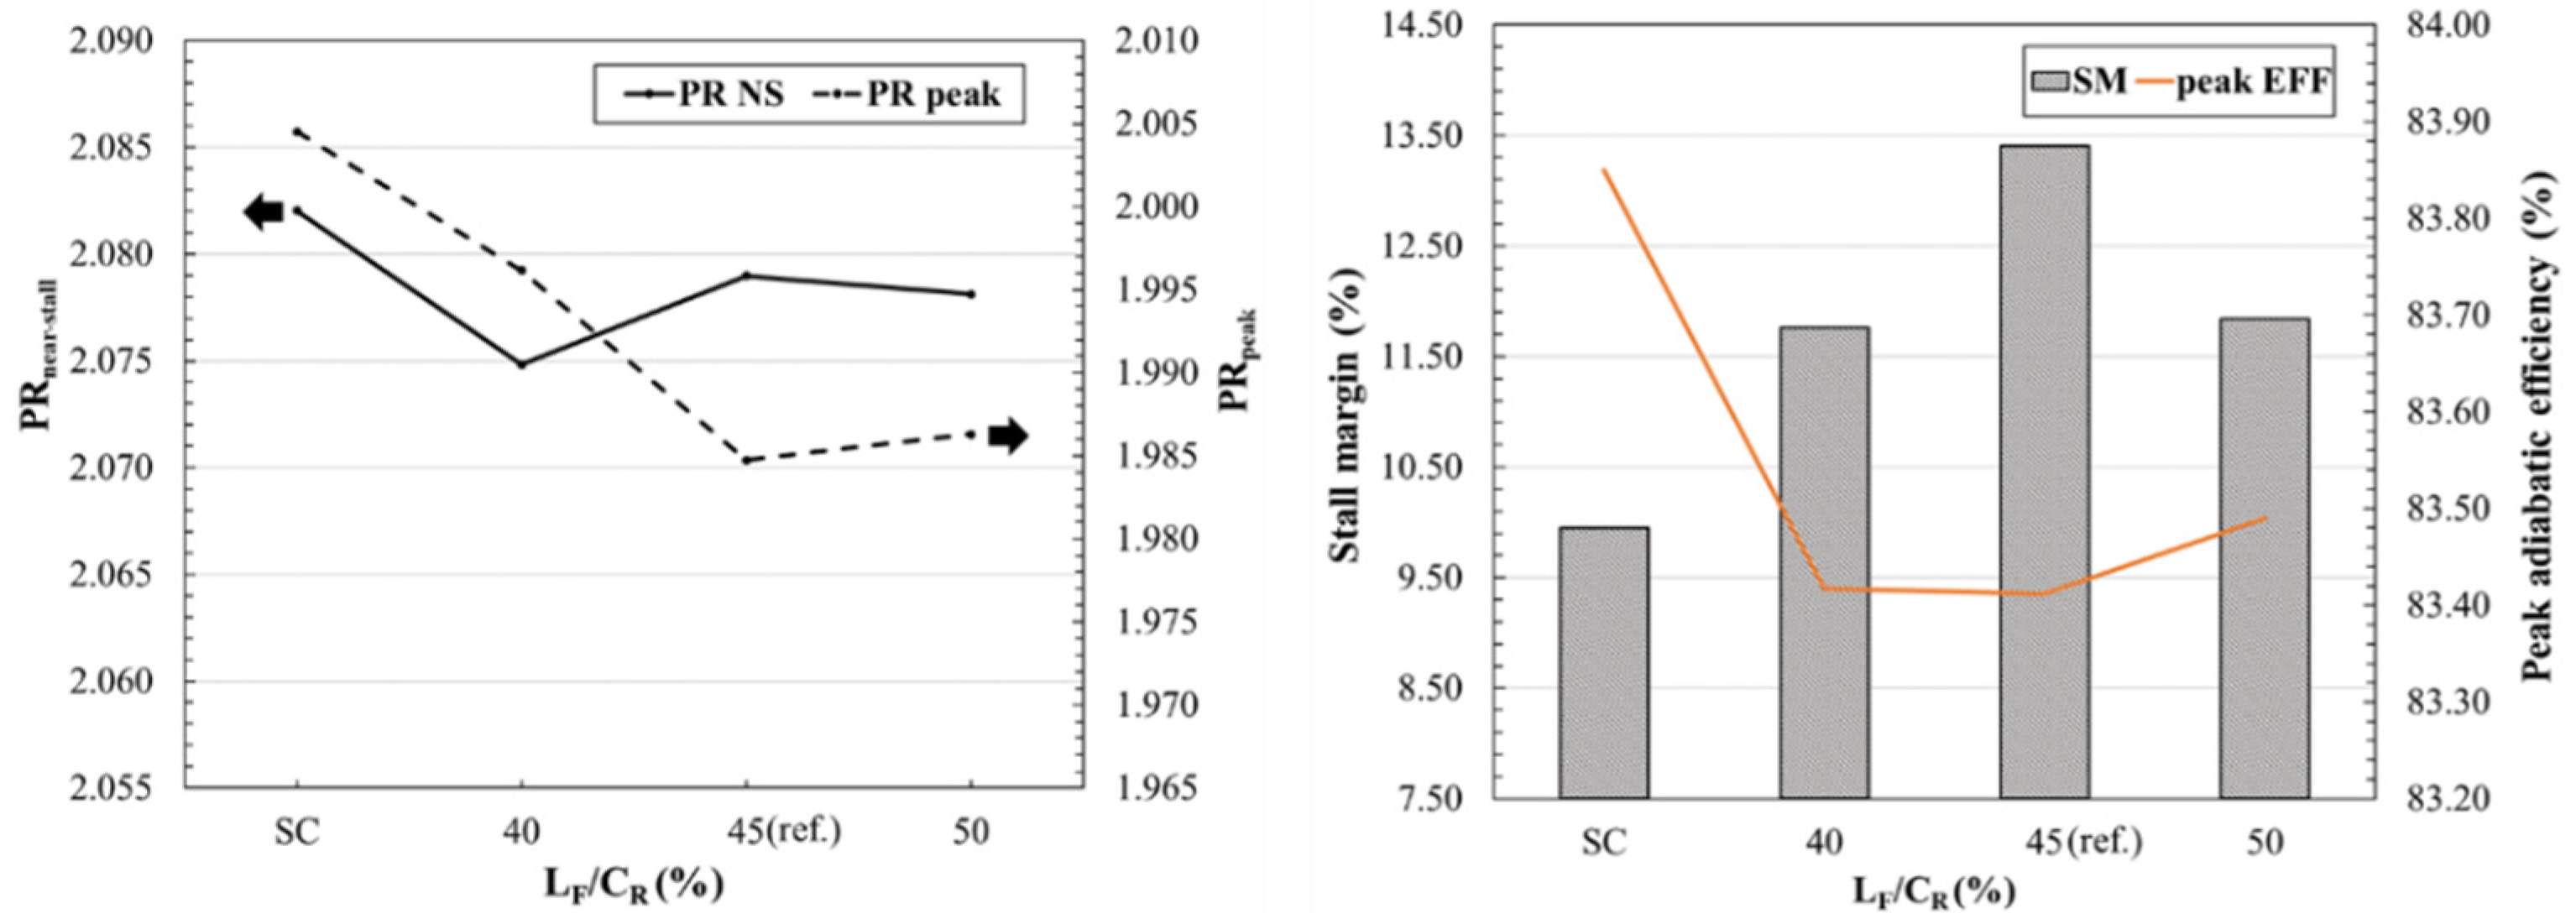
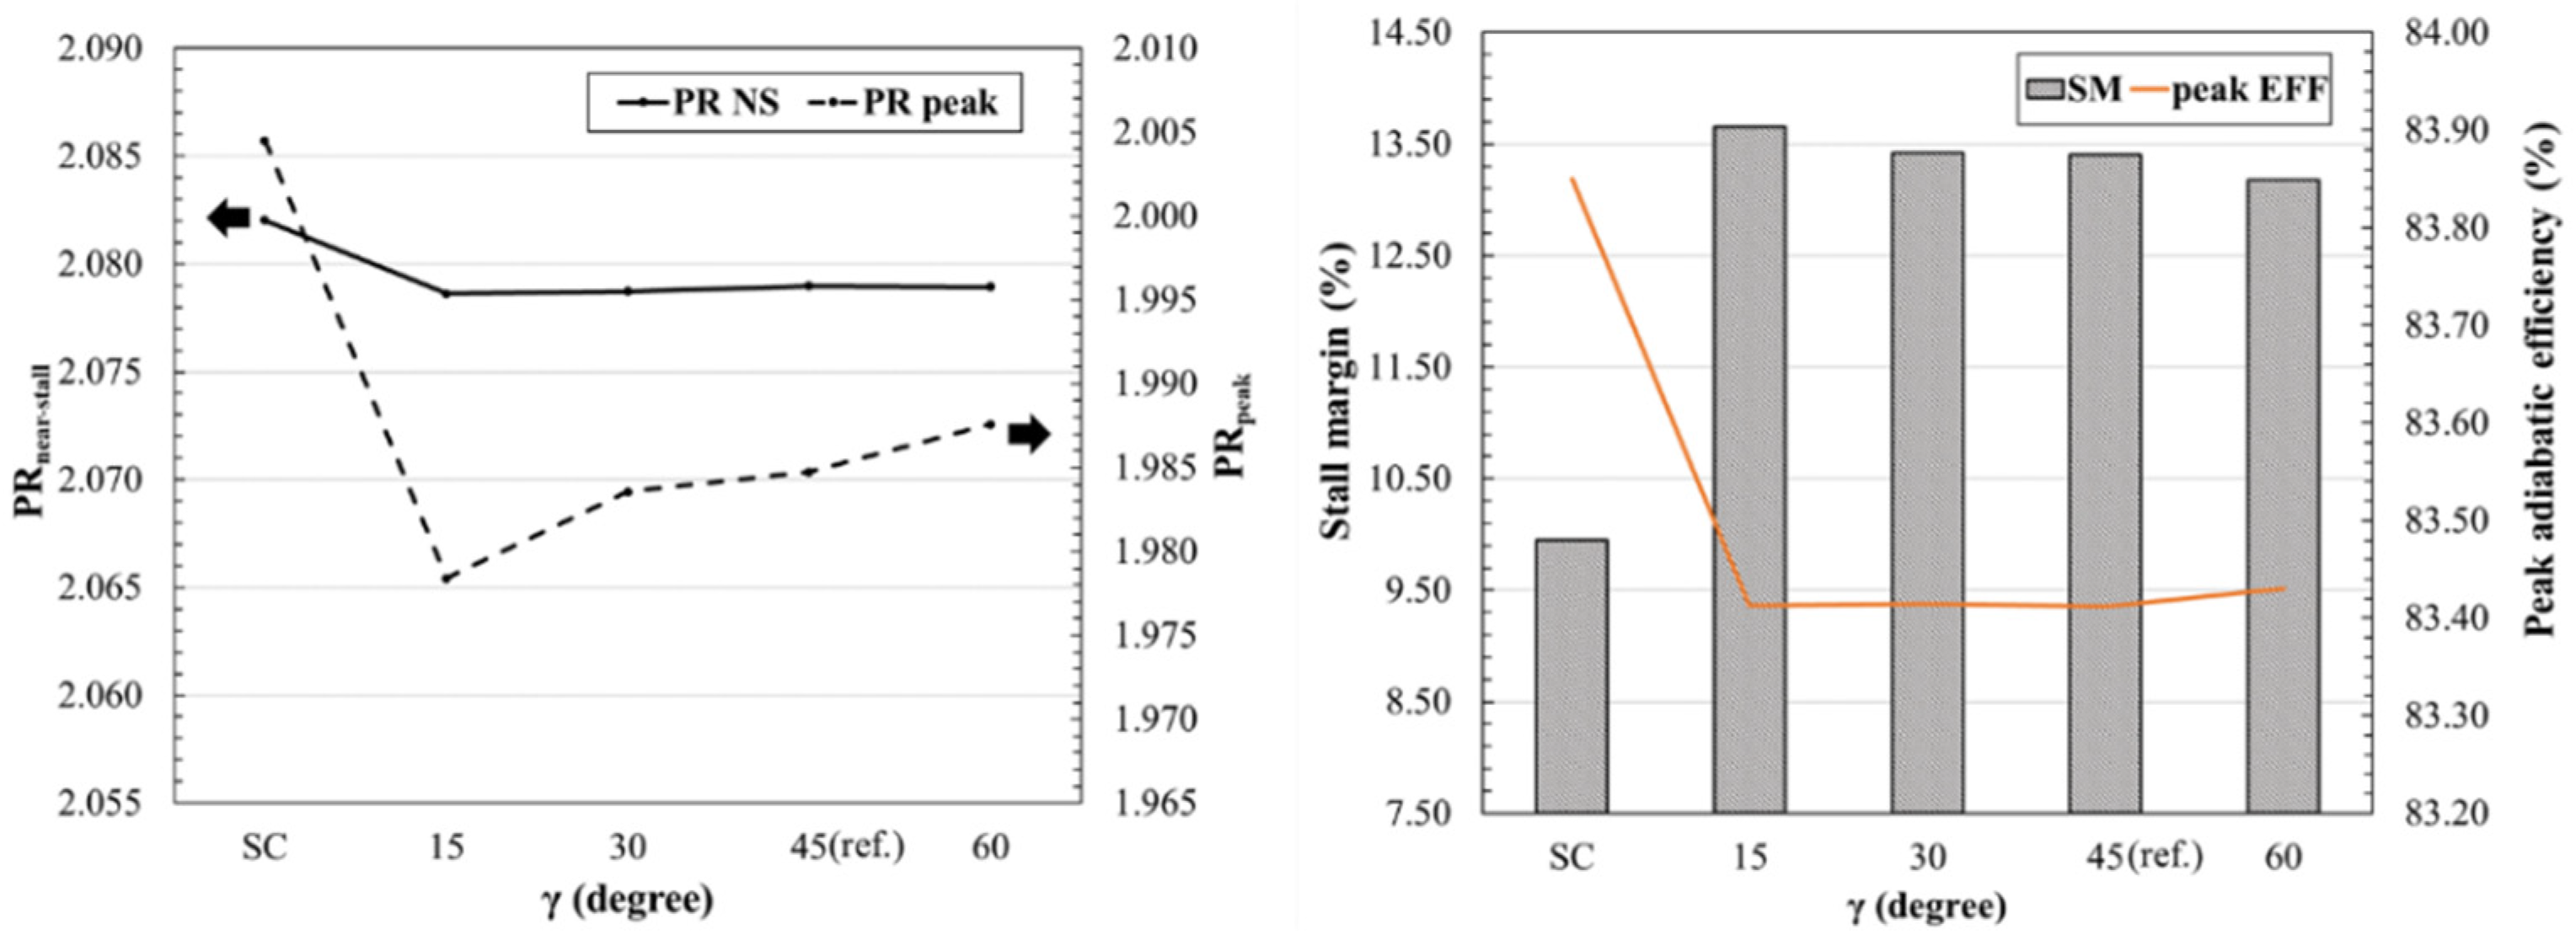
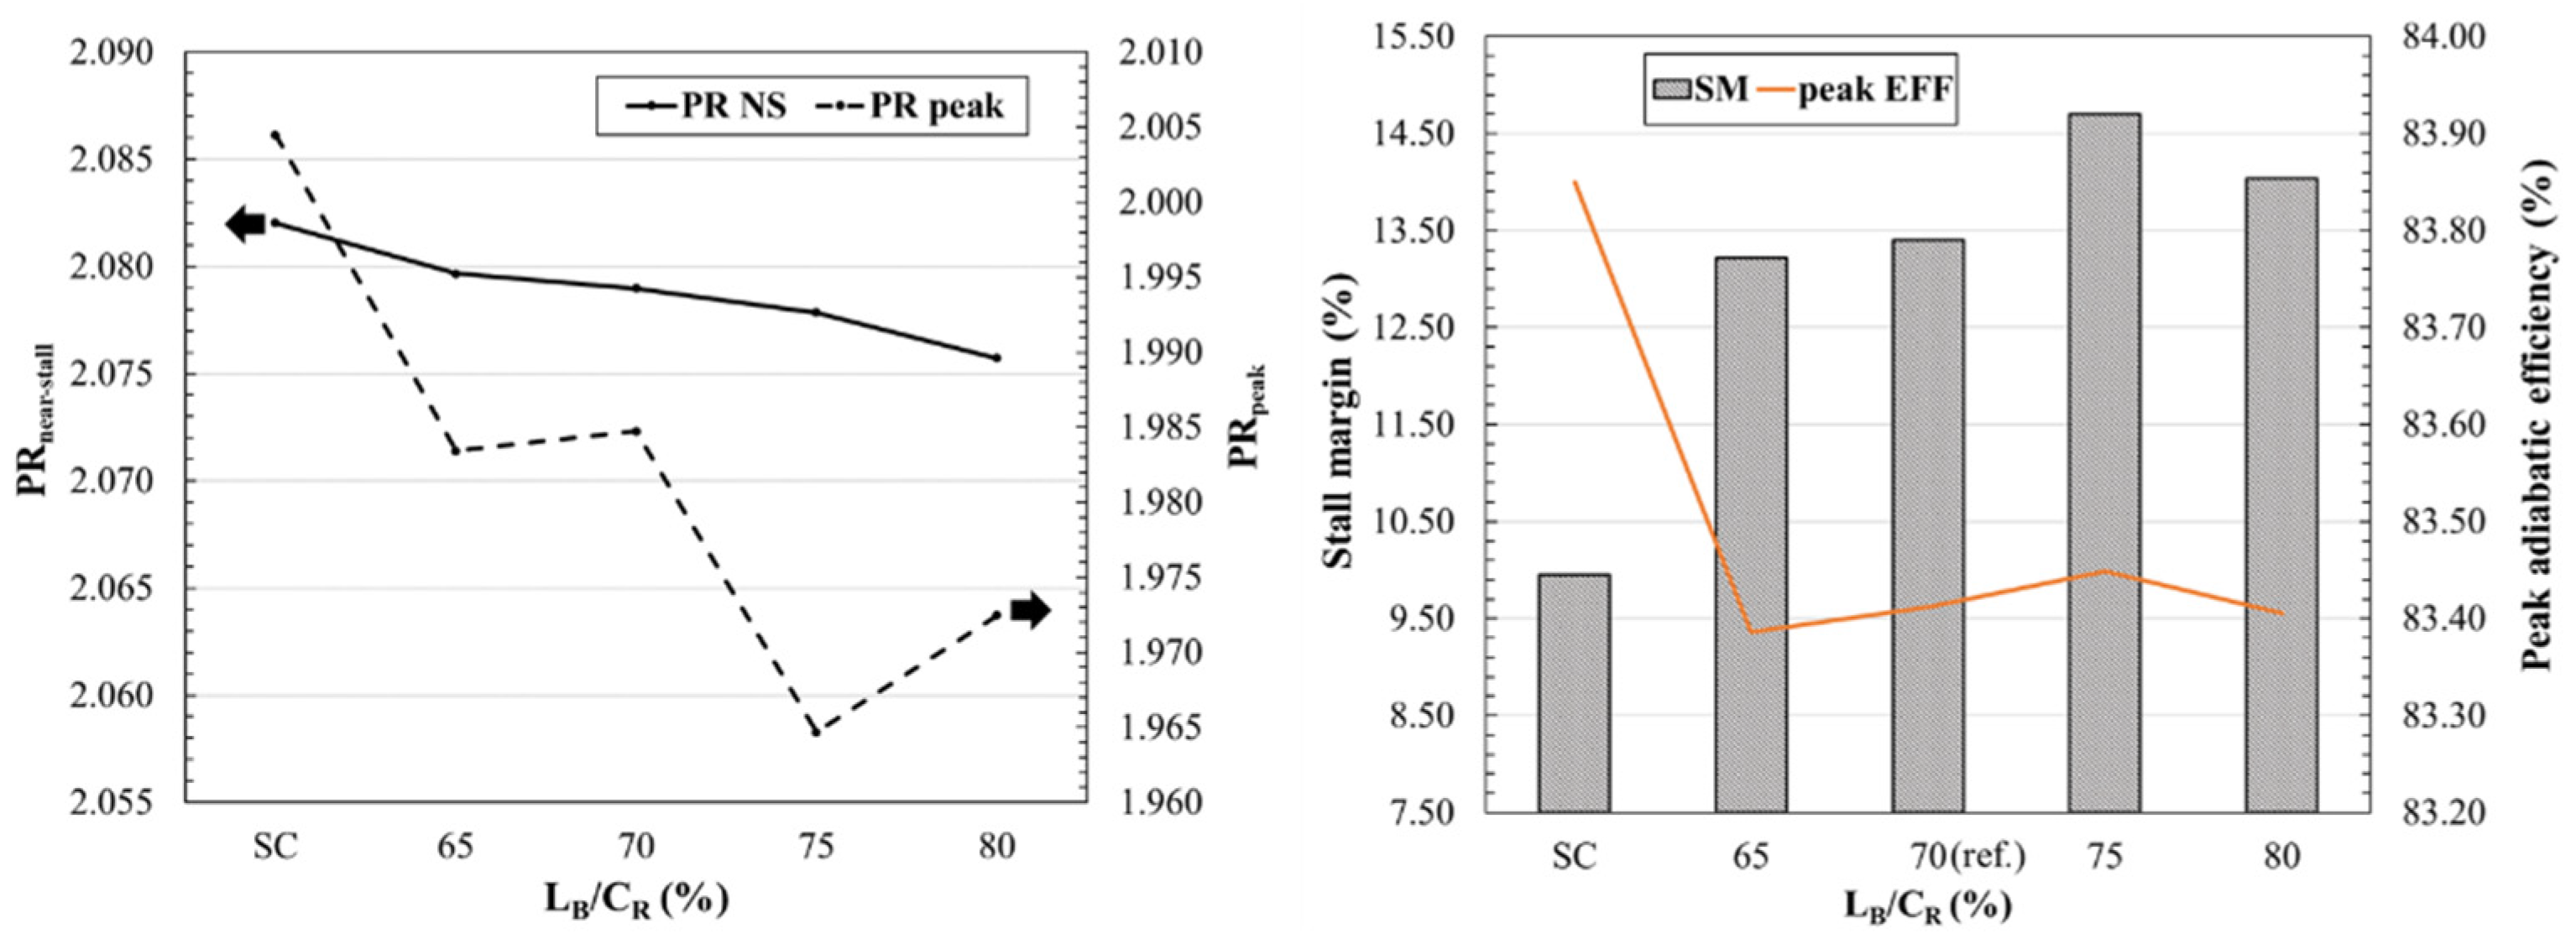
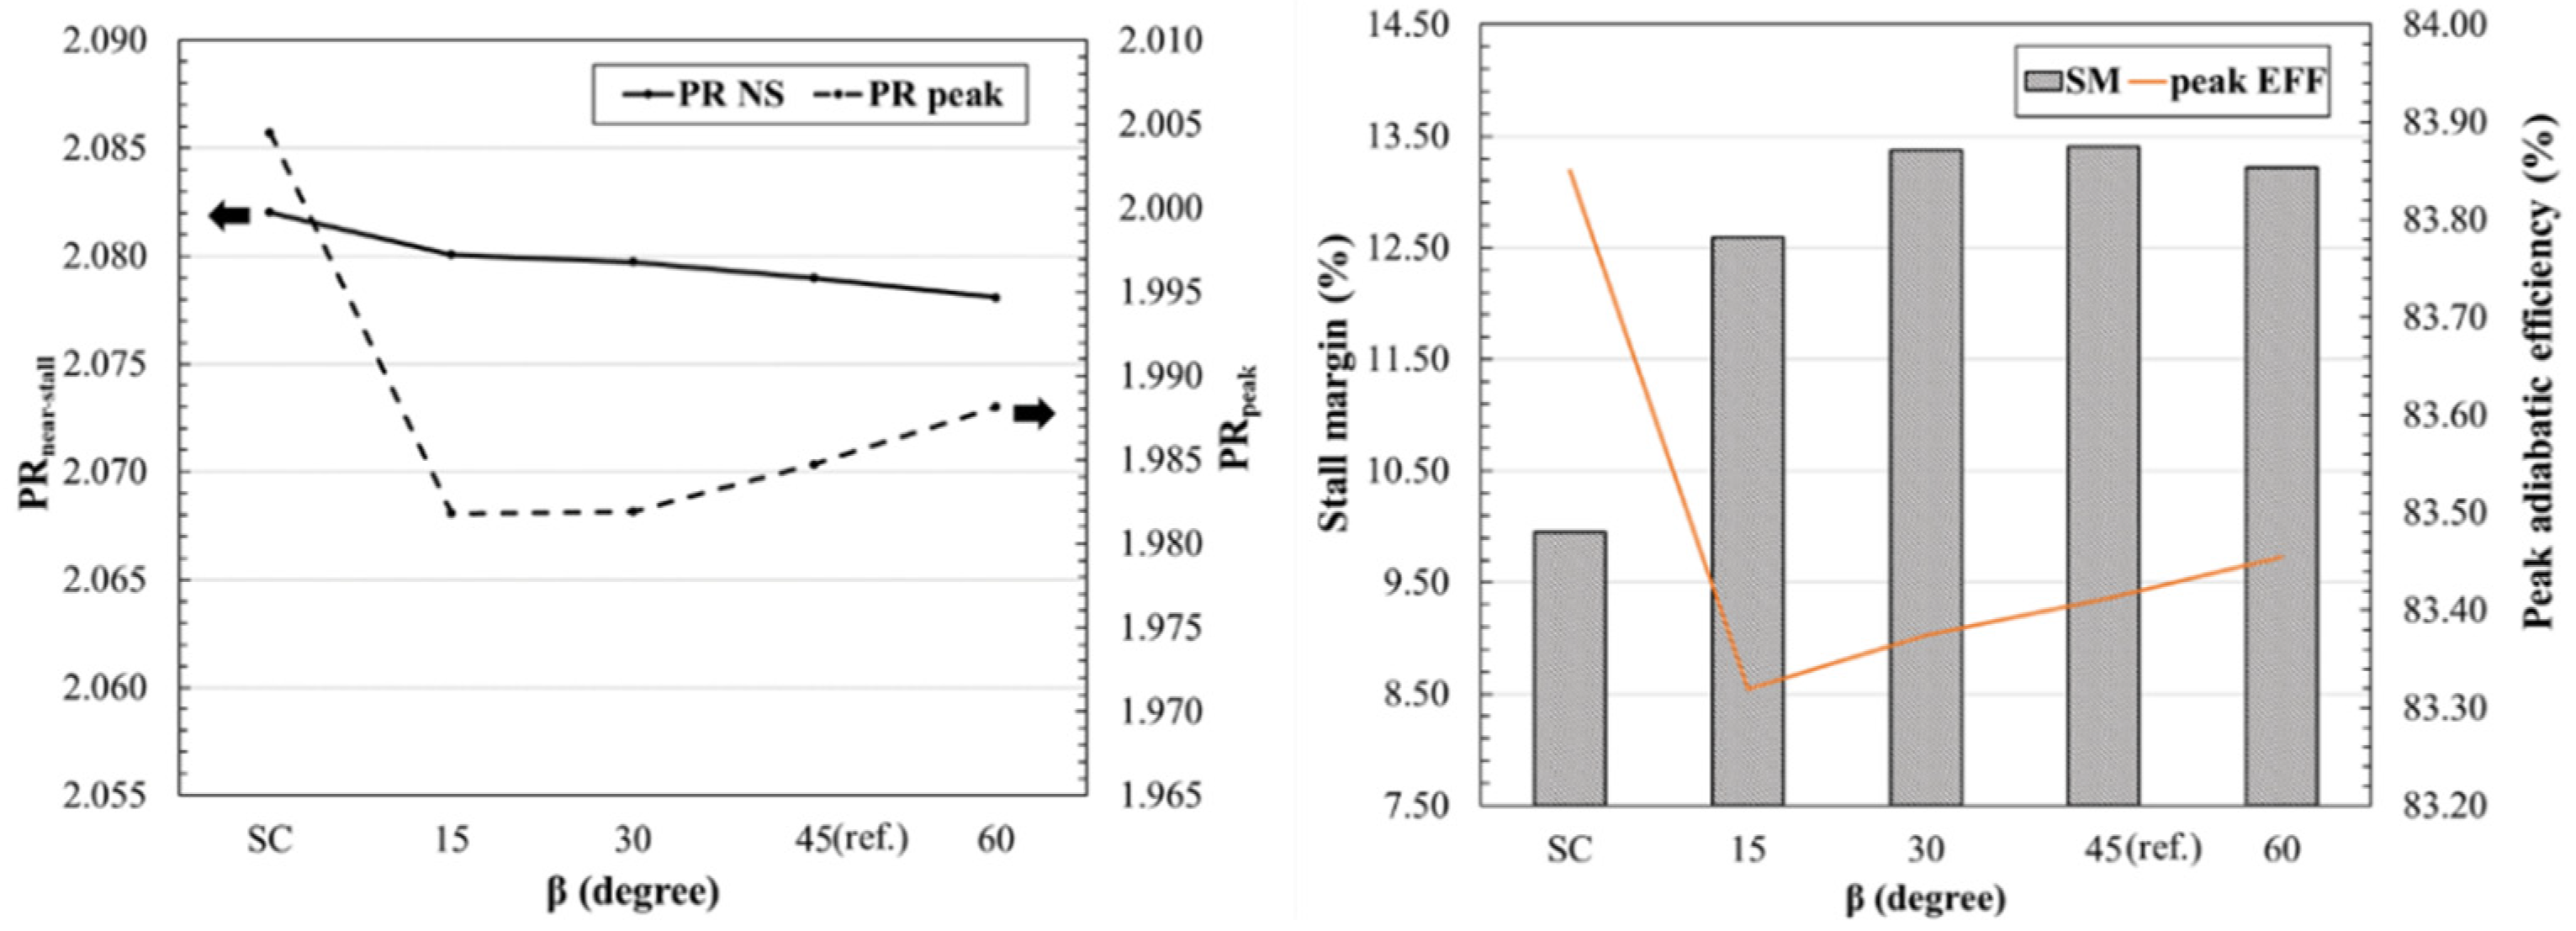
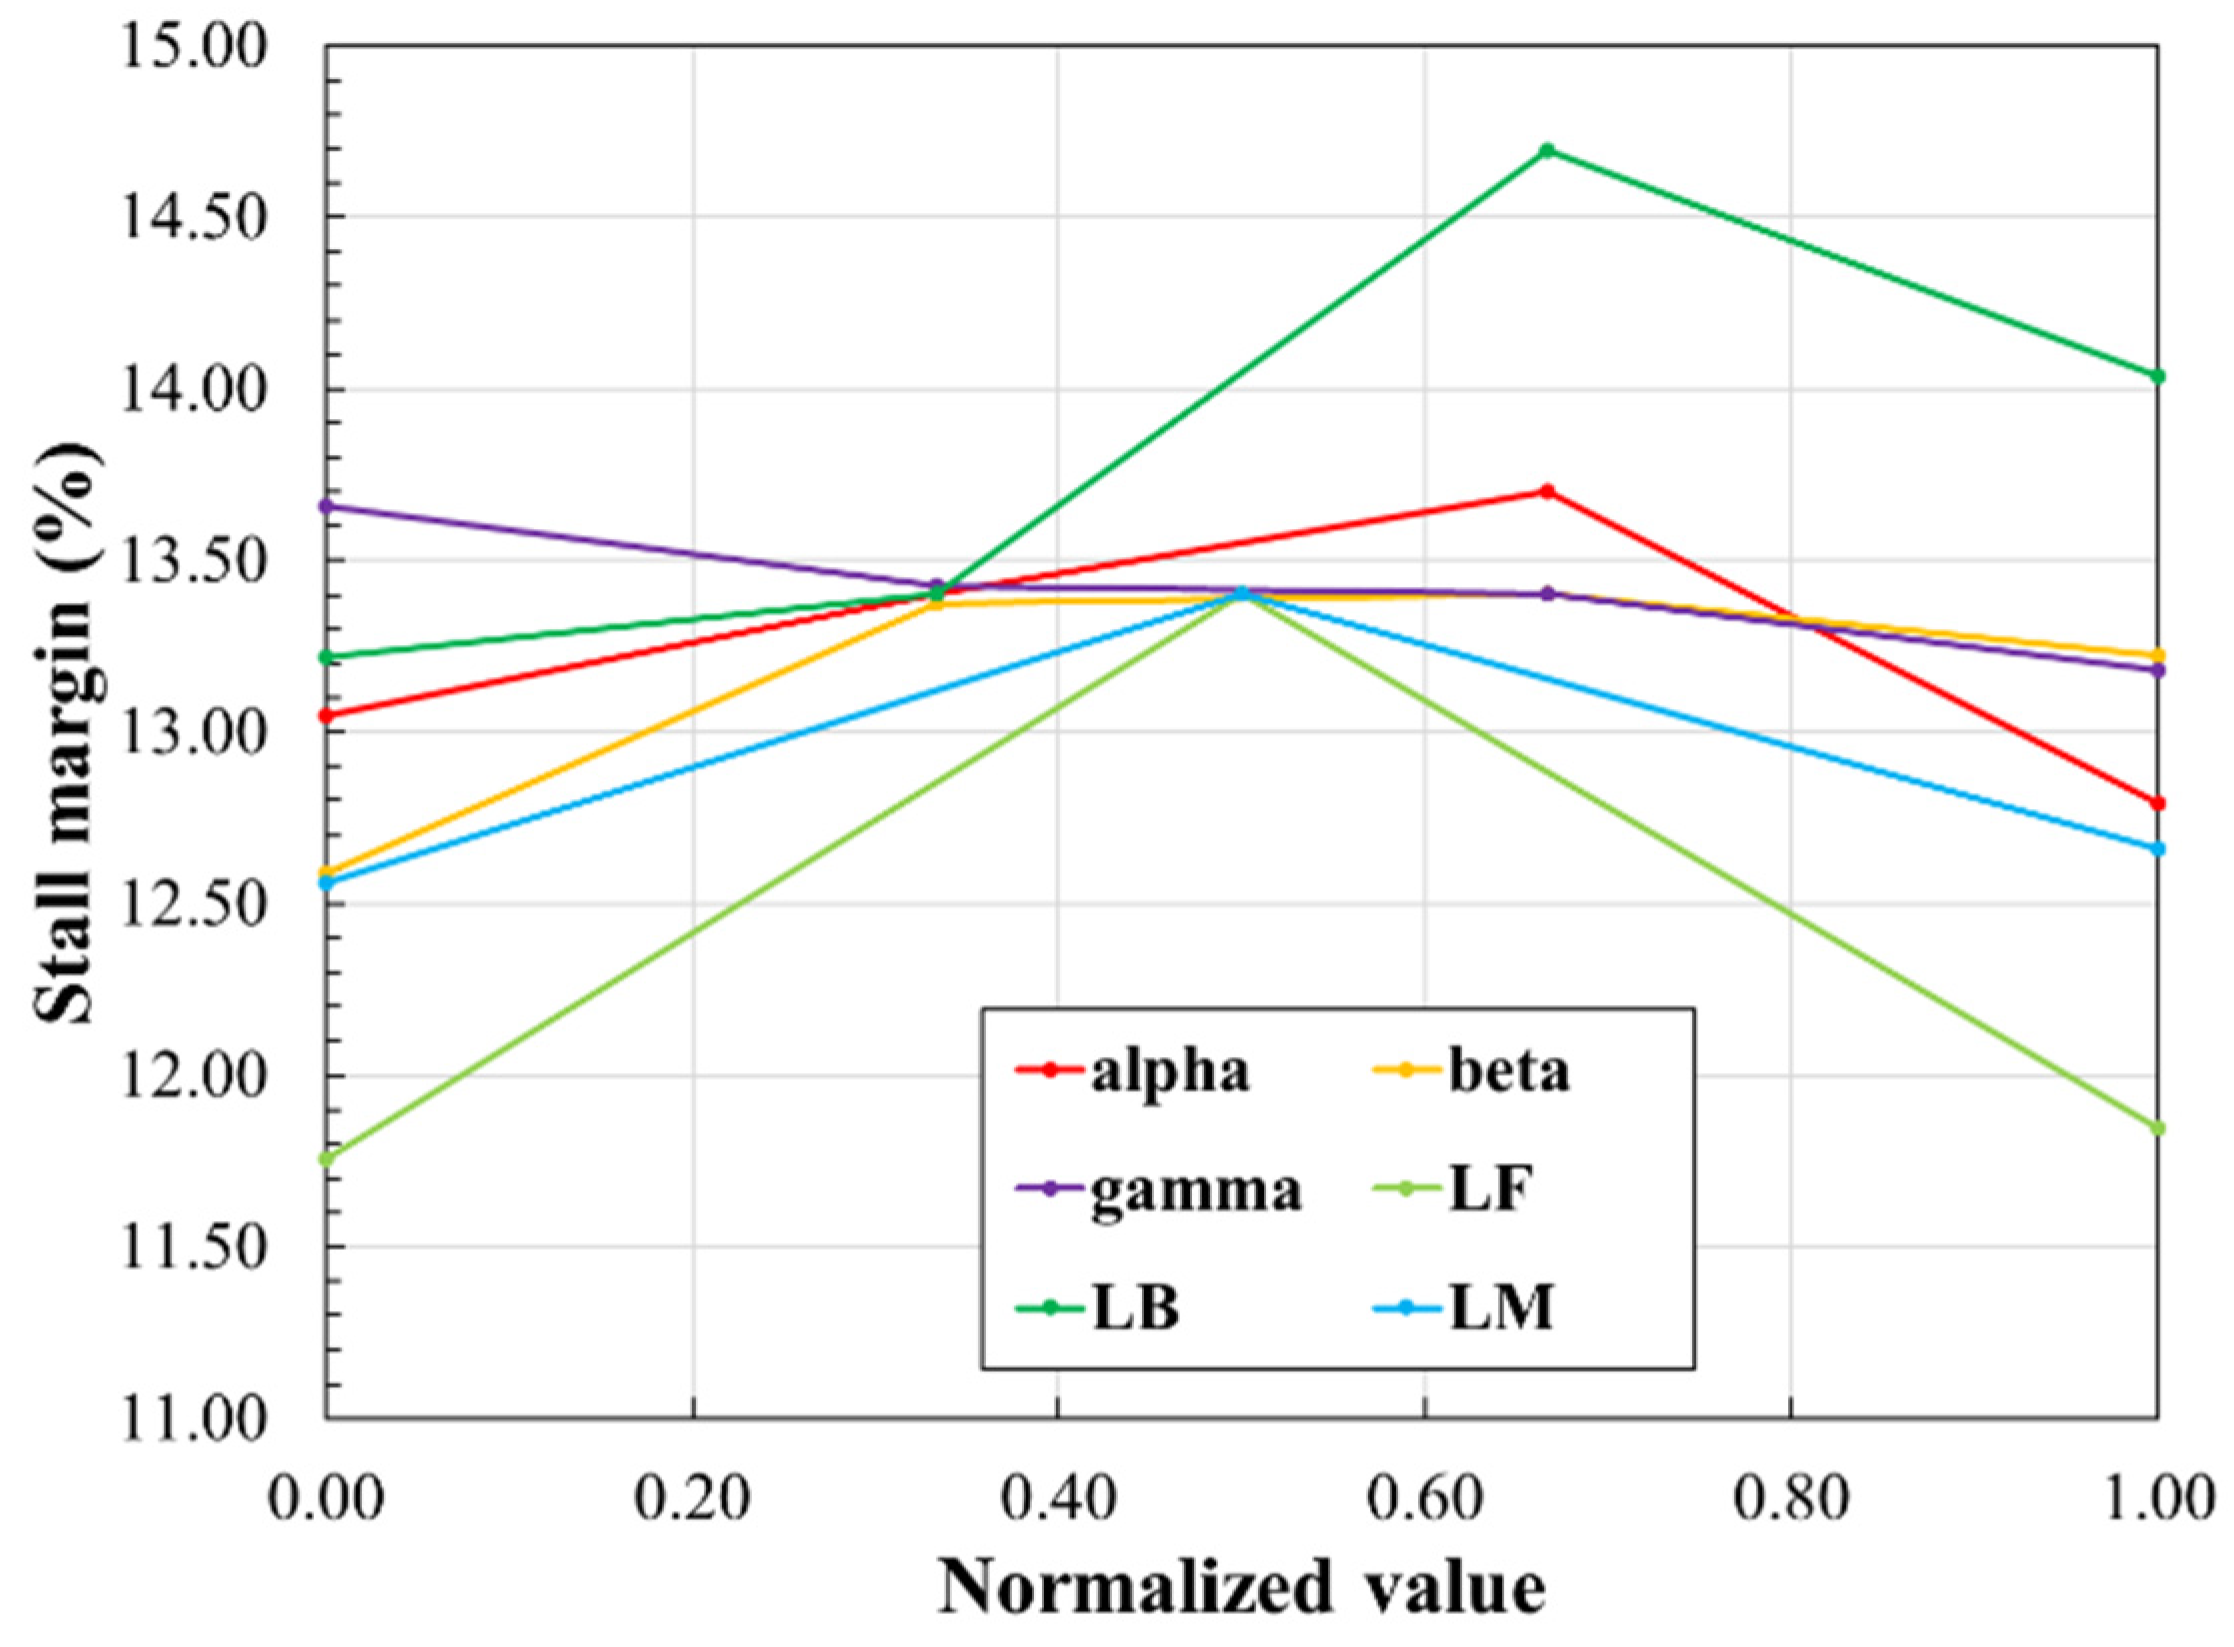
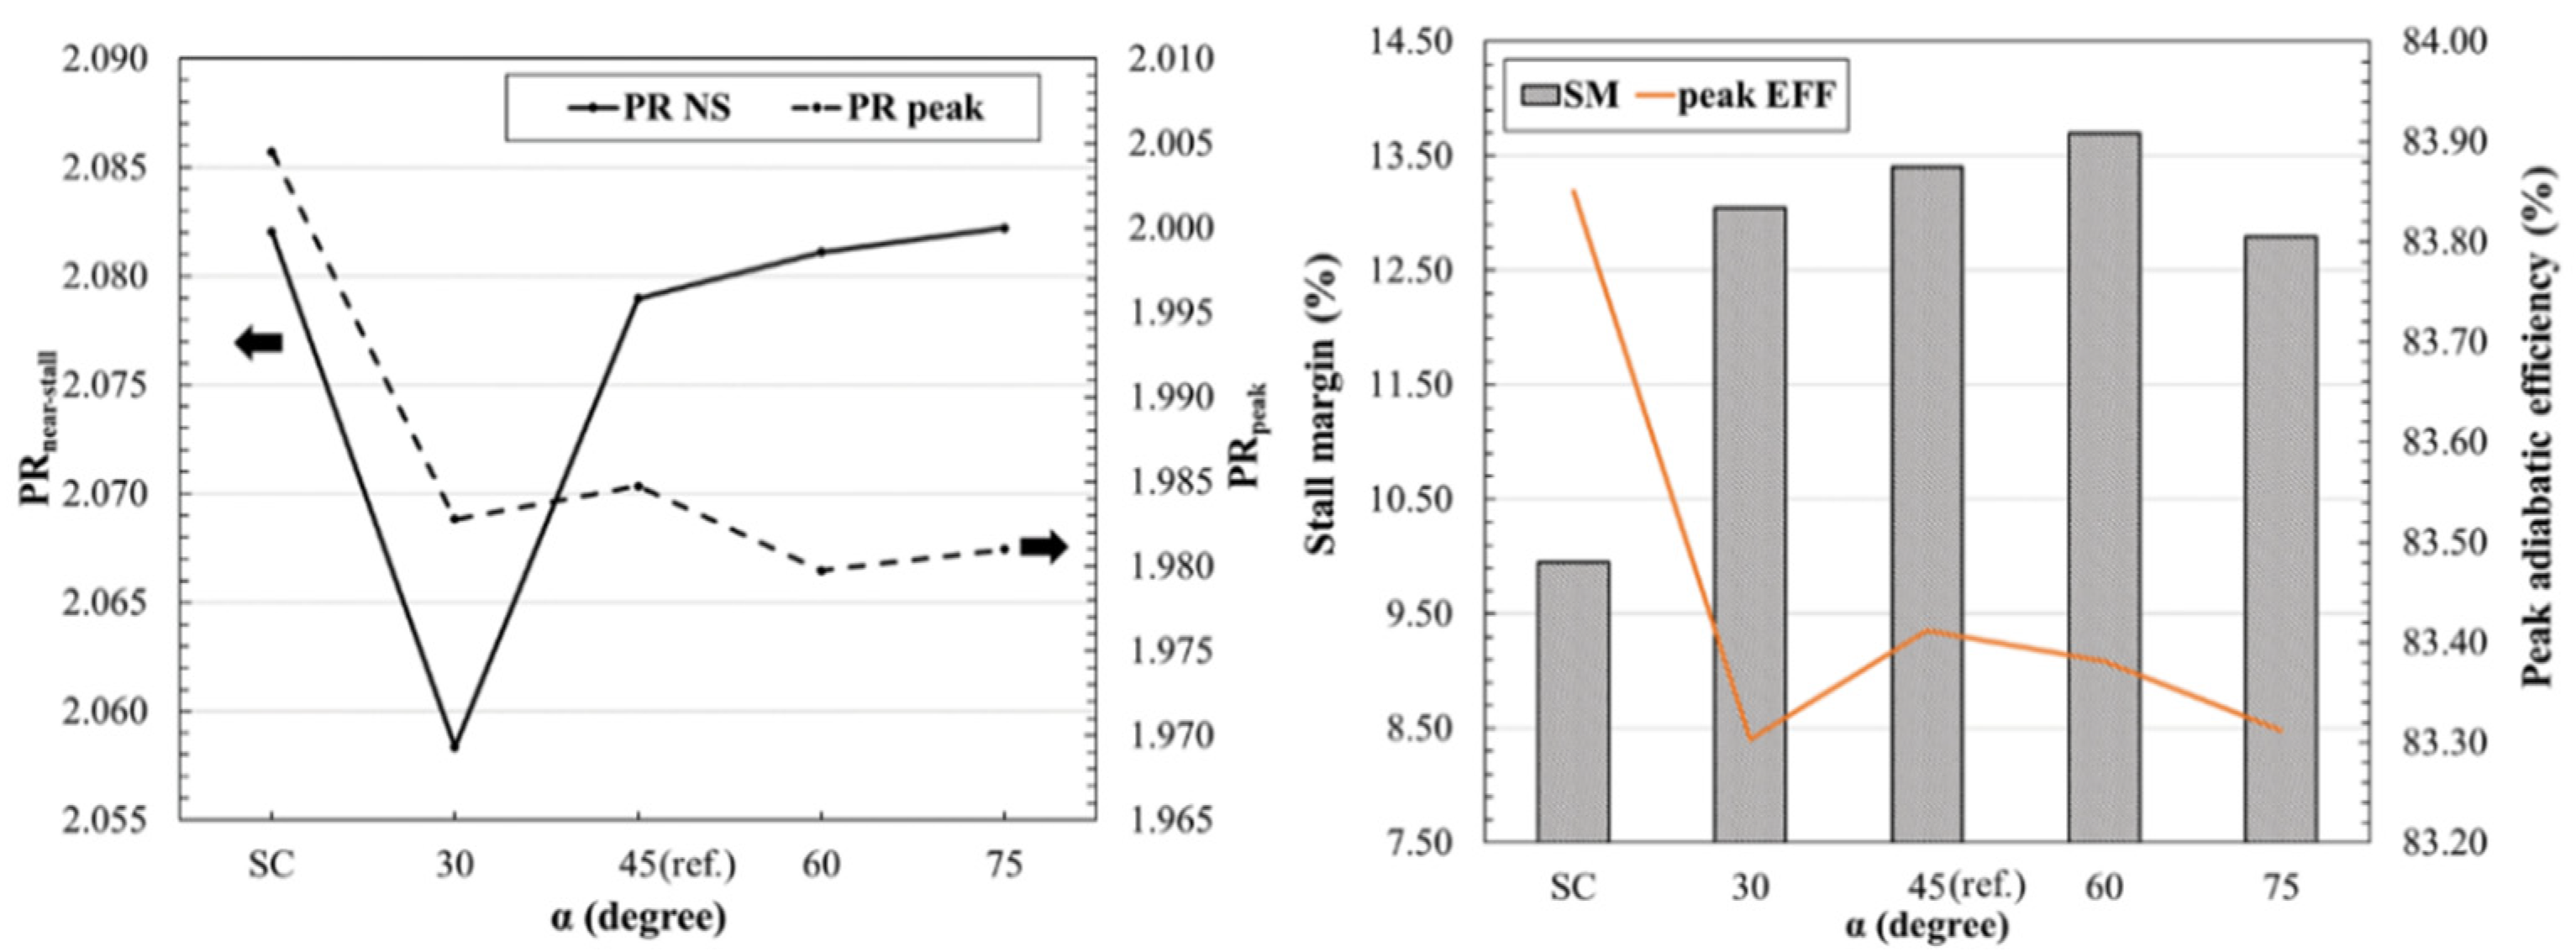
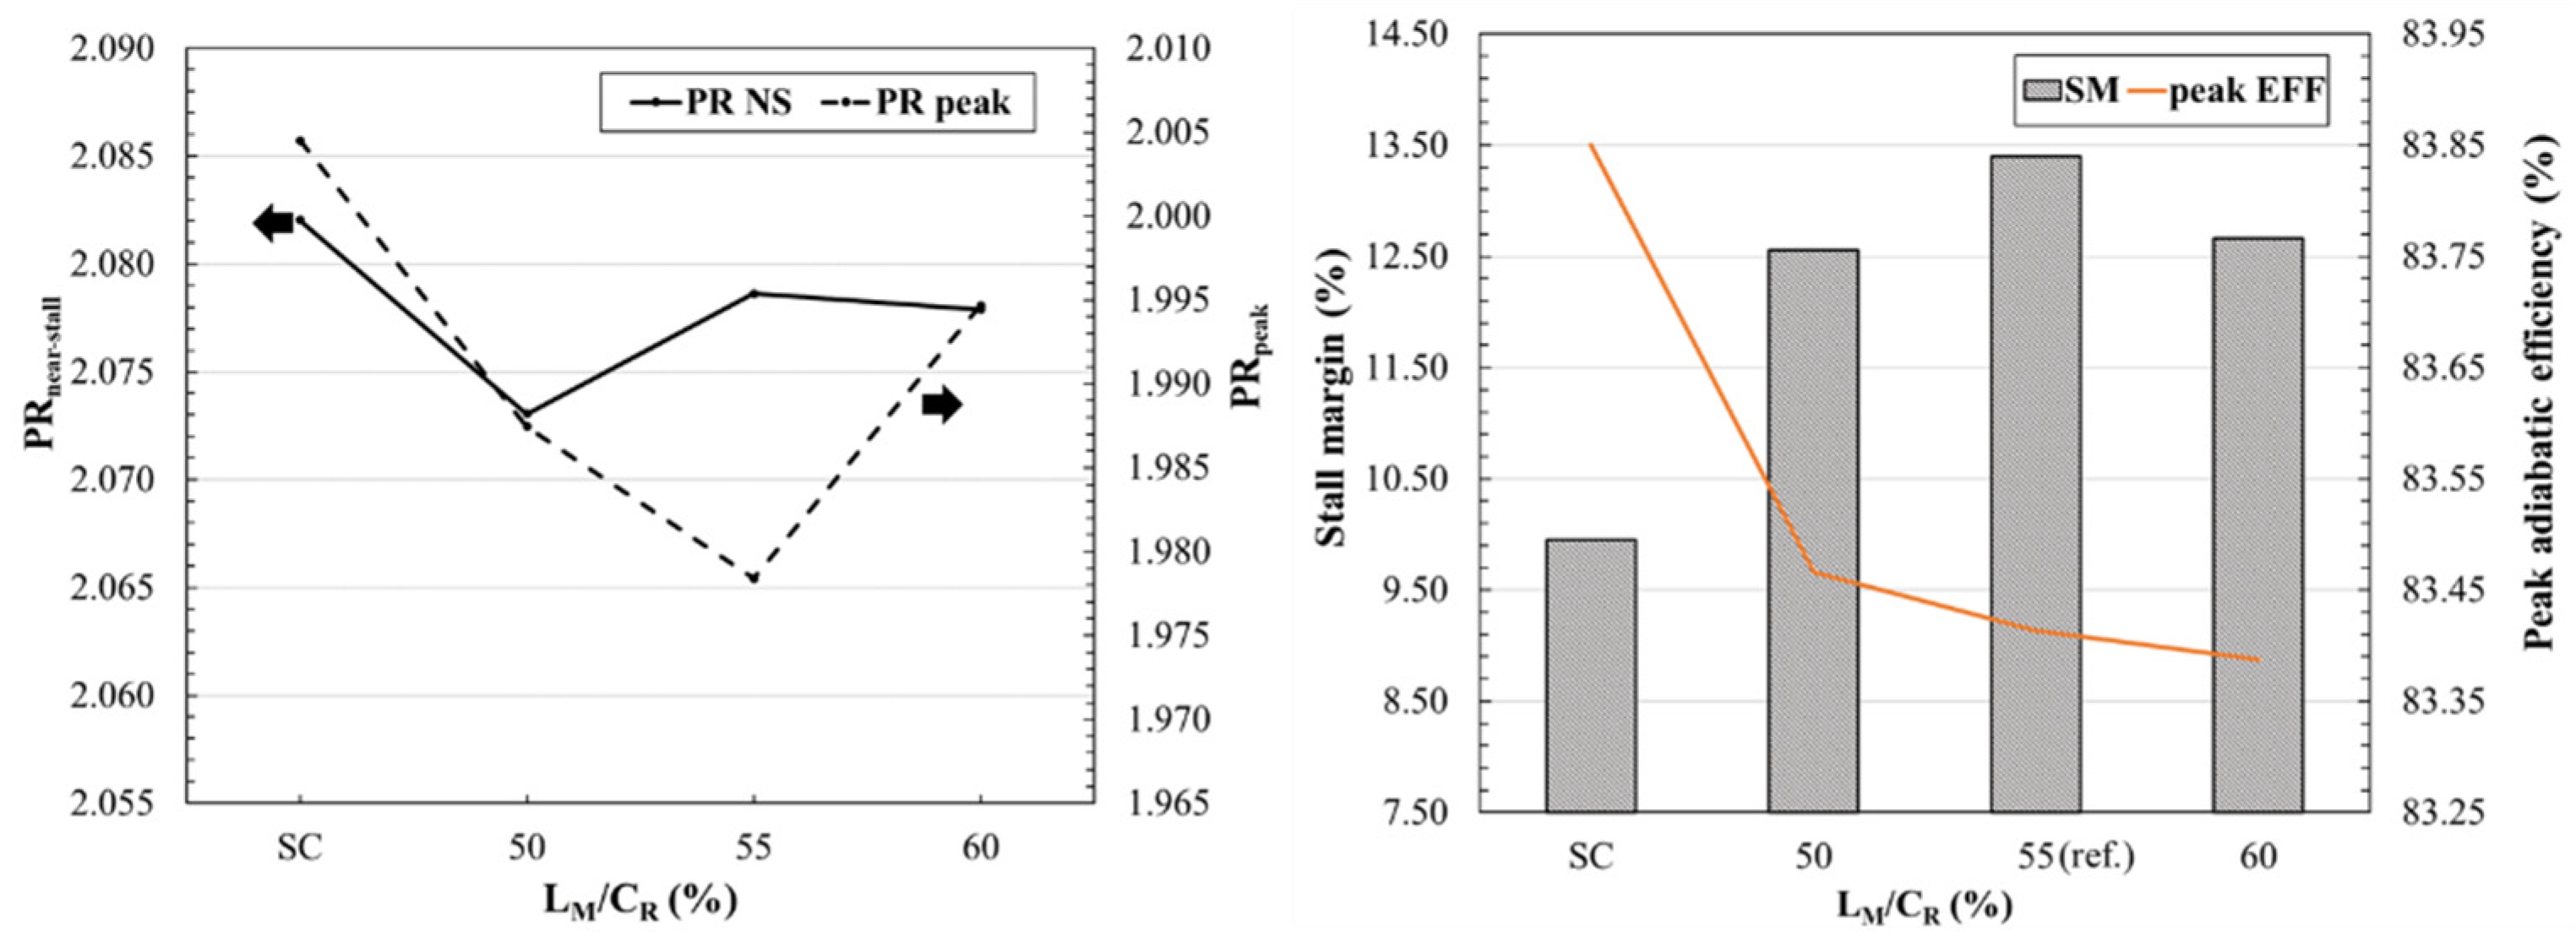
4.2. Parametric Study
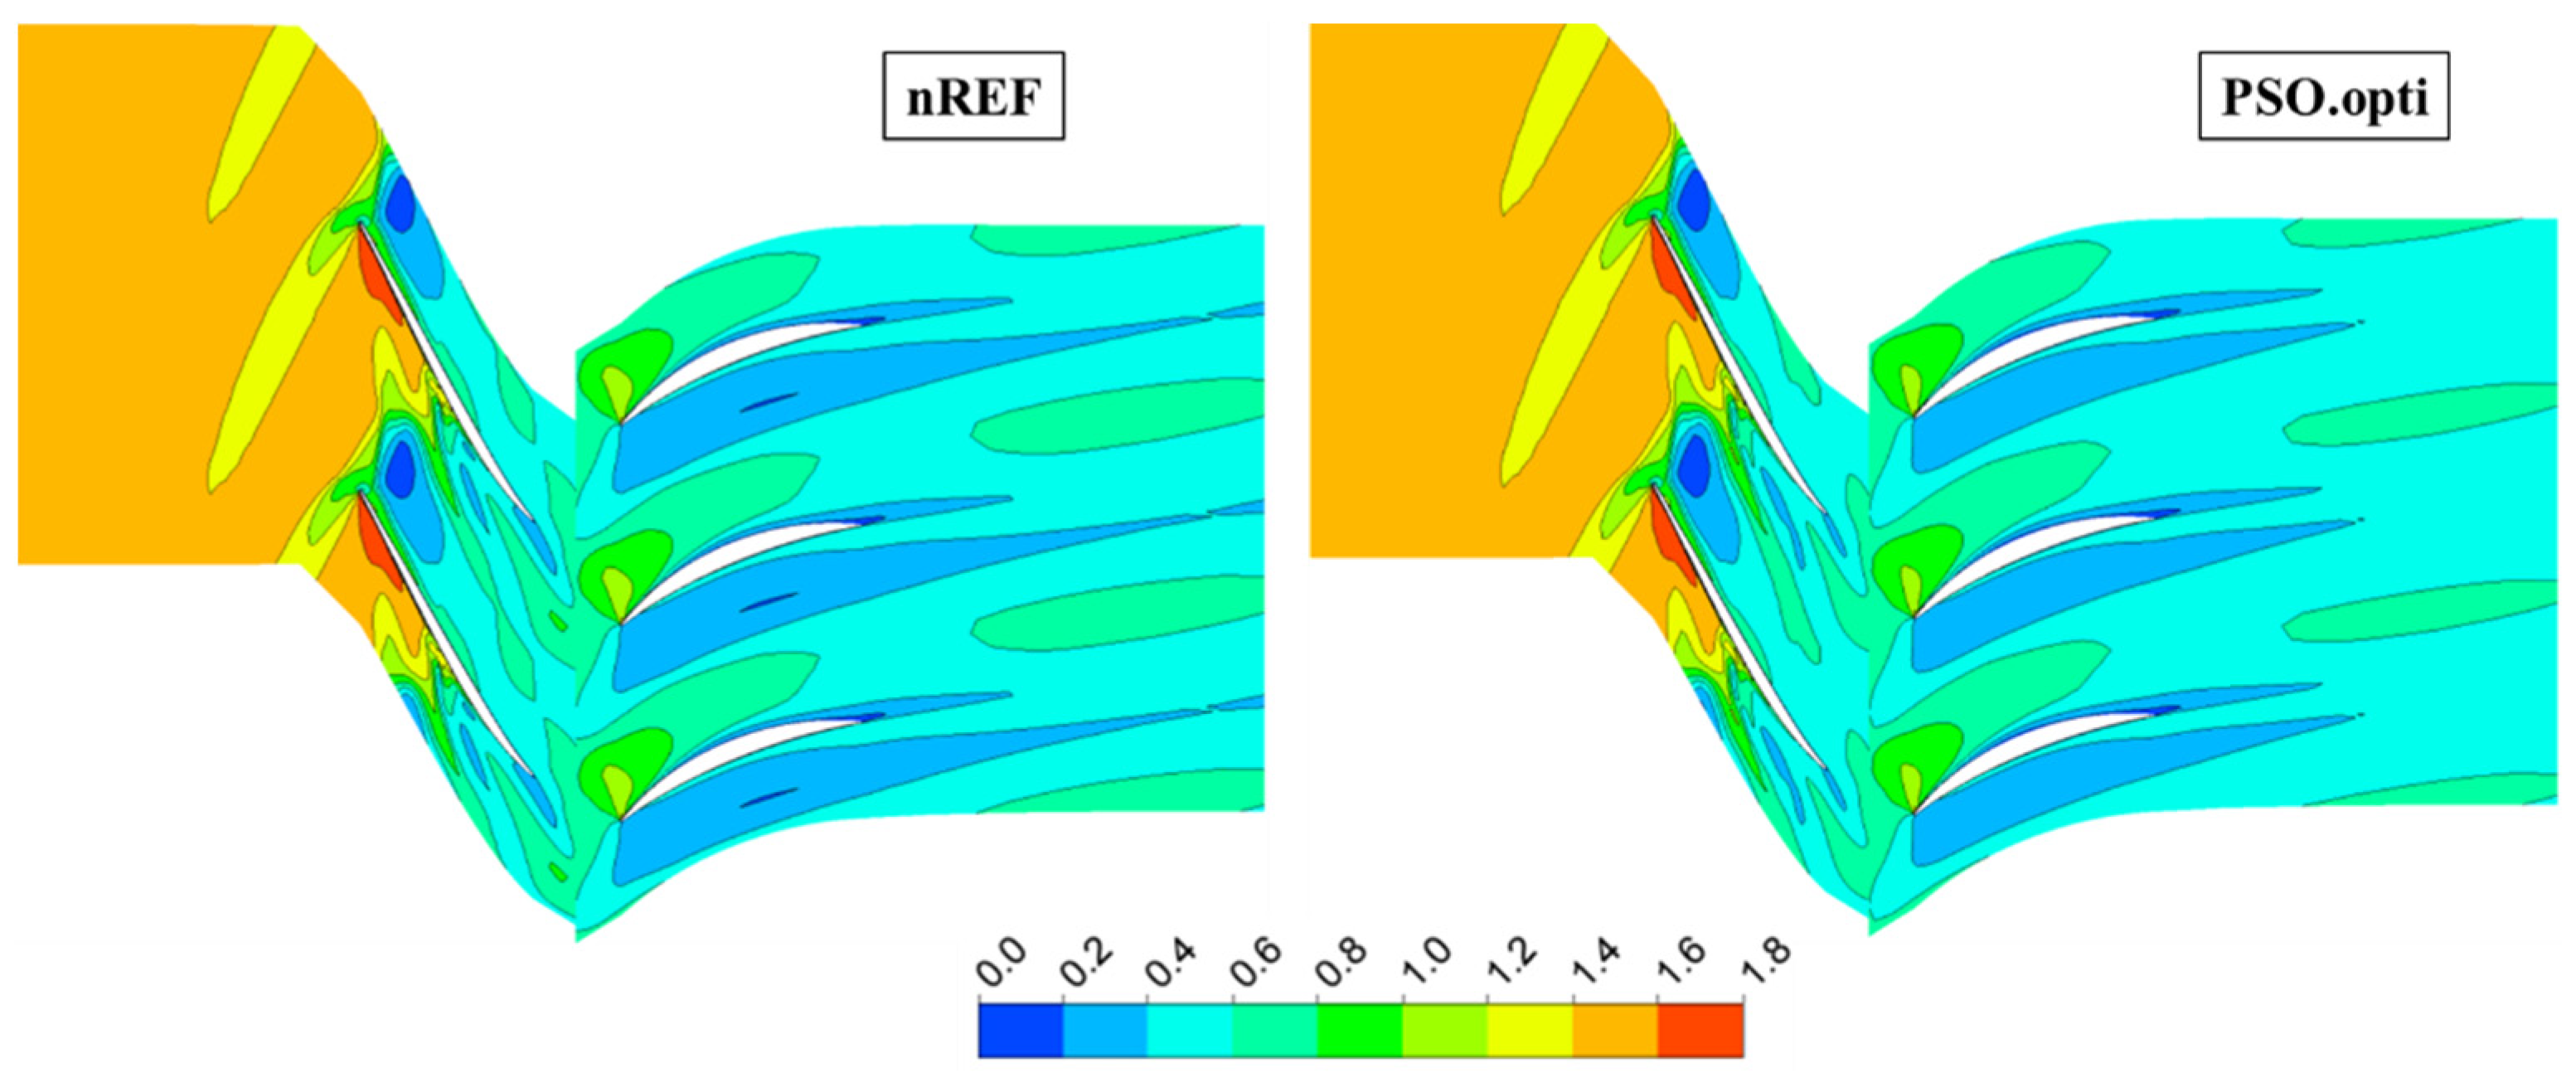
4.3. Optimization
5. Conclusions
Author Contributions
Funding
Institutional Review Board Statement
Informed Consent Statement
Data Availability Statement
Conflicts of Interest
References
- Hathaway, M.D. Self-recirculating casing treatment concept for enhanced compressor performance. In American Society of Mechanical Engineers; International Gas Turbine Institute, Turbo Expo (Publication) IGTI: Amsterdam, The Netherlands, 2002; Volume 5, pp. 411–420. [Google Scholar]
- Koff, S.; Mazzawy, R. Case treatment for compressor blades. US005282718A, 1 February 1994. [Google Scholar]
- Hobbs, D.E.; Windsor, S. Active Vaned Passage Casing Treatment. US005431533A, 11 July 1995. [Google Scholar]
- Nolcheff, N.A. Flow Aligned Plenum Endwall Treatment for Compressor Blades. US005586859A, 24 December 1996. [Google Scholar]
- Strazisar, A.J.; Bright, M.M.; Thorp, S.; Culley, D.E.; Suder, K.L. Compressor stall control through endwall recirculation. In Proceedings of the ASME Turbo Expo 2004, Vienna, Austria, 14–17 June 2004; Voluem 5, pp. 655–667. [Google Scholar]
- Khaleghi, H.; Tousi, A.M.; Boroomand, M.; Teixeira, J.A. Recirculation casing treatment by using a vaned passage for a transonic axial-flow compressor. Proc. Inst. Mech. Eng. Part A J. Power Energy 2007, 221, 1153–1162. [Google Scholar] [CrossRef]
- Weichert, S.; Day, I.; Freeman, C. Self-regulating casing treatment for axial compressor stability enhancement. In Proceedings of the ASME Turbo Expo 2011, Vancouver, BC, Canada, 6–10 June 2011; Volume 7, pp. 225–238. [Google Scholar]
- Khaleghi, H. Effect of discrete endwall recirculation on the stability of a high-speed compressor rotor. Aerosp. Sci. Technol. 2014, 37, 130–137. [Google Scholar] [CrossRef]
- Wang, W.; Chu, W.; Zhang, H.; Wu, Y. The effects on stability, performance, and tip leakage flow of recirculating casing treatment in a subsonic axial flow compressor. In Proceedings of the ASME Turbo Expo, Seoul, Korea, 13–17 June 2016; Volume 2A-2016. [Google Scholar]
- Dinh, C.T.; Ma, S.B.; Kim, K.Y. Effects of a circumferential feed-back channel on aerodynamic performance of a single-stage transonic axial compressor. Proc. ASME Turbo Expo 2017, 2A-2017, 57–65. [Google Scholar] [CrossRef]
- Li, J.; Du, J.; Li, Z.; Lin, F. Stability enhancement with self- recirculating injection in axial flow compressor. J. Turbomach. 2018, 140, 071001. [Google Scholar] [CrossRef]
- Khaleghi, H. A new approach of endwall recirculation in axial compressors. Aerosp. Sci. Technol. 2020, 98, 105704. [Google Scholar] [CrossRef]
- Vuong, T.; Kim, K.; Dinh, C. Recirculation-groove coupled casing treatment for a transonic axial compressor. Aerosp. Sci. Technol. 2021, 111, 106556. [Google Scholar] [CrossRef]
- Samad, A.; Kim, K.Y. Shape optimization of an axial compressor blade by multi-objective genetic algorithm. Proc. Inst. Mech. Eng. Part A J. Power Energy 2008, 222, 599–611. [Google Scholar] [CrossRef]
- Deb, K.; Pratap, A.; Agarwal, S.; Meyarivan, T. A Fast and Elitist Multiobjective Genetic Algorithm: NSGA-II. IEEE Trans. Evol. Comput. 2002, 6, 182–197. [Google Scholar] [CrossRef] [Green Version]
- Lucas, J.M. Response Surface Methodology: Process and Product Optimization Using Designed Experiments, 3rd edition. J. Qual. Technol. 2010, 42, 228–230. [Google Scholar] [CrossRef]
- Deb, K. Multi-objective Optimisation Using Evolutionary Algorithms: An Introduction. In Multi-Objective Evolutionary Optimisation for Product Design and Manufacturing; Wang, L., Ng, A.H.C., Deb, K., Eds.; Springer: London, UK, 2011; pp. 3–34. ISBN 978-0-85729-652-8. [Google Scholar]
- Kim, J.-H.; Ovgor, B.; Cha, K.H.; Kim, J.H.; Lee, S.; Kim, K.Y. Optimization of the aerodynamic and aeroacoustic performance of an axial-flow fan. AIAA J. 2014, 52, 2032–2044. [Google Scholar] [CrossRef]
- Khalfallah, S.; Ghenaiet, A.; Benini, E.; Bedon, G. Surrogate-Based Shape Optimization of Stall Margin and Efficiency of a Centrifugal Compressor. J. Propuls. Power 2015, 31, 1607–1620. [Google Scholar] [CrossRef]
- Ma, S.B.; Afzal, A.; Kim, K.Y. Optimization of ring cavity in a centrifugal compressor based on comparative analysis of optimization algorithms. Appl. Therm. Eng. 2018, 138, 633–647. [Google Scholar] [CrossRef]
- Goldberg, D.E. Genetic algorithms in search, optimization, and machine learning. Choice Rev. Online 1989, 27, 27-0936. [Google Scholar] [CrossRef]
- Kennedy, J.; Eberhart, R. Particle swarm optimization. In Proceedings of the ICNN’95-International Conference on Neural Networks, Perth, Australia, 27 November–1 December 1995; Volume 4, pp. 1942–1948. [Google Scholar]
- Van Laarhoven, P.J.M.; Aarts, E.H.L. Simulated Annealing BT-Simulated Annealing: Theory and Applications; van Laarhoven, P.J.M., Aarts, E.H.L., Eds.; Springer: Dordrecht, The Netherlands, 1987; pp. 7–15. ISBN 978-94-015-7744-1. [Google Scholar]
- Cheng, J.; Zhao, S.; Dong, Z.; Yang, C. Design Optimization of a Multistage Axial Flow Compressor Based on Full-Blade Surface Parameterization and Phased Strategy. Int. J. Aerosp. Eng. 2021, 2021. [Google Scholar] [CrossRef]
- Jinxin, C.; Chen, J.; Xiang, H. Aerodynamic Optimization Design of Compressor Blades Based on Improved Artificial Bee Colony Algorithm. In Proceedings of the 2018 Joint Propulsion Conference, Cincinnati, OH, USA, 9–11 July 2018; AIAA Propulsion and Energy Forum. American Institute of Aeronautics and Astronautics: Reston, VA, USA, 2018. [Google Scholar]
- Yan, S.; Chu, W.L. Influence of self-circulating casing treatment with double-bleed ports structure on compressor performance. Proc. Inst. Mech. Eng. Part G J. Aerosp. Eng. 2020, 234, 1743–1756. [Google Scholar] [CrossRef]
- Lonnie, R.; Moore, R.D. Design and Overall Performance of Four Highly Loaded, High-Speed Inlet Stages for an Advanced High-Pressure-Ratio Core Compressor. In NASA Technical Paper 1337; NASA Lewis Research Center: Cleverland, OH, USA, 1978. [Google Scholar]
- Wilke, I.; Kau, H.P.; Brignole, G. Numerically aided design of a high-efficient casing treatment for a transonic compressor. In Proceedings of the ASME Turbo Expo, Reno-Tahoe, NV, USA, 6–9 June 2005; Volume 6, pp. 353–364. [Google Scholar]
- Hofmann, W.; Ballmann, J. Tip clearance vortex development and shock-vortex-interaction in a transonic axial compressor rotor. In Proceedings of the 40th AIAA Aerosp. Sci. Meet. Exhib, Reno, NV, USA, 14–17 January 2002. [Google Scholar] [CrossRef]
- ANSYS. ANSYS CFX-Solver Theory Guide Release 15.0; ANSYS: Canonsburg, PA, USA, 2014. [Google Scholar]
- Shim, H.-S.; Kim, S.-H.; Kim, K.-Y. Analysis and Optimization of Staggered Partial Diffuser Vanes in a Centrifugal Pump. J. Fluids Eng. 2020, 142, 051207. [Google Scholar] [CrossRef]
- Barth, T.; Jespersen, D. The design and application of upwind schemes on unstructured meshes. In Proceedings of the 27th Aerospace Sciences Meeting; Aerospace Sciences Meetings, Reno, NV, USA, 9–12 January 1989; American Institute of Aeronautics and Astronautics: Reston, VA, USA, 1989. [Google Scholar]
- Chen, H.; Huang, X.; Fu, S. CFD investigation on stall mechanisms and casing treatment of a transonic compressor. In Proceedings of the Collection of Technical Papers-AIAA/ASME/SAE/ASEE 42nd Joint Propulsion Conference, Sacramento, CA, USA, 9–12 July 2006; Volume 6, pp. 4789–4798. [Google Scholar]
- Kim, J.H.; Choi, K.J.; Kim, K.Y. Performance evaluation of a transonic axial compressor with circumferential casing grooves. In Proceedings of the Institution of Mechanical Engineers. Part A J. Power Energy 2012, 226, 218–230. [Google Scholar] [CrossRef]
- Dinh, C.T.; Heo, M.W.; Kim, K.Y. Aerodynamic performance of transonic axial compressor with a casing groove combined with blade tip injection and ejection. Aerosp. Sci. Technol. 2015, 46, 176–187. [Google Scholar] [CrossRef]
- Celik, I.; Karatekin, O. Numerical experiments on application of richardson extrapolation with nonuniform grids. J. Fluids Eng. Trans. ASME 1997, 119, 584–590. [Google Scholar] [CrossRef]
- McKay, M.D.; Beckman, R.J.; Conover, W.J. A Comparison of Three Methods for Selecting Values of Input Variables in the Analysis of Output from a Computer Code. Technometrics 1979, 21, 239–245. [Google Scholar] [CrossRef]
- MATLAB. The Language of Technical Computing-Release 14; Mathworks: Natick, MA, USA, 2004. [Google Scholar]


| Parameters | LF/CR (%) | LM/CR (%) | LB/CR (%) | α (°) | β (°) | γ (°) |
|---|---|---|---|---|---|---|
| Values | 45 | 55 | 70 | 45 | 45 | 45 |
| Parameters | Symbols | Values |
|---|---|---|
| Number of mesh elements in RE2B | G1/G2/G3 | 293,319/148,665/63,632 |
| Grid refinement factors | r21/r32 | 1.97/2.34 |
| Stall margin corresponding to G1/G2/G3 | SM1/SM2/SM3 | 13.40/13.38/13.24 |
| Apparent order | p | 3.13 |
| Extrapolated value | 13.40 | |
| Approximated relative error | 0.0746% | |
| Extrapolated relative error | 0.0101% | |
| Grid convergence index | 0.0126% |
| Parameters | LF/CR (%) | LM/CR (%) | LB/CR (%) | α (°) | β (°) | γ (°) |
|---|---|---|---|---|---|---|
| Lower limit | 40 | 50 | 65 | 30 | 15 | 15 |
| Upper limit | 50 | 60 | 80 | 75 | 60 | 60 |
| Design Variables | Fixed Parameters | |||||
|---|---|---|---|---|---|---|
| LF/CR (%) | LB/CR (%) | α (°) | LM/CR (%) | β (°) | γ (°) | |
| Lower limit | 40 | 70 | 45 | 55 | 45 | 15 |
| Upper limit | 50 | 80 | 75 | |||
| Design | LF/CR (%) | LB/CR (%) | α (°) | Objective Function | Error (%) | Improvement (%) | ||
|---|---|---|---|---|---|---|---|---|
| MATLAB | RANS | vs. SC | vs. nREF | |||||
| SC | - | - | - | - | 9.95 | - | - | - |
| nREF | 45 | 70 | 45 | - | 13.77 | - | 38.39 | - |
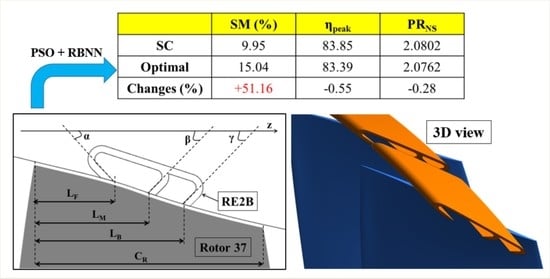
| PSO.opti | 46.25 | 77.57 | 46.56 | 15.05 | 15.04 | −0.07 | 51.16 | 9.22 |
| Design | ηpeak (%) | PRpeak | PRNS | Changes vs. SC (%) | ||
|---|---|---|---|---|---|---|
| ηpeak | PRpeak | PRNS | ||||
| SC | 83.85 | 2.0045 | 2.0820 | - | - | - |
| nREF | 83.41 | 1.9778 | 2.0785 | −0.52 | −1.33 | −0.17 |
| PSO.opti | 83.39 | 1.9562 | 2.0762 | −0.55 | −2.41 | −0.28 |
Publisher’s Note: MDPI stays neutral with regard to jurisdictional claims in published maps and institutional affiliations. |
© 2021 by the authors. Licensee MDPI, Basel, Switzerland. This article is an open access article distributed under the terms and conditions of the Creative Commons Attribution (CC BY) license (https://creativecommons.org/licenses/by/4.0/).
Share and Cite
Vuong, T.-D.; Kim, K.-Y. Design Optimization of a Dual-Bleeding Recirculation Channel to Enhance Operating Stability of a Transonic Axial Compressor. Energies 2022, 15, 159. https://doi.org/10.3390/en15010159
Vuong T-D, Kim K-Y. Design Optimization of a Dual-Bleeding Recirculation Channel to Enhance Operating Stability of a Transonic Axial Compressor. Energies. 2022; 15(1):159. https://doi.org/10.3390/en15010159
Chicago/Turabian StyleVuong, Tien-Dung, and Kwang-Yong Kim. 2022. "Design Optimization of a Dual-Bleeding Recirculation Channel to Enhance Operating Stability of a Transonic Axial Compressor" Energies 15, no. 1: 159. https://doi.org/10.3390/en15010159
APA StyleVuong, T.-D., & Kim, K.-Y. (2022). Design Optimization of a Dual-Bleeding Recirculation Channel to Enhance Operating Stability of a Transonic Axial Compressor. Energies, 15(1), 159. https://doi.org/10.3390/en15010159