Review

Analysis of Fire Hazards Associated with the Operation of Electric Vehicles in Enclosed Structures

by
Adam Dorsz
1,* and
Mirosław Lewandowski
2
1
Power Engineering Institute, Doctoral School nr 4, Warsaw University of Technology, 00-662 Warsaw, Poland
2
Electric Traction Division, Power Engineering Institute, Warsaw University of Technology, 00-662 Warsaw, Poland
*
Author to whom correspondence should be addressed.
Energies 2022, 15(1), 11; https://doi.org/10.3390/en15010011
Submission received: 9 November 2021 / Revised: 5 December 2021 / Accepted: 6 December 2021 / Published: 21 December 2021
(This article belongs to the Special Issue Trends in the Development of Electric Vehicle)

Abstract

:
The article discusses the analysis of the possible development of hazards associated with the operation of vehicles equipped with an electric drive using the example of passenger cars. The authors review the problem of the safety of people and property resulting from the occurrence of a fire in an electric passenger car, in the context of fires that have occurred in recent years. Particular attention was paid to the analysis of the state of knowledge concerning the characteristics of the fire progression in an electric car, its heat release rate curve [HRR], total heat release [THR], heat of combustion and factors affecting the fire progression. In this paper, an attempt was made to compare the fire characteristics of an electric car and a passenger car equipped with an internal combustion engine together with an estimation, using CFD simulations, of the impact on the safety of people and property in closed structures such as underground garages or road tunnels. The need for further development of research on electric cars equipped with large lithium-ion batteries in the context of their fire safety is indicated. The authors pay attention to the insufficient amount of data available to understand the fire characteristics of modern electric cars, which would enable the appropriate design of fire safety systems in building structures.

1. Introduction

Legislative changes aimed at introduction of an increasing number of restrictions on the reduction of nitrogen oxides (NOx), hydrocarbons (HC), carbon oxides (CO) and particulate matter (PM) in exhaust gases of newly sold vehicles (e.g., introduction of EURO VI standard in the European Union and European Economic Area, EURO VII standard is under preparation) [1] and increased car users’ awareness have contributed to a new direction in automotive development, in which the implementation of a low-emission drive source has become a key factor. In the case of passenger cars, electric cars of all types have started to play a much greater role than even a decade ago [2], which creates new challenges in terms of ensuring an appropriate level of fire safety in their operation. In the case of use of passenger cars equipped with internal combustion engines, the last two decades have provided many research works presenting their fire characteristics necessary for proper understanding of the hazards resulting from fires [3,4,5,6,7,8,9,10,11]. This enables use to understand the key parameters related to fire development, i.e., heat release rates and temperatures, thanks to which it is possible to properly design smoke and heat control systems, sprinkler systems or fire extinguishing equipment.
The use of numerical methods of computational fluid dynamics (CFD) allows us to reproduce the environmental conditions during a car fire in a closed space such as a road tunnel, underground garage, or storage building, where the danger of evacuation of users, the operation of firefighting and rescue teams and the safety of the structure is the greatest. The quality of the results obtained by CFD numerical calculation is closely related to the input data provided for the analysis, where the key role is the determination of the fire source through the assignment of its basic parameters, i.e., HRR, heat of combustion and smoke generation of the burning material [12,13,14,15]. Lack of definition of the relevant parameter values may lead to analyses of questionable quality, which in many cases may result in non-optimal design of fire safety systems, consequently leading to insufficient level of safety for the users of the building, firefighting and rescue teams or structure of the building.
The most complete studies include [16], which presents a comparison of calorimetric studies of the same passenger car fire equipped with an internal combustion engine ICEV and an electric EV. Other full-scale studies on the comparison of ICEV and EV fires are [17,18,19]. From the cited studies [16,18,19] on the electric car fire, it is concluded that its fire is a comparable risk due to PHRR (peak heat release rate) and THRR (total heat release rate) for a car equipped with an combustion engine ICEV. In the study [17], the authors suggest that fire EV is a comparable risk, but it is characterised by rapid changes in power release and a larger THRR, which may be an additional risk. The resulting heat of combustion related to the mass of fuel burned is also at a comparable level or lower than the ICEV fire [16,17,18]. It should be noted that among several dozens of fires described, the distribution of e.g., maximum power of such a fire (PHRR), depending on the size and years of production, varies significantly and in extreme cases is even up to seven times (1.5 MW [16] to 10.8 MW [18]).The relatively small sample of the fires of electric cars tested with similar traction battery capacities of 16.5 kWh and 23.5 kWh in [16] and 24 kWh in [17] may not provide a complete overview of the electric passenger cars offered today, for which increasingly higher requirements are imposed on the available range. The requirements related to the range of an electric car lead to the development of increasingly larger capacities of traction batteries, which nowadays may be as much as 3–4 times larger (exceed 100 kWh [20,21,22]) than the capacity of the cars tested. Therefore, it is important to know whether the range of PHRR will show similarity to the fires of various types of ICEVs.
Identifying the hazards associated with a fire in electric cars must pay attention to the factors that contribute to its origin, course and extinguishing. The differences in the cause, course, and extinguishing of a fire in an electric car (EV) as compared with an ICEV are due to the different vehicle design. The main differences being the use of traction batteries (usually lithium ion (Li-ion), nickel metal hydride (Ni-MH), molten salt (Na-NiCl2) and lithium sulphur (Li-S)) [23] for energy storage instead of liquid fuel tanks (gasoline, diesel, LPG, CNG) and secondary changes from fire safety with the electric traction motor, onboard charger, charge port, DC/DC convector, power electronics controller, and thermal system [24]. Traction batteries are considered to be the main source of danger due to the susceptibility of their design to mechanical, thermal and electrical impacts that can lead to spontaneous combustion of batteries and further fire development, In the case of traction batteries, particularly dangerous heating curve are characterized by Li-ion batteries, for which at higher temperatures the phenomenon of the thermal runway can occur which is driven by a chain of exothermic reaction, which causes a significant increase in the rate of heat release and consequently the development of fire or explosion [25,26,27,28,29,30].
The main factor determining the amount of energy and the way it will be released is the course of the thermal runway (TR) phenomenon, which is influenced by many factors depending on the way it is initiated (electrical abuse e.g., overcharge, external and internal short circuit; mechanical abuse e.g., crush or the penetration of the cell with objects, like nail-penetration, thermal abuse, e.g., over-temperature, hot spots [30,31,32]). Another important group of factors influencing the thermal runway (TR) characteristics is the construction of the Li-ion battery, the type of material used to build the anode, cathode, electolyte or separator [32,33] and the type of cell housing (can versus pouch) [34]. Other factors that have been studied are the battery state of charge (SOC) [33,35], battery state of health (SOH) [36], capacity and the energy density [37], and ambient temperature [38].
This paper is an attempt to assess the magnitude of the fire hazard of an EV compared to known hazards of ICEV with reference to limited input data (such as the fire growth curve HRR of EV) to enable effective design assumptions to be made for systems to prevent or mitigate the effects of an EV fire in enclosed spaces. In the first part of the paper there is presented the current state of the market of passenger electric cars and further perspectives of its development with special consideration of increasing the probability of fire incidence in electric cars among all the cars on the road. There is made a review of fire incidents in electric cars in recent years and the circumstances in which they occurred. We present the main source of differences between ICEV and EV during a fire, which are Li-ion traction batteries, together with the characteristics of factors conducive to the development of fire danger of li-ion cell. The current state of knowledge on the course of fires in electric cars is presented and used to carry out a comparative analysis of the environmental conditions prevailing in closed facilities such as an underground garage. The analysis was performed using CFD numerical methods and presents a comparison of the impact of the EV and ICEV fire course on the evacuation conditions, the safety of fire-fighting and rescue teams and the building structure by presenting the visibility and temperature during the fire [39].

2. Market Situation and Forecast of Electric Vehicles

The most popular types of electric car currently in production include BEV (battery electric vehicle), PHEV (plug-in hybrid electric vehicle), HEV (hybrid electric vehicle), and MHEV (mild hybrid electric vehicle). BEVs are cars equipped only with an electric motor or motors powered solely by the energy stored in the batteries. PHEVs are cars equipped with both an electric motor and a combustion engine, which work in parallel depending on the load, additionally allowing the batteries to be charged directly from the electricity grid. HEVs are vehicles that use a combustion engine as the main drive source and an electric motor as the supplementary source, and the MHEVs are vehicles based on a similar solution as HEV, but using electric energy mainly to power electrical devices in the vehicle, relieving the combustion unit.
The COVID-19 pandemic in 2020 for the overall global automotive market had a special impact due to a global decline of 16% in passenger car sales compared to 2019 [40]. Despite the declining situation in the broader market, electric car sales in 2020, as in previous years, grew sharply, increasing the number of newly registered charged electric cars (BEV + PHEV) by 43% compared to 2020, representing approximately 3 million new electric cars worldwide. The total number of registered electric cars on the road worldwide at the end of 2020 was approximately 10.1 million. The largest number of electric passenger cars was on the roads of China at approximately 4.5 million cars representing 45% of all passenger charged electric cars (BEV + PHEV) in the world compared to Europe and the USA, where 3.2 million and 1.8 million electric passenger cars were on the road representing 32% and 18% of all passenger charged electric cars (BEV + PHEV), respectively [40]. It is forecasted that this upward trend will accelerate in the coming years, and that by 2030 there will be 116 million electric passenger cars on the roads worldwide (Figure 1) [40].

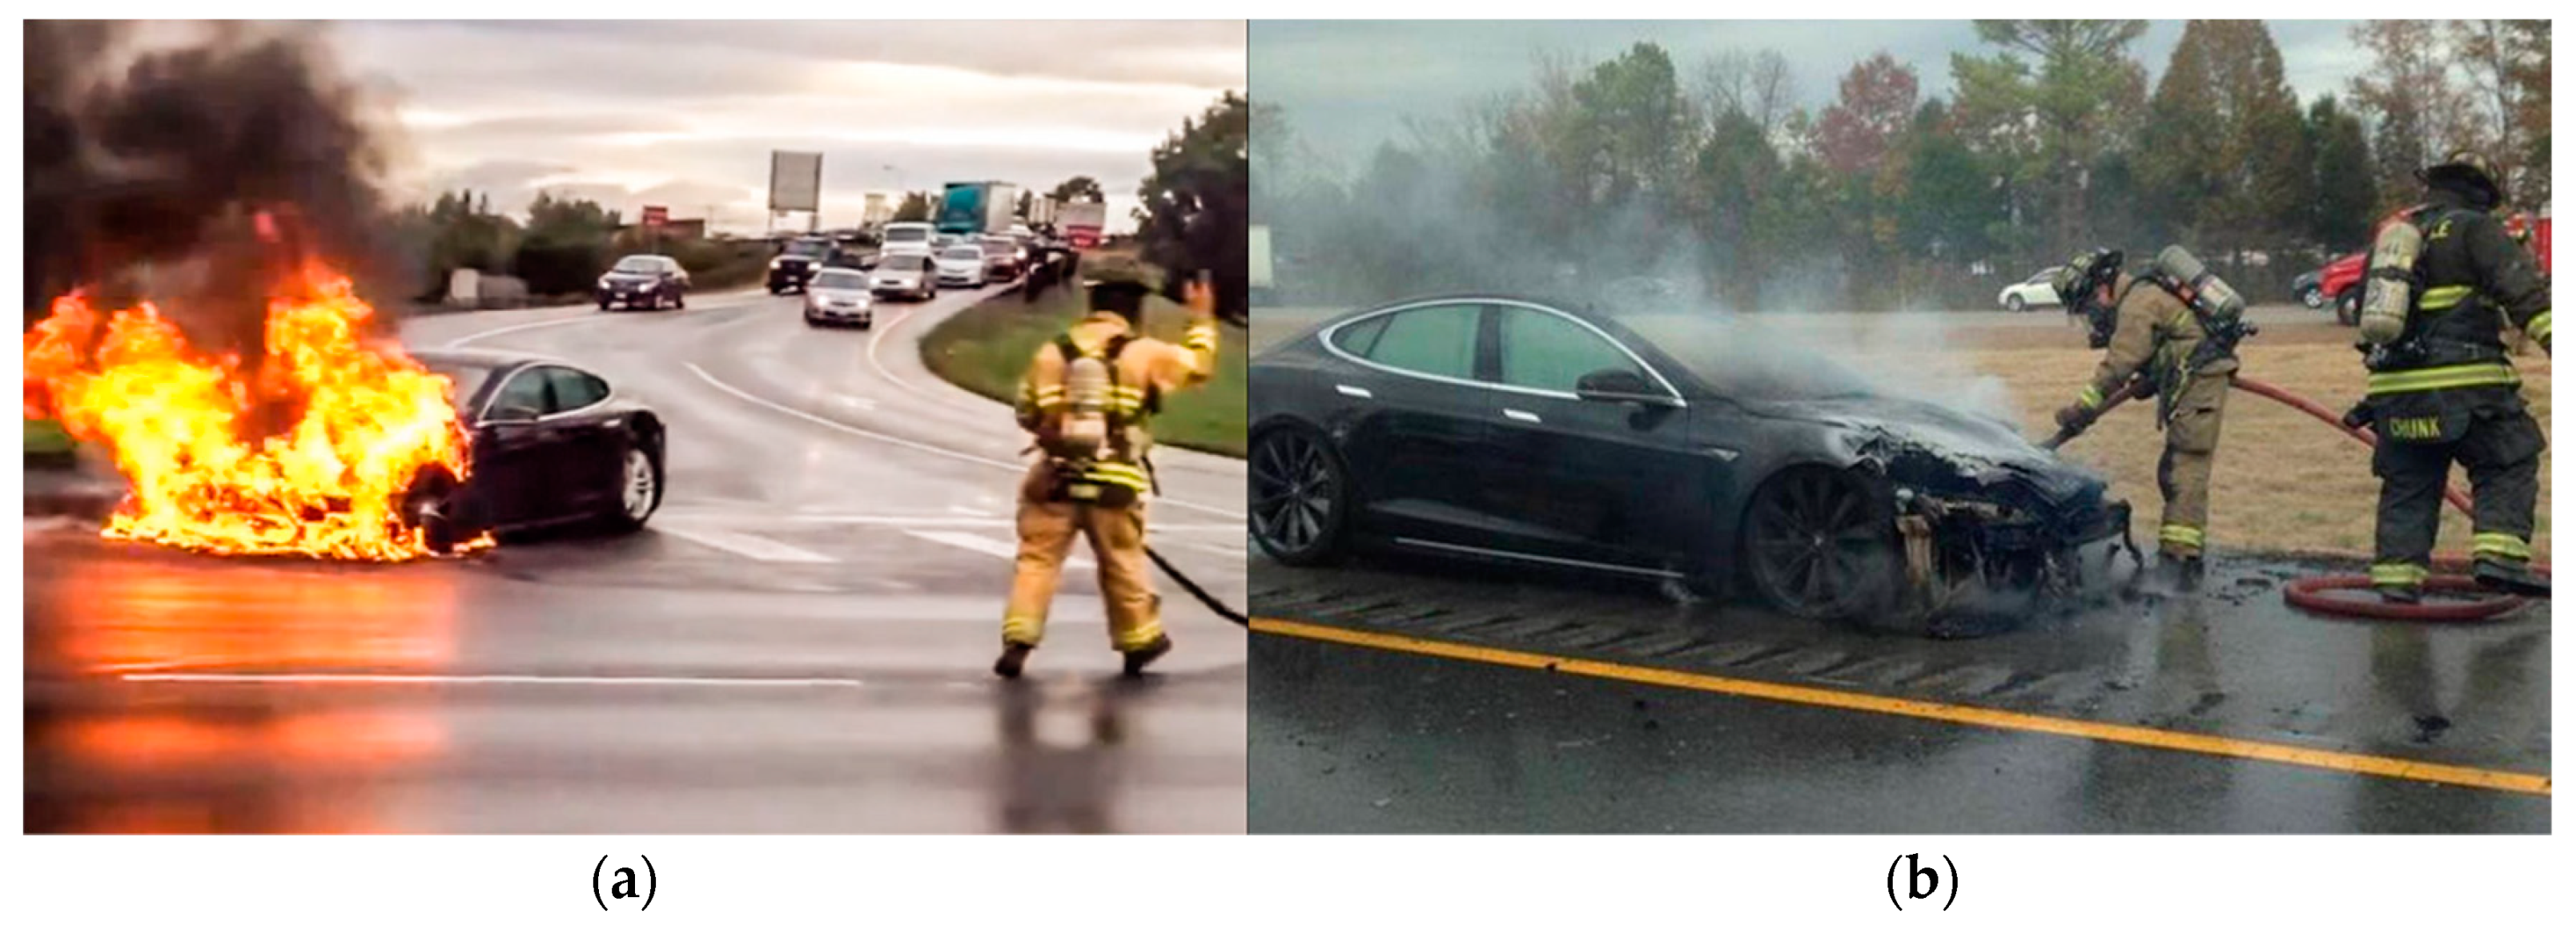
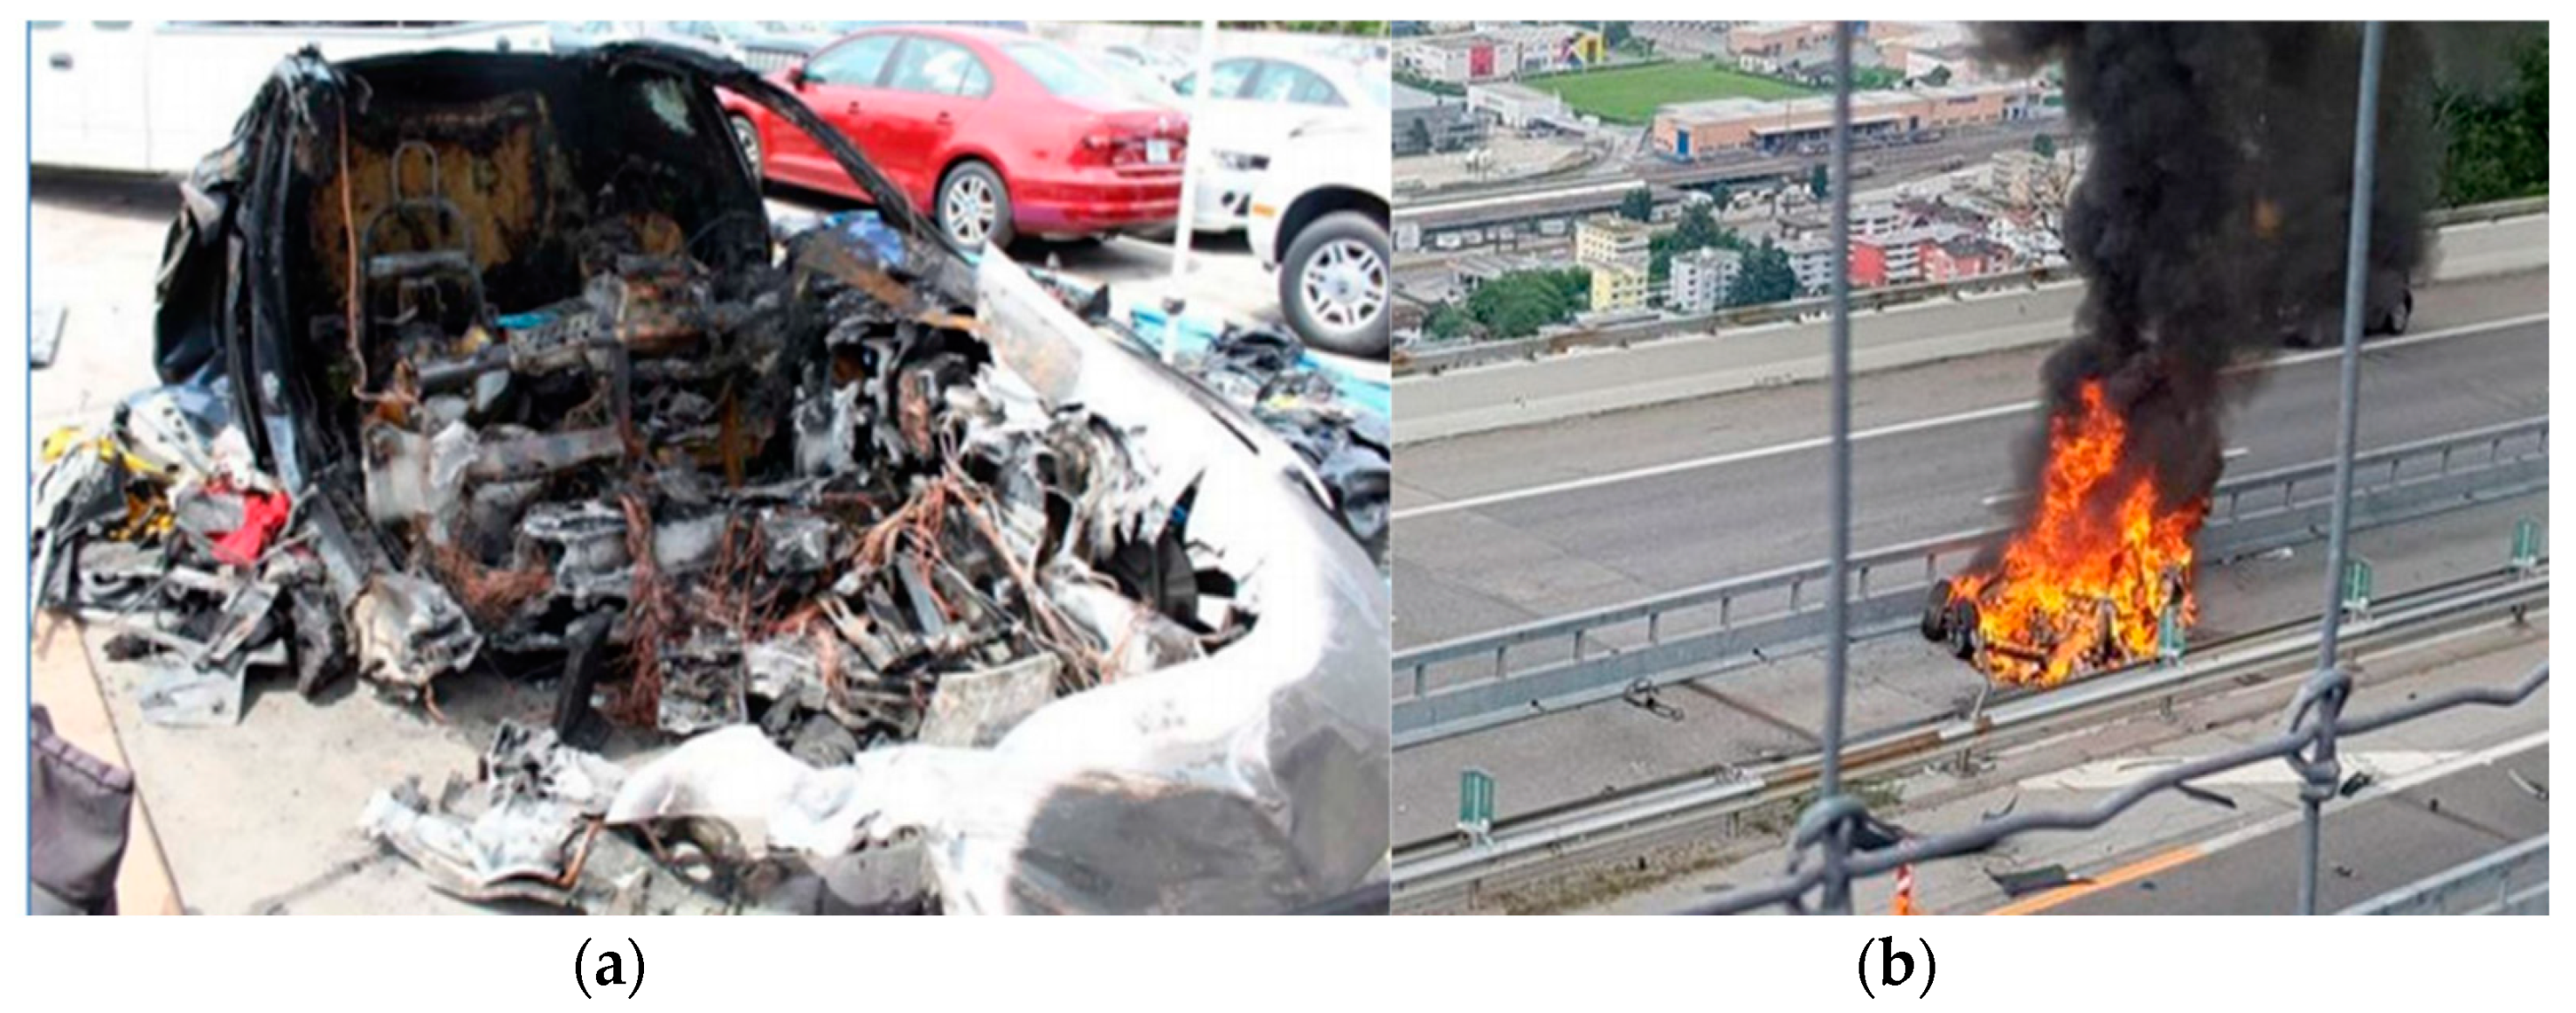
3. Electric Vehicle Fire Incidents

One of the first mass-produced electric car BEV fires was the Tesla Model S fire that occurred on 2 October 2013 on a highway in Washington State. It was caused by direct contact between a metal fragment and one of the 16 lithium-ion battery modules (Figure 2a) [41]. There followed a string of electric car fires, with two BEV fires within a month. In the last week of October 2013, there was a Tesla S fire whose driver lost control of the vehicle and hit a tree in Merida, Mexico [42]. Less than two weeks later, a third fire occurred in a BEV Tesla S electric car in Smyrna, Tennessee caused by the driver running into a metal object, which was a tow bar damaging the cover of the power battery modules (Figure 2b) [43]. No one was killed or injured in any of these incidents. At the time, the manufacturer’s stock price dropped significantly after reports of vehicle fires [44].
Following a series of electric vehicle fires on the road on 15 November 2013, a Tesla S BEV electric car caught fire while charging in a garage on the university’s Irvine campus in California. The probable cause of the fire was a faulty plug for the charging socket, which caused significant resistance to current flow contributing to high temperatures and subsequent spontaneous combustion [45]. A fire for unexplained reasons occurred in Toronto, Canada, on 14 February 2014 where a BEV electric car was parked in a garage and not connected to charging at the time, unfortunately the cause of this fire could not be explained [46]. In 2016, a Tesla S BEV electric car fire occurred while it was being charged in a specially dedicated factory charger with the higher current parameters of the Tesla Supercharger (480 V, DC, power up to 250 kW). A fire that occurred in January 2016 in Norway developed slowly enough to allow the owner time to disconnect from the charger and move away from the scene to a safe distance. The cause of the fire was a short circuit in the vehicle connection [47]. Another incident occurred in August 2016 in France during a test drive of a Model S 90D (BEV type) where the car suggested a problem with the charging system moments before the fire occurred, the driver managed to stop the vehicle and the occupants exited the vehicle and less than 5 min later the car burned completely. The indicated cause of the fire was improperly performed maintenance [48]. The tragic electric car fire in which people lost their lives occurred in May 2018. The first occurred in Florida in Fort Lauderdale where a BEV electric car travelling at excessive speed fell off the road, the driver and passenger died on the spot from their injuries and the vehicle burned completely. The fire brigade had considerable difficulty in extinguishing the vehicle where the battery reignited twice (Figure 3a) [49]. A second tragic accident occurred on the A2 motorway between Lugano and Bellinzona where a 48-year-old driver hit the barriers after which the car burst into flames (Figure 3b) [50].
Over several years until the writing of this article, there have been dozens of electric car fires in the world, among which various circumstances of fire incidents can be detailed [51]. The fires mainly involved BEV-type electric cars and, to a lesser extent, PHEV-type cars. Fires occurred both during normal driving, often after being hit by even small objects near the battery underneath the vehicle [41,44], and during standstill [52,53] as a result of spontaneous ignition. Fires during charging are common, both by specialist chargers [47] and domestic ones [54]. The most dangerous and at the same time the most tragic to extinguish are post-crash fires [49,50,55,56]. Electric vehicles burn mainly due to the lithium-ion batteries used in them, which are particularly susceptible to thermal and current overload and mechanical damage [57,58]. There are still some cases of spontaneous ignition among currently produced electric cars during everyday use of the cars, both during driving and stopping, which force manufacturers to carry out service actions to replace or increase safety level of traction batteries [59,60]. The nature of fires is different from that of cars equipped with internal combustion engines, which poses an important research problem.

4. Lithium Ion Batteries

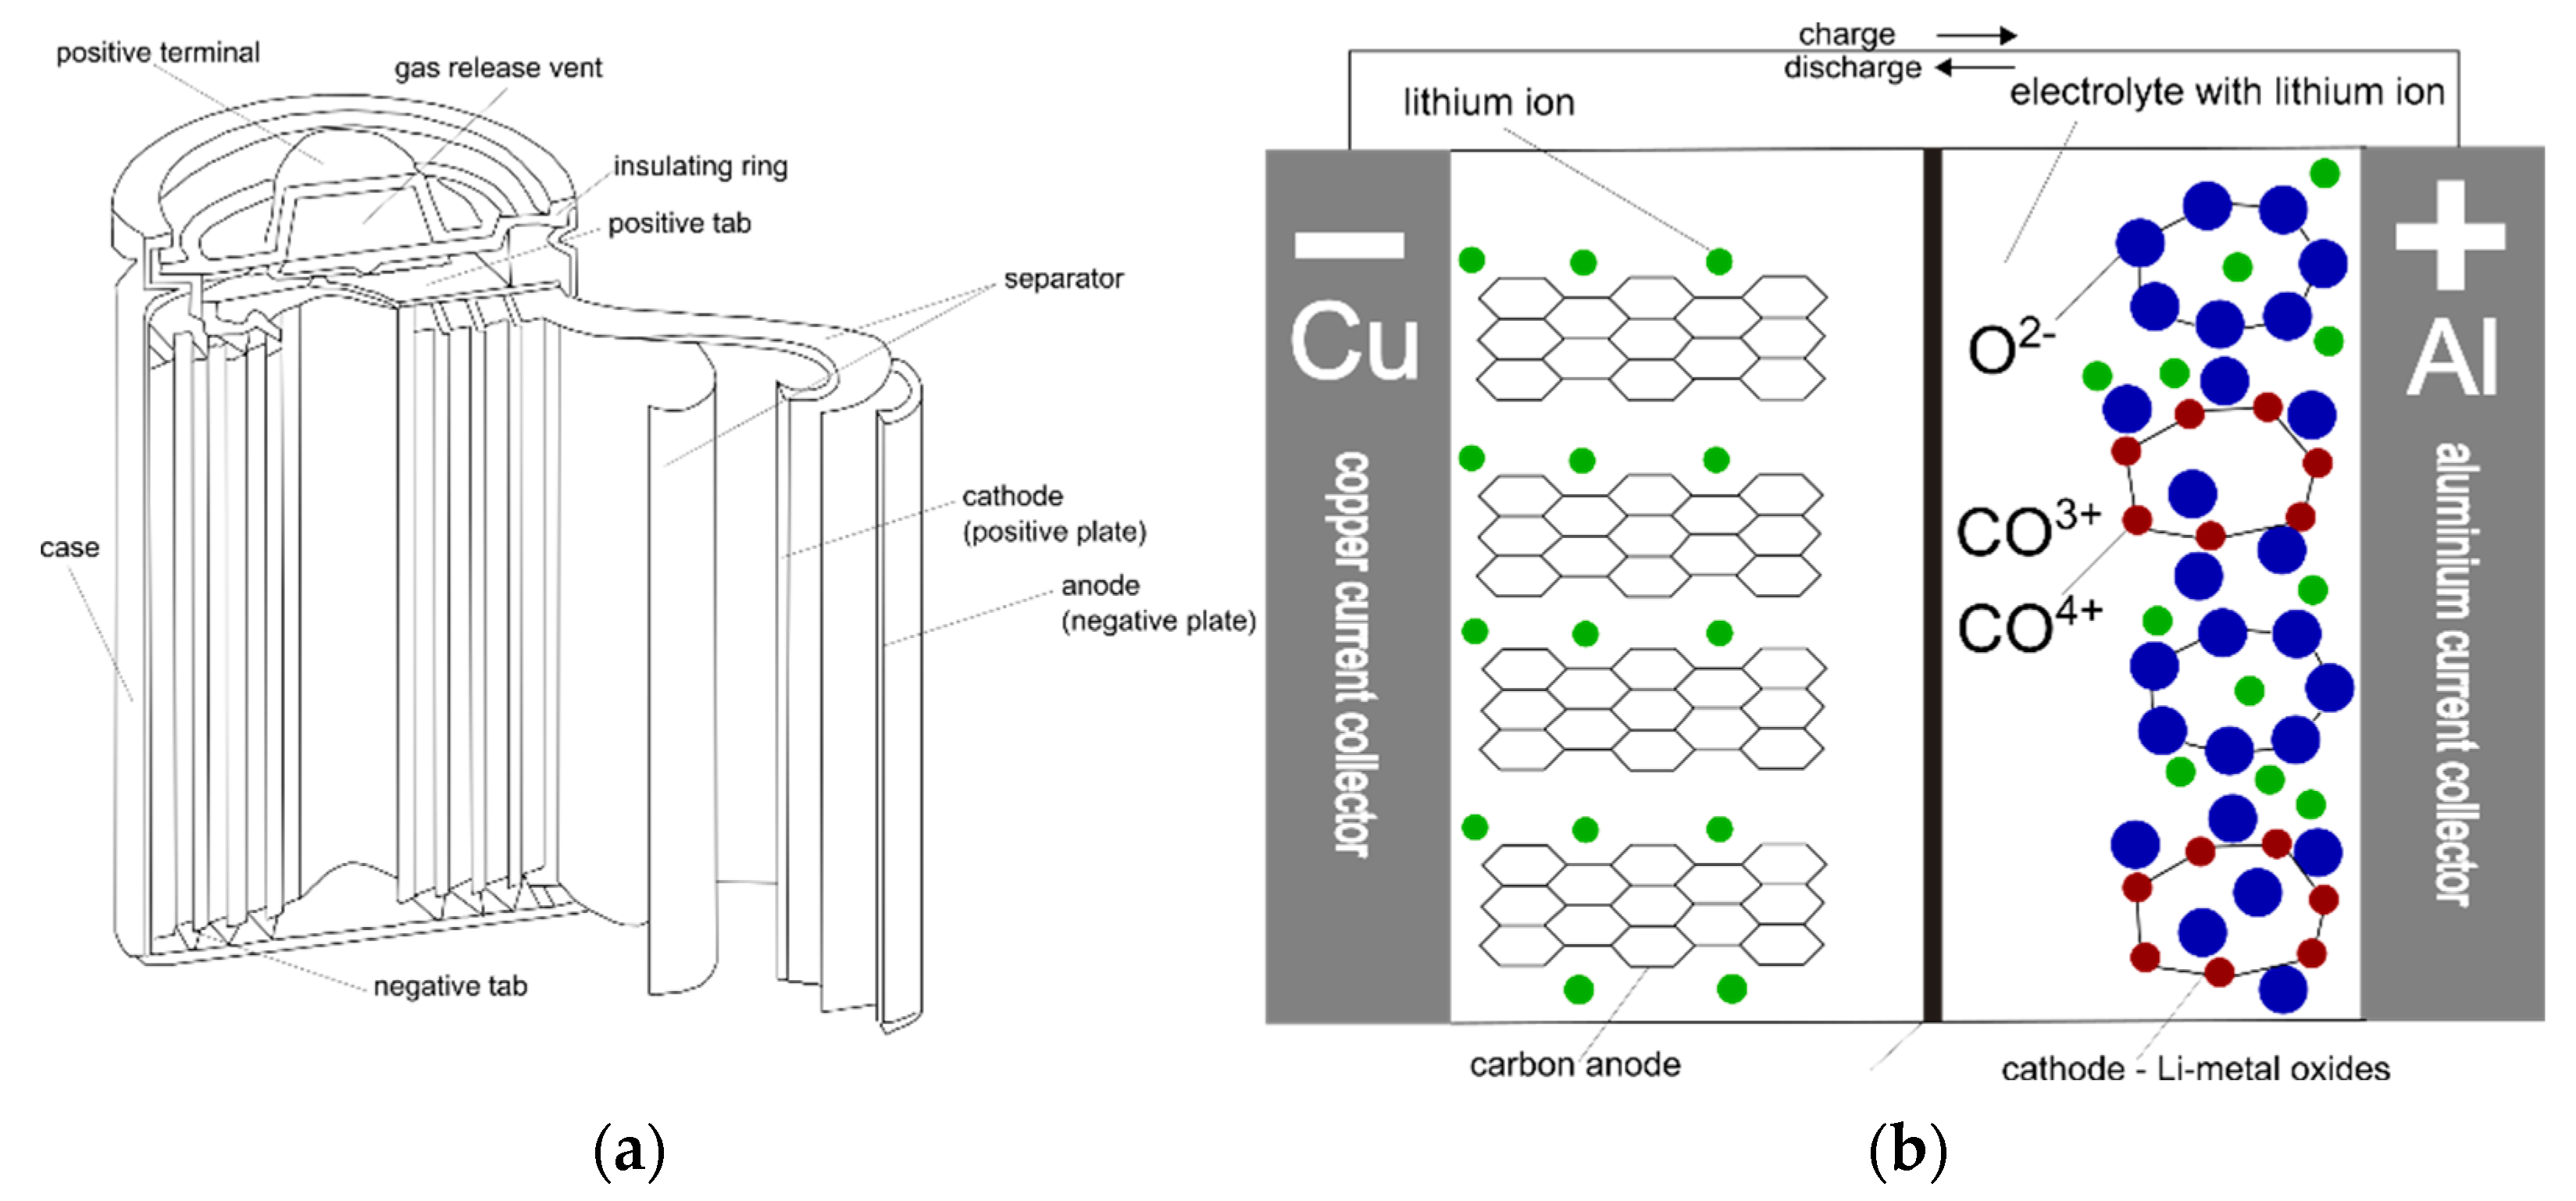
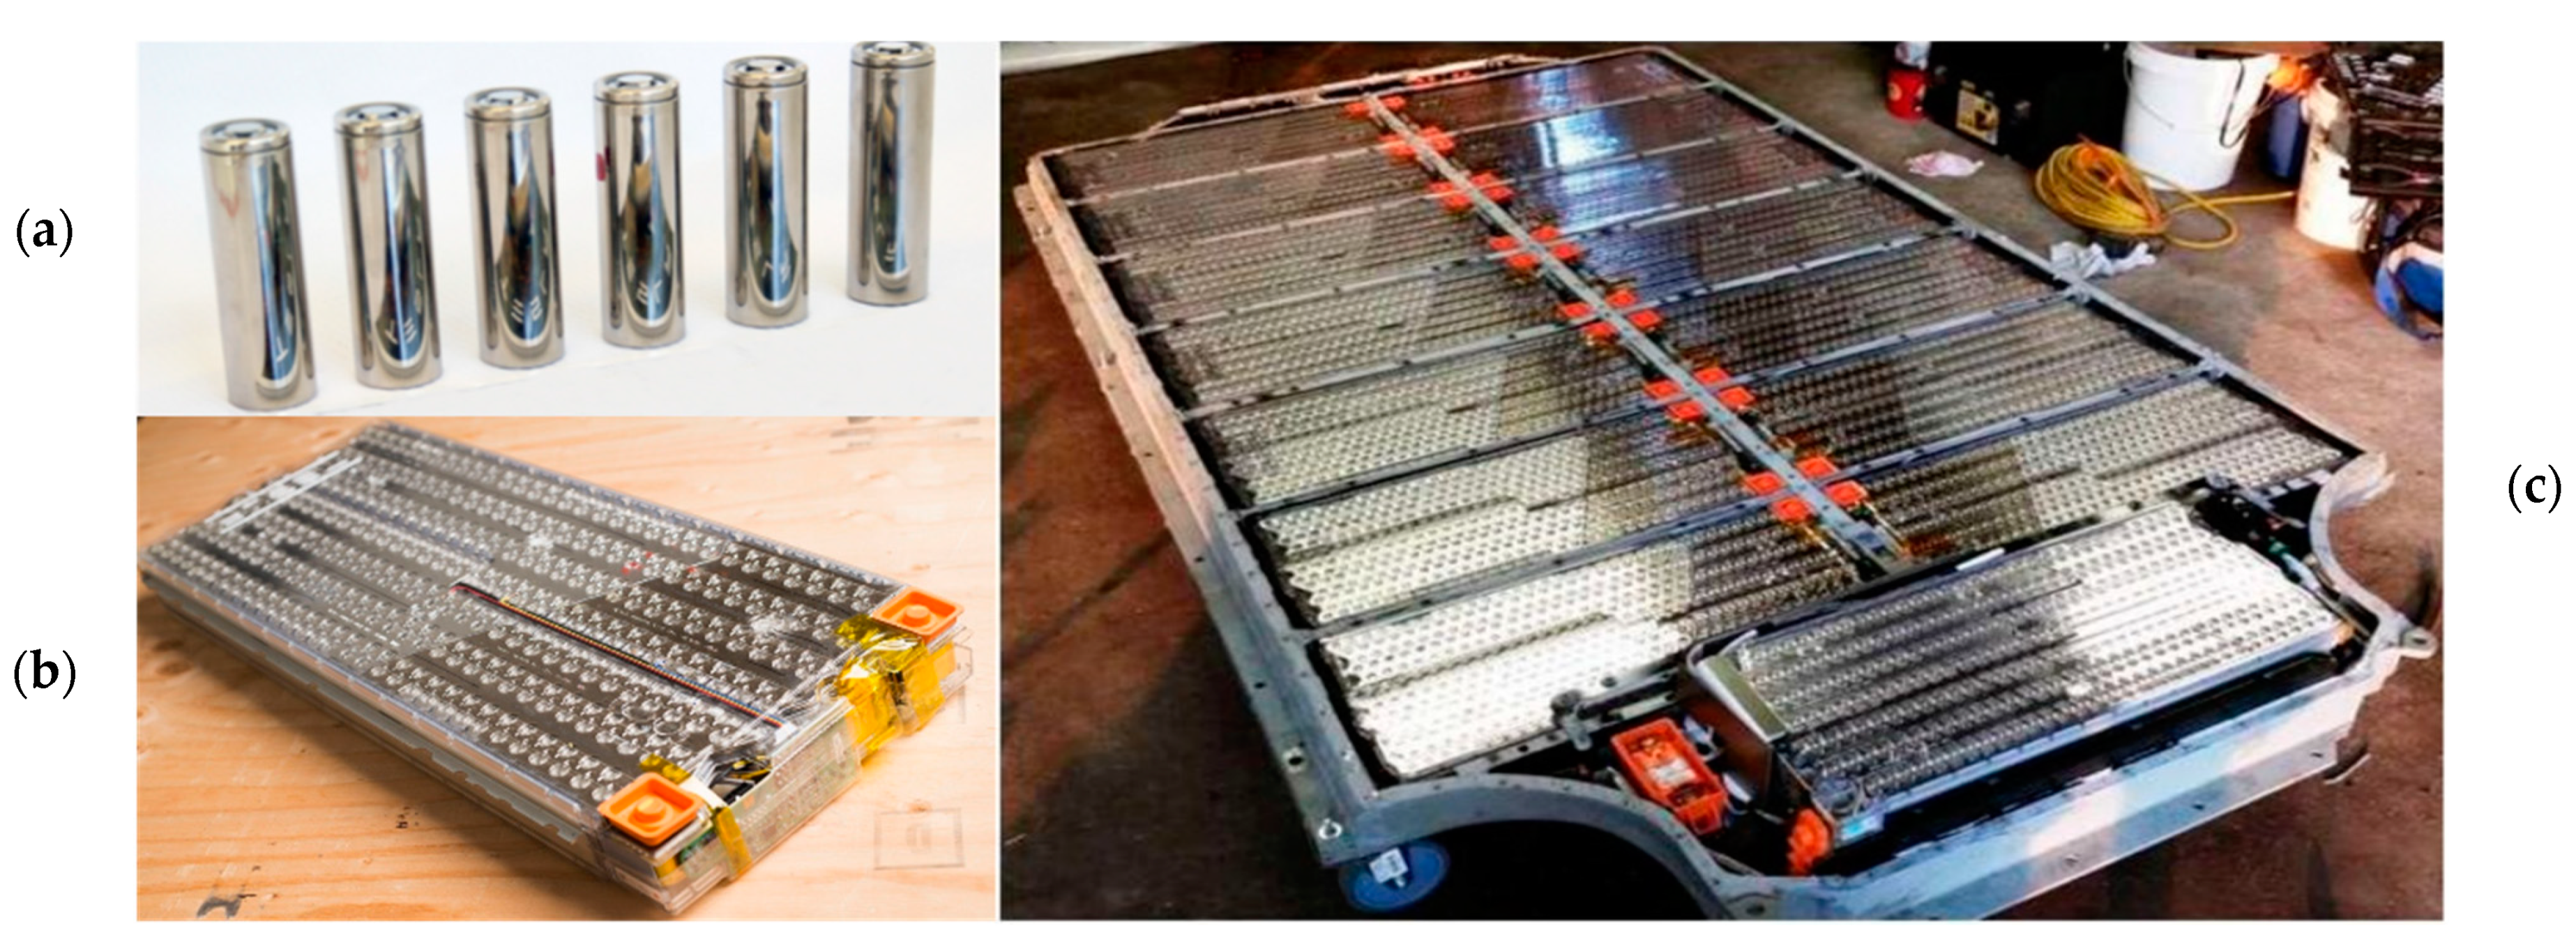
4.1. Basics, Principle of Work

The greatest risk from the operation of an electric vehicle comes from the energy storage in the traction battery used, which in the case of mass produced passenger cars today is the lithium-ion battery. Thanks to its enhanced energy storage capacity, high energy density, high efficiency, long service life, and low self-discharge rate compared with the lead-acid, nickel-cadmium (Ni-Cd), and nickel-metal hydride (Ni-Mh) batteries used previously, it has significantly contributed to the development of electromobility [23,61,62]. In 2019, the Nobel committee awarded the chemistry prize to researchers John B. Goodenough, M. Stanley Whittingham and Akira Yoshino, who started work on the lithium-ion battery and contributed to the possibility of their mass use [63]. It seems that the lithium-ion battery will be the dominant technology used to produce batteries for electric vehicles for the next few years due to its good performance characteristics [64]. In currently produced BEV, PHEV and HEV electric passenger cars, the dominant energy battery technology is lithium-ion batteries. Depending on the type of electric passenger car, their capacity varies greatly, which has implications for the fire hazard of such batteries. The following table shows an example of electric battery capacities in BEV, PHEV, and HEV passenger electric vehicles manufactured today. The following Table 1 shows examples of electric battery capacities in BEV, PHEV, and HEV passenger cars sold currently (model year 2022) [65].
It should be noted that the electric battery capacity in BEVs is by far the largest, which significantly translates into the greatest fire hazard resulting from the operation of this type of vehicle. The passenger car fires described in Section 3 involved predominantly BEVs. Therefore, it can be assumed with a high degree of probability that this type of electric car will be the most vulnerable to fires in the coming years.
The concept of a Li-ion battery is based on the movement of electrical charge in the form of lithium ions between the anode and cathode through electrolyte. Li-ion batteries are most commonly produced in four types of cells: cylindrical, prismatic, coin, and pouch cells [57]. A typical single cylindrical Li-ion battery, e.g., 18,650, is constructed as a multi-layer spiral. There is a layer of an anode, a separator (PTFE), a cathode, a separator and in between them in a sealed housing an electrolyte. Schematic representation of the structure and operation of a Li-ion battery is shown in Figure 4a,b.
During charging, lithium ions move from the cathode doping the carbon layers in the anode with lithium. In the case of discharge, the reverse direction occurs and the lithium ions leave the carbon layer of the anode and migrate towards the cathode. The charging and discharging process for LCO batteries is described by Equations (1) and (2), respectively.
L i C o O 2 + C   L i 1 x C o O 2 + L i x C
L i 1 x C o O 2 + L i x C L i 1 x + d x C o O 2 + L i x d x C  
The most popular materials used for cathode production on a large scale are: lithium-cobalt oxides (LiCoO2), lithium-manganese oxides (LiMn2O4), lithium-iron-phosphate oxides (LiFePO4), lithium-nickel-manganese cobalt oxides (LiNiMnCO2) and lithium-nickel-cobalt aluminium oxides (LiNiCoAlO2). Suitably designated as Li-ion cell types, are LCO, LMO, LFP, NMC and NCA. LCO cells, NMC and NCA are characterised by high energy density, with LCO being the cheapest but with a relatively low level of safety in use [32,67]. The safest of the presented and with the longest life are LFP cells. A summary of the characteristics of the individual battery types is given in Table 2 [68].
The anodes in commercial, mass produced cells in hybrid and electric vehicles are mainly made of graphitic carbon, hard carbon, synthetic graphite, LTO (lithium titanate), tin-based alloys, and silicon-based alloys. The electrolyte is mostly organic lithium salts: LiPF6, LiClO4, LiAsF6, LiCF3SO3, LiBF4 or electrolyte solvents DMC—dimethyl carbonate, EC—ethylene carbonate, DEC—diethyl carbonate, PC—propylene carbonate, ɣ-GBL—gamma-butyrolactone, and RTILs—room temperature ionic liquids. The separator is polypropylene, polyethylene, cellulosic paper, non-woven fabrics, and ceramics [68,69]. The liquid form of the electrolyte is characterised by a better ability to transfer lithium ions than the gel form, while from the safety point of view, the flammability of the gel electrolyte is lower and therefore these solutions are considered to be safer. The cell housings are sealed laminated or metal films [70].
In recent years, the automotive industry has mostly used Li-ion batteries of the NMC type (e.g., VW, GM, Toyota, Audi, Porsche, Fiat, Nissan, BMW), NCA type (Tesla, Daimler), and LFP type (Byd) for the production of electric batteries [71]. BEVs are equipped with Li-ion batteries that consist of modules, which in turn consist of individual cells of different shapes connected in parallel and series. The most common are cylindrical, pocket and prismatic shaped cells. Figure 5 below shows the single cylindrical cells used in the Tesla S and a module consisting cylindrical cells and an entire traction battery consisting of modules [72].

4.2. Safety of Operation and Fire Risk

The issues associated with the safe operation of Li-ion cells are varied. On the one hand, Li-ion batteries themselves do not pose a risk of spontaneous combustion if their operating conditions are stable and do not change significantly [73]. This is the case, for example, when Li-ion cells are used to power electronic devices where no spontaneous fire events have occurred in recent years [51]. On the other hand, a different situation occurs in the case of variable and extreme operating conditions caused by strong electrical, thermal or mechanical impulses acting on Li-ion batteries, which become more susceptible to spontaneous ignition. In the automotive industry, Li-ion batteries are subjected to varying loads over a wide range, increasing the probability of a fire event.
There are three main risk factors that can endanger safe operation:
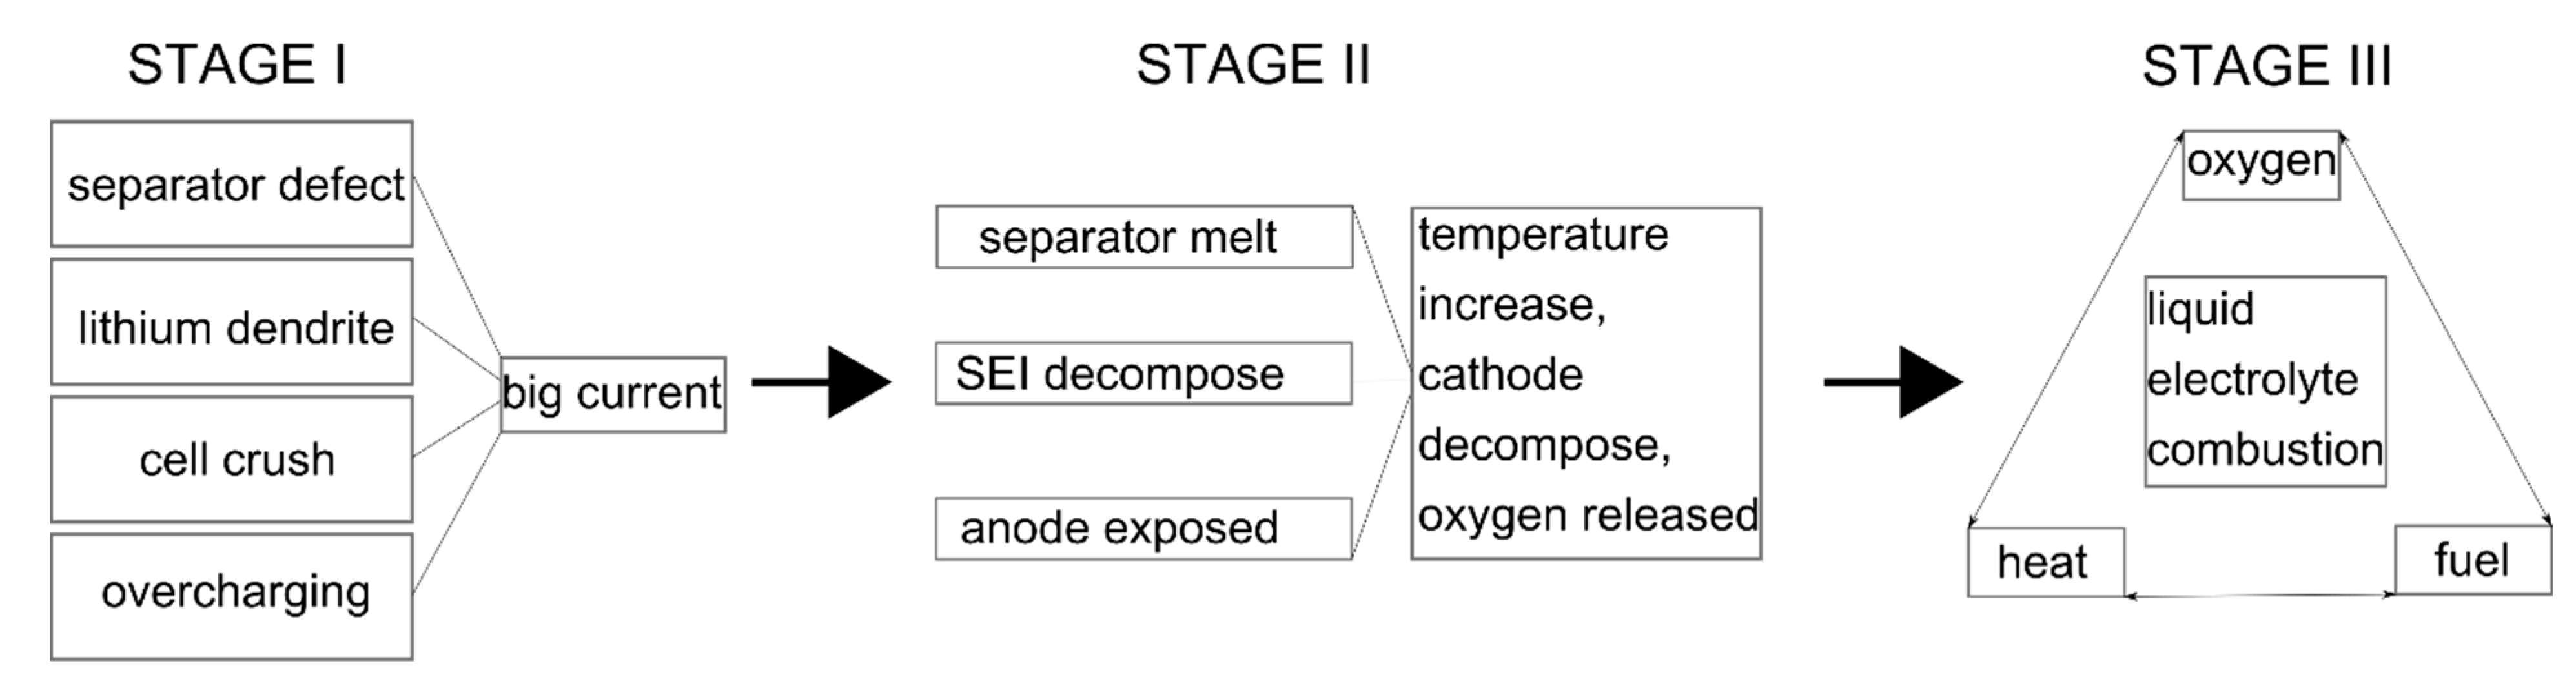
  • Thermal abuse: Li-ion cells demonstrate their best performance at temperatures between 20 and 30 °C [51]. With the global expansion of passenger electric cars equipped with Li-ion cells, it is not possible to guarantee operation in this temperature range without appropriate systems to help maintain proper operating temperatures. In the states of California or Arizona, air temperatures above 40 °C are not uncommon during the summer months, while in the northern parts of Norway or Sweden, temperatures below −10 °C prevail during the winter [74]. Sustained high temperatures can lead to undesirable chemical reactions whereby the battery can overheat [70,75]. Then, if the heat is not properly dissipated, the phenomenon of “thermal runaway” can occur, an uncontrolled temperature rise leading to cell ignition [70]. If the temperature acting on the cell is too low, the internal resistance increases significantly, which can contribute to an additional thermal effect that increases the likelihood of fire [70,76].
  • Electrical overloading: mass-produced electric cars equipped with Li-ion cells are required to be rechargeable as quickly as possible and to have a high level of driving dynamics, all of which negatively affect the safe operation of the vehicle and increase the probability of spontaneous combustion of the cell as a result of too intensive charging or discharging of the cell. In such cases, the Joule effect generating additional heat and unwanted chemical reactions can occur which can lead to an internal short circuit. [77,78]. It is often pointed out that EV fires can be caused by improper servicing, improper manufacturing procedures or inadequate electronic safety and cell condition monitoring systems [79].
  • Mechanical damage: another group of risks associated with the operation of LI-ion cells is damage caused by mechanical actions on the battery. The cells themselves, without special protection, are susceptible to mechanical damage, which is why special covers have been used in electric BEVs since the beginning of production to protect the cells against the effects of collisions. Most data show that minor collisions are harmless for the cells [80]; however, in the case of accidents involving vehicles moving at excessive speeds, the risk of a Li-ion battery fire significantly increases and seems to be unavoidable in the case of road incidents at very high speeds [81,82,83]. The tendency of individual LIBs to initiate TR mechanically is the subject of specific risk assessment tests, i.e., SAE J2464, SAEJ2929, ISO 12405-1, ISO12405-2, ISO 12405-3, SEC 62660-1, SEC 62660-2, SEC62660-3, UL 2580, KMVSS Article18-3, AIS-048, GB38031 [84].
The thermal runaway phenomenon leading to the initiation of fire in Li-ion batteries can be divided into three stages (Figure 6). The first stage starts with an increase in temperature of the Li-ion battery that may be caused by exceeding the rated cell voltage (overcharging), exposing the Li-ion battery to excessively high temperatures, external short circuits caused by faulty wiring, or internal short circuits caused by defects in the battery, mechanical damage (penetration of the cell interior by metal fragments), formation of lithium dendrite during overcharging of the battery at low temperatures, flawed separator. Stage one ends when the LIB exceeds its normal operating temperature range due to rising temperature [81]. During the second stage the increase of the internal temperature of the cell is accelerated and exothermic reactions occur inside the battery such as: decomposition of the electrolyte (SEI), which occurs roughly at temperatures above 90 °C accompanied by the release of flammable gases and oxygen; further decomposition of SEI and increase of temperature causes the reaction of metallic or intercalated lithium in the anode with organic solvents contained in the electrolyte, during which flammable gases (ethane, methane and other hydrocarbons) are released and the temperature increases further. Above approximately 130 °C, the polyethylene (PE)/polypropylene (PP) separator melts, resulting in short circuits between the cathode and anode. Finally, the temperature (about 180 °C e.g., for LiCoO2) causes decomposition of the cathode material and the release of oxygen, which is also highly exothermic which further accelerates the increase of temperature. The heat escaping process moves from stage 2 to stage 3 as soon as sufficient oxygen and heat have accumulated to burn the battery. During stage 3 the combustion of the electrolyte begins, the electrolytes used in LIBs are usually organic, which are highly volatile and flammable [74,81,82,83,84].
If it is impossible to stop the increase of temperature of a Li-ion battery inevitably a thermal runaway phenomenon occurs and ends with a cell fire [85]. The development of the thermal runaway reaction depends on the state of charge of the battery, the more charged the battery, the lower the temperature at which the reaction may start [85]. The material from which the Li-ion battery is made influences the temperature at which the TR phenomenon starts, e.g., LCO batteries are characterised by the lowest temperature [85], the battery housing [85], battery state of health (SOH) [36], capacity and the energy density [37], ambient temperature [38]. The key parameter for describing the danger during a fire is the combustion characteristics, which is the basic data for assessing the danger that accompanies a cell fire [86]. LCO and LFP cells had the highest power during battery fire tests and NMC cells had the lowest power. In reference [85] a similar influence of the time of TR occurrence on the battery SOC charge state was observed on the amount of energy released during a fire HRRmax, and the more charged the cell the higher value of HRRmax which is reached in a shorter time [85].
The occurrence of TR phenomenon for one of the batteries in a battery pack very often leads to a cascade reaction which is difficult to stop, in which subsequent single cells start TR reactions. That is why it is extremely important from the point of view of the safe use of Li-ion cells in large batteries to carefully control the condition of the batteries together with appropriate cooling of the cells in order to diagnose and stop this phenomenon as early as possible so that the thermal stability of the cells is maintained [86,87,88].
In order to limit the effects of TR, it is possible to specify preventive measures that are added to limit the flammability of the battery, safety measures such as separator shutdown and battery venting that stop or reduce the damage caused by thermal runaway, post-TR firefighting measures that allow Li-ion battery fires to be extinguished [26].

5. Characteristics of Electric Car Heat Release Rate (HRR) Fires

Many national standards and regulations have been issued providing a suggested modelling HRR of the ICEV fire [89,90,91,92,93]. At the time of preparation of this article, no standards or regulations were widely available concerning the suggested HRR fire for electric cars.
In the available literature we can find several full-scale experiments on electric passenger car fires on a test stand equipped with the following measurements: thermal flux, temperature inside/outside the vehicle, smoke temperature and gas analysis
In a study [16], a four-fire test was carried out on an ICEV and analogous EV from two manufacturers. The test procedure consisted in extracting 25,000 m3/h of air by means of a fan located in a tower at the end of the 50 m gallery, while compensating air was supplied by a section under the door on the opposite side of the gallery. A car was placed in the tunnel of the fire gallery. The fire was started by a gas burner of about 6 kW placed in the passenger compartment of the seat that was lacerated and the windows were opened. The test samples were two electric cars weighing 1122 kg and 1501 kg respectively and equipped with traction batteries of 16.5 kWh and 23.5 kWh. The total heat of combustion was 6.314 GJ at 4.2 MW and 8.54 GJ and 4.7 MW for the second car. The resulting combustion heat was 29.8 MJ/kg and 30.7 MJ/kg [16].
As a result of the tests, comparable characteristics of fire course and emission of combustion products were observed, with the exception of twice as high HF emission. Another test carried out was the study [18] in which seven full-scale fire tests were performed, each lasting 30 min and comparing two pairs of EVs and ICEVs, where the first pair were cars of similar size and the second pair were the same size but with different propulsion. Unfortunately the capacity of the traction batteries is not known and in two tests the effect of state of charge on the course of the fire was compared. The fires were started by a 2 MW gas burner placed under the cars. Peak powers were obtained for fully charged BEVs 6.0 and 6.9 MW, and PHEVs 6.0 and 7.9 MW. However, shorter times of obtaining the maximum power were observed than in the study [16] due to a different method of fire initiation. In study [17] conducted by a Japanese research team, the test sample was a BEV with a mass of 1520 kg and a capacity of 24 kWh, whose batteries were fully charged and the ignition source was at the fully integrated soft rear bumper as 80 g of alcohol gel fuel. All windows in the vehicle were closed. Fire development took by far the longest. A summary of the parameters obtained in the tests is presented in Table 3.
Attempt a comparison of the fire development curves is shown in Figure 7. Unfortunately, each test was initiated or carried out differently so the data are not fully comparable.
The limited number of publicly available tests carried out in various configurations of fire initiation makes it difficult to give an unambiguous assessment of the degree of danger, therefore, it seems necessary to carry out additional tests with special consideration to the modern production of PHEVs and BEVs equipped with traction batteries of higher capacity.

6. Extinguishing an Electric Car Fire

The risk of a fire in an BEV or PHEV with a large battery implies the additional issue of extinguishing the fire. In the case of electric passenger car fires, it has been observed that after the vehicle and the battery have been extinguished, spontaneous combustion occurs again even after a relatively long time [94]. In the case of the tested Li-ion battery module consisting of 288 cells, re-ignition occurred 22 h after the fire was extinguished [95]. By densely packing the cells, the very design of the batteries significantly impedes proper fire suppression. Numerous cases of electric passenger car fires have shown that after the standard firefighting process, initially extinguished cars reignited, even after some 20 h [51,94]. Therefore, in the case of fires in electric cars, it is suggested to apply much larger amounts of suppressant than in the case of fires in ICEV passenger cars, for a car equipped with 16 kWh batteries, about 4000 L [95]. Other studies indicate that about 750–1100 L of suppressant was needed to extinguish the ICEV compared to about 10,000 L for the EV, and there was a similar disparity in the time of the firefighting action itself, which took about 60 min for the EV compared to 5 min for the ICEV [30]. In addition, the extinguishing process should be monitored by means of a thermal imaging camera, so that before the end of extinguishing activities you can be sure of the absence of internal flames that can restore the combustion reaction. One manufacturer’s safety manual recommends 11,000 to 30,000 L of water to cool and extinguish a traction battery fire, the water should be applied directly to the cells and the whole process should be checked using a IR camera [96]. The traction battery is considered extinguished when it reaches ambient temperature [59].
Another issue is the choice of extinguishing agent: on the one hand, extinguishing a fire in cells with e.g., carbon dioxide or other chemical agent intended for extinguishing electronics may suppress the fire, while administering water may contribute to suppressing the fire and additionally to cooling the batteries. The extinguishing agents most commonly recommended by Li-ion battery manufacturers is water, chemical/dry powder, CO2 and foam [97].
However, this can contribute to damage to the electronics and react with lithium releasing hydrogen [97]. Boron-based, environmentally friendly fire extinguishing agents [98] or Novec 1230 [99] allowing efficient cooling during extinguishing are being developed.
The systems giving good results in preventing or limiting the spread of the thermal runaway phenomenon are the internal systems installed in the cars themselves, which, thanks to an extensive network of sensors, diagnose the temperature rise already at the initial stage and locally apply a cooling agent, which is usually water, so as to prevent further temperature rise and, consequently, further fire development [100]. External systems are less effective in producing a cooling effect on the battery increasing the likelihood of preventing or limiting the spread of thermal runaway, being more effective in extinguishing external flames and limiting the spread of fire from the battery to the surrounding area. It should be noted that without cooling of the battery there is a risk of releasing large quantities of flammable gas. Should the gases accumulate in accessible enclosed spaces (e.g., the battery casing), the risk of sparks or additional heat occurring at the onset increases [100]. Due to the considerable quantities of harmful hydrofluorocarbons emitted during a fire, it is recommended to carry out the extinguishing action using self-contained breathing apparatus (SCBA). The high emissivity of harmful HF substances becomes a significant difference during fires of electric cars inside enclosed spaces, therefore the designers of fire prevention systems in their works should take into account the additional hazard. According to [99], firefighting teams not equipped with a self-contained breathing apparatus (SCBA) should not approach an electric car fire at a distance of less than 15 m. The demanding conditions of extinguishing action should be subject to further research as the number of electric cars grows. Fire-fighting crews should be properly trained to carry out safe extinguishing action.

7. Fire Hazard of Electric Cars in Buildings

The significantly increasing popularity of electric cars in the near future may contribute to the intensification of the risks associated with their operation due to fire safety [101]. One of the currently reported causes of fires in electric vehicles is the process of charging them [47,51,81,102]. In the case of outdoor charging stands, the consequences of a possible fire seem to be limited, whereas in the case of the charging stands increasingly frequently designed in closed underground garages of commercial, office and residential buildings, the consequences may be incomparably worse. In addition, pressures on charging times for passenger car batteries will imply the use of chargers with ever higher powers, potentially adding to the risk. Researchers from [16,19,51] suggest a comparable fire power of EV to ICE car, however, there are differences in its course, especially in the initial phase of fire development during which the energy is accumulated to increase intensively and unexpectedly at a later stage. For the design of systems reducing the effects of a passenger car fire in confined spaces such as underground garages or road tunnels the power of the design fire and the curve of its development as input data determining the dimensioning of e.g., fire ventilation or sprinkler systems is used [103]. The main assumption for a properly functioning fire ventilation or sprinkler system is to provide appropriate conditions for evacuation on the horizontal escape routes for people in the endangered space, the safety of rescue and firefighting operations, and to ensure the stability of the structure of the building in which the fire occurred. One of the methods used to assess the performance of fire ventilation systems or sprinkler systems is the use of computational fluid dynamics (CFD) models to represent the environmental conditions prevailing during the fire in the considered space.
In this study, the HRR fire development curves for electric and combustion cars obtained in the study [16] were implemented into a three-dimensional model of the object in order to compare the effect of their course on the obtained environmental conditions during the fire. The object under consideration was a small underground garage, shown in Figure 8, equipped with fire ventilation system with a capacity of 160,000 m3/h (EP1), two compensating supply points (NSP1, NSP2) and six jet fans under the garage ceiling (JET1...JET6) pushing air and fire gases towards the exhaust point. Three emergency exits (EE1, EE2, EE3) are designed for people evacuating from the garage space. The light green area in Figure 8 shows the escape routes and the possible access to the fire source for fire-fighting and rescue teams.
The HRR fire development curves used for comparison are shown in Figure 9a,b for the test involving a small passenger car of manufacturer 1 with a mass of 1122 kg and a compact passenger car of manufacturer 2 with a mass of 1501 kg, respectively [16].
The CFD Fire Dynamic Simulator computational solver was used to carry out the calculations using the low mach, LES turbulence model together with the SGS Deardorff turbulence model [104]. The 3D model was discretised using a structured numerical grid with a resolution of 0.1 m × 0.1 m × 0.1 m summed over 10,369,440 elements, the boundary conditions were 30 cm thick concrete sides, top and bottom (ρ = 2300 kg/m3; λ = 1.8 W/mK; c = 0.92 kJ/kgK), and the initial temperature was 20 °C. The model fire was a heat and smoke source with HRR characteristics according to Figure 9 [16] and heat and smoke source parameters such as soot yield and effective heat of combustion were applied according to [16] corresponding to the tests. The reaction equation is simple hydrocarbon reaction called “simple chemistry” [104]. The turbulent combustion model is the eddy dissipation concept (EDC) model. The radiation model is a grey-gas radiation model with discrete angles with 30% of the heat release rate per unit volume released as thermal radiation. The starting time of the exhaust fans is 60 s and the starting time of the jet fans is 300 s. The simulation duration was 1800 s.
The results are presented as visibility distributions at a height of 1.8 m above the floor, allowing the course of conditions prevailing during the evacuation to be assessed in minute intervals for the first 5 min of the fire development (60 s, 120 s, 180 s, 240 s, 300 s) [105,106], the temperature prevailing on the paths to the fire source at a height of 1.5 m above the floor at the time of reaching the maximum power of the fire, allowing the actions of fire-fighting and rescue teams [104] and temperature under the ceiling of the room to be evaluated for reaching the maximum power of the model fire PHRR, showing the impact of the fire on the building structure. In Figure 10, Figure 11, Figure 12, Figure 13, Figure 14 and Figure 15 in the left column are presented the results for an electric EV and in the right column for an ICEV.
Distribution of visibility range for the manufacturer’s car (Figure 10) are reflected in the HRR fire development curve; in the initial phase of evacuation (the first three minutes), a significantly greater reduction in visibility was observed for the ICEV fire, while in the final phase of evacuation (the 4th and 5th minutes of the fire), a slightly greater reduction in visibility was observed for the EV car. The differences observed in the operation of the fire ventilation system in the underground garage in question do not translate into accessibility of emergency exits for persons evacuating the space covered by the fire. Access to emergency exits EE1 and EE2 is lost between 2 and 3 min of fire development, while access to emergency exit EE3 is ensured in both cases (visibility > 10 m) [104,105]. Analyzing the conditions for rescue and firefighting action, Figure 11, on the basis of obtained temperature distributions, there are worse conditions from 10 to 20 min of fire development for the ICEV fire, after which time there is a faster increase in temperature for the EV fire, and consequently for 30 min slightly worse conditions are observed for the EV fire. During the operation of the fire ventilation system in the underground garage under consideration, both for the fire of the EV and the ICEV manufacturer 1, the temperature allows access to the fire source from a distance of 10 m from the fire source [107]. Only in close proximity to the fire is the temperature dangerous for extinguishing [107]. In the case of temperature acting on the floor of the storey where there is a fire for the maximum power reached by the fire, the temperature reaches higher values and affects a larger area for the ICEV fire, Figure 12, coinciding with the difference in maximum power for the EV 4.2 MW and for the ICEV 4.8 MW [16].
The results obtained for CFD simulations reflecting the course of the car fire of the manufacturer 2, are characterized by high correlation with the course of the HRR curve cited in Figure 9, in spite of less than 20% difference in the heat of combustion assumed for the models of vehicles also originating from research [16]. In this case, in the initial phase of evacuation (up to 3 min. from the beginning of the fire), a slightly greater reduction in visibility is observed for the EV fire, while in the second part of evacuation, after 3 min. from the beginning of the fire, the decrease in visibility occurs faster for the ICEV fire (Figure 13). For both fires, the conditions of escape passages enable the users to evacuate to the exit EE3 [104,105]. Similar relations are observed for the temperature occurring during 10 and 15 min, which is higher for the EV car fire, while after this time, with increasing fire power of the ICEV, higher temperature is observed until the end of the analysis (Figure 14); however, the conditions prevailing on the access road to the fire source for both EV and ICEV are maintained [107]. Higher maximum power of the ICEV fire by 1.4 MW translates into higher temperatures affecting the ceiling, as presented in Figure 15.
It is important to note a comparable degree of influence of the quoted BEV fires involving small electric cars on the environmental conditions prevailing during a fire in a closed object such as an underground garage equipped with a fire ventilation system. Both the value of temperature and the range of visibility are characterised by a very similar course, only briefly increasing the differences to the detriment of the EV, during most of the fire development time, and it should be stated that the fire of the same electric car according to [16] does not cause a decrease in environmental conditions in the fire compartment in comparison with the ICEV. However, the comparison concerned EVs with a relatively small, by current standards, with a traction battery capacity of 16.5 and 23.5 kWh, which are not able to provide a range similar to the ICEV, so it seems important to continue research on electric cars that are fully comparable in terms of performance in order to fully assess the fire risk associated with the energy released during a fire.

8. Conclusions

This article presents the threat posed by the use of electric cars, which is fire, and reviews the cases of fires involving electric cars that occurred in recent years, together with an attempt to assess the causes of their occurrence. The market situation of all types of electric cars, in view of the current and future legal regulations, leaves no doubt as to the direction in which the automotive market will be heading in years to come; therefore, in the near future, we should expect a significant increase in the probability of the occurrence of fires in all types of electric car, with particular emphasis on BEV-type electric cars, for which the probability of significant fire consequences is the highest.
A comparative CFD analysis reproducing the environmental conditions inside the garage during a BEV and ICEV fire confirmed a similar impact on the parameters of assessment of temperature and visibility of the evacuation conditions, the operations of rescue teams, and the impact on the building structure as for a similar sized ICEV. It should be noted that the comparison was between passenger cars of similar size in terms of weight and not with similar performance characteristics i.e., vehicle range implying a much larger traction battery pack. However, in the case of BEVs with a small traction battery capacity of 15–25 kWh, no greater risk was observed in terms of power and energy released during a fire than for a similar sized ICEV.
In the case of electric cars, a limited number of publicly available full-scale tests have been carried out. From the available studies it can be concluded that the fire power and the amount of energy released by a fire in a BEV electric car is comparable to the amount of energy and fire power in an ICEV. However, there are no available data on fires of different types of PHEVs or BEVs with larger traction batteries, whose mass production is now underway. Well studied characteristics of the course of the HRR fire in the ICEV allowed the introduction of guidelines on how to model it, providing a basis for the design of fire safety systems both to prevent and mitigate the effects of fire. Conducting more full-scale research on the fire characteristics of electric cars such as PHEV or BEV with a significant capacity of the traction battery could contribute to the creation of a description of a model fire course of an electric car, taking into account all the hazards, the knowledge of which becomes important especially in the context of safety within enclosed structures.
It seems important to intensify research on the development of standards and regulations for the modelling of HRR of EV fires, as developed and presented in the ICEV guidelines for the unification of the consideration of human and structural safety risks in enclosed structures.

Author Contributions

Conceptualization, A.D. and M.L.; methodology, A.D.; software, A.D.; validation, A.D., M.L.; formal analysis, A.D. and M.L.; investigation, A.D.; resources, A.D.; data curation, A.D.; writing—original draft preparation, A.D.; writing—review and editing, A.D.; visualization, A.D.; supervision, M.L.; project administration, M.L.; funding acquisition, M.L. All authors have read and agreed to the published version of the manuscript.

Funding

Open Science programme in the “Excellence Initiative–Research University” project, Warsaw University of Technology.

Institutional Review Board Statement

Not applicable.

Informed Consent Statement

Not applicable.

Data Availability Statement

Not applicable.

Conflicts of Interest

The authors declare no conflict of interest.

References

  1. Commission Regulation (EU) No 459/2012 of 29 May 2012 amending Regulation (EC) No 715/2007 of the European Parliament and of the Council and Commission Regulation (EC) No 692/2008 as regards emissions from light passenger and commercial vehicles (Euro 6). Off. J. Eur. Union 2012, 48, 258–266.
  2. Tsakalidis, A.; Thiel, C. Electric Vehicles in Europe from 2010 to 2017: Is Full-Scale Commercialisation Beginning? An Overview of the Evolution of Electric Vehicles in Europe, EUR 29401 EN; Publications Office of the European Union: Luxembourg, 2018; ISBN 978-92-79-96719-1. [CrossRef]
  3. Jiang, X.; Zhu, G.; Zhu, H.; Li, D. Full-scale Experimental Study of Fire Spread Behavior of Cars. Procedia Eng. 2018, 211, 297–305. [Google Scholar] [CrossRef]
  4. Spearpoint, M.; Mohd, T.M.Z. Distribution analysis of the fire severity characteristics of single passenger road vehicles using heat release rate data. Fire Sci. Rev. 2013, 2, 5. [Google Scholar] [CrossRef] [Green Version]
  5. Park, Y.; Ryu, J.; Ryou, H.S. Experimental Study on the Fire-Spreading Characteristics and Heat Release Rates of Burning Vehicles Using a Large-Scale Calorimeter. Energies 2019, 12, 1465. [Google Scholar] [CrossRef] [Green Version]
  6. Okamoto, K.; Watanabe, N.; Hagimoto, Y.; Chigira, T.; Masano, R.; Miura, H.; Ochiai, S.; Satoh, H.; Tamura, Y.; Hayano, K.; et al. Burning behavior of sedan passenger cars. Fire Saf. J. 2009, 44, 301–310. [Google Scholar] [CrossRef]
  7. Mangs, J.; Keski-Rahkonen, O. Characterization of the fire behaviour of a burning passenger car. Part I: Car fire experiments. Fire Saf. J. 1994, 23, 17–35. [Google Scholar] [CrossRef]
  8. Spearpoint, M.; Tohir, M.; Zahirasri, M. Simplified approach to predict heat release rate curves from multiple vehicle fires in car parking buildings. Fires Veh. FIVE 2014, 2014, 173. [Google Scholar]
  9. PIARC. Technical Committee 3.3 Road Tunnel Operation. Design Fire Characteristics for Road Tunnels; World Road Association: Paris, France, 2017. [Google Scholar]
  10. Angel, T. Study of the fire dynamics in a burning car and analysis of the possibilities for transfer of fire to a nearby vehicle. E3S Web Conf. 2019, 112, 01015. [Google Scholar] [CrossRef]
  11. Li, D.; Zhu, G.; Zhu, H.; Yu, Z.; Gao, Y.; Jiang, X. Flame spread and smoke temperature of full-scale fire test of car fire. Case Stud. Therm. Eng. 2017, 10, 315–324. [Google Scholar] [CrossRef]
  12. Merci, B.; Shipp, M. Smoke and heat control for fires in large car parks: Lessons learnt from research? Fire Saf. J. 2013, 57, 3–10. [Google Scholar] [CrossRef] [Green Version]
  13. Deckers, X.; Haga, S.; Tilley, N.; Merci, B. Smoke control in case of fire in a large car park: CFD simulations of full-scale configurations. Fire Saf. J. 2013, 57, 22–34. [Google Scholar] [CrossRef] [Green Version]
  14. Zanzi, C.; Gómez, P.; López, J.; Hernández, J. Analysis of Heat and Smoke Propagation and Oscillatory Flow through Ceiling Vents in a Large-Scale Compartment Fire. Appl. Sci. 2019, 9, 3305. [Google Scholar] [CrossRef] [Green Version]
  15. Park, Y.; Lee, Y.; Na, J.; Ryou, H.S. Numerical Study on the Effect of Tunnel Aspect Ratio on Evacuation with Unsteady Heat Release Rate Due to Fire in the Case of Two Vehicles. Energies 2019, 12, 133. [Google Scholar] [CrossRef] [Green Version]
  16. Lecocq, A.; Bertana, M.; Truchot, B.; Marlair, G. Comparison of the fire consequences of an electric vehicle and an internal combustion engine vehicle. In Proceedings of the International Conference on Fires in Vehicles—FIVE 2012, Chicago, IL, USA, 27–28 September 2012; pp. 183–194. [Google Scholar]
  17. Lecocq, A.; Bertana, M.; Truchot, B.; Marlair, G. Comparison of fire behaviours of an electric-battery-powered behicle and gasoline-powered vehicle in a real-scale fire test. In Proceedings of the Second International Conference on Fires in Vehicles, Chicago, IL, USA, 27–28 September 2012. [Google Scholar]
  18. Lam, C.; MacNeil, D.; Kroeker, R.; Lougheed, G.; Lalime, G. Full-scale fire testing of electric and internal combustion engine vehicles. In Proceedings of the Fourth International Conference on Fire in Vehicle, Baltimore, MD, USA, 5–6 October 2016. [Google Scholar]
  19. Lougheed, G.; Lam, C.; Carbonneau, G.; Kroeker, R.; Edwards, D.; Tompkins, J.; Lalime, G. Electric vehicle fire testing. In Proceedings of the 8th EVS-GTR Meeting, Washington, DC, USA, 1–5 June 2015. [Google Scholar]
  20. Mercedes EQS 450+. Available online: https://ev-database.org/car/1483/Mercedes-EQS-450plus (accessed on 9 September 2021).
  21. Tesla Model S Long Range. Available online: https://ev-database.org/car/1404/Tesla-Model-S-Long-Range (accessed on 9 September 2021).
  22. Porsche Taycan Plus. Available online: https://ev-database.org/car/1394/Porsche-Taycan-Plus (accessed on 9 September 2021).
  23. Iclodean, C.; Varga, B.; Burnete, N.; Cimerdean, D.; Jurchiș, B. Comparison of Different Battery Types for Electric Vehicles. IOP Conf. Ser. Mater. Sci. Eng. 2017, 252, 012058. [Google Scholar] [CrossRef] [Green Version]
  24. Larminie, J.; Lowry, J. Electric Vehicle Technology Explained; John Wiley & Sons Ltd.: Chichester, UK, 2003; pp. 183–187. [Google Scholar]
  25. Wang, Q.; Ping, P.; Zhao, X.; Chu, G.; Sun, J.; Chen, C. Thermal runaway caused fire and explosion of lithium ion battery. J. Power Source 2012, 208, 210–224. [Google Scholar] [CrossRef]
  26. Kong, L.; Li, C.; Jiang, J.; Pecht, M.G. Li-Ion Battery Fire Hazards and Safety Strategies. Energies 2018, 11, 2191. [Google Scholar] [CrossRef] [Green Version]
  27. Feng, X.; Zheng, S.; He, X.; Wang, L.; Wang, Y.; Ren, D.; Ouyang, M. Time Sequence Map for Interpreting the Thermal Runaway Mechanism of Lithium-Ion Batteries with LiNixCoyMnzO2 Cathode. Front. Energy Res. 2018, 6, 126. [Google Scholar] [CrossRef] [Green Version]
  28. Hou, J.; Lu, L.; Wang, L.; Ohma, A.; Ren, D.; Feng, X.; Li, Y.; Li, Y.; Ootani, I.; Han, X.; et al. Thermal runaway of Lithium-ion batteries employing LiN(SO2F)2-based concentrated electrolytes. Nat. Commun. 2020, 11, 5100. [Google Scholar] [CrossRef]
  29. Golubkov, A.W.; Planteu, R.; Krohn, P.; Rasch, B.; Brunnsteiner, B.; Thaler, A.; Hacker, V. Thermal runaway of large automotive Li-ion batteries. RSC Adv. 2018, 8, 40172. [Google Scholar] [CrossRef] [Green Version]
  30. Bisschop, R.; Willstrand, O.; Rosengren, M. Handling Lithium-Ion Batteries in Electric Vehicles: Preventing and Recovering from Hazardous Events. Fire Technol. 2020, 56, 2671–2694. [Google Scholar] [CrossRef]
  31. Essl1, A.; Golubkov, W.; Fuchs, A. Comparing Different Thermal Runaway Triggers for Two Automotive Lithium-Ion Battery Cell Types C. J. Electrochem. Soc. 2020, 167, 130542. [Google Scholar] [CrossRef]
  32. Ruiz, V.; Pfrang, A.; Kriston, A.; Omar, N.; van den Bossche, P.; Boon-Brett, L. A review of international abuse testing standards and regulations for lithium ion batteries in electric and hybrid electric vehicles. Renew. Sustain. Energy Rev. 2018, 81, 1427–1452. [Google Scholar] [CrossRef]
  33. Essl, C.; Golubkov, A.W.; Gasser, E.; Nachtnebel, M.; Zankel, A.; Ewert, E.; Fuchs, A. Comprehensive Hazard Analysis of Failing Automotive Lithium-Ion Batteries in Overtemperature Experiments. Batteries 2020, 6, 30. [Google Scholar] [CrossRef]
  34. Larsson, F. Assessment of Safety Characteristics for Li-Ion Battery Cells by Abuse Testing; Chalmers University of Technology: Göteborg, Sweden, 2014. [Google Scholar]
  35. Wang, Z.; Ouyang, D.; Chen, M.; Wang, X.; Zhang, Z.; Wang, J. Fire behavior of lithium-ion battery with different states of charge induced by high incident heat fluxes. J. Therm. Anal. Calorim. 2018, 136, 2239–2247. [Google Scholar] [CrossRef]
  36. Ren, D.; Hsu, H.; Li, R.; Feng, X.; Guo, D.; Han, X.; Lu, L.; He, X.; Gao, S.; Hou, J.; et al. A comparative investigation of aging effects on thermal runaway behavior of lithium-ion batteries. eTransportation 2019, 2, 100034. [Google Scholar] [CrossRef]
  37. Feng, X.; Zheng, S.; Ren, D.; He, X.; Wang, L.; Liu, X.; Li, M.; Ouyang, M. Key Characteristics for Thermal Runaway of Li-ion Batteries. Energy Procedia 2019, 158, 4684–4689. [Google Scholar] [CrossRef]
  38. Guo, L.S.; Wang, Z.R.; Wang, J.H.; Luo, Q.K.; Liu, J.J. Effects of the environmental temperature and heat dissipation condition on the thermal runaway of lithium ion batteries during the charge-discharge process. J. Loss Prev. Process. Ind. 2017, 49, 953–960. [Google Scholar] [CrossRef]
  39. Truchot, B.; Fouillen, F.; Collet, S. An experimental evaluation of toxic gas emissions from vehicle fires. Fire Saf. J. 2018, 97, 111–118. [Google Scholar] [CrossRef]
  40. IIEA. Global EV Outlook 2021; IEA: Paris, France, 2021; Available online: https://www.iea.org/reports/global-ev-outlook-2021 (accessed on 21 September 2021).
  41. Tesla Says Car Fire Started in Battery. Available online: https://wheels.blogs.nytimes.com/2013/10/02/highway-fire-of-tesla-model-s-included-its-lithium-battery/ (accessed on 21 May 2020).
  42. UPDATE 5-Tesla Reports Third Fire Involving Model S Electric Car. Available online: https://www.reuters.com/article/autos-tesla-fire-idUSL2N0IS0TL20131107 (accessed on 21 May 2020).
  43. Latest Tesla Fire Caused by Running over a Metal Object. Available online: https://money.cnn.com/2013/11/08/autos/tesla-fire-details/index.html (accessed on 21 May 2020).
  44. Tesla’s Third Model S Fire Brings Call for U.S. Inquiry. Available online: https://www.bloomberg.com/news/articles/2013-11-07/tesla-s-third-model-s-fire-brings-call-for-u-s-inquiry (accessed on 21 May 2020).
  45. Exclusive: Tesla Model S Charging System May Have Started Garage Fire—California Fire Dept. Available online: https://www.reuters.com/article/us-autos-tesla-fire/exclusive-tesla-model-s-charging-system-may-have-started-garage-fire-california-fire-dept-idUSBRE9BH1J020131218 (accessed on 21 May 2020).
  46. Linette, L. Another Tesla Caught on Fire While Sitting in a Toronto Garage This Month. Business Insider, 16 February 2014. [Google Scholar]
  47. Nygaard, K. “Tesla Antente under Lading og Brant opp” [A Tesla Caught Fire during Charging and Burned Out]. Aftenposten, 1 January 2016. (In Norwegian) [Google Scholar]
  48. A Tesla Model S Burst into Flames during a Test Drive in France. Available online: https://businessinsider.com.pl/international/a-tesla-model-s-burst-into-flames-during-a-test-drive-in-france/j4p2dh6 (accessed on 22 May 2020).
  49. NTSB: Tesla Was Going 116 Mph at Time of Fatal Florida Accident, Battery Pack Reignited Twice Afterwards. Available online: https://www.foxnews.com/auto/ntsb-tesla-was-going-116-mph-at-time-of-fatal-florida-accident-battery-pack-reignited-twice-afterwards (accessed on 25 June 2020).
  50. Tesla en feu sur l'A2: La batterie serait en cause. Available online: https://www.24heures.ch/suisse/tesla-feu-a2-batterie-cause/story/13942273 (accessed on 25 August 2021).
  51. Sun, P.; Bisschop, R.; Niu, H.; Huang, X. A Review of Battery Fires in Electric Vehicles. Fire Technol. 2020, 56, 1361–1410. [Google Scholar] [CrossRef]
  52. CGTN. Tesla Car Catches Fire in China, Investigation Underway. 2019. Available online: https://news.cgtn.com/news/3d3d514d7a416a4d34457a6333566d54/index.html (accessed on 25 June 2020).
  53. Scurtu, I.-L.; Szabo, I.; Mariasiu, F.; Moldovanu, D.; Mihali, L.; Jurco, A.-N. Numerical analysis of the influence of mechanical stress on the battery pack’s housing of an electric vehicle. IOP Conf. Ser. Mater. Sci. Eng. 2019, 568, 012054. [Google Scholar] [CrossRef] [Green Version]
  54. Bangkok Post. Porsche Catches Fire While Charging. 2018. Available online: https://www.bangkokpost.com/thailand/general/1429518/porsche-catches-fire-while-charging (accessed on 26 June 2020).
  55. National Transportation Safety Board. Preliminary Report: Crash and Post-crash Fire of Electric-powered Passenger Vehicle; National Transportation Safety Board: Denver, CO, USA, 2018.
  56. NTSB to Investigate Fiery Tesla Crash in Coral Gables That Killed 2. Available online: https://wsvn.com/news/local/miami-dade/ntsb-to-investigate-fiery-tesla-crash-in-coral-gables-that-killed-2/9 (accessed on 9 September 2021).
  57. Chen, Y.; Kang, Y.; Zhao, Y.; Wang, L.; Liu, J.; Li, Y.; Liang, Z.; He, X.; Li, X.; Tavajohi, N.; et al. A review of lithium-ion battery safety concerns: The issues, strategies, and testing standards. J. Energy Chem. 2021, 59, 83–99. [Google Scholar] [CrossRef]
  58. Wu, X.; Song, K.; Zhang, X.; Hu Naifang Li, L.; Li, W.; Zhang, L.; Zhang, H. Safety Issues in Lithium Ion Batteries: Materials and Cell Design. Front. Energy Res. 2019, 7, 65. [Google Scholar] [CrossRef] [Green Version]
  59. Tesla Model S Plaid Caught Fire While Driver Was at the Wheel, Says Fire Chief. Available online: https://www.cnbc.com/2021/07/01/tesla-model-s-plaid-caught-fire-while-being-driven-fire-chief.html (accessed on 24 September 2021).
  60. GM to Begin Fixing Chevy Bolt EVs, Recalled Due to Fire Risk, as Soon as Next Month. Available online: https://www.cnbc.com/2021/09/20/gm-to-begin-fixing-recalled-chevy-bolt-evs-next-month-due-to-fire-risk.html (accessed on 24 September 2021).
  61. Lu, L.; Han, X.; Li, J.; Hua, J.; Ouyang, M. A review on the key issues for lithium-ion battery management in electric vehicles. J. Power Sources 2012, 226, 272. [Google Scholar] [CrossRef]
  62. Gerssen-Gondelach, S.J.; Faaij, A.P.C. Performance of batteries for electric vehicles on short and longer term. J. Power Sources 2012, 212, 111. [Google Scholar] [CrossRef]
  63. MLA Style: The Nobel Prize in Chemistry 2019. NobelPrize.org. Nobel Media AB 2020. Sun. 3 May 2020. Available online: https://www.nobelprize.org/prizes/chemistry/2019/summary/ (accessed on 4 July 2021).
  64. Blomgren, G.E. The development and future of lithium ion batteries. J. Electrochem. Soc. 2017, 164, A5019. [Google Scholar] [CrossRef] [Green Version]
  65. Compare Electric Cars: EV Range, Specs, Pricing & More. Available online: https://insideevs.com/reviews/344001/compare-evs/ (accessed on 9 September 2021).
  66. Joo, S.-H.; Shin, S.; Shin, D.-J.; Wang, J.-P. Development of recycling technology to recover valuable metals from lithium primary and ion batteries. Proc. Inst. Mech. Eng. Part B J. Eng. Manuf. 2015, 229, 212–220. [Google Scholar] [CrossRef]
  67. Deng, D. Li-ion batteries: Basics, progress, and challenges. Energy Sci. Eng. 2015, 3, 385–418. [Google Scholar] [CrossRef]
  68. Duan, J.; Tang, X.; Dai, H.; Yang, Y.; Wu, W.; Wei, X.; Huang, Y. Building Safe Lithium-Ion Batteries for Electric Vehicles: A Review. Electrochem. Energ. Rev. 2020, 3, 1–42. [Google Scholar] [CrossRef] [Green Version]
  69. Verma, K.D.; Banerjee, S.; Kar, K.K. Characteristics of electrolytes. In Handbook of Nanocomposite Supercapacitor Materials I; Kar, K., Ed.; Springer Series in Materials Science; Springer: Cham, Switzerland, 2020; Volume 300. [Google Scholar] [CrossRef]
  70. Wang, Q.; Mao, B.; Stoliarov, S.I.; Sun, J. A review of lithium ion battery failure mechanisms and fire prevention strategies. Prog. Energy Combust. Sci. 2019, 73, 95–131. [Google Scholar] [CrossRef]
  71. Zubia, G.; Dufo-Lópeza, R.; Carvalhob, M.; Pasaoglu, G. The lithium-ion battery: State of the art and future perspectives. Renew. Sustain. Energy Rev. 2018, 89, 292–308. [Google Scholar] [CrossRef]
  72. Cuma, M.U.; Yirik, E.; Dericioğlu, Ç.; Ünal, E.; Onur, B.; Tumay, M. Design considerations of high voltage battery packs for electric buses. Int. J. Adv. Automot. Technol. 2017, 1, 73–79. [Google Scholar] [CrossRef] [Green Version]
  73. Liu, Y.; Sun, P.; Niu, H.; Huang, X.; Rein, G. Propensity to self-heating ignition of open-circuit pouch lithium-ion battery pile on a hot boundary. Fire Saf. J. 2020, 120, 103081. [Google Scholar] [CrossRef]
  74. National Climatic Data Center. State Climate Extremes Committee (SCsEC); National Climatic Data Center: Asheville, NC, USA, 2016. [Google Scholar]
  75. Tobishima, S.I.; Yamaki, J.I. A consideration of lithium cell safety. J. Power Sources 1999, 81–82, 882–886. [Google Scholar] [CrossRef]
  76. Hao, M.; Li, J.; Park, S.; Moura, S.; Dames, C. Efficient thermal management of Li-ion batteries with a passive interfacial thermal regulator based on a shape memory alloy. Nat. Energy 2018, 3, 899–906. [Google Scholar] [CrossRef]
  77. Zheng, J.; Engelhard, M.H.; Mei, D.; Jiao, S.; Polzin, B.J.; Zhang, J.; Xu, W. Electrolyte additive enabled fast charging and stable cycling lithium metal batteries. Nat. Energy 2017, 2, 17012. [Google Scholar] [CrossRef]
  78. Fairley, P. Speed bumps ahead for electric-vehicle charging. IEEE Spectr. 2010, 47, 13–14. [Google Scholar] [CrossRef]
  79. Larsson, F.; Mellander, B.-E. Lithium-Ion Batteries Used in Electrified Vehicles—General Risk Assessment and Construction Guidelines from a Fire and Gas Release Perspective; RISE Research Institutes of Sweden: Gothenburg, Sweden, 2017. [Google Scholar]
  80. Justen, R.; Schöneburg, R. Crash safety of hybrid and battery electric vehicles. In Proceedings of the 22nd Enhanced Safety of Vehicles Conference, Washington, DC, USA, 13–16 June 2011. [Google Scholar]
  81. Liu, K.; Liu, Y.; Lin, D.; Pei, A.; Cui, Y. Materials for lithium-ion battery safety. Sci. Adv. 2018, 4, eaas9820. [Google Scholar] [CrossRef] [PubMed] [Green Version]
  82. Menale, C.; D’Annibale, F.; Mazzarotta, B.; Bubbico, R. Thermal management of lithium-ion batteries: An experimental investigation. Energy 2019, 182, 57–71. [Google Scholar] [CrossRef]
  83. Chombo, P.V.; Laoonual, Y. A review of safety strategies of a Li-ion battery. J. Power Sources 2020, 478, 228649. [Google Scholar] [CrossRef]
  84. Victor Chombo, P.; Laoonual, Y.; Wongwises, S. Lessons from the Electric Vehicle Crashworthiness Leading to Battery Fire. Energies 2021, 14, 4802. [Google Scholar] [CrossRef]
  85. Ghiji, M.; Edmonds, S.; Moinuddin, K. A Review of Experimental and Numerical Studies of Lithium Ion Battery Fires. Appl. Sci. 2021, 11, 1247. [Google Scholar] [CrossRef]
  86. Said, A.O.; Lee, C.; Stoliarov, S.I.; Marshall, A.W. Comprehensive analysis of dynamics and hazards associated with cascading failure in 18650 lithium ion cell arrays. Appl. Energy 2019, 248, 415–428. [Google Scholar] [CrossRef]
  87. Vytenis Babrauskas, R.D.P. Heat release rate: The single most important variable in fire hazard. Fire Saf. J. 1992, 18, 255–272. [Google Scholar] [CrossRef]
  88. Ma, M.; Wang, Y.; Duan, Q.; Wu, T.; Sun, J.; Wang, Q. Fault detection of the connection of lithium-ion power batteries in series for electric vehicles based on statistical analysis. Energy 2018, 164, 745–756. [Google Scholar] [CrossRef]
  89. BS 7346-7:2013; Components for Smoke and Heat Control Systems—Part 7: Code of Practice on Functional Recommendations and Calculation Methods for Smoke and Heat Control Systems for Covered Car Parks. British Standards Institution: London, UK, 2013.
  90. NEN 6098:2010; Rookbeheersingssystemen Voor Mechanisch Geventileerde Parkeergarages. Royal Netherlands Standardization Institute: Delft, The Netherlands, 2010.
  91. Verification Method C/VM2, Framework for Fire Safety Design; New Zealand Building Code Clauses C1–C6 Protection from Fire, A3 Building Importance Levels; Ministry of Business Innovation & Employment: Wellington, New Zealand, 2013.
  92. Schleich, J.B.; Cajot, L.G.; Pierre, M.; Brasseur, M. Development of Designa Rules for Steel Structures Subjected to Natural Fires in Closed Car Parks; European Commission: Luxembourg, 1999. [Google Scholar]
  93. NFPA 502:2020; Standard for Road Tunnels, Bridges, and Other Limited Access Highways. National Fire Protection Association: Quincy, MA, USA, 2020.
  94. Colella, F. Understanding Electric Vehicle Fires; Fire Protection and Safety in Tunnels: Stavanger, Norway, 2016. [Google Scholar]
  95. Long, R.T.; Blum, A.F.; Bress, T.J.; Cotts, B.R.T. Best Practices for Emergency Response to Incidents Involving Electric Vehicles Battery Hazards: A Report on Full-Scale Testing Results; Fire Protection Research Foundation: Quincy, MA, USA, 2013. [Google Scholar]
  96. Emergency Response Guide Tesla Model S 2016. Available online: https://www.tesla.com/sites/default/files/downloads/2016_Model_S_Emergency_Response_Guide_en.pdf (accessed on 9 September 2021).
  97. Ghiji, M.; Novozhilov, V.; Moinuddin, K.; Joseph, P.; Burch, I.; Suendermann, B.; Gamble, G. A Review of Lithium-Ion Battery Fire Suppression. Energies 2020, 13, 5117. [Google Scholar] [CrossRef]
  98. Un, C.; Aydın, K. Thermal Runaway and Fire Suppression Applications for Different Types of Lithium Ion Batteries. Vehicles 2021, 3, 480–497. [Google Scholar] [CrossRef]
  99. Said, A.O.; Stoliarov, S.I. Analysis of effectiveness of suppression of lithium ion battery fires with a clean agent. Fire Saf. J. 2021, 121, 103296. [Google Scholar] [CrossRef]
  100. Willstrand, O. Fire Suppression Tests for Vehicle Battery Pack; Test Report 8P03983-03; RISE Research Institutes of Sweden: Gothenburg, Sweden, 2019. [Google Scholar]
  101. SAE. Electric Vehicle and Plug in Hybrid Electric Vehicle Conductive Charge Coupler; SAE Int. Std. J1772-2017; SAE International: Warrendale, PA, USA, 2017; pp. 1–116. [Google Scholar]
  102. Wang, B.; Dehghanian, P.; Wang, S.; Mitolo, M. Electrical Safety Considerations in Large-Scale Electric Vehicle Charging Stations. IEEE Trans. Ind. Appl. 2019, 55, 6603–6612. [Google Scholar] [CrossRef]
  103. Chen, F.; Leong, J. Smoke flow phenomena and turbulence characteristics of tunnel fires. Appl. Math. Model. 2011, 35, 4554–4566. [Google Scholar] [CrossRef]
  104. McGrattan, K.; McDermott, R.; Hostikka, S.; Floyd, J.; Weinschenk, C.; Overholt, K. Volume 1: Mathematical model. In Fire Dynamics Simulator Technical Reference Guide, 6th ed.; NIST Special Publication 1018-1; National Institute of Standards and Technology: Gaithersburg, MD, USA, 2016. [Google Scholar]
  105. Gager, A.H., III; Dominguez, G. Tenability Criteria in Unique Situations and Atypical Buildings; FEMTC: Manhattan, KS, USA, 2016. [Google Scholar]
  106. Poh, W. Tenability Criteria for Design of Smoke Hazard Management Systems; Ecolibrium: Ahmedabad, India, 2011. [Google Scholar]
  107. Hopkin, C.; Spearpoint, M.; Henderson, A.; Hopkin, D. Smoke Control Association Guide: Benchmarking firefighting tenability criteria against accepted designs. Int. Fire Prof. J. 2017. Available online: https://www.researchgate.net/publication/325049474_Smoke_Control_Association_Guide_Benchmarking_firefighting_tenability_criteria_against_accepted_designs (accessed on 10 October 2021).
Figure 1. World electric car growth forecast by IEA [40].
Energies 15 00011 g001
Figure 2. First fires of mass-produced battery electric vehicles (BEVs) (a) 2 October 2013, (b) 7 Novembre 2013 [41,44].
Energies 15 00011 g002
Figure 3. Tragic BEV electric car fires after road accidents (a) Fort Lauderdale, Florida 8 May 2018, (b) A2 road, Monte Ceneri 15 May 2018 [49,50].
Energies 15 00011 g003
Figure 4. Cylindrical cell construction (a) and operation diagram (b) of Li-ion battery, based on [66].
Energies 15 00011 g004
Figure 5. The single Li-ion cylindrical battery used in the BEV Tesla S electric car (a) together with the modular structure (b) of the entire traction battery (c) [72].
Energies 15 00011 g005
Figure 6. Three-stage process of the thermal runaway reaction. Stage 1: increase of internal battery temperature, Stage 2: accelerating increase of internal battery temperature, exothermic reaction starts, Stage 3 combustion of the electrolyte, based on [74].
Energies 15 00011 g006
Figure 7. HRR fire development curves for passenger electric cars according to [16,17,18].
Energies 15 00011 g007
Figure 8. Scheme of fire ventilation system in the building under consideration.
Energies 15 00011 g008
Figure 9. Fire development for the passenger car of manufacturer 1 (a) and manufacturer 2 (b) [16].
Energies 15 00011 g009
Figure 10. Computational fluid dynamics (CFD) analysis result—visibility distribution at a height of 1.8 m above the floor during evacuation (a) electric vehicle (EV) (b) ICEV, manufacturer 1.
Energies 15 00011 g010
Figure 11. CFD analysis result—temperature distribution at a height of 1.5 m above the floor during firefighting and rescue operation (a) EV (b) ICEV, manufacturer 1.
Energies 15 00011 g011
Figure 12. CFD analysis result—temperature distribution under the ceiling affecting the building structure (a) EV (b) ICEV, manufacturer 1.
Energies 15 00011 g012
Figure 13. CFD analysis result—visibility distribution at a height of 1.8 m above the floor during evacuation (a) EV (b) ICEV, manufacturer 2.
Energies 15 00011 g013
Figure 14. CFD analysis result—temperature distribution at a height of 1.5 m above the floor during firefighting and rescue operation (a) EV (b) ICEV, manufacturer 2.
Energies 15 00011 g014
Figure 15. CFD analysis result—temperature distribution under the ceiling affecting the building structure (a) EV (b) ICEV, manufacturer 1.
Energies 15 00011 g015
Table 1. Example of the capacity of lithium-ion batteries used in various types of passenger electric vehicles.
Type of Passenger Electric CarMinimum Capacity of Li-Ion Battery [kWh]Average Li-Ion Battery Capacity [kWh]Maximum Battery Capacity Li-Ion [kWh]
HEV0.9 (1)1.4 (2)1.6 (3)
PHEV8.9 (4)13.8 (5)42.2 (6)
BEV32.6 (7)82 (8)200 (9)
(1) Toyota Yaris Hybrid, (2) Ford Fusion Hybrid, (3) Lexus NX 300 h, (4) KIA Niro PHEV, (5) Mitsubishi Outlander PHEV, (6) BMW i3 REx, (7) Mini Cooper SE, (8) Volkswagen ID.4 Pro, (9) GMC Hummer EV Pickup (estimate).
Table 2. Example of the capacity of lithium-ion batteries used in various types of passenger electric vehicles.
Cell TypeLCOLMOLFPNMCNCA
life cycle length++ (3)+ (4)+++ (2)++ (1)++ (1)
safety+ (4)+++ (2)++++ (1)+++ (2)++ (3)
energy density+++ (2)+ (4)+ (4)+++ (2)+++ (2)
cost+++ (2)++ (3)+++ (2)++ (3)++ (3)
(1) very high, (2) high, (3) medium, (4) low.
Table 3. Heat release data for electric vehicle (EV) fire tests [16,17,18].
Peak Heat Release Rate [MW]Total Heat Release [GJ]
Manufacturer 1 [16]4.26.31
Manufacturer 2 [16]4.78.54
A-EV-100 [18]6.0-
A-EV-85 [18]5.94.91
B-EV [18]6.94.66
C–PHEV [18]6.04.63
D–PHEV [18]7.95.85
BEV [17]6.36.4
Publisher’s Note: MDPI stays neutral with regard to jurisdictional claims in published maps and institutional affiliations.

