Article

Maximizing Energy Recovery from Beauty Leaf Tree (Calophyllum inophyllum L.) Oil Seed Press Cake via Pyrolysis

1
School of Health, Medical and Applied Sciences, Central Queensland University, Rockhampton, QLD 4701, Australia
2
Biological and Agricultural Engineering Department, Texas A&M University (TAMU), College Station, TX 77843, USA
3
Greenhouse Gas Laboratory, Korean Institute of Energy Research, Daejeon 34129, Korea
*
Author to whom correspondence should be addressed.
Energies 2021, 14(9), 2625; https://doi.org/10.3390/en14092625
Submission received: 19 March 2021 / Revised: 26 April 2021 / Accepted: 28 April 2021 / Published: 3 May 2021
(This article belongs to the Special Issue Current Trends in Biomass Pyrolysis for Biofuel Production )

Abstract

:
This study optimizes pyrolysis conditions that will maximize energy recovery from the Beauty Leaf Tree (BLT; Calophyllum inophyllum L.) oil seed press cake. Response surface methodology (RSM) was used to determine the behavior of pyrolysis coproducts (solid, liquid and gas) at various temperatures and residence times. One significant discovery was that 61.7% of the energy (of the whole BLT oil seed) was still retained in the BLT oil seed cake after oil extraction. Controlled pyrolysis produced various proportions of biochar, bio-oil and syngas coproducts. Predictive models were developed to estimate both the mass and energy yields of the coproducts. In all experimental runs, the biochar component had the highest mass yield and energy content. Biochar mass yields were high at the lowest operating temperature used, but the energy yields based on a high heating value (HHV) of products were optimal at higher operating temperatures. From the RSM models, energy from the biochar is optimized at a pyrolysis temperature of 425 °C and 75 min of exposure time. This biochar would have a heating value of 29.5 MJ kg−1, which is similar to a good quality coal. At this condition, 56.6% of the energy can be recovered in the form of biochar and 20.6% from the bio-oil. The study shows that almost all the energy present in the feedstock can be recovered via pyrolysis. This indicates that commercial biodiesel producers from BLT oil seed (and other oil seed) should recover these additional valuable energies to generate high value coproducts. This additional efficient energy conversion process via controlled pyrolysis will improve the overall economics and the feasibility of 2nd generation biodiesel production from BLT—a highly potential species for cultivation in many tropical countries.

1. Introduction

Forest wastes comprised the second largest biomass resource produced in the coastal areas of Queensland and the Northern Territory of Australia [1]. These wastes include bark and post-harvest residues. Additional wastes are also produced continuously as green wastes. These wastes can be used in biofuel generation. However, there is a need to understand the energy and mass balances in the waste products, including those in the oil seed extraction process to better utilize the energy from the spent wastes to improve the overall economics of biofuels production. Hence, the overall goal of the current study was to evaluate the distribution of mass and energy contained in the spent press cake, as it undergoes controlled thermal treatment during pyrolysis process. By careful selection of the temperature and exposure times, it is possible to optimize conditions needed to maximize energy recovery from the spent waste materials.
Various studies have shown that Beauty Leaf Tree (BLT) is a potential source of non-edible and non-food competing oil for producing biodiesel, due to its ability to grow in a wide range of climatic conditions, easy cultivation, high fruit production rate and high oil content in its seeds [2,3,4,5]. This plant is native to coastal areas of Queensland, Western Australia and Northern Territory of Australia. Additional studies have also demonstrated optimized biodiesel production via second-generation biodiesel methods [3,4], and the fuel properties were found to be resembling those of conventional diesel fuel and another edible oil-derived biodiesel [6,7].
There have been many efforts to replace fossil-fuel-based engine fuels with plant or animal derived biofuels over the last decade [3,7]. However, one major challenge to commercialize biofuels made from non-food sources has been its overall cost of production [8] and energy cost [9]. According to the US Department of Energy, biodiesel made from virgin soybean oil is energy efficient, yielding 3.2 units of fuel energy for every 1 unit of fossil fuel energy used to produce it, while reducing lifecycle CO2 emissions by 78% [9]. Other non-edible based biodiesel will not have similar positive net energy balance. Studies are therefore warranted to prove this positive energy balance for each new source of oil for biodiesel production. Likewise, the competitiveness of biodiesel from non-food sources is a strong function of crude oil prices. As the crude oil price drops to below $100 a barrel, so does the competitiveness of biodiesel production, and this must be considered when developing new biofuels from plants [10]. Further engine testing and emissions characteristics of BLT biodiesel have shown baseline ASTM standard values in comparison with other non-edible oil seed biodiesel such as jatropha and jojoba [7].
Large quantities of pressed oil seed cakes are ubiquitously produced from oil extraction processes [2,11,12,13]. These cakes must be further converted into high value products to improve the competitiveness and sustainability of this biodiesel fuel production process. One potential pathway is controlled thermal conversion via pyrolysis. Limited studies have been conducted on these recovery processes such as the study conducted by Kongkasawan et al. in 2016 [11] on the jatropha waste meal, where it was found that more than 50% of the initial biomass of the whole seed remained in the press cake.
Numerous biorefineries around the world produce millions of liters of biofuels from oil seeds [13]. These companies ignore the importance of spent press cake after oil extraction, and consider this as a waste, particularly when it has toxic substances (e.g., jatropha or calophyllum; [5,14]). These biorefineries should realize that significant amounts of energy from the seeds are sequestered in the press cake, as this study will demonstrate.
In a comprehensive study by Jahirul et al. [15], pyrolysis technology was recommended as the best option to recover energy from wastes due to its numerous socioeconomic advantages and the high efficiency of conversion into bio-oil, biochar and syngas, as compared to other thermochemical conversion processes. Hence, the pyrolysis pathway was chosen for this study.
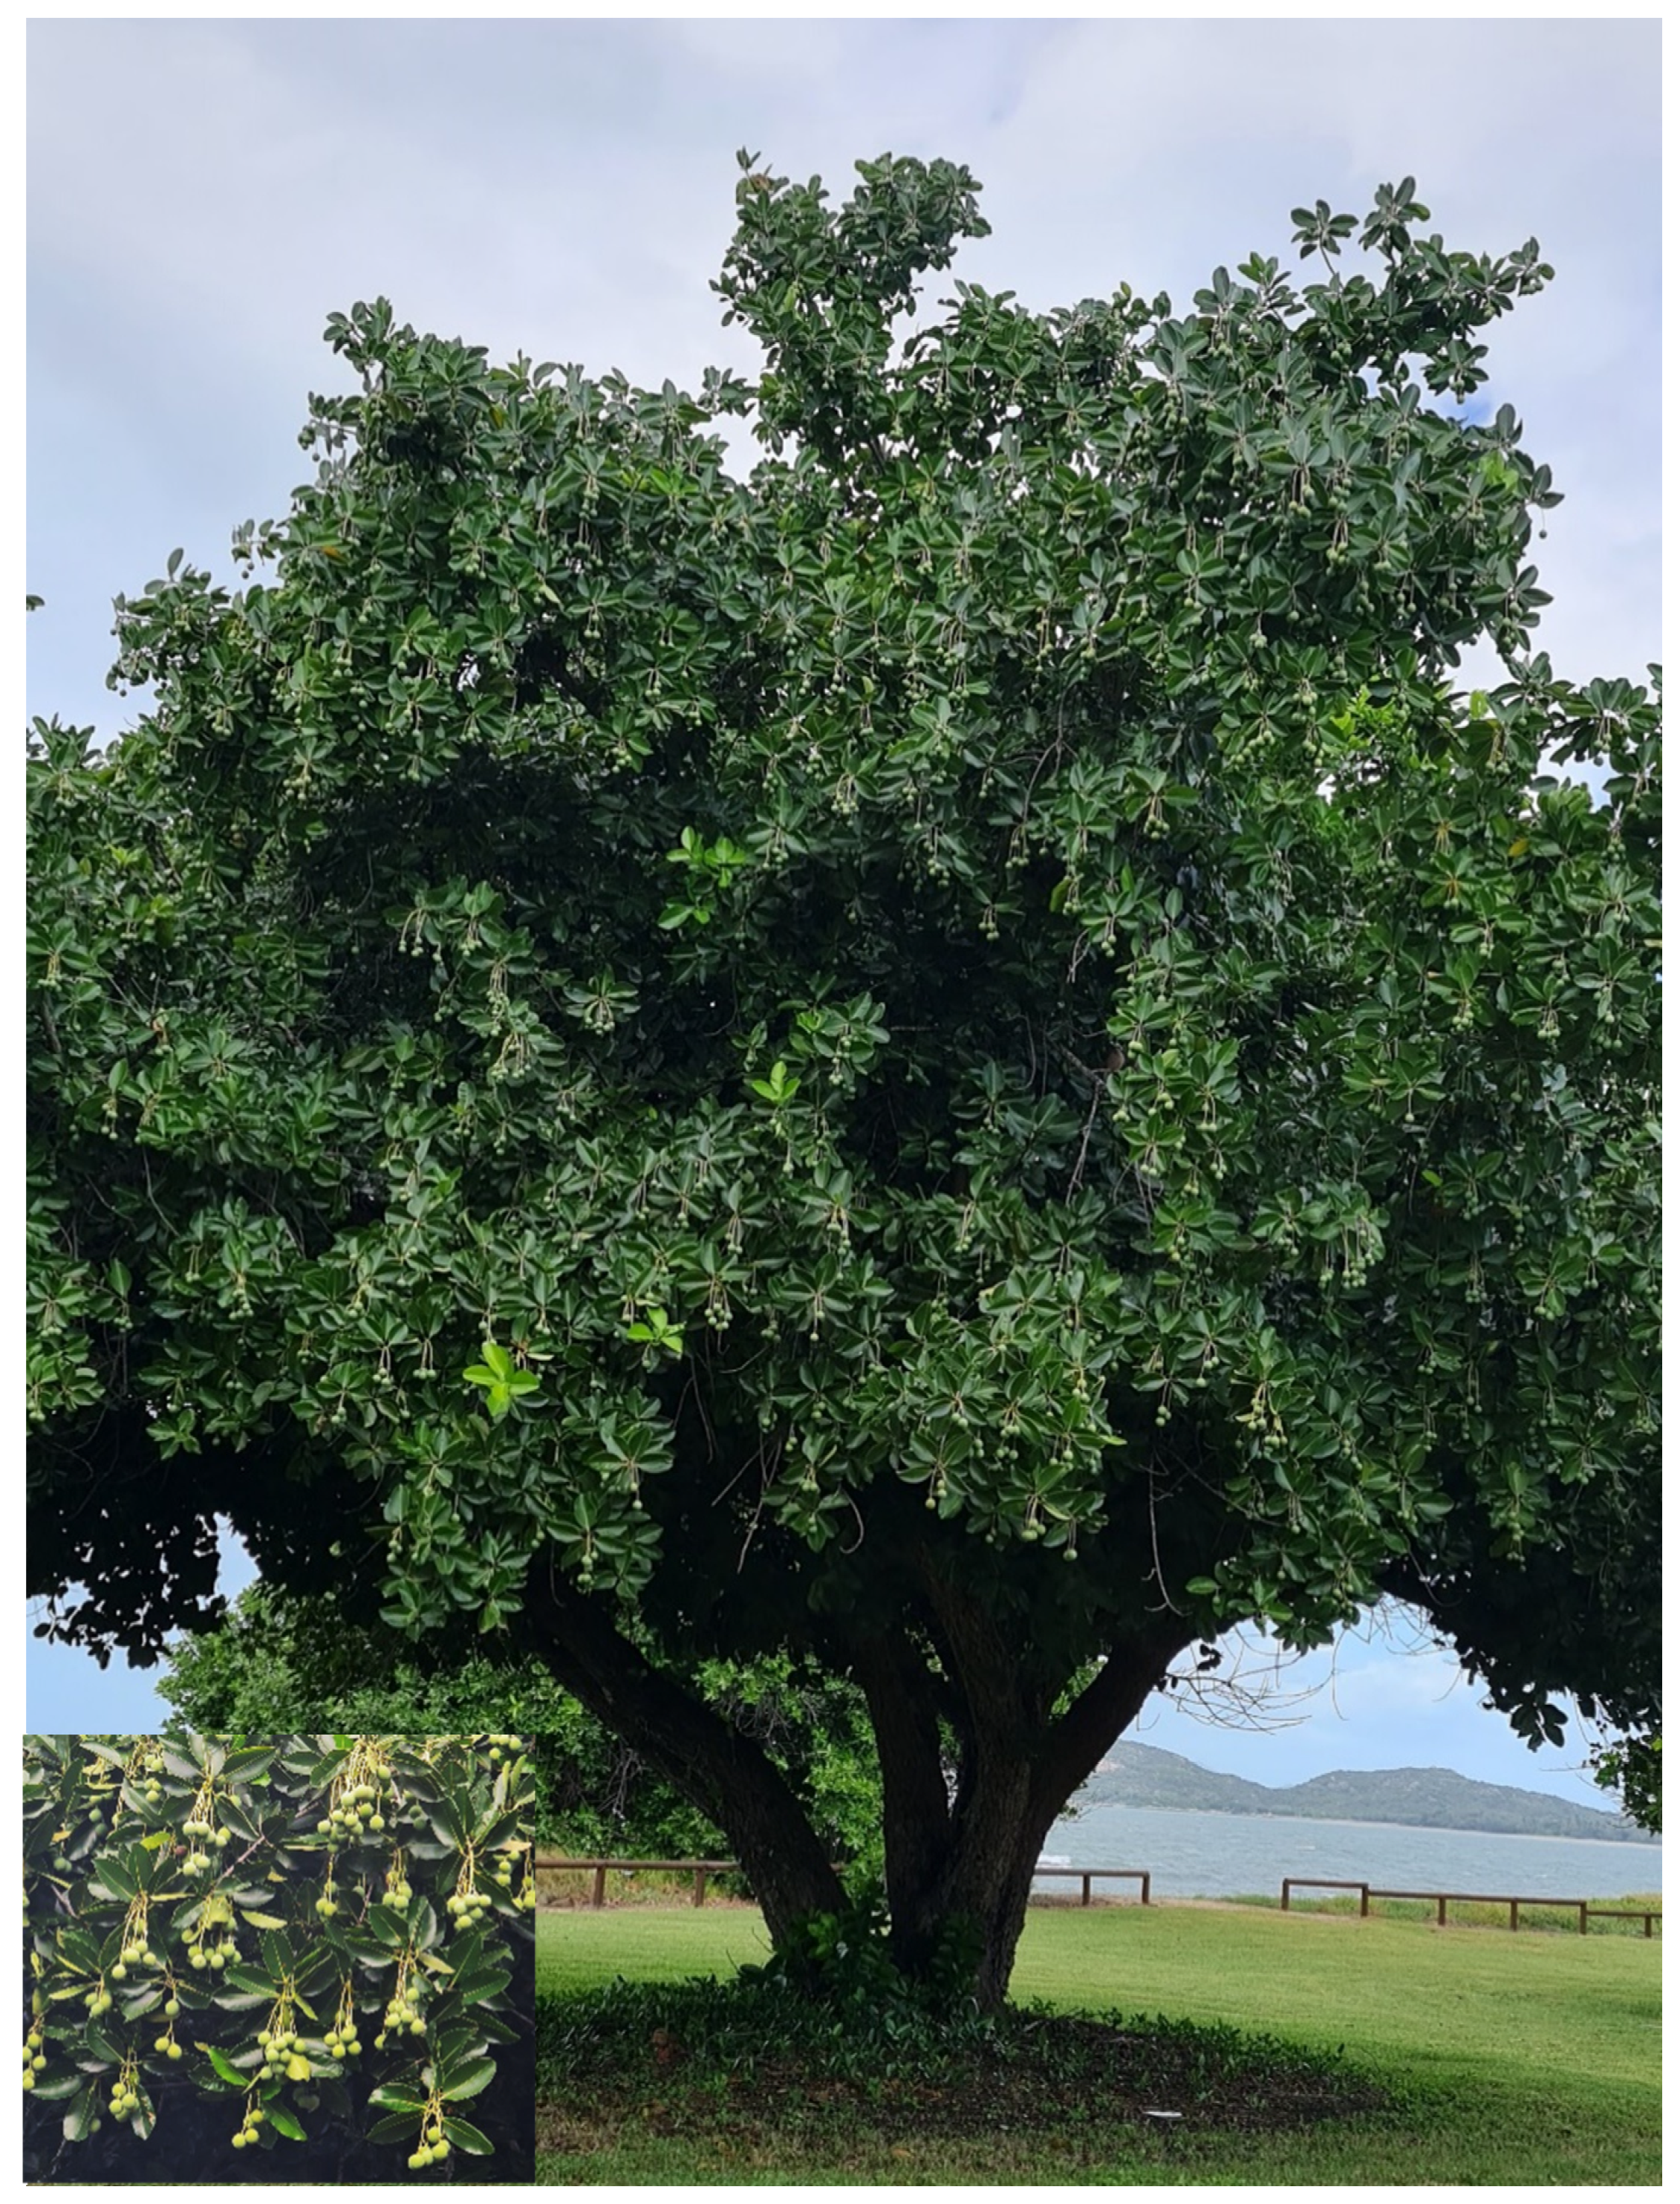
In the present study, spent (oil extracted) press cake from Beauty Leaf Tree (BLT; Calophyllum inophyllum L.) seeds [12] was pyrolyzed using a batch type reactor. BLT was selected as it is easy to cultivate and harvest and produces large amounts of oil-rich fruits (Figure 1).
The primary reason for using the batch type reactor was to minimize losses of co-products. The properties of the pyrolysis products such as the biochar, bio-oil and gaseous products were thoroughly examined. The optimum conditions for the mass and energy yields were studied by establishing statistical models using response surface methodology (RSM). The results of this study will show improved feasibility for biodiesel production, with the recovery of coproducts.

2. Study Objectives

The main technical goal of this study was the identification of proper treatment conditions that would yield optimized coproducts that may be used to develop better feasibility studies for commercial production of biofuels. The specific objectives are as follows:
  • Optimize the biochar, bio-oil, bioliquor and syngas production from pyrolysis of beauty leaf tree oil seed press cake using response surface methodology (RSM),
  • Determine the mass and energy balances required for optimal production of solid, liquid and gaseous coproducts, and,
  • Provide future project directions to optimize the overall energy recovery from wastes resulting from biodiesel production process.

3. Materials and Methods

3.1. Sample Preparation and Characterisation

The pyrolysis experiments were carried out at BETA Laboratory (https://betalab.tamu.edu/ accessed on 29 April 2021) of Texas A&M University, College Station, Texas. Beauty Leaf Tree (Calophyllum inophyllum L.) seeds (kernels) were sourced from Queensland, Australia. The BLT oil was extracted from BLT kernels using a mechanical oil seed press (Komet Press, Germany). Then, the press seed cake, which is a byproduct of biodiesel production, was dried, ground and passed through a 5 mm sieve using the Tyler sieve set (W. S. Tyler, Cleveland, OH, USA) [12].
PARR isoperibol bomb colorimeter (Model 6200, Parr Instrument Company, Moline, IL, USA) was used to measure the high heating value (HHV) of the sample in accordance with the ASTM D 2015. The elemental composition of the press cake was determined using a Vario-MICRO Elemental Analyzer (ASTM D 3176; Standard Practice for Ultimate Analysis of Coal and Coke). For the proximate analysis, ASTM standard D 3173 (Sample Preparation and Moisture Content Determination), D3175 (Standard Test Method for Volatile Matter for Ash in Biomass) and E1755 (Standard Test Method for Ash in Biomass) methods were used [14].

3.2. Experimental Facilities

Pyrolysis of BLT seed cake was conducted using a batch type Parr reactor (Series 4580 HP/HT, Parr Instrument Company, Moline, IL, USA) [12]. A cylindrical electric heater heated the 1.5 L AISI 316 S.S. batch with a thermocouple placed inside the reactor. Temperature and exposure time were controlled with a reactor controller (Series 4840, Parr Instrument Company, Moline, IL). A condenser cooled by an ethanol–water–glycol mixture was used to condense the gas.
Approximately 60 g of the dried seed cake was pyrolyzed each time. The reactor chamber was flushed with N2 gas for 15 min to remove oxygen. The reactor was heated at a rate of about 5 °C/min until the set temperatures (300 °C, 400 °C or 500 °C) were reached. The desired temperature was held each for 30, 60 or 90 min. During pyrolysis, the pyrolyzed gas was condensed (−4 °C), and the volume of the uncondensed gas was measured using a gas meter (METRIS 250, Itron Inc., Owenton, KY, USA). The uncondensed gas was sampled at regular intervals using pre-weighed Tedlar gas sampling bags. After pyrolysis, the reactor was cooled for 10–24 h, prior to collecting the biochar and liquids. The condensed liquid was separated into aqueous (io-liquor) and organic portions (bio-oil) and stored in glass bottles. Weights of the biochar and the liquid were taken soon after collection.

3.3. Analytical Methods

The solid, liquid and gas products of BLT press cake pyrolysis were analyzed. First, the high heating value (HHV) and elemental composition of solid and liquid products were determined using the Parr bomb calorimeter and Vario MICRO Ultimate Analyzer (C, H, O, N and S), respectively as explained in Section 3.1. The proximate analysis and moisture content analysis for solid pyrolyzed char were determined according to ASTM E1755 and D3172. Moisture content of the bio-oil was also obtained by using a KF Titrino 701 (Metrohm, Riverview, FL, USA) in accordance with the ASTM E203 standard. A gas chromatograph was used to determine the composition (H2, N2, O2, CO, CH4, CO2, C2H2, C2H4, C2H6, C3H6 and C3H8) of pyrolysis gas. The gas chromatograph (GC, SRI Multiple Gas Analyzer MG #1, Torrance, CA, USA) was equipped with a thermal conductivity detector (TCD), a Molecular Sieve 5A 80/100 (3’ 1/8” ID SS, Restek, Centre County, PA, USA) and a ShinCarbon ST 80/120 (2 mm ID SRI 8610C, Restek, Centre County, PA, USA). Argon was used as a carrier gas. The initial temperature of the GC was set at 40 °C and it was increased to 280 °C and held for 18.5 min. The temperature was raised at the rate of 10–20 °C/min. The weights and the energy contents of the BLT press cake and those of pyrolysis products were used to calculate recovery of the masses and energies of pyrolysis products, respectively.

3.4. Experimental Design and Statistical Analysis of Data

The central composite design (CCD) is a type of response surface methodology (RSM), which is often used to optimize pyrolysis conditions, coefficient estimation and to determine the significance of independent factors. The temperature and residence time are the two influential pyrolysis factors used in this study. Central composite face-centered (alpha value = 1) was chosen for temperature (300 °C, 400 °C and 500 °C), and exposure times (30, 60 and 90 min). A combination of temperature and residence time resulted in a set of 12 conditions (Table 1). It can be noted that the 400 °C and 60 min combination has been replicated 4 times and the others will have one value.
The analysis of variance (ANOVA) was used to explain the fitness of the regression models with a 95% confidence level. This analysis helps to determine if the treatments had any significant effect on biofuel production, and then to identify the treatments that performed significantly better than the other treatments. The higher the value of the coefficient, the greater will be the effect of the factor being tested. With the coefficient values, the F statistic value can be used to determine if the effect of each factor was significant. If the F value (ratio of the mean square of treatments to the error mean square) is large, then the variance by the model is significantly larger than random errors (error variance). Amongst all the response parameters studied, only the solid heating value (MJ/kg), solid energy yield (%) and mass conversion response parameters (wt %) are reported in this paper. All the models were chosen by reducing the terms using both backward and stepwise model selection to avoid collinearity problems, which can result in large standard errors, poor numerical accuracy and wrong partial regression coefficients.
The following equations were used in the data analysis. Mass and energy were balanced with consequent losses. Energy yield shows the magnitude of the energy conversion of the initial biomass after pyrolysis, while the mass product yield represents the mass conversion during the pyrolysis process. The energy density of the pyrolyzed solid products represents the ratio between the increased energy yield and the converted mass yield.
Product yield (%) = mpyrolysis/minitial × (100%)
Char yield (%) + Liquid yield (%) + Gas yield (%) + Loss (%) = 100%
Energy yield (%) = (mpyro × HHVpyro)/(minitial × HHVinitial) × 100
Energy density (%) = Eenergy_yield (%)/mproduct_ yield × 100
Product yield (%) = mproduct/minitial x 100
Total biomass yield (100%) = Biochar (%) + Liquid (%) + Gas (%) + Loss (%)
where
Liquid yield (%) = bio-oil (%) + aqueous (bioliquor) (%)
Energy yield (%) = (mproduct × HHVproduct)/(minitial × HHVinitial) × 100

4. Results and Discussion

4.1. Beauty Leaf Tree Oil Press Cake Characteristics

Table 2 shows the basic properties of the BLT seeds and the cake resulting from oil extraction using an oil press. Comparing the high heating value (HHV) of BLT seeds with the de-oiled press cake, one would observe that about 61.7% of the energy from the whole seed remained in the cake (on dry basis). Additional comparative data is also shown for a common oil seed crop jatropha and its corresponding de-oiled press cake [11]. One advantage of optimizing BLT seeds is its very high energy content (31.6 MJ kg−1, dry basis) compared with jatropha seeds (22.2 MJ kg−1, dry basis). About 29.7% more energy is contained in BLT seeds than in the equal amount of jatropha seeds on a dry basis.
The prime reason is the genetic differences between the two species in tissue structure and composition [16,17]. Jatropha seeds have lower oil yield, only 25%, as reported in the literature [16]. Additionally, the lower ash content and higher VCM composition can result in the higher HHV as in the case of BLT cake. Hence, if one were to develop a program for biodiesel production, BLT oil seed offers a better energy pathway than jatropha based on its seed oil content.
Another clear advantage of using BLT seeds was its relatively low ash content (5.3%) compared with soybean seeds that contained around 6.4% [18]. Jatropha seeds have very similar ash content. This parameter is important for continuous thermal conversion options to avoid slagging and fouling issues [14]. BLT seeds have relatively higher volatiles compared with jatropha seeds (92.5% versus 77.1%). This is important for syngas production.
BLT seed also has superior carbon content (65.8%) compared with jatropha seeds (53.7%). A higher carbon content will yield excellent quality biochar coproduct from the seed cake. Biochar with high carbon content can be easily upgraded into highly valuable materials such as activated carbon and graphene [14].

4.2. Product Yields (Mass Balance)

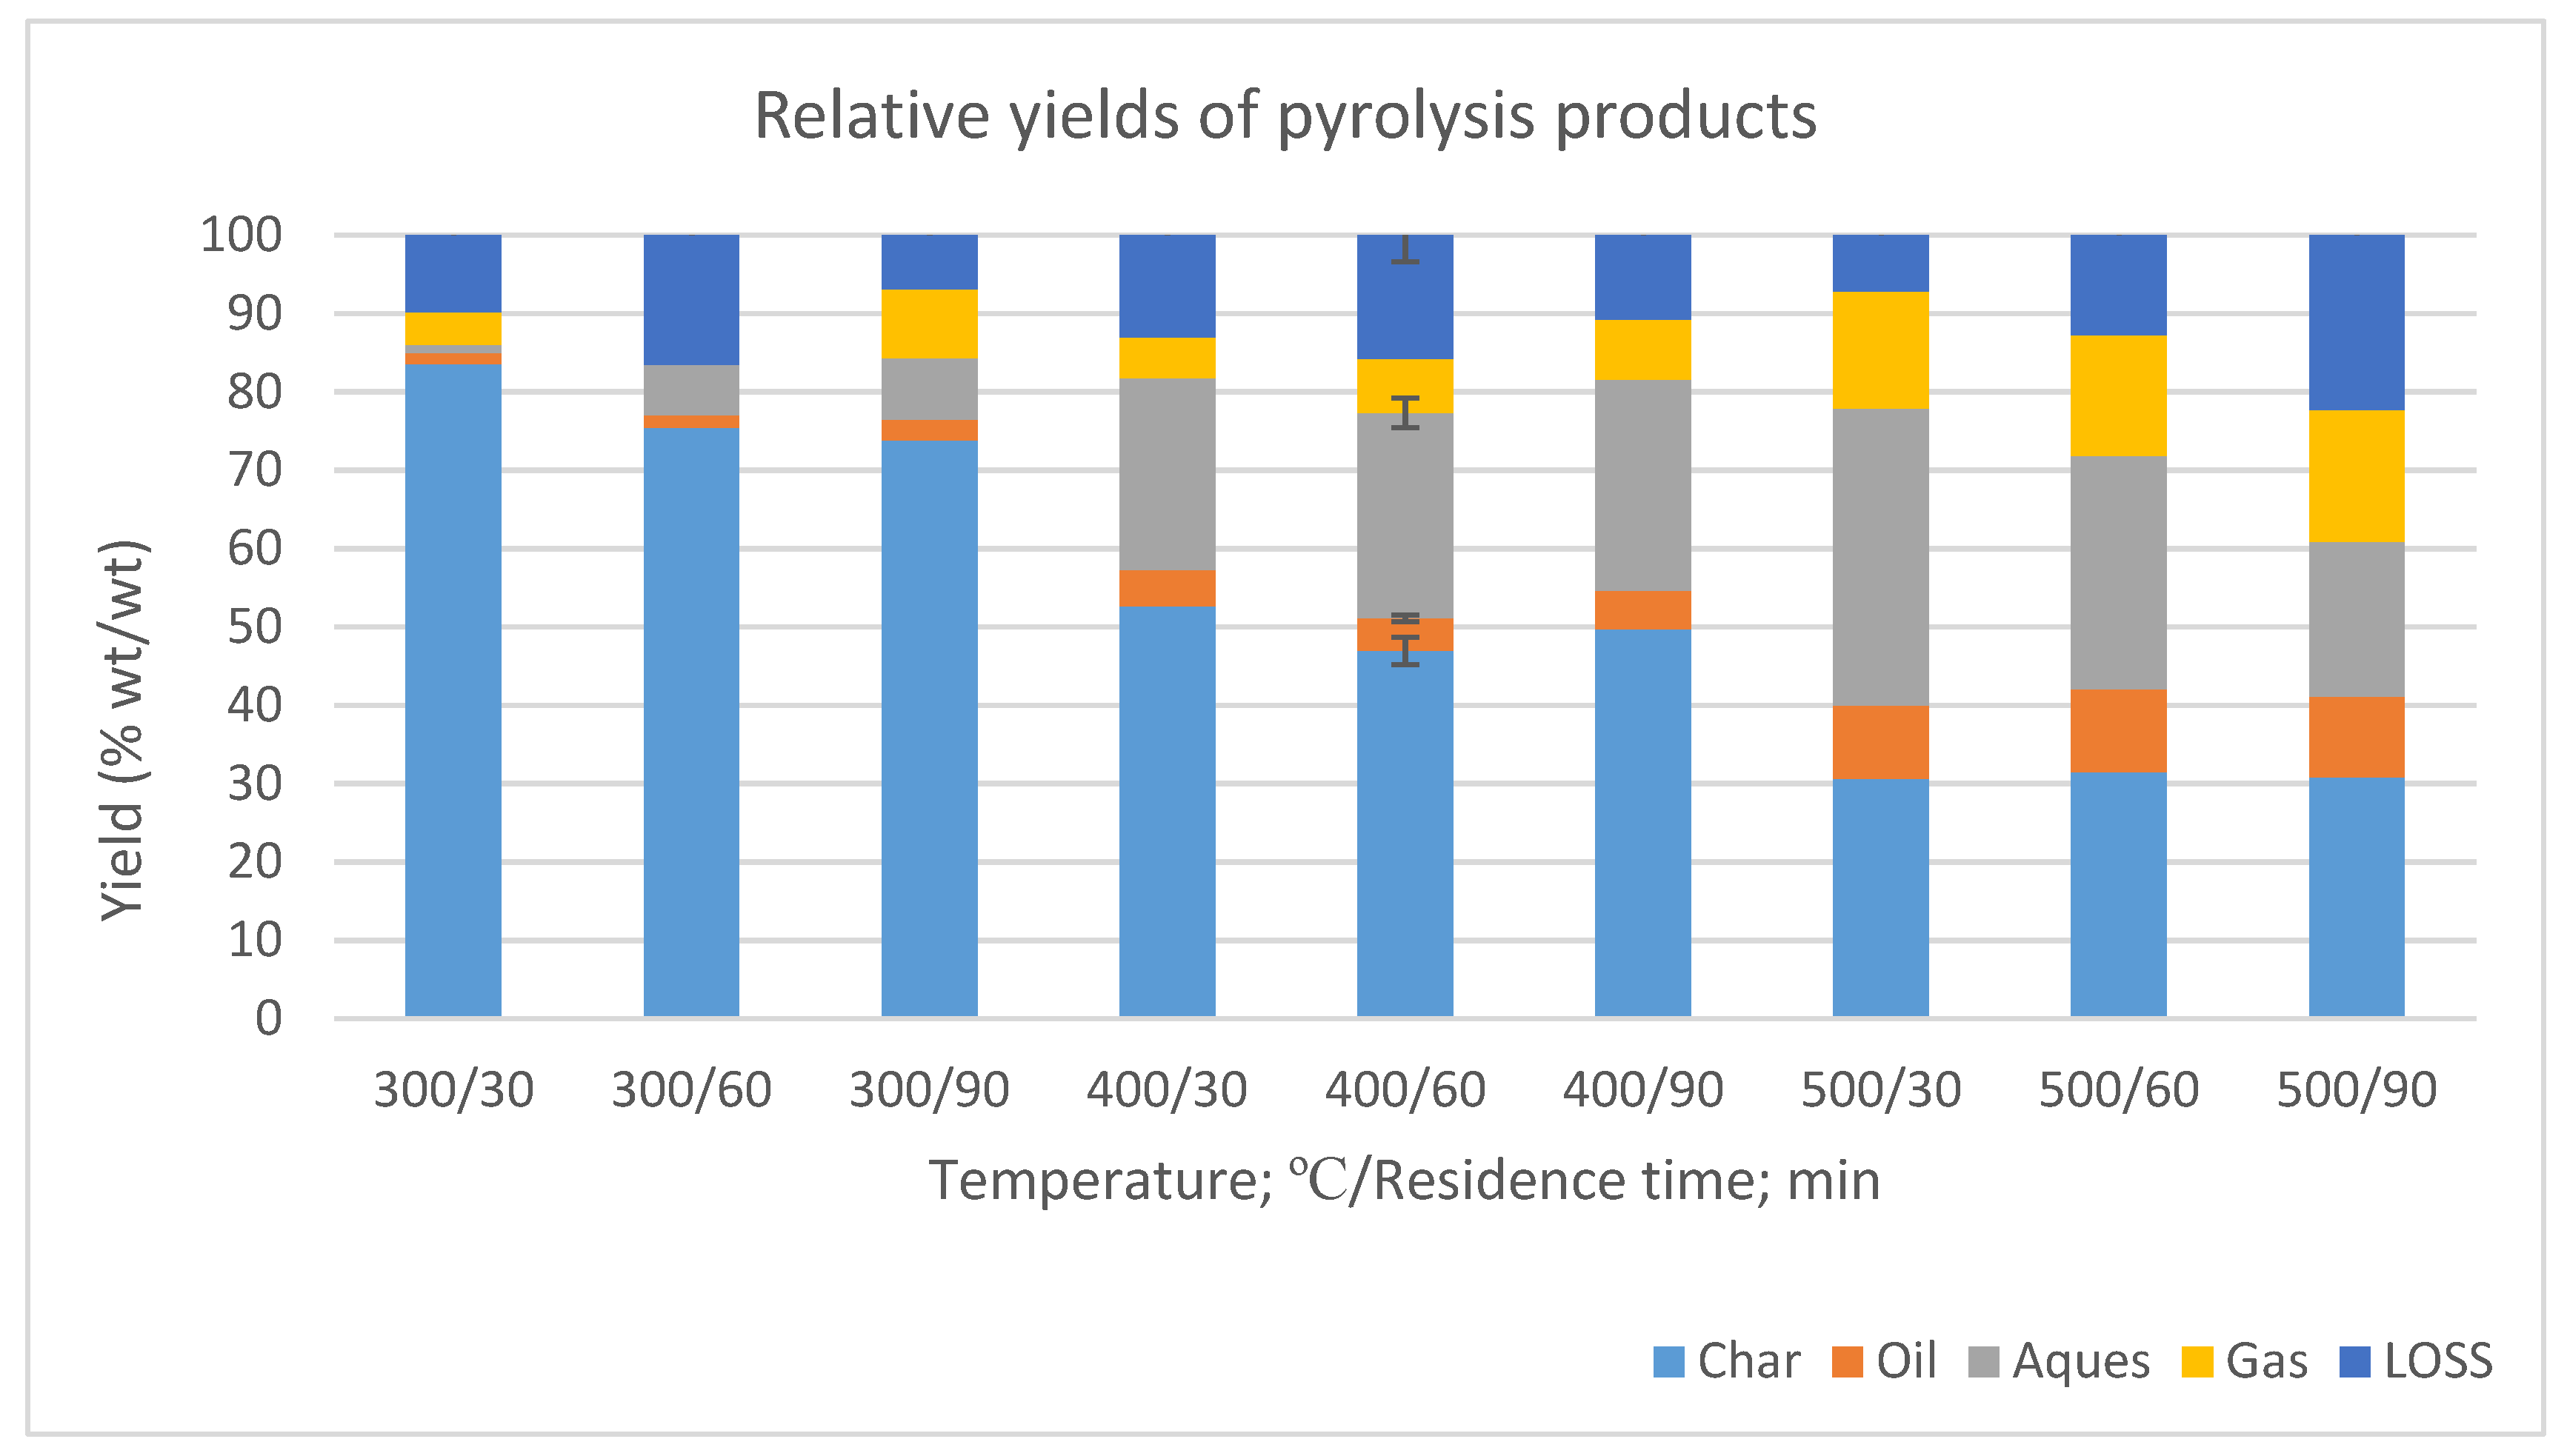
Figure 2 shows the major product yields resulting from the pyrolysis of BLT press cake. Note the superior mass yields from biochar throughout all operating temperatures, with the highest from lower temperature operations (82.8% mass yield at 300 °C and 30 min exposure time). Hence, if biochar production is to be optimized by weight, the temperature conditions should be on the lowest regimes, as compared to the mass yields from jatropha pyrolysis [11]. High biochar yield (around 50%) was obtained from BLT at 400 °C, whereas lower biochar yield was obtained at 500 °C. This also indicates significant recovery of energy from BLT waste in the form of bio-oil at 500 °C, as more bio-oil and gas yields were observed.
The RSM results will define the actual ranges of temperature to be used if this is the ultimate goal. The mass yields from syngas are the next highest value and the lowest mass yields came from the bio-oil portion. However, it was found out in this study that the bio-oil heating value is superior to the syngas heating value.
Figure 2 shows the following basic trend in the production of coproducts:
  • Biochar yield by weight decreased with increasing temperature from a high value of 82.8% (300 °C and 30 min) to a low value of 28.6% (500 °C and 60 min).
  • Bio-oil yield increased as the temperature was increased. The highest bio-oil product yield by weight was found at 12.8% (500 °C and 90 min) and the lowest (2.7%) at the lowest temperature used (300 °C and 30 min).
  • Syngas mass yield increased, as the operating temperature increased from 400 to 500 °C. However, there was no clear trend at lower temperatures (300 °C and 400 °C).
Table 3 and Table 4 show the ANOVA for the effect of biochar and bio-oil being correlated at a range of factors. The proposed model equation is shown in Equation (8). For example, in Table 3, a model F-value of 81.91 implies the model was significant. In this case, there was only a <0.01% chance that the F-value this large could occur due to other factors (or due to noise). Values of “Prob>F” less than 0.05 indicate that model terms were significant. In this case, temperature and the square of temperature were very significant model terms. Values greater than 0.10 indicate model terms were not significant. If there are many insignificant model terms (not counting those required to support the hierarchy), the model reduction may improve the suggested model. The “Lack of Fit F-value” of 0.33 implies factors that were not significant relative to real error. In these results, there was 80.4% chance that a “Lack of Fit F-value” this large could occur due to other factors (or noise). A non-significant lack of fit is good, since we wanted the model to fit appropriately with the factors used for the experimentation.

4.2.1. Proposed Biochar Mass Yield Equation: A Quadratic Model

Equation (8) shows the relationship to optimize the biochar mass yield. The equation, in terms of the actual factors such as temperature and time of exposure, may be used to predict the biochar yield as a function of both pyrolysis temperature and exposure time, and determine the optimal value. Here, the levels should be specified in their original units (°C and minutes) for each factor used, respectively.
Biochar product yield (%) = 255 − 0.68×Temp −0.77 × Time + 0.0008 × Temp × Time + 0.0005 × Temp2 + 0.003 × Time2
When Equation (8) was used, the ranges of mass yields varied from a low value of 28.6% (500 °C and 60 min exposure time) to a high value of 82.8% (300 °C and 30 min residence time). Hence, if biochar is to be optimized by weight, the operating temperature should be the lowest temperature used in these experiments, and it should be associated with the lowest exposure time. This is an excellent combination, as the pyrolysis process requires external heating for continuous decomposition. Thus, if both temperature and residence times are minimal, so does the overall input energy. This would result in a significant reduction in input energy costs.
The decision for optimal product distribution, however, does not depend on the biochar product alone. Bio-oil is another coproduct that produces even higher heating values, as shown in the next section.

4.2.2. Proposed Bio-Oil Mass Yield Equation: A Quadratic Model

Equation (9) shows the relationship to optimize the bio-oil mass yield. The equation, in terms of the actual factors such as temperature and time of exposure, can be used to predict the maximum amount of bio-oil that may be produced as a function of both pyrolysis temperature and exposure time. Likewise, the levels should be specified in their original units for each factor used. Table 4 shows the complete ANOVA analysis results for bio-oil mass yields experiments.
Bio-oil product yield (%) = 12.4 − 0.08 × Temp − 0.0017 × Time − 0.00003 × Temp × Time + 0.00016 × Temp2 + 0.00024 × Time2
When Equation (9) was used over the ranges of temperature and exposure times, the bio-oil mass yields ranged from as low as 2.7% (300 °C and 30 min) to a high of 12.8% (500 °C and 90 min exposure time). The trend was increasing at higher operating temperature and exposure times.
While it is important to optimize the mass yield of bio-oil, using Equation (9), it is also equally important to know the corresponding heating value of the final produced oil at various temperatures and exposure times to evaluate the proper future feasibility project. The reason for this is the fact that bio-oil contained two fractions, the aqueous (minimal heating value) and the organic fractions (very high heating value) and hence, weight alone will not justify the proper project directions. Instead, the quality of the bio-oil is equally important as it could affect fuel spray [19] leading to reduced fuel efficiency. Shown in the next section will be the proper way of optimizing product yields, that is, to evaluate the product relationship in terms of their high heating value (HHV) or energy content.
Similar to the biochar yield relationship, bio-oil production is also a strong function of temperature and exposure time for the BLT press cake. In this relationship, the higher the temperature, the higher is the mass yield of bio-oil.

4.3. Pyrolysis Product Properties

4.3.1. Liquid Product

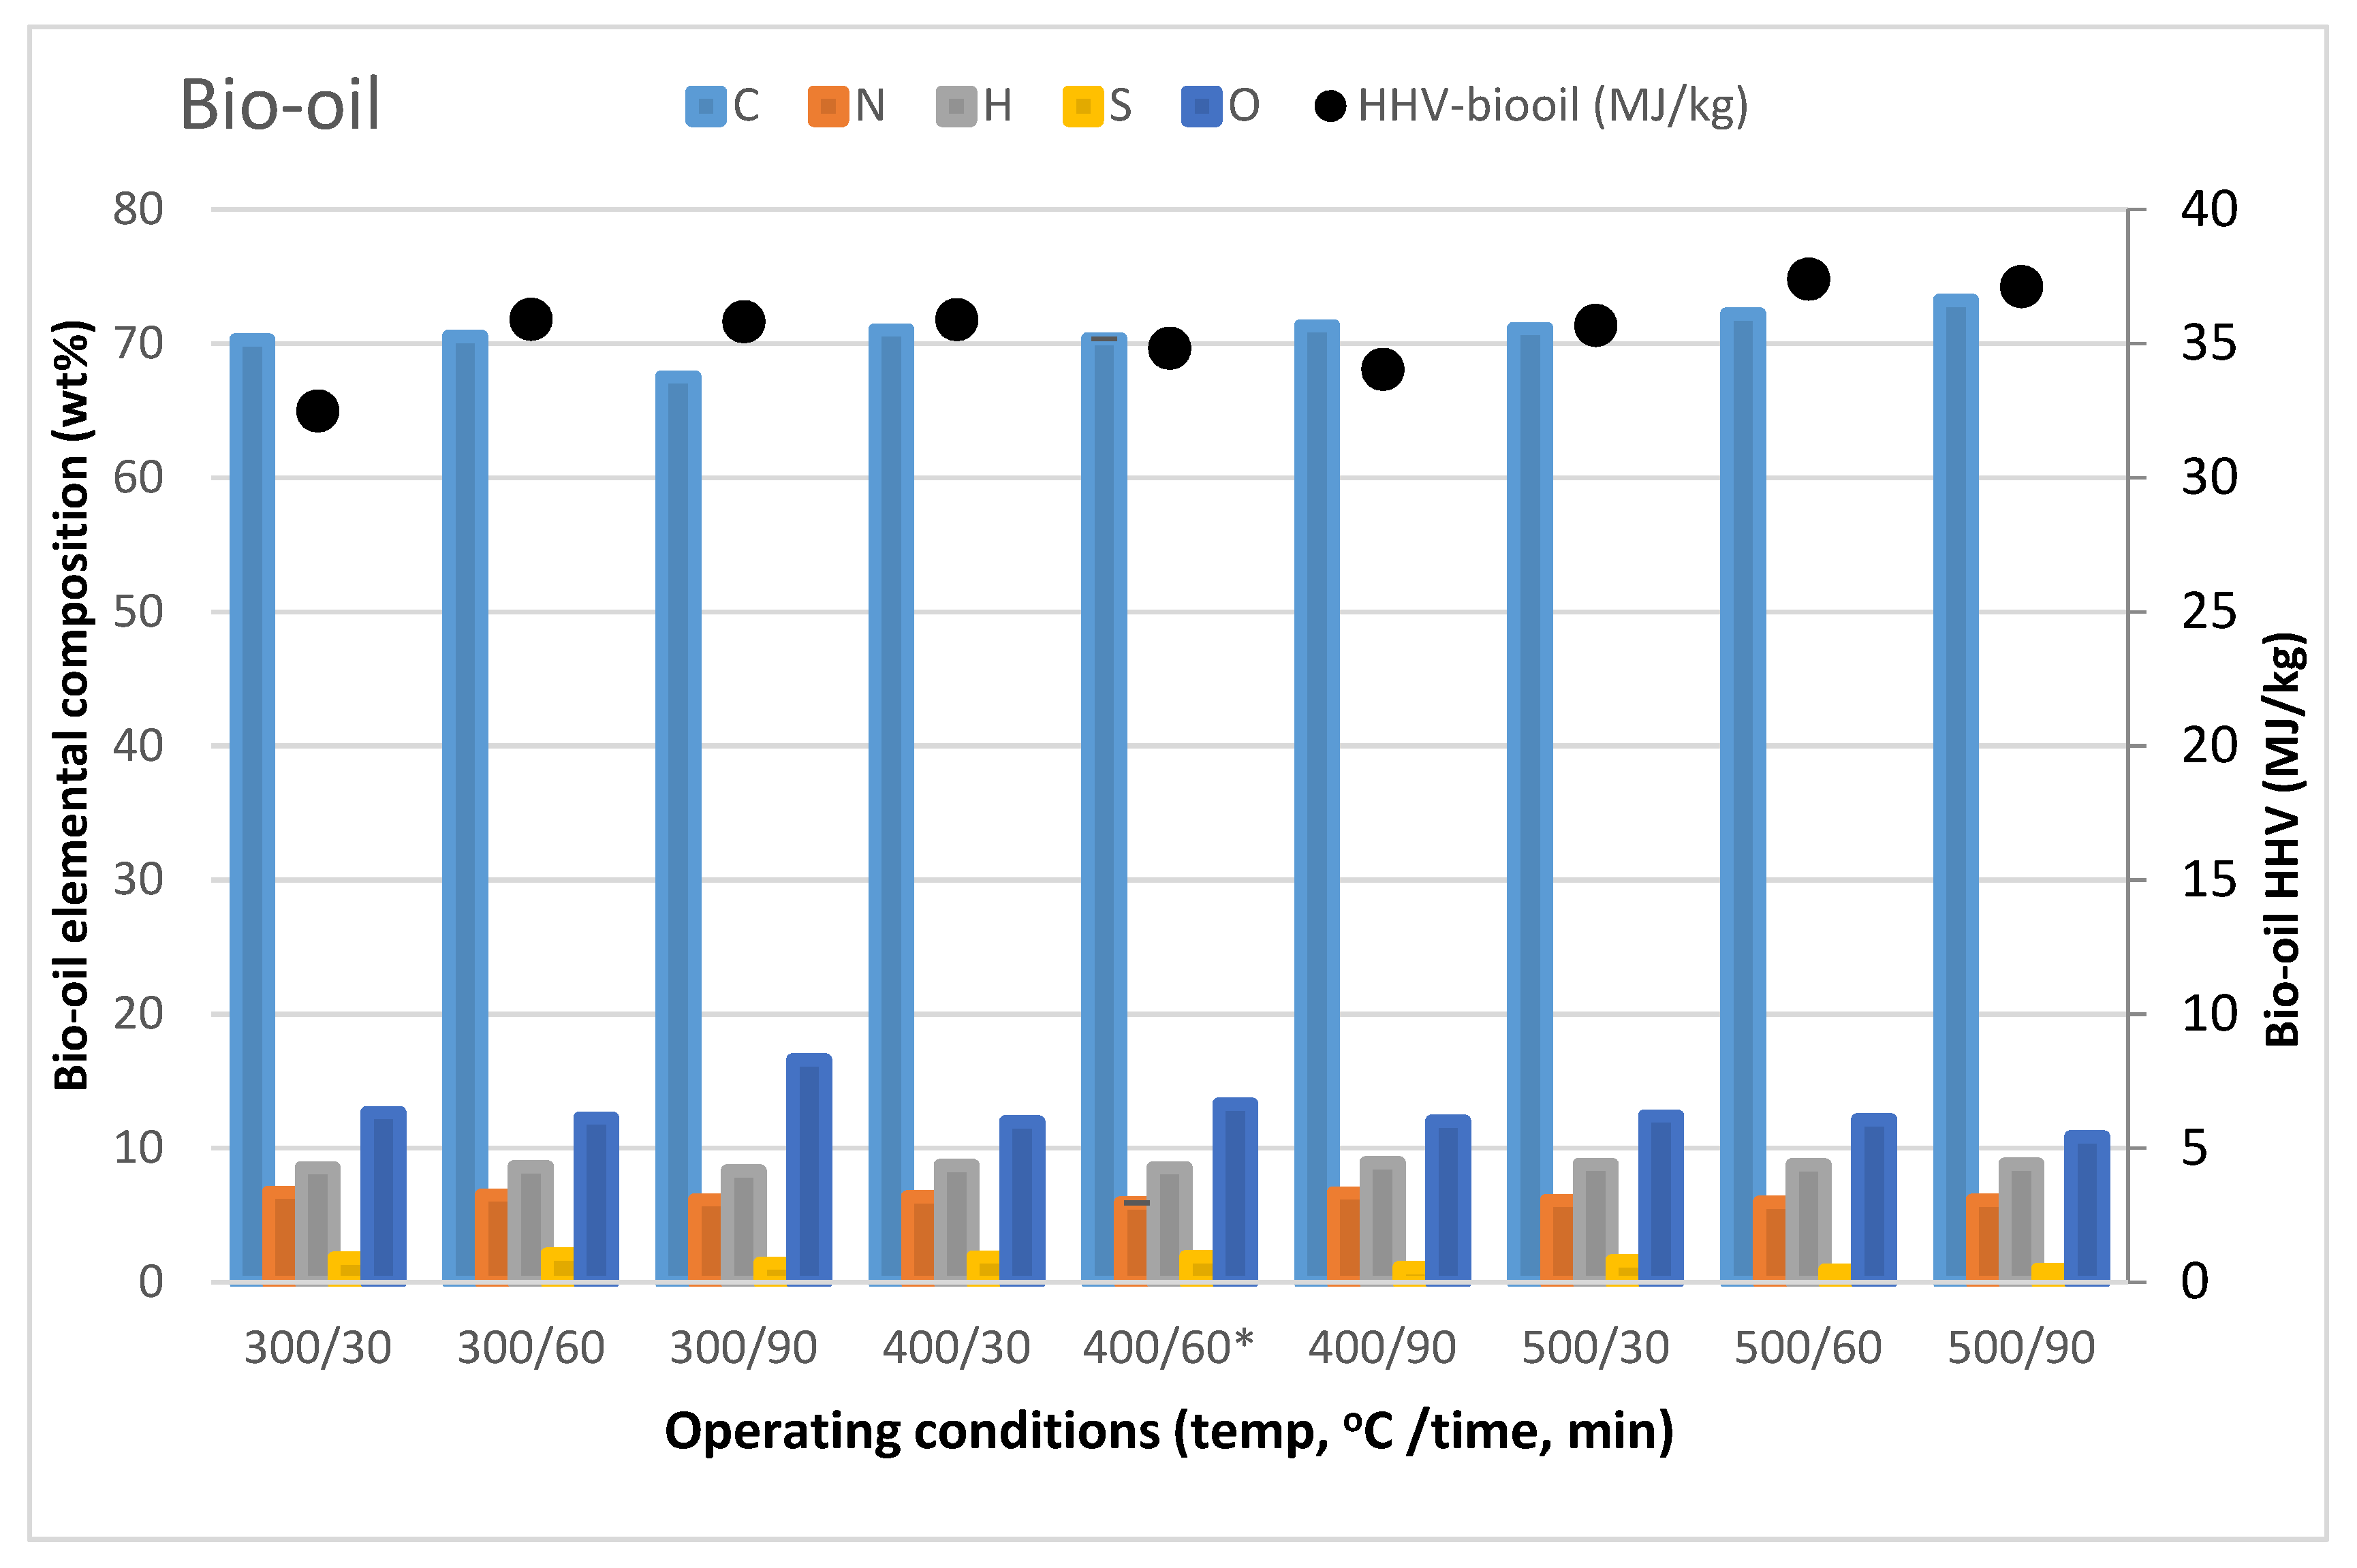
Figure 3 shows the bio-oil elemental composition and the corresponding heating value of the produced bio-oil. Note the ANOVA analysis in Table 5 indicating no significant differences in the bio-oil heating value throughout the range of temperature and exposure time used. Hence, we will not introduce a predictive equation for bio-oil heating value relationship as a function of operating temperature and exposure time. At any operating temperature, the organic fraction of the bio-oil will have consistent high energy content.
The bio-oil product has superior high heating value with an average of approximately 35.4 MJ kg−1, as shown on actual measured values shown in Table 6. If one were to determine the percentage contribution of energy from the bio-oil using Equation (9) (% bio-oil product by weight) and the results of high heating value analysis from Table 6, the energy contained in the bio-oil at the highest yield of around 12.8% by weight will be around 22.4% of the energy from the press cake and 13.8% of the energy from the original BLT oil seed. This condition is at an operating temperature of 500 °C and an exposure time of 90 min.
While the heating value of the bio-oil was relatively higher compared with the biochar, its mass yield was quite low. Hence, the recovered energy from the biochar will be much larger.

4.3.2. Biochar

Table 7 shows the proximate and high heating value analysis results of the BLT pyrolyzed biochar samples. Note the trend in the volatile combustible matter (VCM) produced at the ranges of temperature used. The VCM is at its highest at the lowest operating temperature and continue to decrease at higher temperature and longer residence time. This is the opposite trend compared with the fixed carbon content of biochar. From the raw data, the heating value was maximized at an operating temperature of 400 °C and exposure time of 90 min. This result is quite different from other biomass samples where the HHV of biochar is decreased as operating temperature is increased [20,21]. One reason for this trend is the fact that the ash content of the biochar was significantly higher at very high operating temperature, also shown in Table 7. The energy content of the resulting biochar product was never higher than the original BLT seed samples used prior to oil extraction (Table 2).
The predictive equation showing the effect of temperature and exposure time on the heating value of biochar is given in Equation (10). The equation was likewise quadratic. The corresponding ANOVA results are shown in Table 8.
Biochar HHV (MJ kg−1) = −24.7 + 0.225 × Temp + 0.167 × Time − 0.00027 × Temp × Time − 0.00024 × Temp2 − 0.000347 × Time2
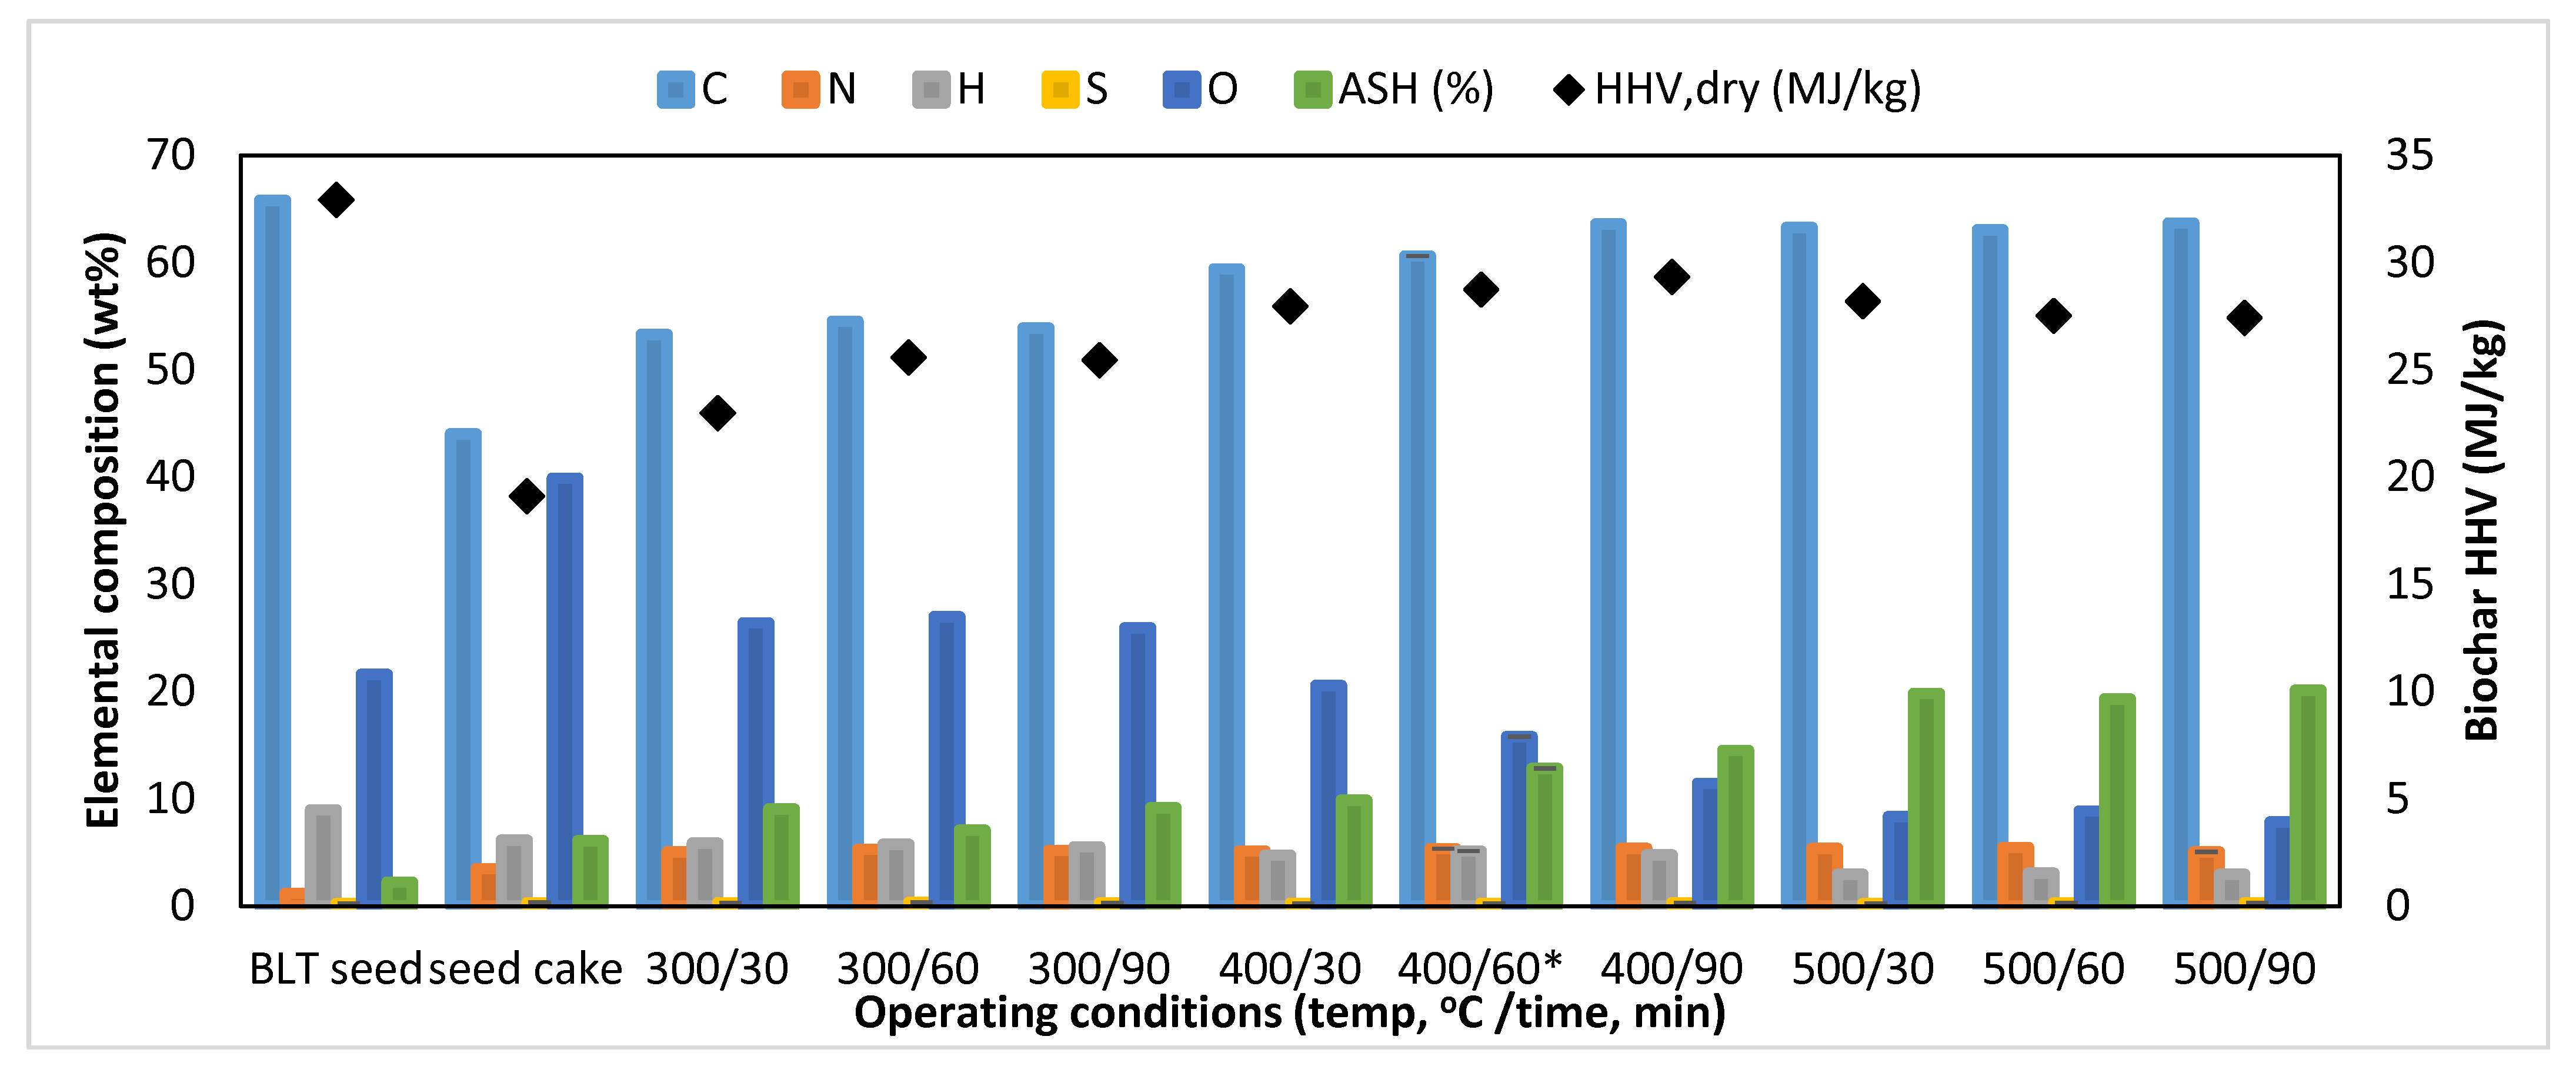
Figure 4 shows the elemental composition of the biochar samples showing significantly high carbon content (light blue) through all ranges of operating temperature used. There is, however, a slight increase in the carbon content of the biochar samples as operating temperature was increased with maximum at the highest operating temperature of 500 °C. This trend was also consistent with the trend in the variations in fixed carbon based on the proximate analysis (Table 6).
The oxygen and hydrogen content of biochar samples decreased with increasing operating temperature. These elements could have been released with the volatile components of the char during the pyrolysis process. This is a common trend in many similar studies [22,23]. The ash content was around 10% up to a heating temperature of 300 °C, but its proportion increased to more than 20% at 500 °C.
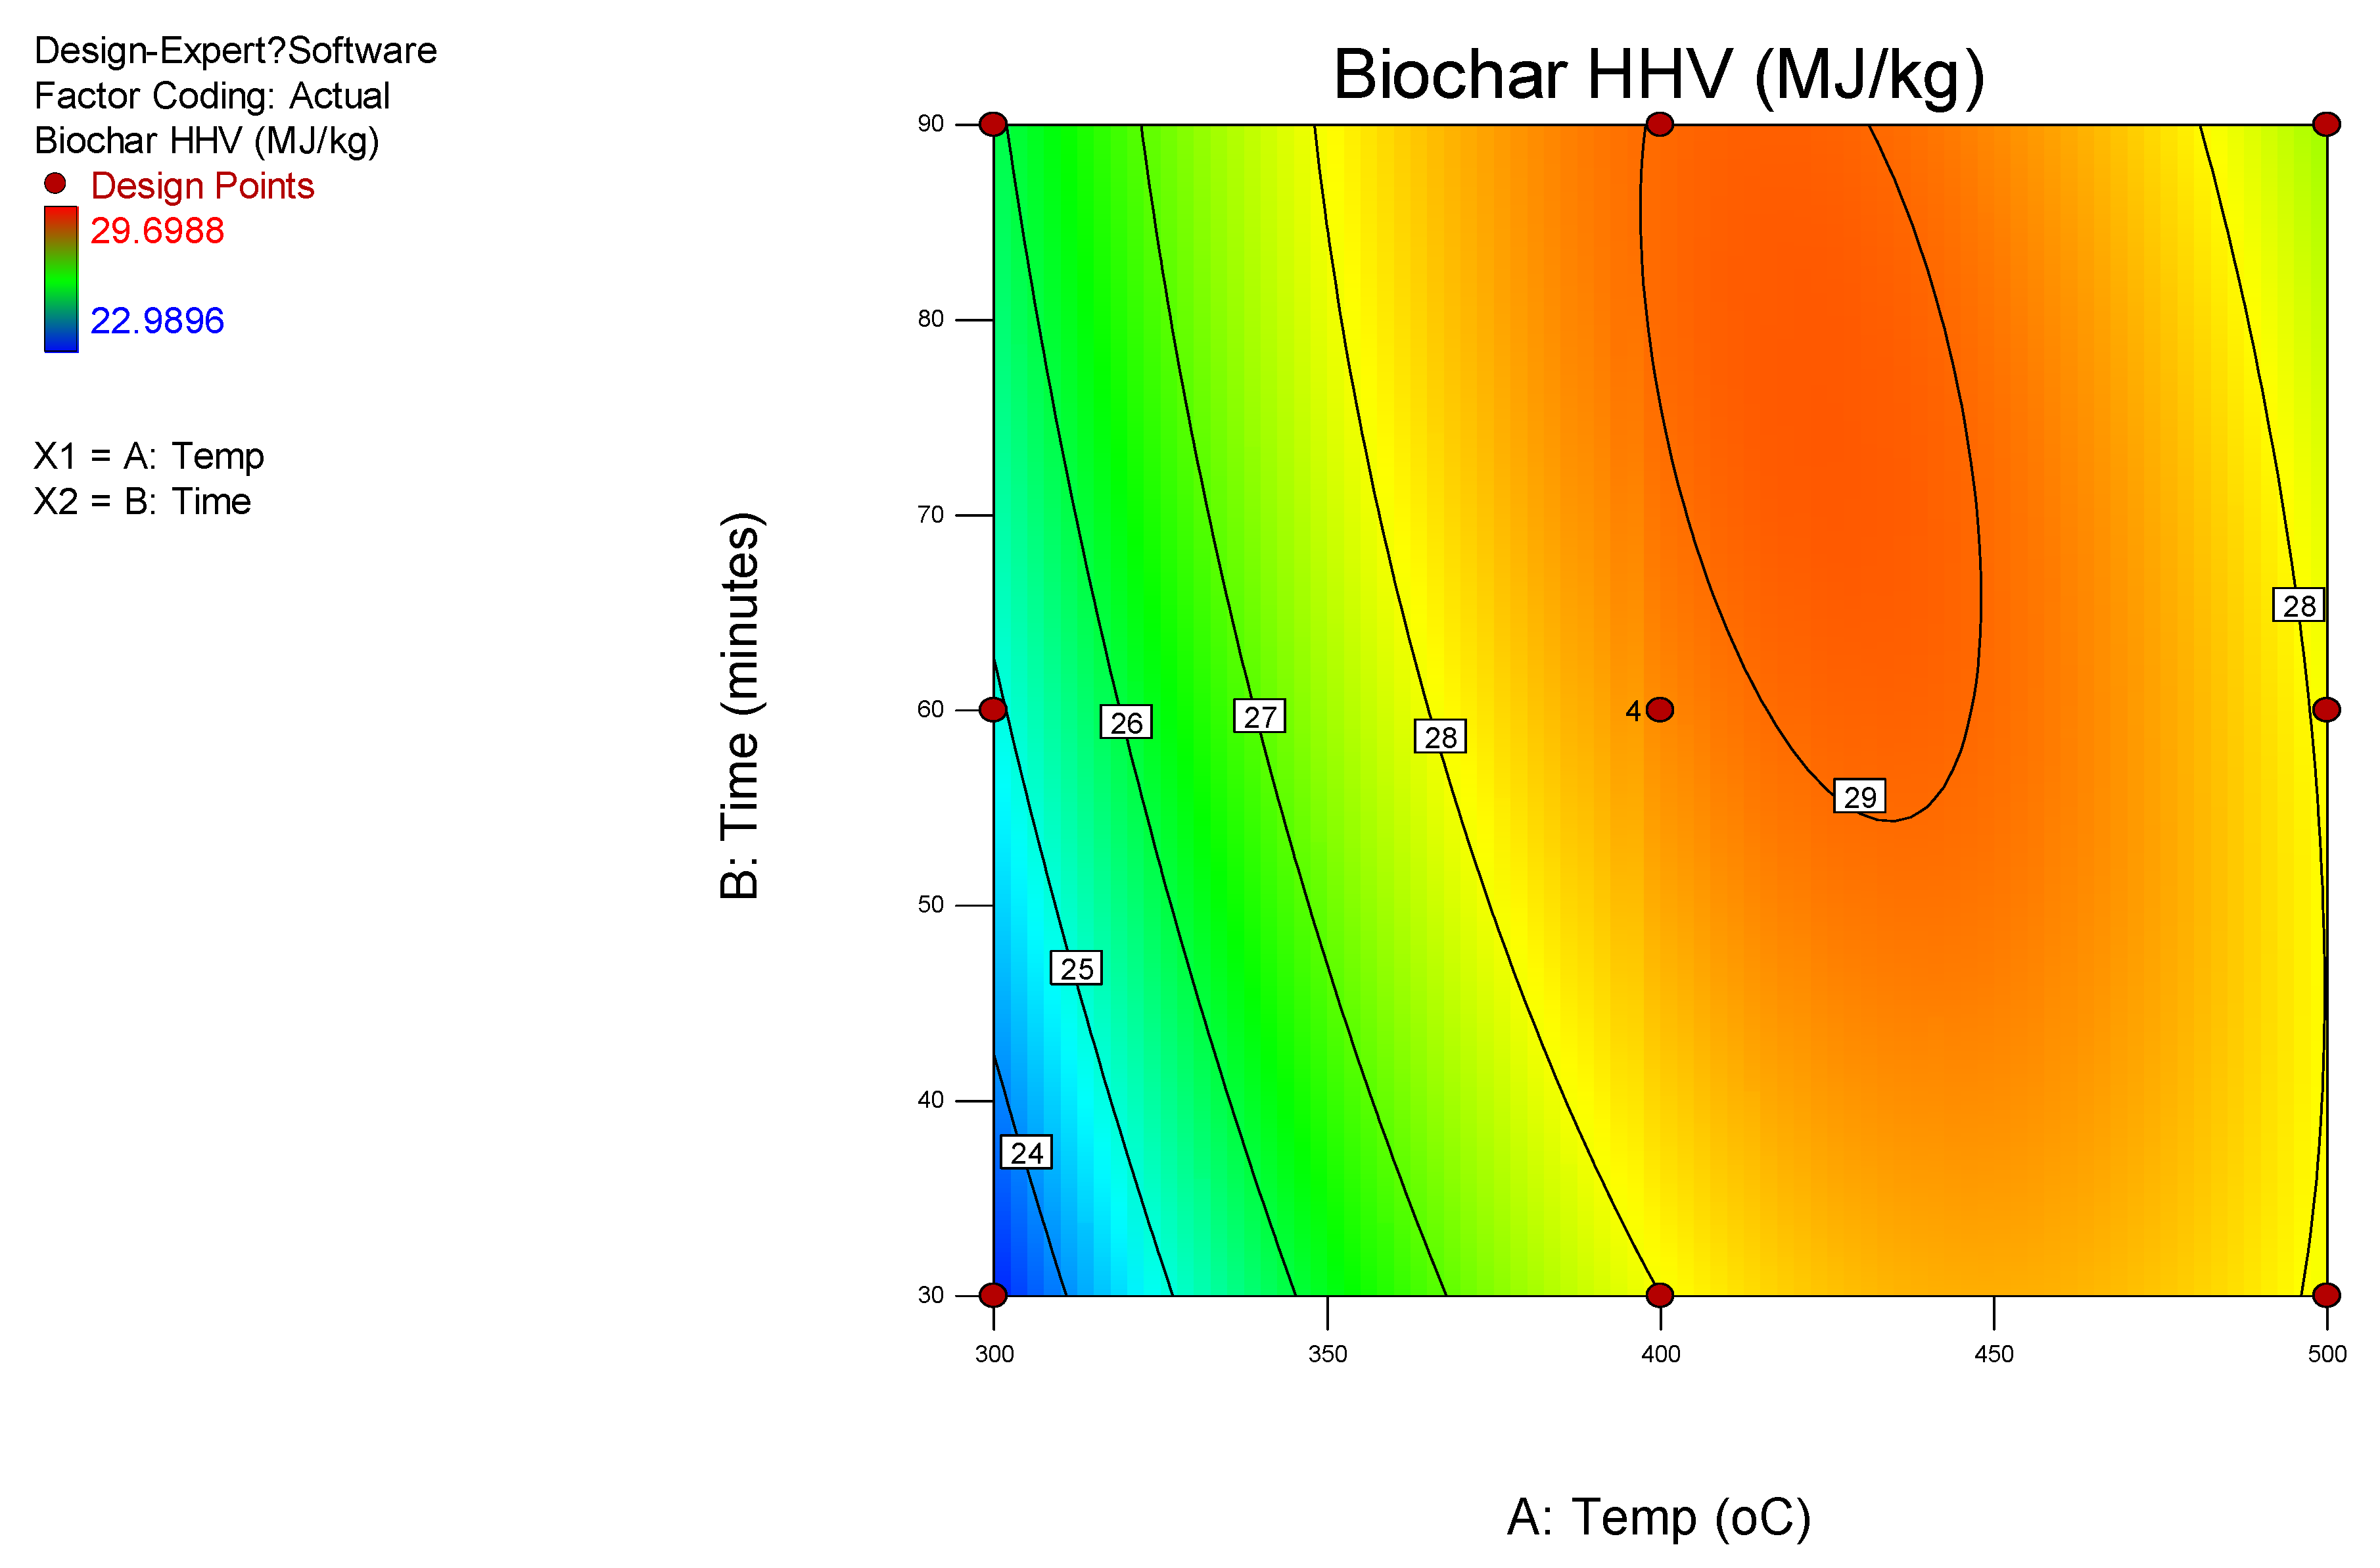
Figure 5 shows the optimal region for biochar production showing ranges of operating temperature and exposure time for optimized biochar product with the highest heating value. This region was between 400 to 450 °C and exposure time between 60 to 90 min. The optimized point is at 425 °C with an exposure time of 75 min. This is clearly shown in Figure 5. At this optimal condition, the biochar would have a HHV of 29.5 MJ kg−1. Mass yield at this condition is about 40.9% (or 0.409 kg biochar/kg seed cake) yielding an energy of 12 MJ per kg of press cake, which was about 56.6% of the energy of the seed cake or 34.9% of the original BLT oil seed. This was a significant energy recovery from the biochar product.
If the main goal of the conversion process is the production of biochar with the highest heating value, these should be the ranges of operating conditions that should be observed and the optimal point condition. Earlier, we mentioned that biochar yield is optimized at the lowest temperature. While one will get high mass yield at lower operating temperatures, the biochar produced at this temperature will have lower heating value. Hence, this shows the importance of optimization in the energy balance section of this study.

4.3.3. Van Krevelen Plot of Pyrolysis Coproducts

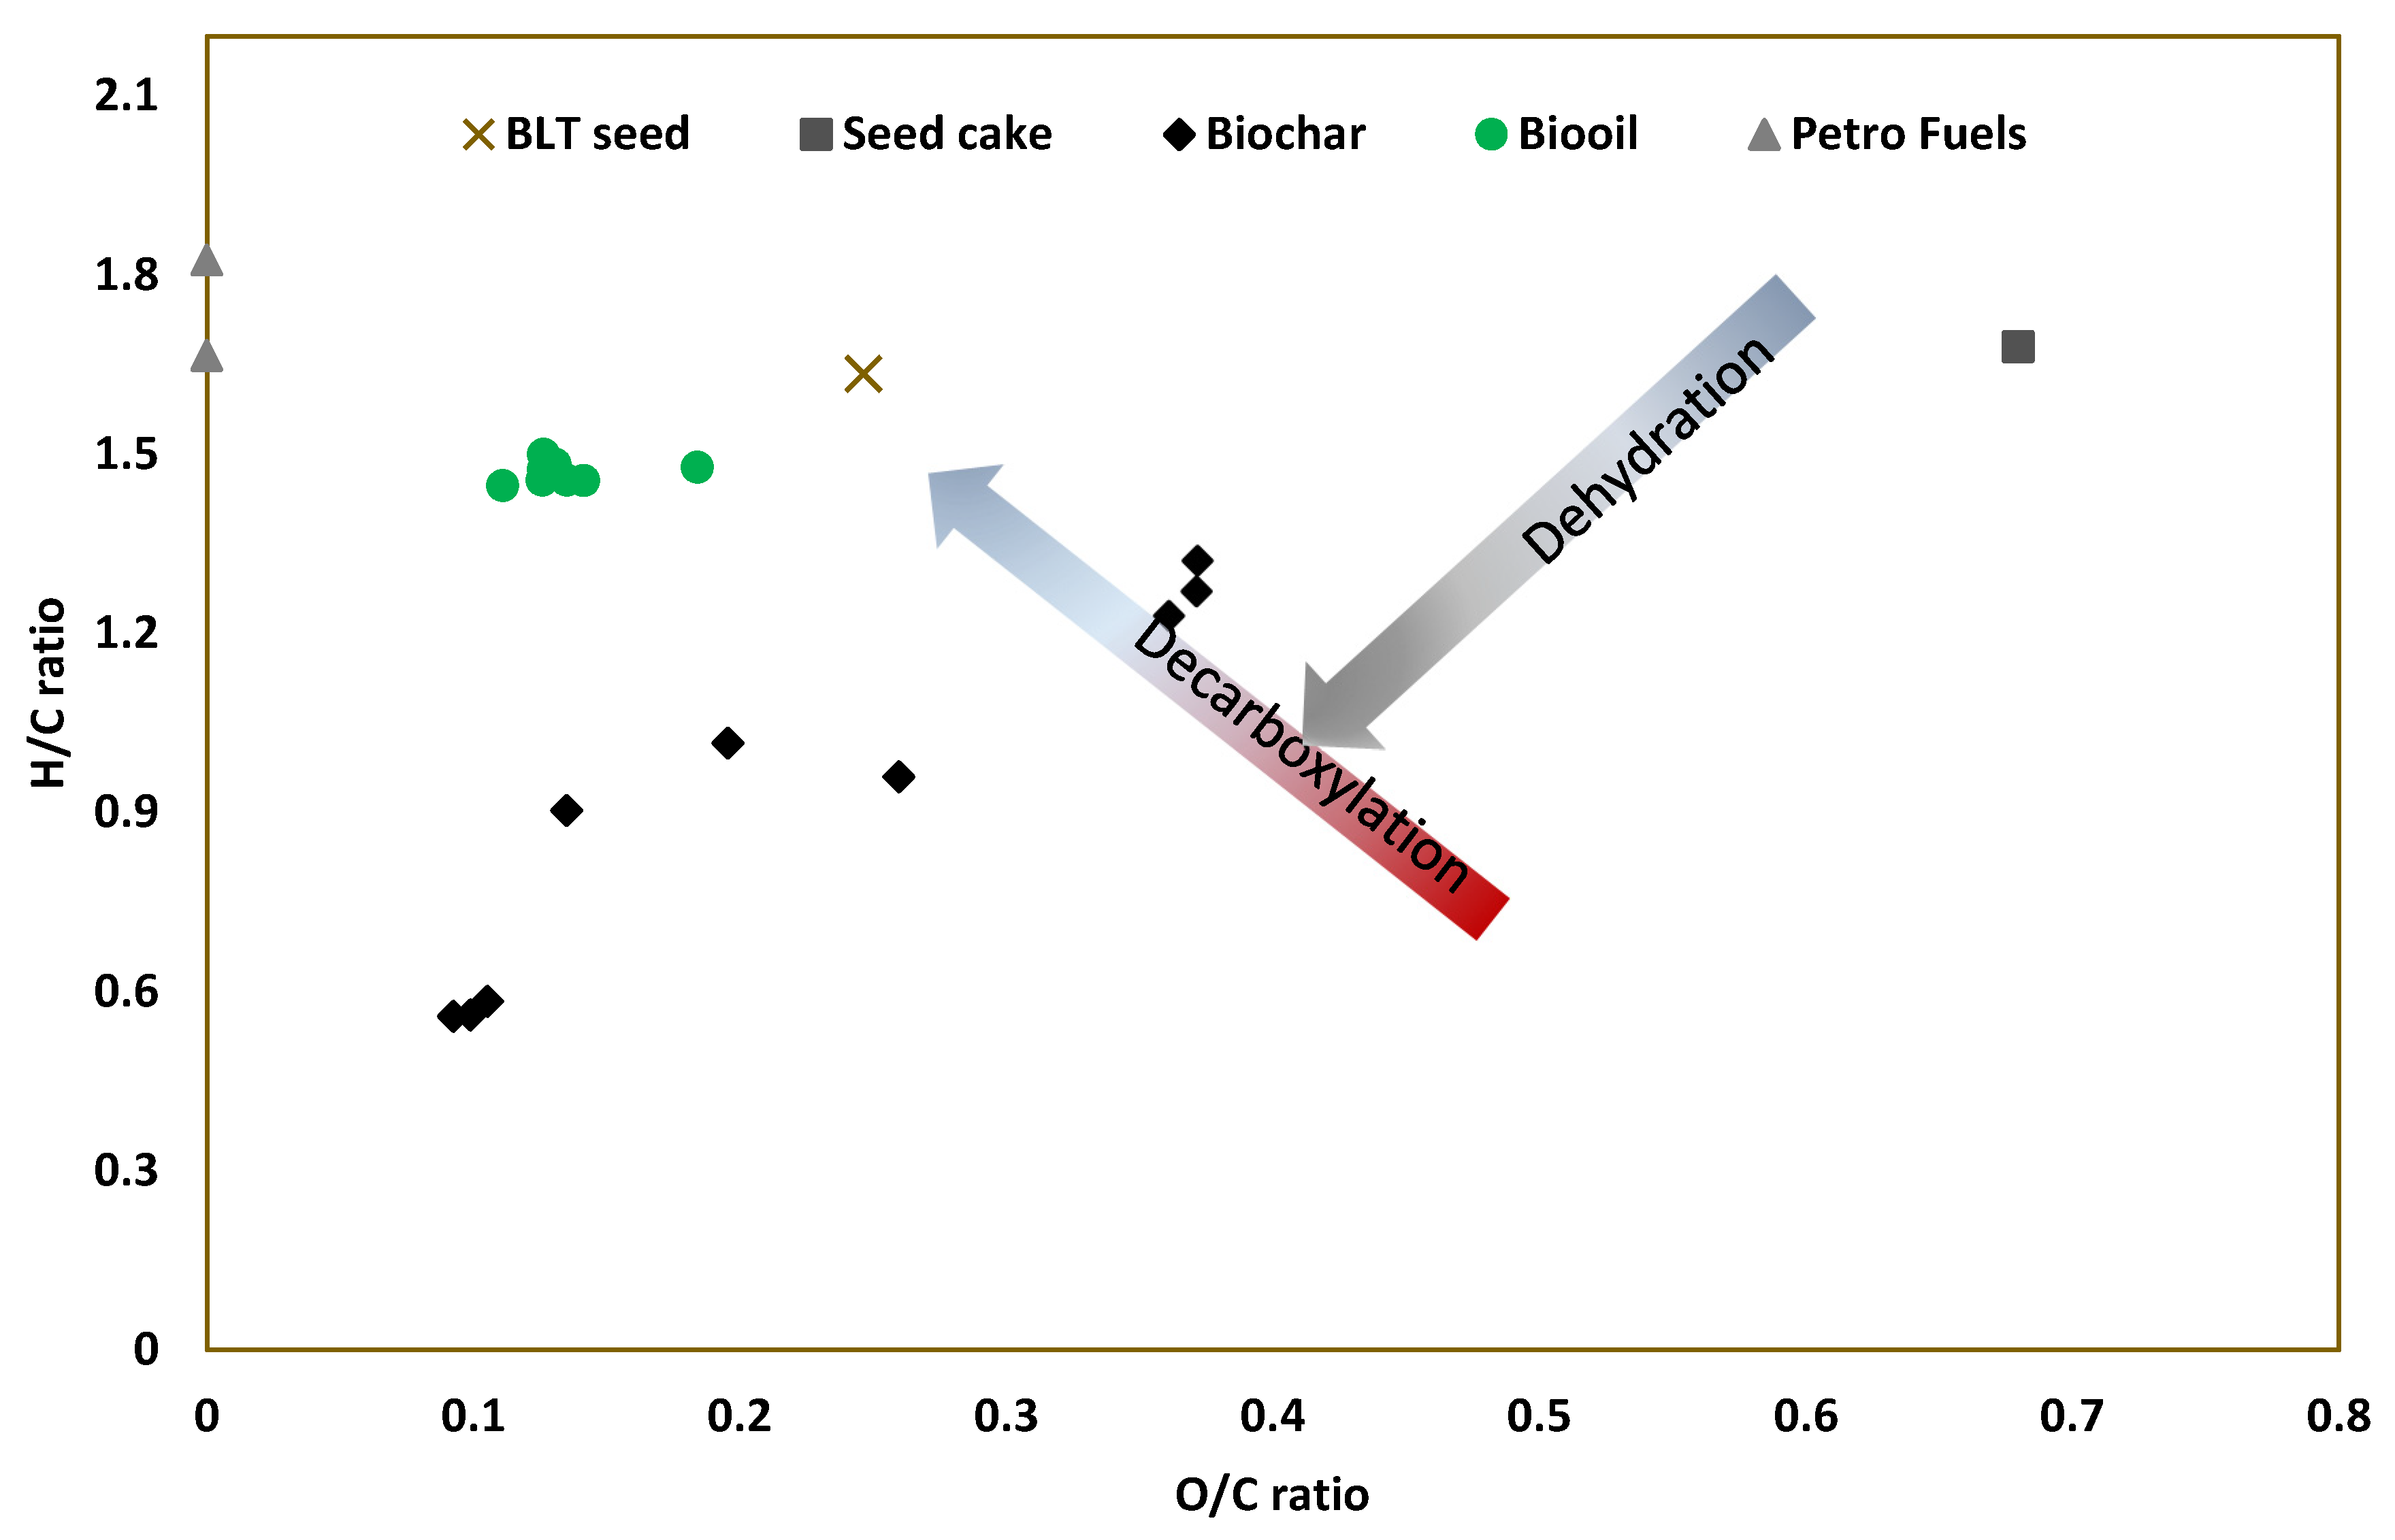
Van Krevelen plot is an interesting way of depicting the improvements of the co-products against fossil-fuel-based materials. Shown in Figure 6 is the Van Krevelen plot for the data resulting from this study. Following is an interesting description of the materials evaluated:
  • BLT oil seed had superior properties than the seed cake. BLT oil seed had a lower O/C ratio to begin with even though both have similar H/C ratios.
  • The bio-oil products had superior properties than the biochar, demonstrating closest properties with petroleum-based-fuels. Hence, a little product upgrade will generate conventional biofuels like gasoline and diesel.
  • The properties of biochar samples approach those of high-grade coal [14]. Usually, high-grade coal was in the lower left quadrant of the Van Krevelen plot. Hence, the biochar produced in this process may be easily cofired with coal.
  • Note how dehydration (removal of moisture) and decarboxylation (carbon reduction relative to hydrogen) affected the behavior of coproducts. The bio-oil had higher atomic H/C ratio than the biochar.
  • The higher the operating temperature the better the qualities of the biochar. This process is important, if the BLT oil seed cake press biochar is used to replace coal products.

4.4. Energy Balance

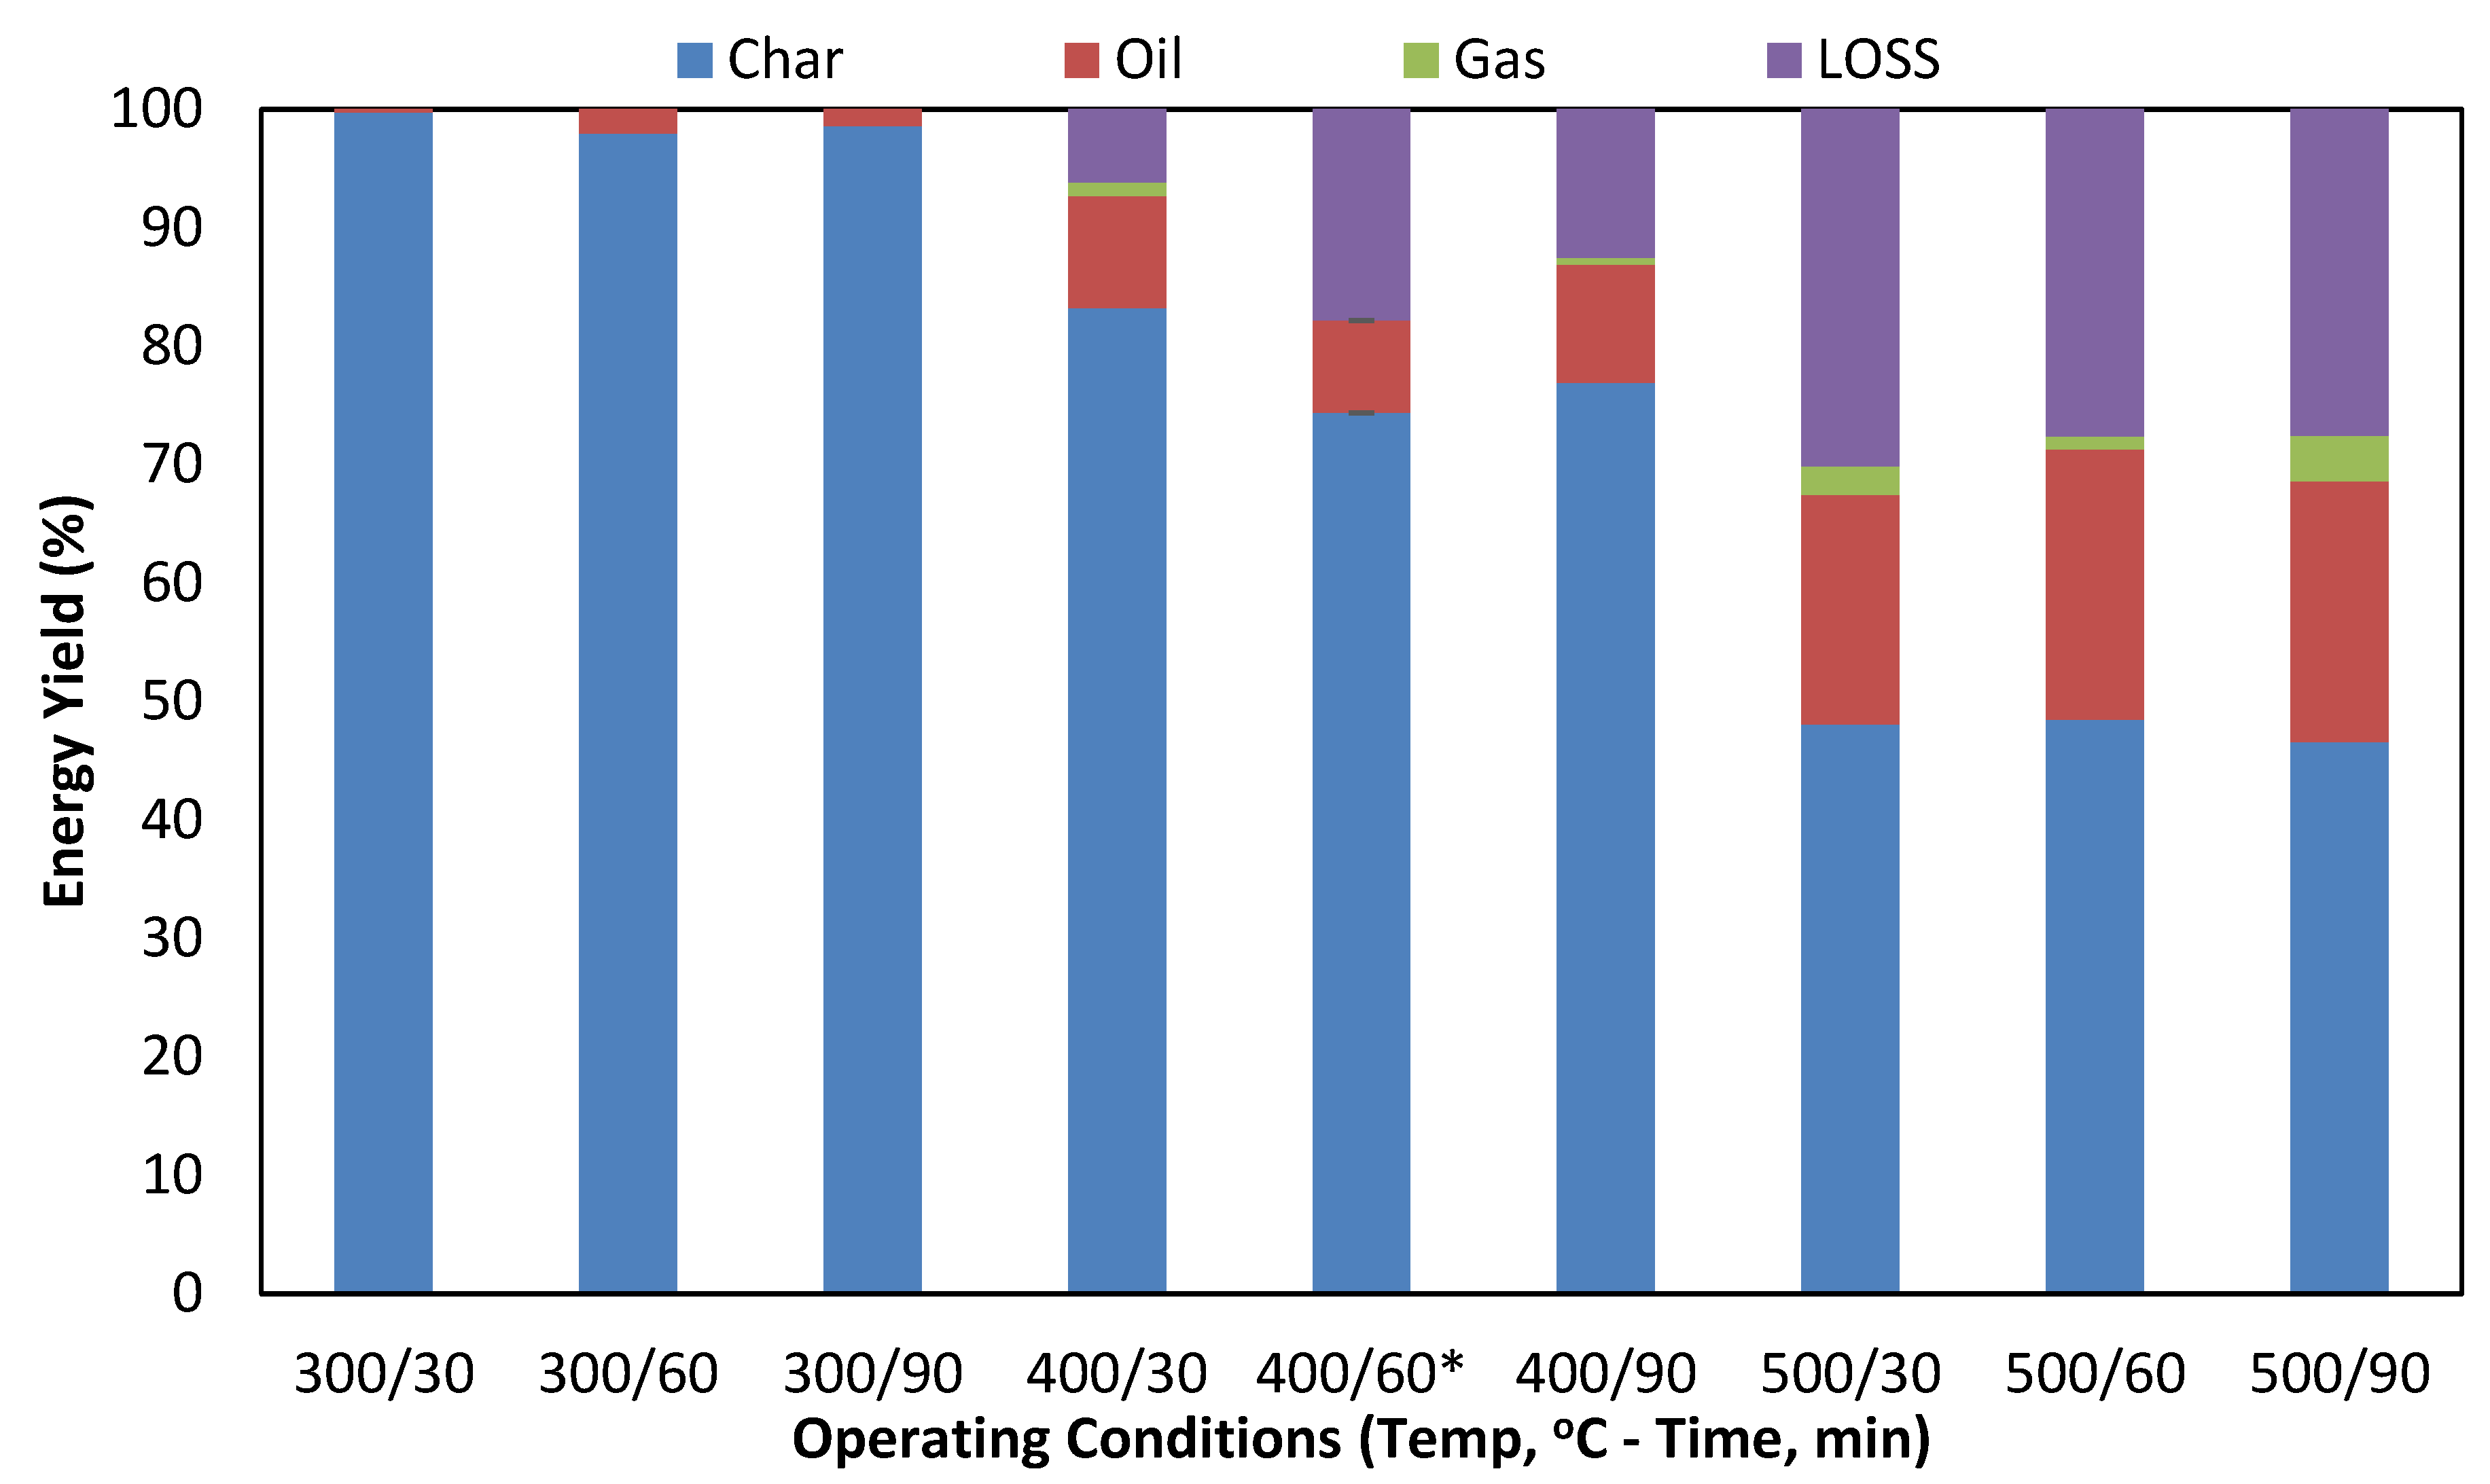
The overall energy balance for this study showed the distribution of energy to the biochar, bio-oil and syngas and is shown in Figure 7. Observe the significant distribution of total energy to the biochar. Clearly, the ideal operating temperature to optimize recoverable mass and energy of the biochar for this pyrolysis process was at the lowest temperature of 300 °C and exposure time of 30 min. At this condition, about 91.3% of the energy of the original seed cake was recovered in the biochar or 56.7% of the energy from the original BLT oil seed (dry basis). Likewise, at this condition, the energy contribution from the bio-oil was still quite significant and rather minimal from the gaseous syngas product. Hence, we will not include the total energy recovery analysis from the syngas coproduct in further analysis.
In this study we focused mainly on energy recovery. However, consideration should be given to examining the properties of biochar resulting from different operating conditions, as biochar is an extremely valuable material for water filtration, battery manufacturing and to improve soil health. Characterizing the resulting biochar will help find additional uses and hence increased revenue from pyrolysis products.
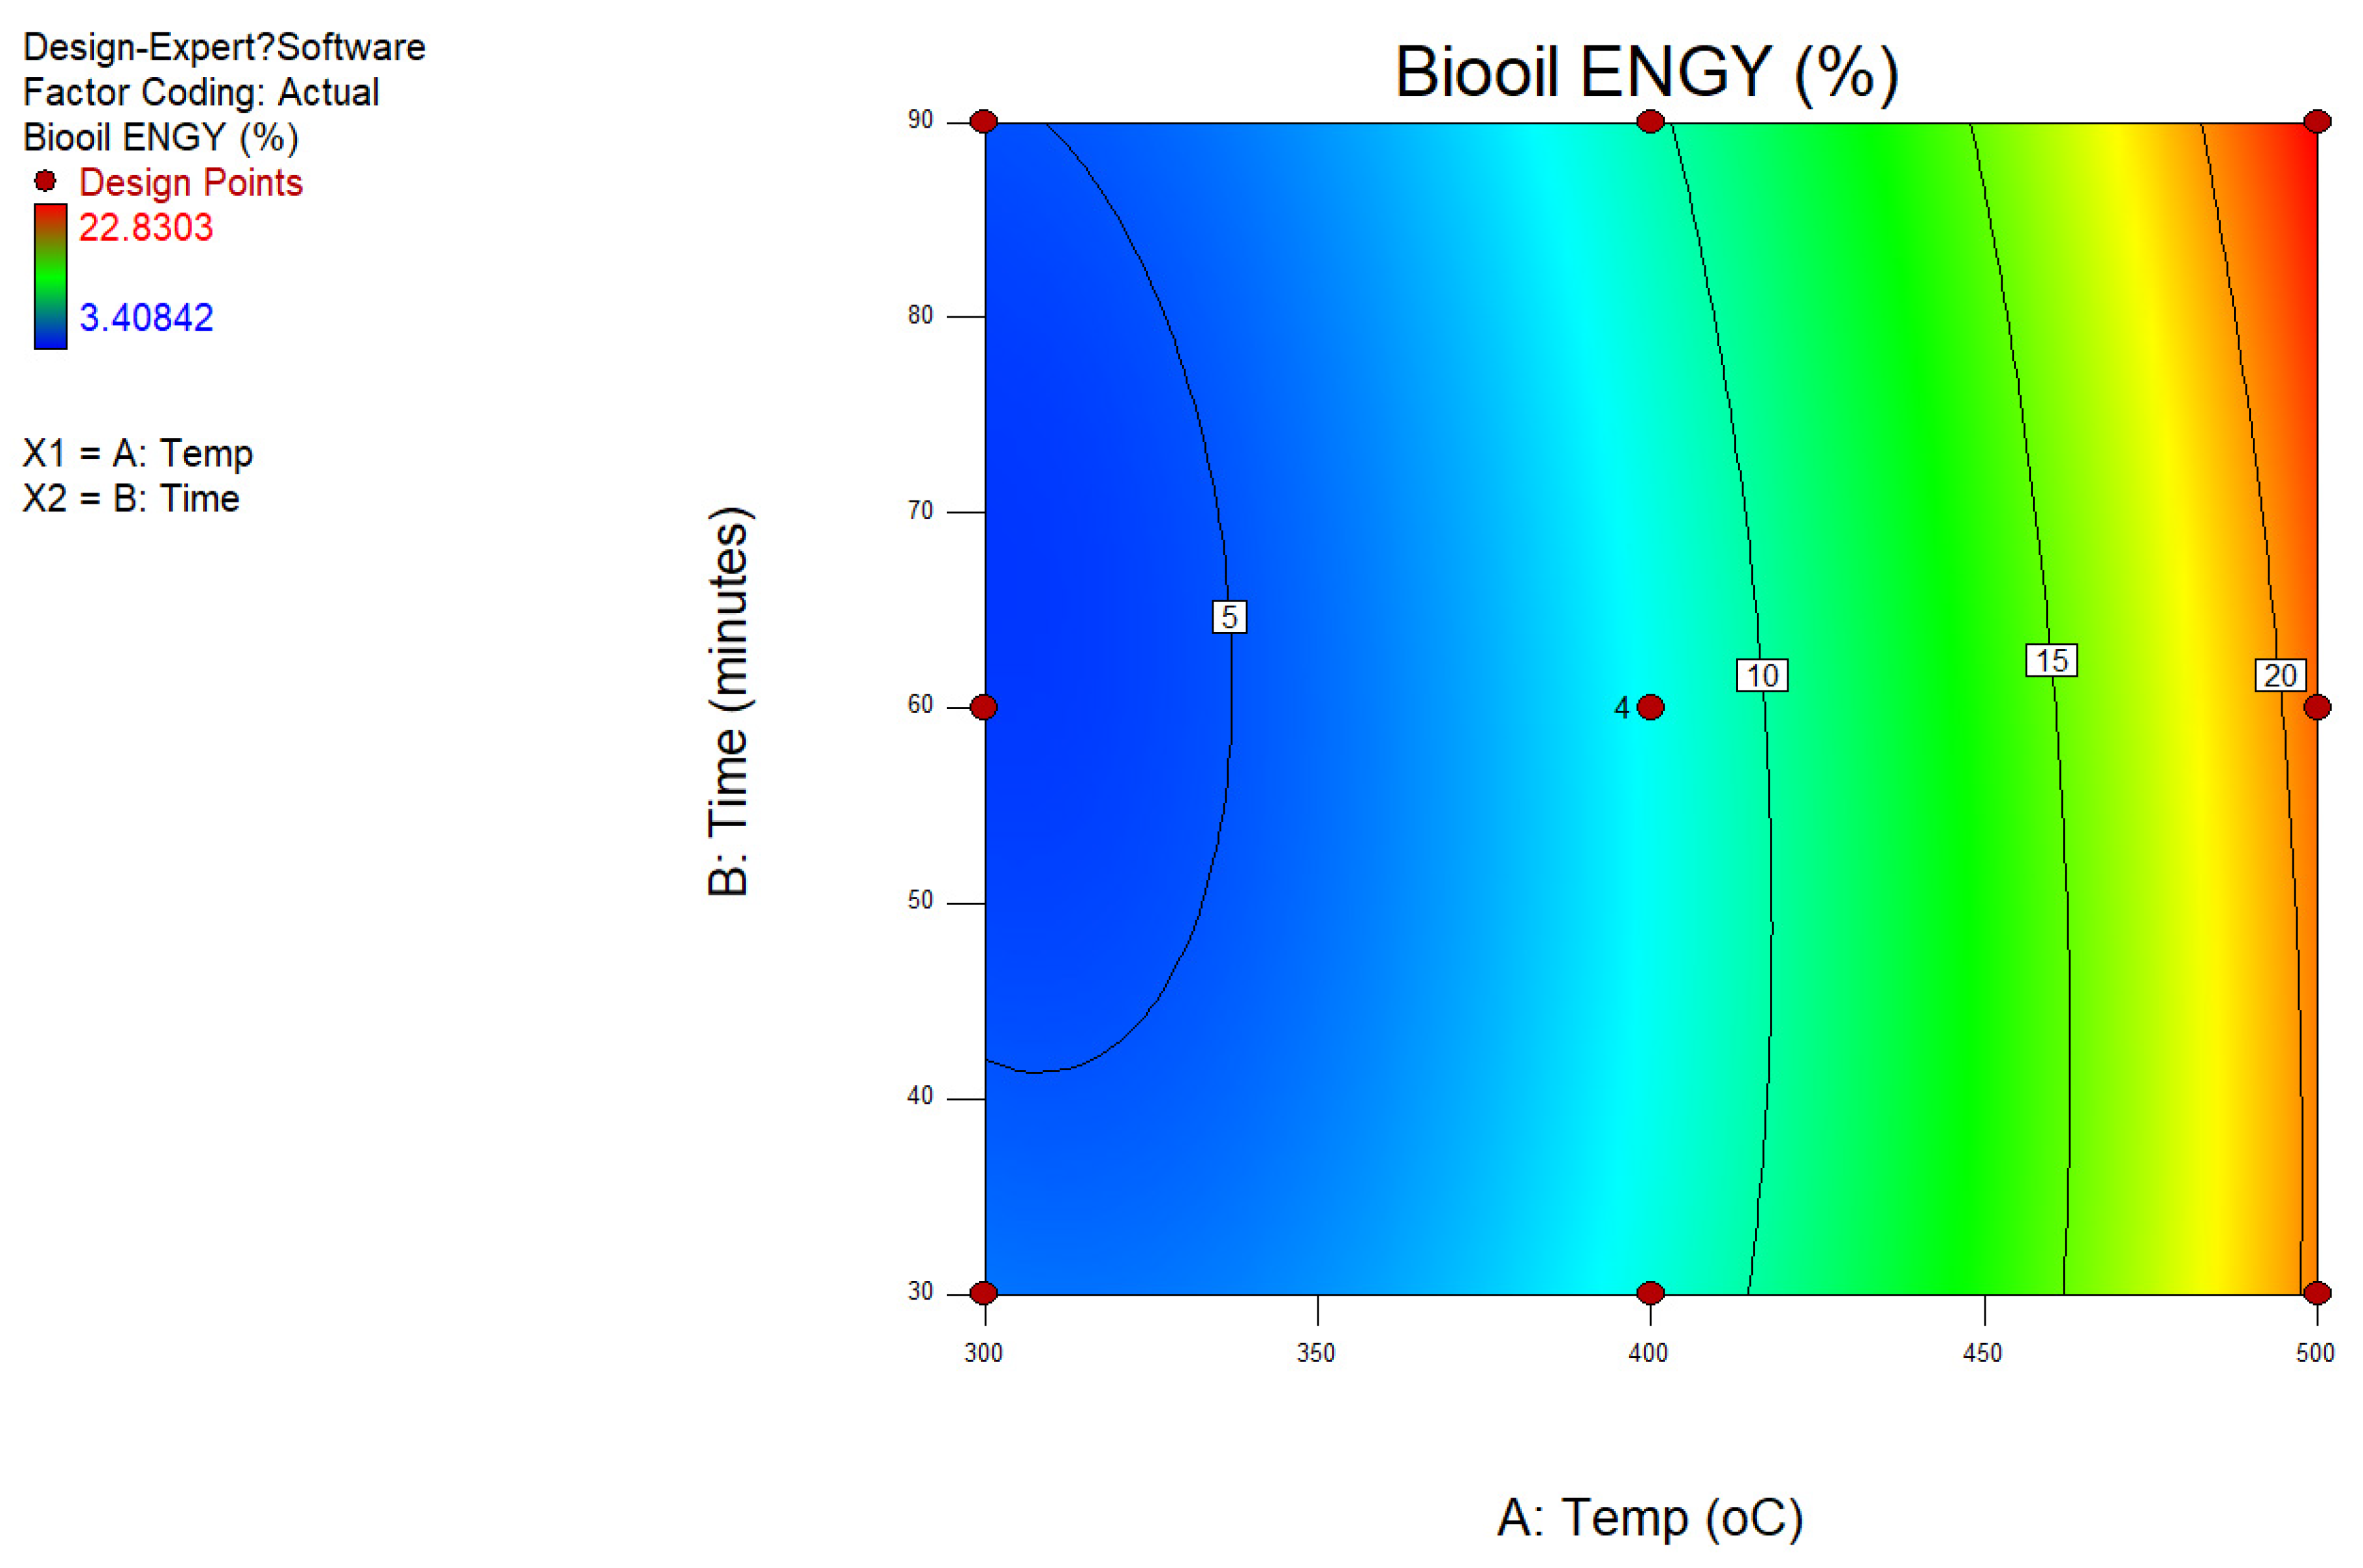
The overall bio-oil energy recovery relationship in percentage (%) is shown in Equation (11) with corresponding ANOVA statistical results provided in Table 9. This is a quadratic model as a function of operating temperature (°C) and exposure time (minutes). The region when bio-oil is optimized is shown in Figure 8. This region is near the highest operating temperature of 500 °C and the highest exposure time of 90 min. Unfortunately, due to low mass yield for the bio-oil, maximizing bio-oil yield for this feedstock (BLT oil seed cake) is not recommended using this condition.
Bio-oil energy product yield (%) = 51.6 − 0.269 × Temp − 0.198 × Time + 0.00027 × Temp × Time + 0.00042 × Temp2 + 0.00088 × Time2
The biochar energy product yield in percentages (%) is shown in Equation (12) with the corresponding ANOVA statistical results in Table 10. Note that the predictive equation is a simple linear relationship with operating temperature and exposure time as a major contributing factor. The optimal condition for maximizing the product based on the overall energy recovery is at the lowest operating temperature and exposure time. The energy contribution from the bio-oil, is quite small and will not alter this conclusion over the range of temperature and exposure time used. Bio-oil production will be a major factor if, even with small contribution, will offer highest cost returns.
Biochar energy product yield (%) = 179 − 0.255 × Temp − 0.05 × Time
The results of this study demonstrated that optimal recovery of energy from BLT oil seed cake must come from the production of biochar. The succeeding section presents a simple prefeasibility study showing yields of biochar and bio-oil at various operating temperatures and exposure times to estimate yields for every 1000 kg of BLT oil seed cake processed.

4.5. Prefeasibility Calculations from Processing of 1000 kg (1 tonne) of the BLT Oil Seed Press Cake

The predictive equations developed in this study were used to make a rough estimate of all coproducts’ mass and energy yields at various operating temperatures and exposure times used. The values presented in this section show how much biochar and bio-oil was produced for every 1000 kg (or 1 tonne) of BLT oil seed cake used. Table 11 shows the resulting mass and energy values. The maximum total recoverable energy was around 2031 MJ of energy for every tonne of BLT seed cake. One should compare this to the original energy content of seed cake of around 19,200 MJ for every tonne of cake produced. While the energy value was slightly high at the exposure time of 90 min, the energy used to prolong the exposure did not warrant nor suggest this operating condition. Input energy was minimized in the pyrolysis process when exposure time was minimized. The input energy was usually just a small fraction (<10%) of energy of all products [14]. At the optimal biochar HHV product condition of 425 °C and 75 min of exposure time, only 16,040 MJ of energy was recovered from the biochar and bio-oil. The energy contribution of the bio-oil coproduct was still inferior to the biochar component.
Table 11 clearly shows that the energy contributions of bio-oil was very minimal. Thus, additional studies must be undertaken to further improve this liquid product yield. The results of this study are very similar to those reported for jatropha press cake [11].

5. Conclusions

This paper described optimization of pyrolysis conditions for BLT oil seed press cake, which is a byproduct of oil extraction during biodiesel production process. A previous study [11] (e.g., jatropha oil seed press cake) shows that a large portion of the energy is still retained in the press cake after oil extraction. The current study further validates this claim and shows that about 61.7% (dry basis) of the energy of the whole seed is still contained in the waste press cake. Hence, to improve the energy balance of biodiesel production, residual energy retained in the press cake must be recovered and thermal processes such as pyrolysis could be relied upon for this purpose.
The results of this research will have a significant impact on projects utilizing Australian natural forest reserves, particularly native trees like BLT. The oil seed from this tree serves as a highly potential source for biodiesel production [17]. Newer studies are now being implemented in Indonesia to explore the potential of BLT for biodiesel production at the village level [10,24]. However, with the price of crude oil still depressed in recent years, the recovery of additional energy from the coproducts must be considered during biodiesel production. Results from this study shows that more than 90% of the energy from the press cake can be recovered via biochar at an optimal condition of 300 °C and exposure time of 30 min. Additional energy may be recovered from the bio-oil sample (organic portion), although this will provide very minimal energy contribution. Hence, a significant amount of energy from the press cake could be optimally recovered by controlled pyrolysis process. Overall, the production of biodiesel must always be undertaken in conjunction with the recovery of additional energy from the press cake. This will likely improve the overall energy recovery and the economics of biodiesel production.
This study has shown how the solid (biochar), liquid (bio-oil) and combustible gas (synthesis gas) coproducts from press cake may be optimized depending upon on the target product based on the relative commercial value of each of the coproducts. In all experimental runs, the biochar energy yield was found to be the highest. Thus, programs to direct production of biochar from press cakes must be developed and enhanced.
Author Contributions

The contributions of each author are as follows: N.A. provided the feedstock material and conducted the pyrolysis experiments at BETA Laboratory in 2014. H.N. undertook product characterization and statistical analysis. S.C. and N.A. prepared the manuscript draft. All authors have read and agreed to the published version of the manuscript.

Funding

This study was made possible by the collaborative effort between Texas A&M University, College Station, Texas, USA and the Central Queensland University in Rockhampton, QLD, Australia.

Institutional Review Board Statement

Not applicable.

Informed Consent Statement

Not applicable.

Data Availability Statement

The data are available at Central Queensland University’s archival system.

Acknowledgments

The authors would like to acknowledge the BETA Lab facilities at Texas A&M University for allowing the conduct of the experiments. NA is grateful to Central Queensland University, for granting study leave (OSPRO) to pursue this research at BETA laboratory, College Station, Texas.

Conflicts of Interest

The authors declare no conflict of interest.

References

  1. Ashwath, N.; Rank, A.H. Bioenergy and charcoal production: An alternative option for disposal of combustible municipal wastes. Int. J. Environ. Waste Manag. 2010, 6, 71–81. [Google Scholar] [CrossRef]
  2. Jahirul, M.I.; Brown, J.R.; Senadeera, W.; Ashwath, N.; Laing, C.; Leski-Taylor, J.; Rasul, M.G. Optimization of bio-oil extraction process from Beauty Leaf (Calophyllum inophyllum) oil seed as a second-generation biodiesel source. Procedia Eng. 2013, 56, 619–624. [Google Scholar] [CrossRef] [Green Version]
  3. Bhuiya, M.M.K.; Rasul, M.G.; Khan, M.M.K.; Ashwath, N.; Azad, A.K. Prospects of 2nd generation biodiesel as a sustainable fuel: Part 1: Selection of feedstocks, oil extraction techniques and conversion technologies. Renew. Sustain. Energy Rev. 2016, 55, 1109–1128. [Google Scholar] [CrossRef]
  4. Ashwath, N. Evaluating Biodiesel Potential of Australian Native and Naturalized Plant Species. RIRDC Publication #10-216, Rural Industries Research and Development Corporation, Canberra, 2010; 113p. Available online: https://www.agrifutures.com.au/product/evaluating-biodiesel-potential-of-australian-native-and-naturalised-plant-species/ (accessed on 29 April 2021).
  5. Ashwath, N. Experimental investigations to demonstrate biodiesel potential of beauty leaf tree (Calophyllum inophyllum L). J. Phys. Conf. Ser. 2019, 1175, 012004. [Google Scholar] [CrossRef]
  6. Bhuiya, M.M.K.; Rasul, M.G.; Khan, M.M.K.; Ashwath, N.; Azad, A.K.; Hazrat, M.A. Second generation biodiesel: Potential alternative to edible oil-derived biodiesel. Energy Procedia 2014, 61, 1969–1972. [Google Scholar] [CrossRef] [Green Version]
  7. Bhuiya, M.M.K.; Rasul, M.G.; Khan, M.M.K.; Ashwath, N.; Azad, A.K. Prospects of 2nd generation biodiesel as a sustainable fuel: Part 2. Properties, performance and emissions characteristics. Renew. Sustain. Energy Rev. 2016, 55, 1129–1146. [Google Scholar] [CrossRef]
  8. Tyner, W. How will Low Oil Prices Affect Biofuels? Issue 06 February; Economic World Forum: Geneva, Switzerland, 2015. [Google Scholar]
  9. Murphy, M. Sustainable Biodiesel: The Ecological Cost of Fuel; Issue 13 February; Renewable Energy World: Nashua, NH, USA, 2007; Issue 13 February. [Google Scholar]
  10. Murti, W. The influence of crude oil price in biodiesel and its implication on the production of palm oil: The case of Indonesia. Eur. Res. Stud. J. 2017, 20, 568–580. [Google Scholar] [CrossRef]
  11. Kongkasawan, J.; Nam, H.; Capareda, S.C. Jatropha waste meal as an alternative energy source via pressurized pyrolysis: A study on temperature effects. Energy 2016, 113, 631–642. [Google Scholar] [CrossRef]
  12. Ashwath, N.; Nam, H.; Capareda, S.C. Optimizing pyrolysis conditions for thermal conversion of beauty leaf tree (Calophyllum inophyllum L.) press cake. In Application of Thermo-Fluid Processes in Energy Systems; Green Energy and Technology, Khan, M., Chowdhury, A., Hassan, N., Eds.; Springer: Singapore, 2018; pp. 267–280. [Google Scholar]
  13. US Energy Information Administration (US EIA). Monthly Biodiesel Production Report with Data for October 2020; USDOE: Washington, DC, USA, 2020; Available online: https://www.eia.gov/biofuels/biodiesel/production/biodiesel.pdf (accessed on 26 January 2020).
  14. Capareda, S.C. Introduction to Biomass Energy Conversions; CRC Press Taylor and Francis Group: Boca Raton, FL, USA, 2014. [Google Scholar]
  15. Jahirul, M.I.; Rasul, M.G.; Chowdhury, A.A.; Ashwath, N. Chowdhury and N. Ashwath. Biofuels production through biomass pyrolysis—A technological review. Energies 2012, 5, 4952–5001. [Google Scholar] [CrossRef]
  16. Nahar, K.; Ozores-Hampton, M. Jatropha: An Alternative Substitute to Fossil Fuel. University of Florida Extension Service Publications #HS1193, UFAS Extension. 2017. Available online: https://edis.ifas.ufl.edu/pdffiles/HS/HS119300.pdf (accessed on 26 January 2021).
  17. Bhuiya, M.M.K.; Rasul, M.G.; Khan, M.; Ashwath, N.; Rahman, M. Comparison of oil extraction between screw press and solvent (n-hexane) extraction technique from beauty leaf (Calophyllum inophyllum L.) feedstock. Ind. Crop. Prod. 2020, 144. [Google Scholar] [CrossRef]
  18. Banaszkiewicz, T. Nutritional Value of Soybean Meal. Intech Open Access Peer-Reviewed Chapter; InTech Publishing: Rijeka, Croatia, 2011; Available online: https://www.intechopen.com/books/soybean-and-nutrition/nutritional-value-of-soybean-meal (accessed on 26 January 2021). [CrossRef] [Green Version]
  19. Panchasara, H.; Ashwath, N. Effects of pyrolysis bio-oils on fuel automation—A review. Energies 2021, 14, 794. [Google Scholar] [CrossRef]
  20. Nam, H.; Capareda, S.C.; Ashwath, N.; Kongkasawan, J. Experimental investigation of pyrolysis of rice straw using bench-scale auger, batch and fluidized bed reactors. Energy 2015, 93, 2384–2394. [Google Scholar] [CrossRef]
  21. Capunitan, J.A.; Capareda, S.C. Assessing the potential for biofuel production of corn stover pyrolysis using a pressurized batch reactor. Fuel 2012, 95, 563–572. [Google Scholar] [CrossRef]
  22. Maguyon, M.C.; Capareda, S.C. Evaluating the effects of temperature on pressurized pyrolysis of Nannochloropsis oculata based on products yields and characteristics. Energy Convers. Manag. 2013, 76, 764–773. [Google Scholar] [CrossRef]
  23. Imam, T.; Capareda, S. Characterization of bio-oil, syngas and biochar from switchgrass pyrolysis at various temperatures. J. Anal. Appl. Pyrolysis 2012, 93, 170–177. [Google Scholar] [CrossRef]
  24. Ishak, L.; Ashwath, N.; Sidayat, M.; Teapon, A. Empowering Farmers in Ternate to Utilize Locally Available Natural Resources to Produce Bioenergy: The Use of Beauty Leaf Tree (Capilong) as a Source of Biofuel; LepKhair Press: Ternate, Indonesia, 2019; p. 23. [Google Scholar]
Figure 1. Beauty leaf tree (BLT) showing its profuse fruit-bearing nature.
Energies 14 02625 g001
Figure 2. Pyrolysis product yield of BLT press cake at various operating conditions (temp; 300–500 °C/residence time; 30 to 90 min). This is a modified version of the book chapter by [12]. Reproduced with permission from [12].
Energies 14 02625 g002
Figure 3. Bio-oil elemental composition and heating values.
Energies 14 02625 g003
Figure 4. Elemental composition of biochar and its corresponding high heating value.
Energies 14 02625 g004
Figure 5. Optimal conditions to produce biochar from beauty leaf oil press cake.
Energies 14 02625 g005
Figure 6. Van Krevelen plot of coproducts from pyrolysis of the BLT oil seed cake.
Energies 14 02625 g006
Figure 7. Energy distribution from the BLT pyrolysis process at different temperatures.
Energies 14 02625 g007
Figure 8. Optimal conditions to produce bio-oil from the beauty leaf press cake.
Energies 14 02625 g008
Table 1. Experimental design of central composite face-centered operating conditions.
Set No.Coded Variable LevelTemperature (°C)Time (min)
TemperatureTime
10140090
21050060
30040060
4−1130090
5−1030060
60040060
71−150030
80−140030
90040060
100040060
111150090
12−1−130030
Table 2. BLT press cake sample characteristics compared with other press cakes.
BLT SeedsBLT De-oiled CakeJatropha Seed [10]Jatropha De-oiled cake [10]Rice Straw [13]
HHV (MJ kg−1)32.9 ± 0.319.2 ± 0.0824.0 ± 0.2420.5 ± 0.414.2 ± 0.2
Moisture (wt %)4.07 ± 0.129.91 ± 0.117.5 ± 0.1218.2 ± 0.49.2 ± 0.1
Proximate analysis (wt %)VCM92.5 ± 0.575.2 ± 0.277.1 ± 0.9573.0 ± 0.0169.3 ± 0.1
Ash2.24 ± 0.236.10 ± 0.125.9 ± 0.559.2 ± 0.7621.7 ± 1.1
FC5.27 ± 0.2418.7 ± 0.129.4 ± 0.5311.3 ± 1.019.01 ± 0.96
Elemental analysis (wt %)C65.844.053.7 ± 0.7943.3 ± 0.636.6 ± 0.2
H1.183.508.0 ± 0.025.8 ± 0.044.9 ± 0.15
N8.966.164.5 ± 0.235.0 ± 0.460.77 ± 0.02
S0.240.320.23 ± 0.02
O *21.6139.9027.936.731.96
* Calculated by difference.
Table 3. ANOVA for biochar mass yield.
Sum of MeanFp-Value
SourceSquaresdfSquareValueProb > F
Model3441.895688.3881.91<0.0001****
A-Temp3265.6813265.68388.58<0.0001****
B-Time26.41126.413.140.1267NS
AB24.87124.872.960.1362NS
A266.69166.697.940.0305*
B220.01120.012.380.1738NS
Residual50.4368.40
Lack of Fit12.6534.220.330.8035NS
Pure Error37.77312.59
* p < 0.05, **** p < 0.0001, NS not significant (p > 0.05).
Table 4. ANOVA for bio-oil mass yield.
Sum of MeanFp-Value
SourceSquaresdfSquareValueProb > F
Model110.24522.0543.550.0001***
A-Temp100.811100.81199.13<0.0001****
B-Time1.0811.082.130.1950NS
AB0.03810.0380.0750.7928NS
A26.6616.6613.150.0110*
B20.1210.120.250.6372NS
Residual3.0460.51
Lack of Fit1.0030.330.490.7127NS
Pure Error2.0430.68
Cor Total113.2811
* p < 0.05, *** p < 0.001, **** p < 0.0001, NS not significant (p > 0.05).
Table 5. ANOVA for the bio-oil high heating value.
Sum of MeanFp-Value
SourceSquaresdfSquareValueProb > F
Model7.4123.712.490.1378NS
A-Temp5.9815.984.020.0759NS
B-Time1.4311.430.960.3529NS
Residual13.3991.49
Lack of Fit12.7462.129.830.0440*
Pure Error0.6530.22
Cor Total20.8011
* p < 0.05.
Table 6. Heating values of bio-oil produced at various temperatures and exposure times.
Bio-oil HHV (MJ kg1)Bio-Oil Product Yield (%) Equation (9)
32.52.69
35.923.02
35.833.78
35.95.81
34.656.04
34.046.71
35.6912.11
37.4212.62
37.1412.84
Table 7. Proximate analysis of BLT pyrolyzed biochar.
Dry BasisVCM (%)Ash (%)FC (%)HHV (MJ kg1)
Temp/Time
BLT Seed92.5 ± 0.42.24 ± 0.235.27 ± 0.232.92 ± 0.25
BLT deoiled cake75.2 ± 0.26.10 ± 0.1218.69 ± 0.119.17 ± 0.08
300/3067.4 ± 4.09.06 ± 1.6223.55 ± 2.822.99 ± 0.00
300/6065.8 ± 2.77.07 ± 0.7727.16 ± 2.025.58 ± 0.41
300/9063.5 ± 2.59.15 ± 0.7127.32 ± 1.725.46 ± 0.28
400/3053.0 ± 0.49.88 ± 1.0537.09 ± 0.727.97 ± 0.00
400/6043.1 ± 1.212.83 ± 0.5847.46 ± 1.228.75 ± 0.61
400/9036.7 ± 0.814.51 ± 0.0748.84 ± 0.829.34 ± 0.05
500/3017.4 ± 1.219.83 ± 0.4762.77 ± 0.828.19 ± 0.13
500/6021.0 ± 0.919.29 ± 1.4059.71 ± 0.527.51 ± 0.13
500/9016.7 ± 4.320.13 ± 1.0363.20 ± 3.227.41 ± 0.09
Table 8. ANOVA for biochar heating value model development.
Sum of MeanFp-value
SourceSquaresdfSquareValueProb > F
Model37.3457.4717.220.0017**
A-Temp13.76113.7631.720.0013**
B-Time1.5611.563.590.1069NS
AB2.6412.646.100.0485*
A215.62115.6236.020.0010**
B20.2610.260.600.4678NS
Residual2.6060.43
Lack of Fit1.1330.380.770.5826NS
Pure Error1.4730.49
Cor Total39.9411
* p < 0.05, ** p < 0.01, NS not significant (p > 0.05).
Table 9. ANOVA for bio-oil energy content.
Sum of MeanFp-Value
SourceSquaresdfSquareValueProb > F
Model467.45593.4936.930.0002***
A-Temp402.481402.48159.01<0.0001****
B-Time1.1711.170.460.5228NS
AB2.6412.641.040.3464NS
A246.84146.8418.510.0051**
B21.6511.650.650.4497NS
Residual15.1962.53
Lack of Fit8.1732.721.160.4516NS
Pure Error7.0232.34
Cor Total482.6311
** p < 0.01, *** p < 0.001, **** p < 0.0001, NS not significant (p > 0.05).
Table 10. ANOVA for biochar energy content.
Sum of MeanFp-Value
SourceSquaresdfSquareValueProb > F
Model3923.2021961.6077.30<0.0001****
A-Temp3909.6413909.64154.06<0.0001****
B-Time13.56113.560.530.4834NS
Residual228.40925.38
Lack of Fit80.77613.460.270.9172NS
Pure Error147.63349.21
Cor Total4151.6011
**** p < 0.0001, NS not significant (p > 0.05).
Table 11. Mass and energy yields of biochar and bio-oil from processing 1000 kg of press cake.
Operating Temperature (°C)Exposure Time (minutes)Biochar Yield (kg)Biooil Yield (kg)Biochar Energy MJBiooil Energy (MJ)Total Recoverable Energy (MJ)
30030828619,4308820,310
30060750518,83010919,920
30090726518,97013520,320
40030522914,80020816,890
40060468913,66020915,750
425754681013,76022816,040
400904091212,09033015,400
5003031621899043213,310
5006028621814045912,730
5009031024864047713,410
Publisher’s Note: MDPI stays neutral with regard to jurisdictional claims in published maps and institutional affiliations.