
Research on Crop Growing Factory: Focusing on Lighting and Environmental Control with Technological Proposal


Abstract
1. Introduction
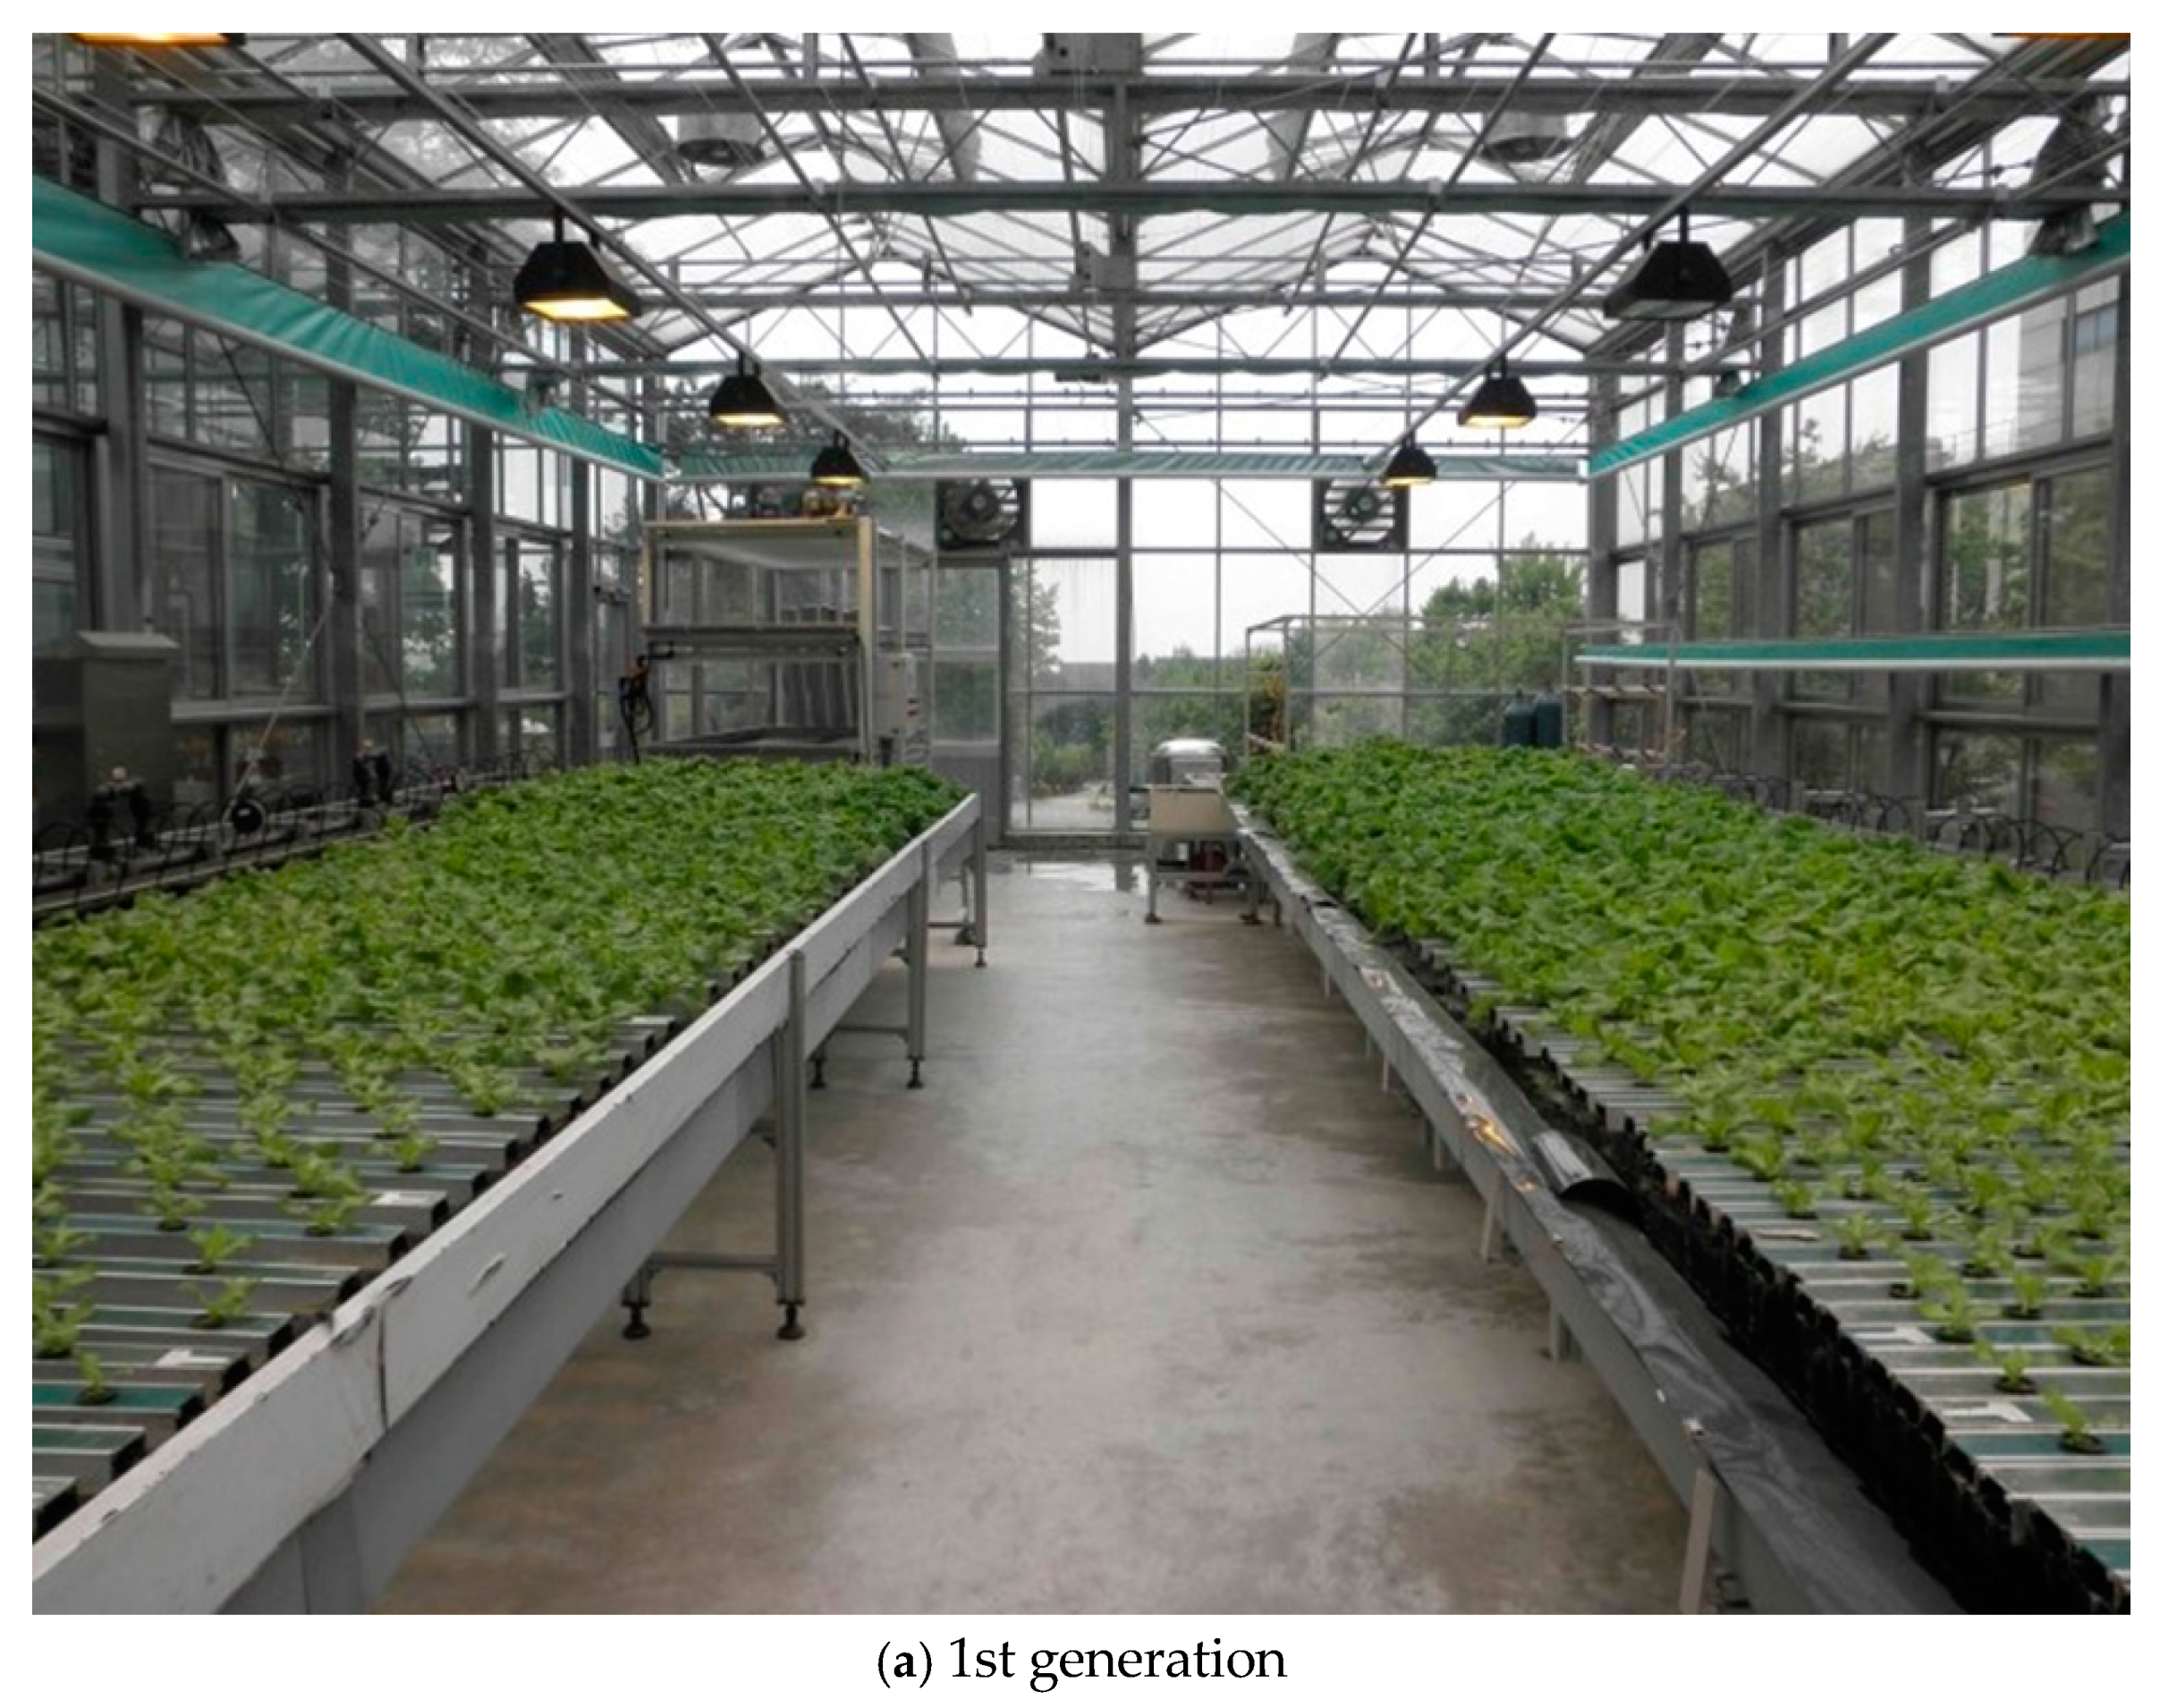
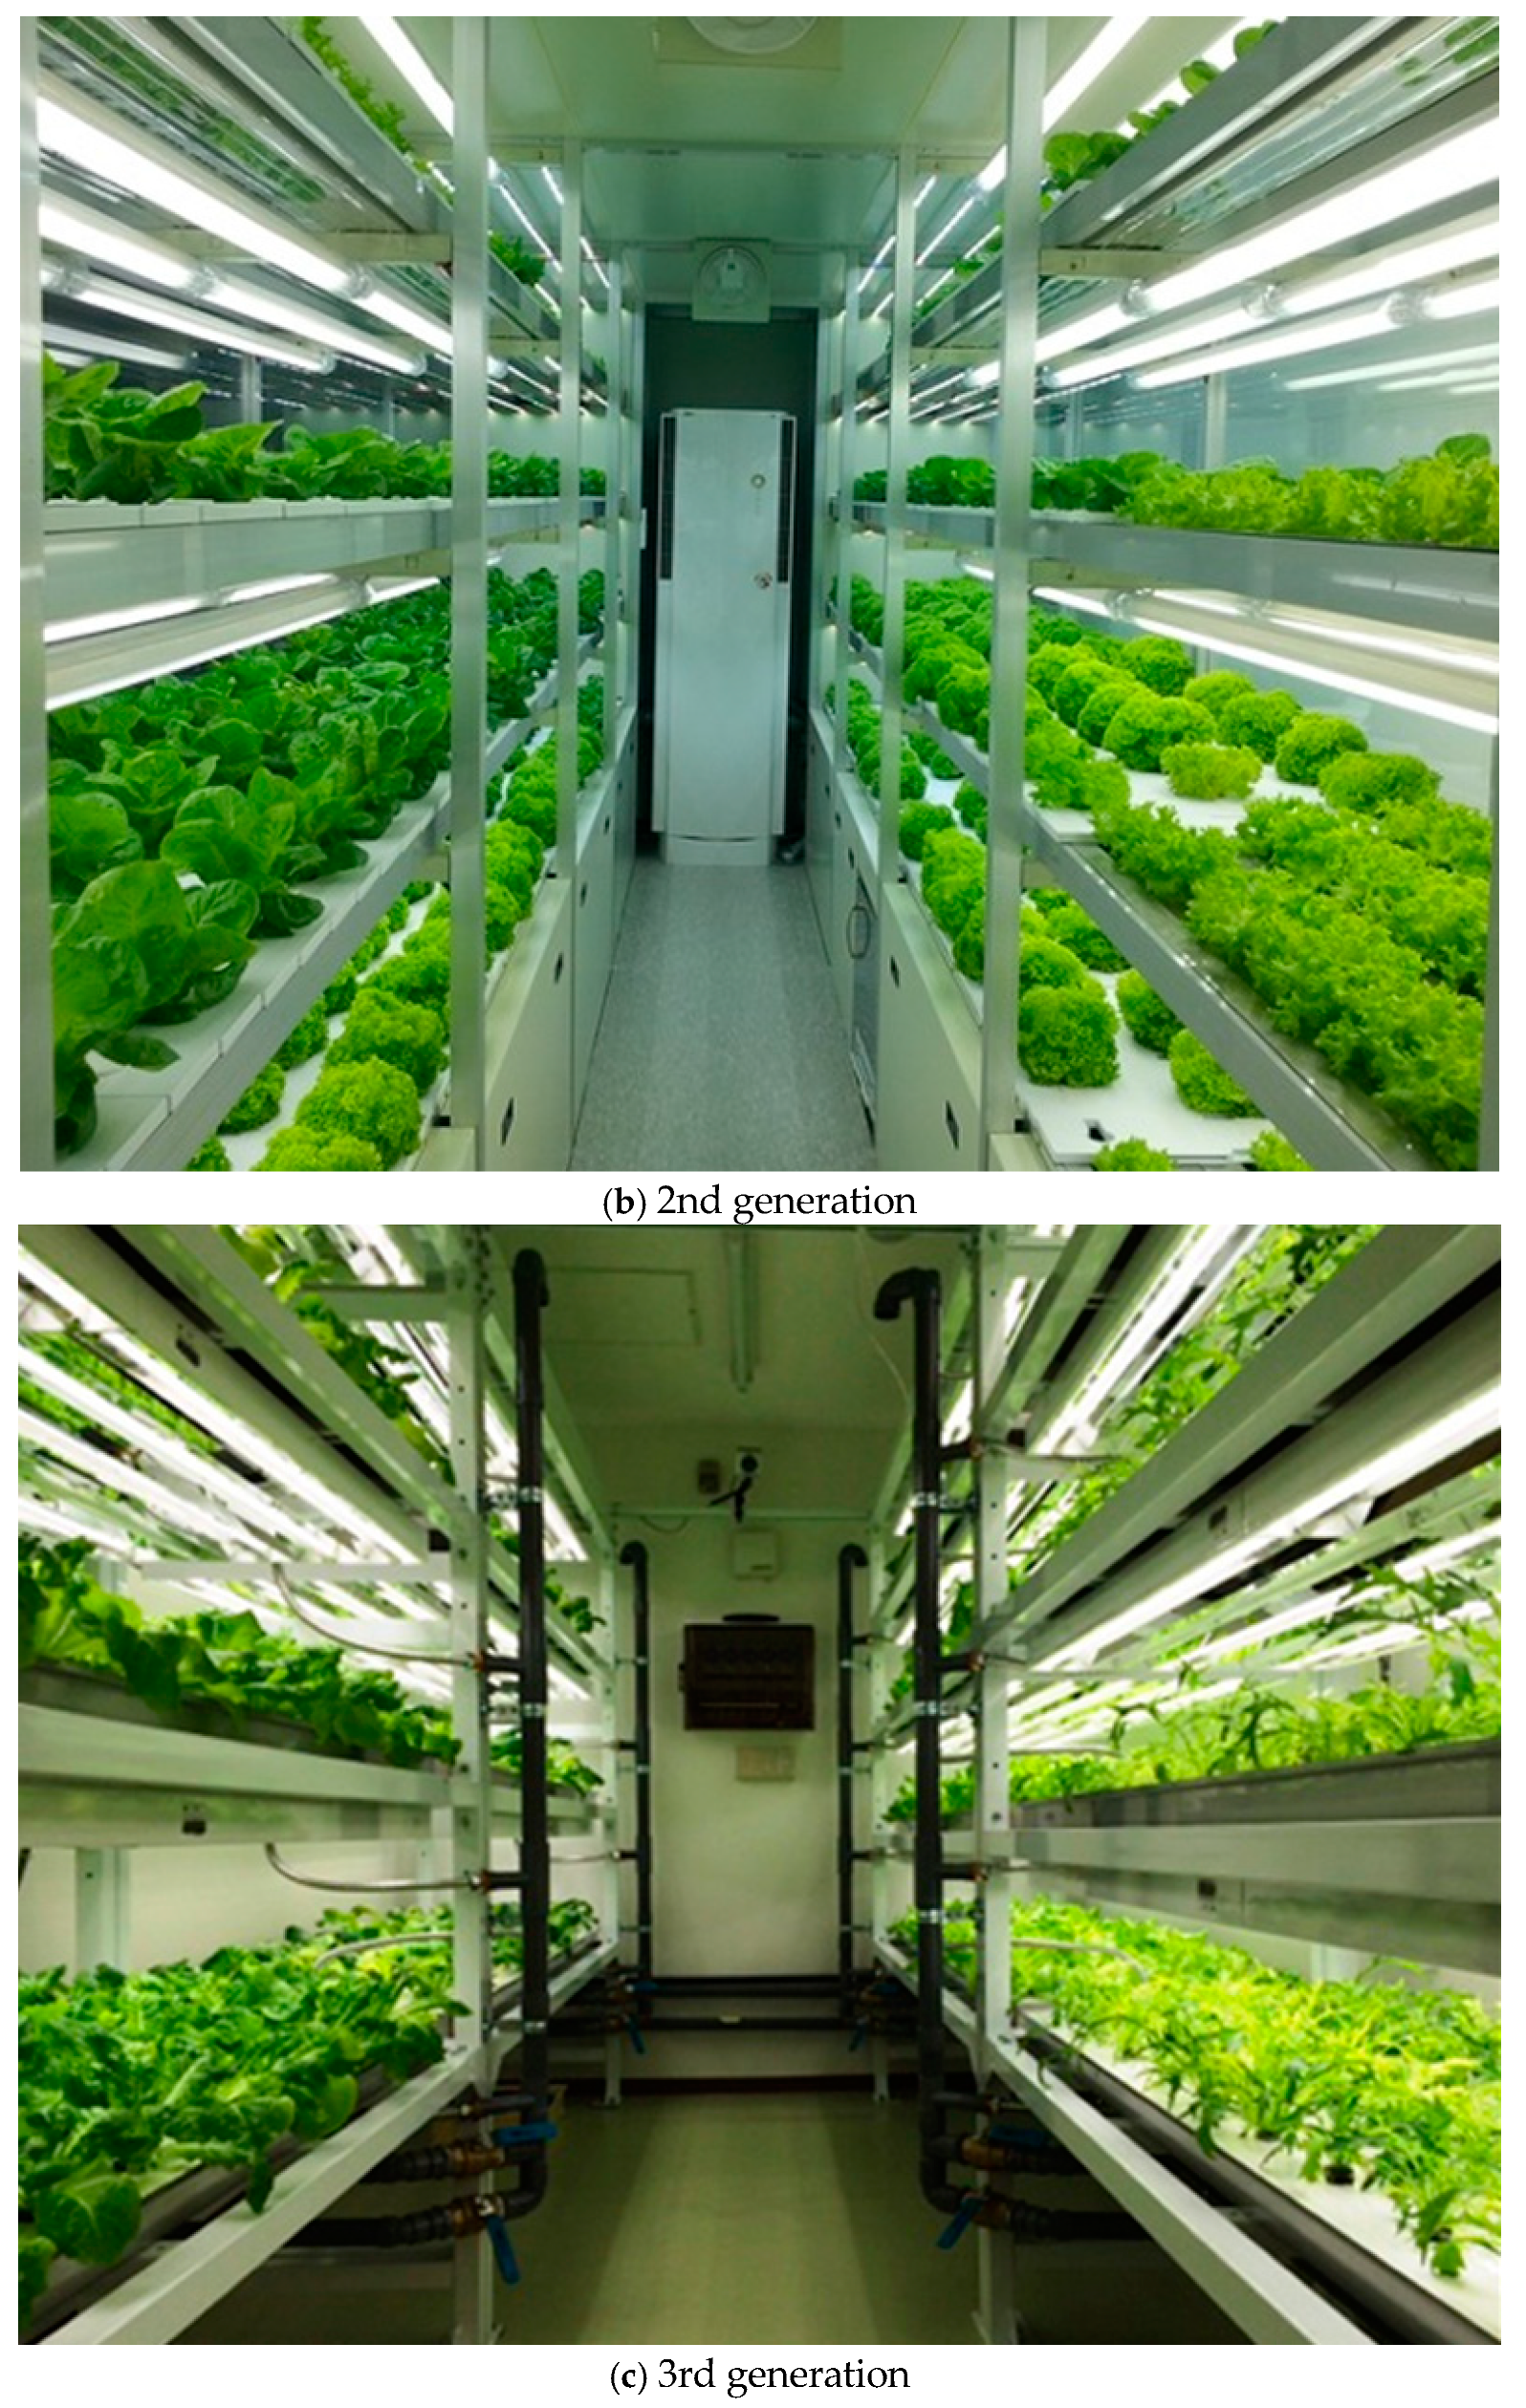
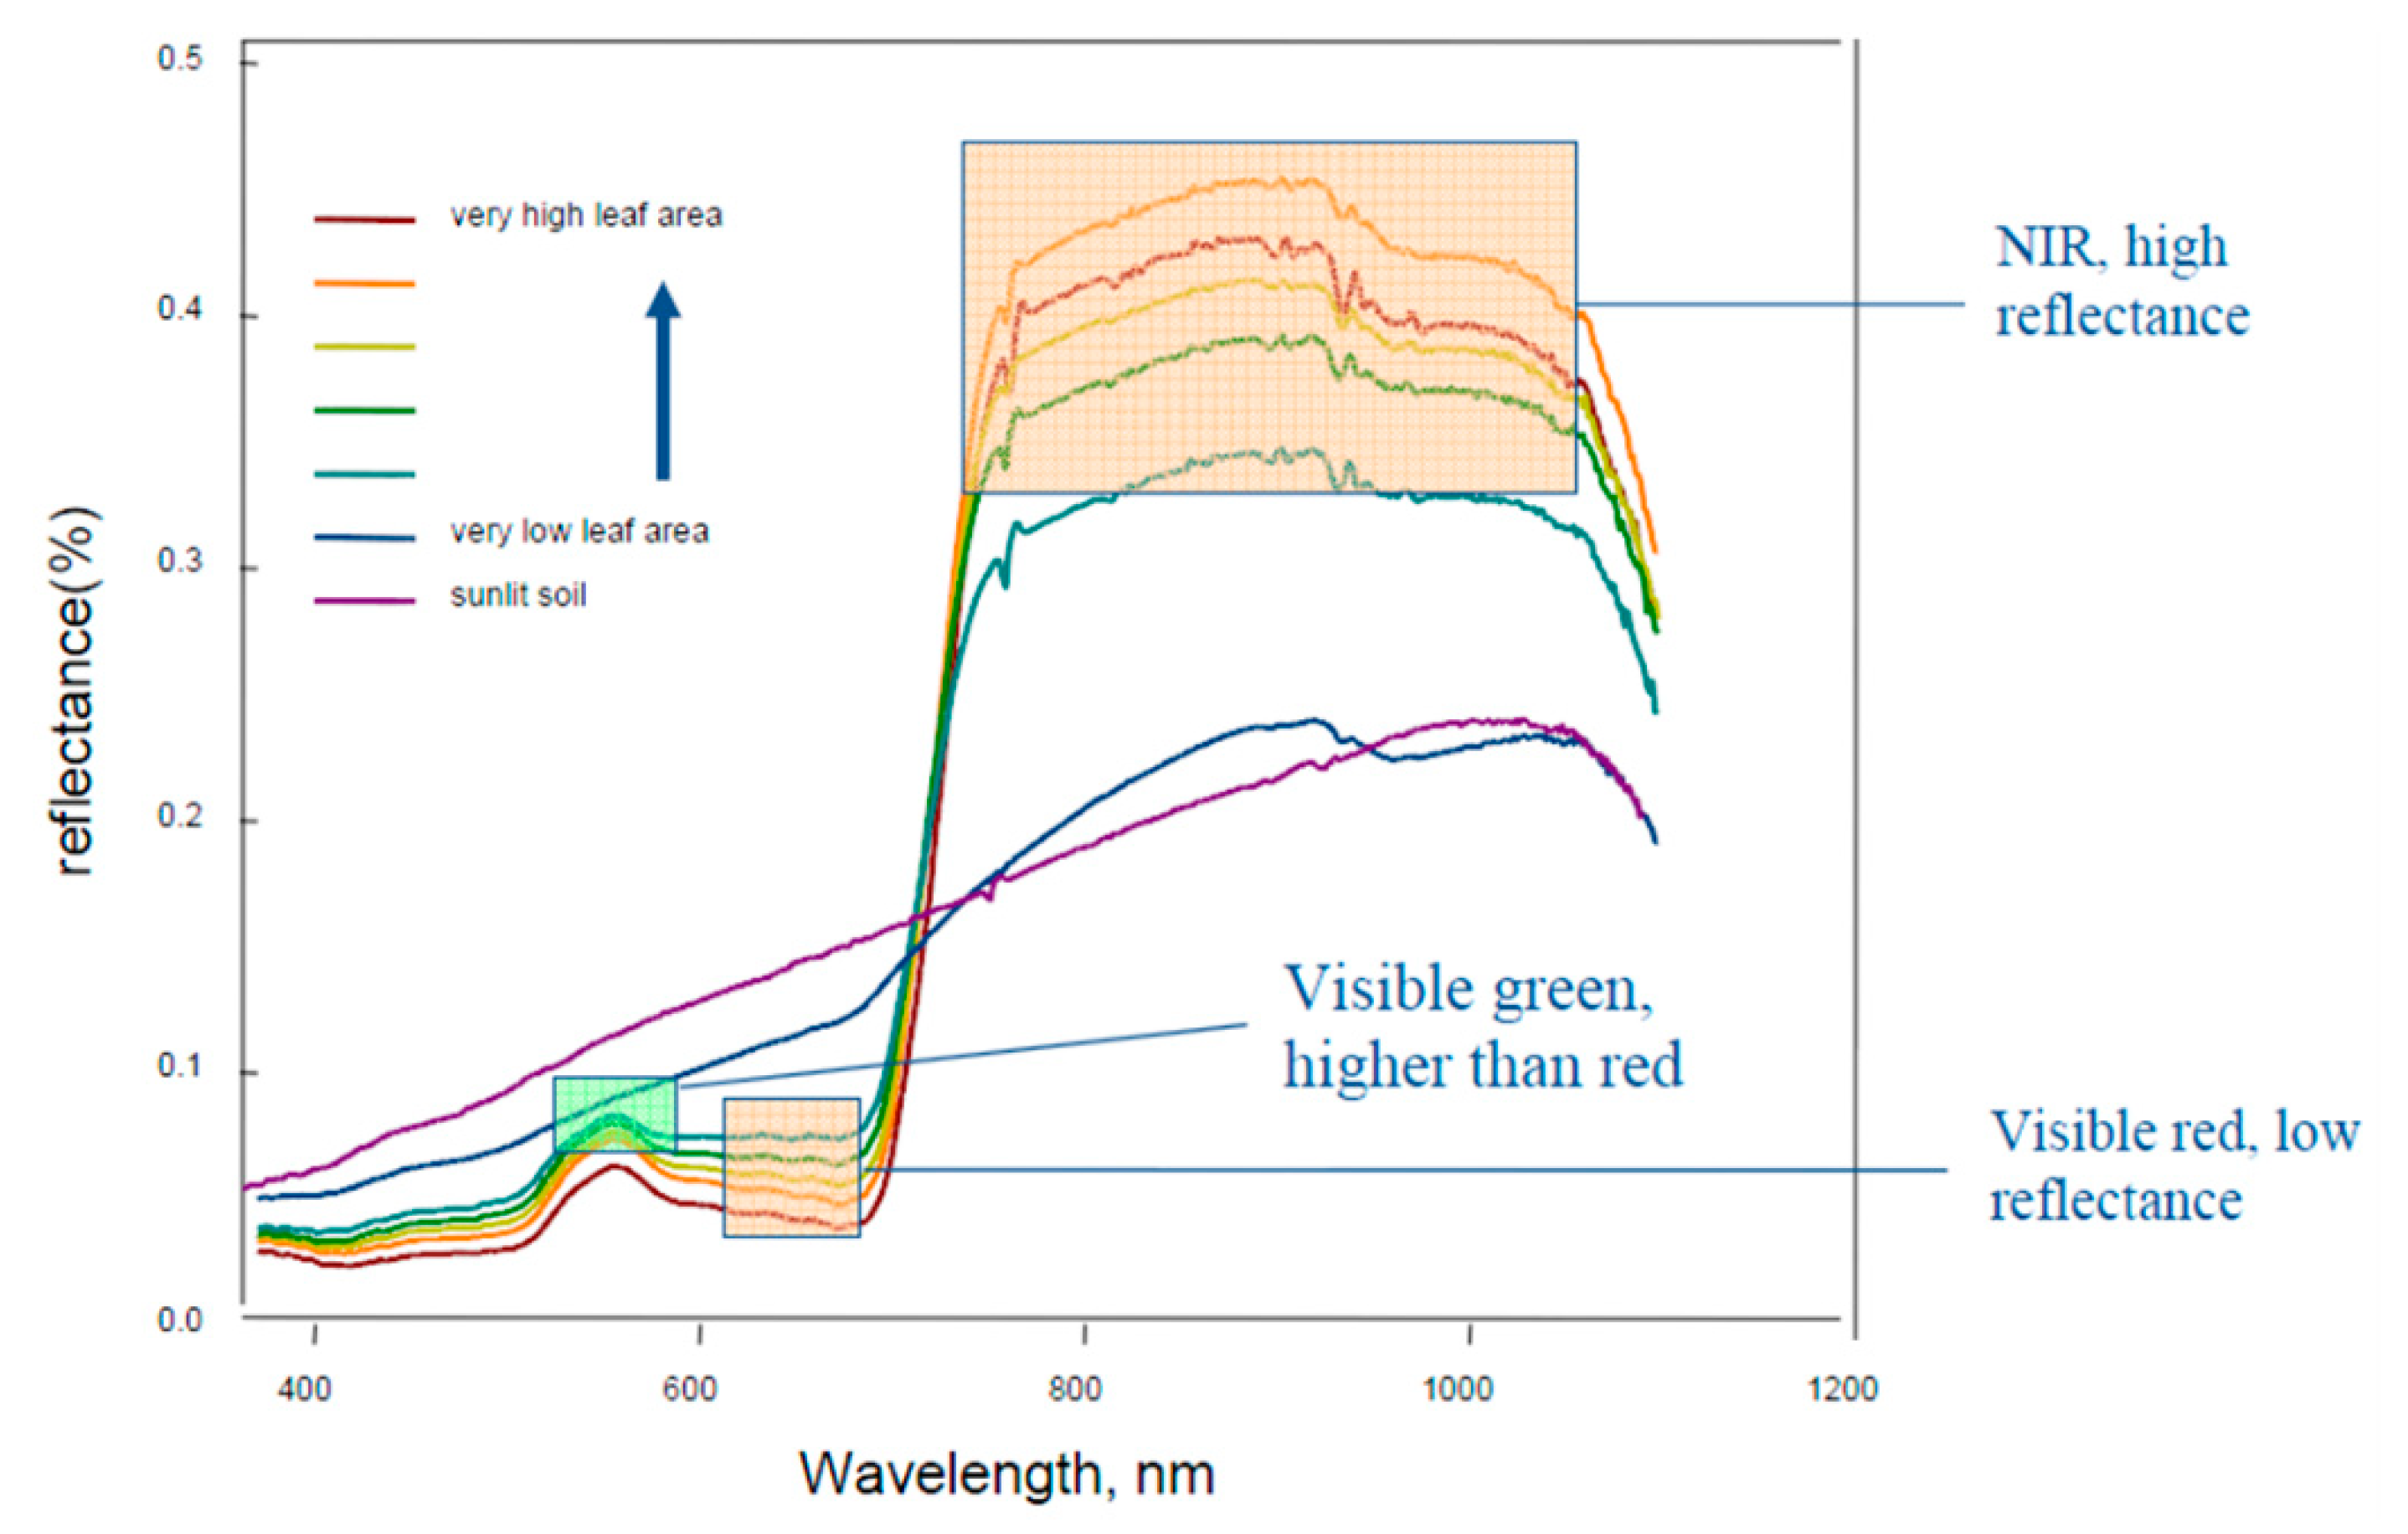
2. Related Research
3. Methods and Proposed System
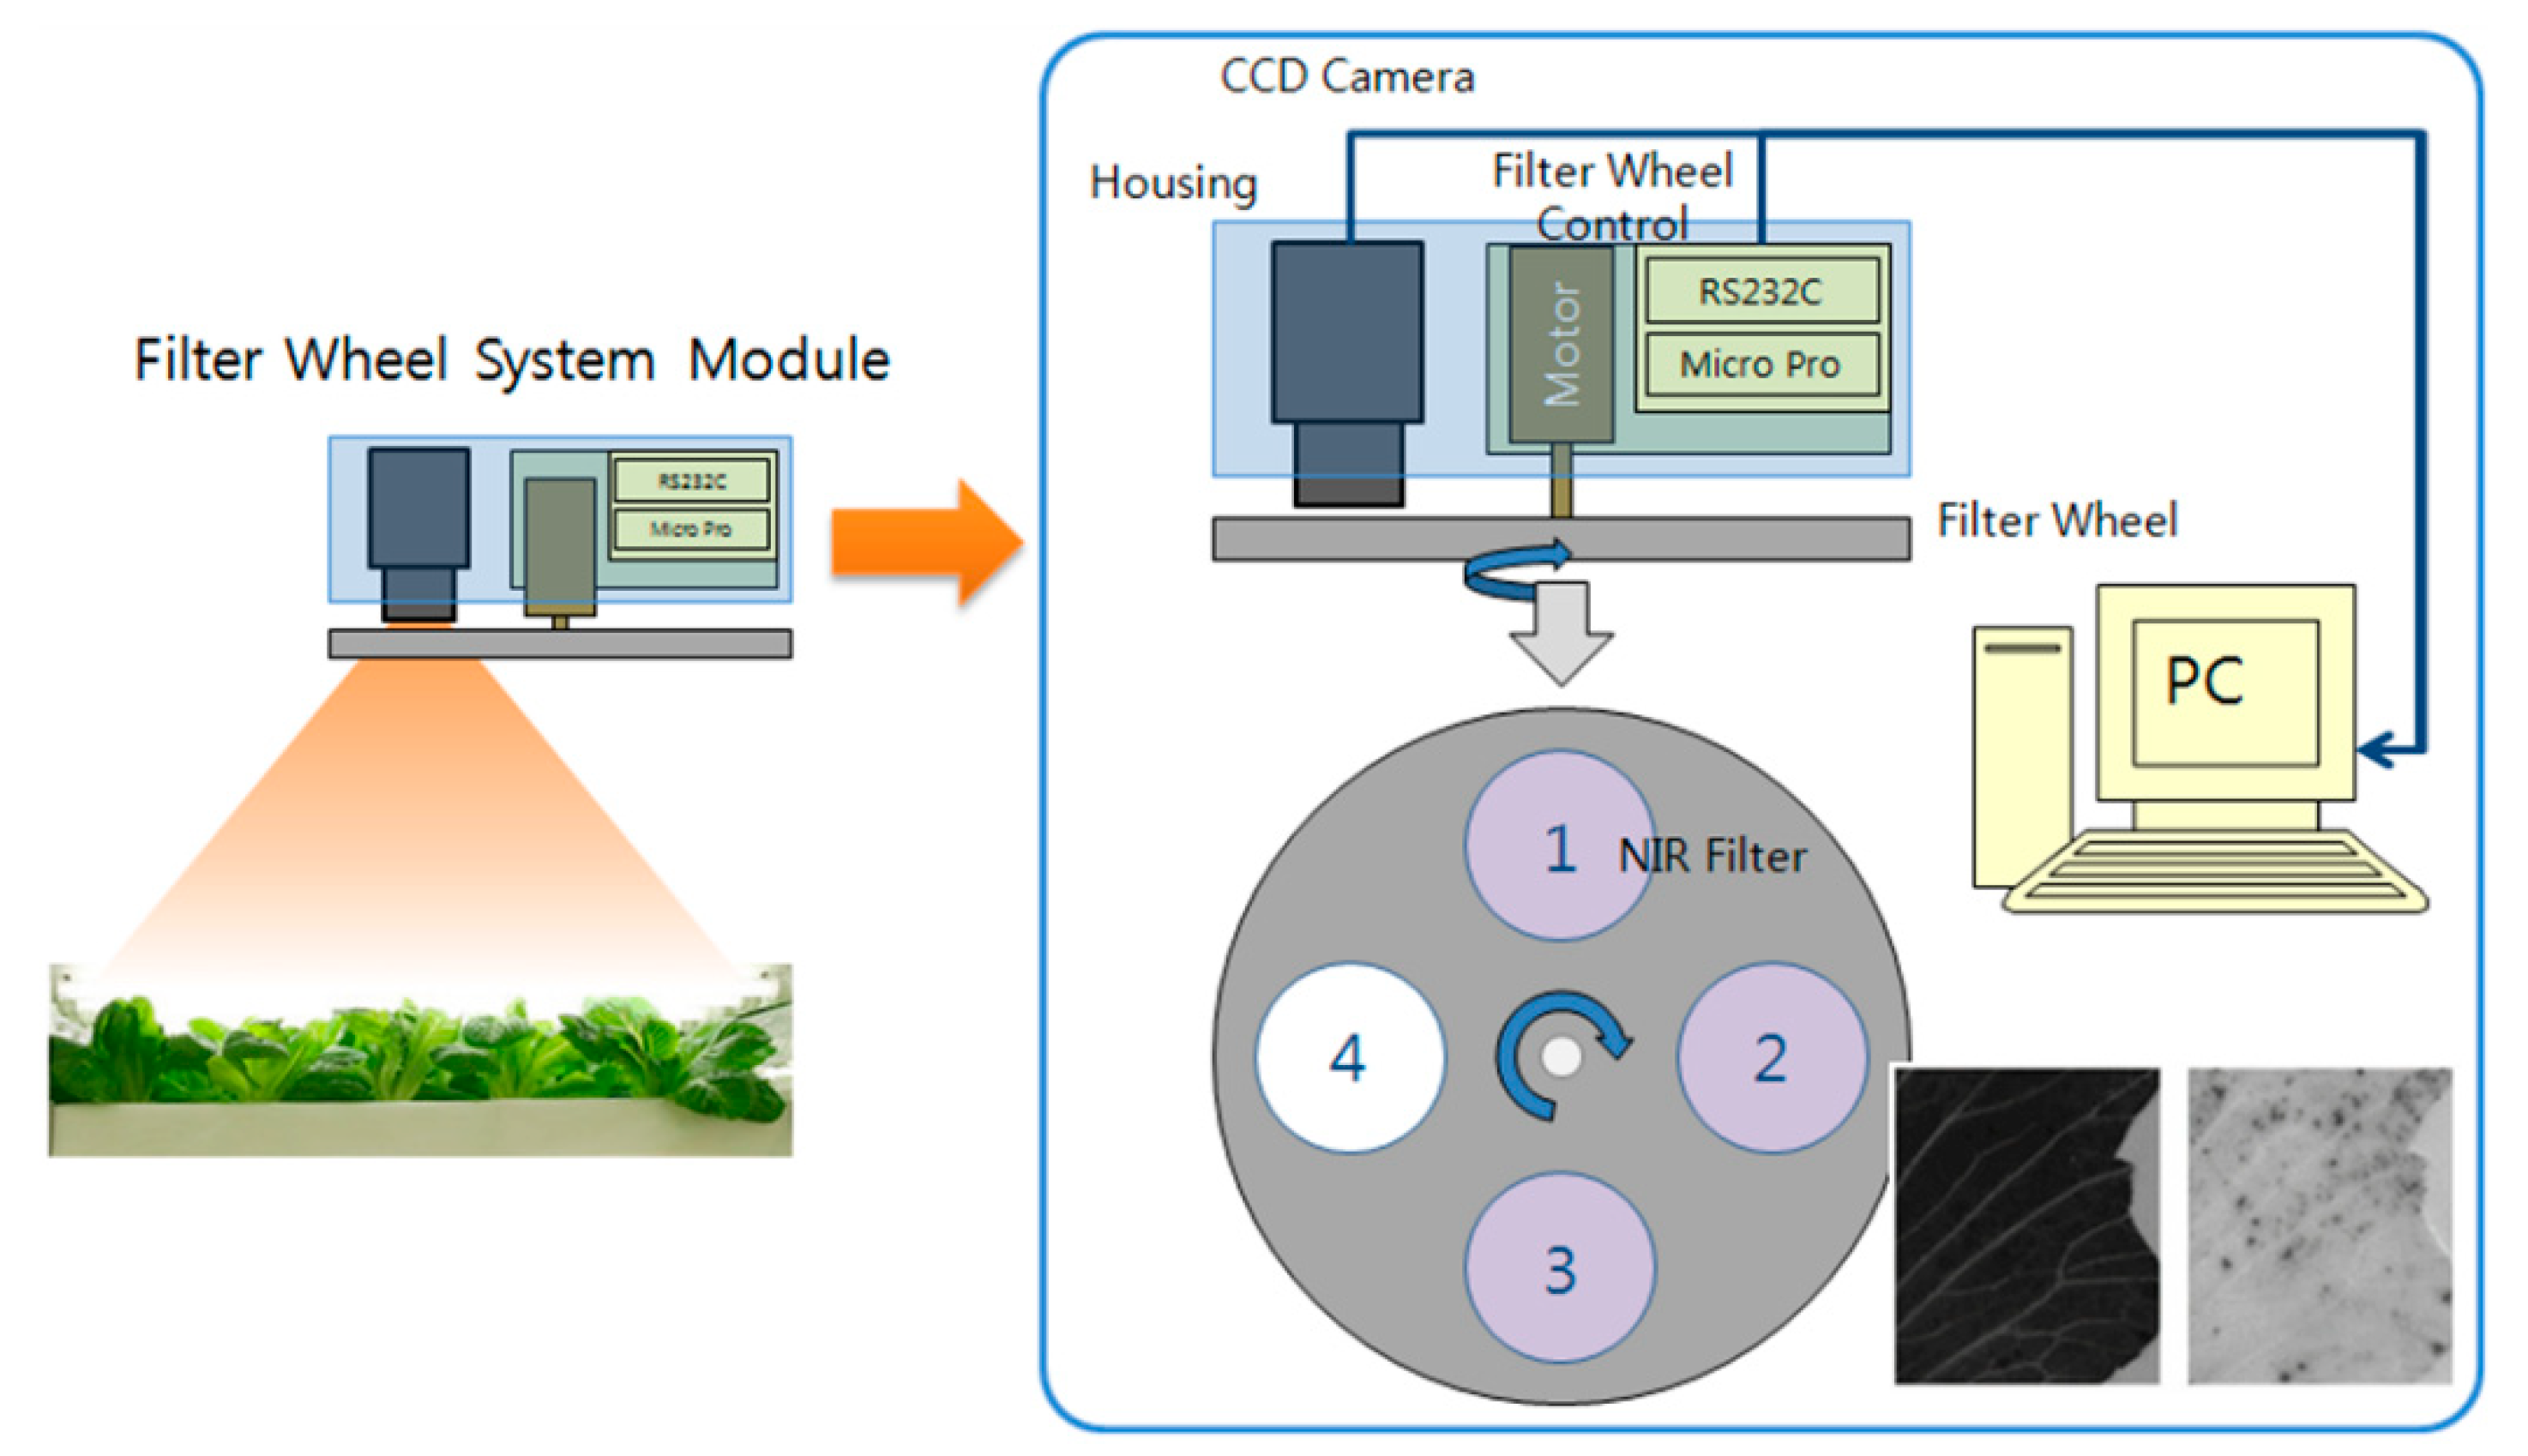
3.1. Analysis of Optical Spectral Characteristics in Near-Infrared (NIR) Range Following Crop Growth Performance
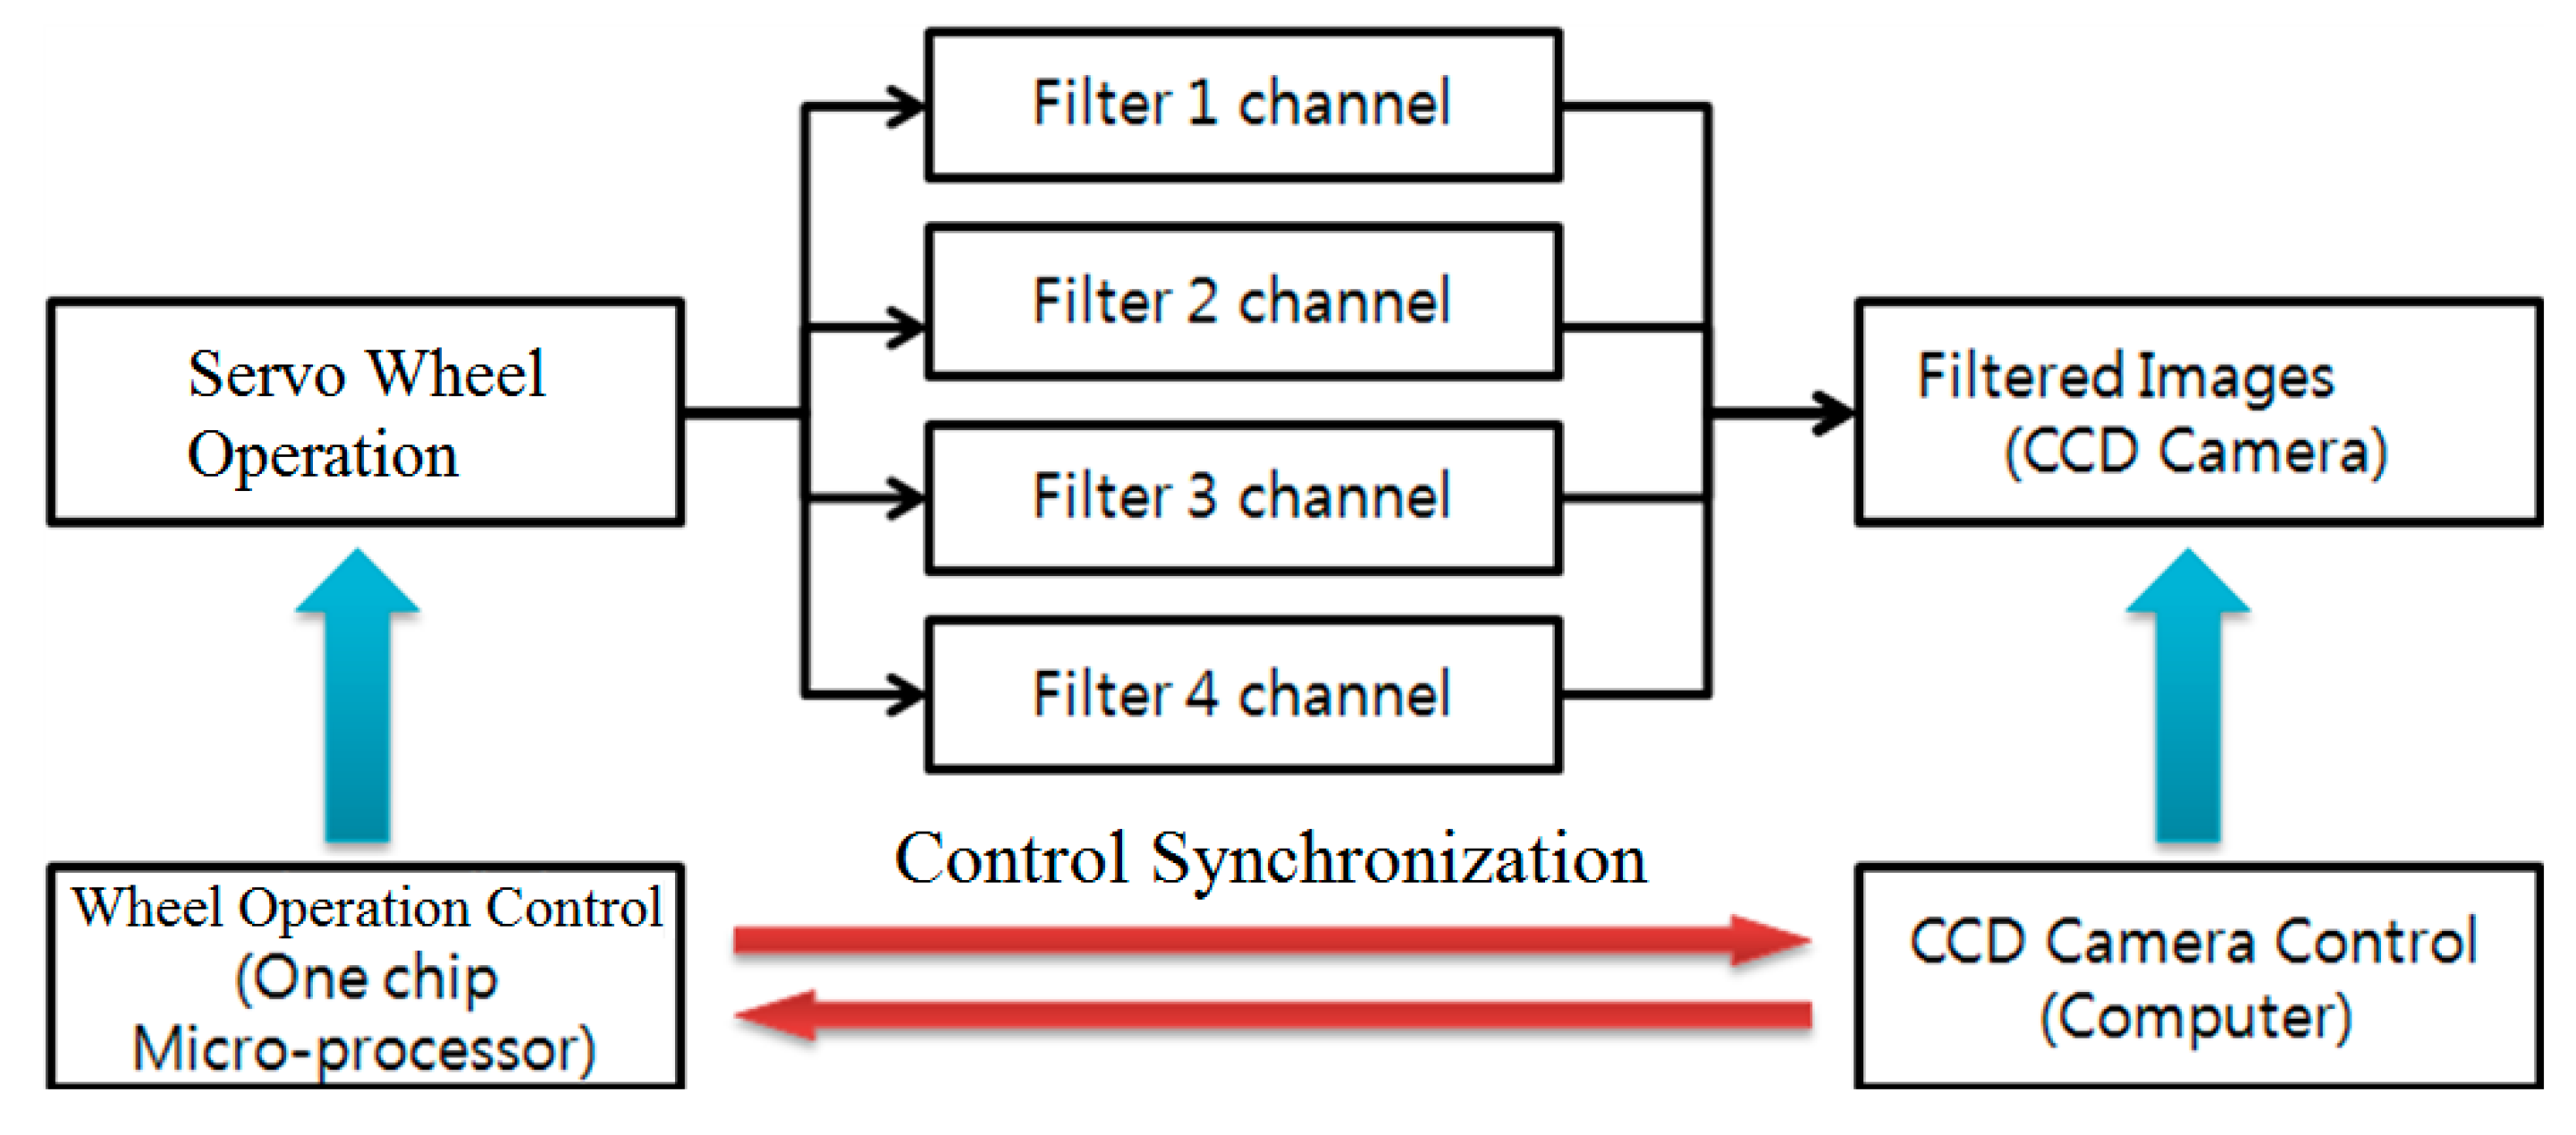
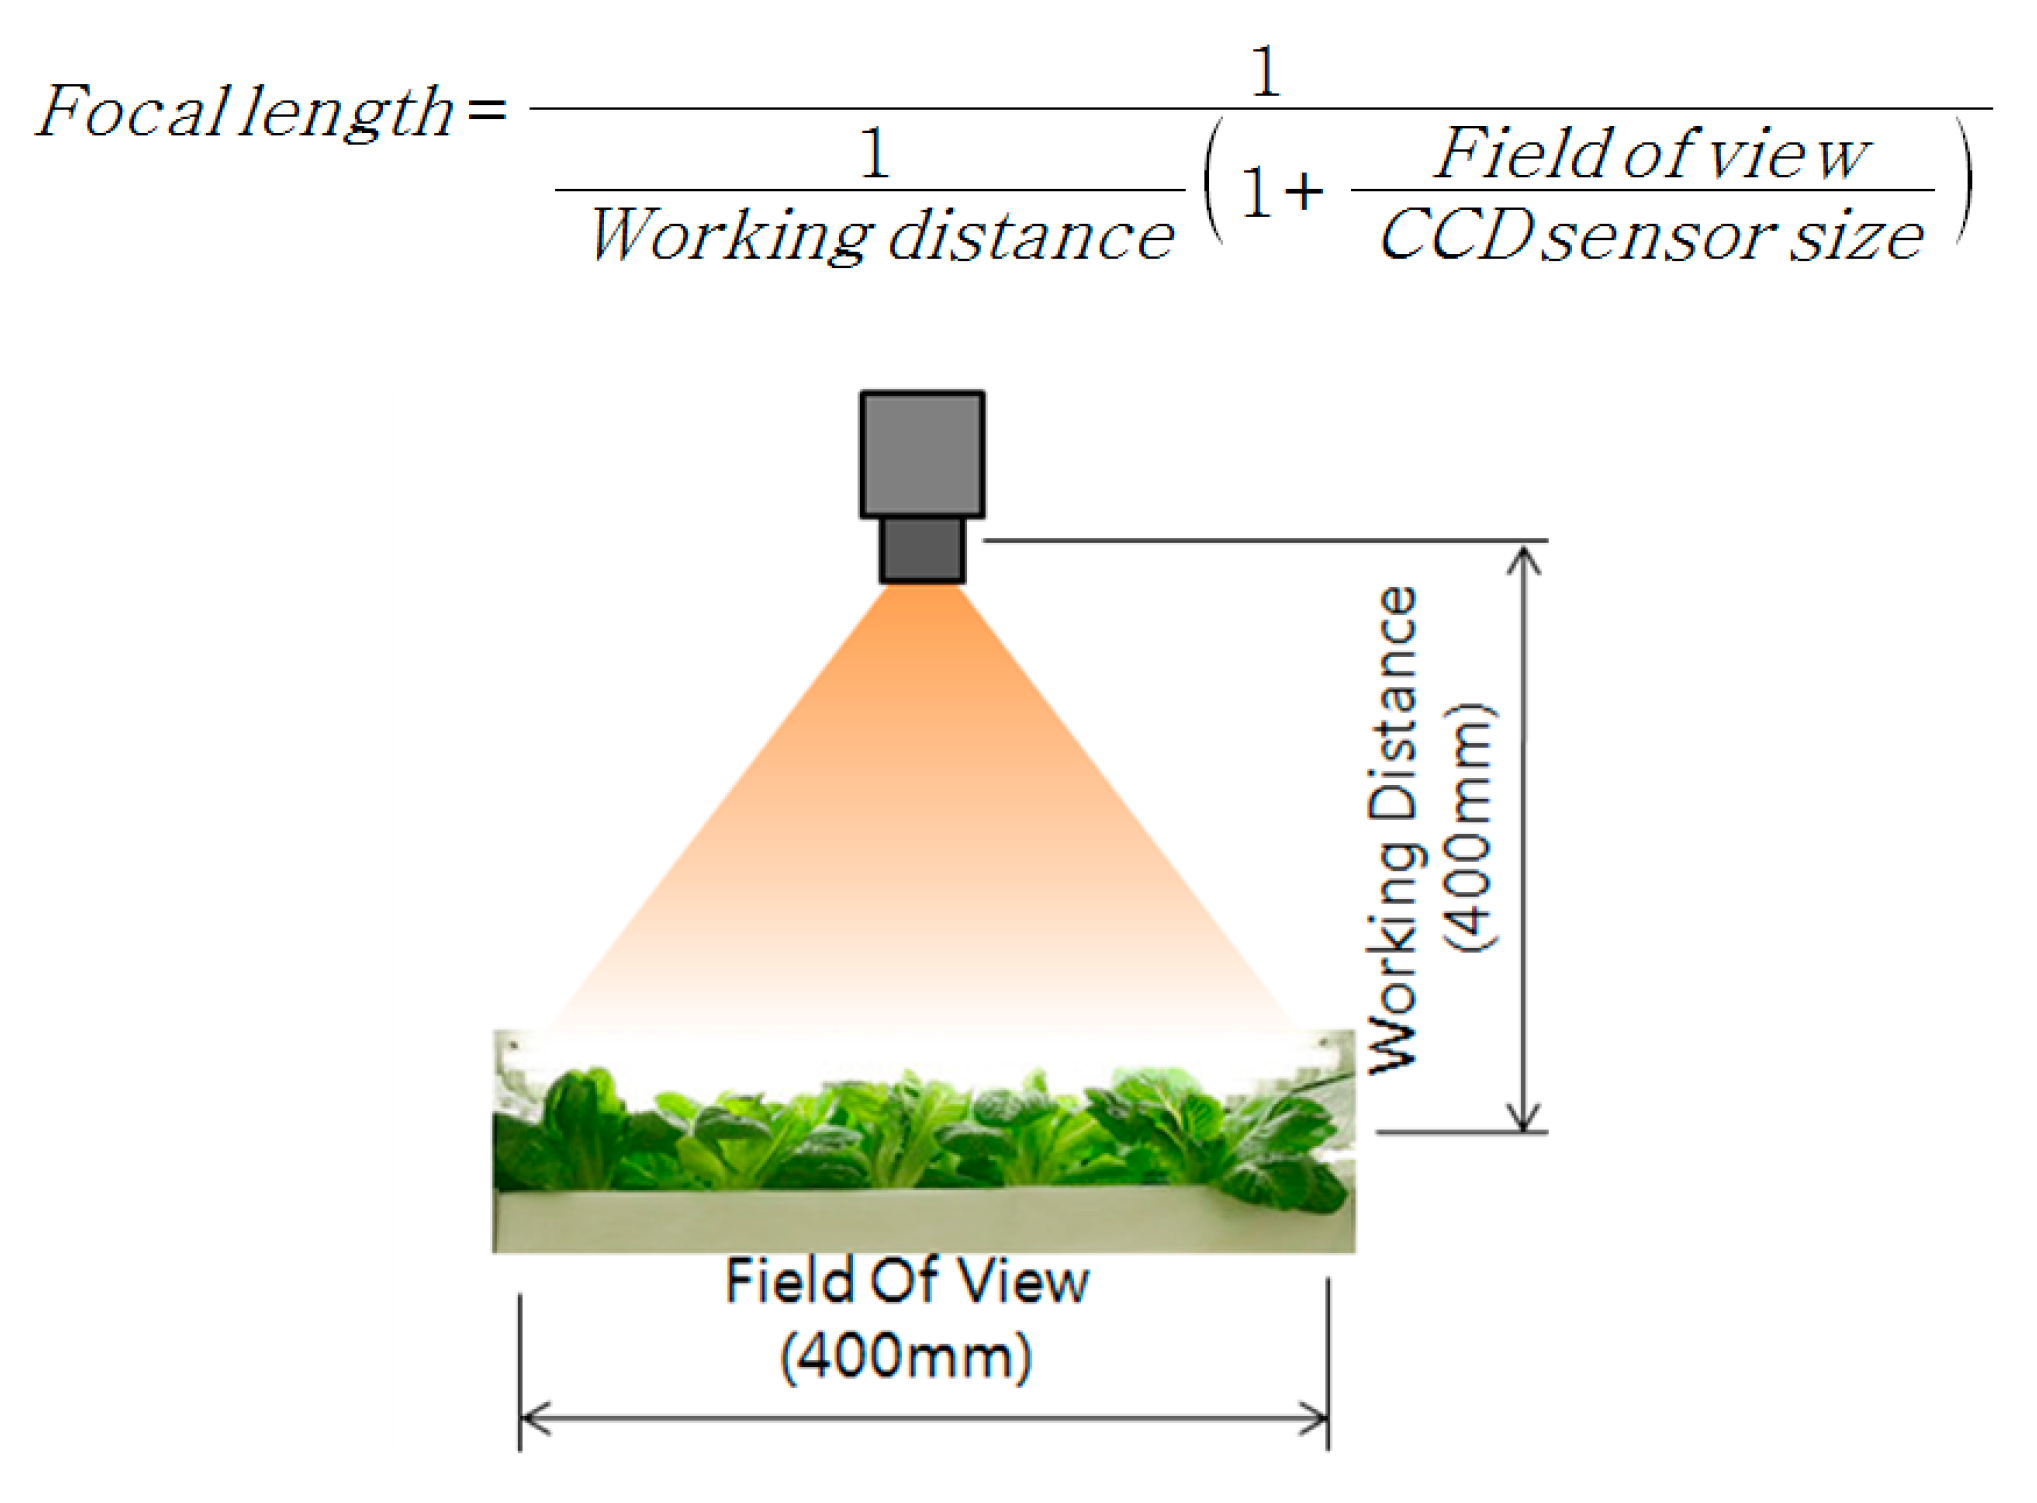
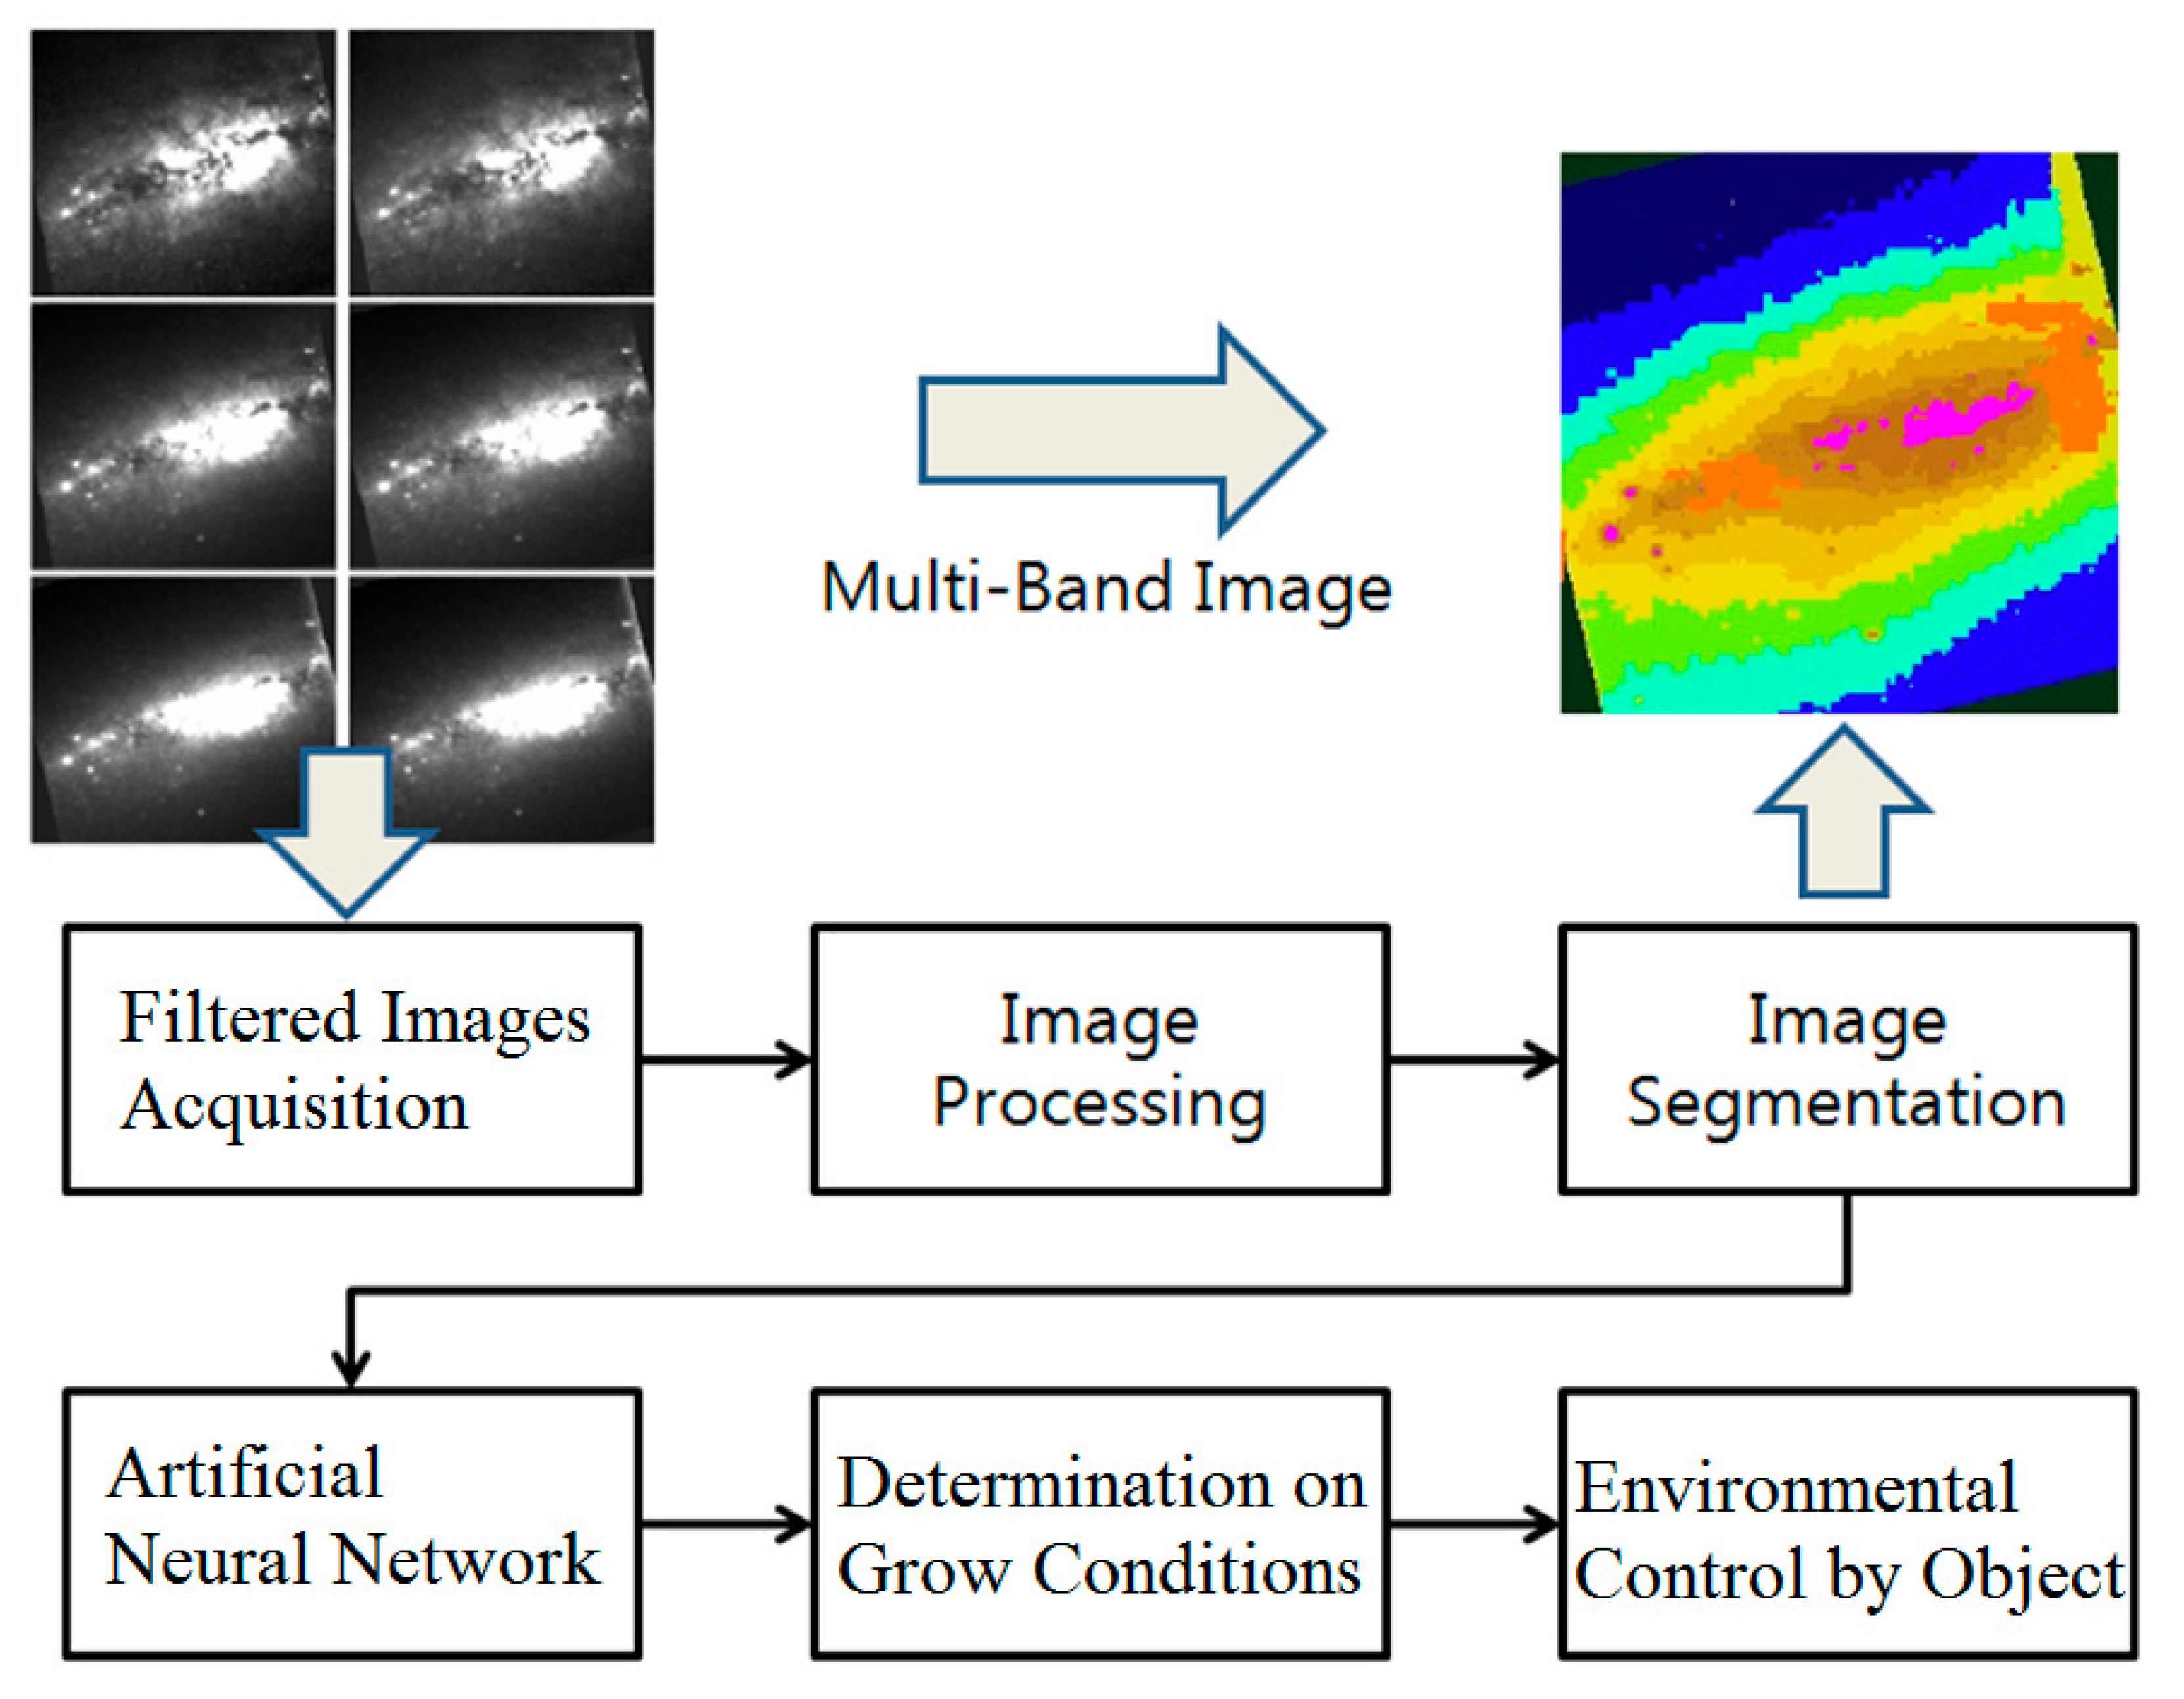
3.2. Analysis of Crop Growth Characteristics by Images and System Design and Construction: Imaging System Design Using Spectral Characteristics
3.3. Development of Crop Image Processing Algorithm for Determination of Required Environmental Controlled Variables
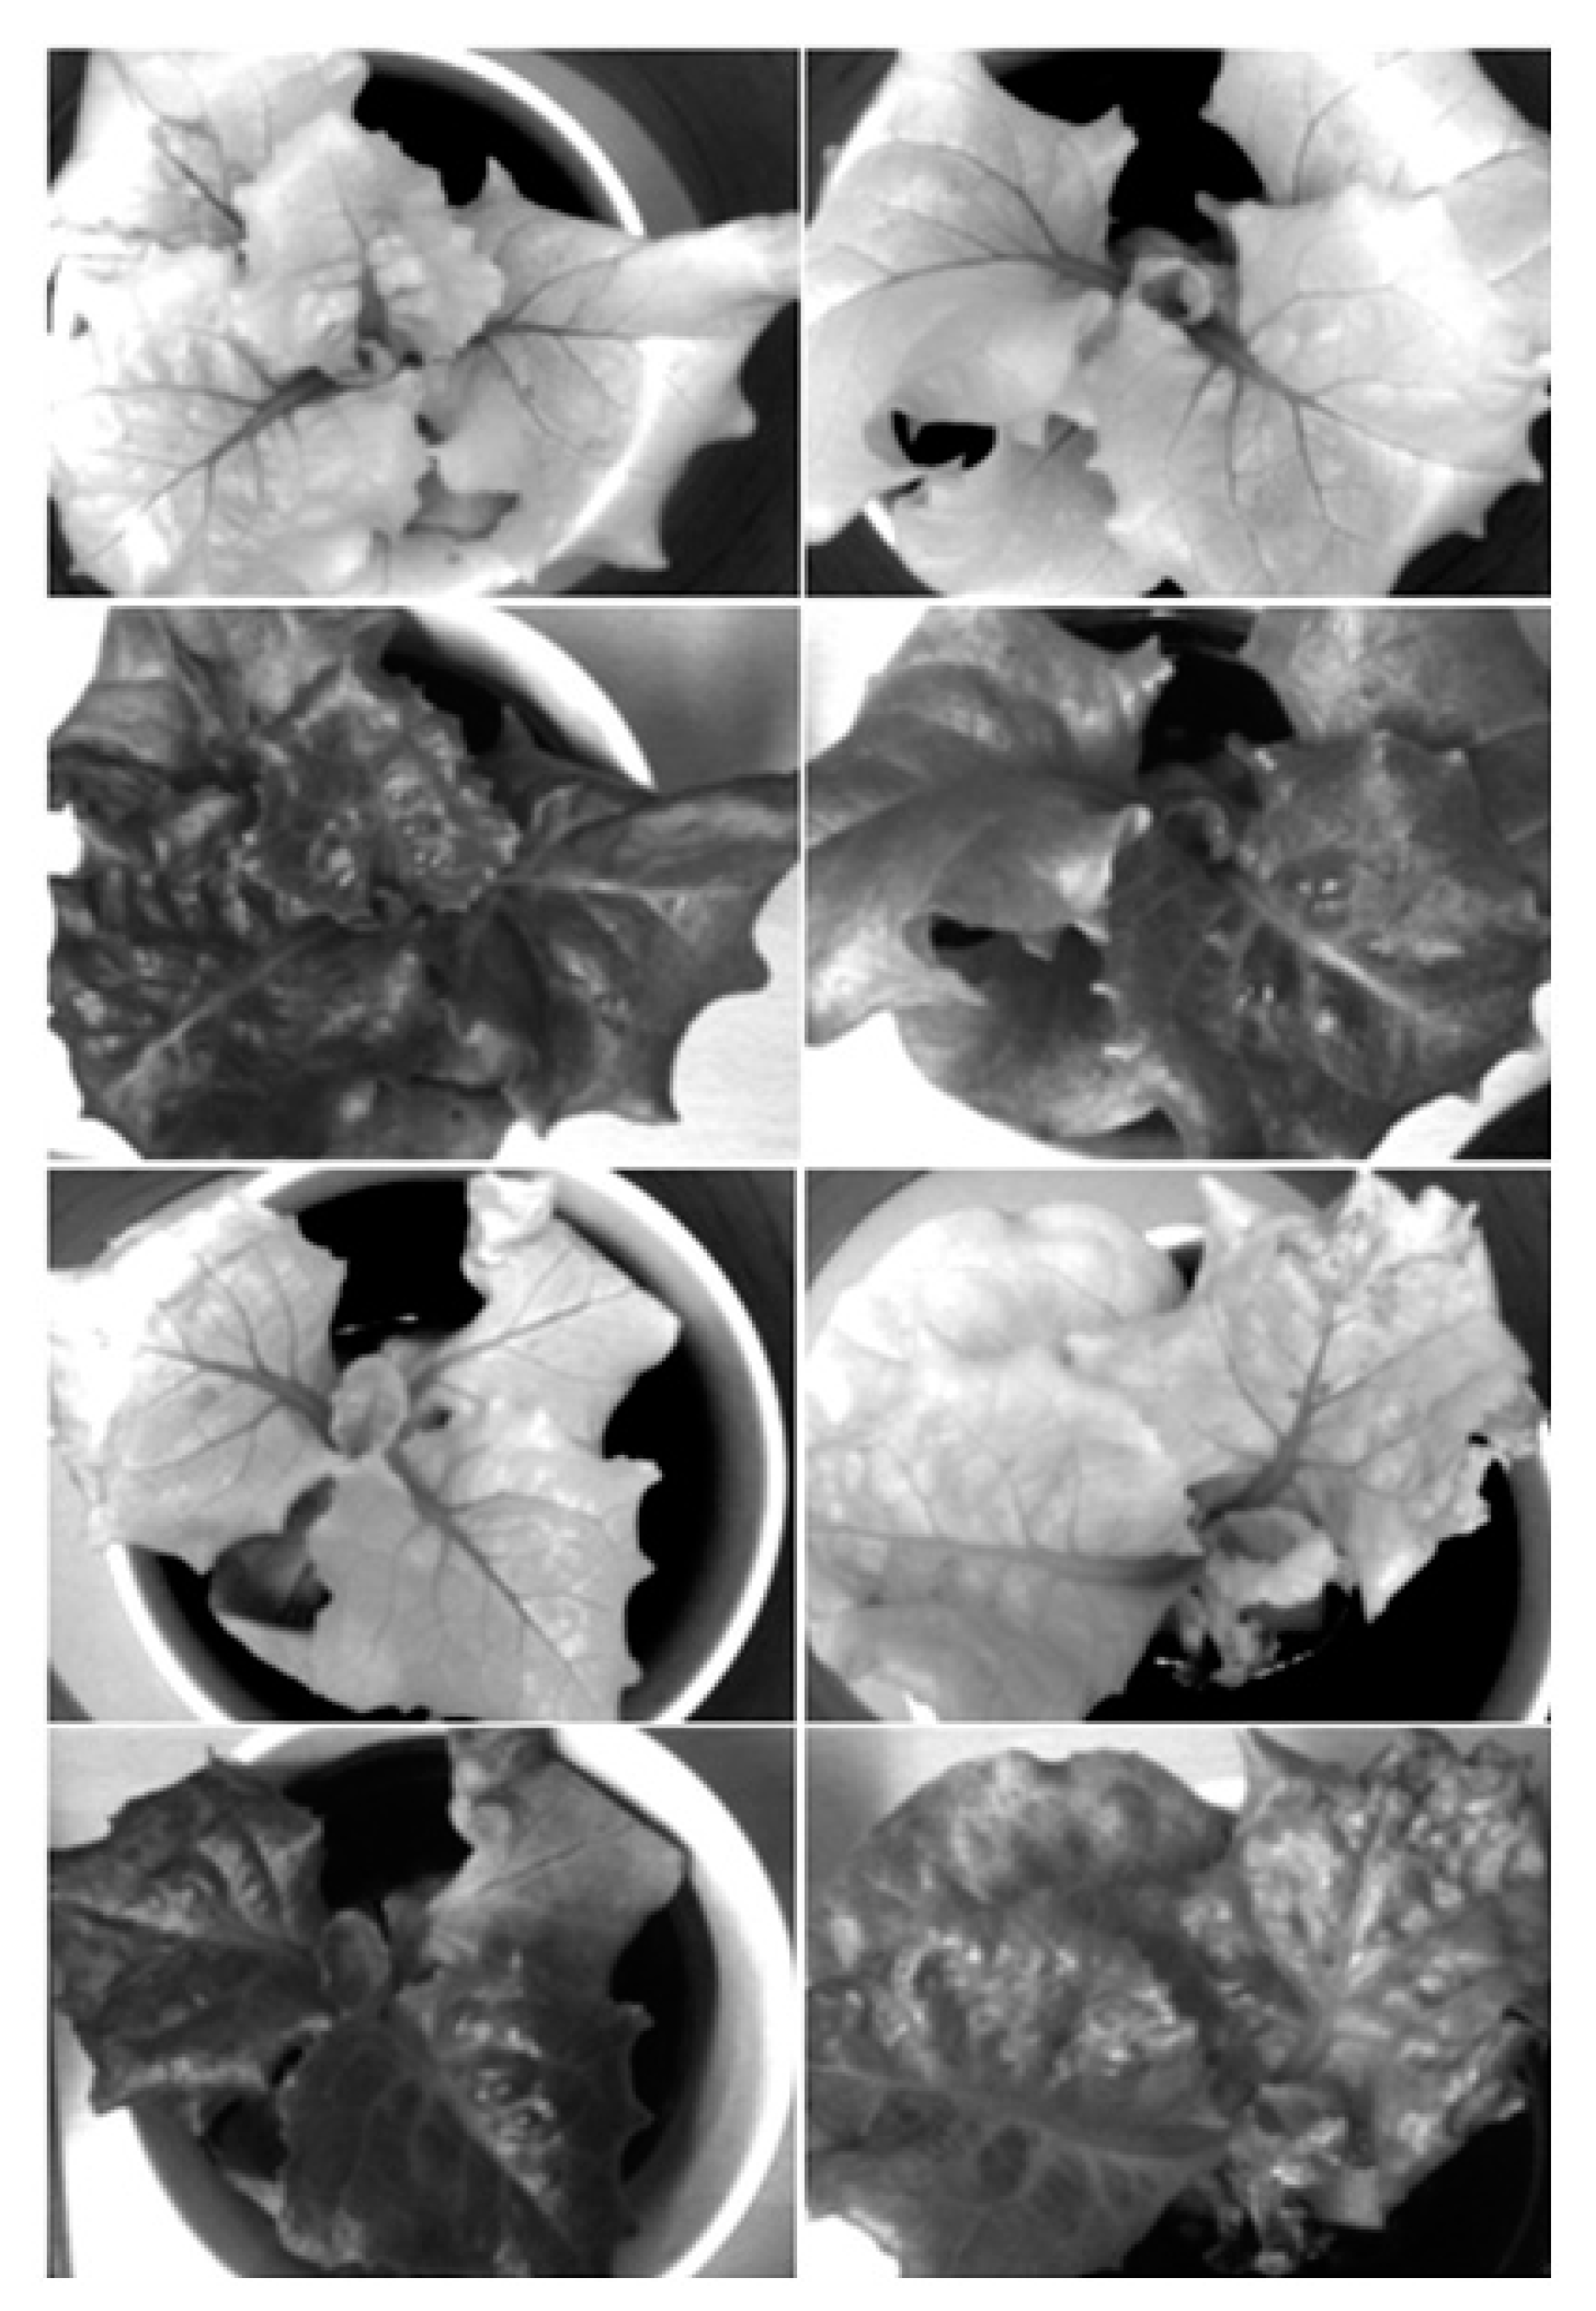
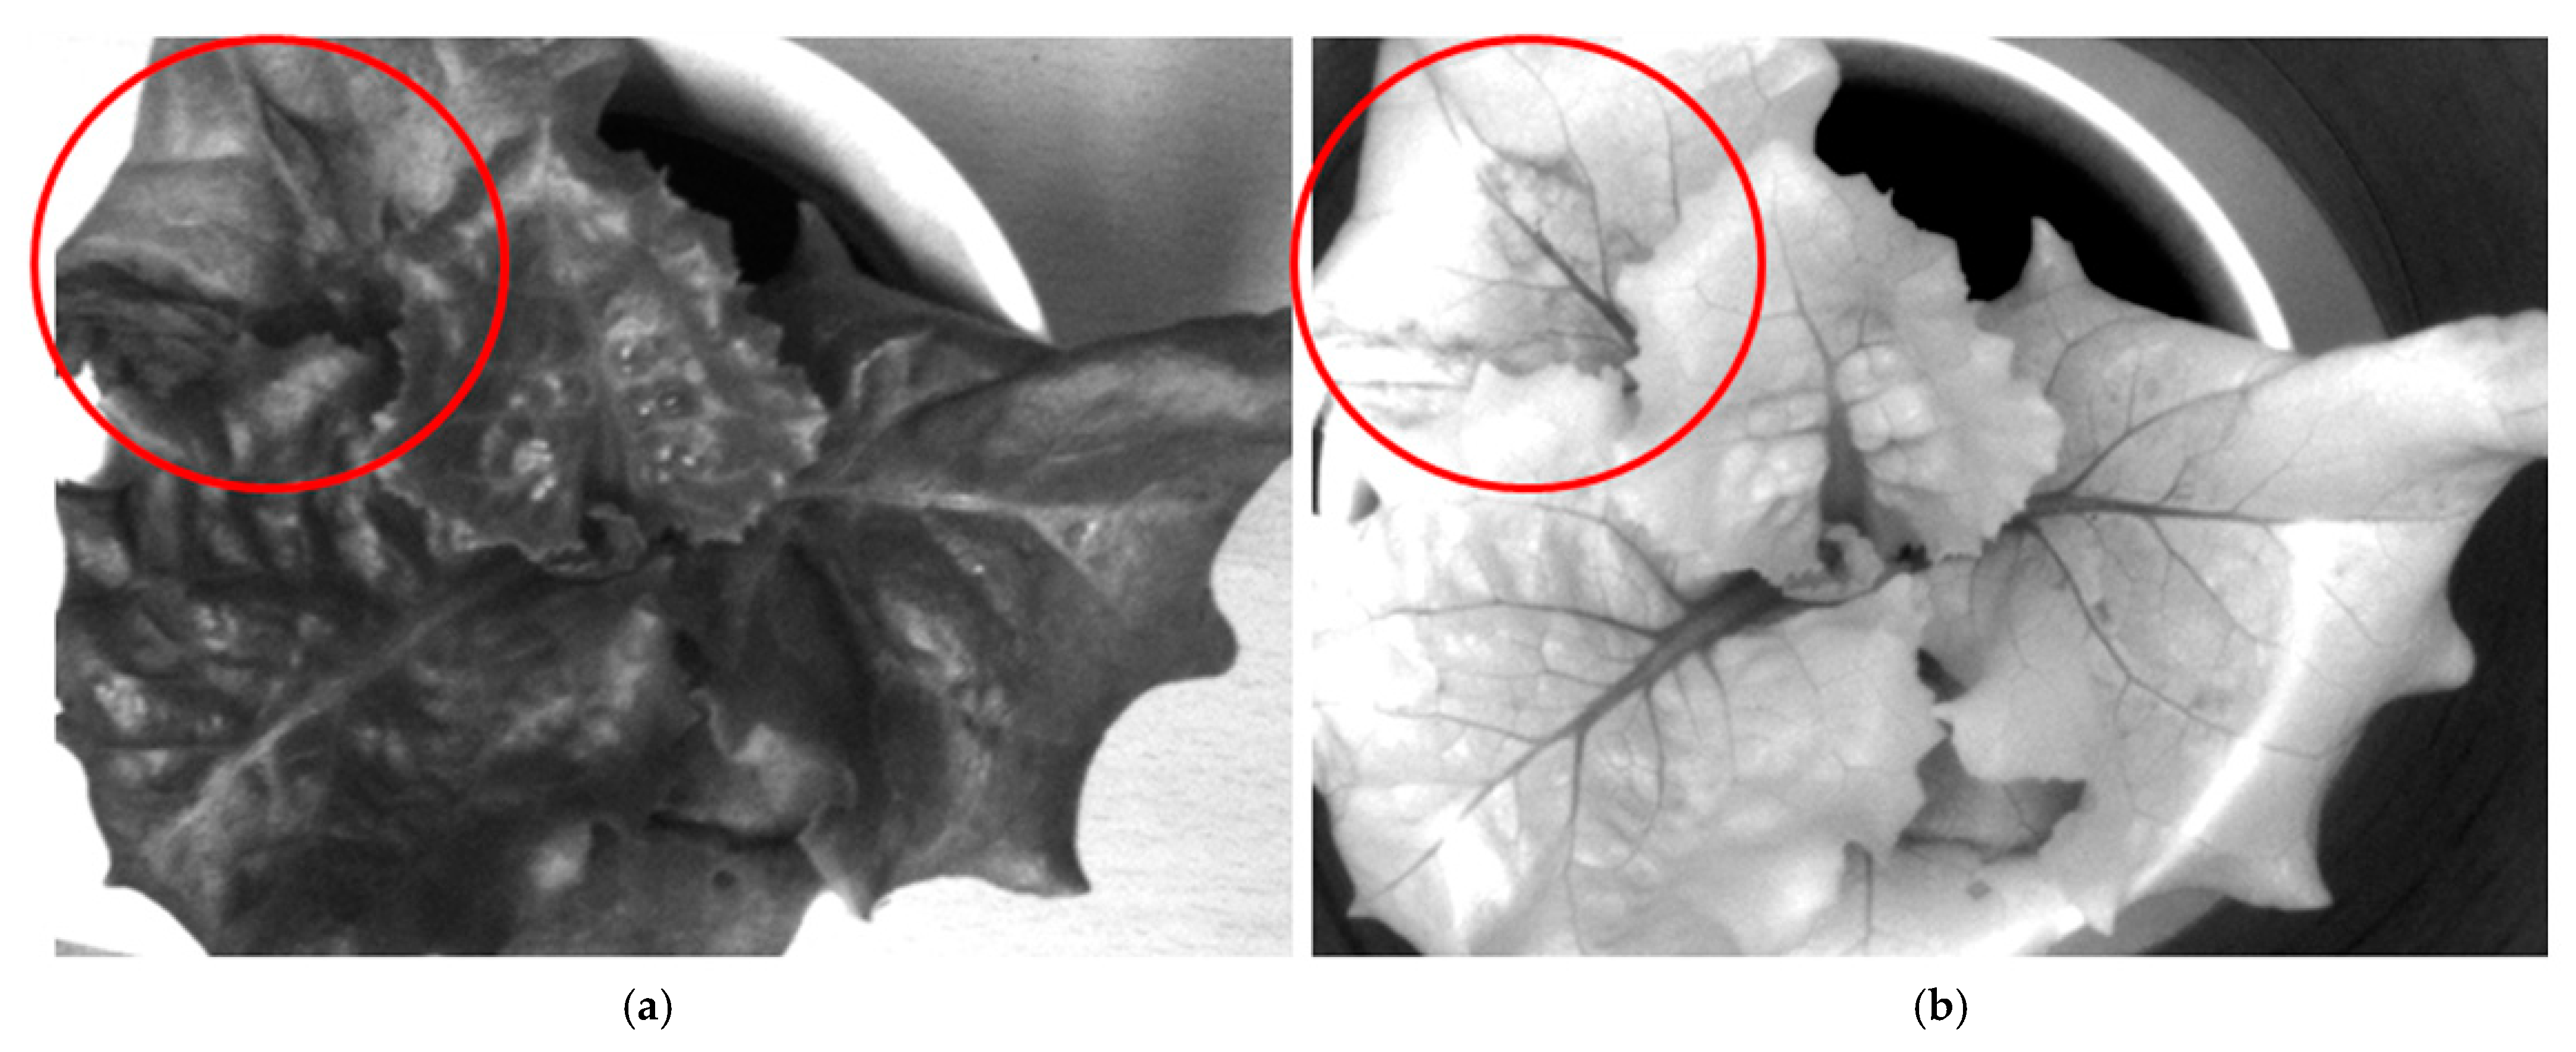
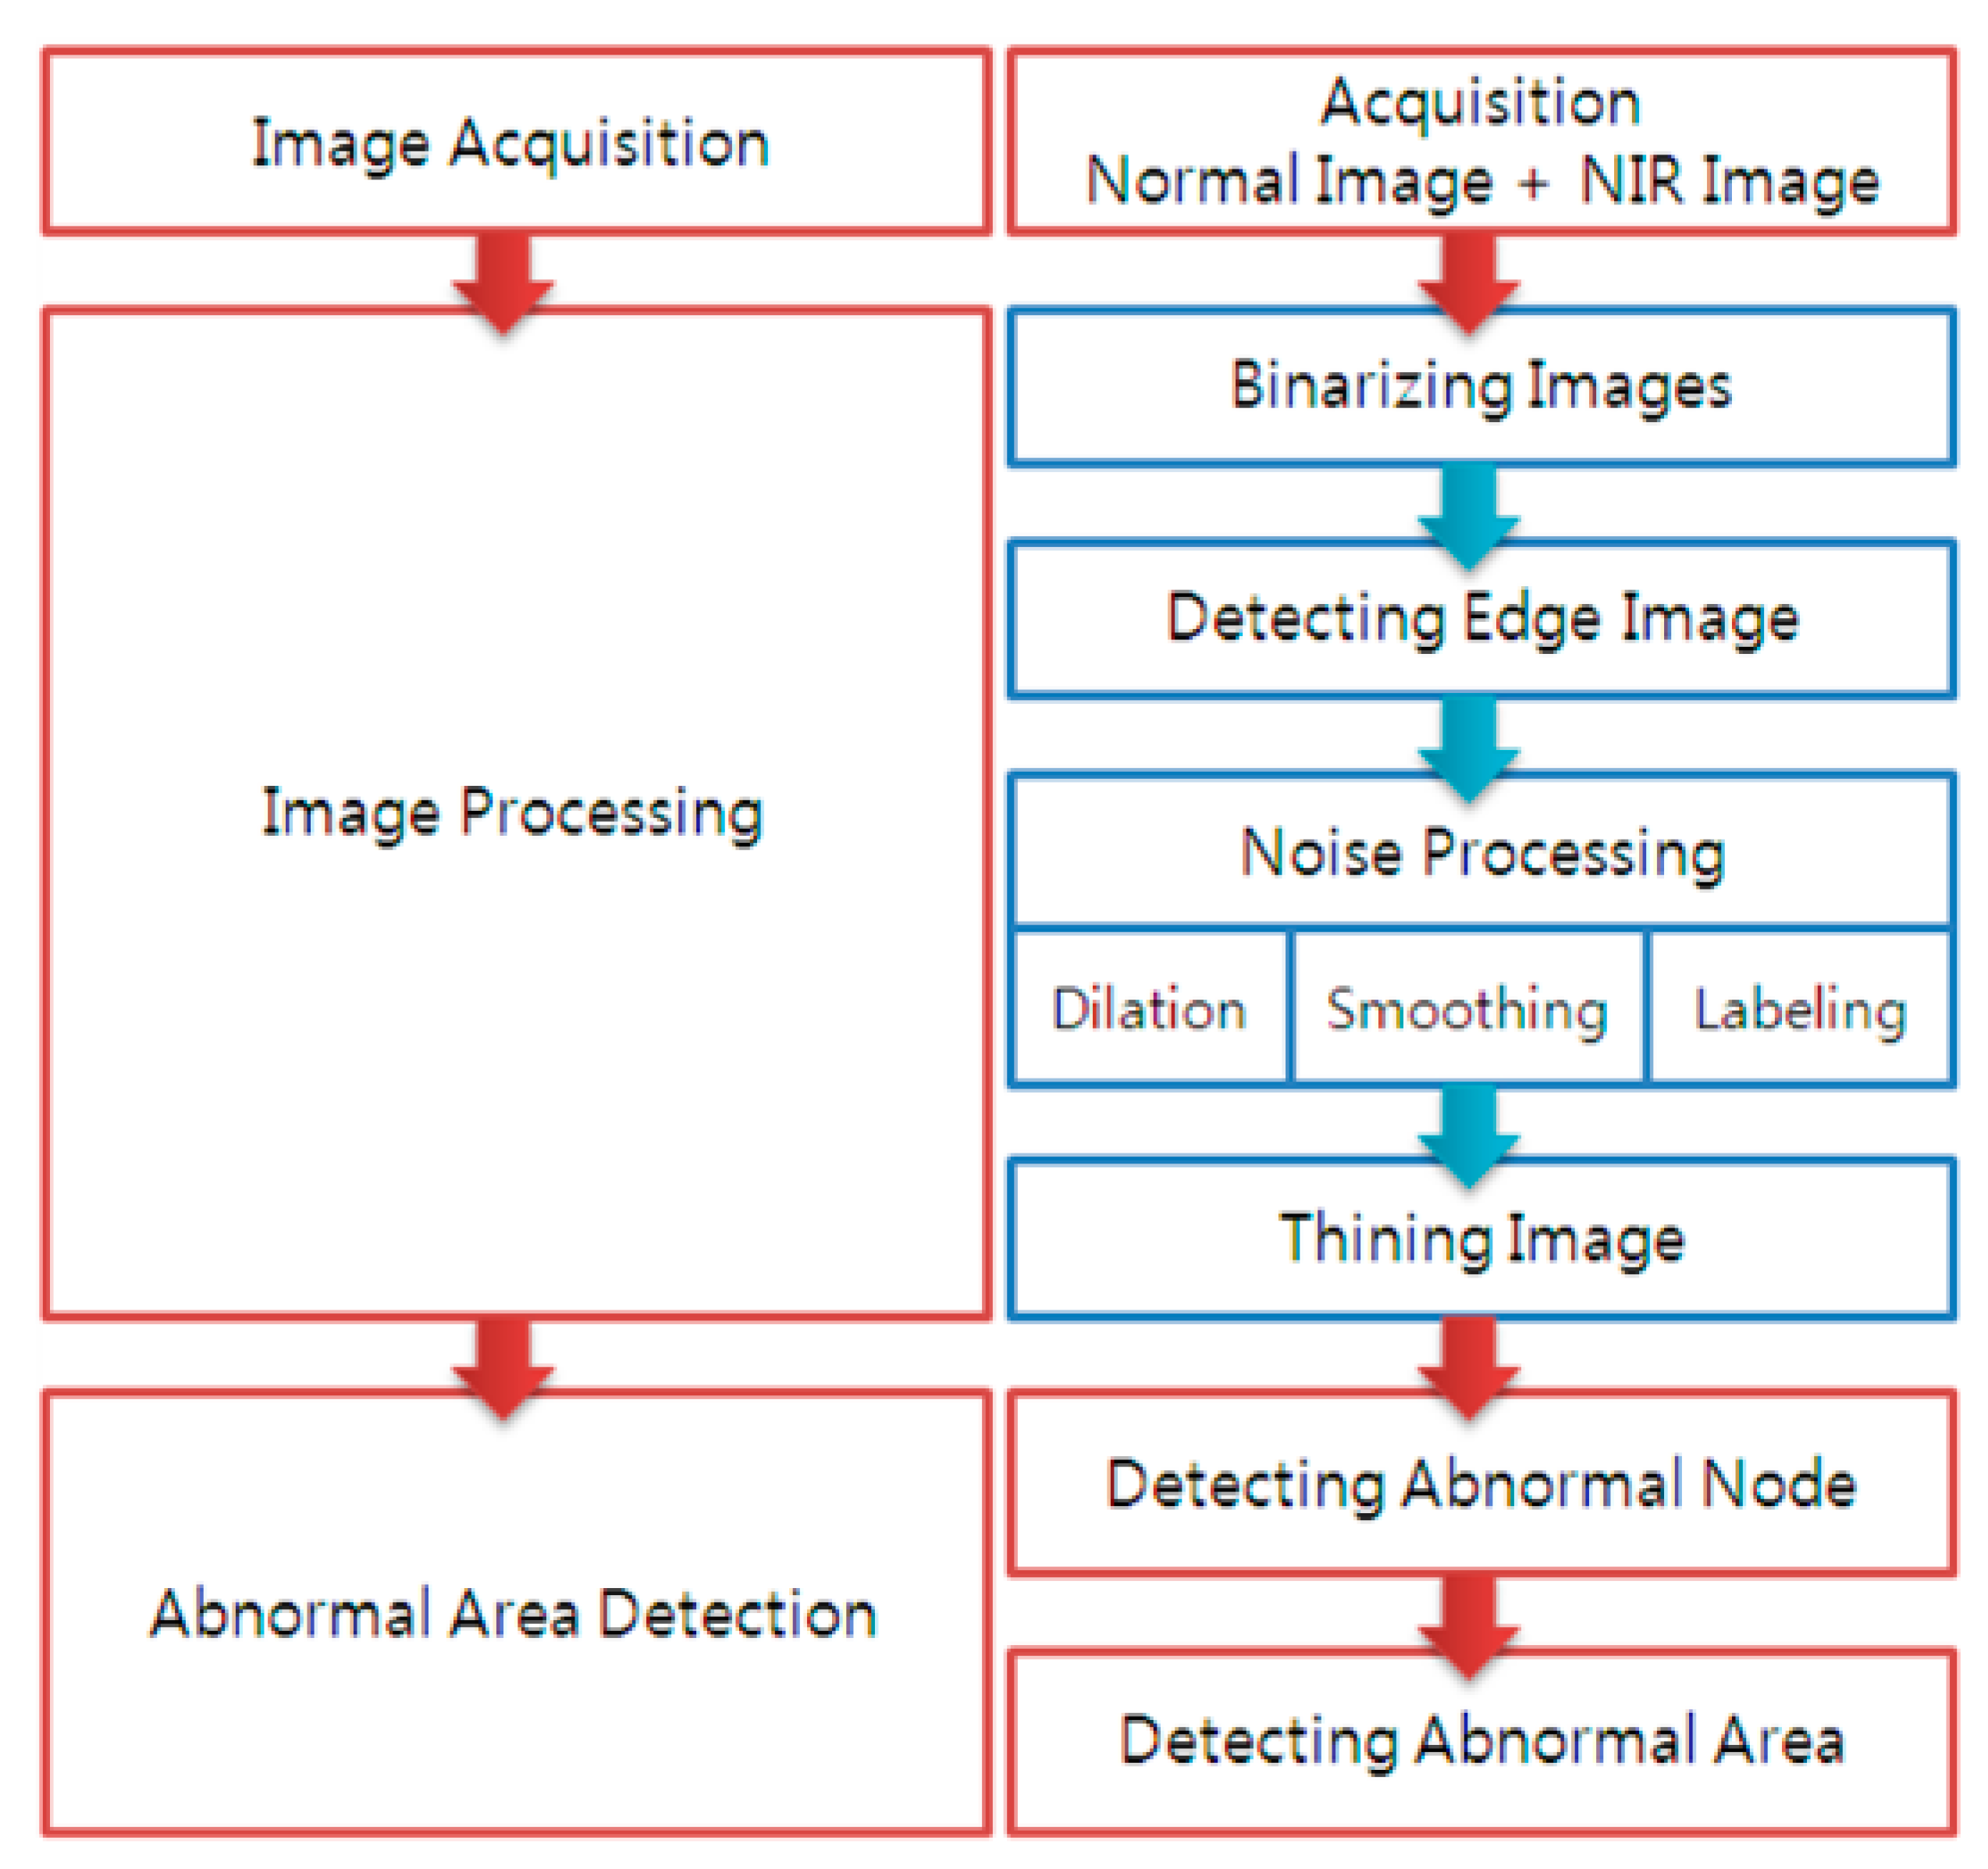
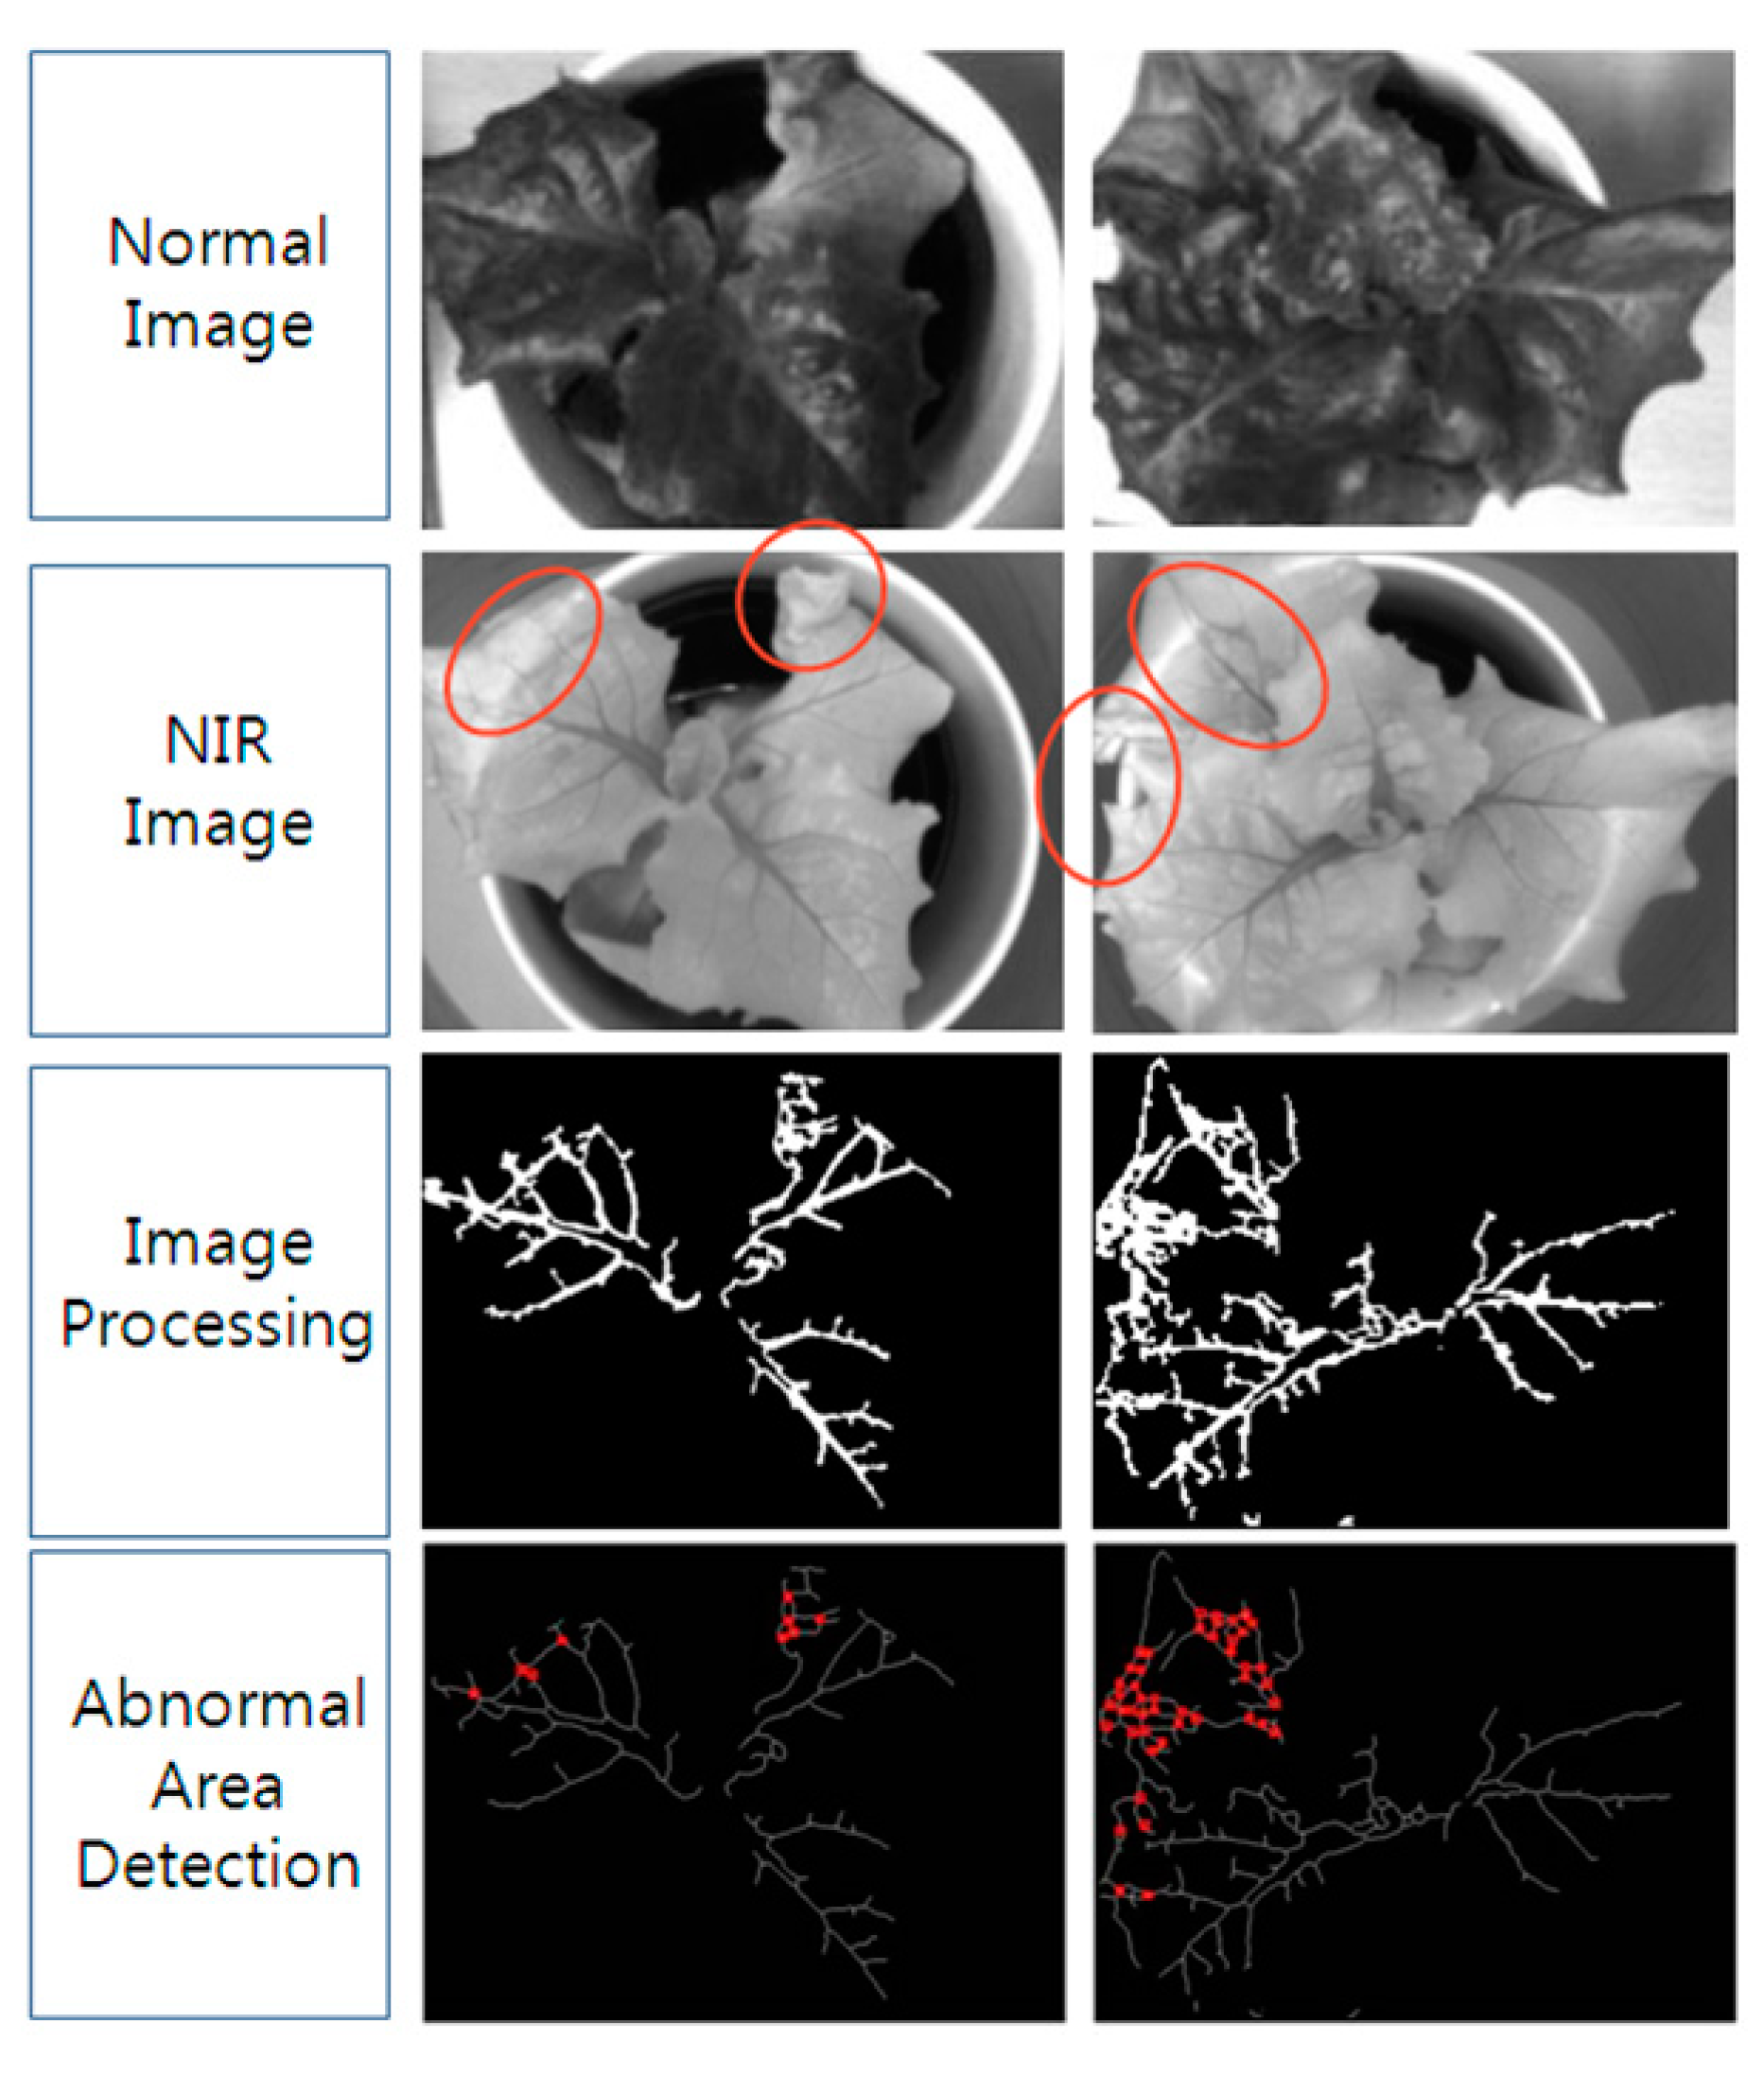
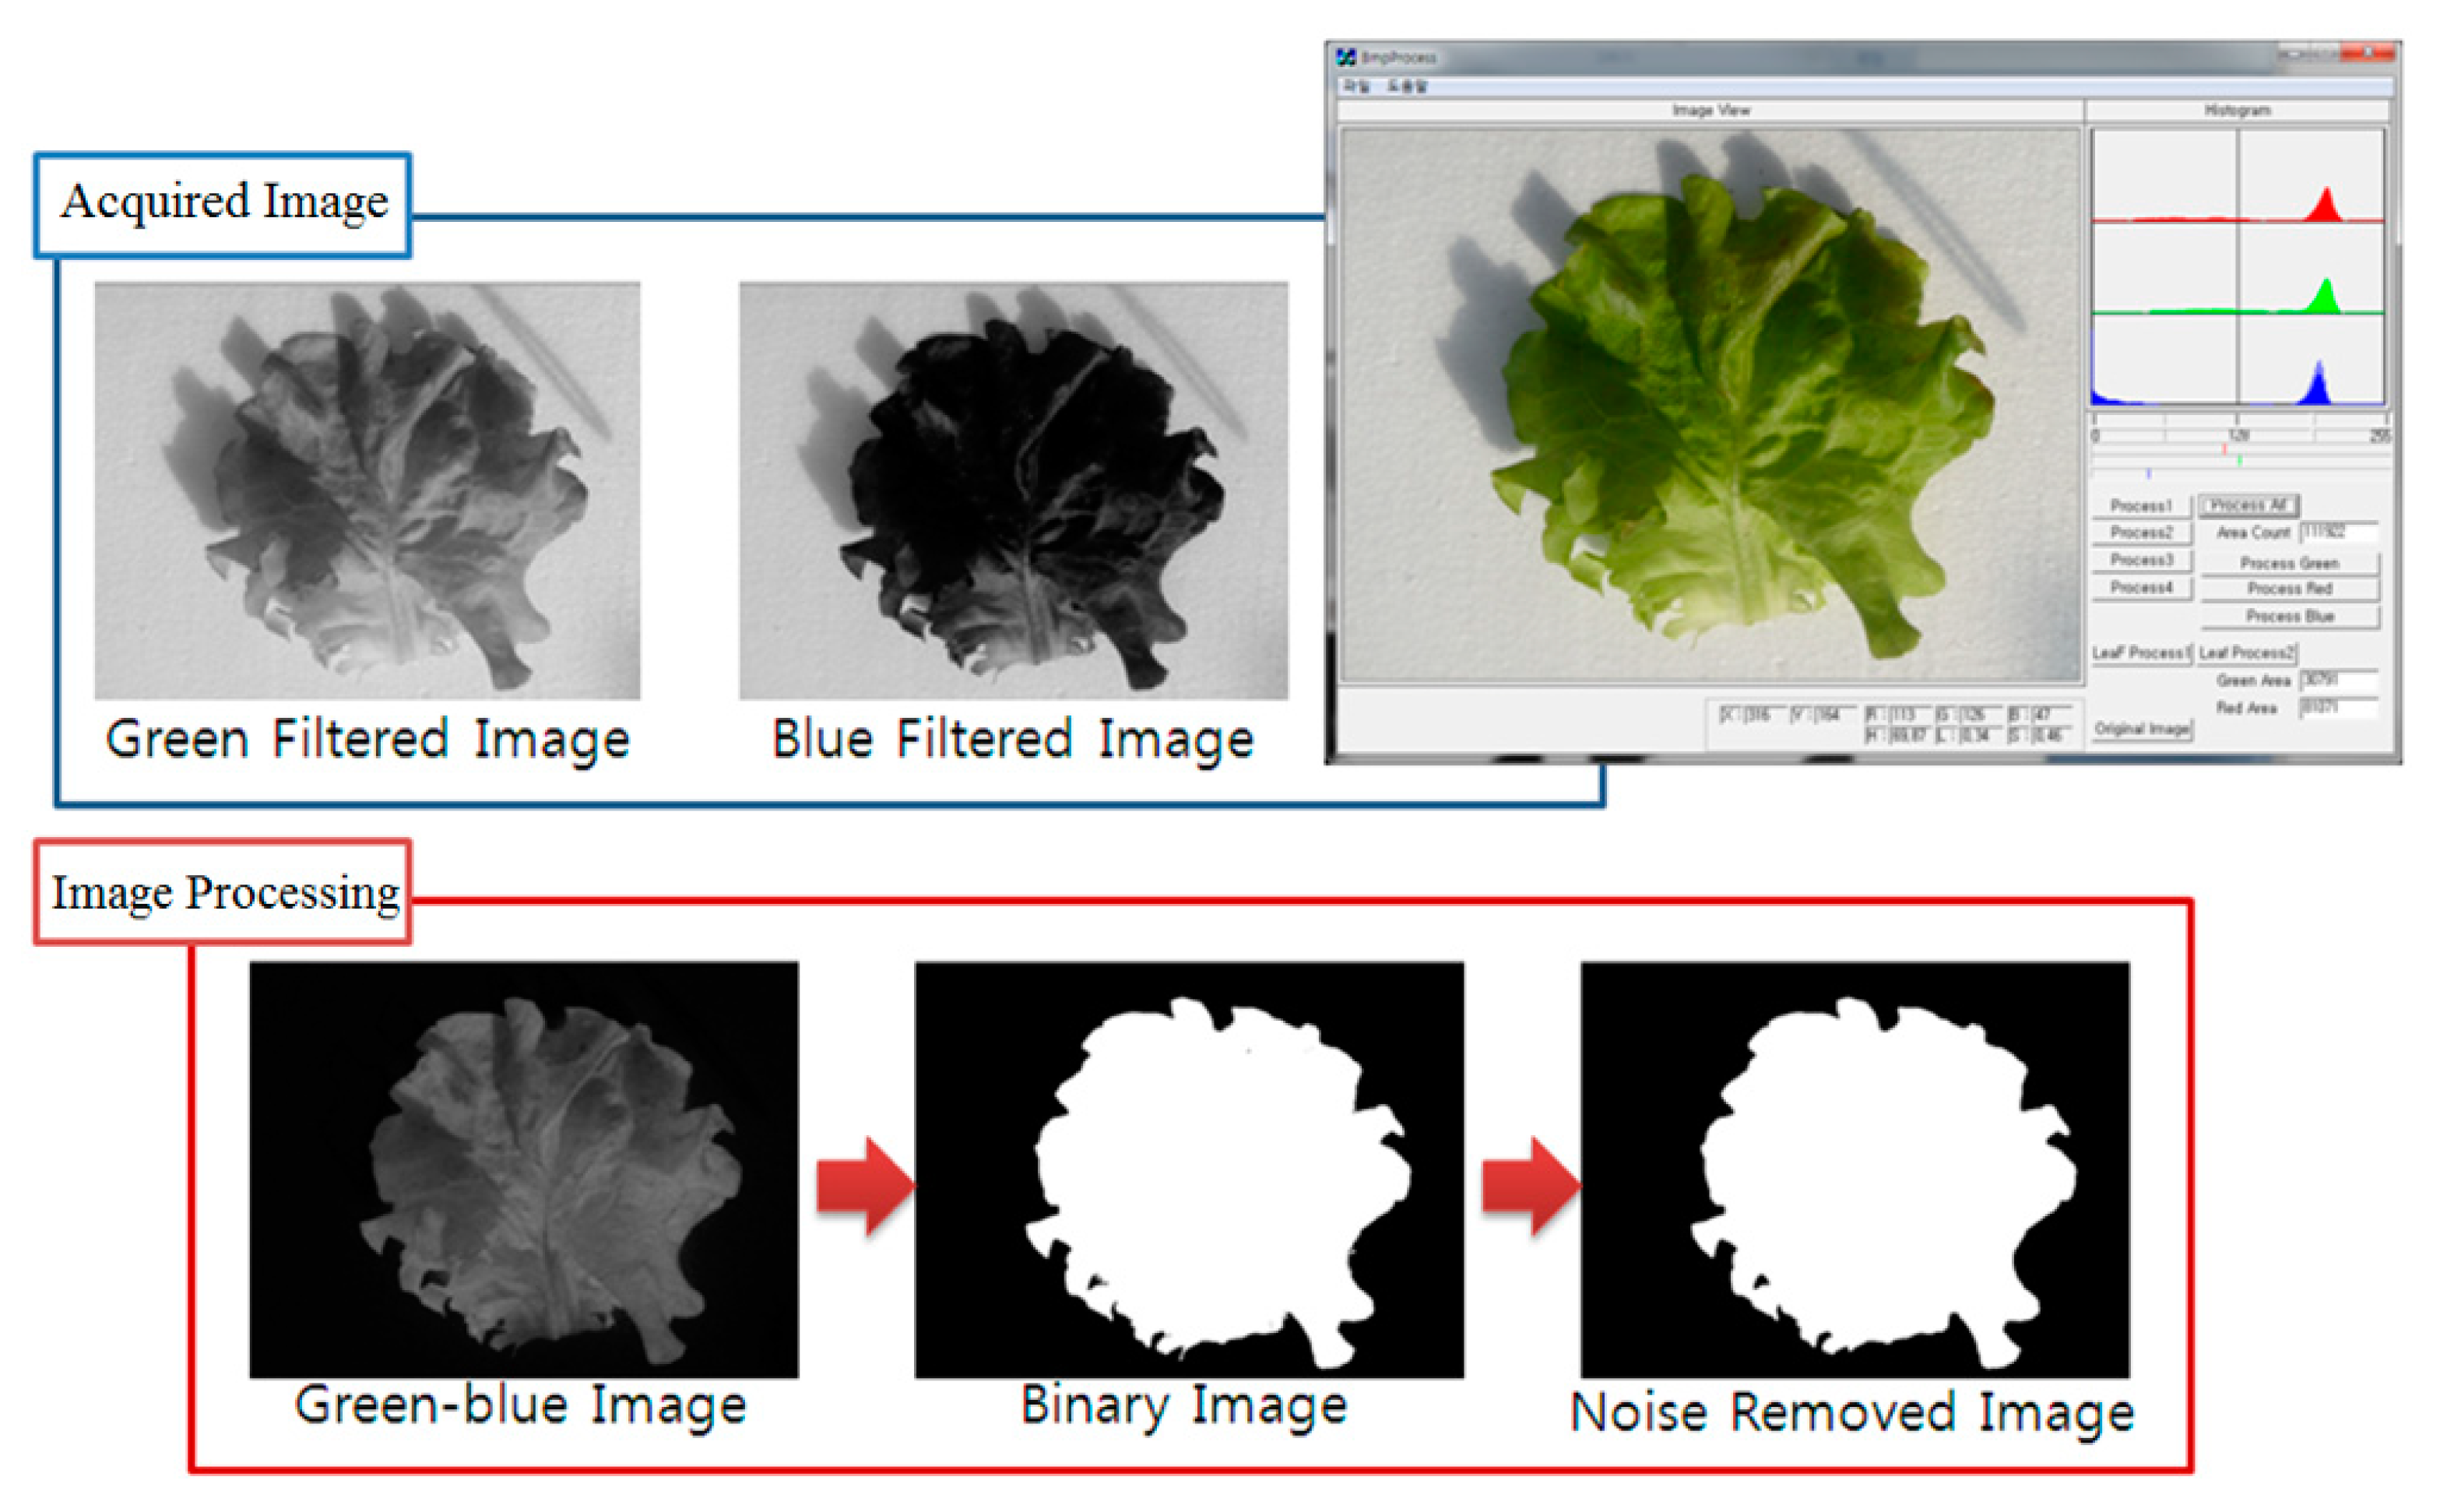
3.3.1. Development of Basic Image Processing Algorithm for Determination of Crop Growth: Development of an Algorithm Detecting Abnormal Parts, Based on the NIR Images
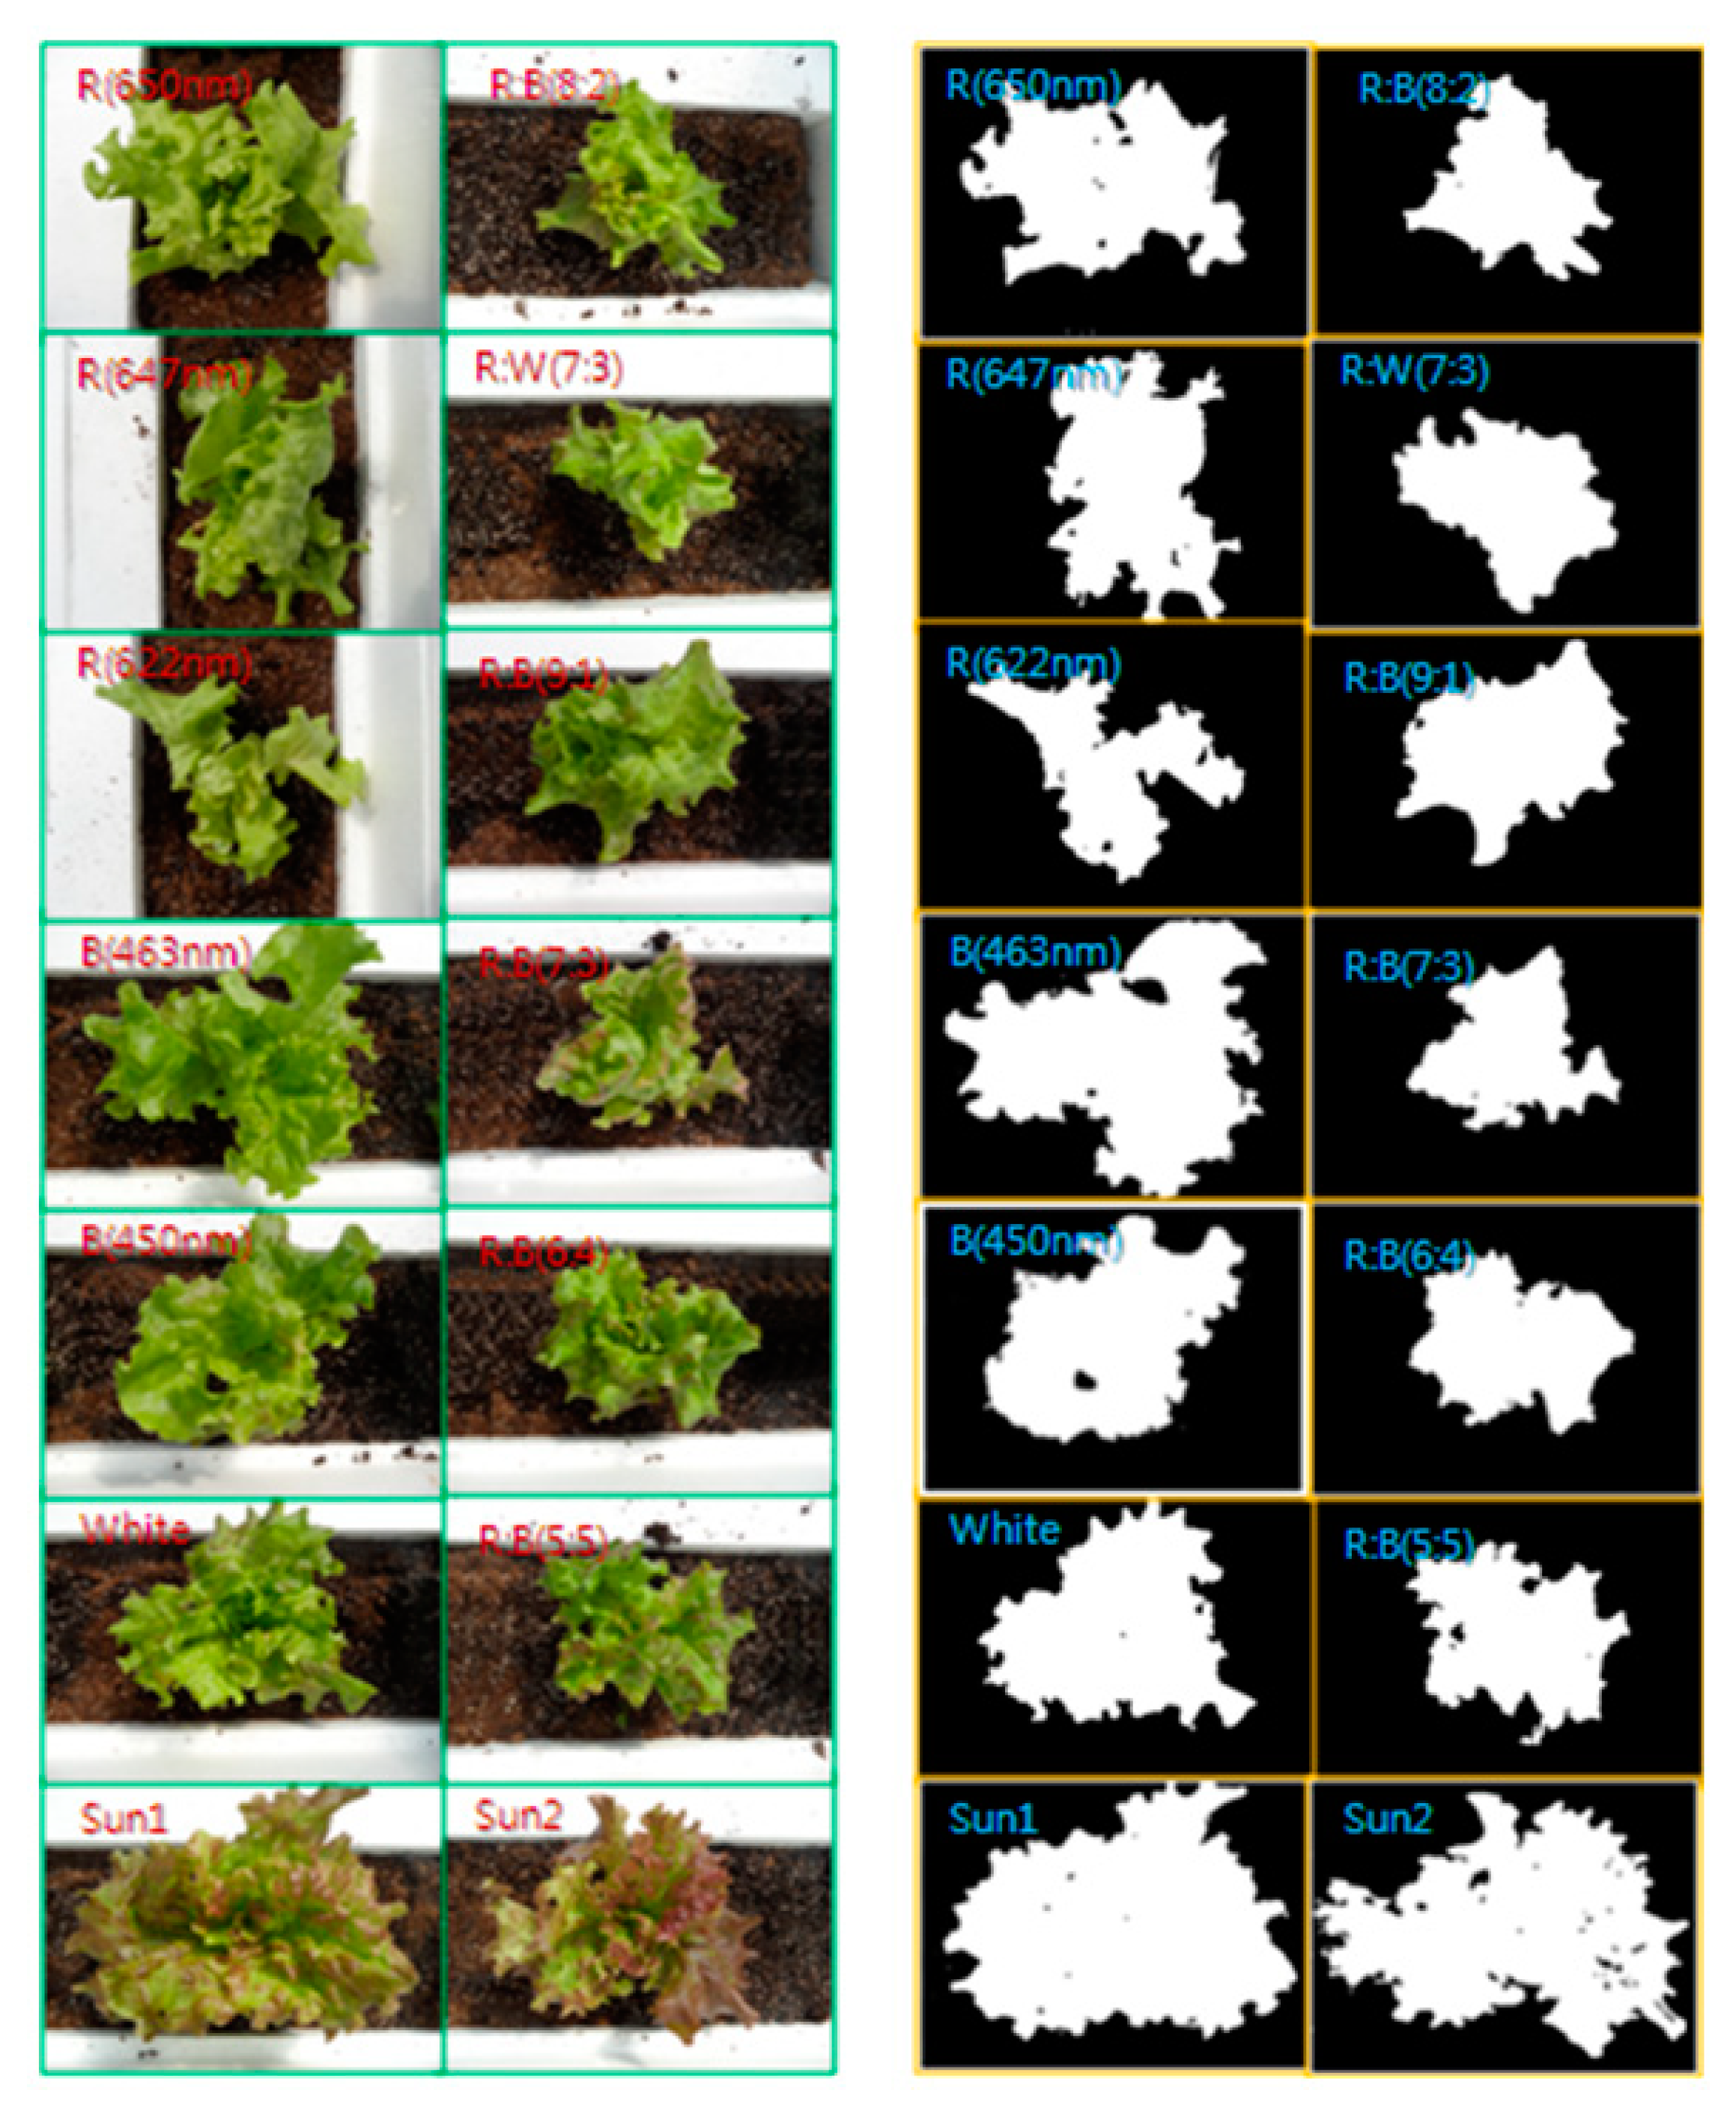
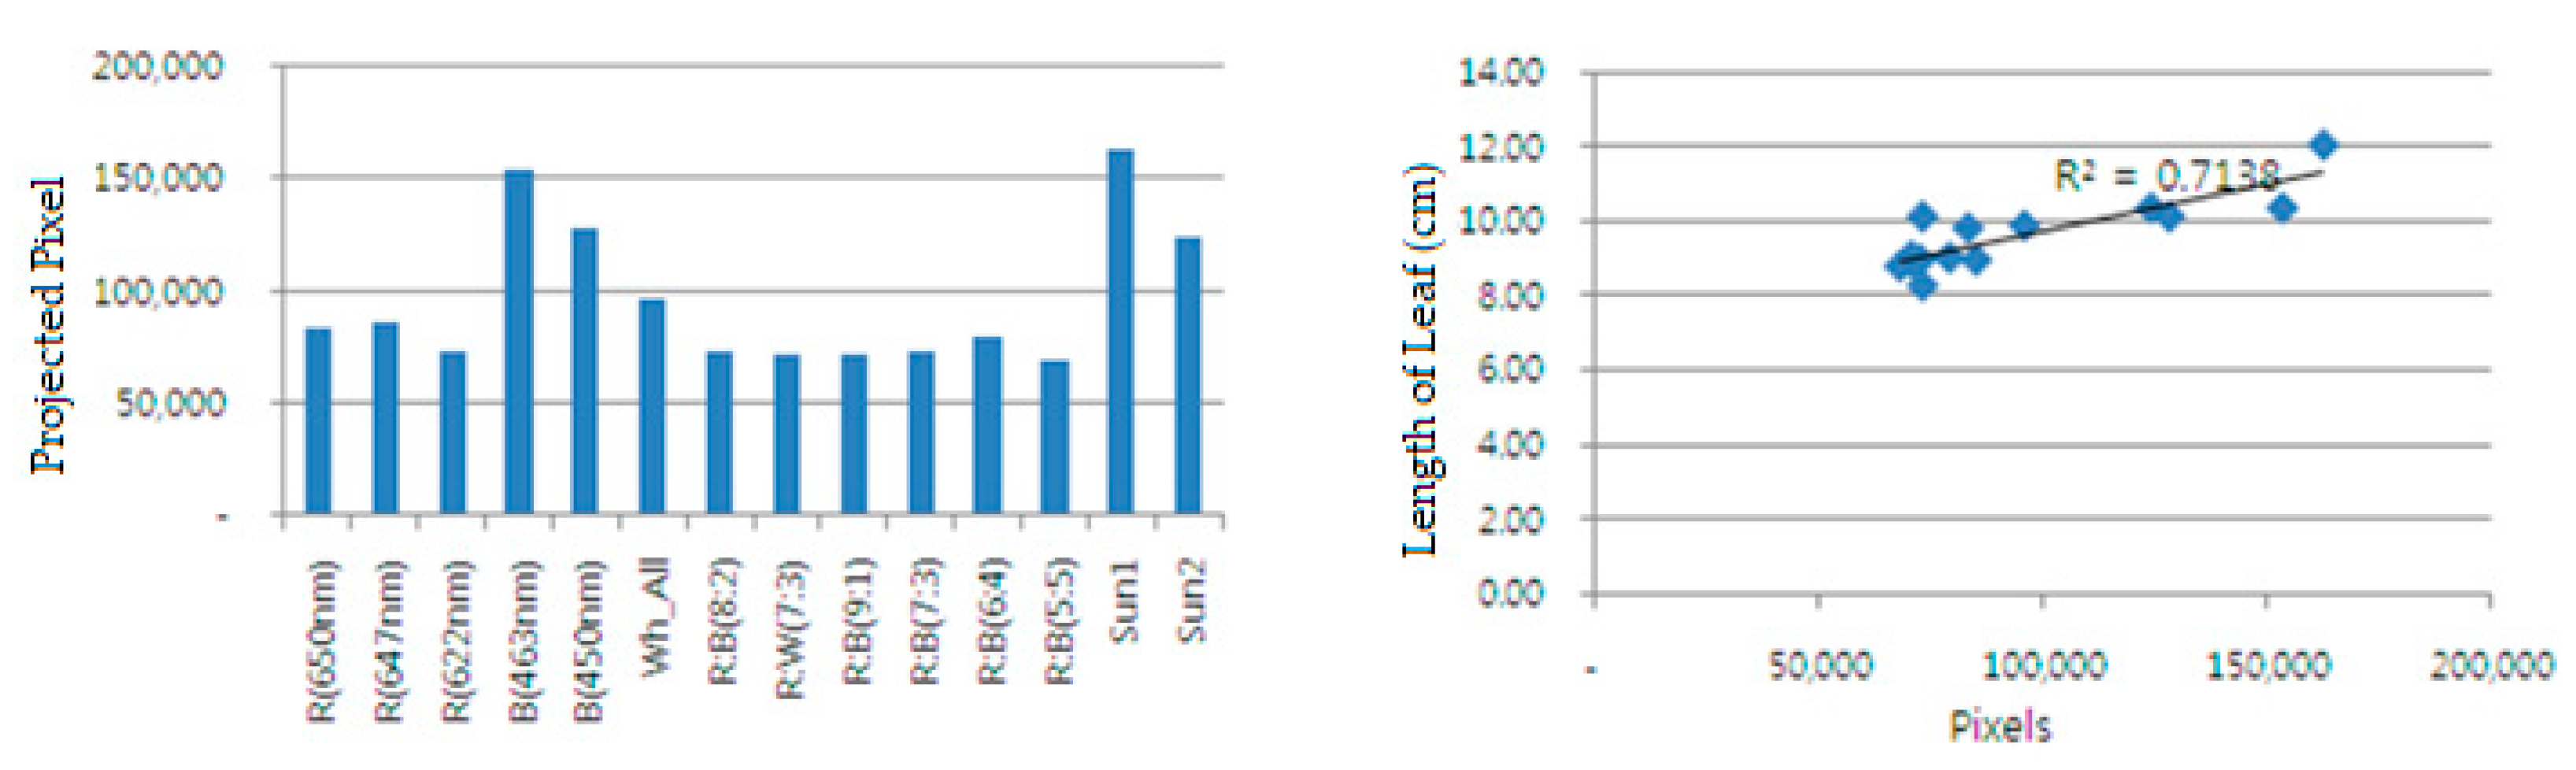
3.3.2. The Image Processing Algorithm for the Comparison of Crop Growth Conditions by Test Group
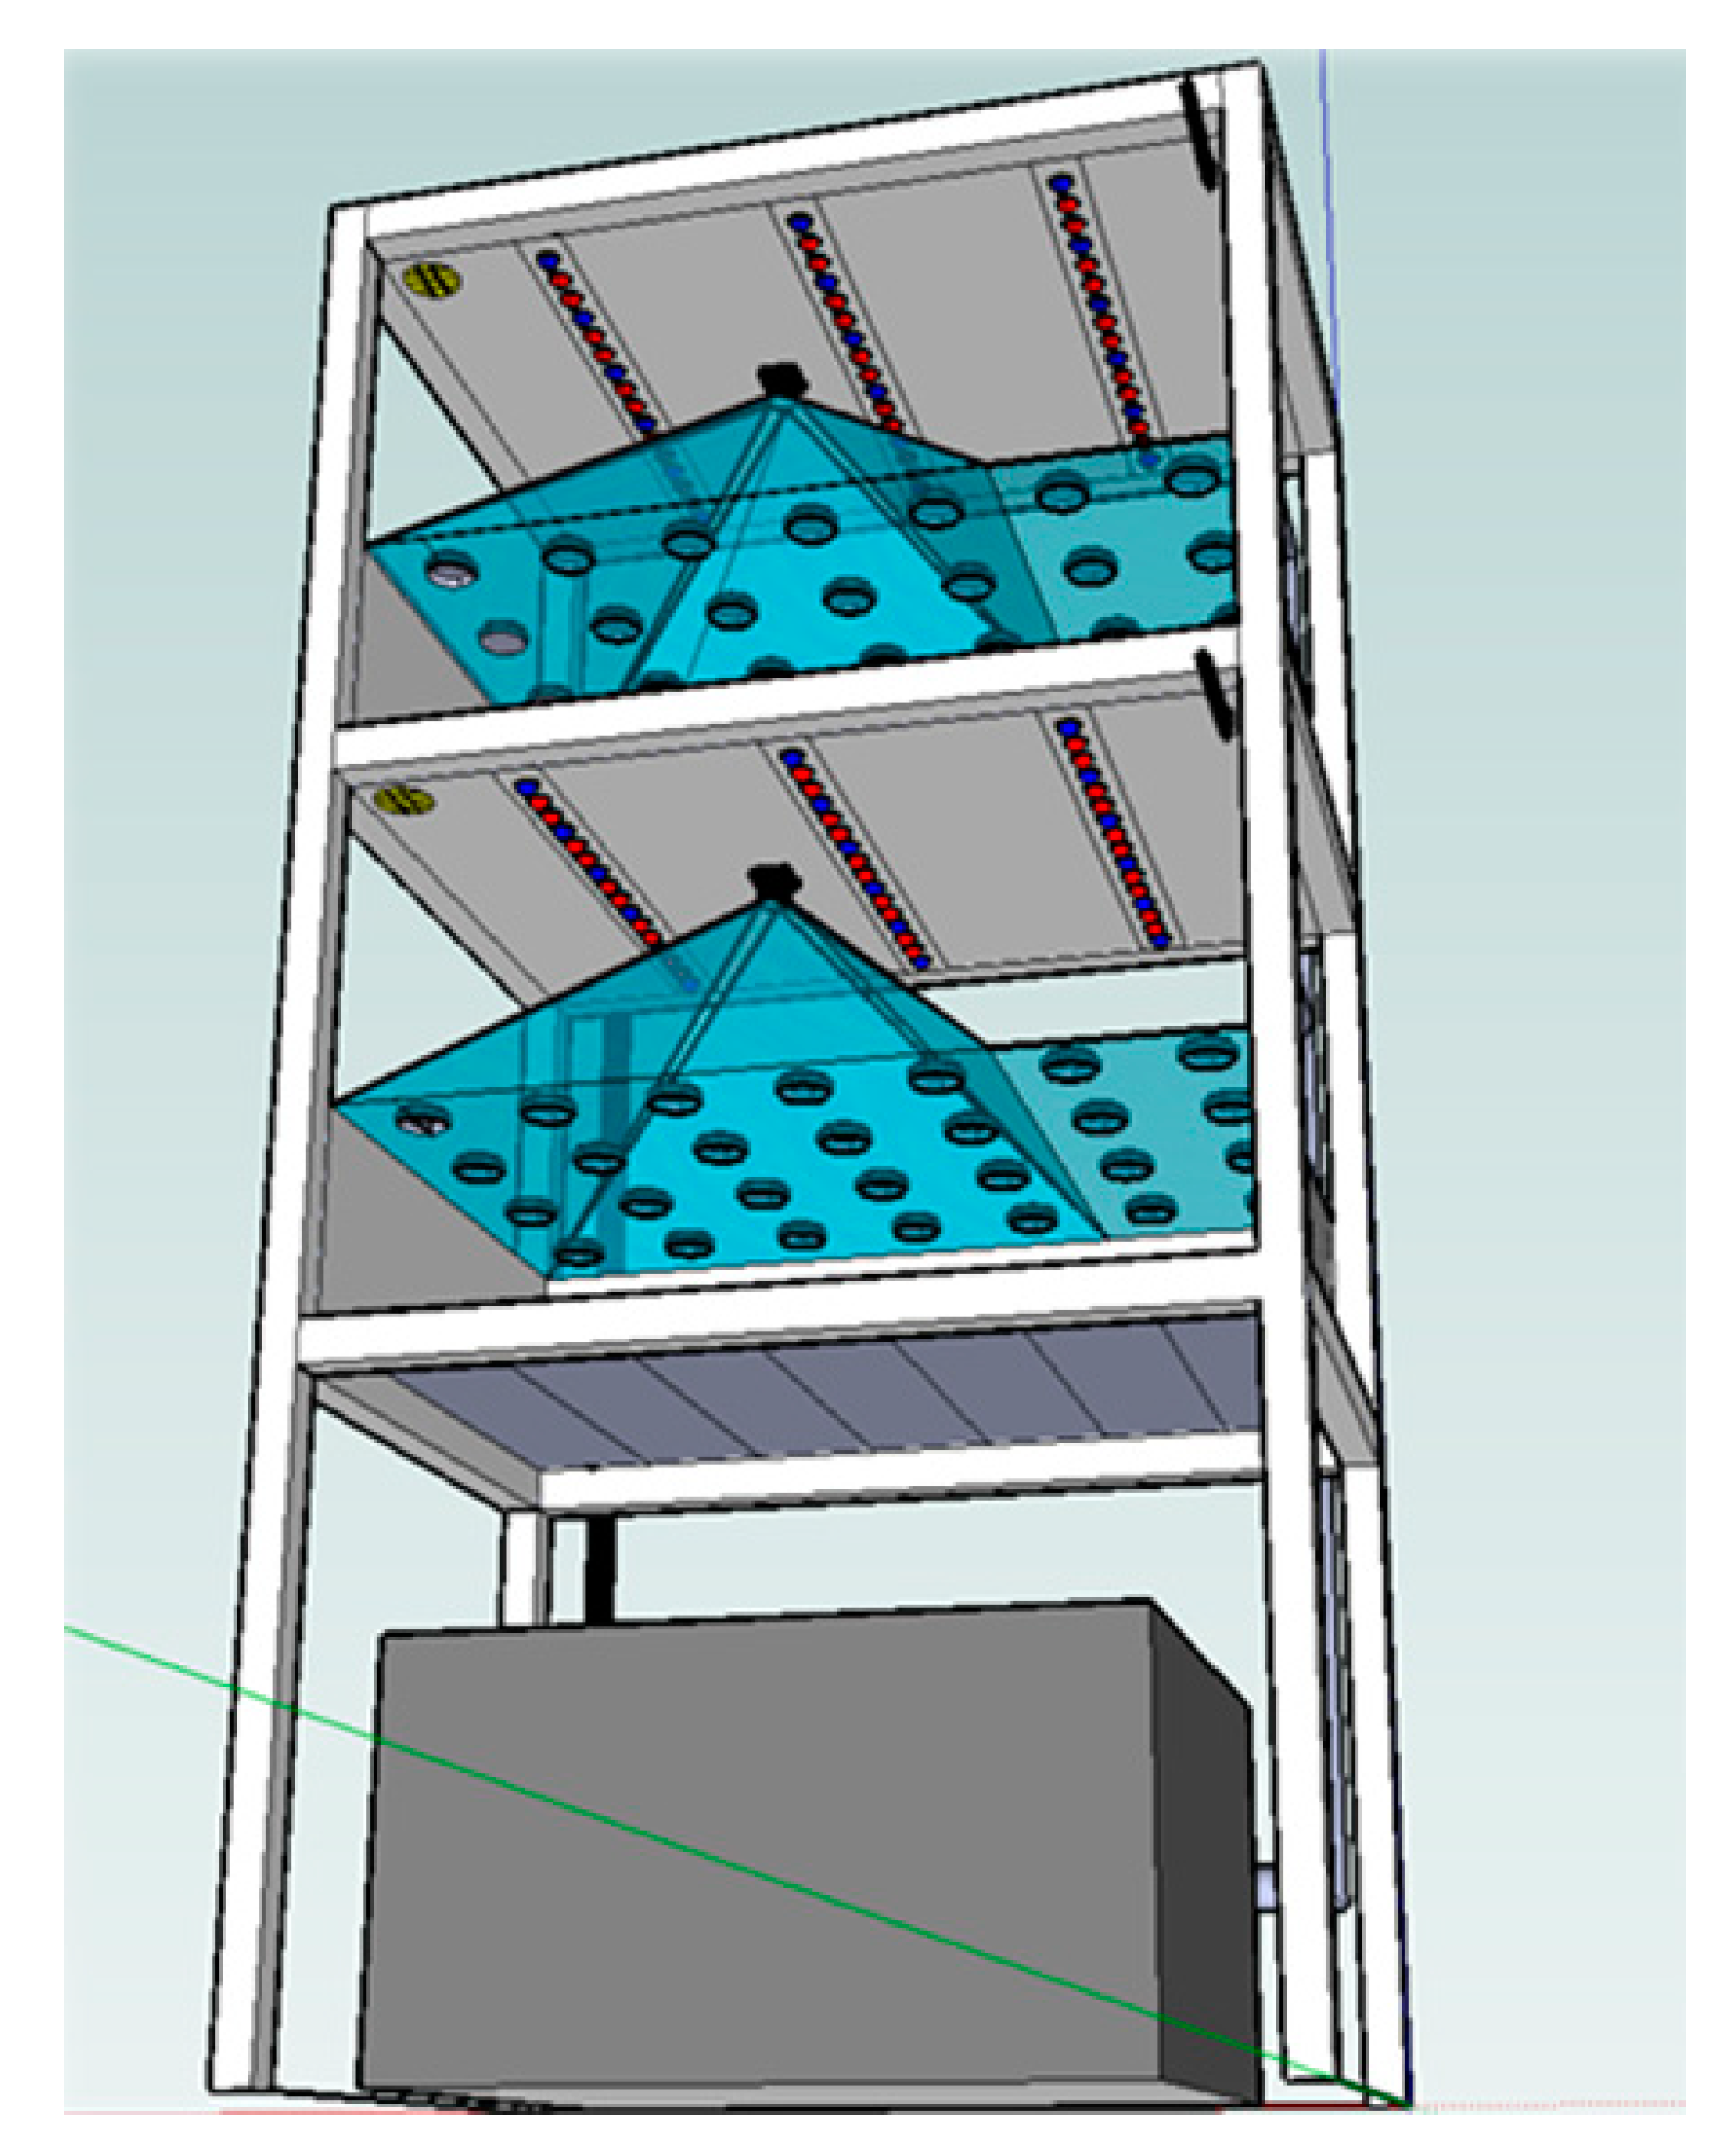
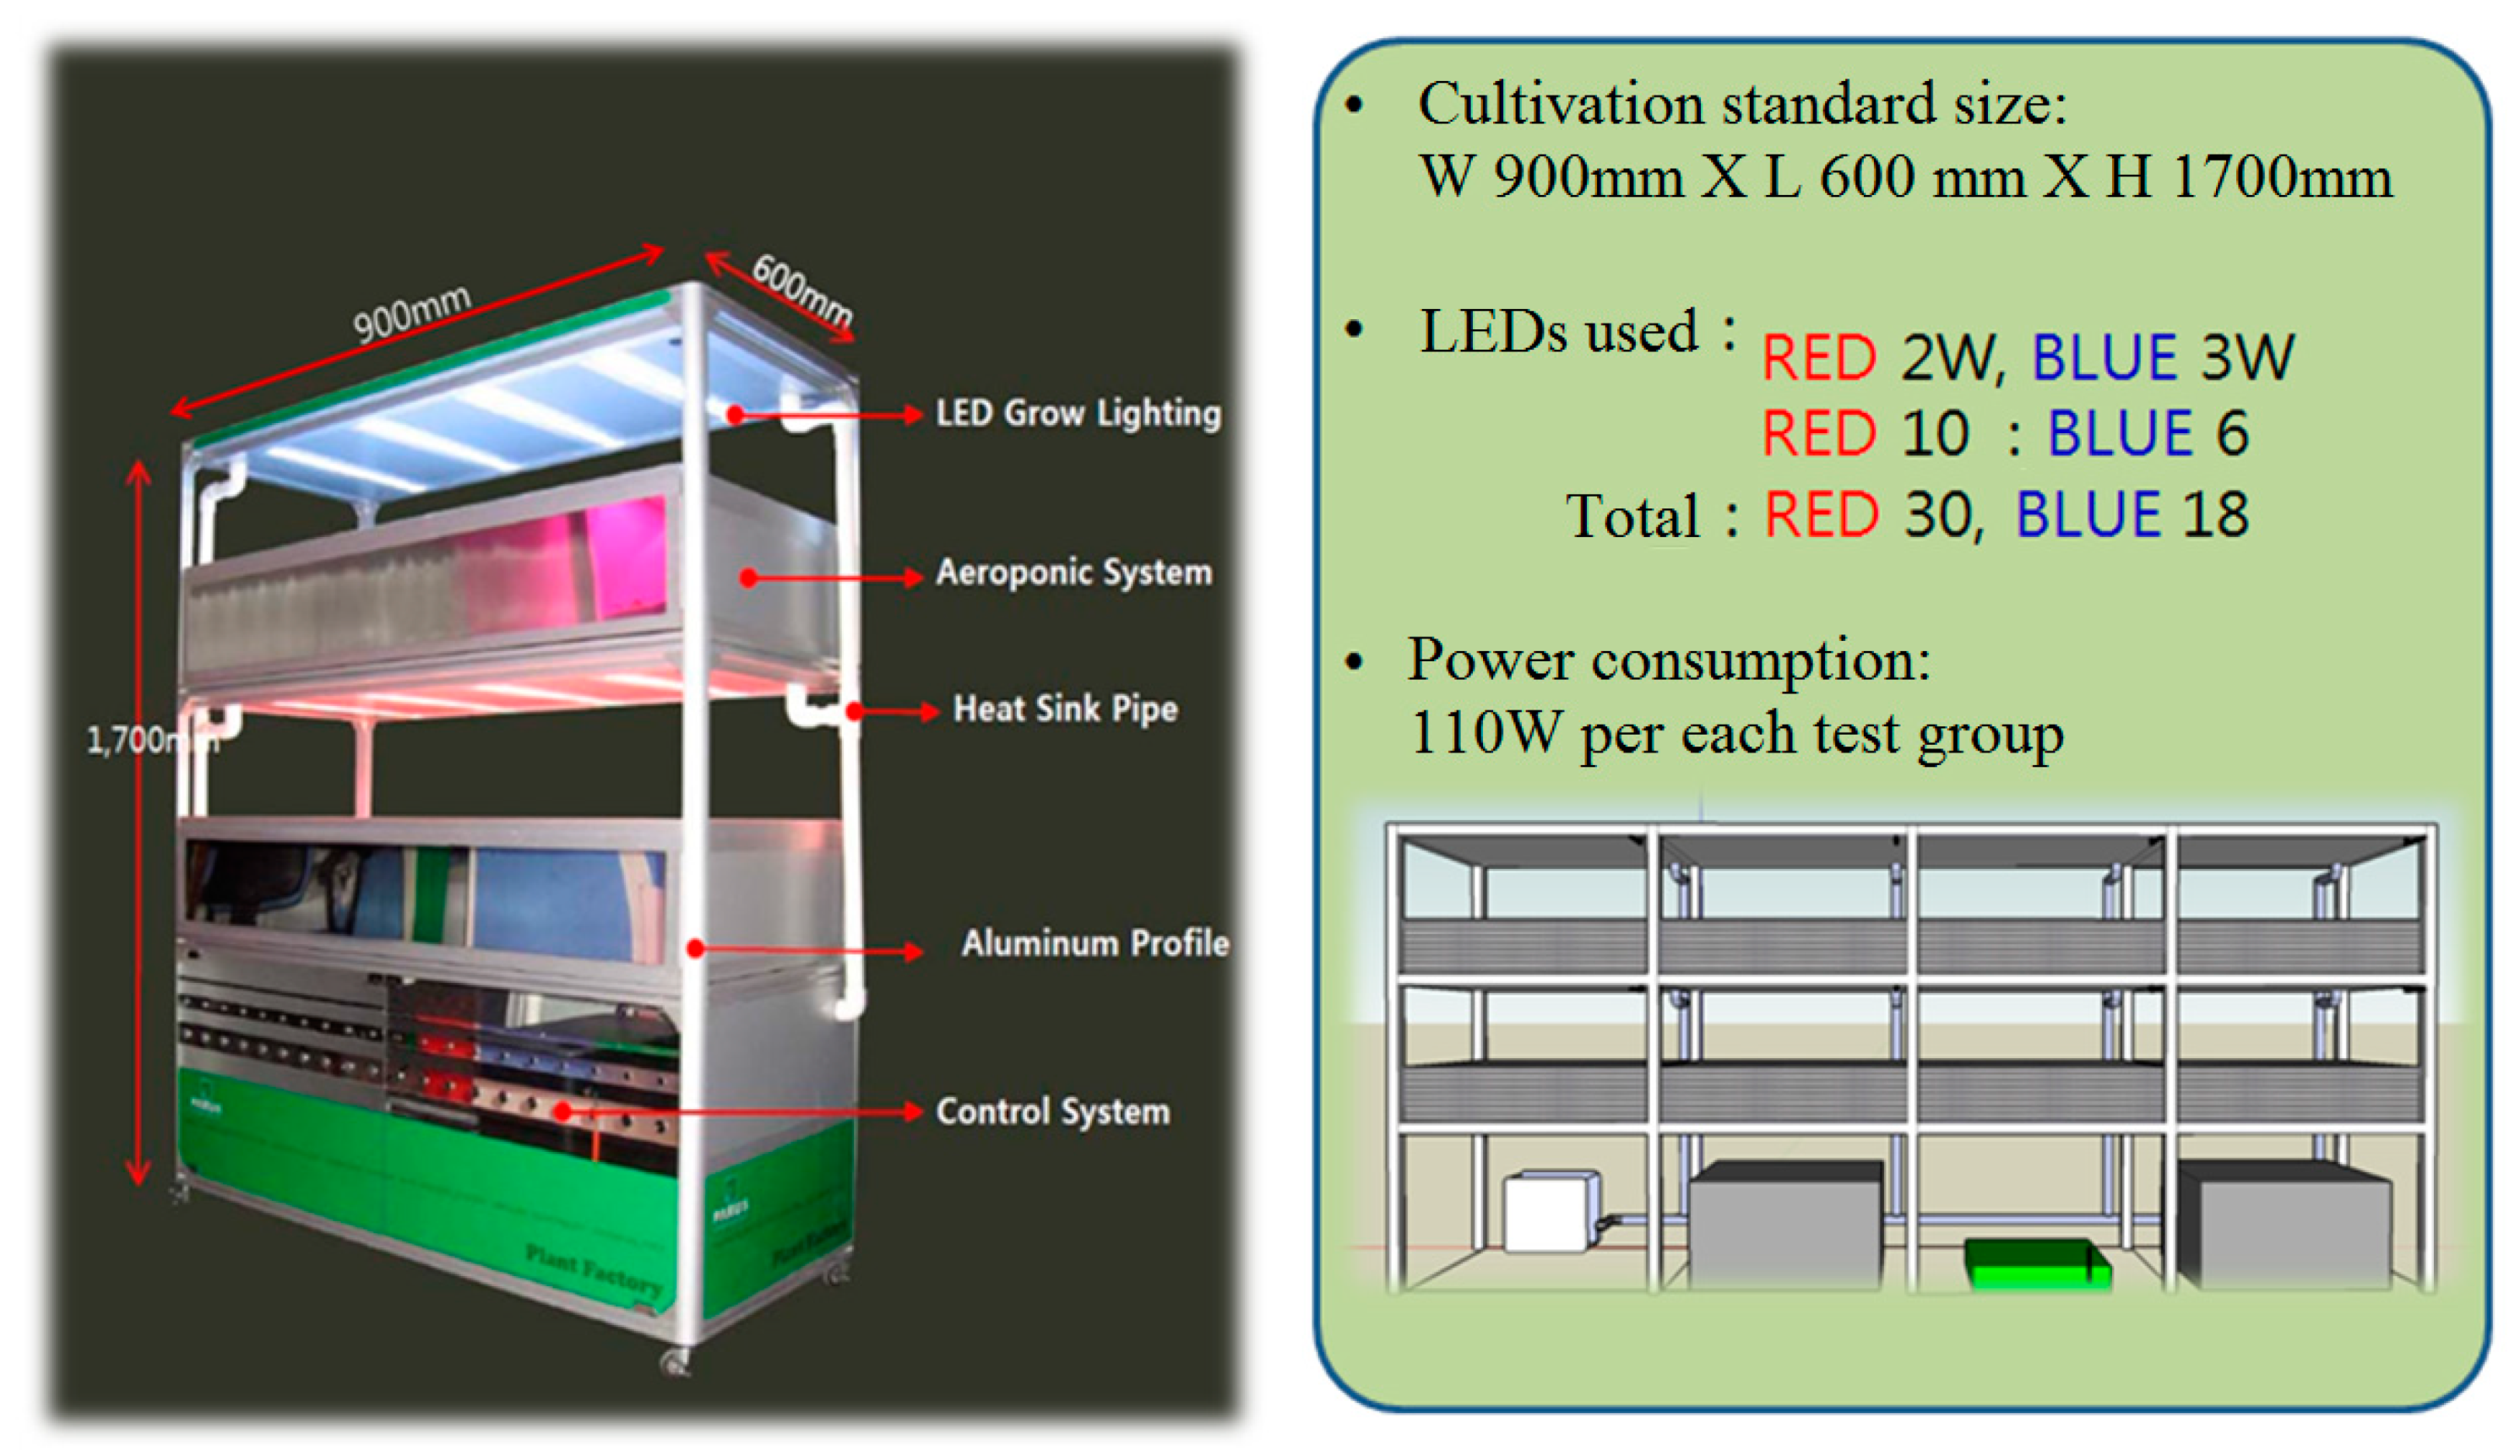
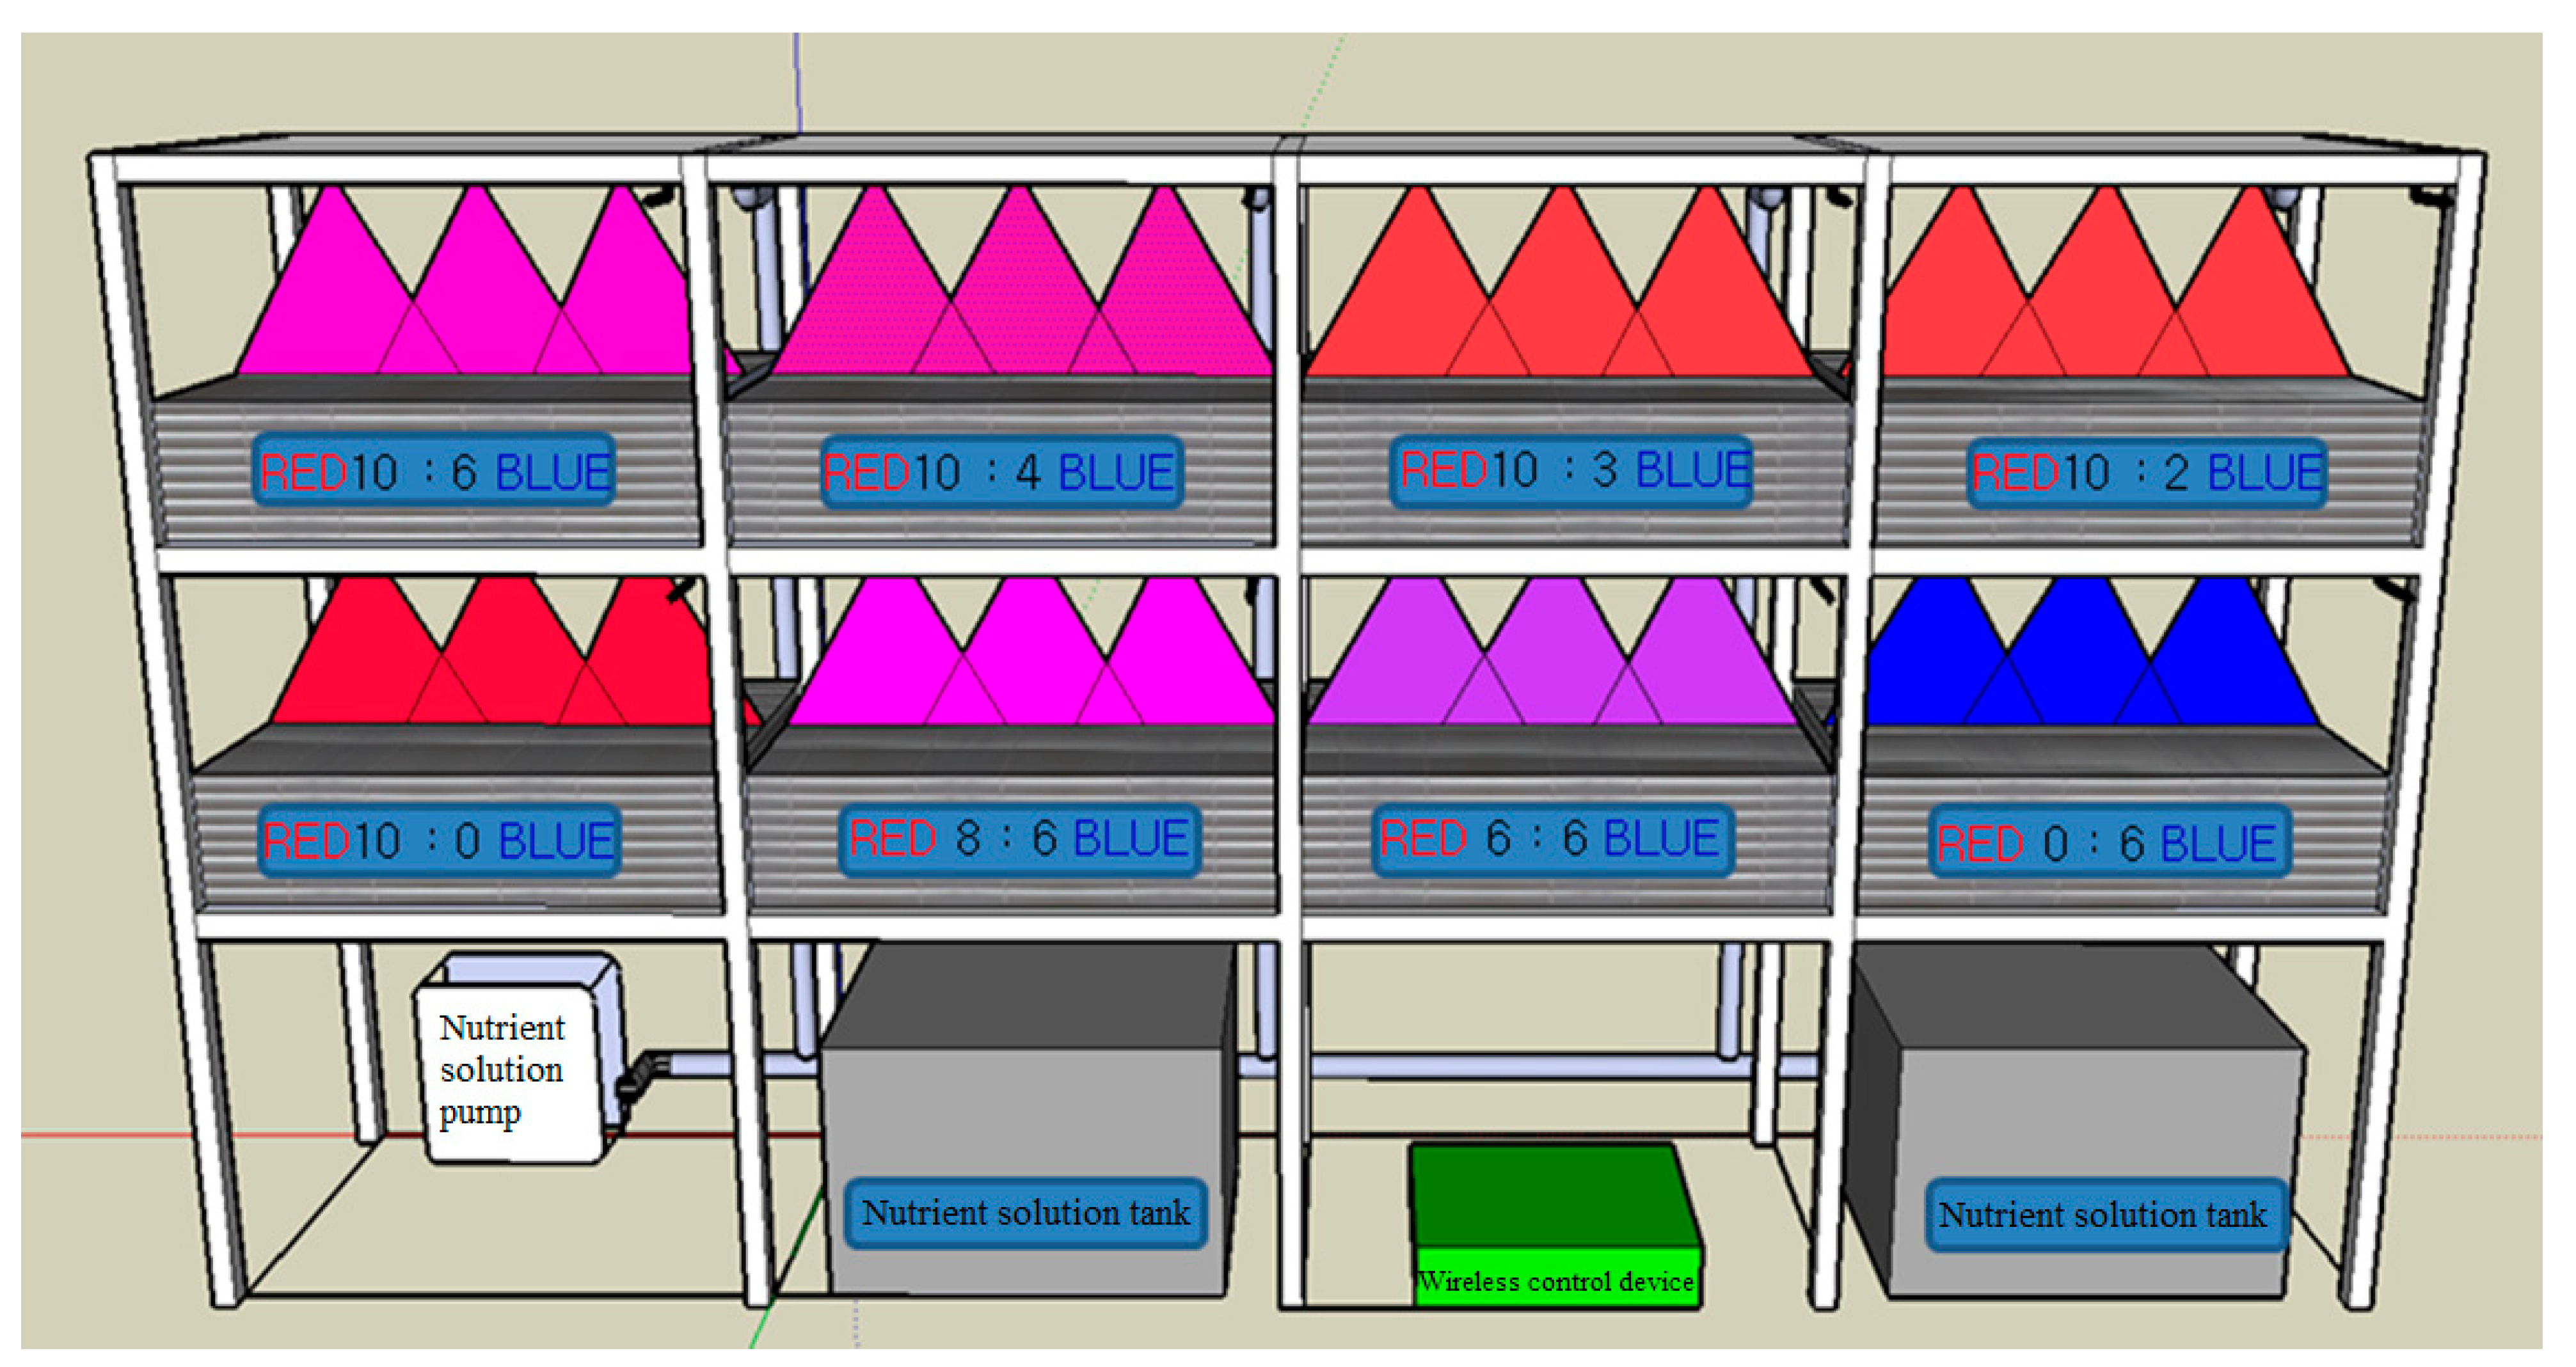
3.4. The Crop Cultivation Test Groups for Environmental Control and Monitoring: Crop Cultivation System
4. Experiment
4.1. Experiment Subjects
4.2. Experimental Design
4.3. Measurement and Analysis
4.4. Data Analysis
5. Results and Discussion
5.1. First Experiment
5.2. Second Experiment
5.3. Third Experiment
5.4. Statistical Data Analysis
6. Conclusions
Author Contributions
Funding
Institutional Review Board Statement
Informed Consent Statement
Data Availability Statement
Conflicts of Interest
Abbreviations
| CCD | Charged-Coupled Device |
| PC | Personal Computer |
| ICT | Information and Communications Technology |
| IoT | Internet of Things |
| CCTV | Closed-Circuit Television |
| LED | Light Emitting Diode |
| PCB | Printed Circuit Board |
| PPDF | Photosynthetic Photon Flux Density |
| TSA | Trypticase Soy Agar |
| SDAC | Sabouraud Dextrose Agar + Chloramphenicol |
| CFU | Colony Forming Unit |
References
- Aksoy, M.A.; Beghin, J.C. Global Agricultural Trade and Developing Countries; World Bank Publications: Washington, DC, USA, 2005. [Google Scholar]
- Rosset, P. The Multiple Functions and Benefits of Small Farm Agriculture in the Context of Global Trade Negotiations. Development 2000, 43, 77–82. [Google Scholar] [CrossRef]
- Kwit, C.; Moon, H.S.; Warwick, S.I.; Stewart, N. Transgene introgression in crop relatives: Molecular evidence and mitiation stategies. Trends Biotechnol. 2011, 29, 284–293. [Google Scholar] [CrossRef] [PubMed]
- Maria, V.S.; Beltran, D.; Allende, A.; Chacon-vera, E.; Gil, M.I. Elimination by ozone of Shigella in Shredded lettuce and water. Food Microbiol. 2007, 24, 492–499. [Google Scholar] [CrossRef]
- Jung, S.D.; Huh, H.W.; Hong, J.H.; Choi, J.S.; Chun, H.S.; Bang, K.H.; Huh, M.K. Genetic diversity and population structure of Kalopanax pictus (Araliaceae). J. Plant Biol. 2003, 46, 255–262. [Google Scholar] [CrossRef]
- Amoah, P.; Drechsel, P.; Abaidoo, R.C. Irrigated urban vegetable production in Ghana: Sources of pathogen contamination and health risk elimination. Irrig. Drain. 2005, 54, 49–61. [Google Scholar] [CrossRef]
- Purnomohadi, N. Jakarta: Urban agriculture as an alternative strategy to face the economic crisis. City Case Study Jkt. 2005, 13, 453–465. [Google Scholar]
- Choi, K.Y.; Lee, Y.B. Effect of Air Temperature on Tipburn Incidence of Butterhead and Leaf Lettuce in a Plant Factory. Korean Soc. Hortic. Sci. 2003, 44, 805–808. [Google Scholar]
- Choi, K.Y.; Park, D.K.; Kim, Y.C.; Seo, T.C.; Yun, H.K.; Seo, H.D. Development of Nutrient Solution for Chenopodiaceae Hydroponics by a Rate of Nutrient and Water Uptake and Cation. Korean Soc. Hortic. Sci. 2003, 21, 55. [Google Scholar]
- Lee, H.J.; Lee, Y.B.; Bae, J.H. Effect of Root Zone Temperature on the Growth and Quality of Single-Stemmed Rose in Cutted Rose Production Factory. Korean Soc. Bio-Environ. Control. 2004, 13, 266–270. [Google Scholar]
- Cantrell, I.C.; Linderman, R.G. Preinoculation of lettuce and onion with VA mycorrhizal fungi reduces deleterious effects of soil salinity. Plant Soil 2001, 33, 269–281. [Google Scholar] [CrossRef]
- Francis, G.A.; O’Beirne, D. Effects of the indigenous microflora of minimally processed lettuce on the survival and growth of Listeria innocua. Int. J. Food Sci. Technol. 1998, 33, 477–488. [Google Scholar] [CrossRef]
- Guentzel, J.L.; Liang, L.K.; Callan, M.A.; Emmons, S.A.; Dunham, V.L. Reduction of bacteria on spinach, lettuce, and surfaces in food service areas using neutral electrolyzed oxidizing water. Food Microbiol. 2008, 25, 36–41. [Google Scholar] [CrossRef] [PubMed]
- King, A.D.; Magnuson, J.A.; TÖRÖK, T.; Goodman, N. Microbial Flora and Storage Quality of Partially Processed Lettuce. J. Food Sci. 1991, 56, 459–461. [Google Scholar] [CrossRef]
- Yang, H.; Swem, B.L.; Li, Y. The Effect of pH on Inactivation of Pathogenic Bacteria on Fresh-cut Lettuce by Dipping Treatment with Electrolyzed Water. J. Food Sci. 2003, 68, 1013–1017. [Google Scholar] [CrossRef]
- Gravesen, S. Identification and quantitaion of inddor airborne micro-fungi durning 12 months from 44 danish homes. Allergy 1972, 27, 337–354. [Google Scholar] [CrossRef]
- Kasprzyk, I.; Morek, M. Airborne fungal spores in urban and rural environments in Poland. Aerobiologia 2006, 22, 169–176. [Google Scholar] [CrossRef]
- Şen, B.; Asan, A. Airborne fungi in vegetable growing areas of Edirne, Turkey. Aerobiologia 2001, 17, 69–75. [Google Scholar] [CrossRef]
- Collier, G.F.; Tibbitts, T.W. Tipburn of Lettuce Horticultural Reviews; John Wiley & Sons, Inc.: Hoboken, NJ, USA, 1982; pp. 49–65. [Google Scholar]
- Pastuszka, J.S.; Kyaw, T.P.U.; Lis, D.O.; Wlazło, A.; Ulfig, K. Bacterial and fungal aerosol in indoor environment in Upper Silesia, Poland. Atmos. Environ. 2000, 34, 3833–3842. [Google Scholar] [CrossRef]
- Wu, P.C.; Su, H.J.; Lin, C.Y. Characteristics of indoor and outdoor airborne fungi at suburban and urban homes in two seasons. Sci. Total Environ. 2000, 253, 111–118. [Google Scholar] [CrossRef]
- Park, H.S.; Chung, D.H.; Joo, Y.J. Survey of airborne pollens in Seoul, Korea. J. Korean Med. Sci. 1994, 9, 42–46. [Google Scholar] [CrossRef] [PubMed]
- Allende, A.; Martínez, B.; Selma, V.; Gil, M.I.; Suárez, J.E.; Rodríguez, A. Growth and bacteriocin production by lactic acid bacteria in vegetable broth and their effectiveness at reducing Listeria monocytogenes in vitro and in fresh-cut lettuce. Food Microbiol. 2007, 24, 759–766. [Google Scholar] [CrossRef] [PubMed]
- Koseki, S.; Isobe, S. Prediction of pathogen growth on iceberg lettuce under real temperature history during distribution from farm to table. Int. J. Food Microbiol. 2005, 104, 239–248. [Google Scholar] [CrossRef] [PubMed]
- Lee, J.J.; Park, R.D.; Kim, Y.W.; Shim, J.H.; Chae, D.H.; Rim, Y.S. Effect of food waste compost on microbial population, soil enzyme activity and lettuce growth. Bioresour. Technol. 2004, 93, 21–28. [Google Scholar] [CrossRef] [PubMed]
- Kozai, T. Propagation, grafting and transplant production in closed systems with artificial lighting for commercialization in Japan. Propag. Ornam. Plant. 2007, 7, 145–149. [Google Scholar]
- Kim, I.S.; Zhang, C.; Kang, H.M.; Mackay, B. Control of stretching of cucumber and tomato plug seedlings using supplemental light. Hort. Envior. Biotechnol. 2008, 49, 287–292. [Google Scholar]
- Ijaz, F.; Siddiqui, A.A.; Im, B.K.; Lee, C. Remote management and control system for LED based plant factory using ZigBee and Internet. In Proceedings of the 2012 14th international conference on advanced communication technology (ICACT), Phoenix Park, PyeongChang, Korea, 19–22 February 2012; pp. 942–946. [Google Scholar]
- Olle, M.; Viršile, A. The effects of light-emitting diode lighting on greenhouse plant growth and quality. Agric. Food Sci. 2013, 22, 223–234. [Google Scholar] [CrossRef]
- Watanabe, H. Light-controlled plant cultivation system in Japan-development of a vegetable factory using LEDs as a light source for plants. In Proceedings of the 6th International Symposium on Light in Horticulture, Tsukuba, Japan, 15–19 November 2009; pp. 37–44. [Google Scholar]
- Goto, E. Plant production in a closed plant factory with artificial lighting. In Proceedings of the 7th International Symposium on Light in Horticultural Systems, Wageningen, The Netherlands, 15–18 October 2012; Volume 956, pp. 37–49. [Google Scholar]
- Barrett, G.E.; Alexander, P.D.; Robinson, J.S.; Bragg, N.C. Achieving environmentally sustainable growing media for soilless plant cultivation systems—A review. Sci. Hortic. 2016, 212, 220–234. [Google Scholar] [CrossRef]
- Schmilewski, G. The role of peat in assuring the quality of growing media. Mires Peat 2008, 3, 1–8. [Google Scholar]
- Carlile, W.R.; Cattivello, C.; Zaccheo, P. Organic growing media: Constituents and properties. Vadose Zone J. 2015, 14, 1–13. [Google Scholar] [CrossRef]
- Alexander, P.D.; Bragg, N.C.; Meade, R.; Padelopoulos, G.; Watts, O. Peat in horticulture and conservation: The UK response to a changing world. Mires Peat 2008, 3, 1–10. [Google Scholar]
- Cleary, J.; Roulet, N.T.; Moore, T.R. Greenhouse gas emissions from Canadian peat extraction, 1990–2000: A life-cycle analysis. AMBIO J. Hum. Environ. 2005, 34, 456–461. [Google Scholar] [CrossRef]
- Carlile, B.; Coules, A. Towards sustainability in growing media. In Proceedings of the International Symposium on Growing Media, Composting and Substrate Analysis, Barcelona, Spain, 17–21 October 2011; Volume 1013, pp. 341–349. [Google Scholar]
- Kern, J.; Tammeorg, P.; Shanskiy, M.; Sakrabani, R.; Knicker, H.; Kammann, C.; Tuhkanen, E.M.; Smidt, G.; Prasad, M.; Tiilikkala, K.; et al. Synergistic use of peat and charred material in growing media—An option to reduce the pressure on peatlands? J. Environ. Eng. Landsc. Manag. 2017, 25, 160–174. [Google Scholar] [CrossRef]
- Chrysargyris, A.; Prasad, M.; Kavanagh, A.; Tzortzakis, N. Biochar type, ratio, and nutrient levels in growing media affects seedling production and plant performance. Agronomy 2020, 10, 1421. [Google Scholar] [CrossRef]
- Tüzel, Y.; Ekinci, K.; Öztekin, G.B.; Erdal, I.; Varol, N.; Merken, Ö. Utilization of olive oil processing waste composts in organic tomato seedling production. Agronomy 2020, 10, 797. [Google Scholar] [CrossRef]
- Gohardoust, M.R.; Bar-Tal, A.; Effati, M.; Tuller, M. Characterization of Physicochemical and hydraulic properties of organic and mineral soilless culture substrates and mixtures. Agronomy 2020, 10, 1403. [Google Scholar] [CrossRef]
- Huang, L.; Gu, M.; Yu, P.; Zhou, C.; Liu, X. Biochar and vermicompost amendments affect substrate properties and plant growth of basil and tomato. Agronomy 2020, 10, 224. [Google Scholar] [CrossRef]
- Blok, C. Growing Media for Food and Quality of Life in the Period 2020–2050. Acta Hortic. 2020. In Press. Available online: https://peatlands.org/document/growing-media-blok-2018/ (accessed on 31 March 2021).
- Van Gerrewey, T.; Vandecruys, M.; Ameloot, N.; Perneel, M.; van Labeke, M.C.; Boon, N.; Geelen, D. Microbe-Plant Growing Media Interactions Modulate the Effectiveness of Bacterial Amendments on Lettuce Performance Inside a Plant Factory with Artificial Lighting. Agronomy 2020, 10, 1456. [Google Scholar] [CrossRef]
- Available online: https://cnews.smartfn.co.kr/view.php?ud=20190930112453350227695a3dd0_46 (accessed on 31 March 2021).
- Korea Vocational College of Food and Agriculture. Available online: https://m.blog.naver.com/supersizeher/220564559027 (accessed on 31 March 2021).
- Available online: https://www.itmedia.co.jp/smartjapan/articles/1405/27/news084.html (accessed on 31 March 2021).


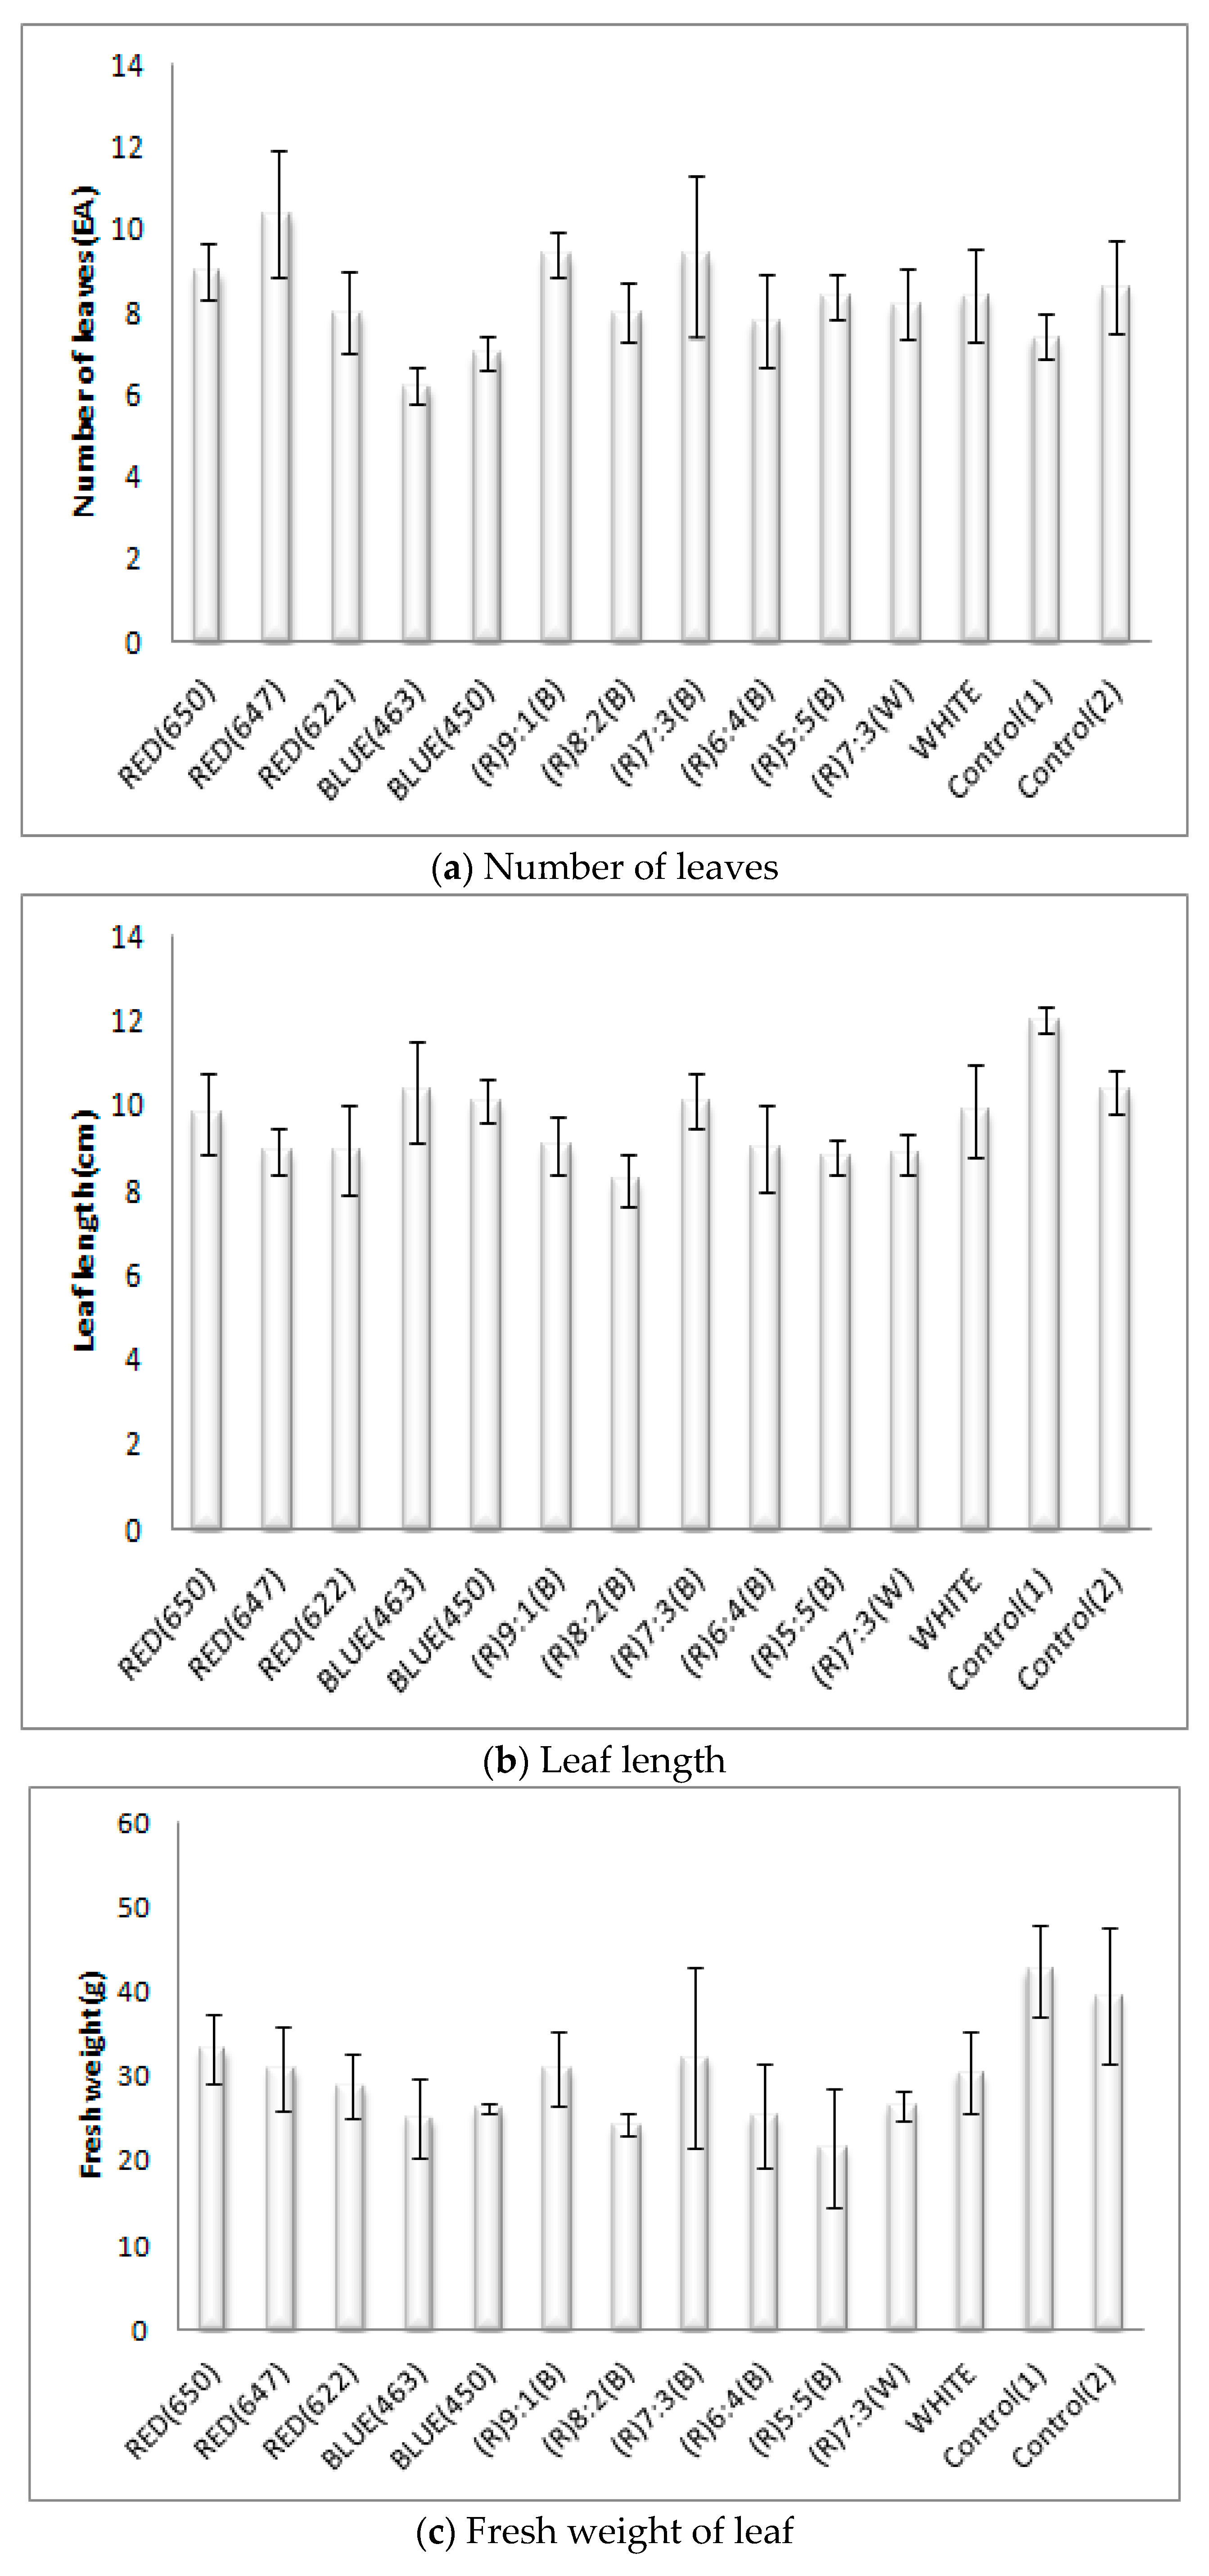
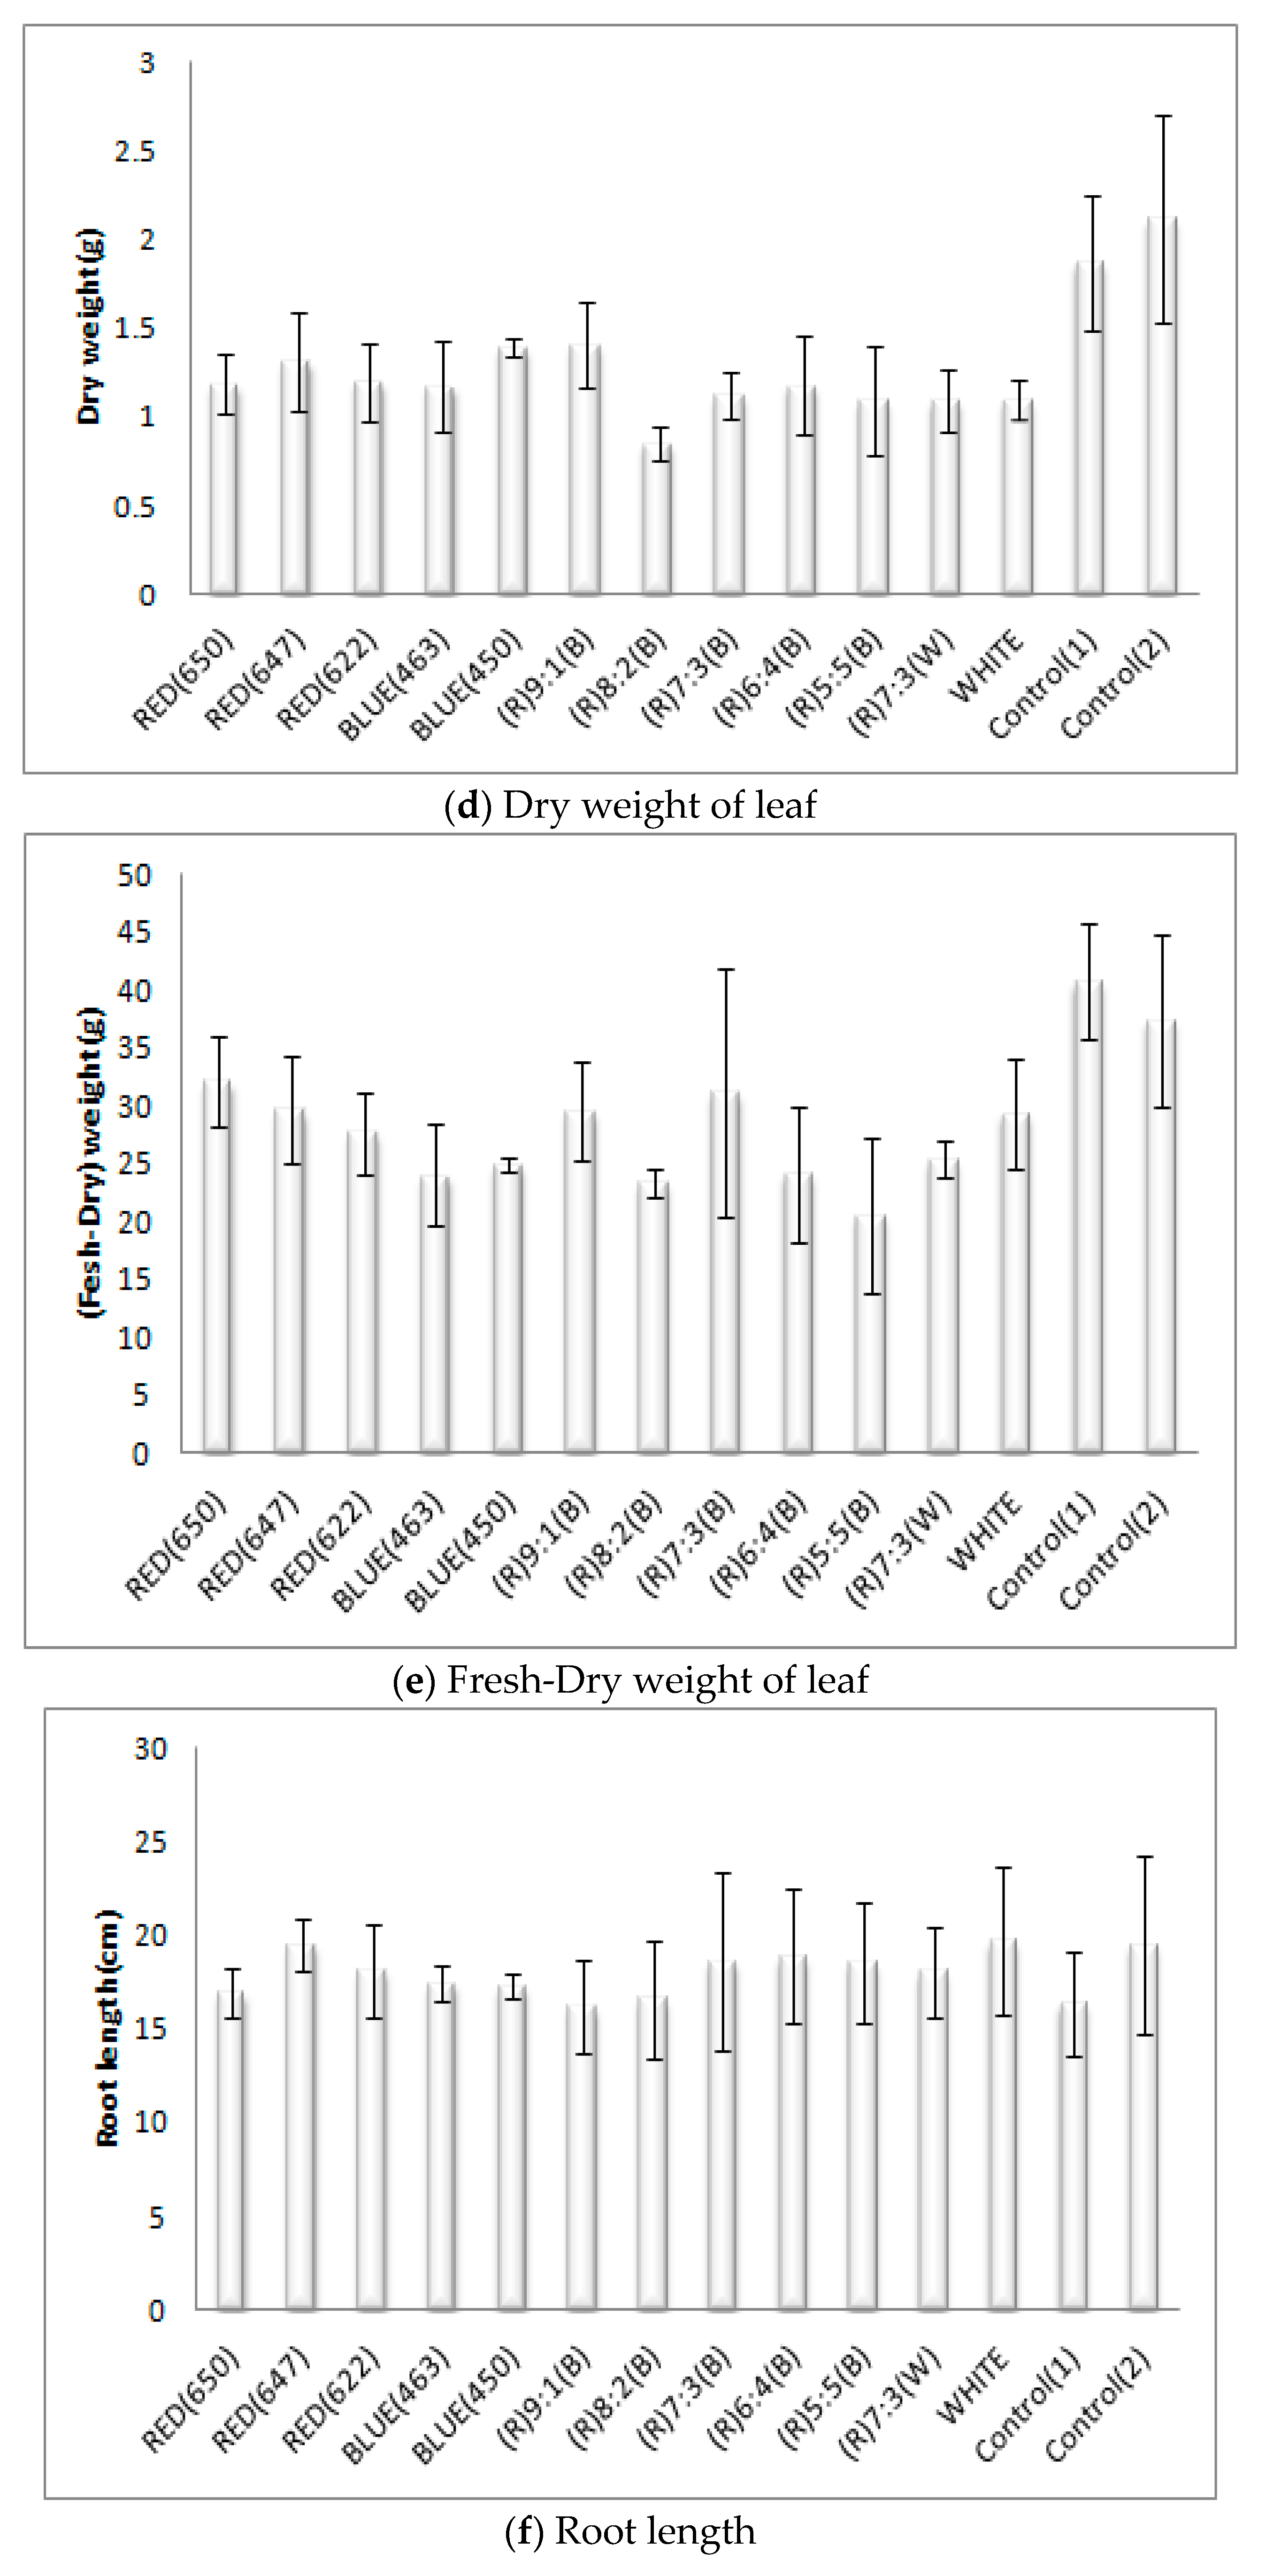
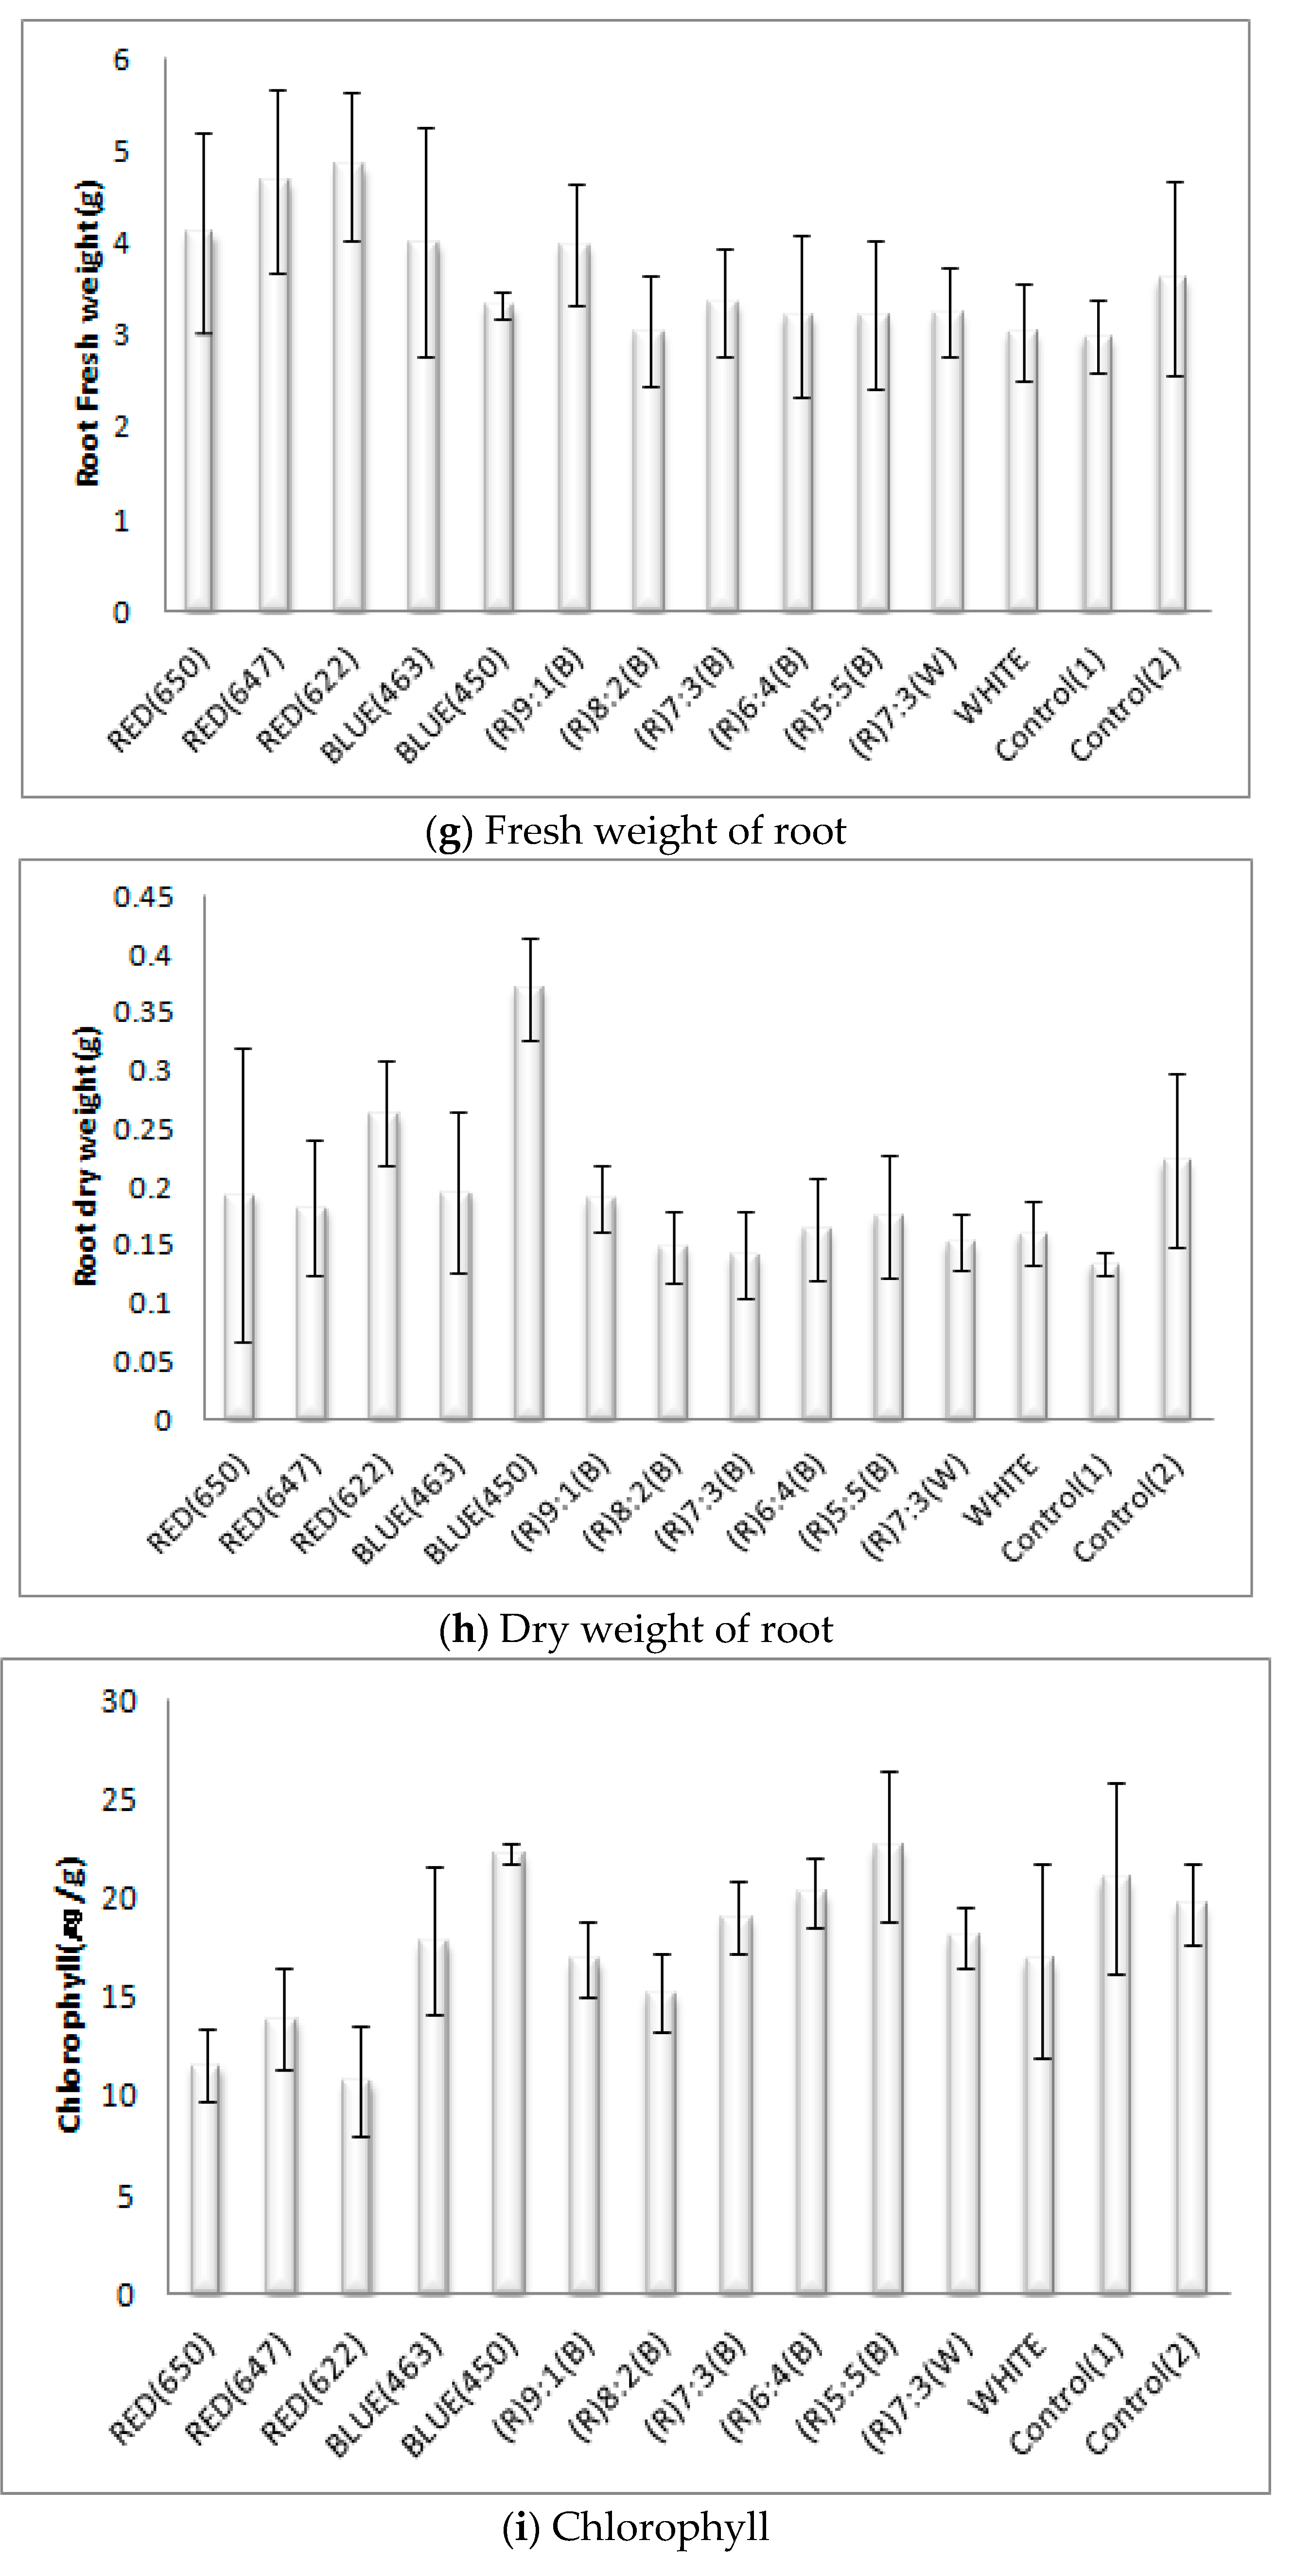
| Test Group | Image Measurements | Actual Physical Measurements | ||||||
|---|---|---|---|---|---|---|---|---|
| Projected Pixel | Number of Leaves (ea) | Leaf Fresh Wight (g) | Leaf Dry Weight (g) | Length of Leaf (cm) | Length of Root (cm) | Root Fresh Weight (g) | Root Dry Weight (g) | |
| R (650 nm) | 83,519 | 9.00 | 33.27 | 1.18 | 9.81 | 16.96 | 4.12 | 0.19 |
| R (647 nm) | 85,335 | 10.40 | 30.93 | 1.31 | 8.95 | 19.50 | 4.67 | 0.18 |
| R (622 nm) | 72,968 | 8.00 | 28.86 | 1.20 | 8.96 | 18.14 | 4.85 | 0.26 |
| B (463 nm) | 153,378 | 6.20 | 25.14 | 0.20 | 10.34 | 17.44 | 4.01 | 0.20 |
| B (450 nm) | 128,208 | 7.00 | 26.30 | 1.39 | 10.12 | 17.26 | 3.32 | 0.37 |
| Wh_All | 96,045 | 8.40 | 30.44 | 1.10 | 9.87 | 19.70 | 3.03 | 0.16 |
| R:B (8:2) | 73,418 | 8.00 | 24.22 | 0.85 | 8.27 | 16.62 | 3.05 | 0.15 |
| R:W (7:3) | 71,340 | 8.20 | 26.48 | 1.09 | 8.85 | 18.06 | 3.25 | 0.15 |
| R:B (9:1) | 70,928 | 9.40 | 30.95 | 1.41 | 9.06 | 16.18 | 3.99 | 0.19 |
| R:B (7:3) | 73,441 | 9.40 | 32.27 | 1.12 | 10.11 | 18.62 | 3.36 | 0.14 |
| R:B (6:4) | 79,364 | 7.80 | 25.35 | 1.18 | 9.02 | 18.86 | 3.22 | 0.16 |
| R:B (5:5) | 68,379 | 8.40 | 21.63 | 1.09 | 8.79 | 18.50 | 3.23 | 0.18 |
| Sun 1 | 162,485 | 7.40 | 42.63 | 1.87 | 12.03 | 16.36 | 2.99 | 0.13 |
| Sun 2 | 124,183 | 8.60 | 39.53 | 2.11 | 10.34 | 19.50 | 3.62 | 0.22 |
| First-Phase Experiment (1–28 February) | ||||||
| Pollutant | Spot | Concentration | Spot | Concentration | ||
| Airborne fungi | In | 427 ± 228 CFU/m3 | Out | 540 ± 210 CFU/m3 | ||
| Airborne bacteria | 540 ± 210 CFU/m3 | 476 ± 170 CFU/m3 | ||||
| Particulate matter | TSP | >6579 μg/m3 | TSP | 91.64 ± 44.47 μg/m3 | ||
| PM10 | >6579 μg/m3 | PM10 | 32.6 ± 15.56 μg/m3 | |||
| PM2.5 | >657.9 μg/m3 | PM2.5 | 16.45 ± 1.26 μg/m3 | |||
| PM1 | >657.9 μg/m3 | PM1 | 7.10 ± 0.32 μg/m3 | |||
| Micro-climate conditions (temperature: 11.2 ± 1.3 ℃, relative humidity: 31.3 ± 2.2%) in the plant factory | ||||||
| Result: All experimental plants died after of 14 days of planting. (It might be due to the low temperature and humidity conditions and the high dust level.) | ||||||
| Second-Phase Experiment (15 March–12 April) | ||||||
| Pollutant | Spot | Concentration | Spot | Concentration | ||
| Airborne fungi | In | 525 ± 150 CFU/m3 | Out | 1656 ± 414 CFU/m3 | ||
| Airborne bacteria | 647 ± 241 CFU/m3 | 2267 ± 677 CFU/m3 | ||||
| Particulate matter | TSP | 155.46 ± 52.40 μg/m3 | TSP | 101.22 ± 36.19 μg/m3 | ||
| PM10 | 64.76 ± 9.71 μg/m3 | PM10 | 61.22 ± 28.36 μg/m3 | |||
| PM2.5 | 14.18 ± 1.76 μg/m3 | PM2.5 | 14.46 ± 1.25 μg/m3 | |||
| PM1 | 3.64 ± 0.38 μg/m3 | PM1 | 3.83 ± 0.45 μg/m3 | |||
| Micro-climate conditions (temperature: 12.2 ± 3.3 ℃, relative humidity: 31.7 ± 4.2%) | ||||||
| Result: All plants died after 23 days of planting (it might be due to the failure of electric conductivity; 10.7 dS/m) in nutritional solution. Continuous nutrient solution was mistakenly fed to the plants on a daily basis. | ||||||
| Third Experiment (28 October–25 November) | ||||||
| Pollutant | Spot | Concentration | Spot | Concentration | ||
| Airborne fungi | In | 1113 ± 849 CFU/m3 | Out | 1462 ± 324 CFU/m3 | ||
| Airborne bacteria | 1533 ± 1226 CFU/m3 | 4133 ± 1200 CFU/m3 | ||||
| Particulate matter | TSP | 183.10 ± 28.19 μg/m3 | TSP | 87.68 ± 20.68 μg/m3 | ||
| PM10 | 73.88 ± 20.52 μg/m3 | PM10 | 35.78 ± 14.02 μg/m3 | |||
| PM2.5 | 12.53 ± 3.57 μg/m3 | PM2.5 | 10.23 ± 0.86 μg/m3 | |||
| PM1 | 4.13 ± 0.15 μg/m3 | PM1 | 4.30 ± 0.47 μg/m3 | |||
| Micro-climate conditions (temperature: 12.2 ± 3.3 ℃, relative humidity: 31.7 ± 4.2%) in the plant factory | ||||||
| Result: The growth of lettuce was satisfactory. | ||||||
| Mean Rank | RED | BLUE | (R):(B) | (R)7: 3(W) | WHITE | Control | Significance Value by Kruskal Wallis | Significance Value By Run Test | ||||||||
|---|---|---|---|---|---|---|---|---|---|---|---|---|---|---|---|---|
| (650) | (647) | (622) | (463) | (450) | 9:1 | 8:2 | 7:3 | 6:4 | 5:5 | (1) | (2) | |||||
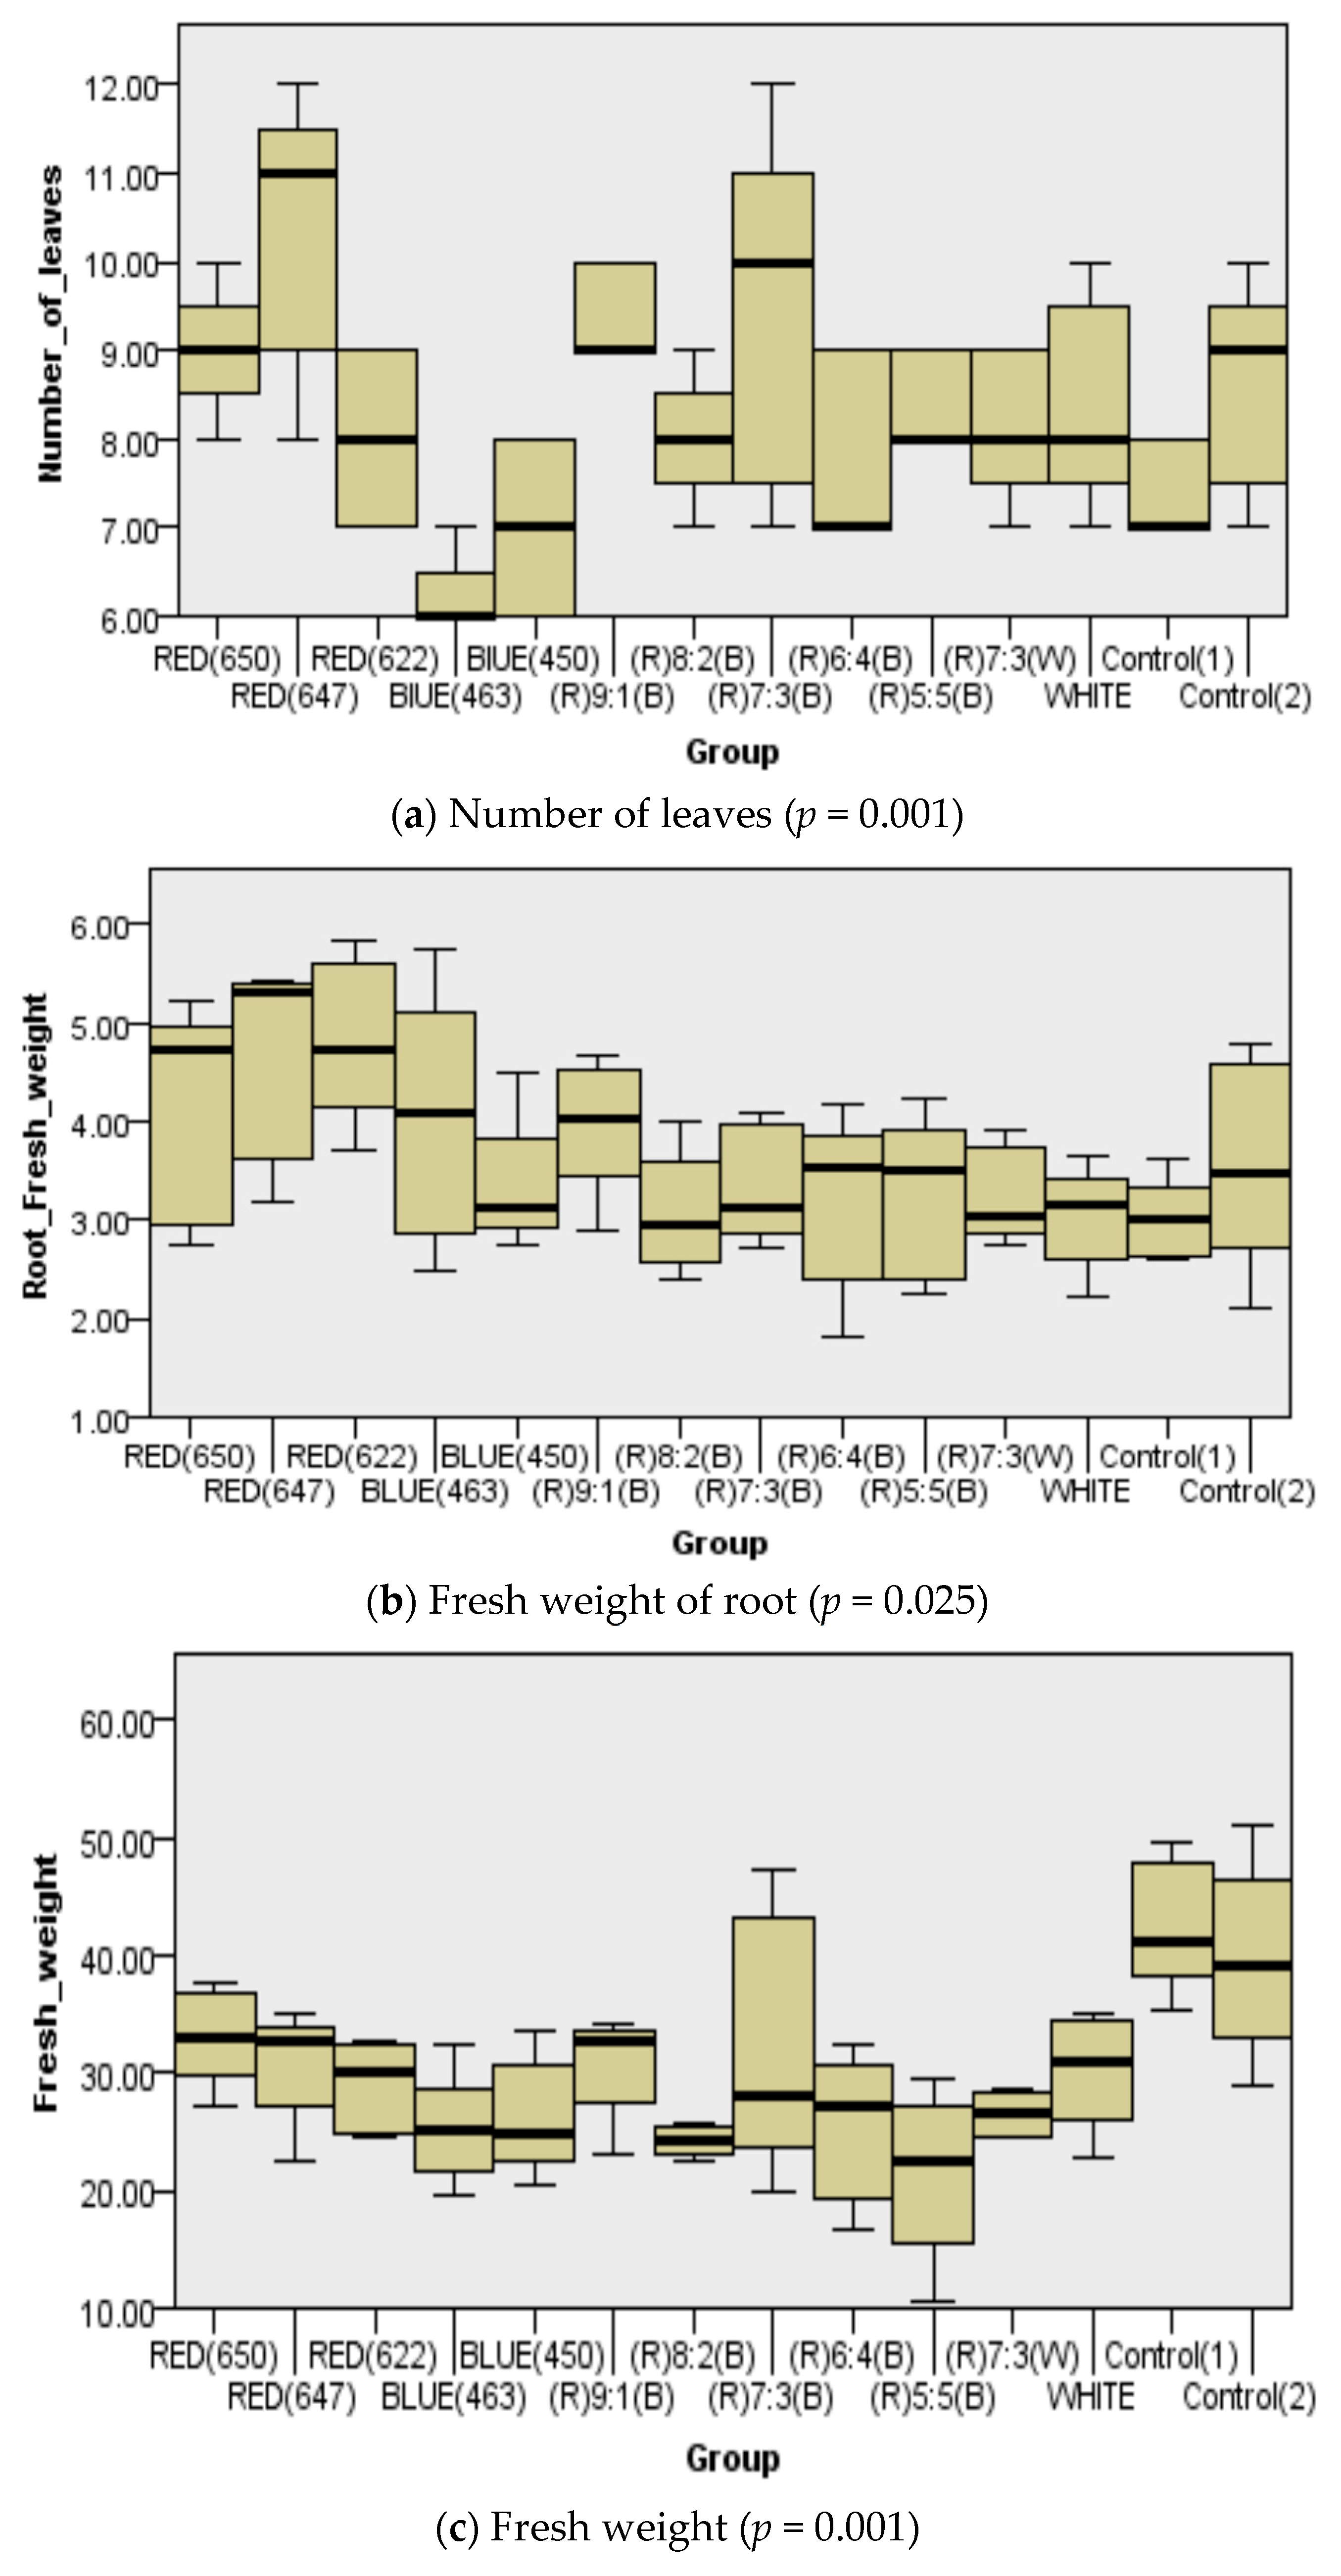
| Number of leaves **‡ | 3 | 1 | 9 | 14 | 13 | 2 | 10 | 4 | 11 | 6 | 8 | 7 | 12 | 5 | 0.001 | 0.016 |
| Fresh weight **‡ | 3 | 5 | 8 | 12 | 10 | 4 | 13 | 7 | 11 | 14 | 9 | 6 | 1 | 2 | 0.001 | 0.002 |
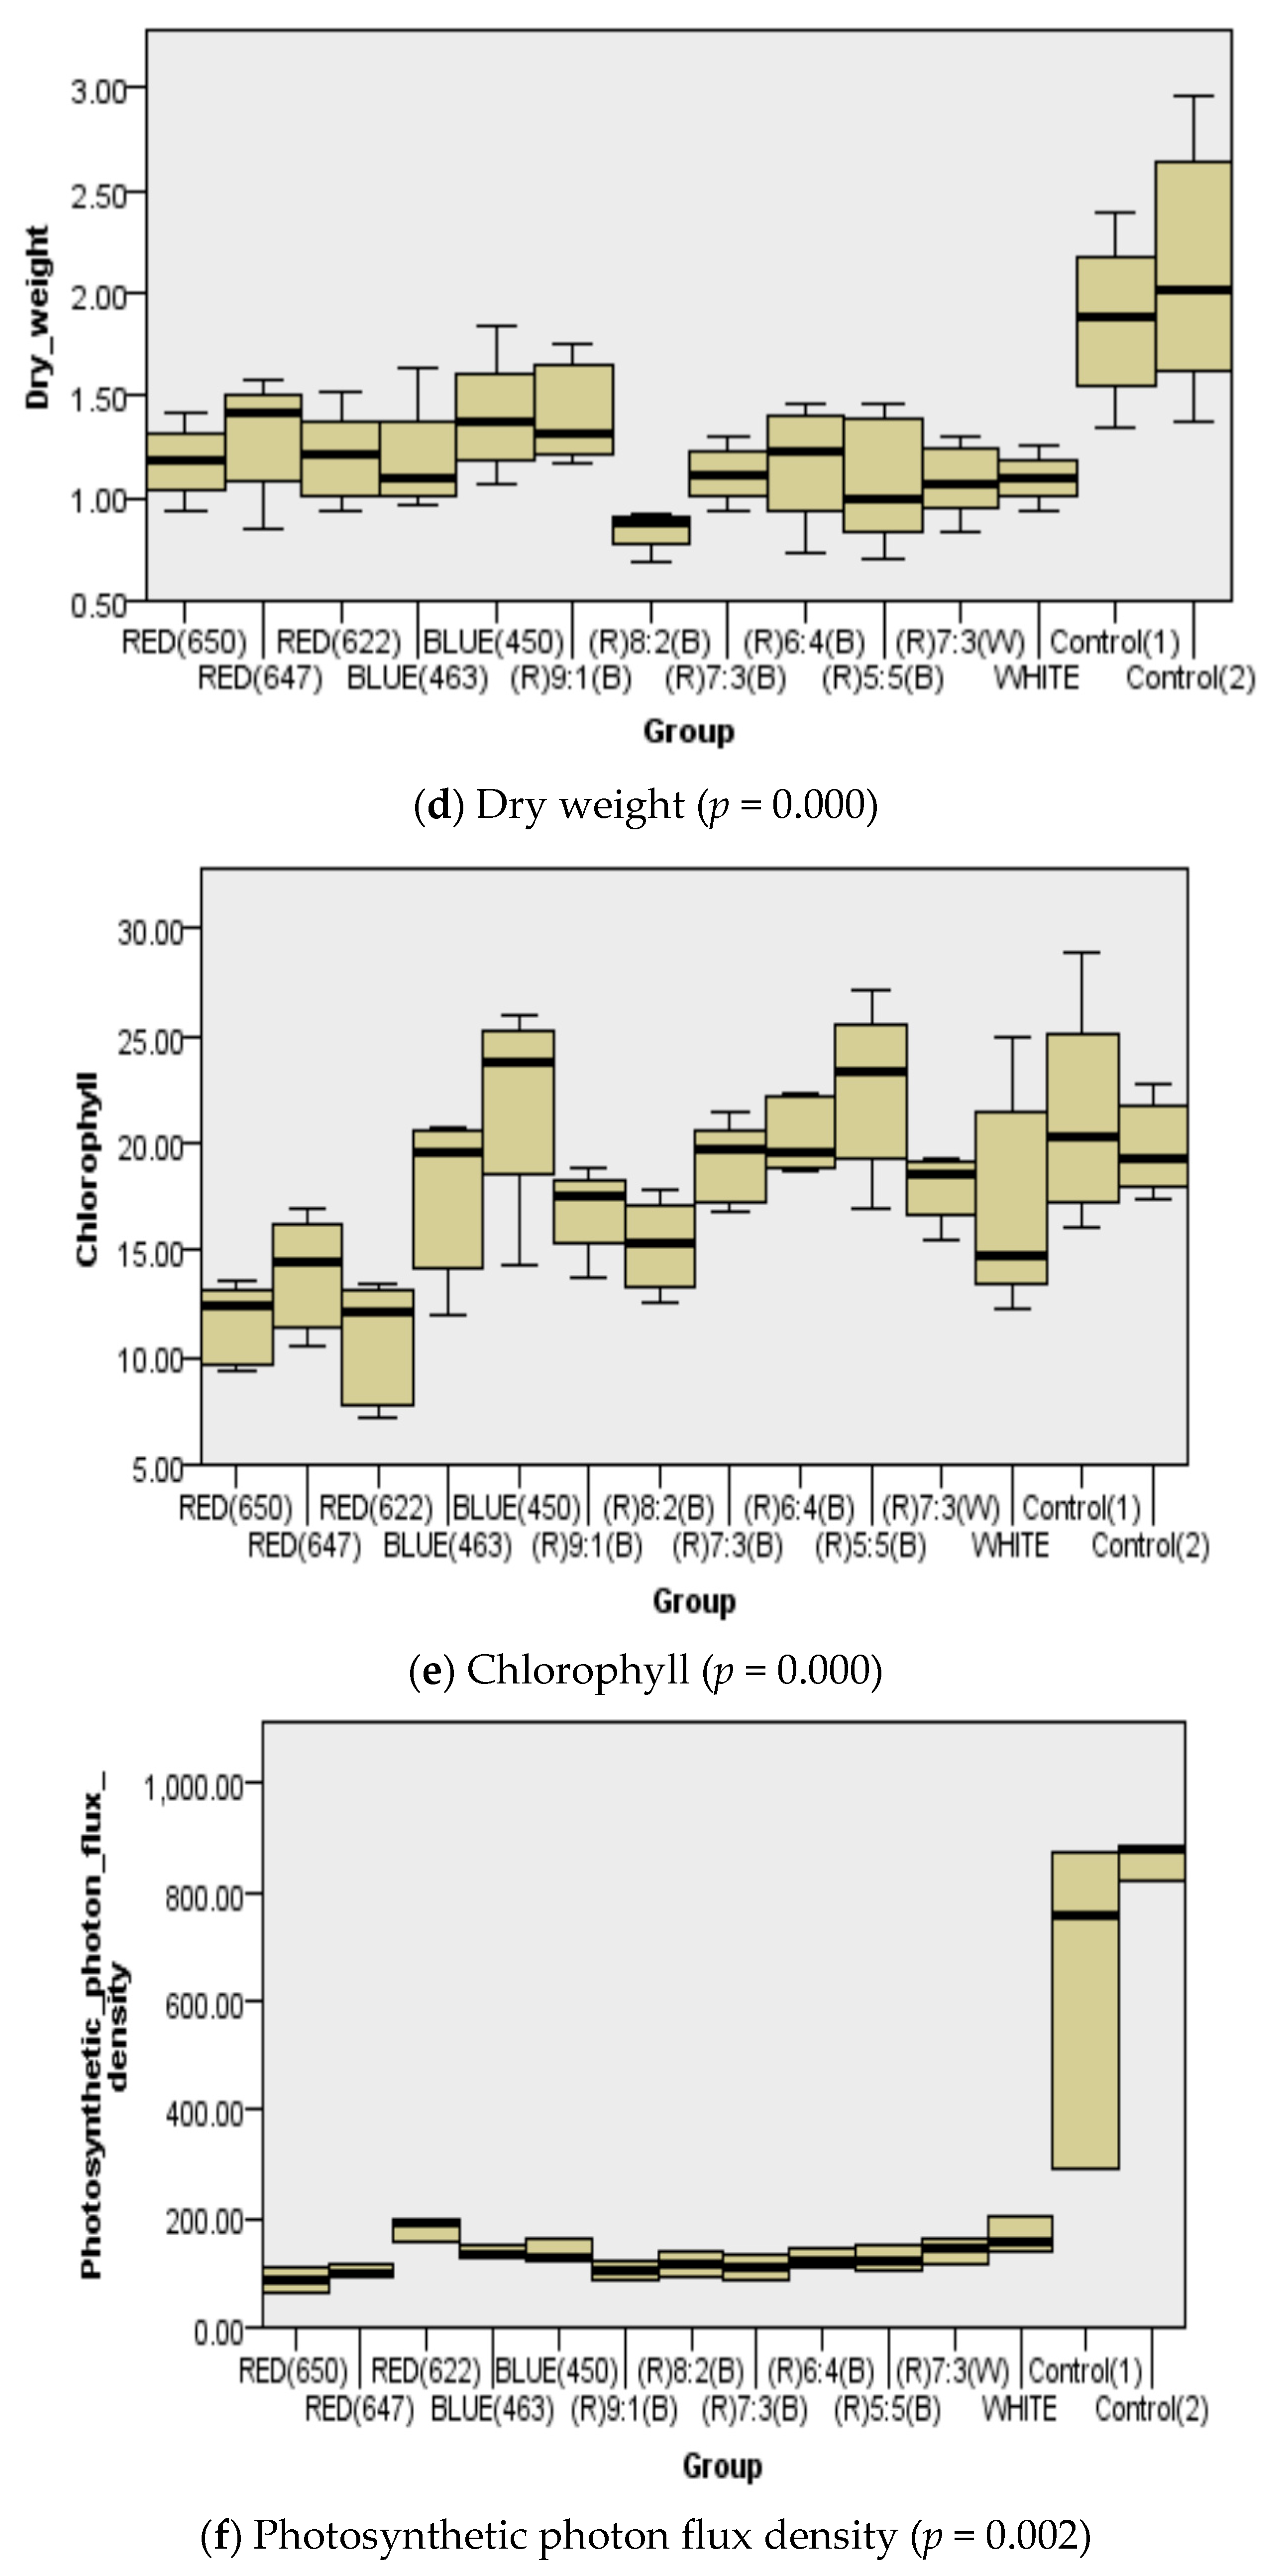
| Dry weight **‡ | 7 | 5 | 8 | 9 | 4 | 3 | 14 | 11 | 6 | 10 | 13 | 12 | 2 | 1 | 0.000 | 0.004 |
| Root length | 4 | 3 | 2 | 6 | 8 | 5 | 13 | 8 | 9 | 10 | 11 | 12 | 14 | 7 | 0.761 | 0.339 |
| Root fresh weight ‡ | 13 | 12 | 14 | 8 | 2 | 9 | 11 | 6 | 3 | 1 | 7 | 10 | 4 | 5 | 0.025 | 0.810 |
| Root dry weight | 14 | 13 | 4 | 8 | 6 | 13 | 11 | 12 | 9 | 10 | 7 | 5 | 3 | 2 | 0.072 | 0.486 |
| Chlorophyll **‡ | 13 | 12 | 14 | 8 | 2 | 9 | 11 | 6 | 3 | 1 | 7 | 10 | 4 | 5 | 0.000 | 0.004 |
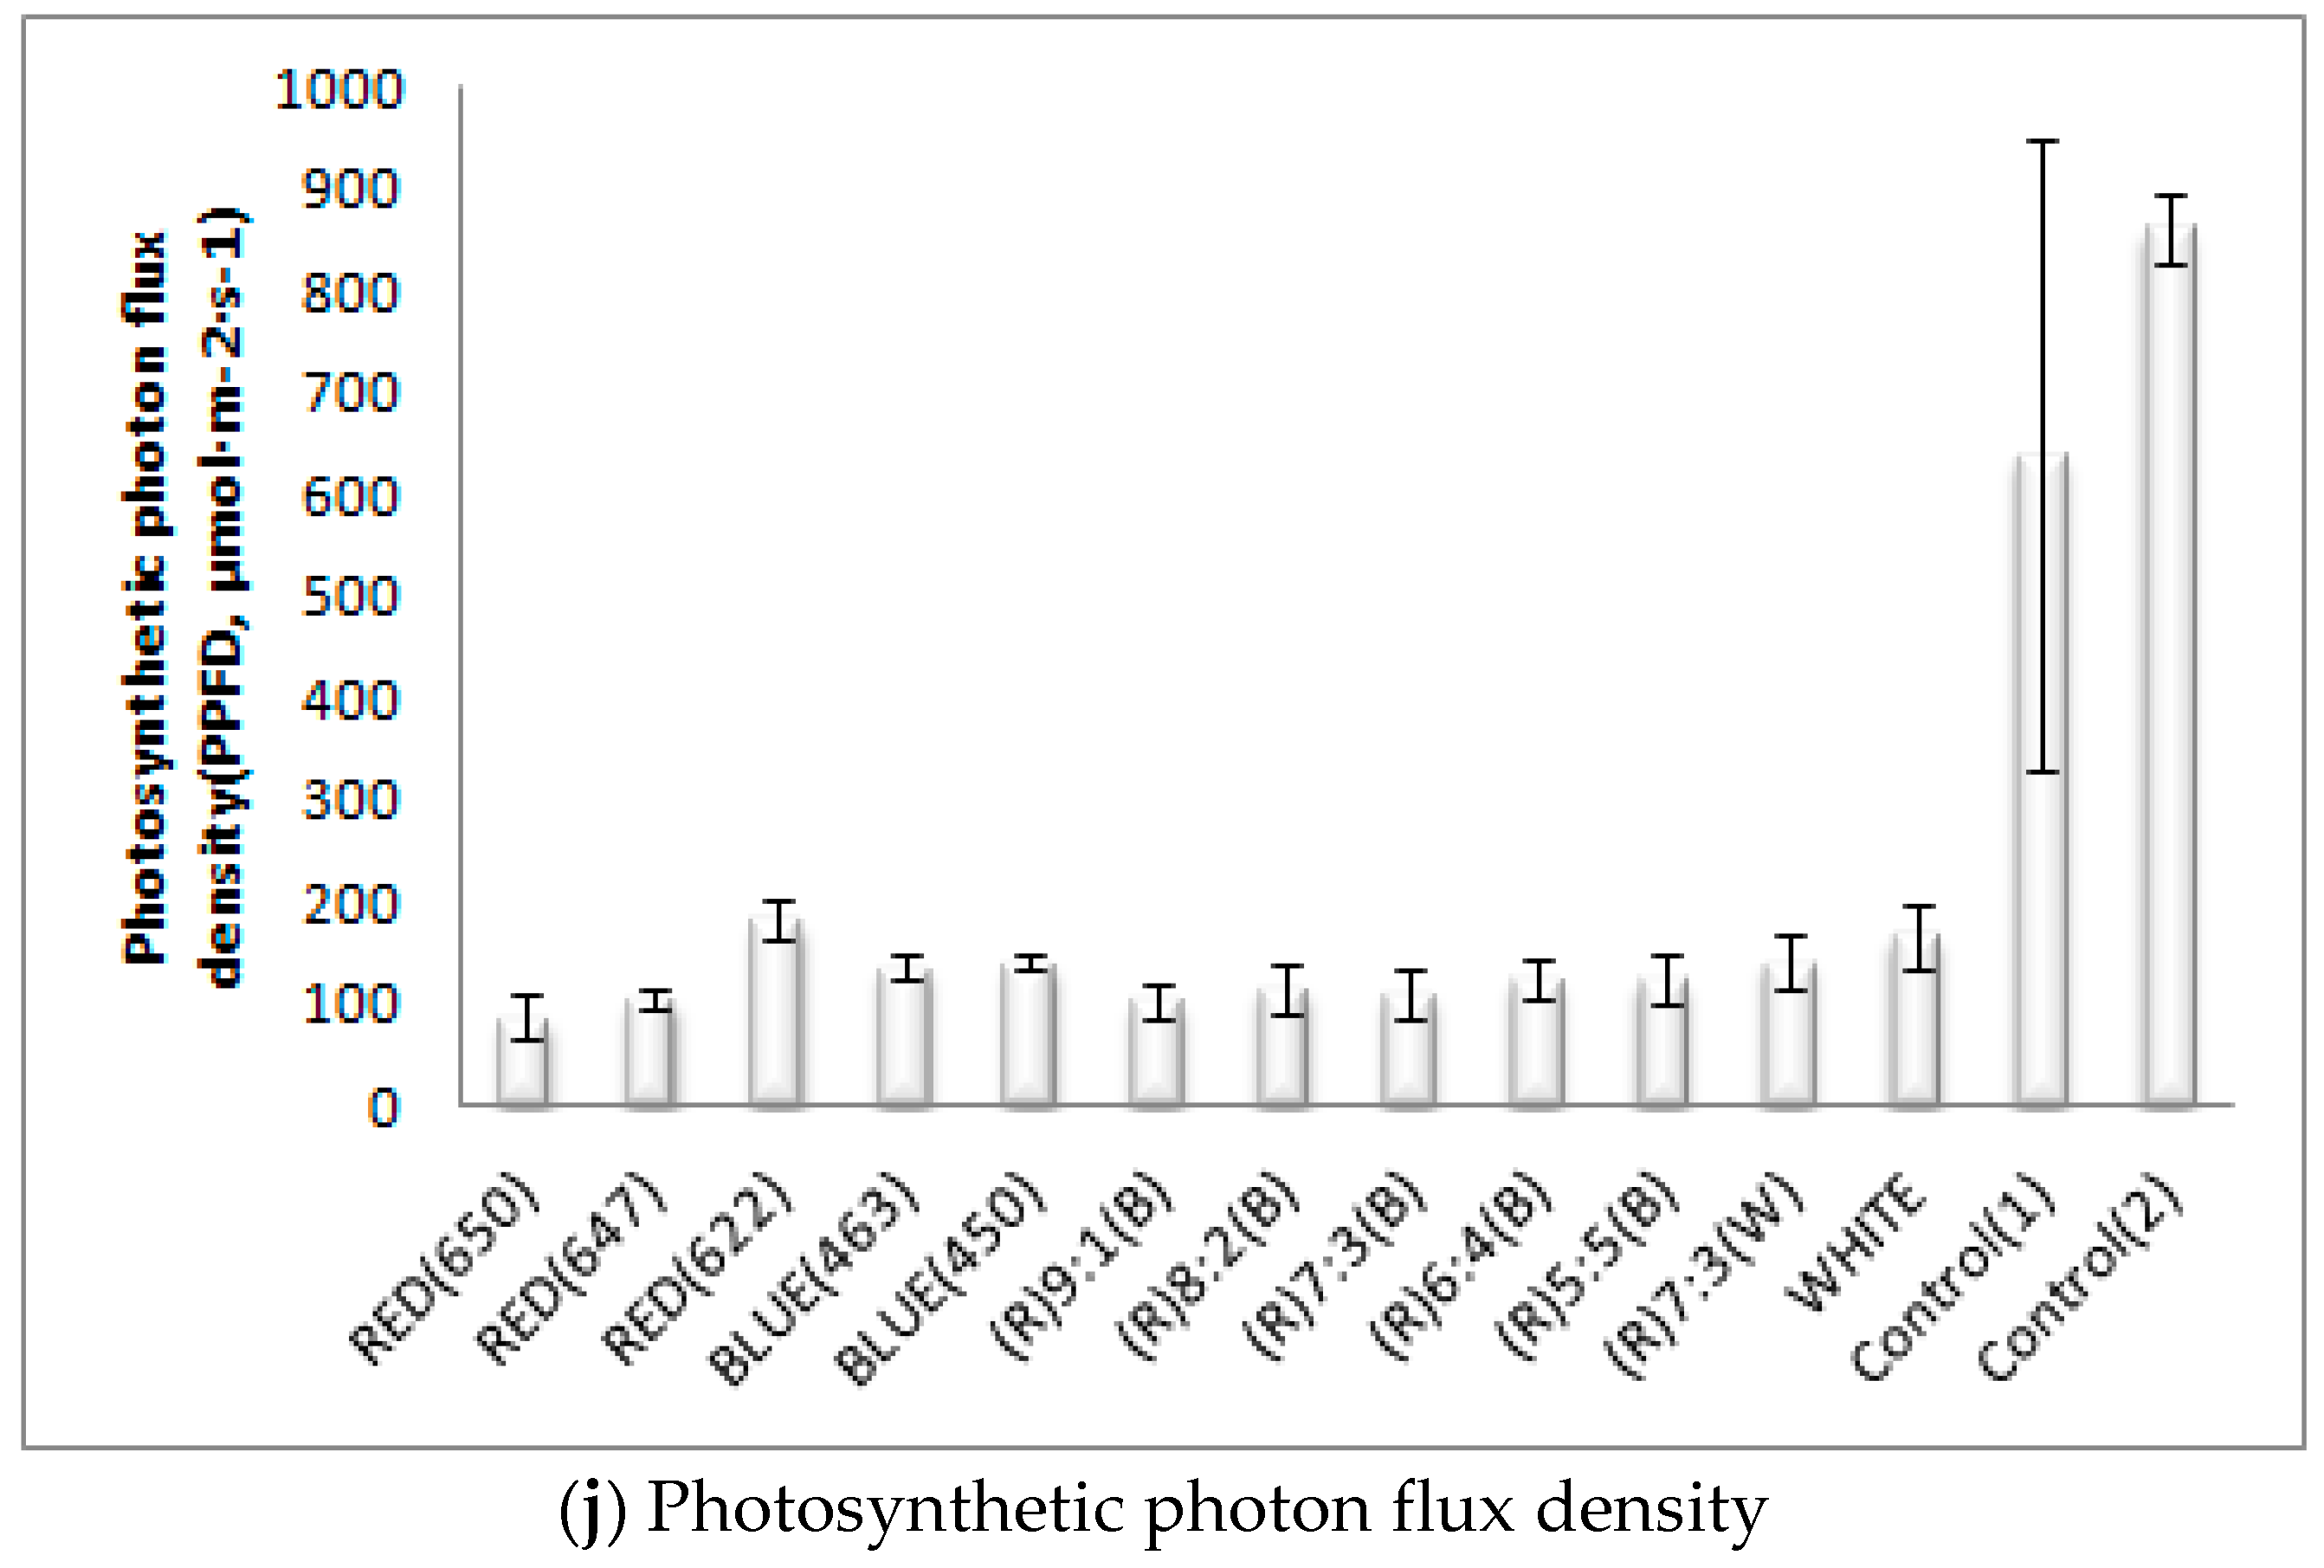
| Photosynthetic photon flux density ** | 14 | 13 | 4 | 8 | 6 | 13 | 11 | 12 | 9 | 10 | 7 | 5 | 3 | 2 | 0.002 | 0.086 |
Publisher’s Note: MDPI stays neutral with regard to jurisdictional claims in published maps and institutional affiliations. |
© 2021 by the authors. Licensee MDPI, Basel, Switzerland. This article is an open access article distributed under the terms and conditions of the Creative Commons Attribution (CC BY) license (https://creativecommons.org/licenses/by/4.0/).
Share and Cite
Kim, K.-Y.; Huh, J.-H.; Ko, H.-J. Research on Crop Growing Factory: Focusing on Lighting and Environmental Control with Technological Proposal. Energies 2021, 14, 2624. https://doi.org/10.3390/en14092624
Kim K-Y, Huh J-H, Ko H-J. Research on Crop Growing Factory: Focusing on Lighting and Environmental Control with Technological Proposal. Energies. 2021; 14(9):2624. https://doi.org/10.3390/en14092624
Chicago/Turabian StyleKim, Ki-Youn, Jun-Ho Huh, and Han-Jong Ko. 2021. "Research on Crop Growing Factory: Focusing on Lighting and Environmental Control with Technological Proposal" Energies 14, no. 9: 2624. https://doi.org/10.3390/en14092624
APA StyleKim, K.-Y., Huh, J.-H., & Ko, H.-J. (2021). Research on Crop Growing Factory: Focusing on Lighting and Environmental Control with Technological Proposal. Energies, 14(9), 2624. https://doi.org/10.3390/en14092624