Article

A Planning Method for Partially Grid-Connected Bus Rapid Transit Systems Operating with In-Motion Charging Batteries

by
Andrés E. Díez
1,*,† and
Mauricio Restrepo
2,†
1
Department of Electrical and Electronics Engineering, Universidad Pontificia Bolivariana, Circular 1 70-01, Medellín 050031, Colombia
2
Department of Electrical and Electronics Engineering, Universidad del Norte, km 5 Vía Puerto Colombia, Barranquilla 081007, Colombia
*
Author to whom correspondence should be addressed.
These authors contributed equally to this work.
Energies 2021, 14(9), 2550; https://doi.org/10.3390/en14092550
Submission received: 3 March 2021 / Revised: 4 April 2021 / Accepted: 9 April 2021 / Published: 29 April 2021
(This article belongs to the Section E: Electric Vehicles)

Abstract

:
This paper presents an electrical infrastructure planning method for transit systems that operate with partially grid-connected vehicles incorporating on-board batteries. First, the state-of-the-art of electric transit systems that combine grid-connected and battery-based operation is briefly described. Second, the benefits of combining a grid connection and battery supply in Bus Rapid Transit (BRT) systems are introduced. Finally, the planning method is explained and tested in a BRT route in Medellin, Colombia, using computational simulations in combination with real operational data from electric buses that are currently operating in this transit line. Unlike other methods and approaches for Battery Electric Bus (BEB) infrastructure planning, the proposed technique is system-focused, rather than solely limited to the vehicles. The objective of the technique, from the vehicle’s side, is to assist the planner in the correct sizing of batteries and power train capacity, whereas from the system side the goal is to locate and size the route sections to be electrified. These decision variables are calculated with the objective of minimizing the installed battery and achieve minimum Medium Voltage (MV) network requirements, while meeting all technical and reliability conditions. The method proved to be useful to find a minimum feasible cost solution for partially electrifying a BRT line with In-motion Charging (IMC) technology.

1. Introduction

Since the beginning of transit electrification in the last quarter of the 19th century, Grid-connected Systems (GCSs) became the core of mass transit in main cities of Europe and North America, starting with London metro, electrified by 1890 [1]. Despite the fact that electro-mobility has been among us for a long time, the term is usually restricted to new battery electric vehicles, maybe because its presence is not obvious to the public as many of these systems, represented by metros, are underground, and they are almost limited to high capacity modes. By the decade of 1920s, electro-mobility prevailed in medium-capacity surface transit, in the form of intricate networks of trams, trolleybuses and cable cars, and even intercity routes experienced a golden age with commuter railways. All of these modes had one thing in common: their energy was continually supplied by the electric grid. Back then, there was also a spike in battery electric cars, trams, and even small trains, which lasted until the end of that decade.
Nowadays, when a new wave of electro-mobility motivated by recent advances in Lithium-ion (Li-ion) batteries, with the subsequent mass production and use of electric car, buses, bikes, motorcycles and a great variety of the so-called last-mile vehicles, grid connected systems and vehicles are still responsible for consuming about 85% of the electricity in the transport sector [2]. According to the International Energy Agency (IEA), rail mode (a great part of GCS) consumed around 290 TWh of electricity in 2018 (more than 1% of global electricity use), while electricity demand to serve EV was roughly a fifth part of it (58 TWh) [2,3]. Almost 55% of Electric Vehicle (EV) energy demand was attributable to two wheelers, which have a global stock of 260 million, while BEB energy share was 20% for a fleet of about 460,000. Moreover, the energy consumption of the global BEB fleet in 2019, which corresponds to 11.46 TWh, was about the same of the total urban rail energy consumption in Europe [2,3].
Bus modes, especially in intensive operational BRT schemes, could be considered the border between grid-connected operation and battery energy storage. It is widely recognized and reported that two operational schemes for BEB are disputing their prevalence among new bus electrification projects, i.e., the depot charging and the opportunity charging [4,5,6,7,8], while In-motion Charging (IMC), an alternative that uses typical trolleybus overhead lines to charge the batteries, is either ignored or superficially discarded arguing reasons as technological obsolescence, landscape ugliness because of the catenary, prohibitive deployment cost, among others, but no objective assessment is provided as support. Additionally, as onboard energy storage increases in vehicles, the opportunity of eventually using this capacity to support the grid, by considering the fleets as virtual power plants, becomes a promising field for further development of IMC technology [9]. If the vehicles remain connected to the grid for longer times, either when stopped or moving, the interaction with the grid would be not only easier, but more fruitful.
Recently, several works in the literature have addressed and compared the operation of BEB systems for public transportation. In [10], the author presents a lifecycle cost analysis for an electric city bus fleet in different operating routes, using a specific simulation tool to evaluate BEB under different conditions. Overnight, end station and opportunity charging methods are assessed, whereas IMC is not evaluated. Additionally, authors in [11] propose a novel mathematical formulation to model BEB fleet systems, which integrates the transportation and the power distribution system models, achieving an integrated utility-transit problem formulation for optimal design studies. This model deals with depot opportunity charging, but again, IMC alternative is not considered. Reference [12] proposes an optimal battery charging and schedule control strategy for electric BRT, taking into account hourly energy price variations. However, it assumes an existing depot charging system and does not take into account the infrastructure cost. As this approach neglects IMC, the bus has to be charged when stopped at the depot. Moreover, the results of this work are constrained to an assummed fleet of 20 buses, which is small considering the patronage required in a real BRT operation.
Regarding a combined operation between battery and grid connection, ref. [13] proposes a method for planning wireless infrastructure for BEB dynamic charging. This approach takes into account that many bus routes have overlapped segments and the dynamic charging infrastructure can be used by buses from several routes. A robust optimization algorithm is adopted to address the uncertainties of energy consumption and travel time. However, when BRT operation is considered, as in the present work, travel times and energy consumption uncertainties are reduced with respect to mixed traffic routes. Additionally, authors in [14] demonstrate the cost competitiveness of wireless IMC technologies for intensive bus lines by studying different types of charging modes, including charging stations and battery swapping facilities, through an optimization model that does not take into account a detailed energy consumption profile of the buses, which is highly related to the topography of the route. Thus, this work finds that charging lanes supported by the current inductive IMC technology are cost competitive for most of the existing BRT corridors, and their superiority becomes more remarkable for those transit systems with high service frequency and low operational speed. However, conductive charging with overhead lines is discarded because of infrastructure deployment cost and installation challenges during the night. Additionally, according to these authors, the service frequency, route length, and operational speed of a transit system have a great impact on the cost competitiveness of different charging infrastructure. Authors in [15] postulate IMC as an alternative to reduce investment risks in transport electrification, mainly by reducing the uncertainties regarding battery lifespan and eventual replacement cost. These authors also provide guidelines about the minimum coverage of the electrification as a function of the maximum charging power, using average energy consumption estimations, and report financial advantages of the IMC scheme with 20% overhead line coverage compared to depot charging. The present work improves these estimated guidelines using detailed energy consumption to recommend, specifically, which segments are the most effective to be electrified. In [16], a theoretical analysis of the impact of supply system topology on the energy consumption in the trolleybus system of Gdynia is described, supported by extensive measurement analyses. This study found a strong relationship between traffic conditions, the spatial structure of the electricity supply system, and the use rate of regenerative braking.
With respect to optimization applied to trolleybus battery sizing, ref. [17] presents an optimal battery sizing procedure for hybrid trolleybuses that takes into account the assigned trolleybus energy and power requirements along with operational data and the details on the features of the battery technologies. Based on a recursive algorithm, the proposed procedure minimizes the total cost of the battery energy storage, taking into account the main factors affecting the battery life, such as the depth of discharge and the working temperature; in the present paper, the optimization of the minimal cost involves both battery storage and power supply-charge infrastructure cost. In [18], authors describe and compare two approaches, based on discrete time and event optimizations for minimizing the charging costs and the grid impact of fast charging BEB transit networks; however, they assume a constant average energy consumption of 1.5 kWh/km for 12 m buses, and recommend that a large fleet of BEB could be used as a virtual power plant, providing services to the grid.
From the aforementioned discussion, little attention has been paid to conductive IMC, even though recent advances in battery storage technologies, combined with well-known and extensively proven electricity feeding technologies used in trolleybus systems, have demonstrated to provide an effective solution in high-demand transit corridors, such as those of BRT systems. Therefore, the objective of this paper is to present an optimization-based conductive IMC planning technique to select the best combination of battery size, route segment electrification, and depot charging infrastructure that guarantees the correct operation of a high-demand BRT system. The proposed method is tested in a BRT line in Medellin, Colombia, using actual power and energy measurements on a 18 m articulated BEB that has been operating in this line since 2018. The proposed technique also addresses a gap discussed in [1], which states that, among the challenges that face transportation and power utility sectors to integrate BEB, the lack of appropriate simulation tools to model, design, and optimize BEB fleet systems is the most prominent.
The remainder of this paper is organized as follows: Section 2 presents background information about charging strategies for BEB. Section 3 discusses the effect of energy source selection in BRT systems operation. The details of the proposed IMC planning model are described in Section 4, and the characteristics of the study case and the studied articulated BEB are depicted in Section 5. The main simulation results are discussed in Section 6, and the conclusions of this work are highlighted in Section 7.

2. BEB Charging Strategies

2.1. Depot Charging

Depot charging refers to the battery charging that occurs in bus depots, mainly during night, and eventually during operational valley periods [19]. A basic example of this scheme is given in Figure 1, which includes a typical charger converter and a manual connector according to charging standards. The main idea in this scheme is that buses are equipped with a relatively large energy storage capacity in order to guarantee a full schedule operation without charging.
Considering the battery size, a high gravimetric energy density battery must be used, being Nickel-Manganese-Cobalt (NMC) (around 200 Wh/kg) the ideal alternative, although its high cost restrains its use to buses for high GDP markets. For buses intended for Latin American, Eastern European, Asian, and African markets, Lithium Ferrophosphate (LFP) batteries dominates, resulting in a battery that weights twice (around 100 Wh/kg). Currently, for articulated buses, the use of an LFP battery implies an overweight of about 3 tons, which compared to an equivalent diesel bus or trolleybus, this usually represents a loss of passenger capacity between 30 to 40 passengers, for a vehicle that in BRT operations could have a capacity of 180 passengers. If a lighter bus is desired, the use of composite materials or aluminum is required, increasing the costs and reducing the possibility of local manufacturing in low GDP markets. For 12 m buses, even assuming a passenger density of 8 passenger/m2, a battery weighting close to 1.3 tons could be added without exceeding the usual gross vehicle weight limit of 19.5 tons [19]. Additionally, LFP batteries are restricted in terms of charging (0.5 C) and discharging rates (1 C). The latter does not result critical because of the relationship between the required maximum power and energy capacity is relatively low, thanks to the large battery size.

2.2. Opportunity Charging

This operational scheme is intended to overcome some of the disadvantages of the depot charging, replacing the storage unit with a smaller battery with enough capacity to withstand frequent and high-power fast charging, every time there is an opportunity on the route and terminal stops [10,12,18,19]. The smaller and lighter battery is depot charged during the night, and the on-route partial charging allows meeting the scheduled operational range. At least three kinds of chargers have been in use in Opportunity Charging (OC) systems: depot and terminal charging with powers around 40 kW to 60 kW, on-route fast charging of 400 kW, and on-route ultrafast charging above 500 kW. It is important to mention that on-route charging systems require pole-mounted connectors, as seen in Figure 2, which automatically locate the input contact on top of the bus to start feeding the battery. Moreover, a high-power charging requires a special battery chemistry, being Lithium-titanate (LTO) the most commonly used because its high C (8–10), and its long lifespan (more than 10,000 cycles), which is required for a demanding routine.

2.3. In-Motion Changing

2.3.1. Wireless In-Motion Changing

Wireless in-motion chargers operate through the electromagnetic induction from a primary coil, connected to a charger converter, to a secondary coil, which is located at the bus bottom, and feeds directly the battery system. As depicted in Figure 3, the primary coils are installed on the road, so that the energy from the charger converter is continually induced in the secondary coil as the bus is moving. One of the intentions for promoting the use of grid-connected sections in BRT electrification projects is to reduce the risks associated to battery premature aging, charging infrastructure reliability issues, and unexpected bus load growth represented in the installation of air conditioning or heating systems. With respect to the wireless charging, the mere advantage with respect to conductive charging is the aesthetics improvement of avoiding overhead lines, while involving critical disadvantages in both construction and operation. Capital cost expenditure related to relocation of underground infrastructure, as water and natural gas pipes, pavement or concrete works, installation of underground MV feeders, are higher than overhead line installation. Operationally, inductive charging is at least 5% less efficient than conductive, as reported in [7] for stationary cases. Considering that primary and secondary coils need to be close and aligned correctly to minimize leakage flux, efficiency in this scheme is compromised if eddy currents are caused in elements near the chargers. Additionally, the bus design must consider the minimization of all ferromagnetic elements in the bottom. Some wireless charging technology manufacturers are seeking to develop a dynamically charging system that would power motors directly, in order to increase the efficiency by 15% [7], eliminating the losses associated to battery charging, feature already achieved by conductive IMC technology.

2.3.2. Conductive In-Motion Charging

Conductive IMC is based on the classic trolleybus feeding system with overhead lines, and a storage element on-board the bus that enables its operation without catenary contact for a portion of the route. As this charging system requires the bus to connect and disconnect to/from the overhead line, contact guides should be provided along the route to facilitate this procedure, as seen in Figure 4. Thus, the infrastructure and equipment required to supply the energy demanded for the bus fleet with conductive IMC can be classified into the following categories:
  • Medium Voltage (MV) feeder: It consists of the equipment required to supply energy from the MV network to the traction substations and depot chargers.
  • Traction Substation (TS): It consists of a coupling point to an MV feeder, a power transformer, and an AC/DC converter. It could be used to feed a catenary section and to supply energy to depot scheme to charge the battery buses trough an alternative connector. The cost of TS can be assumed as a function of the power capacity in USD/kW. If a design class VI is assumed for this element, according to standard UNE EN 50328:2004 [20], the equipment is be able to withstand an overload of 3 p.u. during 60 s, 1.5 p.u. for 2 h, and 1.0 continually.
  • Catenary segment: It includes the set of elements and equipment of the overhead line such as poles, insulators, mechanical supports, and related accessories. Its cost is almost independent of the feeding power, and it is considered only proportional to the length in USD/km.
  • Depot Charger: It consists of a power converter for BEB charging with DC current. Its cost is related to the charger power.
  • On-board battery: It is the battery installed on-board the buses, and its cost is related to the energy capacity in USD/kWh, and the chemistry, i.e., LFP, NMC, or LTO.
As this charging method is primarily an improvement of classic trolleybus systems, it is important to briefly discuss the importance of these systems and the new opportunities with conductive IMC. Trolleybuses have been in public transit service since the decade of 1910s, and were very popular around the world until the decade of 1950s, when along with streetcar and many commuter railway systems faced a quick decadence, especially in several cities of United States, Latin America and Eastern Europe [21]. In some cases to highlight in the Americas, such as San Francisco, Seattle, Boston, Dayton, Mexico City and Sao Paulo, trolleybus lines were maintained, and with the exception of Boston, these cities have strong plans involving trolleybus technology in the future, mostly thanks to state of the art Li-Ion batteries. Contrary to the common belief, new batteries are potentiating trolleybus technology, because the combination of grid-connected and off-wire battery operation is eliminating the restriction of both schemes, and joining their advantages; nowadays, under trolleybus conductive platform, the use of dual-source catenary-battery IMC buses are gaining relevance in Europe and specially in China [22,23]. Trolleybuses remained important in East Europe and Asia, regions in where they are also gaining strength with new large systems in the Chinese cities of Shanghai, Baoding and Jinan, and two BRT lines with articulated trolleybuses in the Turkish cities of Malatya (2015) and Sanliurfa (2018). In Africa, a new BRT trolleybus system entered in operation in Marrakech [24] in 2017, but given a trouble with the overhead line, the buses have to operate only with the batteries, with many daily depot charges, until February 2020, when the catenary finally entered in operation. In Riyadh, Saudi Arabia, a 4 km trolleybus line opened in 2013, connecting several buildings of the King Saud bin Abdulaziz University for Health Sciences (KSAU-HS) campus. Cities that retain trolleybuses and are incorporating IMC technology impulse new developments in dual source trolleybuses energy management, like [25] that design an energy storage system combining batteries and super-capacitors to improve energy use.
A system that needs a special mention is the BRT trolleybus system of Quito, Ecuador, inaugurated in 1995, that became the pioneer in applying trolleybuses into BRT schemes [26,27]. Despite its high success, only two Latin American cities adopted trolleybuses for their BRT, i.e., Merida, Venezuela, still in operation, and Barquisimeto, Venezuela, a great failure, that sunk in the middle of the chaotic situation in this country [28]. The trolleybus of Quito managed to mobilize in its electric trolleybuses 220,000 passengers daily (2002), with a capacity of up to 15,000 pphs [29]. Although not IMC, the buses had dual diesel-electric motorization to off-wire operation. The fleet of 100 trolleybuses lasted 22 years, but 60 units remained operational in 2020. However, the Quito scheme has been followed by Beijing and Shanghai. The former has electrified 18 BRT lines with battery-backed trolleybuses, and the latter inaugurated in 2020 its last generation BRT line with IMC trolleybuses [23]. Cities that include trolleybus systems within the range of electrification options tend to be those that are currently operating a trolleybus network. For example, ref. [30] presents and analyzes how the gradual development and adoption of IMC technology from 2004 to 2018 has been a key factor for the improvement and consolidation of the three Polish trolleybus networks: Gdynia, Lublin, and Tychy. In this evaluation, authors find how the battery operation has been successfully used both in emergency and regular traffic, as for extending the service range of the trolleybuses. Despite trolleybuses being a mature and sustainable technology, the introduction of a new trolleybus system is aggressively disputed because of the installation of overhead lines.

3. Vehicle Technology Effect in BRT Operation

Before the discussion about proper electric bus technologies for BRT systems that we face nowadays, the discussion about energy sources in such transit systems involved fossil alternatives, mainly diesel and Compressed Natural Gas (CNG), with the characteristics described in Table 1. Two particular examples of these discussions can be found in Bogota and Medellin, Colombia’s first and second largest cities. In 2018, Bogota’s BRT system company, Transmilenio, decided to renovate a fleet of 1441 diesel buses. Despite that BEB were considered as an alternative, the fleet renovation was done with 741 CNG and 700 Euro V diesel buses. Before that, in 2008, an intensive debate arose in Medellin when it was decided that the new BRT would use CNG buses instead of electric trolleybuses, the latter being promoted by academic sectors. However, the high impact of this decision on the public opinion yielded later to a city council agreement which states that bus fleet renovation must be achieved with electric buses. In 2017, following the council’s agreement, several city institutions started a pilot project with a 18 m battery bus from the manufacturer BYD to test these technologies under actual operational conditions.
A previous work examined the cost differences of four bus technologies (diesel, CNG, electric-diesel hybrid, and trolleybus) for BRT operation in Colombia [33]. This paper considered a sensitive analysis with the annual travel of vehicles as the independent variable, and the Net Present Value (NPV) of the project as dependent variable, for a 24 year period. The results of this work showed that a fully electrified trolleybus system would be more profitable than a CNG or hybrid project with an annual traveled distance of 50,000 km/year, and than a diesel project with 65,000 km/year, considering medium growth rate scenarios. The assumed cost for the electric infrastructure, including overhead lines and traction substation, was 733,989 USD/km. The cost of the buses was assumed as 325,000 USD for diesel, 425,000 USD for CNG, 525,000 USD for hybrid, and 606,000 USD for trolleybuses. Lower energy and maintenance cost, and larger lifespan, favored the electrification alternative despite higher capital costs.
Zero emissions target in BRT systems is fundamental as users are exposed to bus fleets with powerful engines, and eventually, as the fleet ages, there is an unavoidable trend for high concentrations of air pollutants. Various examples of this phenomenon have been reported for Transmilenio system, where high concentrations of PM2.5 and other pollutants such as black carbon and CO have been measured [34,35,36]. Additionally, according to [34], due to diesel buses the Transmilenio system produces high PM2.5 emissions, whereas its configuration of roads and stations favors high exposure of system’s users to self-produced pollutants.

4. IMC Planning Model

The aim of this model is to determine both the size of the on-board bus battery, and the energy supply infrastructure to obtain the minimum cost solution for electrifying a BEB route. The energy supply infrastructure accounts for the depot chargers and the required conductive on-route supply, either for traction or battery charging. The minimum cost optimization process considers the physical characteristics of the route and the buses, as well as the operational rules of the fleet. The purpose of the model is to reduce around 30% to 50% the on-board battery capacity of each vehicle, compared to the size of the batteries installed in a depot charging scheme and, at the same time, guarantee an extended operational range. In consequence, bus passenger capacity is increased thanks to reducing the weight and volume of the battery, since each ton saved (about 100 kWh in LFP batteries) represents up to 14 more passengers. Moreover, by reducing dead times caused by charging stops, the amount of buses available to operate would be greater, which is critical for heavy duty lines, and the depot charging during night will employ less hours and power for charging the entire fleet with the required energy for operating the next day. The latter represents another advantage since distribution lines will be less stressed during the night (18–24 h), contributing to avoid some bottlenecks in the MV system of Medellin that are now foreseen in high EV penetration scenarios [37].
Given the aforementioned goals, the following equations describe the proposed optimization model to determine the best combination of batteries and IMC segments throughout a bus route. All variables and parameters of these equations are described in the Nomenclature Section.
  • Objective function: it consists of minimizing the total investment costs, and considers the costs associated to overhead line segments, batteries, traction substations and depot chargers:
    min s = 2 N S x s , s 1 L s , s 1 C c a t + b = 1 N B B b C b a t + s = 1 N S y s C s u b + P d e p C d e p
  • Line segment electrification and traction substation constraints: the following equations determine the installation of electrified segments between bus stops and the location of traction substations to feed the required overhead line segments [13]:
    y s x s , s + 1 , s = 1 , , N S
    y s 1 x s 1 , s , s = 1 , , N S
    y s x s , s + 1 x s 1 , s , s = 1 , , N S
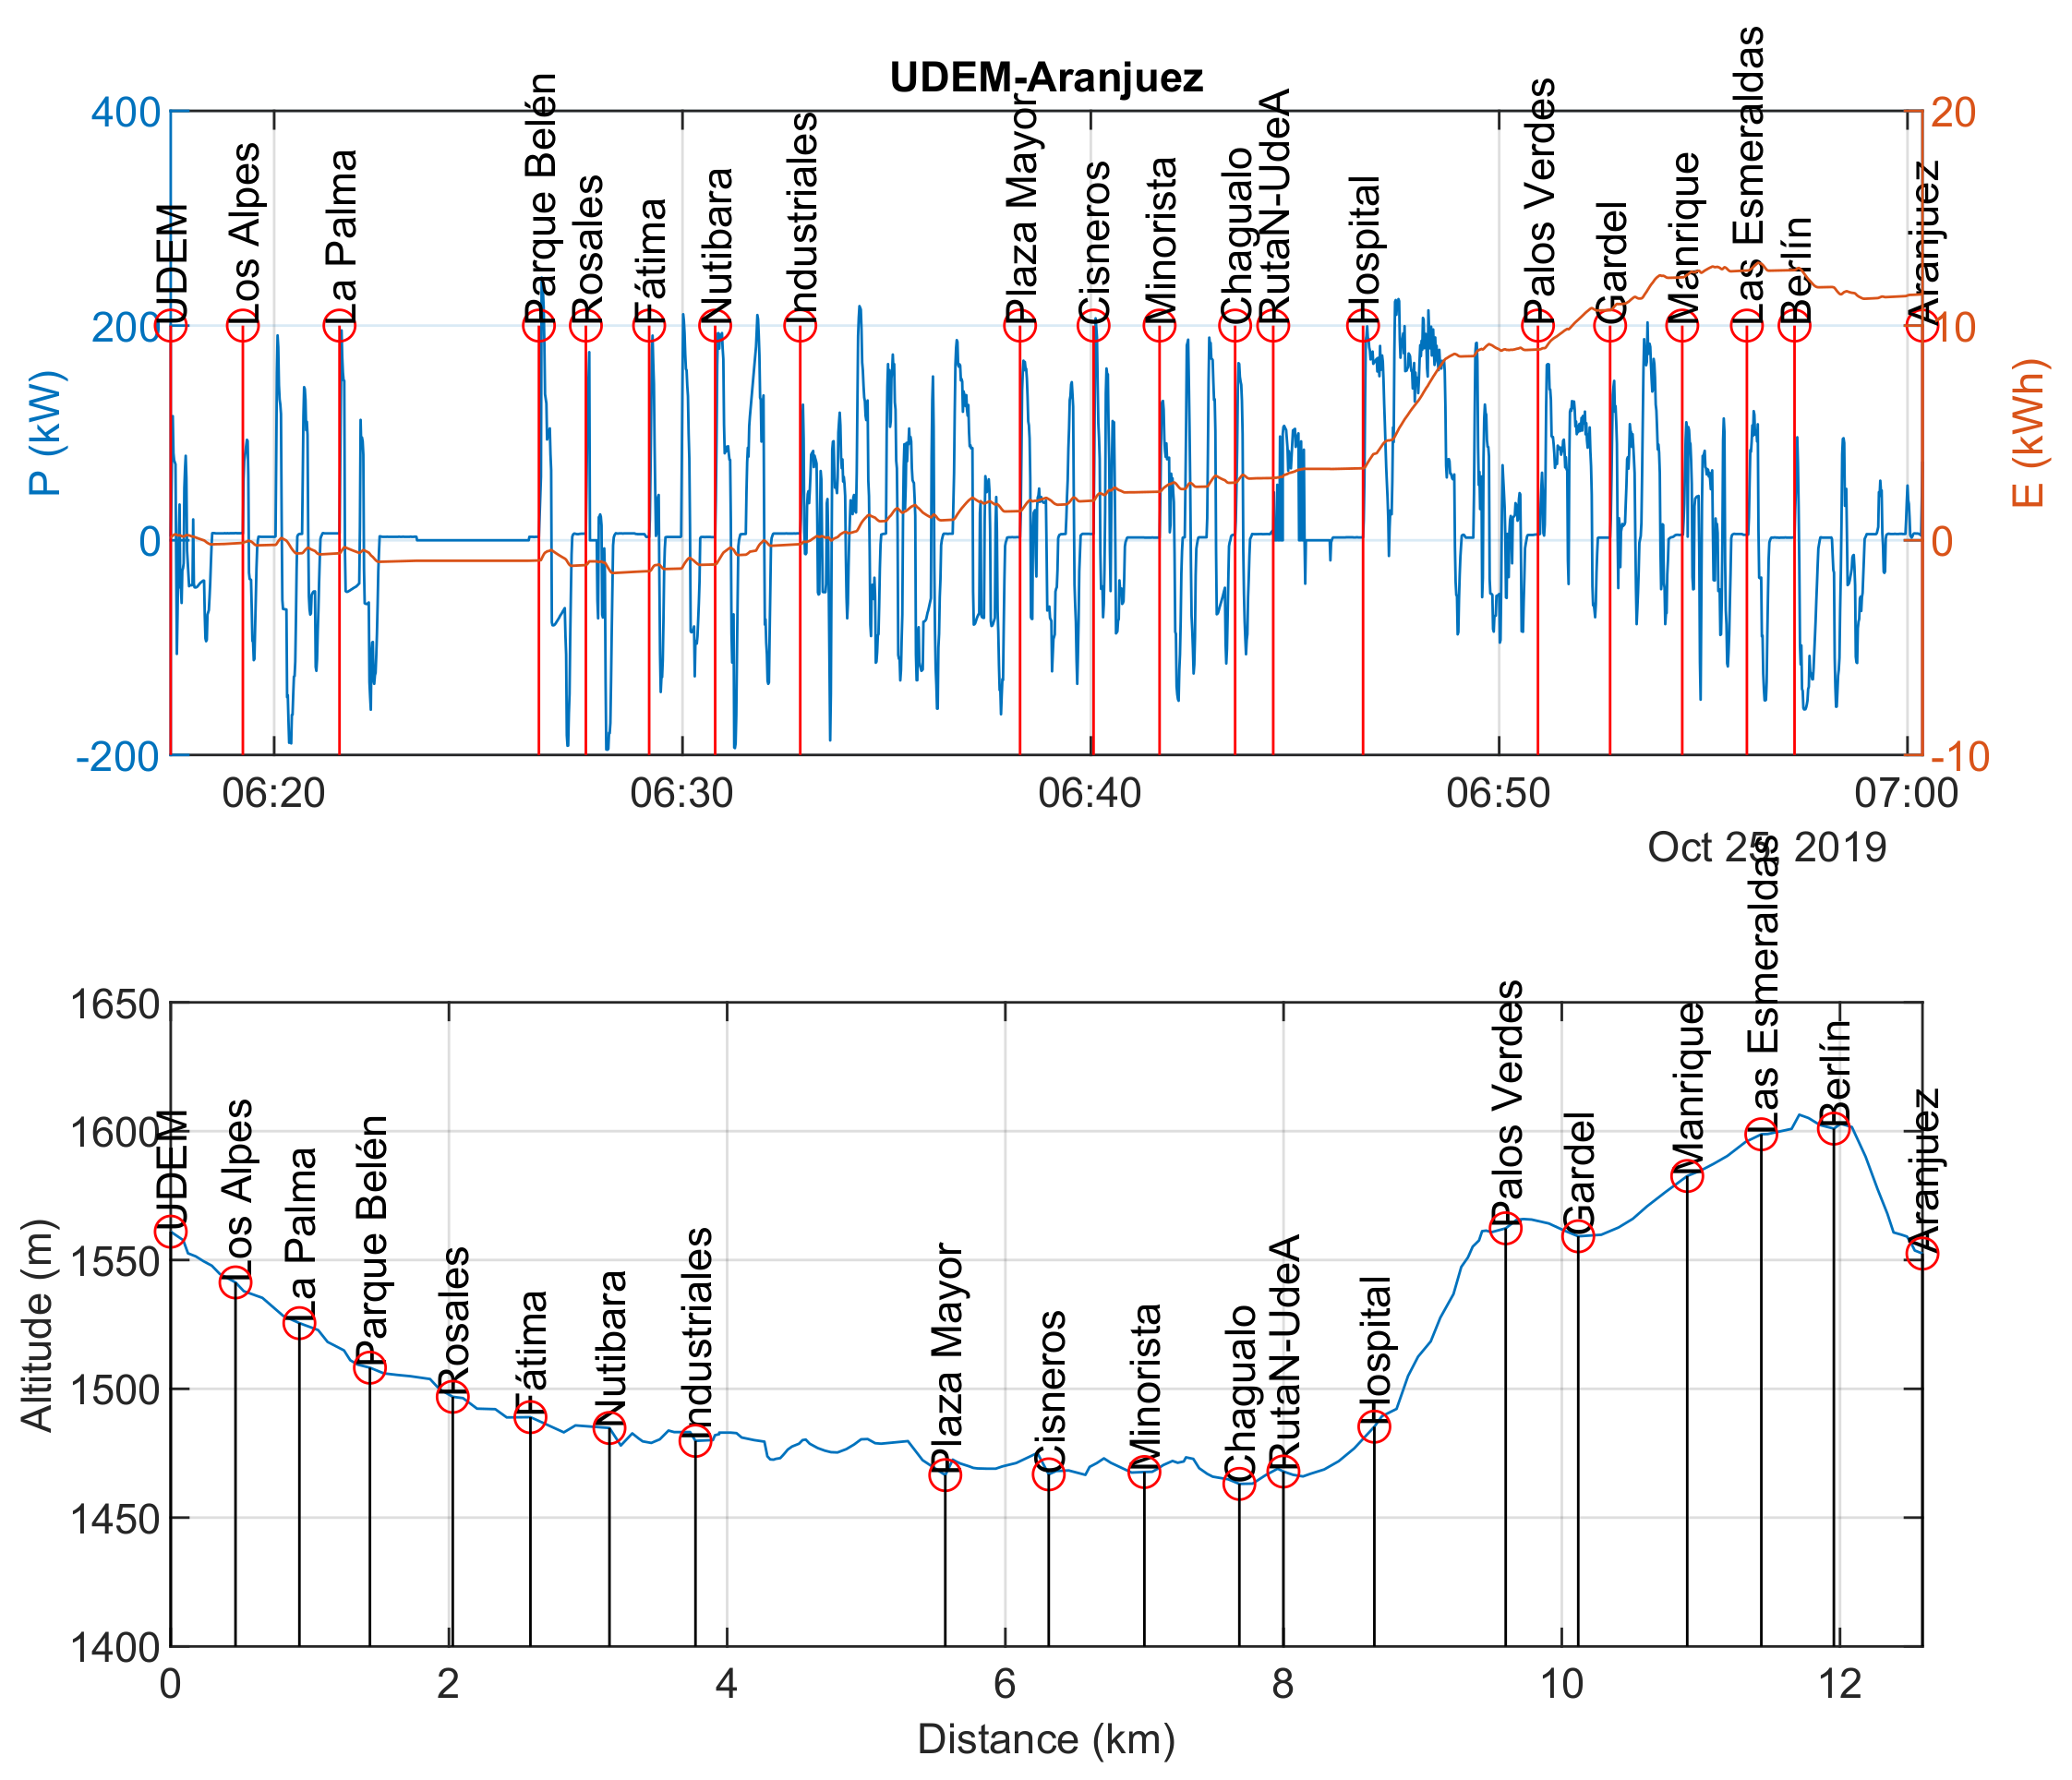
  • Bus energy constraints: the following equations describe the energy consumption or storage for each bus. The energy demand D for each bus can be determined through measurements, as in this paper, or transport simulations using vehicle dynamic models and route data (e.g., [13]):
    E l , b , s E l , b , s 1 D s 1 , s ( 1 x s 1 , s ) + η I M C P I M C Δ t s 1 , s x s 1 , s , l = 1 , , N L ; b = 1 , , N B ; s = 1 , , N S
    E l , b , s E l , b , s 1 D s 1 , s , l = 1 , , N L ; b = 1 , , N B ; s = 1 , , N S
    E l + 1 , b , s 1 = E l , b , s 2 , l = 1 , , N L ; b = 1 , , N B ; s 1 = 1 ; s 2 = N S
  • Battery state-of-charge (SoC) constraints: the following equations determine the initial State-of-charge (SoC) and constraint the energy consumption and storage to the minimum and maximum SoC, according to battery’s capacity:
    E l , b , s = S o C i n i B b , l = 1 , , N L ; b = 1 , , N B ; s = 1
    S o C m i n B b E l , b , s , l = 1 , , N L ; b = 1 , , N B ; s = 1 , , N S
    E l , b , s S o C m a x B b , l = 1 , , N L ; b = 1 , , N B ; s = 1 , , N S
  • Depot Charging Power: The following constraint computes the total required power to charge the bus fleet at the end of the operation day to guarantee a high SoC level at the beginning of next day:
    P d e p = b = 1 N B S o C i n i B b E l , b , s T d e p η d e p , l = N L ; b = 1 , , N B ; s = N S

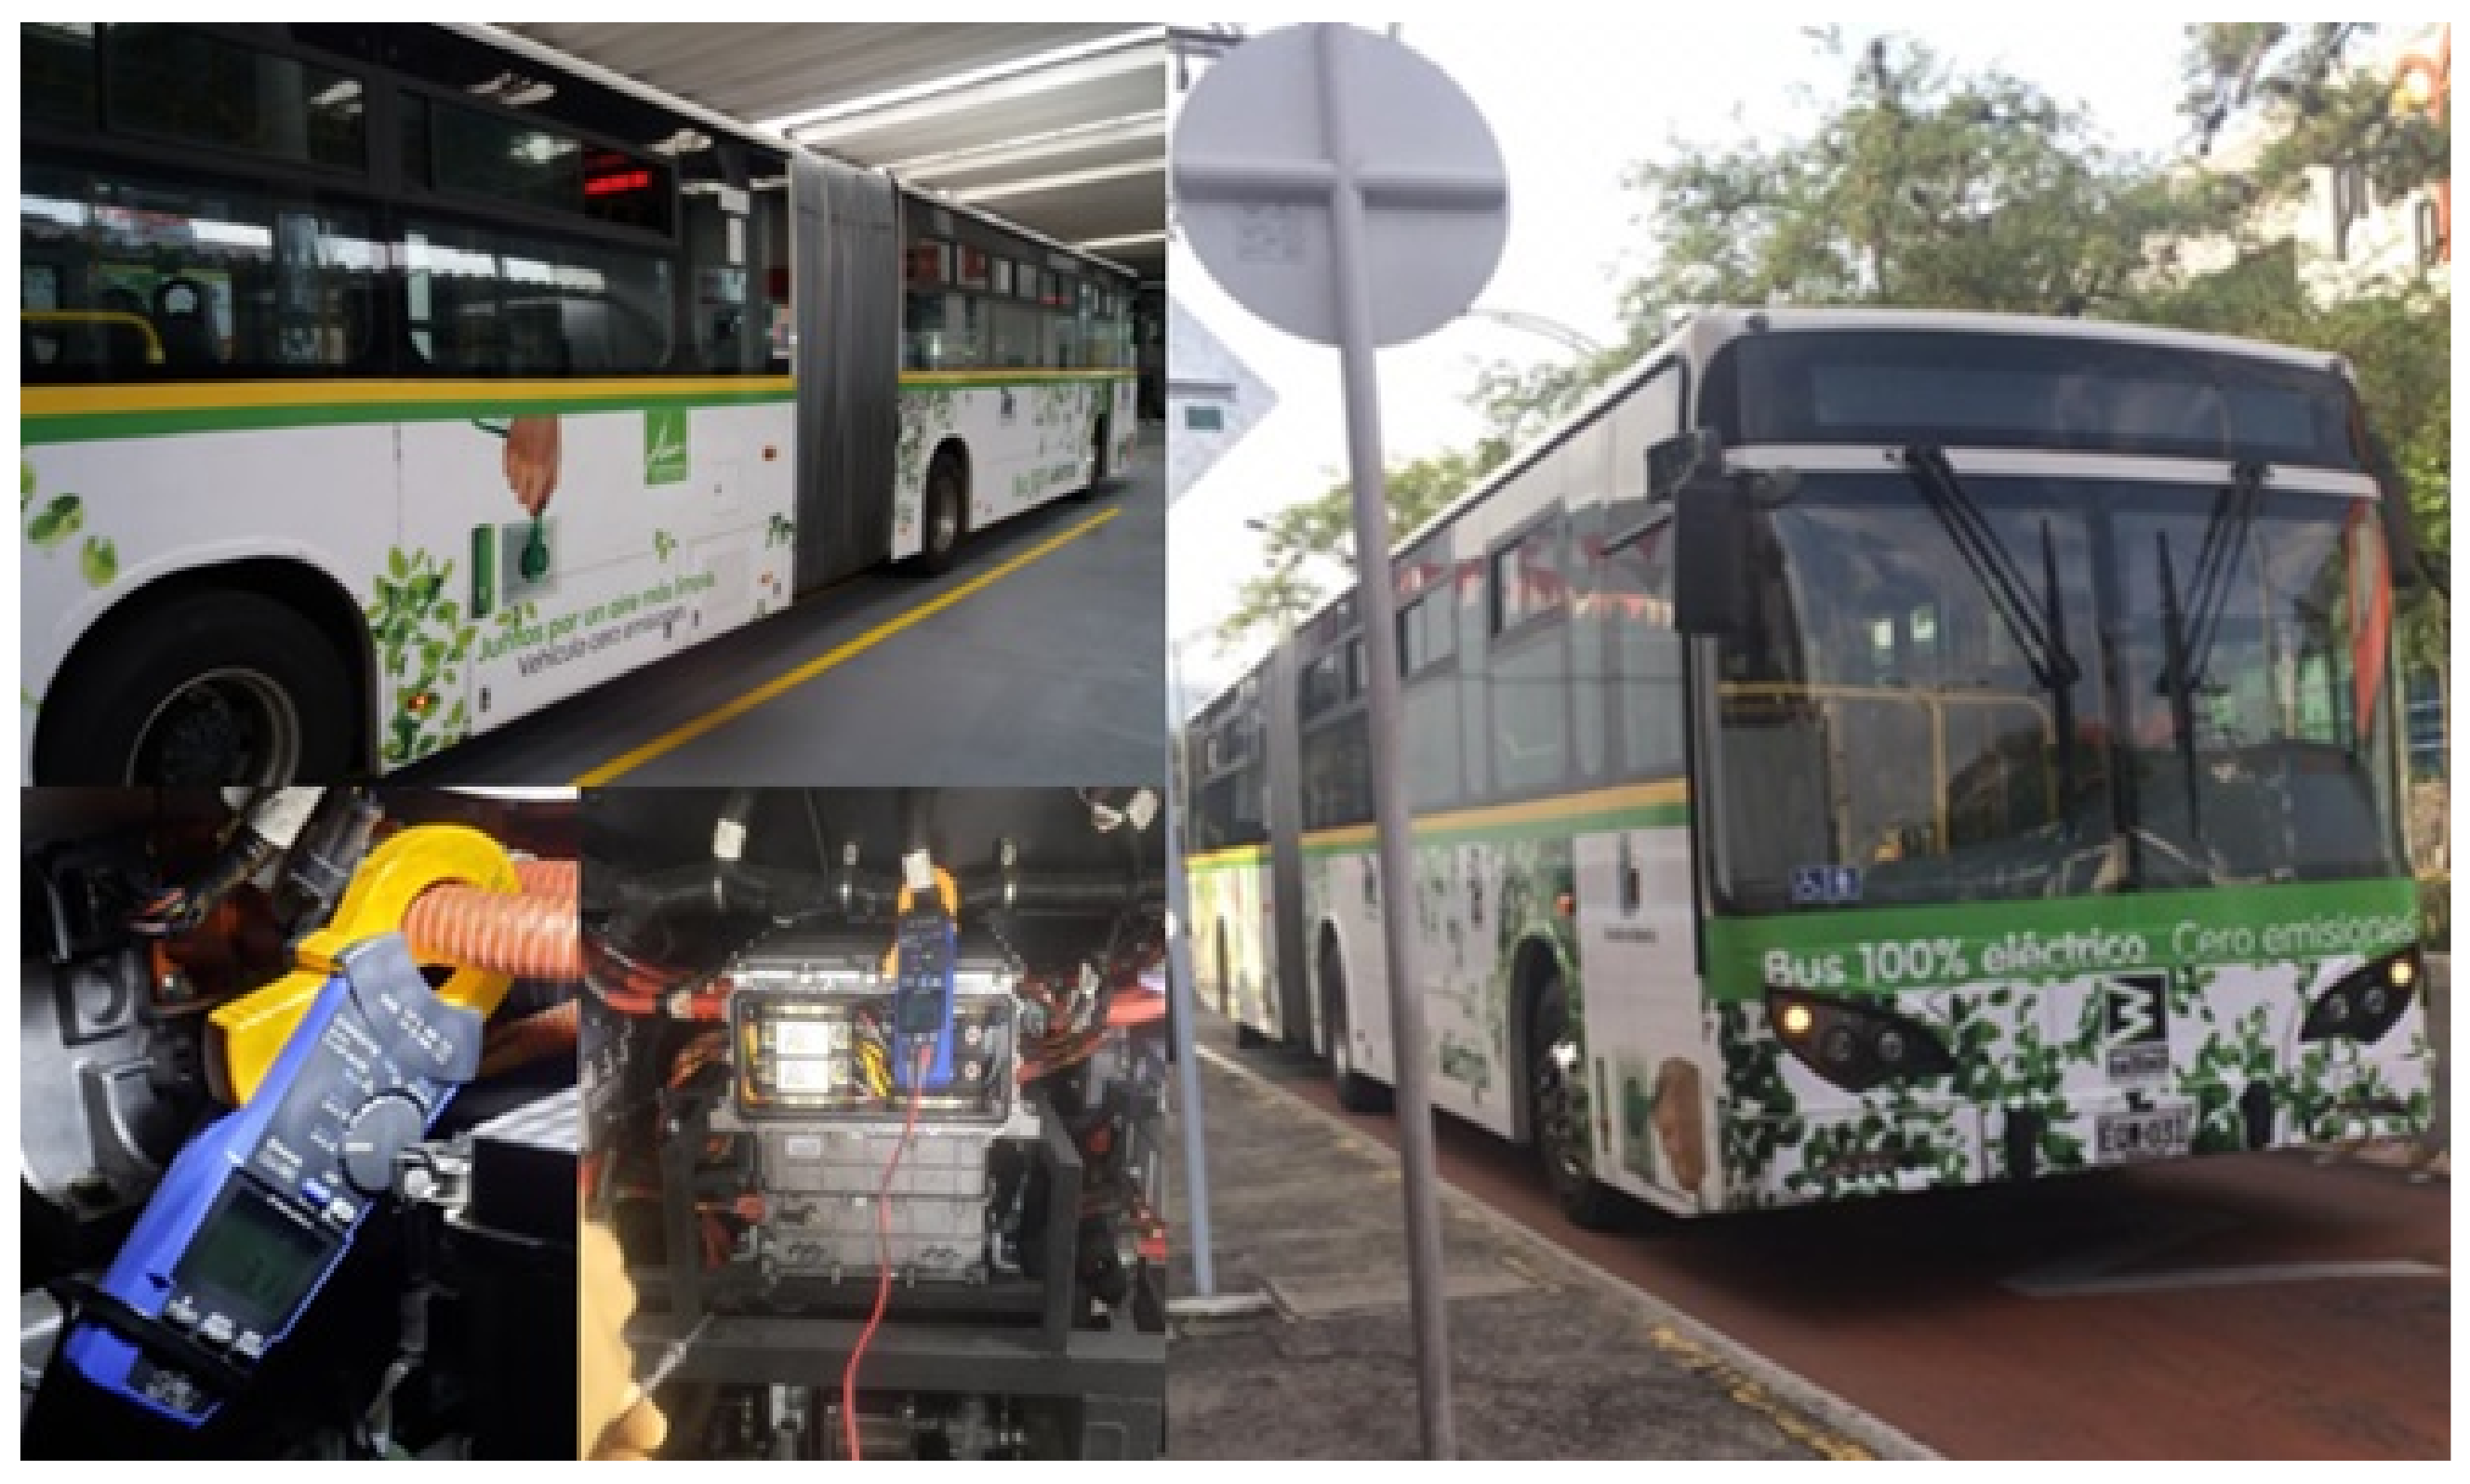
5. Study Case: Medellin’s Metro Bus Line 1

The optimization model explained in the previous section was used to study the electrification with IMC technology of the Metroplus Line 1 in Medellin, Colombia. This BRT line has 20 stations and covers 13.5 km from the west part to the east part of the city, as depicted in Figure 5. Currently, it operates with 23 articulated CNG buses, 10 single-decker CNG buses, 1 articulated BEB, and five single-decker BEB [38]. The latter was used as the bus model for all the analyses that were developed in this and the coming section, with the general parameters listed in Table 2.
As the majority of the BEB in the Chinese and Latin-American bus markets, the battery technology of the aforementioned articulated bus is LFP. Thus, the information of the battery and the charger for this bus is presented in Table 3. The articulated BEB started commercial operation on 23 April 2018, and by the beginning of the lock downs caused by the Covid-19 pandemic in March 2020, the recorded traveled distance was 147,135 km. On that date, the BEB had consumed 190,870 kWh for an average consumption of 1.38 kWh/km and an average daily operational distance of 225 km, which will be considered as the regular operational distance for this system. As the occupancy in this transit system was limited to 30% during the Covid-19 lockdown, the BEB energy consumption reduced to an average of 1.29 kWh/km, and the total traveled distance reached 168,820 km on 25 June 2020.
Some detailed measurements were carried out on 23 October 2019, on the aforementioned BEB, as seen in Figure 6. This vehicle had to be instrumented because the prototype did not have an on-board recording system. The measurements were performed on weekdays in actual operation. As measurements were performed on the DC bus, between the battery and the motor controller, energy data was scaled by a factor of 0.9, which takes into account charging and battery losses. After this correction, energy measurements were coherent with average daily energy consumption recordings, which were done before the charger. Additionally, several performance variables such as battery voltage, battery current, motor power and energy, bus speed, and position were recorded for two full bus trips between the terminal stations Aranjuez and Universidad de Medellin.
Figure 7 presents the recordings for power and energy for the trip from Universidad de Medellin to Aranjuez, and Figure 8 depicts the same results for the return trip from Aranjuez to Universidad de Medellin. As can be seen in both Figure 7 and Figure 8, this BRT line had an interesting topography crossing the Aburrá Valley east-west, with two extreme stations at about 1550 m above the sea level. It was observed that the maximum altitude difference in this line was equal to 138 m from Chagualo station (1463 m) to Berlin station (1601 m). For this test, the energy consumption of the articulated battery bus from Universidad de Medellin to Aranjuez is 15.19 kWh or 1.13 kWh/km, and from Aranjuez to Universidad de Medellin the consumption was equal to 11.48 kWh or 0.85 kWh/km. The difference between these two results might be explained by unexpected stops (e.g., traffic lights), a higher number of users (more weight), and higher power demand to climb in some line segments from Aranjuez to Universidad de Medellin. It was also noted that the regenerative braking performed better when the bus was in the direction where descending was smoother. Of particular relevance for energy consumption and regeneration was the route segment between Hospital and Palos Verdes stations, which corresponded to a climb of 77 m in a distance of 914 m, with a maximum slope of 16%. Accordingly, the bus reached 224.7 kW of peak power and consumed 5.53 kWh in this segment, being the most demanding portion in the entire route. However, when the bus went along this segment in the opposite direction, it regenerated 1.68 kWh, which corresponded to the maximum regenerated energy on a segment in this route.
Figure 9 and Figure 10 depict the power curves for Metroplus line 1 in both directions. From Universidad de Medellin to Aranjuez, the maximum power demand is seen in the segment Parque Belén-Rosales, which was equal to 244 kW, and the maximum regeneration was seen in the segment Rosales-Fátima, which went up to 195.1 kW. On the opposite direction, the maximum power demand was seen between Minorista and Cisneros, where the bus reached a maximum power of 228.3 kW, and the maximum regeneration was found between Cisneros and Plaza Mayor, where the bus reached 174.9 kW. From these results it could be seen that this bus, unlike many other electric vehicles, had a symmetrical converter that was able to process the same power either for traction or regeneration. This was possible thanks to the high capacity and chemistry of this bus battery, as already discussed in Section 5.
Finally, it should be recalled some important remarks related to the battery sizing and typical operation of the articulated BEB under study, which highlight the opportunities for conductive IMC. Considering an average consumption of 1.5 kWh/km and a daily operational range of 240 km for this route, a 450 kWh battery should be used if only depot charging is considered. This value assumes a 20% of energy margin, which takes into account a minimum SoC of 10%, and 10% of capacity loss because of battery degradation. In terms of power consumption, the rated power of the bus motors is 360 kW (2 × 180 kW), which is equivalent to 0.8 C. The 1-s peak power required in the route is approximately 250 kW, so that the maximum discharge rate needed to operate is only 0.66 C. This is a good consequence of the battery over-sizing, which could be reflected in a longer lifespan. On the other hand, the recommended 0.5 C charging rate for the LFP battery of this vehicle implies that the bus should remain stopped for at least 3 h each 240 km, if the battery State-of-health (SoH) is 100%. Otherwise, the charging time will be shorter but the bus range will be lower. Additionally, this battery sizing approach has some troubling oversimplifications:
  • An average daily range of 240 km is low for most of intensive BRT schemes, being 300 km or higher the most common requirement.
  • Average energy consumption of 1.5 kWh/km does not include air conditioning, which is increasingly reclaimed by the public and would be needed more as average temperature increases due to climate change. Additionally, heating is a sensible bus feature in extreme weather countries, and increases the energy consumption of the bus, reducing operational range.
  • In many cities as Medellin, where events like pollution emergencies occur, the bus fleet is required to operate at maximum capacity, it becomes difficult to stop a bus for battery charging, and almost all day the operation schedule behaves like peak period.
  • Despite many manufacturers define a ratio of buses to chargers of 4, this criteria has proven to be unrealistic when intensive use of the fleet is required.

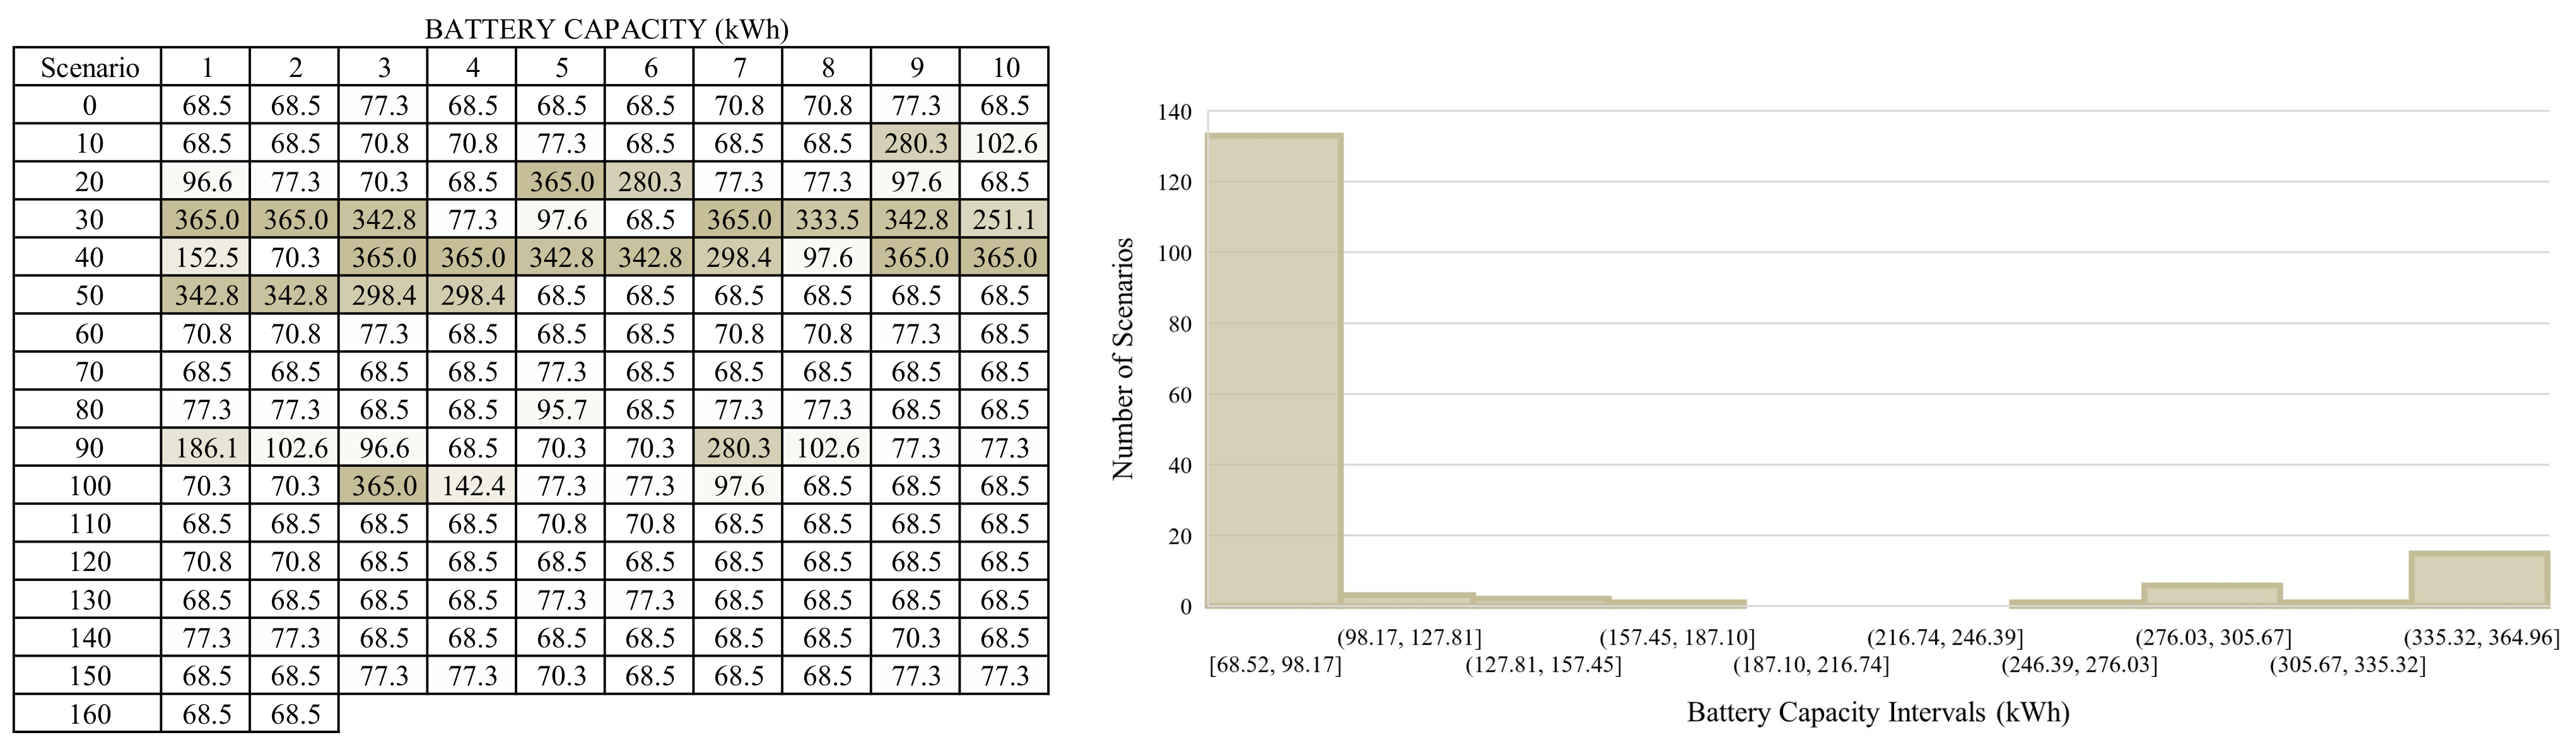
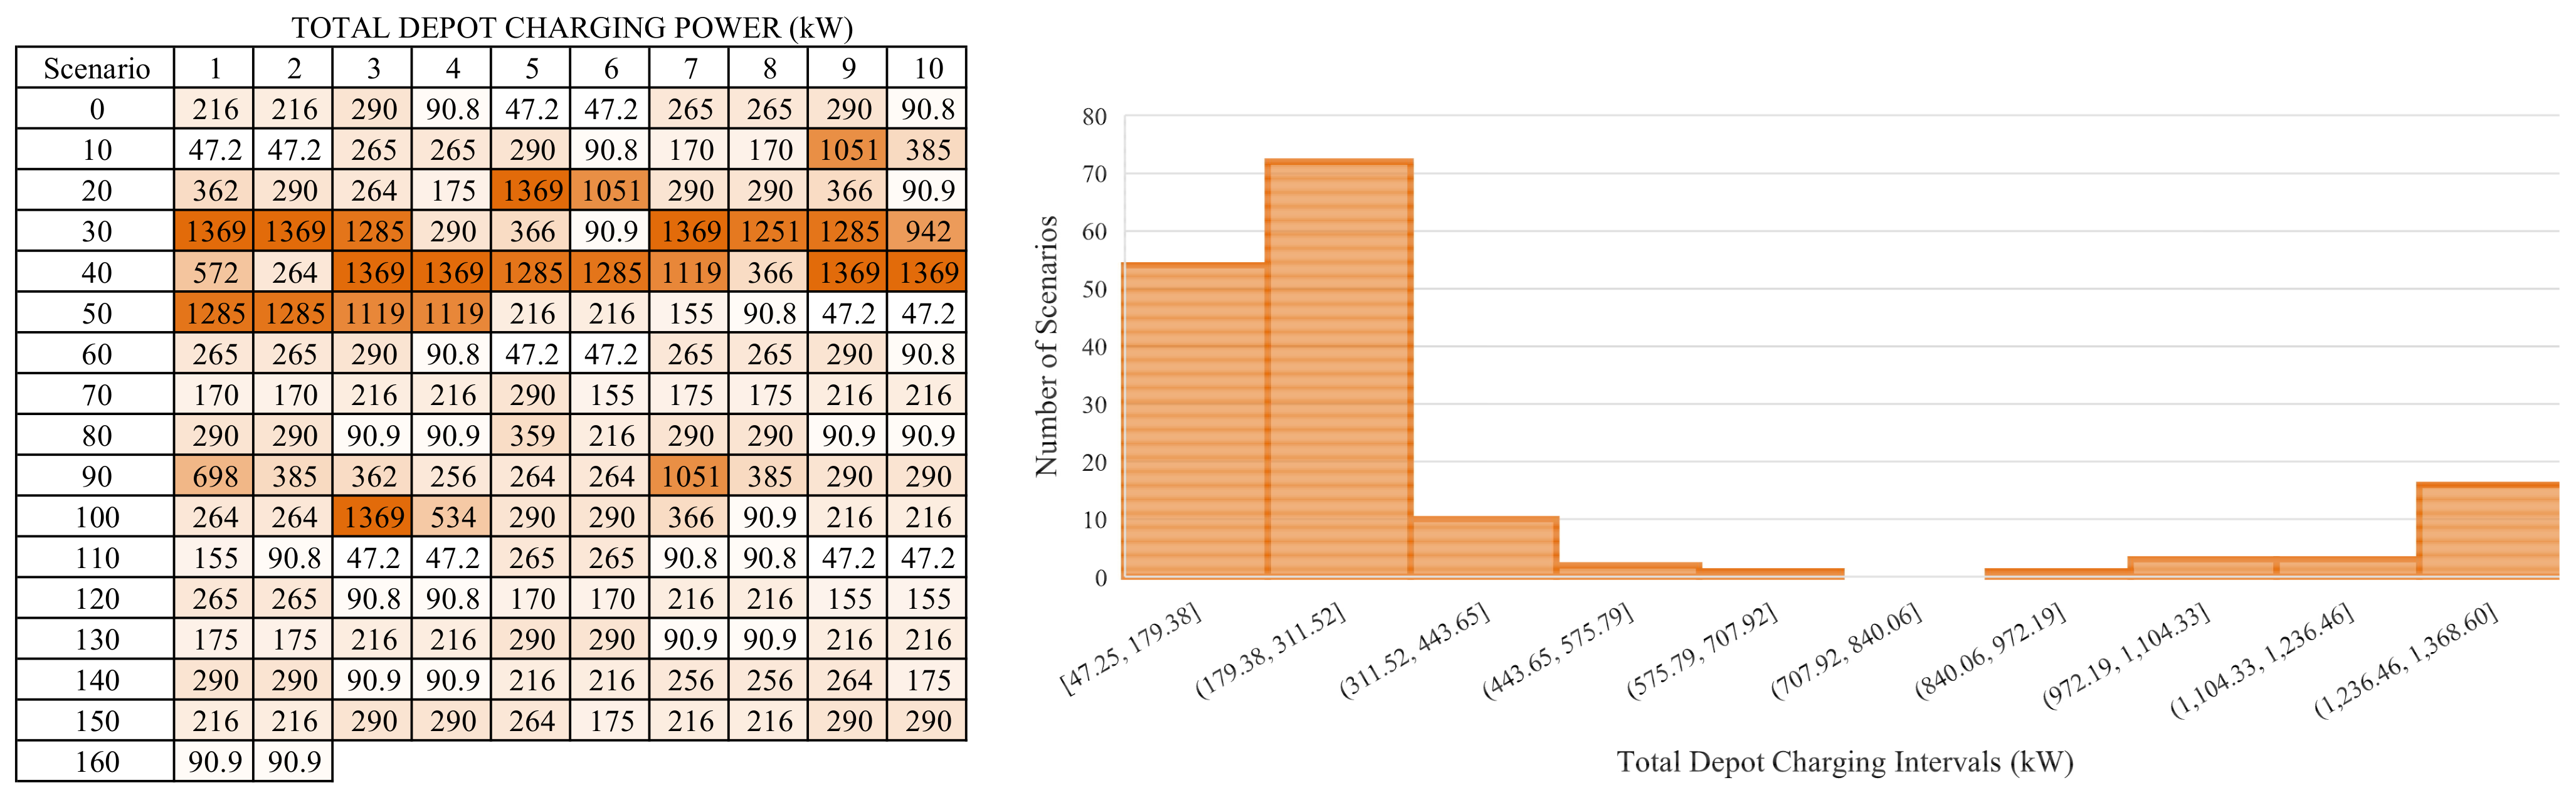
6. Results and Discussion

The planning model described in Section 4 was implemented in Python language, using the package Pyomo [39] for optimization problem modeling, and the solver CPLEX [40] provided in the NEOS server [41,42,43]. In order to test the performance of the proposed optimization model in the Medellin’s Metroplus Bus line 1, 162 scenarios were analyzed, combining different values for the cost parameters of the overhead line, the traction substation, the battery and the depot charger, as well as the battery charging power from the overhead lines. These 162 scenarios are summarized in Table 4. In these scenarios, the overhead line cost varies from 200 kUSD/km to 600 kUSD/km, the traction substation cost ranges from 100 kUSD to 300 kUSD, the battery cost goes from 100 USD/kWh to 300 USD/kWh, the depot charger cost alternates between 500 USD/kW and 700 USD/kW, and the overhead charging power changes from 20 to 50 kW. The creation of these scenarios is based on a simple combinatorial rule that takes the extreme and some intermediate values within the ranges of the aforementioned parameters, as can be seen in Table 4. In general, these values are consistent to those given in [14], in which the installation cost per unit of charging power is assumed to be 444 USD/kW, and the construction cost for building one kilometer of wireless charging lane is assumed to be about 200 kUSD/km, while this is for wireless charging, it is a good reference value for comparison. These scenarios are intended to take into account the effect of variable costs that rely on local parameters, such as labor costs. Additionally, for the purpose of this study, Universidad de Medellin-Aranjuez and Aranjuez-Universidad de Medellin routes were merged into a single line, being Aranjuez station the mid point of this circuit, and a total of 11 bus trips were assumed to cover around 250 km during a day. These and the remaining parameters of the proposed planning model are shown in Table 5.
The objective function values that represented the minimum total cost for each scenario are summarized in Figure 11. The average objective function value was 2.52 MUSD, the minimum value was equal to 1.15 MUSD, corresponding to scenario 5, and the maximum value was equal to 4.48 MUSD in scenario 158. Additionally, the assigned bus battery capacity in each scenario is presented in Figure 12. The minimum, maximum and average values for the battery were 68.5 kWh, 364.95 kWh, and 111.32 kWh. As seen in the histogram, 133 scenarios or 82% of the total runs were assigned a battery capacity between 68.52 kWh and 98.17 kWh, which is a capacity similar to what is found in actual IMC projects, as in in Gyidina and Eberswalde (both with 100 kWh) [44]. The remaining 18% of the cases were assigned batteries from 98.17 kWh to 364.95 kWh, which in most instances were associated with high catenary cost (more than 400 kUSD/km) so that electrification was only carried out in a very small portion of the route.
Figure 13 depicts the length of the electrified segments. The minimum, maximum and average lengths of electrified segments were 1.47 km, 5.4 km, and 3.74 km, or 5.4%, 20%, and 13.85% of the total route length, respectively. Moreover, the calculated depot charging power for each scenario is shown in Figure 14. The minimum, maximum and average depot charging power were 47.2 kW, 1369 kW and 361.62 kW. It is important to mention that the highest depot charging power capacities were associated with the largest batteries, as these required more energy from the system to reach a high SoC at the beginning of the day.
Figure 15 presents the location of the electrified segments for all scenarios, which are highlighted in light gray. It can be seen that the segment between Hospital and Gardel stations was electrified in almost all scenarios, as expected, as this was the most demanding part with the highest average slope, as already discussed in Section 5. Moreover, the segments between Fatima and Universidad de Medellin stations also showed a high percentage of electrification, which is due to the high average slope that was perceived in this portion of the route, as depicted in Figure 8. The topology of the resulting electric infrastructure was similar to the one described in [16] as “decentralized overhead line power supply”.
In the minimum cost scenario, i.e., scenario 5, the battery was charged at 50 kW and decision variables presented the following values: the battery was assigned a capacity of 68.5 kWh, two segments were electrified with two traction substations and 3.59 km of overhead line (13.3% of total route length), and the depot charging power was given a value of 47.2 kW. This scenario corresponded to the lowest costs of catenary, substation, battery, and depot charger, and the highest charging power from the catenary (50 kW). However, the decision variables presented similar results in scenarios 6, 11, 12, 59, 60, 65, 66, 113, 114, 119, and 120, in which some cost parameters were increased, but the charging power was always kept at the maximum limit of 50 kW.
In summary, from the previous results, IMC BEB should be one of the first options to consider into an ambitious bus sector electrification, especially for BRT and routes that were supposed for modal shift towards buses. The reduction of 200 kWh per battery bus in the Medellin’s bus line 1 would represent almost 2 tons of less weight to be moved on a distance of 250 km per day. Considering a fleet of 50 buses and 75,000 km/bus-year, the energy to move 7.5 M tons-km would be saved. Moreover, gradients had an important impact on increasing the energy consumption of vehicles, as demonstrated in the aforementioned case study, where in a segment whose length was about 11% of the total route distance, the bus needed 33% of the total energy consumption. This section presented a 16% grade, where the average consumption went from 1.34 kWh/km to almost 3 kWh/km. On the other hand, the average energy consumption of the articulated bus in this route, i.e., 1.38 kWh/km, was low compared to the values reported in the literature (e.g., [15,18,22,25]); however, this is explained by the fact that the bus in Medellin used neither air conditioning nor heating, and the segregated operation reduced the number of start/stop actions and other traffic events that had great effect on energy consumption. Critical weather conditions and traffic restriction in shared corridors may have a critical impact in the energy consumption of the bus, and the presence of electrified segments could be the best technical-economical approach for a profitable bus electric operation.
It is important to note that the maximum electrified length (20%) resulting from the proposed optimization model was similar to the percentage predicted in [15] for future IMC projects, but with much lower charging power; this is explained by the lower energy consumption in this particular case, a larger on-board battery, and the optimal placement of the overhead line sections. In this work, the cost of the overhead line was assumed to be the same along the route, which could be accurate since it would be built over BRT infrastructure; however, it is usual that the electrification of some segments is more expensive, specially for mixed-traffic or partially segregated bus lanes. The over-costs in catenary installation could be related to the geometry of the way, prominent curves, and the presence of other infrastructure and/or trees; moreover, location of traction substation could be influenced by MV network constraints. These higher electrification costs could be easily added to the model as constraints for better results.
Even though the study case considered a fleet of only 30 buses, the electrification planning method is convenient for gradually adapting the infrastructure to increasing bus energy consumption, in case of ridership growth, by extending electrified sections and/or adding new traction substations, if necessary. The latter represents an important financial and risk mitigation advantage for electrification projects, avoiding the deployment of full-length catenary coverage from the beginning and, at the same time, reducing the technological dependence on the batteries. After these results, it is confirmed the call at the end of [30] for reliable scientific studies to refute the myths unfavorable for trolleybuses, and to help making more realistic plans of urban electrification, specially when intensive bus lanes are prone to be electrified with much lower capital costs using alternatives such as IMC.

7. Conclusions

This paper presented a planning method for conductive IMC in BRT systems for BEB, that considers the battery sizing, the location of electrification segments, and the required overnight depot charging infrastructure. The algorithm was coded in Python and was tested on an actual BRT route in Medellin, Colombia, for different costs and operational scenarios, using energy and power measurements on an articulated BEB that has been operating in this route since 2018. In general terms the algorithm showed a very good performance in allocating the electrification segments for IMC and sizing the on-board batteries for the BEB. The proposed method constitutes an excellent tool for BEB system planners and designers to support decision making around the adequate bus technology to be applied in intensive bus lines, and could also be utilized in the basic design of railway electrification that involves electric trains with battery backup. Future work includes the study of power quality phenomena and other distribution network constraints in the IMC planning model.

Author Contributions

Conceptualization, A.E.D. and M.R.; methodology, A.E.D. and M.R.; software, M.R.; validation, A.E.D. and M.R.; formal analysis, A.E.D. and M.R.; investigation, A.E.D. and M.R.; resources, A.E.D.; data curation, A.E.D.; writing—original draft preparation, A.E.D.; writing—review and editing, M.R.; visualization, M.R.; supervision, A.E.D.; project administration, A.E.D. All authors have read and agreed to the published version of the manuscript.

Funding

This research received no external funding.

Institutional Review Board Statement

Not applicable.

Informed Consent Statement

Not applicable.

Data Availability Statement

Not applicable.

Acknowledgments

The Author Andrés Emiro Díez performed this work in the framework of the “ENERGETICA 2030” Research Program, with code 58667 in the “Colombia Científica” initiative, funded by The World Bank through the call “778-2017 Scientific Ecosystems”, managed by the Colombian Ministry of Science, Technology and Innovation (Minciencias), with contract No. FP44842-210-2018.

Conflicts of Interest

The authors declare no conflict of interest.

Abbreviations

bBus index
lTrip index
sStation index
Δ t Total travel time per segment (h)
η d e p Depot charging efficiency (p.u.)
η I M C Efficiency of in-motion charging (p.u.)
C b a t Unitary cost of battery (USD/kWh)
C c a t Unitary cost of overhead line (USD/km)
C d e p Unitary cost of depot charger (USD/kW)
C s u b Unitary cost of feeding substation (USD)
DBus energy consumption (kWh)
LLength of route segment between passenger stations (km)
NBTotal number of buses
NLTotal number of bus trips
NsTotal number of stations
P I M C In-motion charging power (kW)
S o C i n i Initial battery state-of-charge (p.u.)
S o C m a x Maximum battery state-of-charge (p.u.)
S o C m i n Minimum battery state-of-charge (p.u.)
T d e p Depot charging time (h)
B b Battery capacity of bus b (kWh)
ETotal bus energy (kWh)
xBinary variable for installing overhead line between stations (1 = Install, 0 = Do not install)
yBinary variable for installing traction substation in a passenger station (1 = Install, 0 = Do not install)
Acronyms
BEBBattery Electric Bus
BRTBus Rapid Transit
CNGCompressed Natural Gas
EVElectric Vehicle
GCSGrid-connected System
IEAInternational Energy Agency
IMCIn-motion Charging
LFPLithium Ferrophosphate
Li-ionLithium-ion
LTOLithium-titanate
NMCNickel-Managanese-Cobalt
MVMedium Voltage
NPVNet Present Value
OCOpportunity Charging
SoCState-of-charge
SoHState-of-health
TSTraction Substation

References

  1. Gilbert, R.; Perl, A. Grid-connected vehicles as the core of future land-based transport systems. Energy Policy 2007, 35, 3053–3060. [Google Scholar] [CrossRef]
  2. International Energy Agency. The Future of Rail. 2019. Available online: https://www.iea.org/reports/the-future-of-rail (accessed on 15 January 2021).
  3. International Energy Agency. Global EV Outlook 2019. 2019. Available online: https://www.iea.org/reports/global-ev-outlook-2019 (accessed on 15 January 2021).
  4. Vilppo, O.; Markkula, J. Feasibility of electric buses in public transport. World Electr. Veh. J. 2015, 7, 357–365. [Google Scholar] [CrossRef] [Green Version]
  5. Jahic, A.; Eskander, M.; Schulz, D. Charging schedule for load peak minimization on large-scale electric bus depots. Appl. Sci. 2019, 9, 1748. [Google Scholar] [CrossRef] [Green Version]
  6. Raab, A.F.; Lauth, E.; Strunz, K.; Göhlich, D. Implementation schemes for electric bus fleets at depots with optimized energy procurements in virtual power plant operations. World Electr. Veh. J. 2019, 10, 5. [Google Scholar] [CrossRef] [Green Version]
  7. Fisher, T.M.; Farley, K.B.; Gao, Y.; Bai, H.; Tse, Z.T.H. Electric vehicle wireless charging technology: A state-of-the-art review of magnetic coupling systems. Wirel. Power Transf. 2014, 1, 87–96. [Google Scholar] [CrossRef]
  8. Randhahn, A.; Knote, T. Deployment of Charging Infrastructure for Battery Electric Buses. In Towards User-Centric Transport in Europe 2; Springer: Berlin, Germany, 2020; pp. 169–183. [Google Scholar]
  9. Kahlen, M.T.; Ketter, W.; van Dalen, J. Electric vehicle virtual power plant dilemma: Grid balancing versus customer mobility. Prod. Oper. Manag. 2018, 27, 2054–2070. [Google Scholar] [CrossRef]
  10. Lajunen, A. Lifecycle costs and charging requirements of electric buses with different charging methods. J. Clean. Prod. 2018, 172, 56–67. [Google Scholar] [CrossRef]
  11. El-Taweel, N.A.; Farag, H.E.; Mohamed, M. Integrated Utility-Transit Model for Optimal Configuration of Battery Electric Bus Systems. IEEE Syst. J. 2019, 14, 738–748. [Google Scholar] [CrossRef]
  12. Ruiz, S.; Arroyo, N.; Acosta, A.; Portilla, C.; Espinosa, J. An optimal battery charging and schedule control strategy for electric bus rapid transit. In Proceedings of the MOVICI-MOYCOT 2018: Joint Conference for Urban Mobility in the Smart City, Medellin, Colombia, 18–20 April 2018; pp. 1–5. [Google Scholar]
  13. Liu, Z.; Song, Z. Robust planning of dynamic wireless charging infrastructure for battery electric buses. Transp. Res. C Emerg. Technol. 2017, 83, 77–103. [Google Scholar] [CrossRef]
  14. Chen, Z.; Yin, Y.; Song, Z. A cost-competitiveness analysis of charging infrastructure for electric bus operations. Transp. Res. C Emerg. Technol. 2018, 93, 351–366. [Google Scholar] [CrossRef]
  15. Bartłomiejczyk, M.; Połom, M. Dynamic charging of electric buses as a way to reduce investment risks of urban transport system electrification. In Proceedings of the International Conference TRANSBALTICA, Vilnius, Lithuania, 2–3 May 2019; Springer: Berlin, Germany, 2019; pp. 297–308. [Google Scholar]
  16. Bartłomiejczyk, M.; Połom, M. The impact of the overhead line’s power supply system spatial differentiation on the energy consumption of trolleybus transport: Planning and economic aspects. Transport 2017, 32, 1–12. [Google Scholar] [CrossRef] [Green Version]
  17. Alfieri, L.; Bracale, A.; Caramia, P.; Iannuzzi, D.; Pagano, M. Optimal battery sizing procedure for hybrid trolley-bus: A real case study. Electr. Power Syst. Res. 2019, 175, 105930. [Google Scholar] [CrossRef]
  18. Abdelwahed, A.; van den Berg, P.; Brandt, T.; Collins, J.; Ketter, W. Evaluating and Optimizing Opportunity Fast-Charging Schedules in Transit Battery Electric Bus Networks. Transp. Sci. 2020, 54, 1601–1615. [Google Scholar] [CrossRef]
  19. Göhlich, D.; Fay, T.A.; Jefferies, D.; Lauth, E.; Kunith, A.; Zhang, X. Design of urban electric bus systems. Des. Sci. 2018, 4, e15. [Google Scholar] [CrossRef] [Green Version]
  20. Asociación Española de Normalización (UNE). Spanish Standard UNE-EN 50328:2004, Railway Applications—Fixed Installations—Electronic Power Converters for Substations; Asociación Española de Normalización: Madrid, Spain, 2007. [Google Scholar]
  21. Brunton, L. The trolleybus story. IEE Rev. 1992, 38, 57–61. [Google Scholar] [CrossRef]
  22. Wołek, M.; Wolański, M.; Bartłomiejczyk, M.; Wyszomirski, O.; Grzelec, K.; Hebel, K. Ensuring sustainable development of urban public transport: A case study of the trolleybus system in Gdynia and Sopot (Poland). J. Clean. Prod. 2020, 279, 123807. [Google Scholar] [CrossRef]
  23. Sun, F.; Liu, B.; Wang, Z. Analysis of energy consumption characteristics of dual-source trolleybus. In Proceedings of the 2014 IEEE Conference and Expo Transportation Electrification Asia-Pacific (ITEC Asia-Pacific), Beijing, China, 31 August–3 September 2014; pp. 1–5. [Google Scholar]
  24. Bartłomiejczyk, M. Dynamic charging of electrical vehicles. Adv. Mech. Eng. Transp. 2018, 2, 5–10. [Google Scholar]
  25. Zhang, L.; Yang, Y.; Sun, M.; Liu, H. Energy management strategy based on dynamic programming for dual source trolleybus. Teh. Vjesn. Tech. Gaz. 2017, 24, 1439–1447. [Google Scholar]
  26. López, R. El Corredor de Trolebuses de Quito. Carreteras, Revista Técnica de la Asociación Española de Carreteras 2003, 133, 99–115. [Google Scholar]
  27. Wright, L. 15 Bus rapid transit: A review of recent advances. In Urban Transport in the Developing World: A Handbook of Policy and Practice; Edward Elgar Publishing: Cheltenham, UK, 2011; p. 421. [Google Scholar]
  28. González, E.G.M.; Romana, M.G.; Álvaro, Ó.M. Effectiveness of reserved bus lanes in Arterials. In Proceedings of the Transportation Research Board 92nd Annual Meeting, Washington, DC, USA, 13–17 January 2013; pp. 1–15. [Google Scholar]
  29. Nair, P.; Kumar, D. Transformation in road transport system in Bogotá: An overview. ICFAI J. Infrastruct. 2005, 3, 20–28. [Google Scholar]
  30. Połom, M. Trends in the development of trolleybus transport in Poland at the end of the second decade of the 21st century. Prace Komisji Geogr. Komun. PTG 2018, 4, 44–59. [Google Scholar] [CrossRef]
  31. Transmilenio, S.A. Informe de Gestión 2019. 2019. Available online: https://www.transmilenio.gov.co/publicaciones/151691/informe-de-gestion-2019/ (accessed on 22 January 2021).
  32. Autoridad Nacional de Licencias Ambientales (ANLA). Certificación 629. 2016. Available online: http://portal.anla.gov.co/sites/default/files/res_cert_0629_10062016.pdf (accessed on 22 January 2021).
  33. Diez, A.E.; Bohórquez, A.; Velandia, E.; Roa, L.F.; Restrepo, M. Modern trolleybuses on bus rapid transit: Key for electrification of public transportation. In Proceedings of the 2010 IEEE ANDESCON, Bogota, Colombia, 15–17 September 2010; pp. 1–7. [Google Scholar]
  34. Castillo-Camacho, M.P.; Tunarrosa-Grisales, I.C.; Chacón-Rivera, L.M.; Guevara-Luna, M.A.; Belalcázar-Cerón, L.C. Personal Exposure to PM2.5 in the Massive Transport System of Bogotá and Medellín, Colombia. Asian J. Atmos. Environ. 2020, 14, 210–224. [Google Scholar] [CrossRef]
  35. Guevara-Luna, F.A.; Guevara-Luna, M.A.; Belalcázar-Cerón, L.C. Passengers Exposure to PM2.5 in Self-polluted BRT-Diesel Operated Transport System Microenvironments. Asian J. Atmos. Environ. 2020, 14, 105–118. [Google Scholar] [CrossRef]
  36. Ríos, A.M.G.; Salas, M.A.D.; Becerra, L.C.B. Evaluación diaria de la exposición personal a PM2.5 en cuatro localidades de la ciudad de Bogotá. In Proceedins of the Congreso Colombiano y Conferencia Internacional de Calidad del Aire y Salud Pública, Barranquilla, Colombia, 14–16 August 2019. [Google Scholar]
  37. Betancur, D.; Duarte, L.F.; Revollo, J.; Restrepo, C.; Díez, A.E.; Isaac, I.A.; López, G.J.; González, J.W. Methodology to Evaluate the Impact of Electric Vehicles on Electrical Networks Using Monte Carlo. Energies 2021, 14, 1300. [Google Scholar] [CrossRef]
  38. Gómez Hernández, L.Y.; Semeshenko, V. Transporte y calidad de vida urbana: Estudio de caso sobre el Metroplús de Medellín, Colombia. Lect. Econ. 2018, 89, 103–131. [Google Scholar] [CrossRef]
  39. Hart, W.E.; Laird, C.D.; Watson, J.P.; Woodruff, D.L.; Hackebeil, G.A.; Nicholson, B.L.; Siirola, J.D. Pyomo–Optimization Modeling in Python, 2nd ed.; Springer: Berlin, Germany, 2017; Volume 67. [Google Scholar]
  40. Cplex, I.I. V12.1: User’s Manual for CPLEX. Int. Bus. Mach. Corp. 2009, 46, 157. [Google Scholar]
  41. Czyzyk, J.; Mesnier, M.P.; Moré, J.J. The NEOS Server. IEEE J. Comput. Sci. Eng. 1998, 5, 68. [Google Scholar] [CrossRef]
  42. Dolan, E.D. The NEOS Server 4.0 Administrative Guide; Technical Memorandum ANL/MCS-TM-250; Mathematics and Computer Science Division, Argonne National Laboratory: Lemont, IL, USA, 2001. [Google Scholar]
  43. Gropp, W.; Moré, J.J. Optimization Environments and the NEOS Server. In Approximation Theory and Optimization; Buhman, M.D., Iserles, A., Eds.; Cambridge University Press: Cambridge, UK, 1997; p. 167. [Google Scholar]
  44. Salzillo-Arriaga, D.; Sessing, G.; Kowalski, J. Strengths, Weaknesses, Opportunities and Threats of Electrification Strategies. 2018. Available online: https://ec.europa.eu/research/participants/documents/downloadPublic?documentIds=080166e5bb778c92&appId=PPGMS (accessed on 7 February 2021).
Figure 1. Depot charging.
Energies 14 02550 g001
Figure 2. Opportunity charging.
Energies 14 02550 g002
Figure 3. Wireless dynamic charging.
Energies 14 02550 g003
Figure 4. Conductive in-motion charging.
Energies 14 02550 g004
Figure 5. Medellin’s bus line 1 between Aranjuez and Universidad de Medellín.
Energies 14 02550 g005
Figure 6. Articulated battery bus under study.
Energies 14 02550 g006
Figure 7. Power and energy consumption in Universidad de Medellín—Aranjuez route.
Energies 14 02550 g007
Figure 8. Power and energy consumption in Aranjuez—Universidad de Medellín route.
Energies 14 02550 g008
Figure 9. Power curves, Universidad de Medellín—Aranjuez.
Energies 14 02550 g009
Figure 10. Power curves, Aranjuez—Universidad de Medellín.
Energies 14 02550 g010
Figure 11. Total costs for study case scenarios (MUSD).
Energies 14 02550 g011
Figure 12. Calculated battery capacity for study case scenarios (kWh).
Energies 14 02550 g012
Figure 13. Calculated electrification for study case scenarios (km).
Energies 14 02550 g013
Figure 14. Calculated depot charging power for study case scenarios (kW).
Energies 14 02550 g014
Figure 15. Electrified segments for study case scenarios (Dark gray (1) = Electrify, White (0) = Do not electrify).
Energies 14 02550 g015
Table 1. Bus technology characteristics.
Bus TechnologyEnergy
Consumption
(kWh/km)
GHG Emissions
(kgCO2/km)
Energy Cost
(USD/km)
Comments
Diesel6.561.700.402From average diesel consumption in Transmilenio BRT (6.20 km/gL), Bogotá.
Emissions from tailpipe [31]
CNG8.751.760.370From average CNG consumption in Metroplus BRT, Medellín (1.2 km/m3).
Emissions from tailpipe [32].
BEB1.340.280.191From average consumption in Metroplus BRT, Medellín. Emissions from electric grid [32].
Table 2. Parameters of 18 m electric bus in Medellin’s metroplus bus line 1.
Bus ParameterValueComments
Length (m)18Articulated bus
Width (m)2.55
Heigth (m)3.26
Seats33
Passengers160
Empty weight (kg)19,120Measured 19,770 kg
Maximum weigth (kg)30,000
Battery capacity (kWh)450
Power (KW)3602 × 180 kW Permanent magnet synchronous motor
Battery ChemistryLFP
Table 3. Bus battery parameters.
Battery and Charger
Information
ValueComments
Number of parallel modules2
Voltage per module (V)736
Current capacity per module (Ah)300
Module energy capacity (kWh)220.8
Battery energy capacity (kWh)441.6450 kWh according to manufacturer
Cells per module230
Nominal cell voltage (V)3.2
Charging power (kW)2002 × 100 kW plugs, 480 Vac
Measured charging power (kW)154.32 kW
Measured charging time (h)2.58From 10% SoC
Table 4. Study case scenarios.
Energies 14 02550 i001
C b a t [=] kUSD/kWh C c a t [=] kUSD/km C s u b [=] kUSD P I M C [=] kW C d e p [=] kUSD/kW.
Table 5. Optimization model parameters.
ParameterValue
Number of buses (NB)30
Number of station (NS)39
Number of bus trips (NL)11
Minimum SoC ( S o C m i n )0.3
Maximum SoC ( S o C m a x )0.9
Initial SoC ( S o C i n i )0.8
IMC efficiency ( η I M C )1
Depot charging efficiency ( η d e p )1
Depot charging time ( T d e p )4 h
Publisher’s Note: MDPI stays neutral with regard to jurisdictional claims in published maps and institutional affiliations.

