Article

Increasing Electric Vehicles Reliability by Non-Invasive Diagnosis of Motor Winding Faults

Institute of Electrical Engineering and Electronics, Faculty of Control, Robotics and Electrical Engineering, Poznan University of Technology, Piotrowo Street, No. 3a, 60-965 Poznan, Poland
*
Author to whom correspondence should be addressed.
Energies 2021, 14(9), 2510; https://doi.org/10.3390/en14092510
Submission received: 25 March 2021 / Revised: 21 April 2021 / Accepted: 24 April 2021 / Published: 27 April 2021

Abstract

:
The article proposes a proprietary approach to the diagnosis of induction motors allowing increasing the reliability of electric vehicles. This approach makes it possible to detect damage in the form of an inter-turn short-circuit at an early stage of its occurrence. The authors of the article describe an effective diagnostic method using the extraction of diagnostic signal features using an Enhanced Empirical Wavelet Transform and an algorithm based on the method of Ensemble Bagged Trees. The article describes in detail the methodology of the carried out research, presents the method of extracting features from the diagnostic signal and describes the conclusions resulting from the research. Phase current waveforms obtained from a real object as well as simulation results based on the field-circuit model of an induction motor were used as a diagnostic signal in the research. In order to determine the accuracy of the damage classification, simple metrics such as accuracy, sensitivity, selectivity, precision as well as complex metrics weight F1 and macro F1 were used.

1. Introduction

As a results of the dynamic development of electronics, inverter-powered induction motors are increasingly used as drives for electric vehicles. The high starting torque of asynchronous motors has a significant impact on the dynamics of vehicles, which directly affects the value of acceleration. Thanks to the increasingly better electromagnetic properties of the materials from which asynchronous motors are produced, it is possible to miniaturize these machines. Their relatively small size makes squirrel-cage motors used not only as drives in traction vehicles, but also in trucks, passenger cars and even electric motorcycles.
Induction motors, due to their simple structure, low production costs and the possibility to control the rotational speed in a wide range, are often used in industry in drive systems [1,2,3,4,5]. The wide area of their application means that diagnostics of this type of machines plays an increasingly important role, and ensuring their failure-free operation becomes a priority from an economic point of view for many companies [1,6,7,8]. The results of the research conducted so far show that just after mechanical damage to bearings, which account for nearly 40% of all damage to induction motors, stator winding failures are the second most frequent cause of failure of induction machines (38% of all damage) [9,10]. Among the stator winding faults, the most common fault is the inter-turn short-circuit. The reason for their appearance is damage to the insulation of the wires next to each other. Damage to the insulation may occur as a result of too high current flow, excessive mechanical stresses related to electrodynamic forces acting on the stator or as a result of too high temperature inside the machine [11,12,13,14]. As a result of an inter-turn short-circuit in the machine, asymmetry of both voltages and currents with high effective values may occur, which may lead to complete damage to the machine [15].
The most popular and most frequently used diagnostic techniques in the application of electrical machines are those in which the current waveform signal is used, e.g., (Motor Current Signature Analysis (MCSA)) as well as vibrations (Motor Vibration Signature Analysis (MVSA)) [16]. These techniques allow for non-invasive acquisition of a diagnostic signal without having to turn off the device, and thus without interrupting the technological process. For this reason, the authors of the presented article used the phase current waveforms as a diagnostic signal. In the presented approach, unlike other currently used methods, short-circuit detection is performed only on the basis of one diagnostic signal, i.e., the current waveform of one phase, without the need to record other diagnostic signals, such as e.g., current waveforms from all phases [17,18,19], torque waveform [18,20,21], magnetic flux distribution [17,18,22,23,24], power changes [20,25], temperature distribution [26,27], inter-winding voltage response to the impulse test [28,29].
The latest research focusing on the diagnostics of induction motors is carried out in two different directions. The first direction is based on analytical calculations [1,6] and the second one uses numerical methods [4,20], where the most popular are the finite element method or the finite difference method. As mentioned in the previous paragraph, the most frequently used diagnostic signals are current waveforms, acoustic signals or vibrations, although these signals are not the only ones that can be used. More and more often can be find a publication describing motor diagnostics based on torque waveforms. More information on diagnostics based on torque can be found, for example, in articles [9,14]. Diagnostics of induction motors using vibroacoustic signals gives satisfactory results in case of detection of mechanical failure of the machine, such as misalignment or bearing damage. It is because mechanical failures, most often, result in significant changes in the axial symmetry of the machine, which translates into additional vibrations or noise [4,5,12]. Unfortunately, failures of the stator winding, especially at an early stage of its occurrence, does not significantly impact into vibration or acoustic signal. Therefore, despite the fact that these signals can be aggregated in a non-invasive method, their use in the diagnosis of inter-turn short circuits is possible, but significantly impeded. Many researchers have proved in their publications that the situation is similar in the case of the current signal and the inter-turn short circuits in the early stage of their occurrence, i.e., when a small number of turns are shorted, also do not significantly distort the current waveforms. Nevertheless, the dynamic development in the fields of both, signal processing methods and artificial intelligence, makes it possible to diagnose machine failures on the basis of signals that were previously considered insufficient.
Due to the fact that inter-turn short-circuits at an early stage of their occurrence (a small number of short-circuits) do not significantly affect the phase current waveforms, they are difficult to detect and unambiguously interpret. Therefore, the authors in the research used and compared several methods of machine learning as classification method. Based on the obtained results, they proposed an original classification algorithm based on the most effective method. The presented algorithm enables short-circuit detection with high accuracy, even for a small number of shorted turns.
The presented article has been divided into several sections. After the introduction in the Section 1, the Section 2.1 presents a general algorithm for short-circuit detection in the stator windings. Then, the feature extraction method using the Enhanced Empirical Wavelet Transformation (EEWT) is presented in the Section 2.2. The EEWT algorithm is presented and the method of extracting the diagnostic signal features based on its components is described. Section 2.3 presents the method of Ensemble Bagged Trees (EBT) for the classification of motor winding faults. Section 3 presents obtaining a diagnostic signal using the field-circuit model and a physical object, and finally validates the proposed approach. Section 4 contains a description of conclusions resulting from the carried out research.

2. Approach

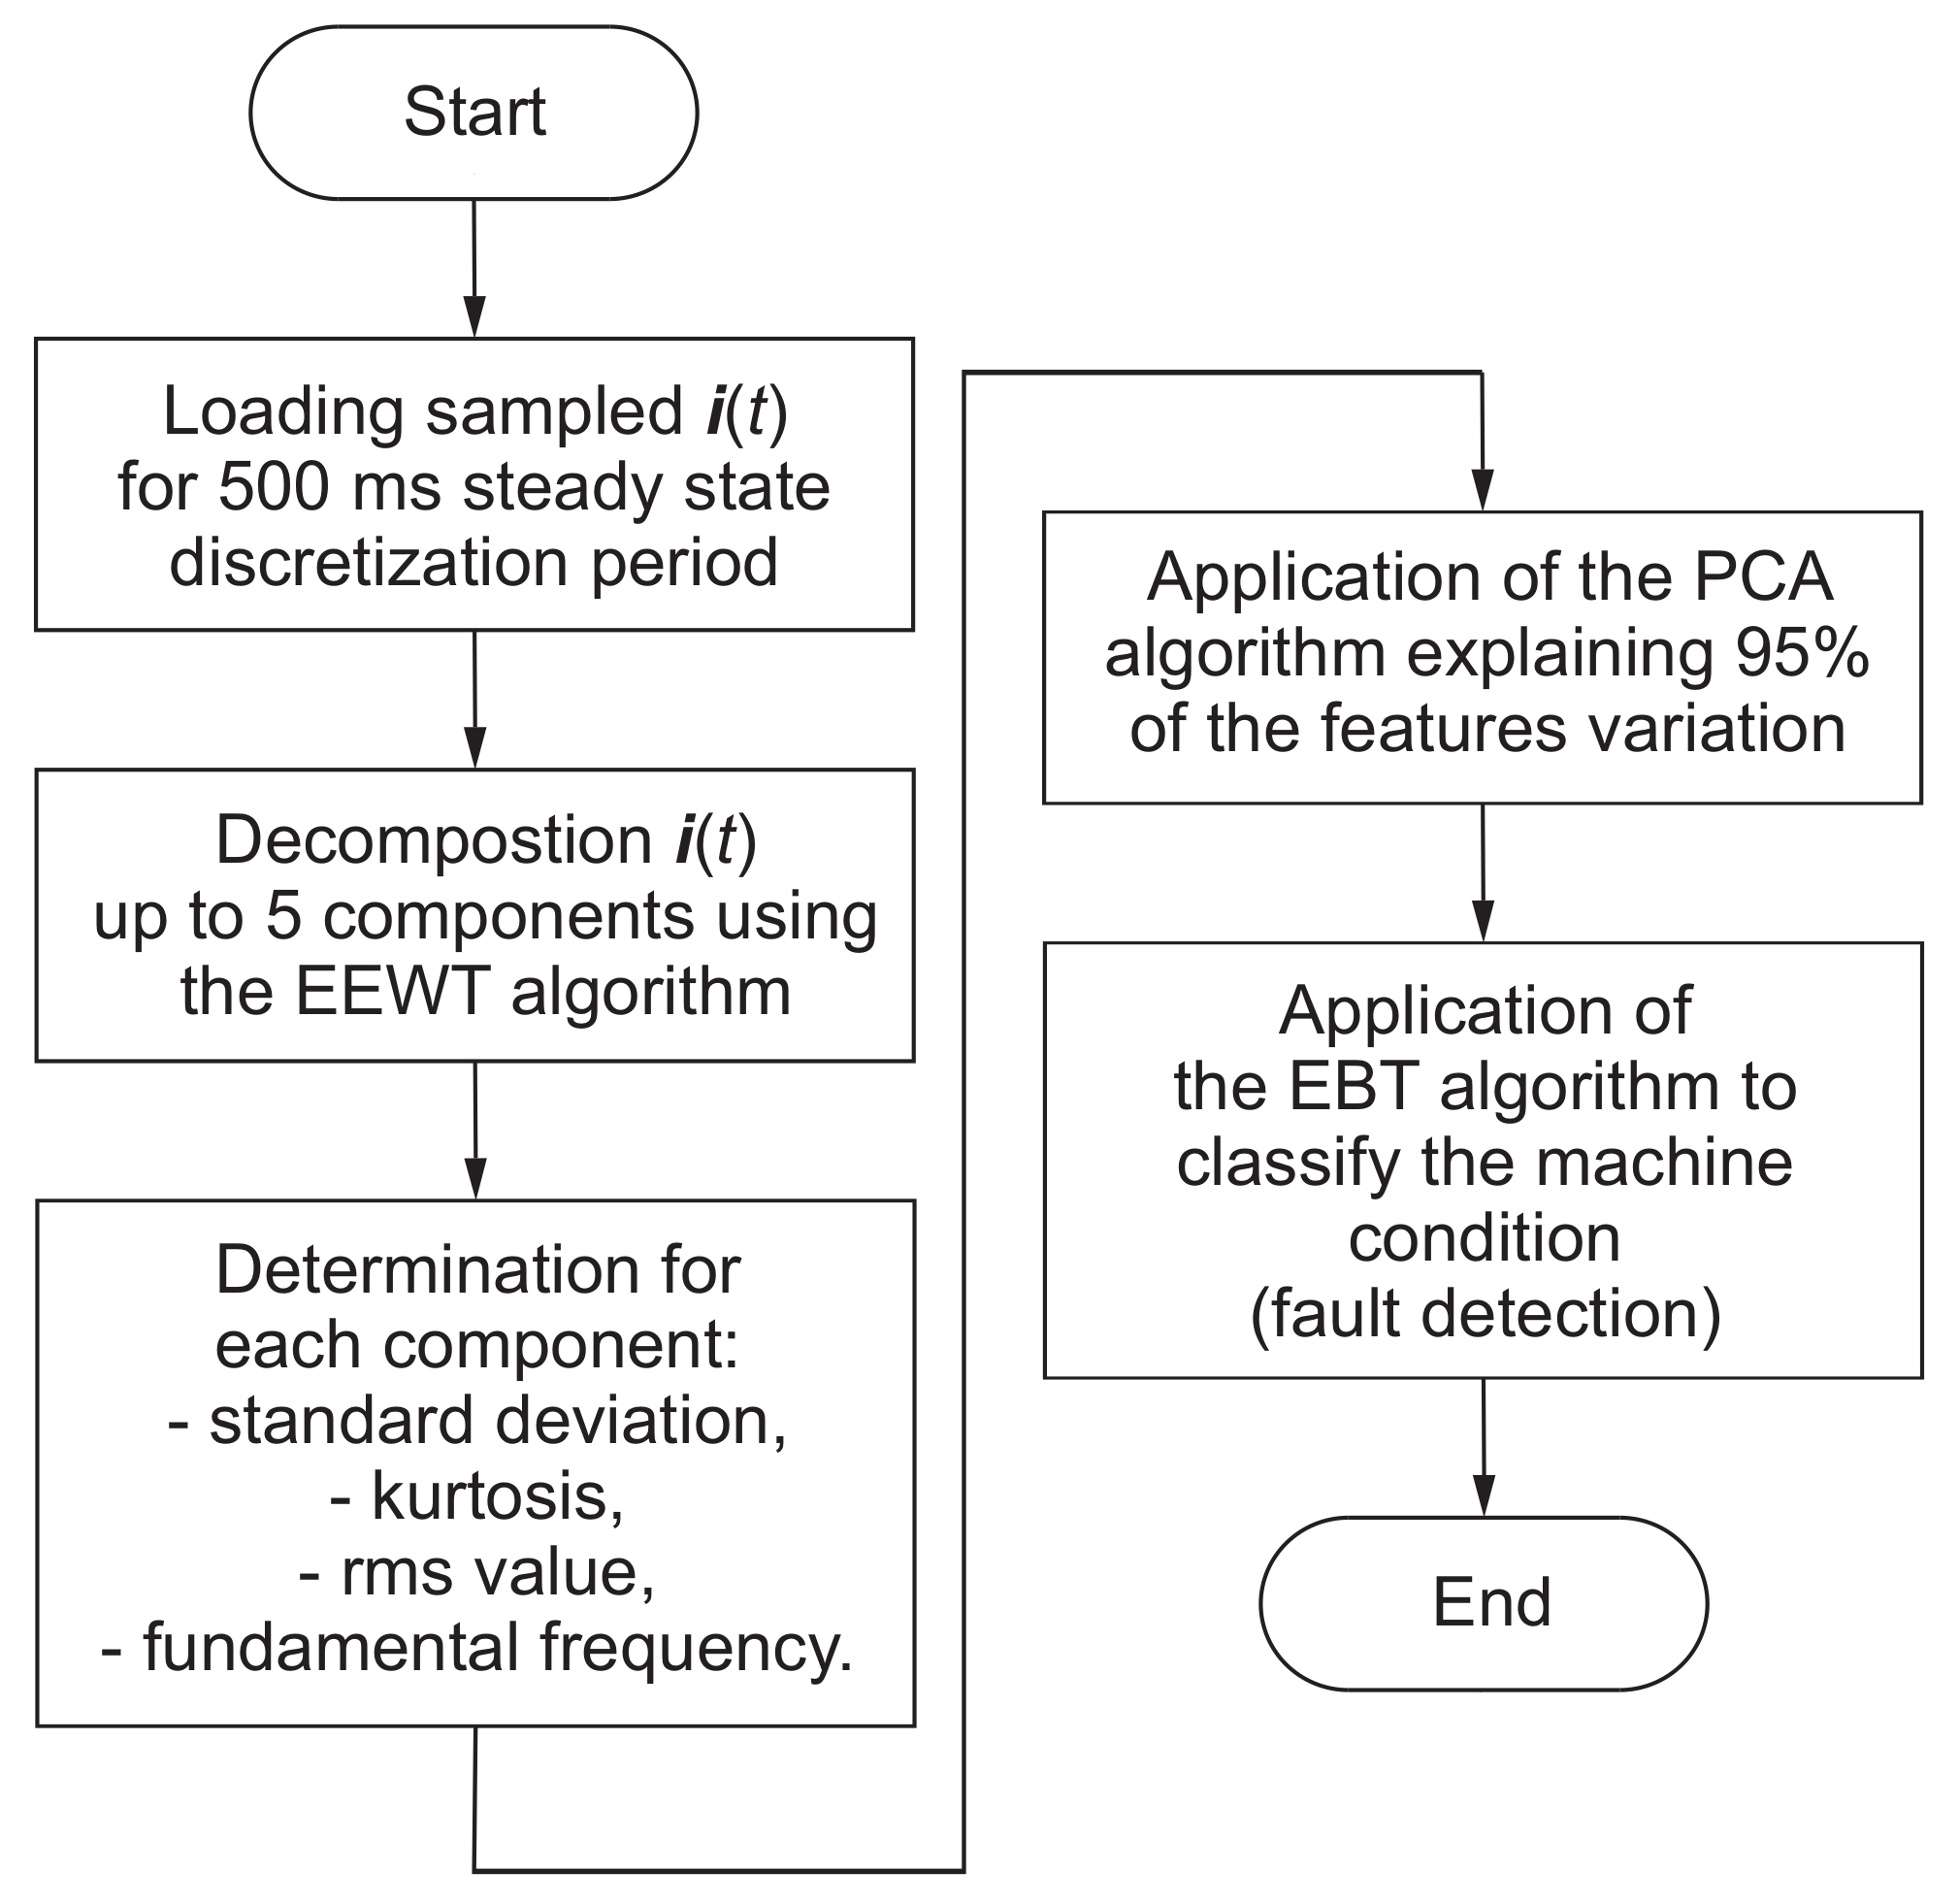
2.1. Proposed Algorithm for the Motor Winding Fault Diagnosis

The proposed algorithm for the detection of short-circuits in the motor windings is shown in Figure 1.
The proposed algorithm for the detection of short-circuits in the motor windings uses the sampled current in the steady state for the discretization period equal to 500 ms with the sampling frequency of 5 kHz. The current can be measured non-invasively in any phase of the motor during normal operation. The motor current spectrum depends on many factors: e.g., on the operation state of motor, on the occurrence of possible motor faults (including mechanical faults), on the stator supply voltage. Hence, it is difficult to define the maximum limit value of current spectrum, so it is best to record the signal with the highest possible value of sampling frequency. Increasing the sampling rate affects the speed of proposed classification method because the input data size for the proposed approach increases. The computational complexity of the EEWT implementation is at least O ( n 2 ) (n is the input data size) [30], which means at least square increase in the algorithm execution time in relation to the input data size for the proposed algorithm implementation. Additionally, the time needed to perform the EBT classification should be considered. In order to implement the proposed approach in real time on an average quality PC, the sampling frequency for the adopted discretization period should be at the level of kHz . Moreover, the assumed value of sampling frequency equal to 5 kHz , considering the sampling theorem, allows taking into account current spectrum components dependent on the typical distortions (up to the 50-th harmonic) of stator voltage supply (the frequency of 50-th harmonic for the voltage in the power grid with the fundamental frequency equal to 50 Hz is 2500 Hz ). On the other hand, the discretization time of 500 ms allows consideration current spectrum components with a frequency of several Hz . These components are subharmonics that occur as a result of voltage fluctuations in the power grid (typical disturbance in a low-voltage network). Increasing the discretization time for proposed motor winding fault classification is not appropriate because, as with the sampling rate, it affects the input data size for the proposed approach operating in real time.
In the next step, the sampled current is decomposed to five component signals using the Enhanced Empirical Wavelet Transform (EEWT) (see Section 2.2). The selected decomposition algorithm allows to precise decomposition of signals of variable amplitude and frequency (AM-FM) with the use of a bank of adaptive wavelet filters, even when the analyzed signal is non-stationary and noisy. The carried out research shows that the current decomposition of up to five component signals is optimal for the proposed algorithm. In the case of current decomposition to two, three or four component signals, the classification accuracy for two classes of motor states (undamaged motor and motor with the short-circuits of at least one turn of stator winding) significant decreases. In the case of increasing the number of component signals (from 6 to 10), the increase in the accuracy of the proposed algorithm is negligible (1–2%), while the operating time of the proposed approach increases significantly due to the increase in the number of features on the basis of which classification is performed. The presentation of these results has been omitted due to the required brevity of the article.
Two statistical parameters are determined for individual component signals: standard deviation and kurtosis, and two signal parameters: rms value and fundamental frequency. The fundamental frequency is determined using the power spectral density of the j-th component signal. Other statistical measures, such as: mean value (arithmetic, harmonic, geometric), maximum and minimum value, median, interquartile range, coefficient of variation, asymmetry coefficient, excess coefficient, Lorenz concentration coefficient; and other signal measures: signal power/energy; were considered in the research, but these measures in the proposed approach do not effect on the final classification accuracy. Hence, the extraction of these features is omitted in the presented algorithm shown in the Figure 1. The presentation of influence other considered measures on final classification accuracy has been omitted due to the required brevity of the article.
In next step, Principal Component Analysis (PCA) (explaining 95% of the variability of features) is applied for the extracted features of individual component signals. In this step, the dimensions of the feature space are reduced from 20-dimensional space to 2-dimensional or 3-dimensional space, and consequently the operation time of the proposed algorithm (Figure 1) significantly decreases. The proposed approach using Ensemble Bagged Trees (EBT) machine learning algorithm with the PCA applied allows for the prediction of approximately 2600 objects per second. When the PCA is not applied, then the prediction speed is estimated at approximately 2000 objects per second. Therefore the use of PCA in the proposed approach allows to increase the prediction speed by about 30%. A comparison of the classification accuracy without PCA and with PCA is presented in Section 3.
The machine learning algorithm of EBT was used for classification, because in the carried out research the EBT achieved the highest classification accuracy, considering the basic metrics in the case of two class classification, i.e., accuracy, sensitivity, selectivity, precision, F1 score; and complex metrics in the case of multi-class classification, i.e., weight F1 and macro F1. A comparison of the classification accuracy by the proposed EBT machine learning algorithm with other selected machine learning methods is presented in Section 3. The proposed approach can be used with high accuracy in Case I and Case II. Case I concerns the recognition if the motor is undamaged or if the motor is damaged, so it has the short-circuits of at least one turn of stator winding. Case II concerns the recognition if the motor is undamaged, or if the motor is slightly damaged (the short-circuits of 1 to 10 turns of stator winding), or if the motor is significantly damaged (the short-circuits of more turns of stator winding) and should be repaired immediately.

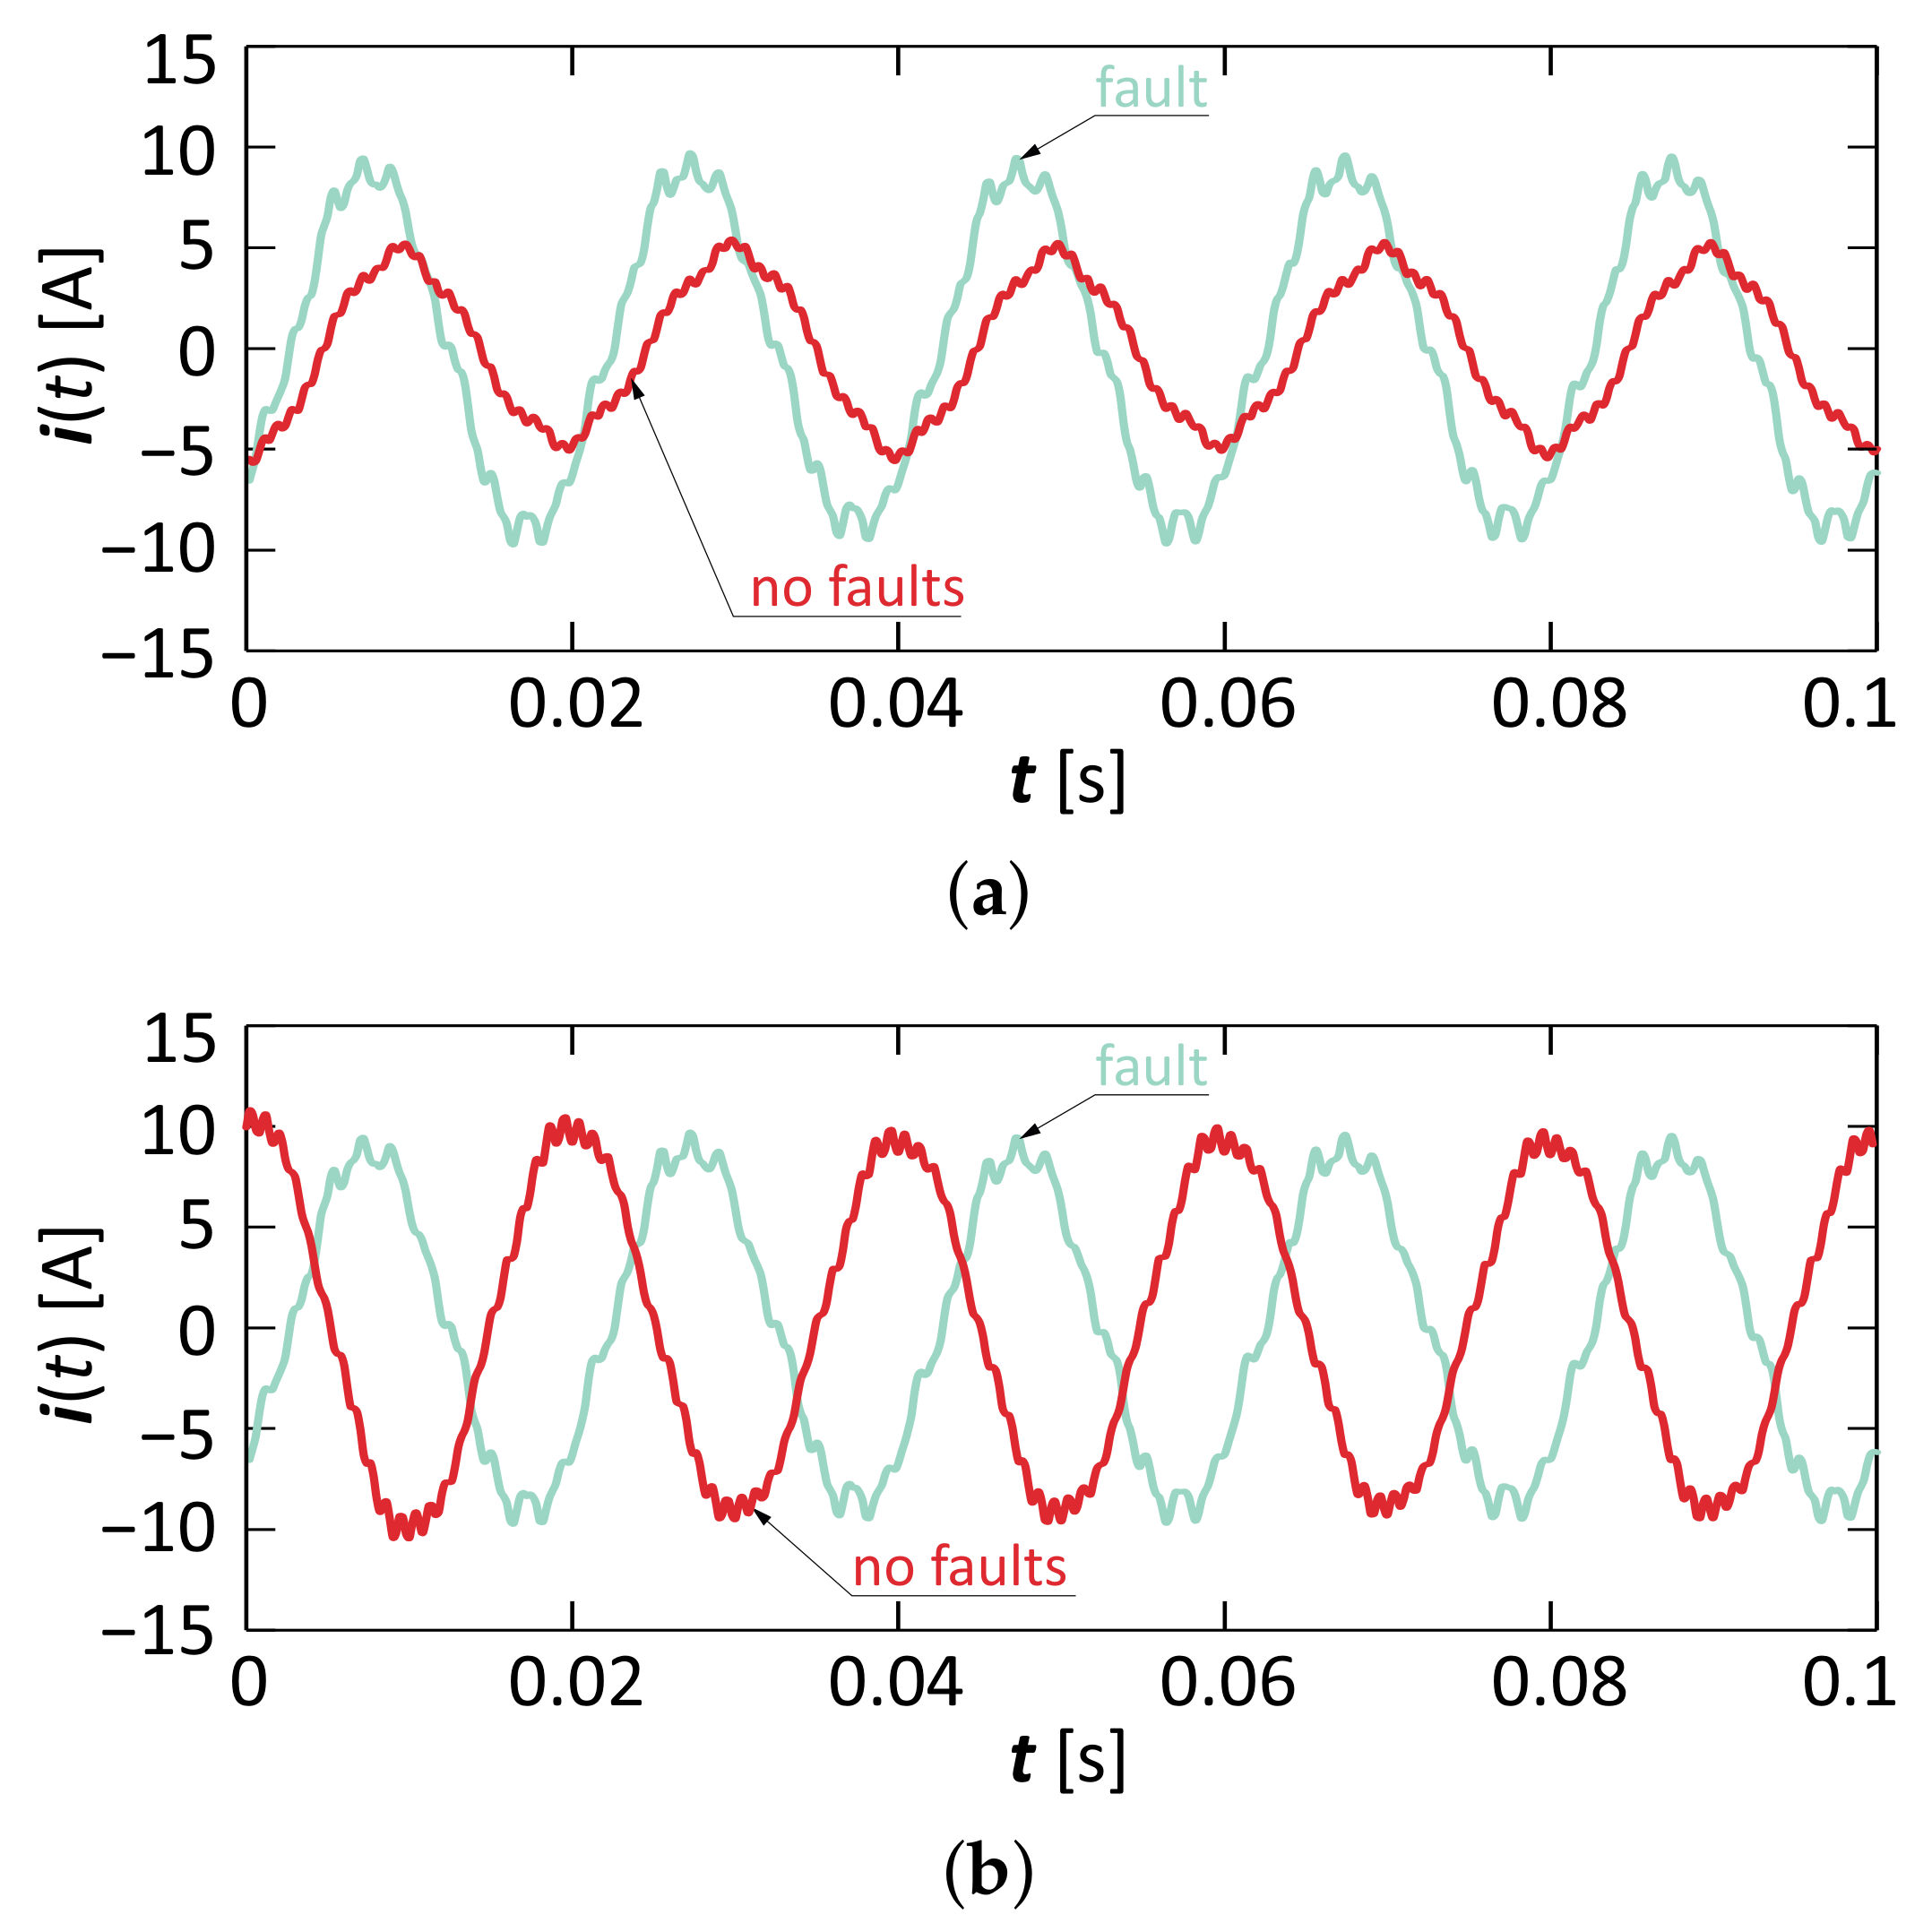
2.2. Feature Extraction with EEWT Decomposition

In this block, the sampled current is decomposed using the EEWT [31,32]. The EEWT algorithm is an improved algorithm of the empirical wavelet transform (EWT) proposed by Gilles [33]. Section 2.2.1 shortly explains the basic operation of EEWT algorithm. The features are extracted for individual component signals, as shown in the example in Section 2.2.2.

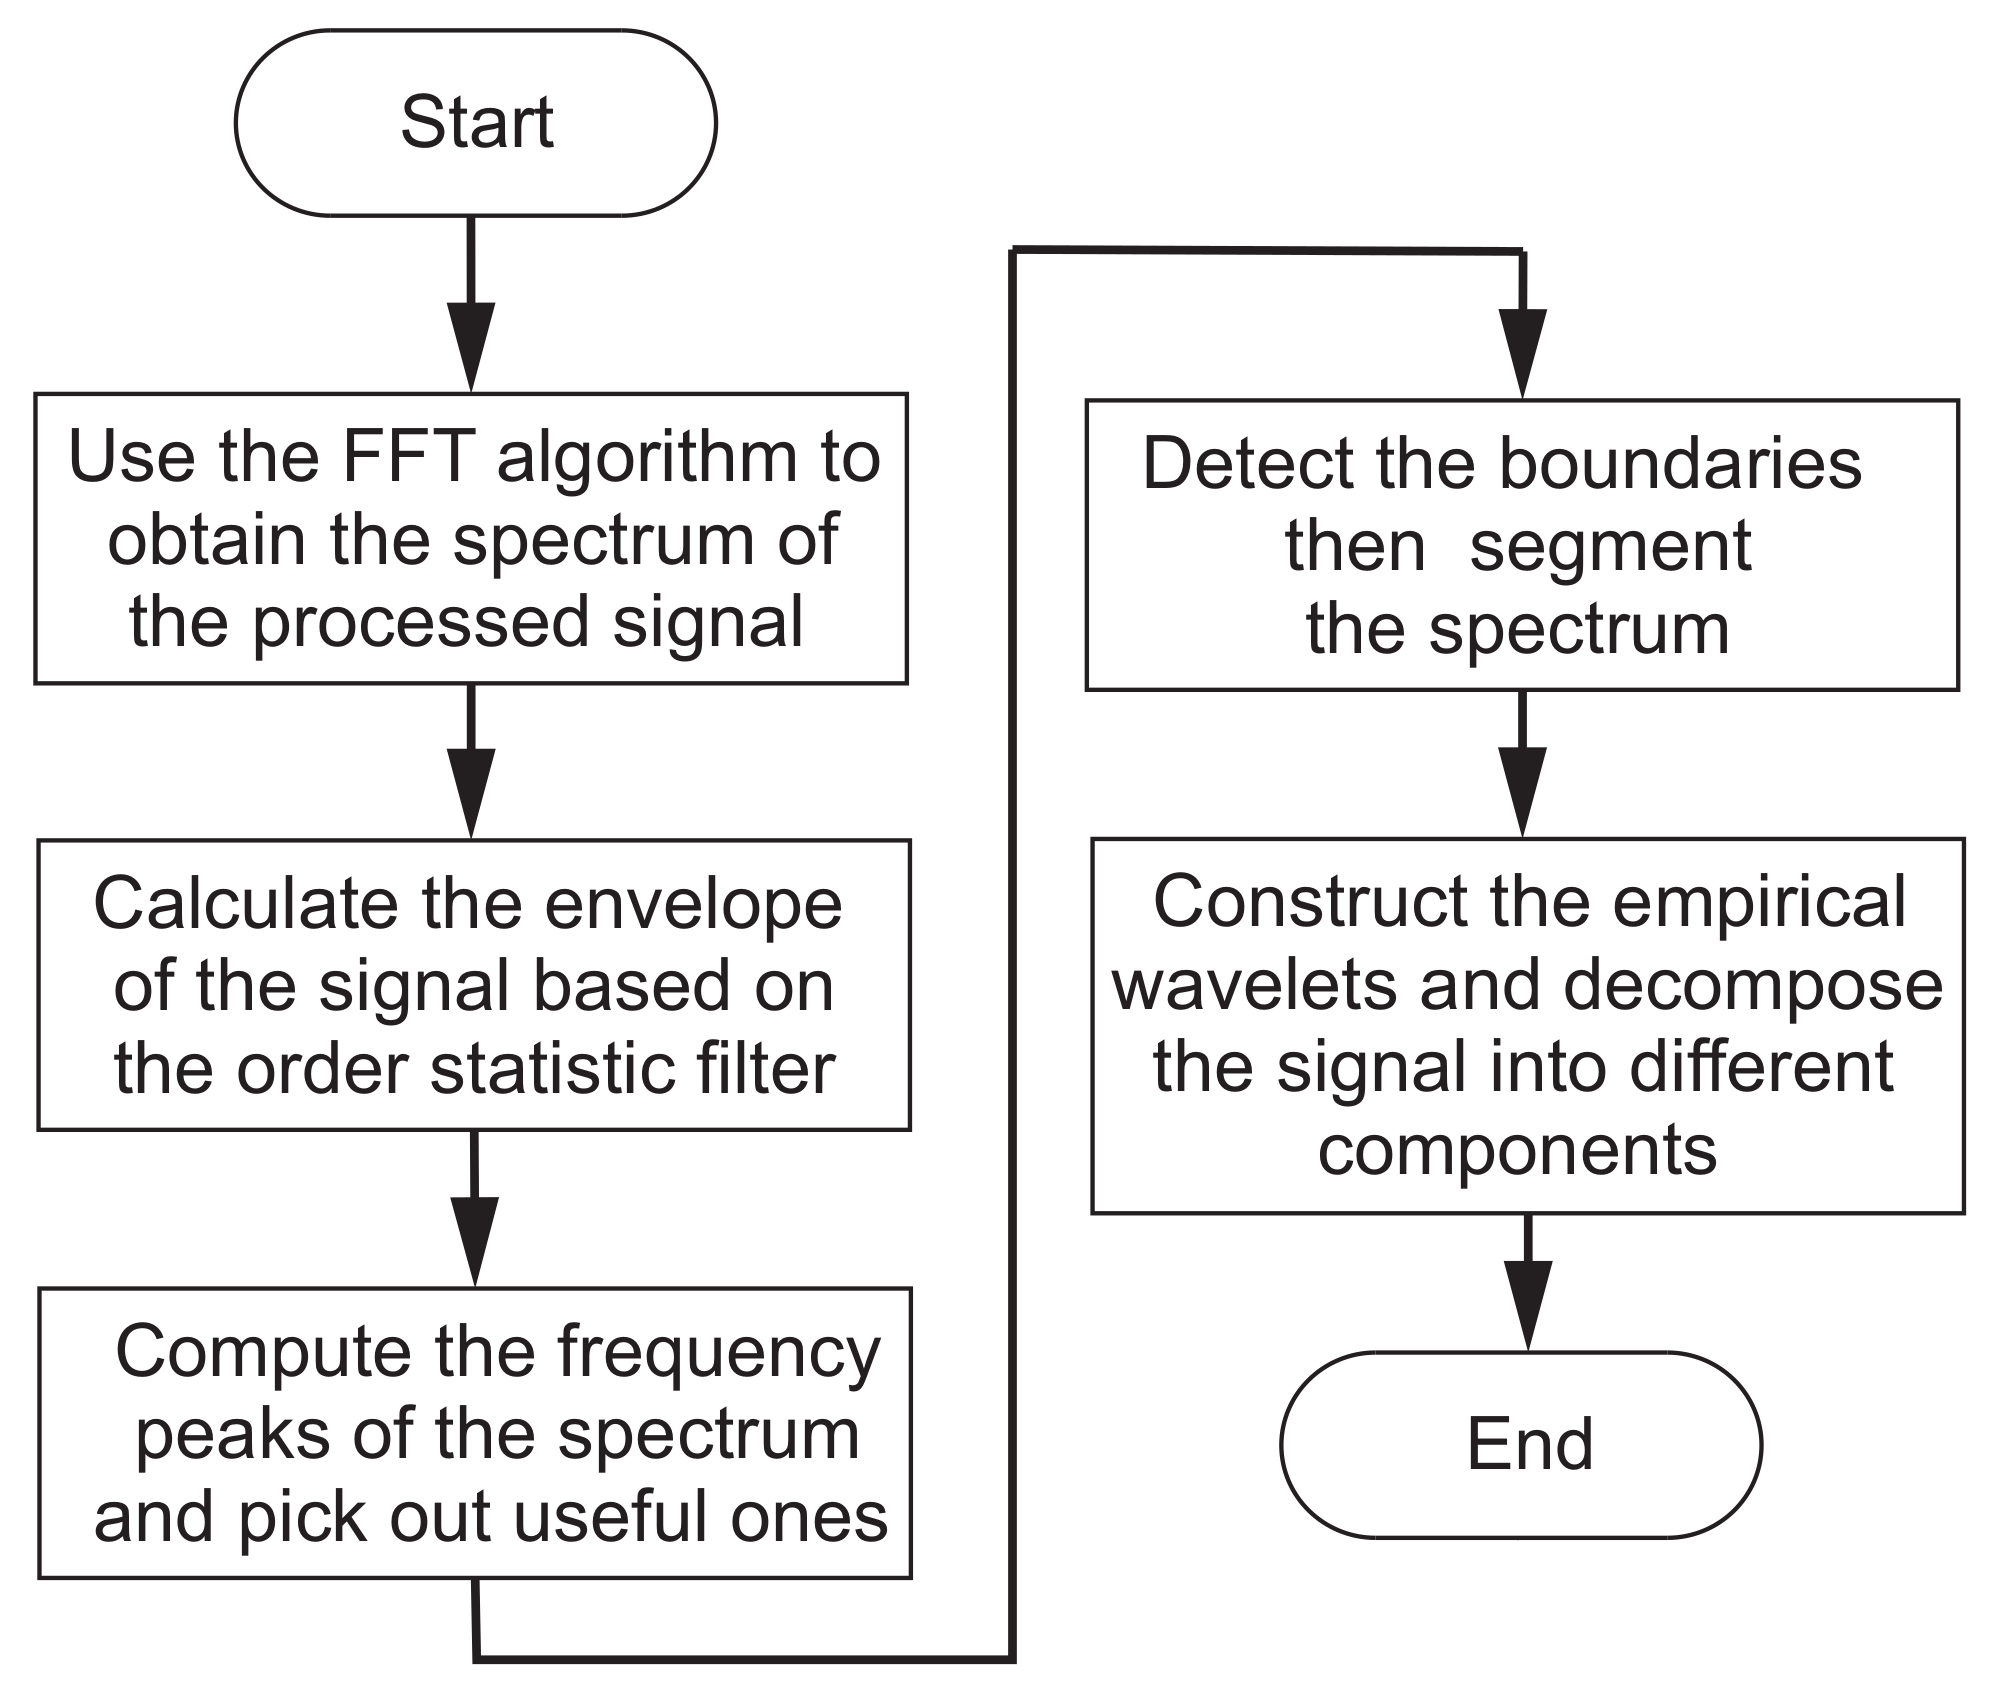
2.2.1. The EEWT Algorithm

The EEWT algorithm can be represented in the following steps.
  • The use of Fast Fourier Transform (FFT) to determine the spectrum of the analyzed signal.
  • The calculation of the upper envelope of the analyzed signal using the Order Statistical Filter (OSF). In the enhanced method (in relation to the EWT method), the envelope is used to identify the trend of spectrum variation.
  • The determination of spectrum frequency peaks from the designated envelope and selection of useful ones based on the following criteria: (a) the width of a flat top cannot be shorter than the the order statistics filter size; (b) the most representative flat top in the neighbor ones is picked out; (c) the useful flat tops do not appear in the downtrend of the analyzed signal spectrum.
  • The calculation of the spectrum segmentation boundaries based on flat tops obtained in step 3.
  • The construction of the empirical scaling function and empirical wavelet as in the EWT method, and the decomposition of the analyzed signal into component signals.
Steps 1–4 allow segmentation of the spectrum of the analyzed signal. To segment the spectrum, the segmentation boundaries must be determined. For this purpose, the spectrum is normalized to the range [ 0 ; π ] and is divided into N intervals (the EEWT method allows decomposition the processed signal into a predetermined number N of component signals). The individual intervals boundaries are designated as ω n , where ω 0 = 0 and ω N = π . Each sub-range is marked as n = 1 N Λ n = [ 0 ; π ] . The boundary determination is based on flat tops described in Step 3. Each boundary is the minimum between subsequent flat tops in the analyzed signal spectrum. If the flat tops are designated as F T n , then:
ω n = arg min f ^ ω ω F T n , F T n + 1
where f ^ ω is the analyzed signal spectrum.
Step 5 allows construction of the empirical wavelet enabling extraction of individual component signals as described in [33]. For specific intervals, an empirical scaling function Φ n is constructed described by (2) and an empirical Meyer wavelet Ψ n described by (3) [33]:
Φ n = 1 if ω ω n τ n cos π 2 υ 1 2 τ n ω ω n + τ n if ω n τ n < ω < ω n + τ n 0 otherwise ,
Ψ n = 1 if ω n + τ n ω ω n + 1 τ n + 1 cos π 2 υ 1 2 τ n + 1 ω ω n + 1 + τ n + 1 if ω n + 1 τ n + 1 < ω < ω n + 1 + τ n + 1 sin π 2 υ 1 2 τ n ω ω n + τ n if ω n τ n ω ω n + τ n 0 otherwise ,
where υ ( x ) can be described as:
υ ( x ) = x 4 ( 35 84 x + 70 x 2 20 x 3 ) if 0 < x < 1 0 otherwise .
For the defined empirical wavelet, the τ n can be selected many ways and determines the appropriate width of the spectrum segment. One of the simplest choices is τ n proportional to ω n , so τ n = γ ω n , where 0 < γ < 1 .
The approximate coefficients are the scalar product of the processed signal and the empirical scaling function:
W f ε ( 0 , t ) = f , Φ 1 = f ( τ ) Φ 1 ( τ t ) ¯ d τ .
The detail coefficients are the scalar product of the processed signal and the empirical wavelet:
W f ε ( n , t ) = f , Ψ n = f ( τ ) Ψ n ( τ t ) ¯ d τ .
For defined approximation coefficients and detail coefficients, signal decomposition defined by empirical wavelet transform can be described as:
f i ( t ) = W f ε ( 0 , t ) Φ 1 ( t ) if i = 0 W f ε ( i , t ) Ψ i ( t ) if i = 1 , 2 , , N .
The block diagram showing the EEWT algorithm is presented in Figure 2. A detailed description of EEWT method can be found in [31].

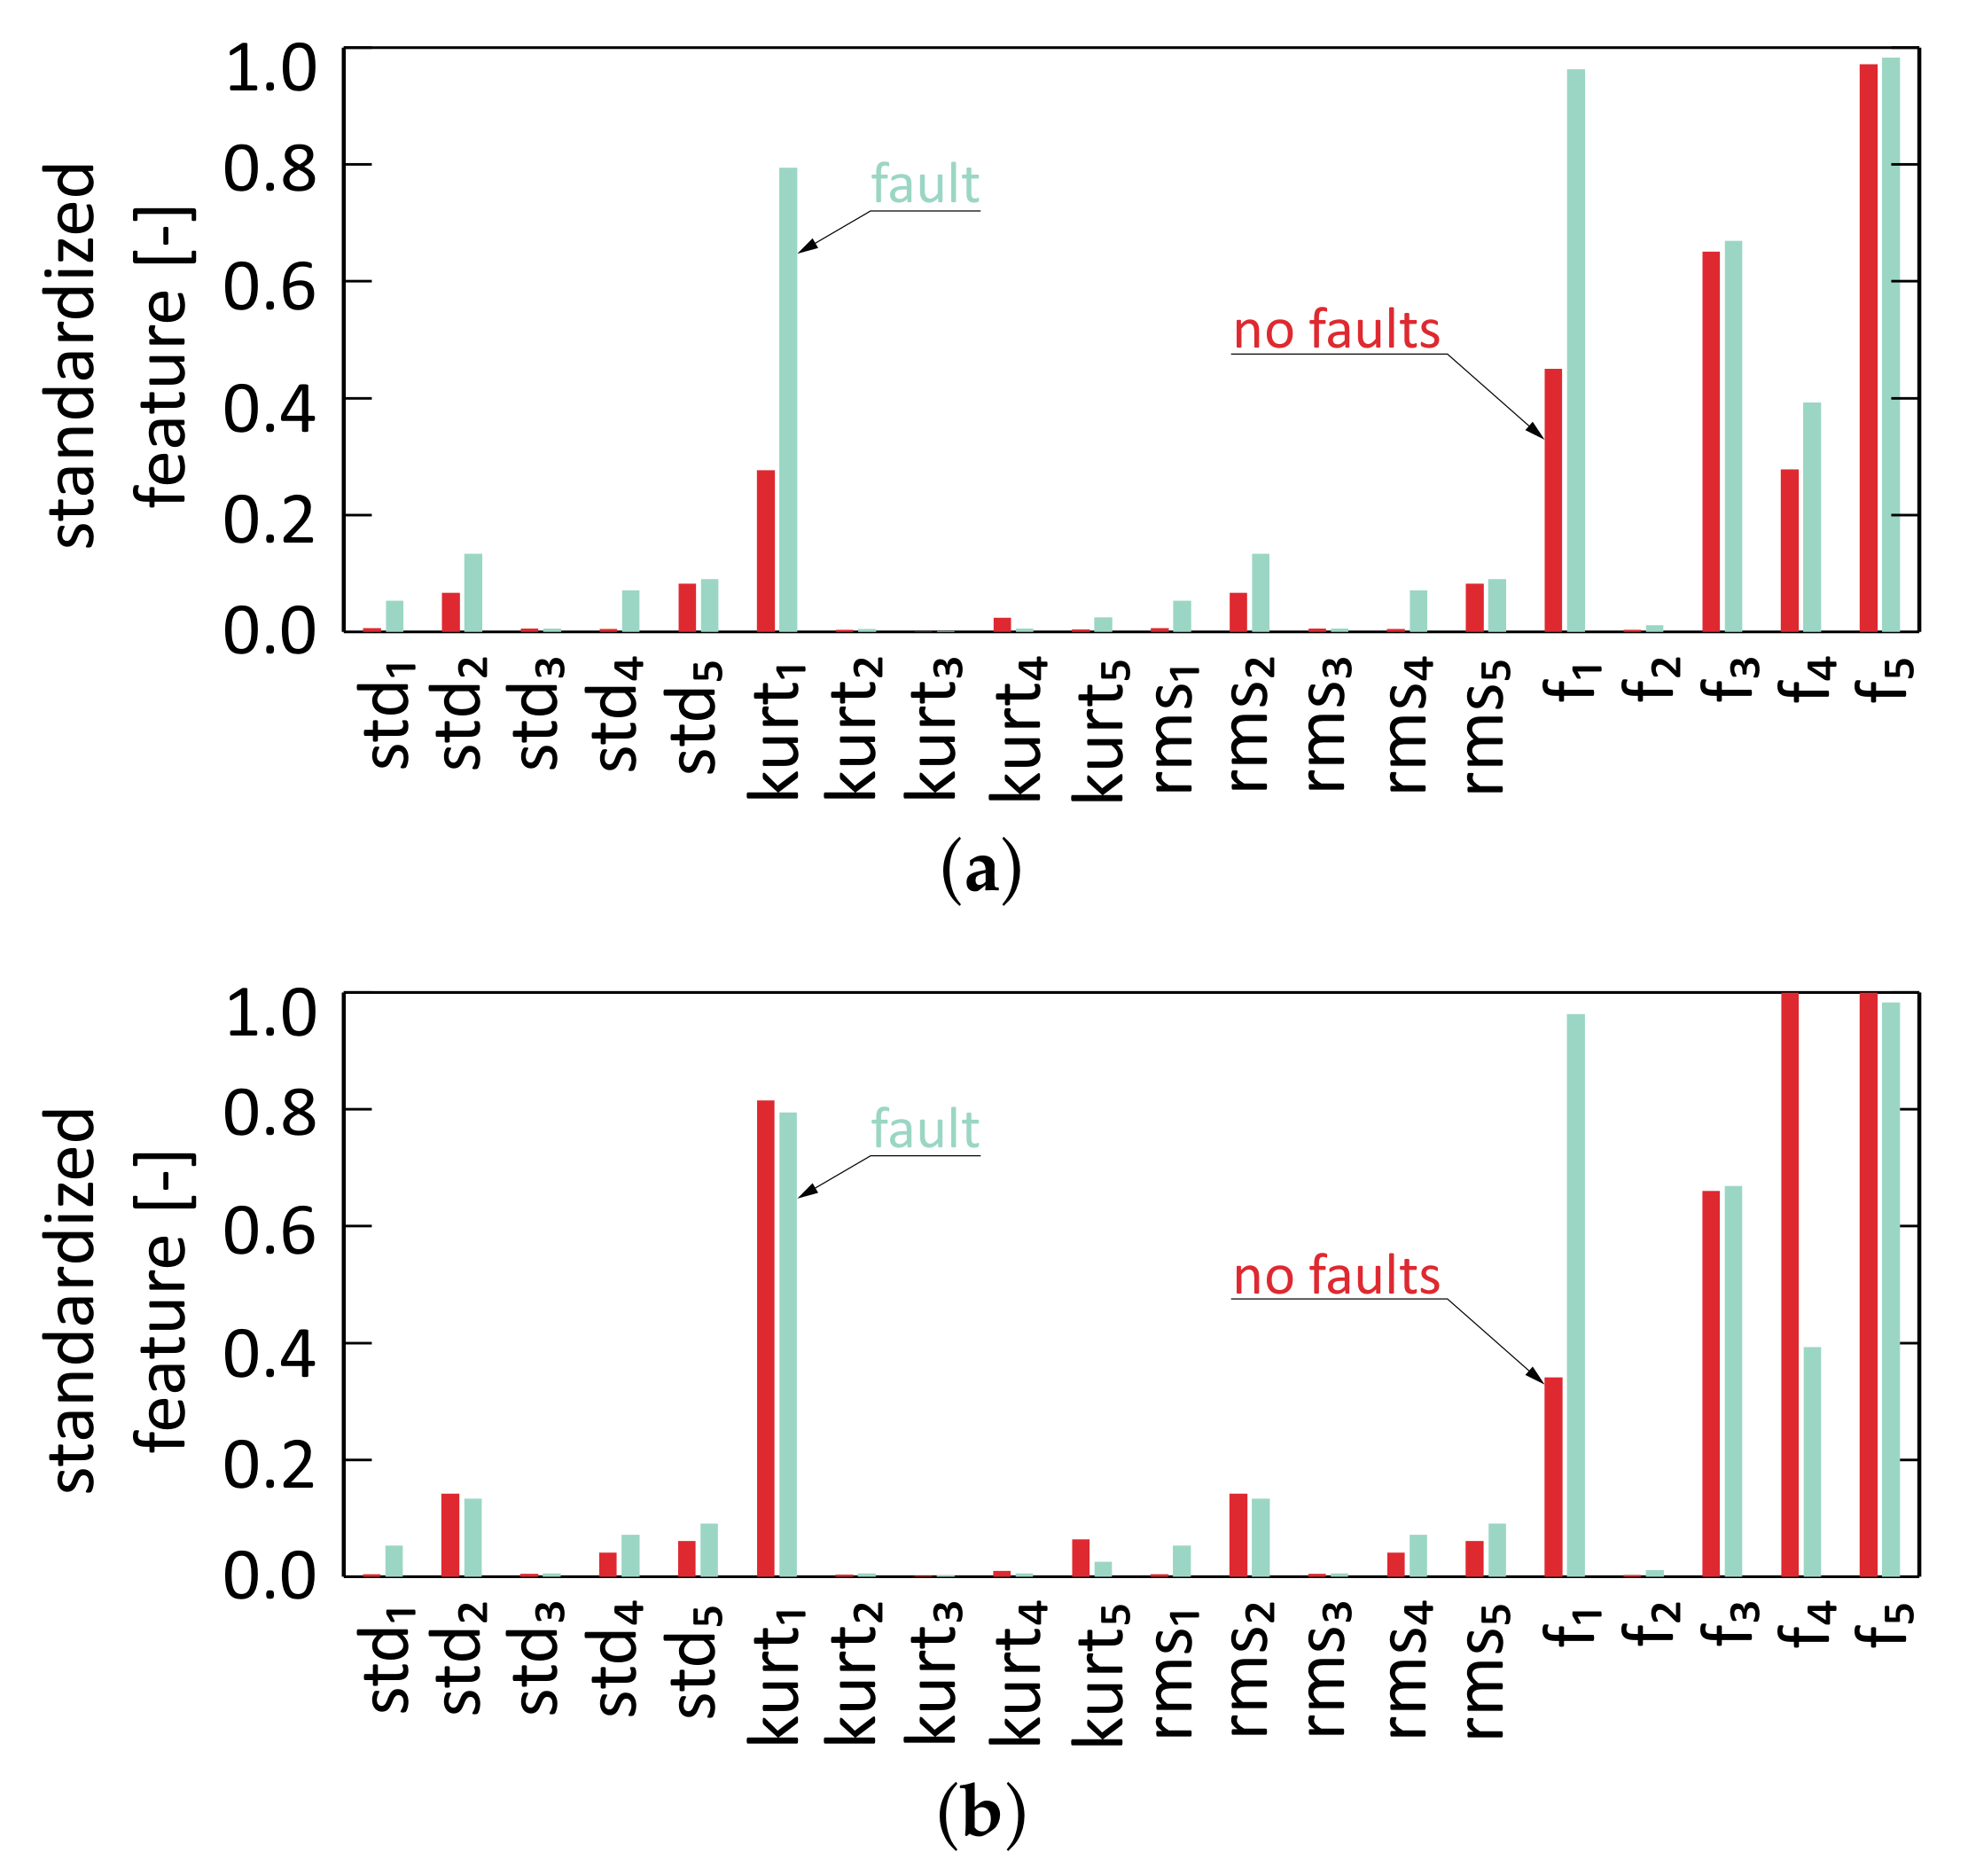
2.2.2. Feature Extraction Based on Component Signals

Non-invasive short-circuits detection in the motor is the important diagnostic task, especially if only the sampled steady-state current during motor operation is available. Figure 3a shows the stator current waveforms, in which there are no visible recognizable features between the undamaged machine current and the current of machine with the short-circuits of one turn. Based on the presented waveforms, it can be concluded that the increased current amplitude and its distortion can indicate motor damage, but the increased current amplitude and its distortion can also occur in the case of increased load on the motor with external torque. This situation is shown in Figure 3b, which compares the current of motor with the short-circuits of one turn and the current of undamaged motor, but operating with a greater load than the damaged motor.
The correct indication of if the motor is undamaged, or if motor have short-circuits of at least one turn, is possible by using the proposed decomposition and by determining for each of the j-th component signals: standard deviation (std j ), kurtosis (kurt j ), rms value (rms j ) and fundamental frequency (f j ). This situation is shown in Figure 4 for selected cases shown in Figure 3.
The Figure 5 shows standardized extracted features in parallel coordinates for classification into two or three classes. The Figure 5 shows that the selected features are characteristic for the following cases: no faults, minor fault and significant fault.

2.3. Classification Block with Ensemble Bagged Trees

In this block, machine condition classification is performed using the proposed Ensemble Bagged Trees (EBT) algorithm. This method is based on nested decision trees. For classification problems, the predicted class for an observation is the class that yields the largest weighted average of the class posterior probabilities (i.e., classification scores) computed using selected trees only. That is:
  • For each class c C and each tree t = 1 , , T , predict computes P t ( c | x ) , which is the estimated posterior probability of class c given observation x using tree t. C is the set of all distinct classes in the training data.
  • Predict computes the weighted average of the class posterior probabilities over the selected trees.
    P ^ b a g c | x = 1 t = 1 T α t I t S t = 1 T α t P ^ t c | x I t S
  • The predicted class is the class that yields the largest weighted average.
    y ^ b a g = arg max c C P ^ b a g c | x

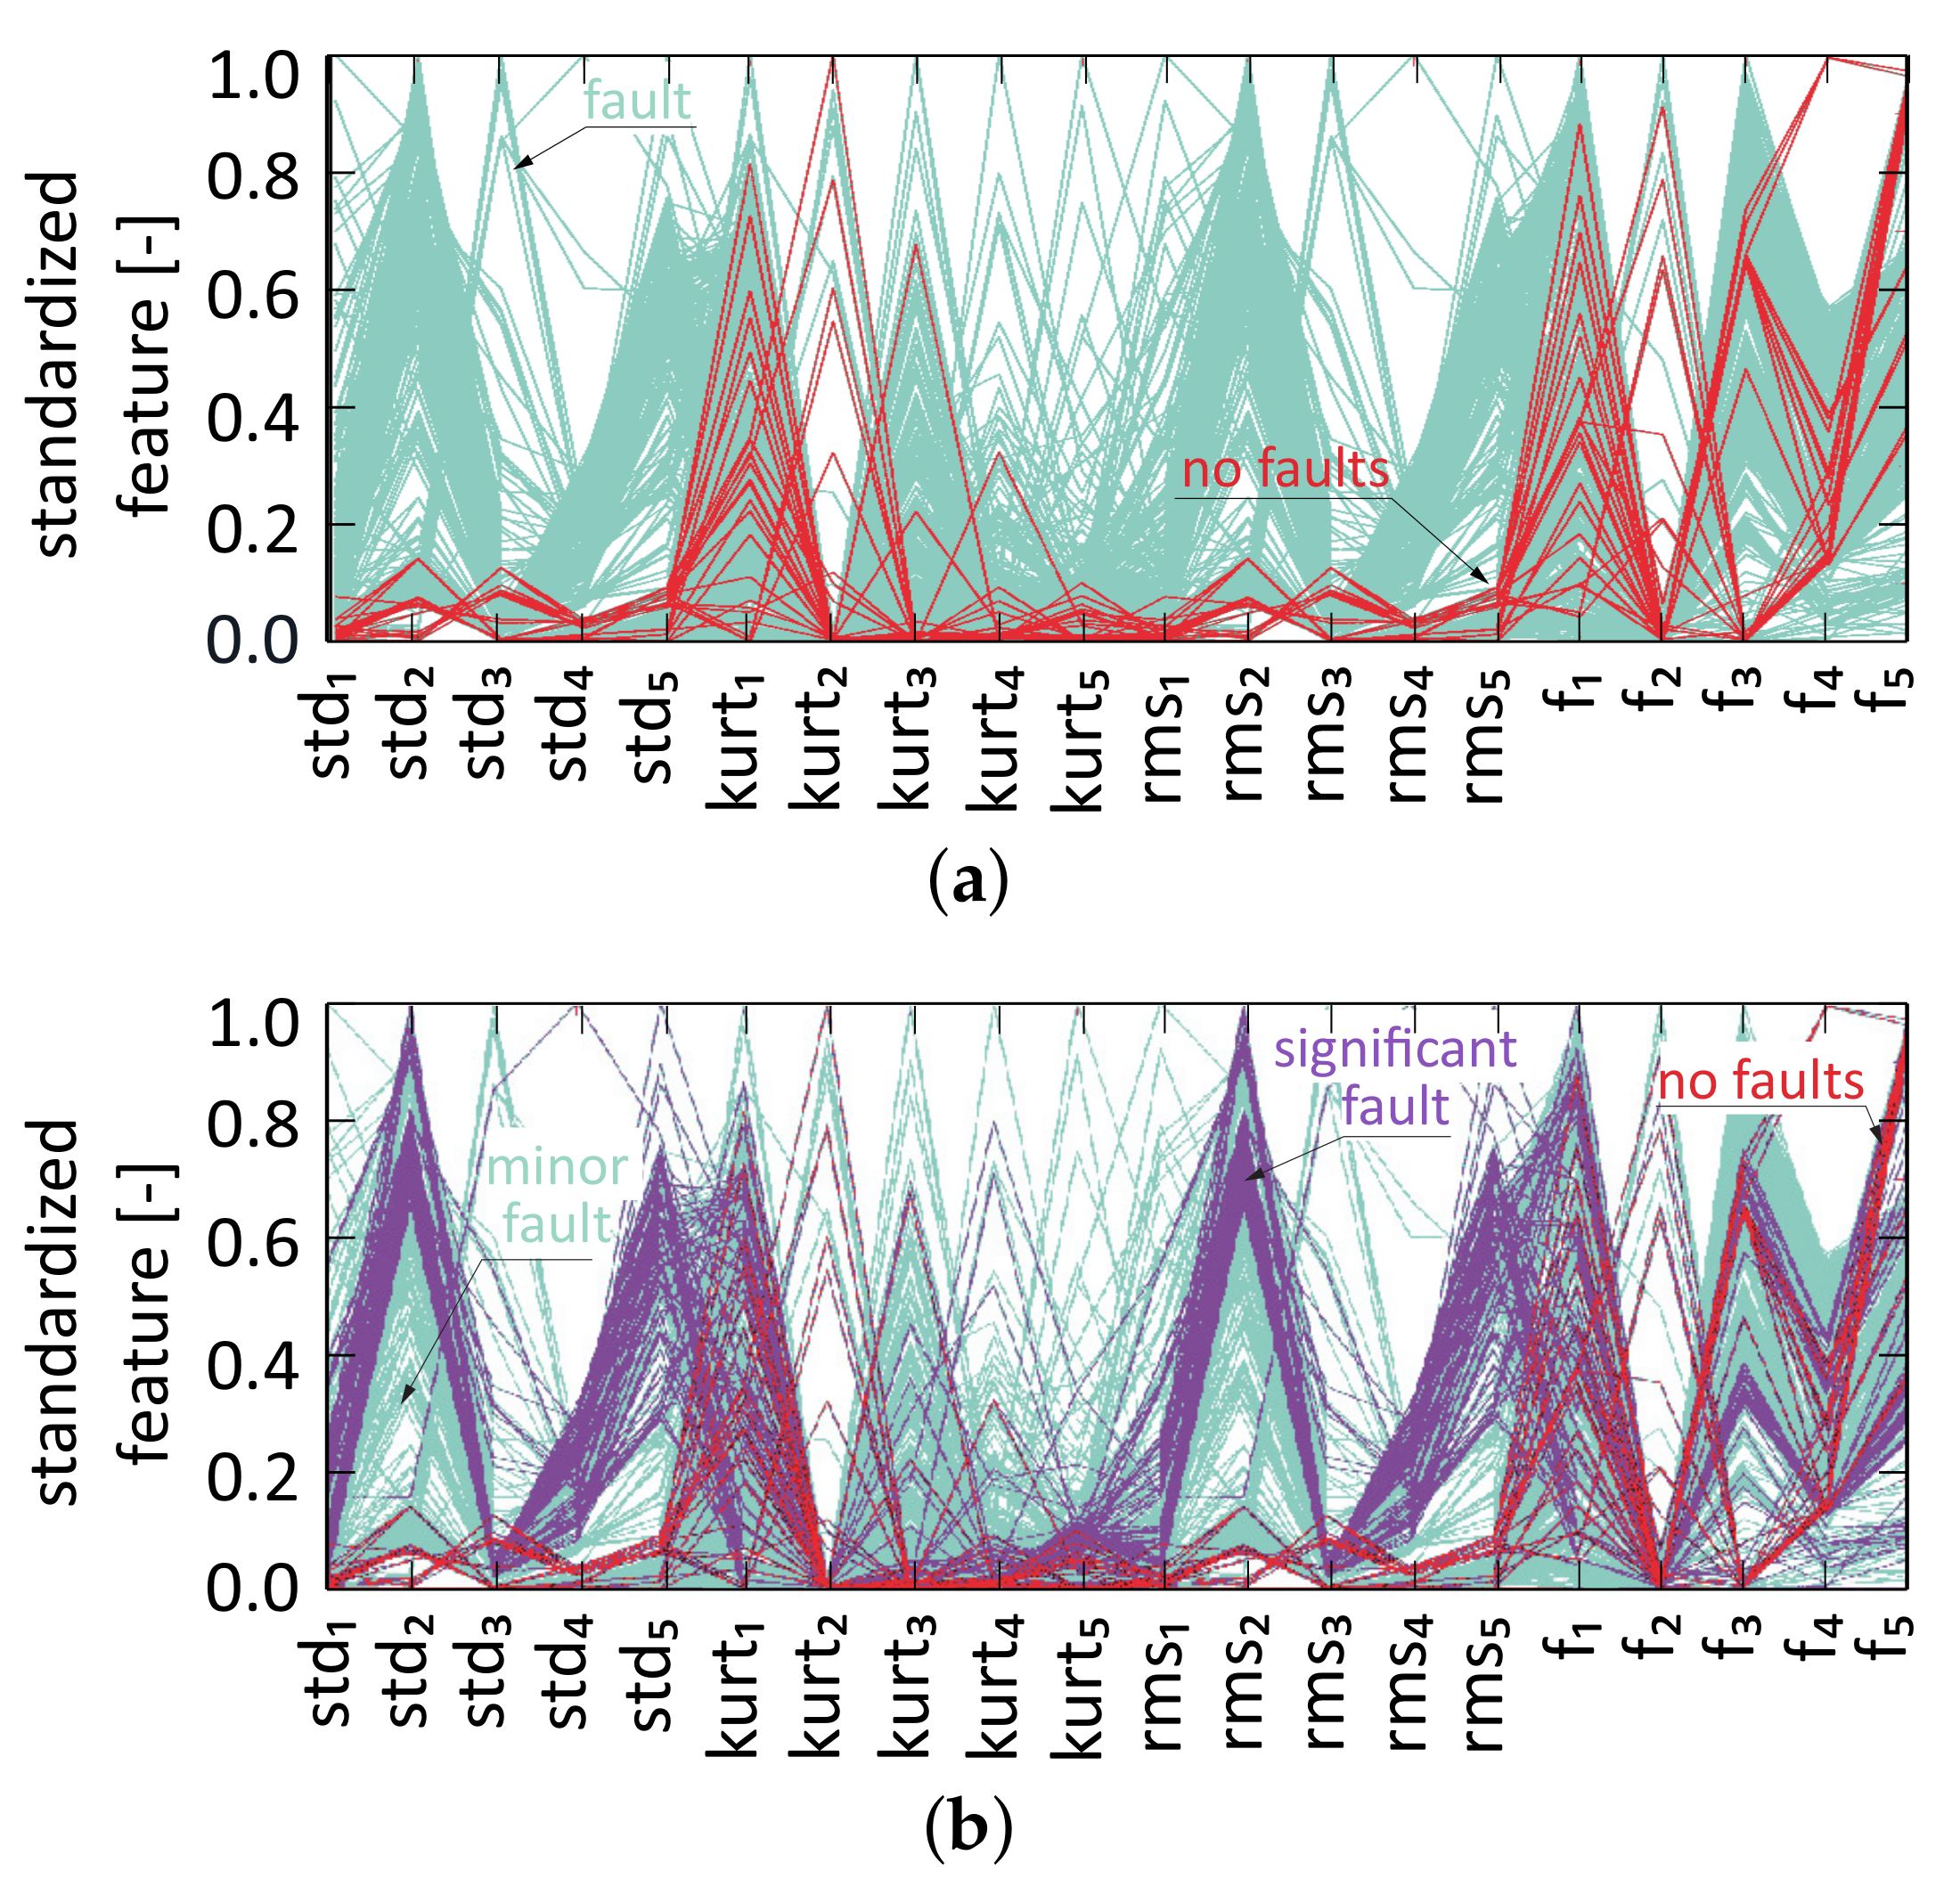
3. Dataset and Validation

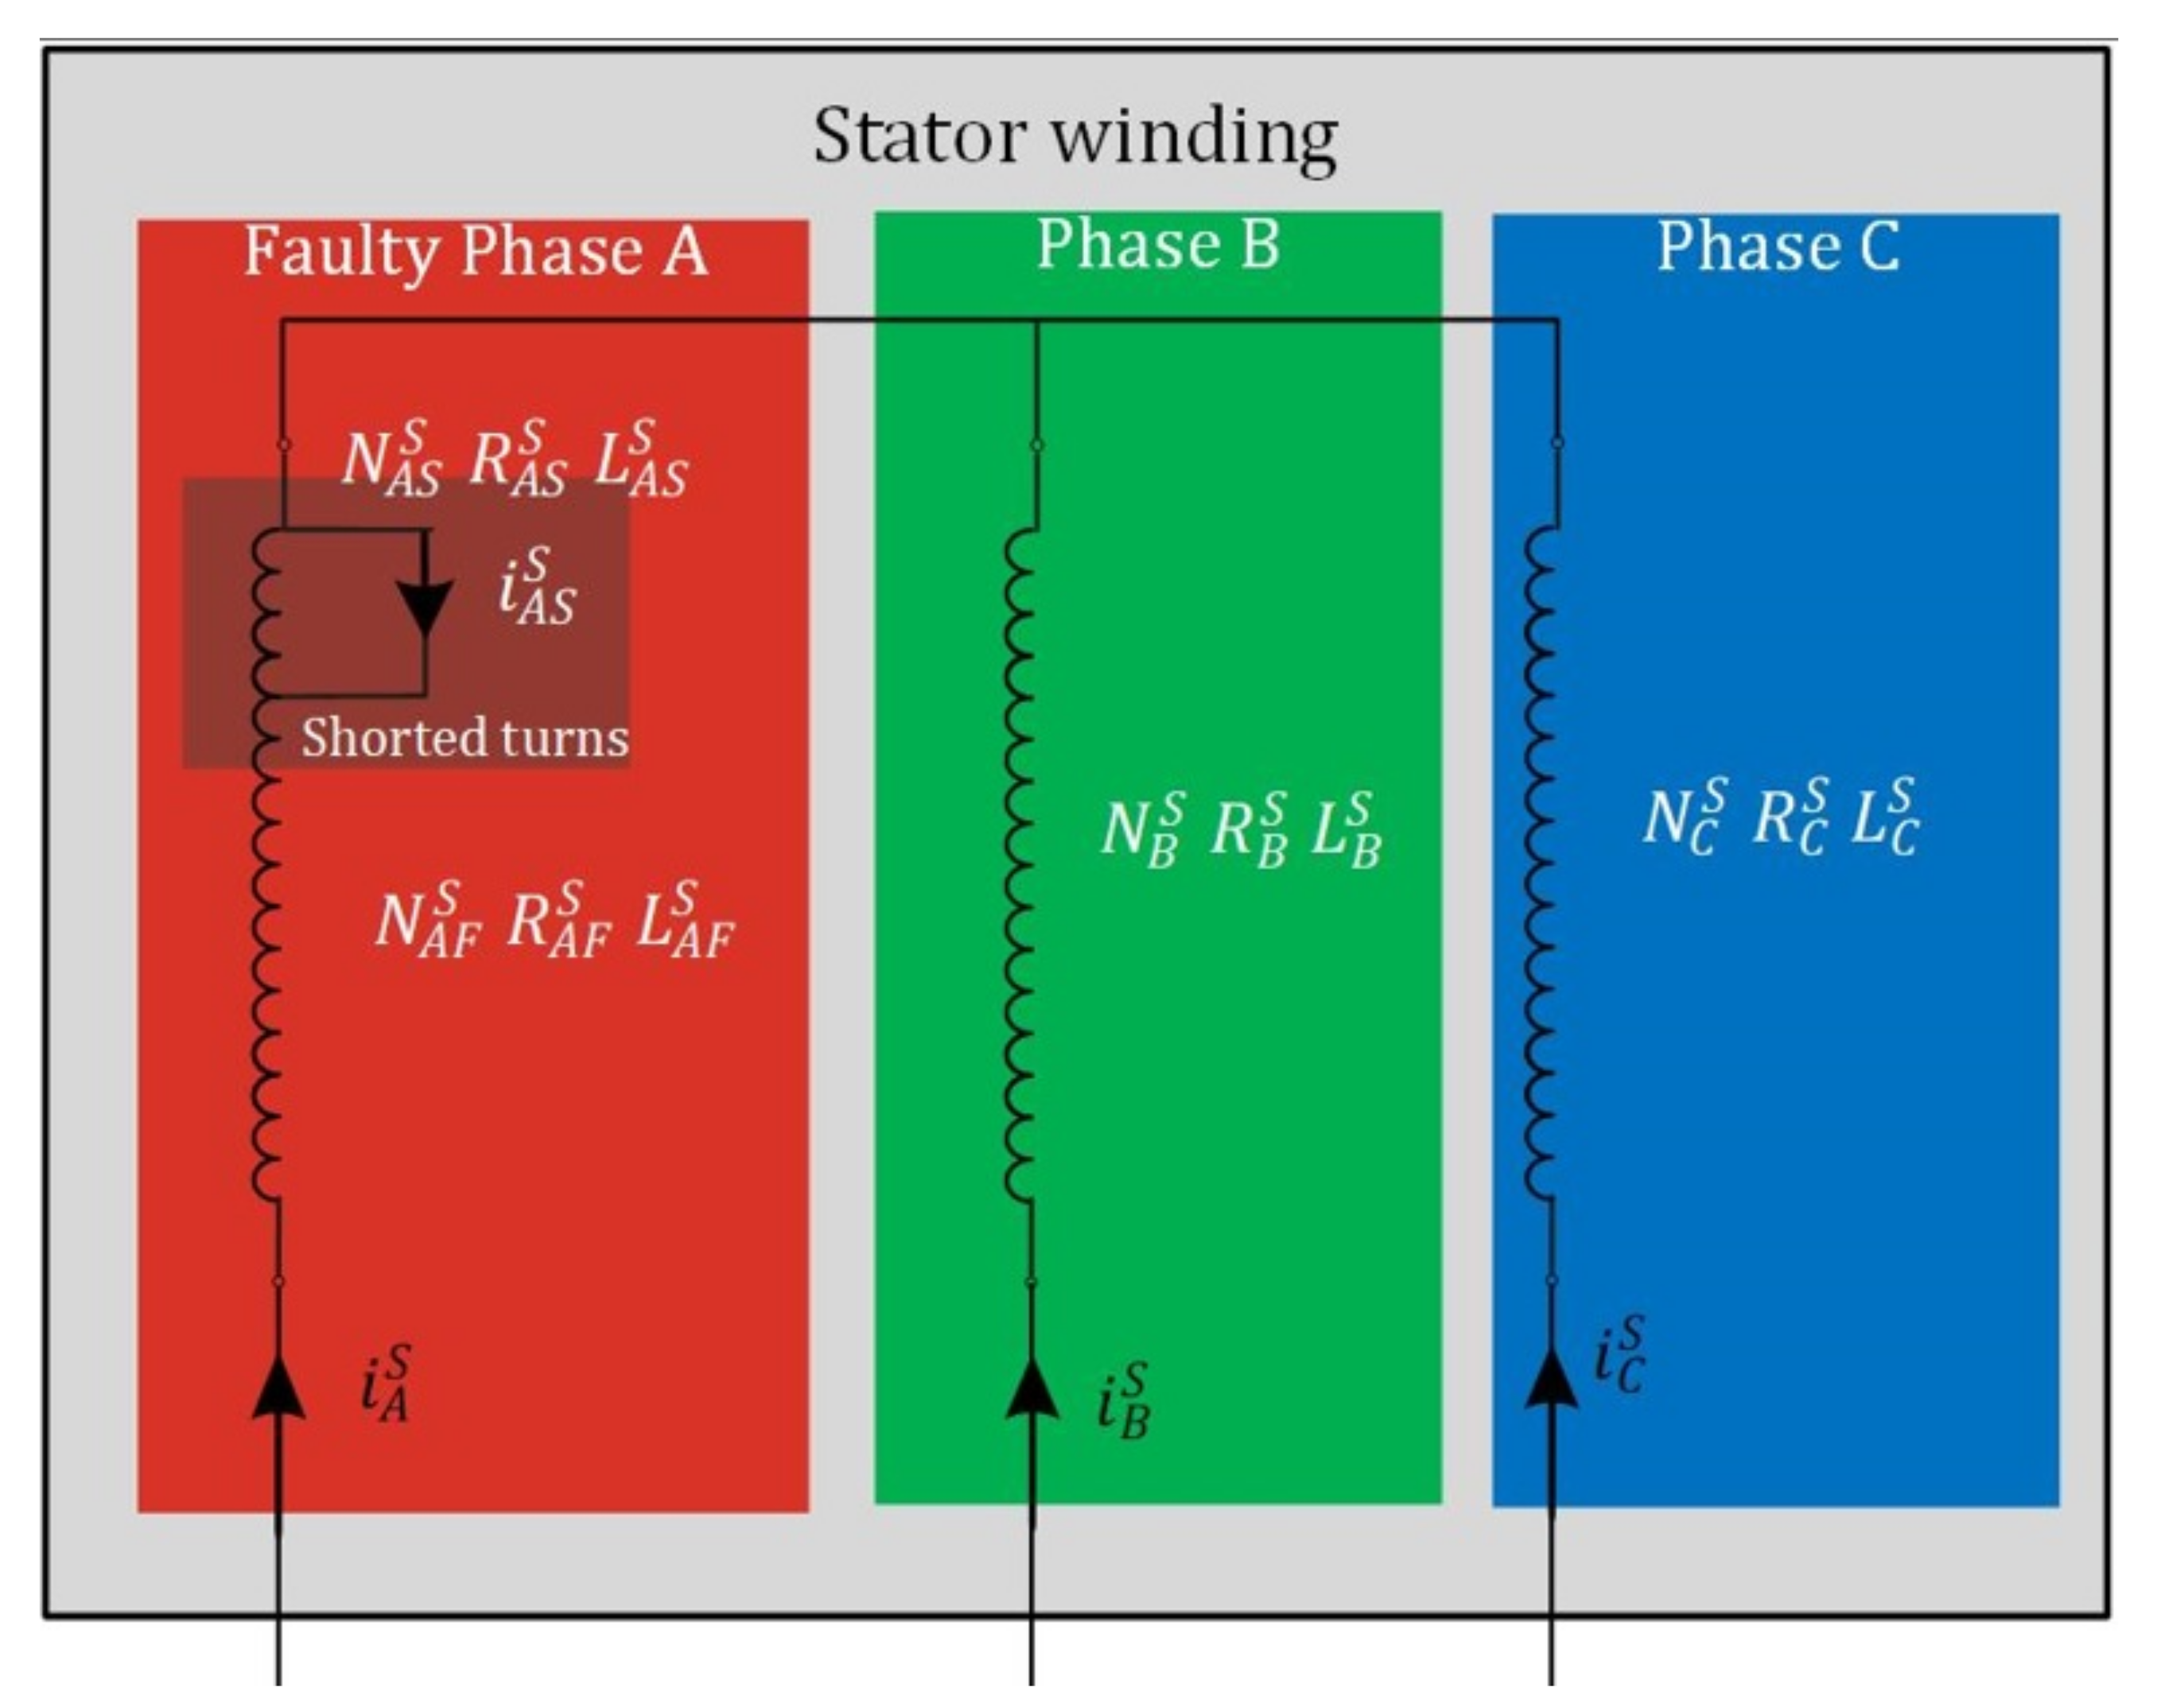
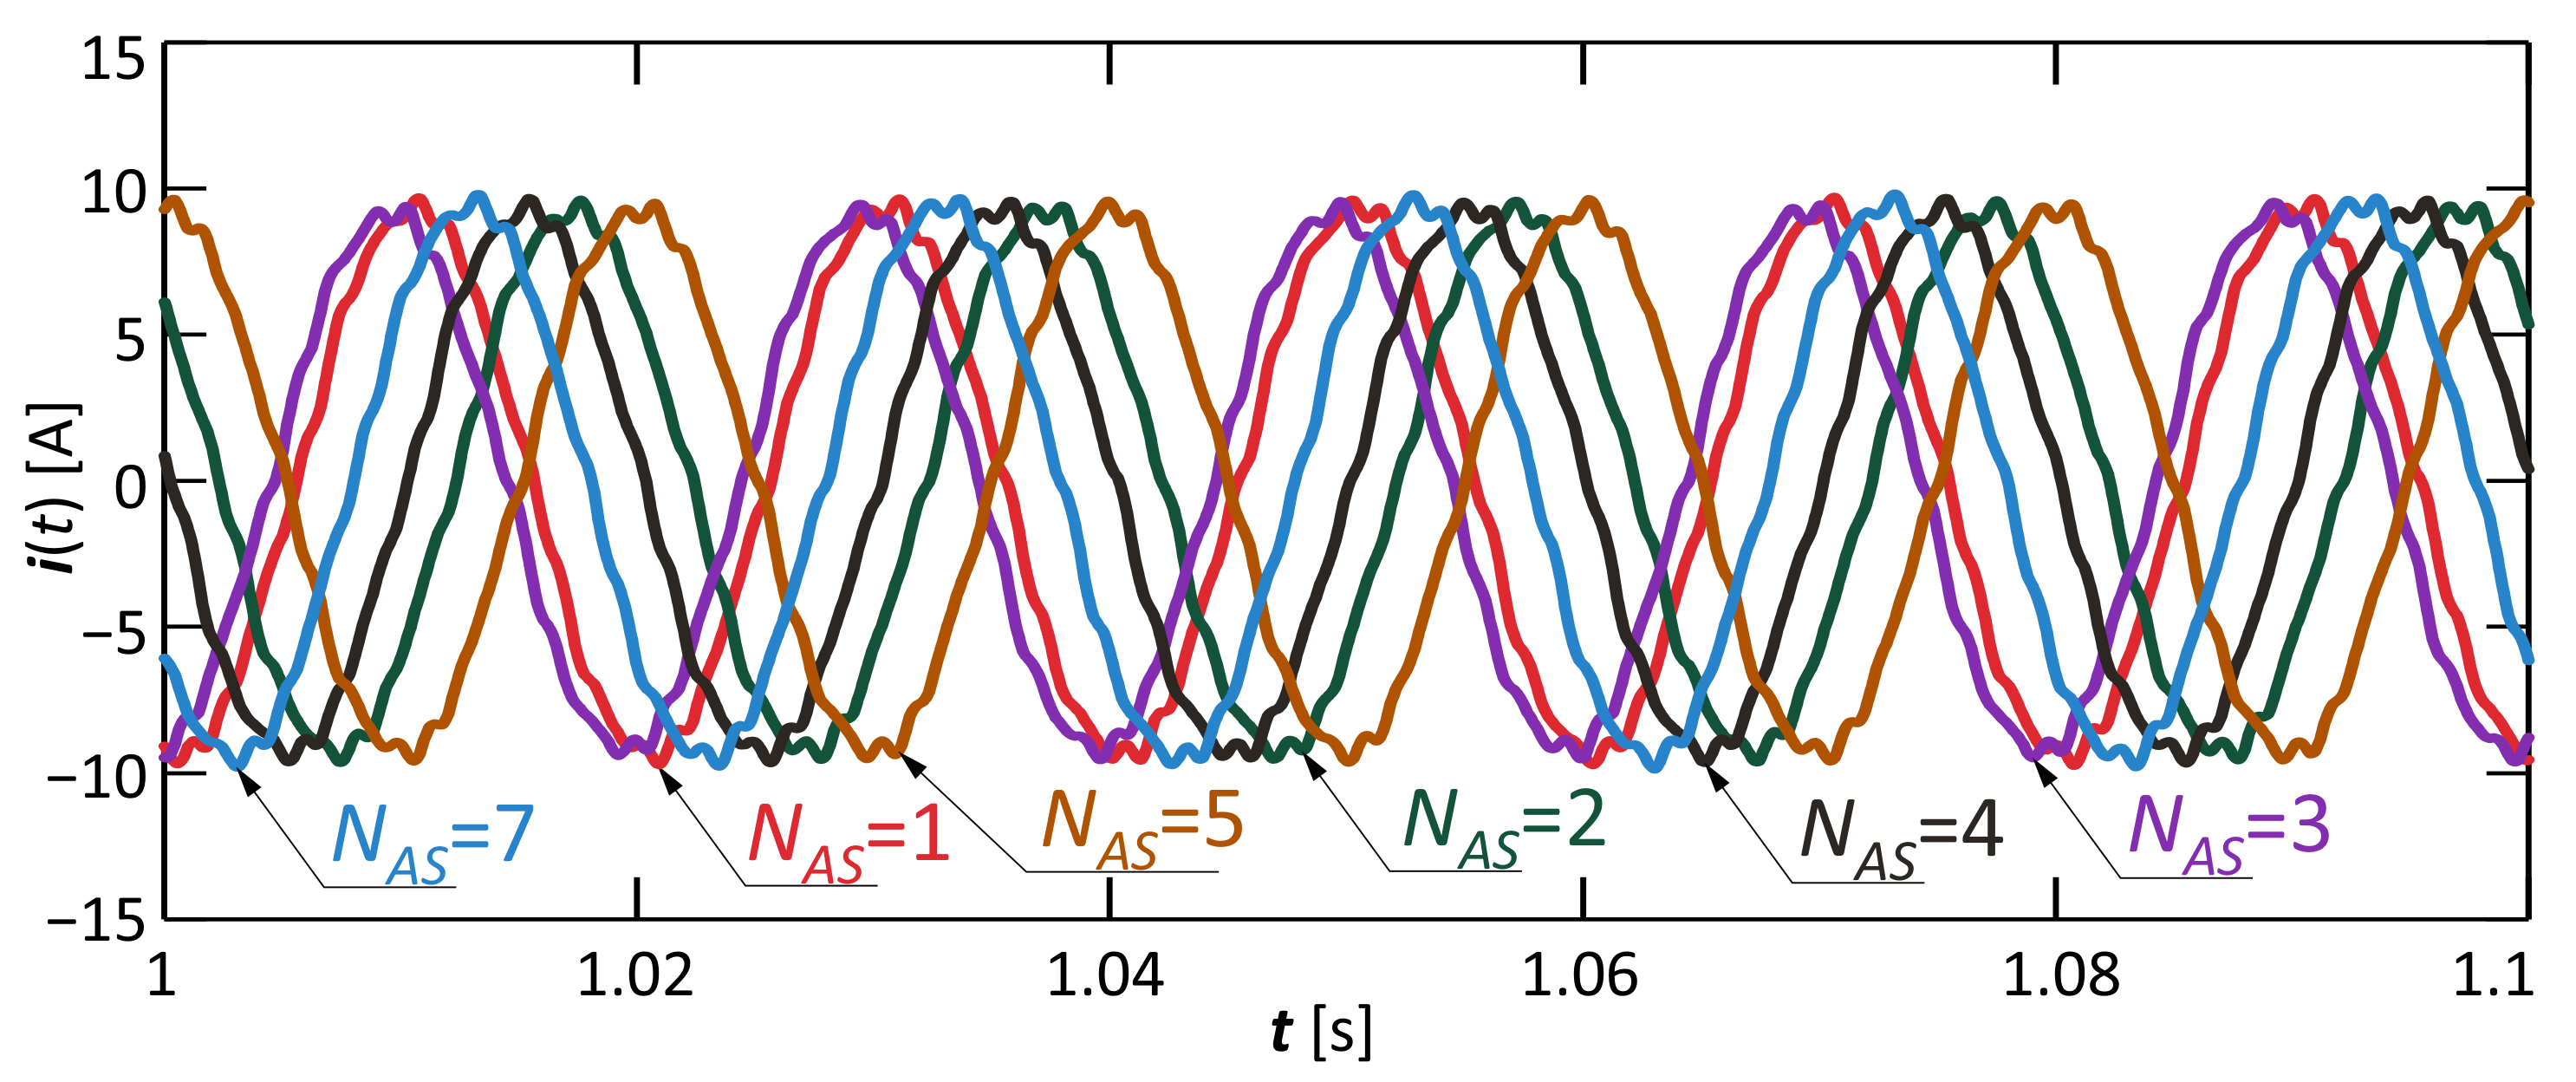
3.1. Dataset Obtained from Numerical Simulations

A Celma Indukta 3SIE100L4B field-circuit model was developed to obtain input for EBT. The motor has the following rated parameters: power 3 kW , voltage 400 V , current 6.3 A , frequency 50 Hz , speed 1465 rpm , torque 19.56 Nm and the following basic design data: number of stator slots is 36, number of rotor slots is 28. The stator winding is star-connected. The electric circuit of the model taking into account the short circuit in one phase of the stator is shown in Figure 6.
As shown in Figure 6, the occurrence of an inter-turn short-circuit divides the phase winding into two parts. The first one has short-circuited turns and the second one has undamaged turns.
A field-circuit model of the machine was developed based on geometric dimensions from data sheet, data on the materials used and rated parameters. The Finite Element Method (FEM) in the Maxwell environment was used in the calculations. Detailed information about the FEM model is included in Table 1. The developed field-circuit model allowed us to determine the current waveforms of the three phases of the induction motor. More information about the simulation and applied field model can be found in the paper [14].

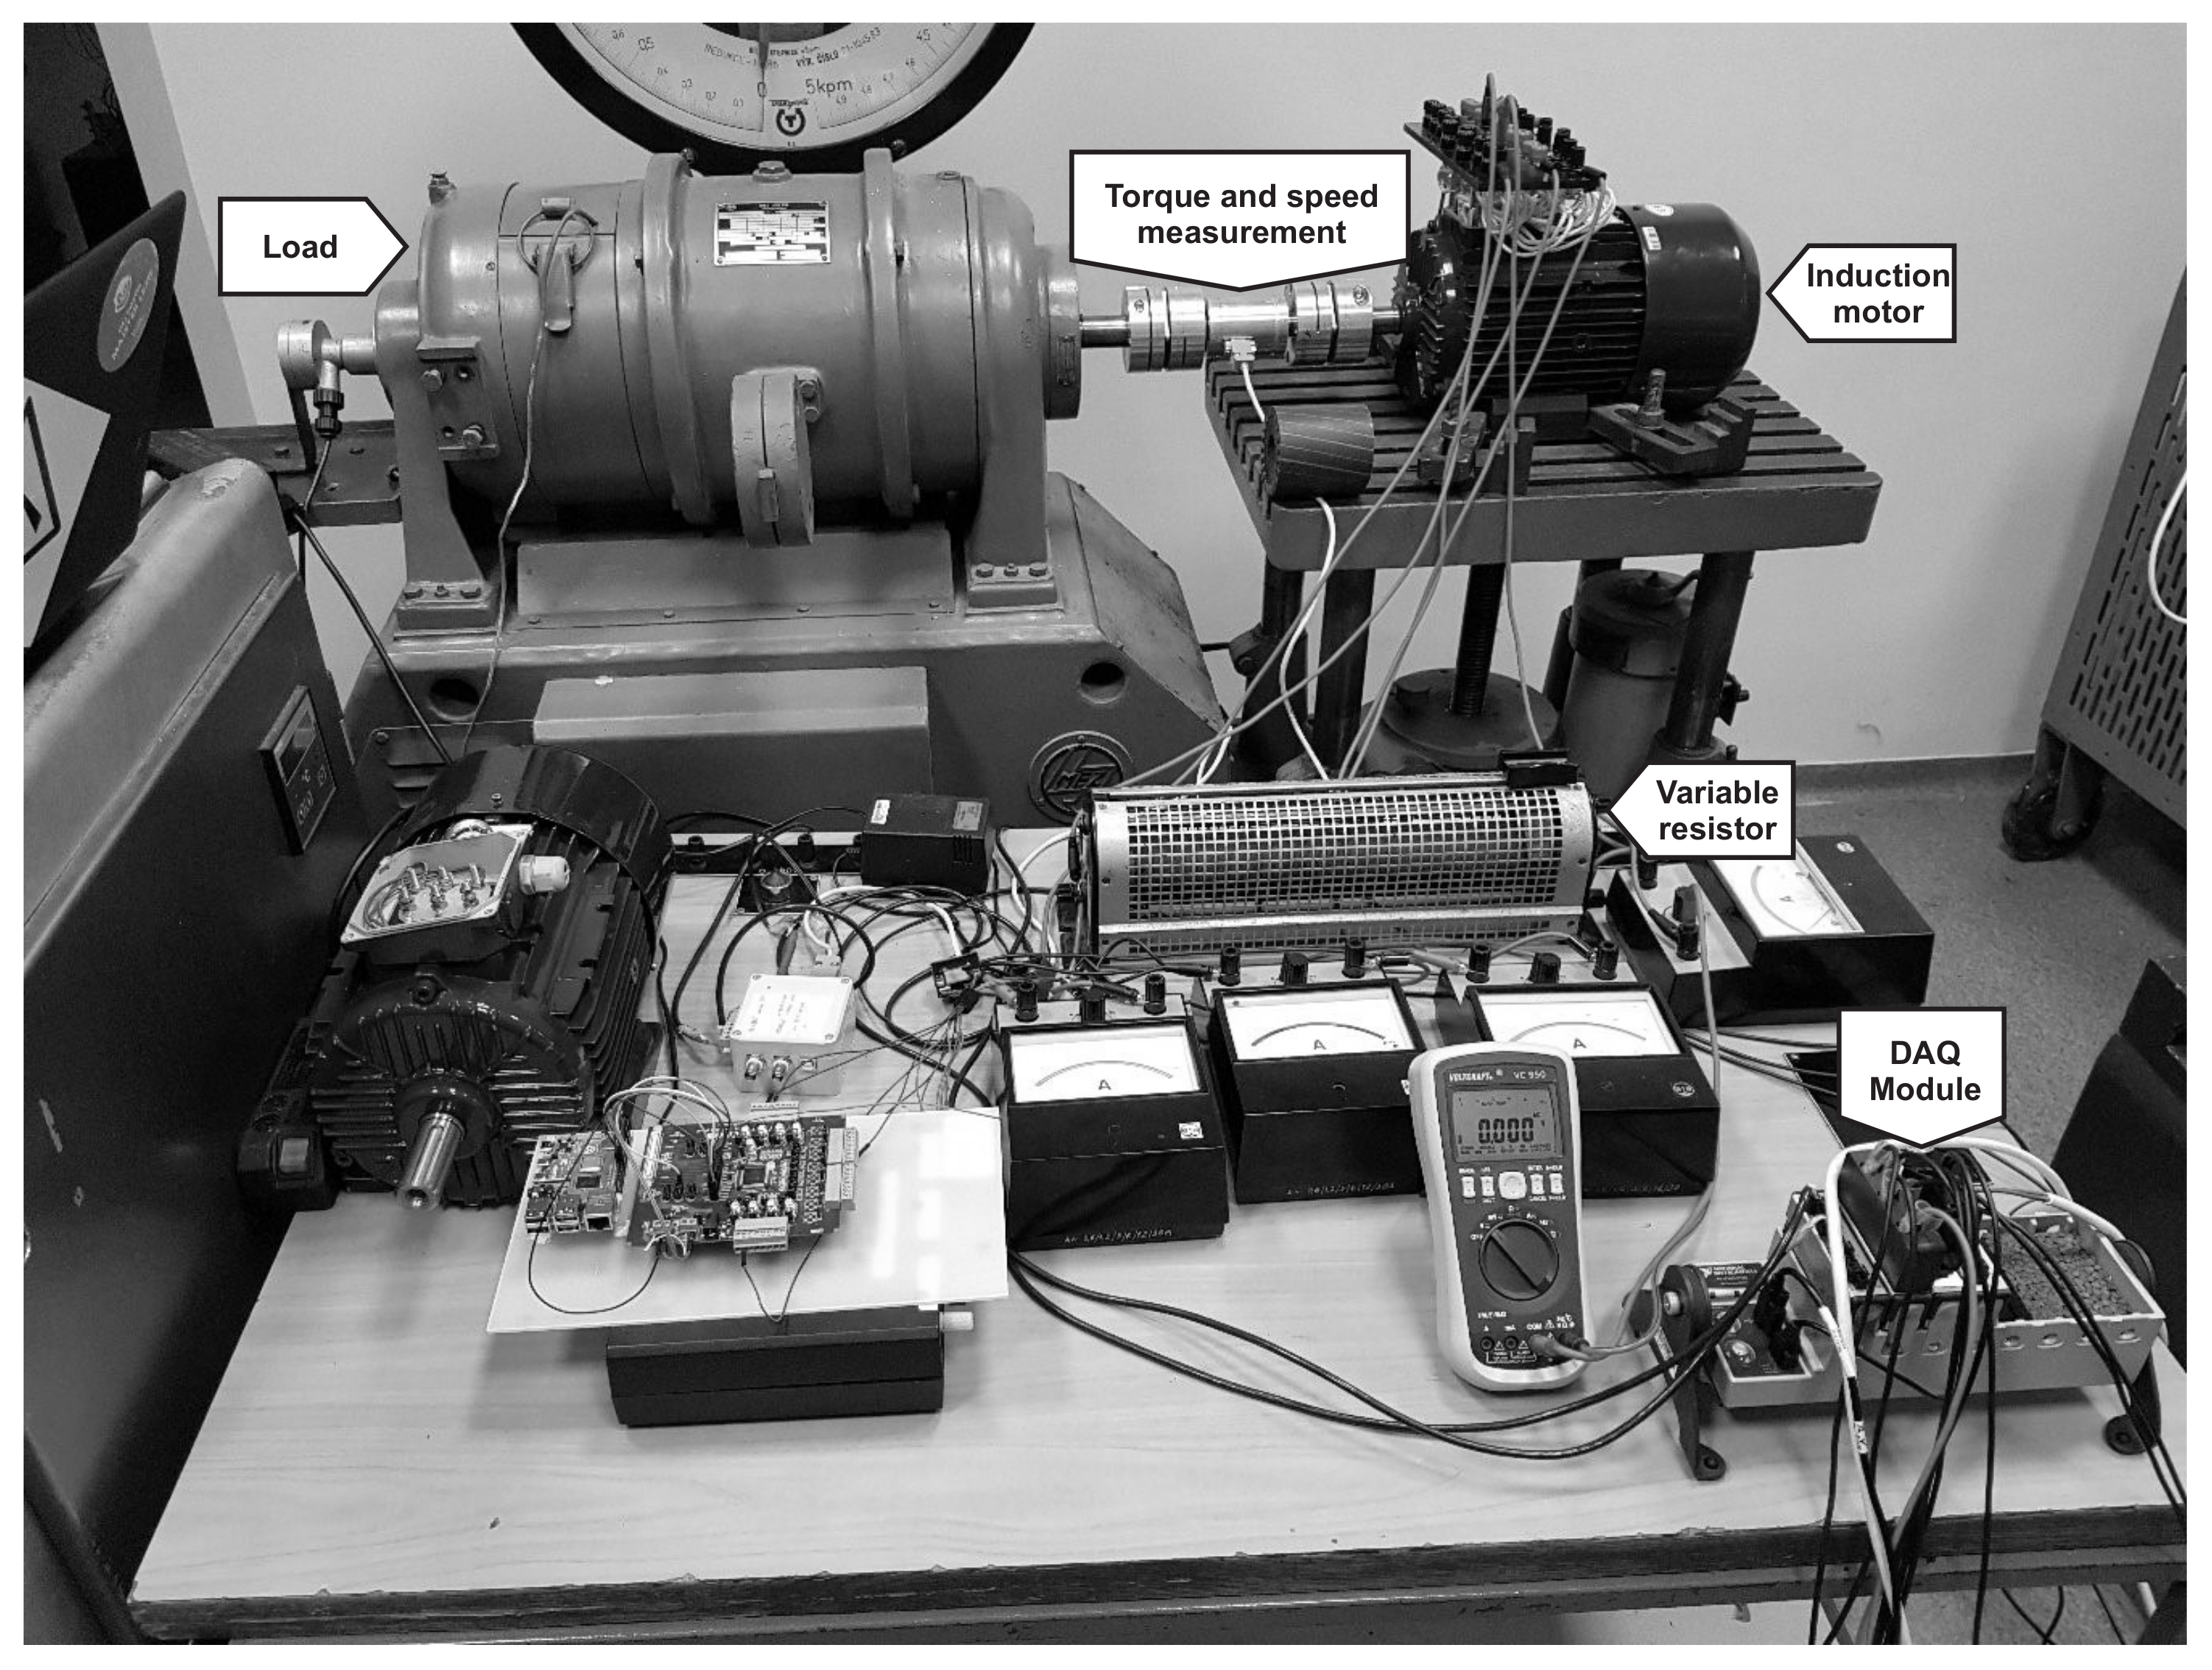
3.2. Dataset Obtained from Experimental Studies

In order to verify the elaborated field-circuit model of machine, stator current waveforms were measured on a laboratory stand. The tests used a motor with a specially prepared stator winding. The modification consisted in leading out the taps from the winding to the terminal board on the motor housing. Turning short circuits were reflected by appropriate connection of taps.
The diagram of the measuring system enabling the recording of the machine phase currents waveforms is shown in Figure 7. The measuring system consisted of the tested Celma Indukta 3SIE100L4B induction motor with led terminals enabling making inter-turn short-circuits, a resistor for setting the current limiting resistance in short circuits, an additional motor serving as a load, system for measuring torque and rotational speed, DAQ modules such as NI-9229, NI-9242, NI-9247 and a personal computer. Data archiving was performed with the LabView software. The use of DAQ modules allowed for the parallel measurement of currents and voltages in the three phases of the stator winding.
In the first part of the experimental tests, a set of current waveforms of healthy motor was obtained for various values of the load torque from 0 Nm to the rated value (19.56 Nm ). The tests were carried out for the motor powered by rated voltage. In the second part of the measurement tests, the current waveforms were obtained for the number of shorted turns from 1 to 9 step by 1 in phase A of stator winding. It is worth adding here that the number of turns per phase was 220 and the number of coils per phase was 4.
The appearance of an inter-turn short-circuit as a result of insulation degradation is a process that can be modeled with additional resistance in the shorted part of stator winding. The influence of this resistance on the operation of the motor can be observed when its value is not greater than the value of the phase winding resistance. The tests were carried out for the following resistance values R: 1 Ω , 3 Ω , 7 Ω . Selected measurement results of the current waveform for the additional resistance value R = 3 Ω in the shorted part of stator winding are shown in Figure 8.

3.3. Validation of the Proposed Approach to the Motor Winding Fault Diagnosis

In the research on the best Machine Learning (ML) model for the short-circuits detection problem in the motor were used:
  • Fine, Medium and Coarse Tree;
  • Linear, Quadratic, Cubic Support Vector Machine (SVM);
  • Fine, Medium, Coarse Gaussian Support Vector Machine (SVM);
  • Fine, Medium, Coarse, Cosine, Cubic and Weighted kNN;
  • Ensemble Bagged and RUSBoosted Trees;
  • Ensemble Subspace Discriminant;
  • Ensemble Subspace kNN.
Data from simulation (see Section 3.1) and from experimental studies (see Section 3.2) were used as test and validation data. Currents from individual phases of the motor were treated as a separate object. Thus, the test database consisted of 1239 current measurements, of which 237 current measurements are simulation data. The individual current measurements were performed for the motor with the short-circuits of 0 to 54 turns, and with the loaded external torque from equal zero to maximum acceptable value. Three Cases were considered in the research. In the Case I, the input data was assigned into two classes: undamaged motor and damaged motor with short-circuits of at least of one turn. In the Case II, the input data was assigned into three classes: undamaged motor, slightly damaged motor (short-circuits of 1 to 10 turns), significantly damaged motor (short-circuits of more turns). In the Case III, the input data was assigned into four classes: undamaged motor, slightly damaged motor (short-circuits of one to five turns), damaged motor (short-circuits of 6 to 10 turns), significantly damaged motor (short-circuits of more turns). The learning process of selected ML models with and without PCA was carried out for Case I-III. The 5-fold cross-validation was used to avoid overfitting on selected ML models. The assessment of selected ML models was performed using five metrics (accuracy, sensitivity, selectivity, precision and F1 score) for two classes, or two complex metrics (macro F1 and weight F1) for three and four classes. Consideration the individual metrics for the selected ML models allows to obtain more information about the quality of the model. The process of optimizing model hyperparameters with automatic search for the optimal version of each of the tested ML models for the used data set was implemented. In the process of hyperparameter optimization, a nested five-fold cross-validation was used to avoid a “skewed” assessment of a concrete model with specific hyperparameter values (the model would be evaluated with the same data as it was trained). Therefore, in nested cross-validation, the inner loop (inner cross-validation) was used to select the appropriate values of the hyperparameters of a given model, while the outer loop was used only to evaluate the performance of this model. Exhaustive search over specified parameter values for an estimator (GridSearchCV) was used in inner cross-validation.
The summaries of model assessment for Case I–III are shown in Table 2 and Table 3. The bold green font type indicates the highest ratings of selected ML models for a specific metric. On the basis of the carried out research, it can be concluded that the proposed EBT machine learning algorithm was characterized by the highest classification accuracy, considering all the basic selected metrics, i.e., accuracy, sensitivity, selectivity, precision, F1 score; and complex metrics in the case of multi-class classification, i.e., weight F1 and macro F1. The use of PCA in the proposed approach slightly reduced the classification accuracy, but allowed for a significant reduction the algorithm operating time by reducing the features on the basis of which the prediction was performed. When the PCA was not applied, then the prediction speed was estimated at approximately 2000 objects per second. When the PCA was applied, then the prediction speed was estimated at approximately 2600 objects per second. The use of PCA in the proposed approach allowed us to increase the prediction speed by about 30%. The research results presented in Table 3 show that the proposed approach allowed classification with high accuracy only up to three classes. A precise determination the number of turns, that have short-circuits, is currently unattainable by the proposed approach.

4. Conclusions

The presented approach allows to precisely (accuracy at the level of 96%) determine the occurrence of an inter-turn short-circuit in the stator winding of an induction motor at an early stage of their occurrence (a small number shorted turns). If the motor is damaged, the proposed approach precisly indicates the deegre of damage according to two classes, i.e., slightly damage (1 to 10 shorted turns), significantly damage (more than 10 shorted turns). The proposed algorithm classifies only on the basis of the sampled steady state current from any phase, allowing to continuously monitor the induction motor without switching off the device and thus without interrupting the technological process. The efficiency of the proposed approach is at the level of 2600 objects per second with the use of a medium-class personal computer, which allows for the implementation in diagnostic systems of large technological processes. However, that the accuracy of determining the degree of damage is at the level of 70–90%, so this accuracy is much lower than the accuracy of the classification between the state of no damage and the occurrence of a short-circuit. Continued increasing the number of classes, related to the possibility of precisely determining the degree of damage (number of shorted turns), results in a rapid decrease in accuracy for the proposed approach. Increasing the accuracy of precisely determining the degree of damage to an induction motor by modifying the feature extraction method [34] or by using prediction with the use of multilayer neural networks is an area of further research by the authors.

Author Contributions

All authors contributed in the preparation of this manuscript. Conceptualization, K.G., P.K. and W.P.; methodology, K.G., P.K. and W.P.; software, P.K.; validation, P.K.; formal analysis, P.K.; investigation, P.K.; resources, K.G., P.K. and W.P.; data curation, K.G., P.K. and W.P.; writing—original draft preparation, P.K.; funding acquisition, K.G. and P.K. All authors have read and agreed to the published version of the manuscript.

Funding

This research was supported by statutory funds of the Faculty of Control, Robotics and Electrical Engineering of the Poznan University of Technology.

Institutional Review Board Statement

Not applicable.

Informed Consent Statement

Not applicable.

Data Availability Statement

The data presented in this study are available on request from the corresponding author. The data are not publicly available due to University policy.

Conflicts of Interest

The authors declare no conflict of interest.

References

  1. Ojaghi, M.; Sabouri, M.; Faiz, J. Performance Analysis of Squirrel-Cage Induction Motors Under Broken Rotor Bar and Stator Inter-Turn Fault Conditions Using Analytical Modeling. IEEE Trans. Magn. 2018, 54, 1–5. [Google Scholar] [CrossRef]
  2. Saucedo-Dorantes, J.J.; Delgado-Prieto, M.; Osornio-Rios, R.A.; de Jesus Romero-Troncoso, R. Multifault Diagnosis Method Applied to an Electric Machine Based on High-Dimensional Feature Reduction. IEEE Trans. Ind. Appl. 2017, 53, 3086–3097. [Google Scholar] [CrossRef] [Green Version]
  3. Yang, T.; Pen, H.; Wang, Z.; Chang, C.S. Feature Knowledge Based Fault Detection of Induction Motors Through the Analysis of Stator Current Data. IEEE Trans. Instrum. Meas. 2016, 65, 549–558. [Google Scholar] [CrossRef]
  4. Ojaghi, M.; Aghmasheh, R.; Sabouri, M. Model-based exact technique to identify type and degree of eccentricity faults in induction motors. IET Electr. Power Appl. 2016, 10, 706–713. [Google Scholar] [CrossRef]
  5. Boudinar, A.H.; Benouzza, N.; Bendiabdellah, A.; Khodja, M. Induction Motor Bearing Fault Analysis Using a Root-MUSIC Method. IEEE Trans. Ind. Appl. 2016, 52, 3851–3860. [Google Scholar] [CrossRef]
  6. Abdallah, H.; Benatman, K. Stator winding inter-turn short-circuit detection in induction motors by parameter identification. IET Electr. Power Appl. 2017, 11, 272–288. [Google Scholar] [CrossRef]
  7. Surya, G.N.; Khan, Z.J.; Ballal, M.S.; Suryawanshi, H.M. A Simplified Frequency-Domain Detection of Stator Turn Fault in Squirrel-Cage Induction Motors Using an Observer Coil Technique. IEEE Trans. Ind. Electron. 2017, 64, 1495–1506. [Google Scholar] [CrossRef]
  8. Aswad, R.A.; Jassim, B.M. Open-circuit fault diagnosis in three-phase induction motor using model-based technique. Arch. Electr. Eng. 2020, 69, 815–827. [Google Scholar] [CrossRef]
  9. Dhamal, S.S.; Bhatkar, M.V. Modelling and Simulation of Three-Phase Induction Motor to Diagnose the Performance on Inter-Turn Short Circuit Fault in Stator Winding. In Proceedings of the 2018 International Conference on Computing, Power and Communication Technologies (GUCON), Greater Noida, India, 28–29 September 2018; pp. 1166–1172. [Google Scholar] [CrossRef]
  10. Berzoy, A.; Mohamed, A.A.S.; Mohammed, O. Impact of Inter-Turn Short-Circuit Location on Induction Machines Parameters Through FE Computations. IEEE Trans. Magn. 2017, 53, 1–4. [Google Scholar] [CrossRef]
  11. Zouzou, S.E.; Sahraoui, M.; Ghoggal, A.; Guedidi, S. Detection of inter-turn short-circuit and broken rotor bars in induction motors using the Partial Relative Indexes: Application on the MCSA. In Proceedings of the XIX International Conference on Electrical Machines (ICEM 2010), Rome, Italy, 6–8 September 2010; pp. 1–6. [Google Scholar] [CrossRef]
  12. Ojaghi, M.; Mohammadi, M. Unified Modeling Technique for Axially Uniform and Nonuniform Eccentricity Faults in Three-Phase Squirrel Cage Induction Motors. IEEE Trans. Ind. Electron. 2018, 65, 5292–5301. [Google Scholar] [CrossRef]
  13. Berzoy, A.; Mohamed, A.A.S.; Mohammed, O. Complex-Vector Model of Interturn Failure in Induction Machines for Fault Detection and Identification. IEEE Trans. Ind. Appl. 2017, 53, 2667–2678. [Google Scholar] [CrossRef]
  14. Pietrowski, W.; Gorny, K. Analysis of Torque Ripples of an Induction Motor Taking into Account a Inter-Turn Short-Circuit in a Stator Winding. Energies 2020, 13, 3626. [Google Scholar] [CrossRef]
  15. Dorrell, D.G.; Makhoba, K. Detection of inter-turn stator faults in induction motors using short term averaging of forwards and backwards rotating stator current phasors for fast prognostics. In Proceedings of the 2017 IEEE International Magnetics Conference (INTERMAG), Dublin, Ireland, 24–28 April 2017; pp. 1–2. [Google Scholar] [CrossRef]
  16. Rangel–Magdaleno, J.; Peregrina–Barreto, H.; Ramirez–Cortes, J.; Morales–Caporal, R.; Cruz–Vega, I. Vibration Analysis of Partially Damaged Rotor Bar in Induction Motor under Different Load Condition Using DWT. Shock Vib. 2016, 2016, 3530464. [Google Scholar] [CrossRef]
  17. Gyftakis, K.N.; Marques Cardoso, A.J. Reliable Detection of Stator Inter-Turn Faults of Very Low Severity Level in Induction Motors. IEEE Trans. Ind. Electron. 2021, 68, 3475–3484. [Google Scholar] [CrossRef]
  18. Elbouchikhi, E.; Amirat, Y.; Feld, G.; Benbouzid, M. Generalized Likelihood Ratio Test Based Approach for Stator-Fault Detection in a PWM Inverter-Fed Induction Motor Drive. IEEE Trans. Ind. Electron. 2019, 66, 6343–6353. [Google Scholar] [CrossRef]
  19. Soufi, Y.; Bahi, T.; Harkat, M.F.; Merabet, H. Diagnosis and Detection of Short-Circuit in a Three-Phase Induction Machine. In Proceedings of the 2009 Second International Conference on Computer and Electrical Engineering, Dubai, United Arab Emirates, 28–30 December 2009; Volume 2, pp. 347–351. [Google Scholar] [CrossRef]
  20. Bouchareb, C.; Nait-Said, M.S. PMSM Model with Phase-to-Phase Short-Circuit and Diagnosis by ESA and EPVA. Adv. Electr. Electron. Eng. 2016, 14, 522–530. [Google Scholar] [CrossRef]
  21. Pietrowski, W.; Gorny, K. Detection of inter-turn short-circuit at start-up of induction machine based on torque analysis. Open Phys. 2017, 15, 851–856. [Google Scholar] [CrossRef] [Green Version]
  22. Fireteanu, V. Detection of the Short-Circuit Faults in the Stator Winding of Induction Motors based on Harmonics of the Neighboring Magnetic Field. J. Phys. Conf. Ser. 2013, 450, 012021. [Google Scholar] [CrossRef]
  23. Wang, B.; Wang, J.; Griffo, A.; Sen, B. Stator Turn Fault Detection by Second Harmonic in Instantaneous Power for a Triple-Redundant Fault-Tolerant PM Drive. IEEE Trans. Ind. Electron. 2018, 65, 7279–7289. [Google Scholar] [CrossRef] [Green Version]
  24. Skowron, M.; Wolkiewicz, M.; Orlowska-Kowalska, T.; Kowalski, C.T. Effectiveness of Selected Neural Network Structures Based on Axial Flux Analysis in Stator and Rotor Winding Incipient Fault Detection of Inverter-fed Induction Motors. Energies 2019, 12, 2392. [Google Scholar] [CrossRef] [Green Version]
  25. Dash, R.N.; Subudhi, B. Stator inter-turn fault detection of an induction motor using neuro-fuzzy techniques. Arch. Control Sci. 2010, 20, 363–376. [Google Scholar] [CrossRef] [Green Version]
  26. Mohammed, A.; Melecio, J.I.; Djurovic, S. Stator Winding Fault Thermal Signature Monitoring and Analysis by In Situ FBG Sensors. IEEE Trans. Ind. Electron. 2019, 66, 8082–8092. [Google Scholar] [CrossRef]
  27. Baranski, M. FE analysis of coupled electromagnetic-thermal phenomena in the squirrel cage motor working at high ambient temperature. COMPEL Int. J. Comput. Math. Electr. Electron. Eng. 2019, 38, 1120–1132. [Google Scholar] [CrossRef]
  28. Skowron, M.; Orlowska-Kowalska, T.; Wolkiewicz, M.; Kowalski, C.T. Convolutional Neural Network-Based Stator Current Data-Driven Incipient Stator Fault Diagnosis of Inverter-Fed Induction Motor. Energies 2020, 13, 1475. [Google Scholar] [CrossRef] [Green Version]
  29. Nakamura, H.; Mizuno, Y. Method for Diagnosing a Short-Circuit Fault in the Stator Winding of a Motor Based on Parameter Identification of Features and a Support Vector Machine. Energies 2020, 13, 2272. [Google Scholar] [CrossRef]
  30. Kuwalek, P.; Burlaga, B.; Jesko, W.; Konieczka, P. Research on methods for detecting respiratory rate from photoplethysmographic signal. Biomed. Signal Process. Control 2021, 66, 102483. [Google Scholar] [CrossRef]
  31. Hu, Y.; Li, F.; Li, H.G.; Liu, C. An enhanced empirical wavelet transform for noisy and non-stationary signal processing. Dig. Signal Process. 2017, 60, 220–229. [Google Scholar] [CrossRef]
  32. Kuwalek, P. Estimation of Parameters Associated with Individual Sources of Voltage Fluctuations. IEEE Trans. Power Deliv. 2020, 36, 351–361. [Google Scholar] [CrossRef]
  33. Gilles, J. Empirical Wavelet Transform. IEEE Trans. Signal Process. 2013, 61, 3999–4010. [Google Scholar] [CrossRef]
  34. Kuwalek, P. AM Modulation Signal Estimation Allowing Further Research on Sources of Voltage Fluctuations. IEEE Trans. Ind. Electron. 2020, 67, 6937–6945. [Google Scholar] [CrossRef]
Figure 1. The block diagram of the proposed approach of detecting motor windings fault.
Energies 14 02510 g001
Figure 2. Block diagram showing the EEWT algorithm [32].
Energies 14 02510 g002
Figure 3. The current waveform of (a) undamaged motor and motor with short-circuits of at least one turn, both motors loaded with the same torque; (b) undamaged motor and motor with short-circuits of at least one turn, where the undamaged motor is loaded with a greater torque than the damaged motor.
Energies 14 02510 g003
Figure 4. The determined features for the component signals of the current of (a) undamaged motor and motor with short-circuits of at least one turn, both motors loaded with the same torque; (b) undamaged motor and motor with short-circuits of at least one turn, where the undamaged motor is loaded with a greater torque than the damaged motor.
Energies 14 02510 g004
Figure 5. Parallel coordinates plots for extracted features for: (a) two classes, i.e., no faults (black line) and fault (gray line); (b) three classes, i.e., no faults (black line), minor fault—the short-circuits of 1 to 10 turns (light gray line), significant fault—the short-circuits of more turns (dark gray line).
Energies 14 02510 g005
Figure 6. Equivalent diagram of the stator winding with taking into account the inter-turn short-circuit.
Energies 14 02510 g006
Figure 7. The measurement stand for signal acquisition from the physical object.
Energies 14 02510 g007
Figure 8. Selected measurement results of the current waveform for the additional resistance value R = 3 Ω in the shorted part of stator winding, where N A S is the number of short-circuits.
Energies 14 02510 g008
Table 1. Parameters of the FEM model.
Num ElementsMin Edge LengthMax Edge LengthRMS Edge LengthMin Elem. AreaMax Elem. AreaMean Elem. Area
Band6270.0001250.001970.000854 14.9 × 10 9 0.159 × 10 6 68.3 × 10 9
Shaft960.003120.006130.00459 5.94 × 10 6 0.146 × 10 6 8.32 × 10 6
Outer Region17370.0001250.005890.00217 22.48 × 10 9 4.86 × 10 6 1.09 × 10 6
Stator21610.0004080.006150.00327 0.204 × 10 6 0.15 × 10 6 3.9 × 10 6
Coil330.0008970.00340.00239 0.935 × 10 6 3.15 × 10 6 2.04 × 10 6
Rotor63000.0002730.005820.00141 48.1 × 10 9 0.103 × 10 6 0.794 × 10 6
Bar4530.0002730.0006990.000499 46 × 10 9 0.182 × 10 6 0.106 × 10 6
Bar Separate4990.0002730.0006990.000473 46 × 10 9 0.182 × 10 6 96.4 × 10 9
Coil Shorted70.00080.0020.001194 0.4 × 10 6 1 × 10 6 0.571 × 10 6
Table 2. Summary of model assessments for Case I (two classes—undamaged and damaged motor).
MethodPCA Not AppliedPCA Applied
AccuracySensitivitySelectivityPrecisionF1 ScoreAccuracySensitivitySelectivityPrecisionF1 Score
Fine Tree98.795.899.195.894.598.697.298.897.294.3
Medium Tree98.795.899.195.894.598.697.298.897.294.3
Coarse Tree98.493.899.093.893.195.268.898.668.876.7
Linear SVM95.691.796.291.783.088.40.0100.00.00.0
Quadratic SVM98.095.898.395.891.789.37.6100.07.614.2
Cubic SVM98.794.499.394.494.491.331.399.231.345.5
Fine Gaussian SVM97.985.499.585.490.489.711.8100.011.821.1
Medium Gaussian SVM95.890.396.590.383.389.37.6100.07.614.2
Coarse Gaussian SVM89.011.199.311.119.088.40.0100.00.00.0
Fine kNN91.028.599.228.542.391.329.299.529.243.8
Medium kNN96.991.797.591.787.198.093.198.693.191.5
Coarse kNN89.729.297.629.239.689.756.994.056.956.2
Cosine kNN96.991.797.591.787.197.193.197.693.188.2
Cubic kNN96.991.097.691.087.097.993.198.593.191.2
Weighted kNN98.094.498.494.491.699.097.299.397.295.9
Ensemble Bagged Trees99.196.599.596.596.299.097.299.397.295.9
Ensemble Subspace Discriminant92.561.896.561.865.788.62.1100.02.14.1
Ensemble Subspace kNN91.327.899.627.842.690.228.598.328.540.2
Ensemble RUSBoosted Trees98.197.298.397.292.498.897.299.097.294.9
Table 3. Summary of model assessments for Case II (three classes—undamaged, slightly damaged and significantly damaged motor) and for Case III (four classes—undamaged, slightly damaged, damaged and significantly damaged motor).
Case IICase III
MethodPCA Not AppliedPCA AppliedPCA Not AppliedPCA Applied
weight F1Macro F1Weight F1Macro F1Weight F1Macro F1Weight F1Macro F1
Fine Tree95.686.393.073.170.170.863.360.0
Medium Tree95.285.392.973.768.467.163.453.2
Coarse Tree91.567.987.356.464.353.657.343.0
Linear SVM92.880.675.730.366.364.543.019.4
Quadratic SVM95.987.877.838.667.365.343.934.0
Cubic SVM96.188.676.243.854.562.935.928.9
Fine Gaussian SVM93.075.283.549.762.456.156.742.4
Medium Gaussian SVM91.876.177.534.864.961.045.223.4
Coarse Gaussian SVM81.544.475.730.360.043.351.118.2
Fine kNN86.453.486.454.459.046.854.541.3
Medium kNN92.977.991.367.664.560.161.754.4
Coarse kNN80.843.782.948.554.336.253.034.9
Cosine kNN92.275.790.968.364.359.161.453.4
Cubic kNN92.475.291.769.964.058.461.454.2
Weighted kNN94.682.792.573.867.165.662.858.1
Ensemble Bagged Trees96.889.693.575.372.573.163.960.7
Ensemble Subspace Discriminant86.270.277.233.955.849.644.222.9
Ensemble Subspace kNN86.151.585.749.359.745.254.438.3
Ensemble RUSBoosted Trees93.282.889.275.166.867.056.956.5
Publisher’s Note: MDPI stays neutral with regard to jurisdictional claims in published maps and institutional affiliations.

