1. Introduction
With the South Korean government recently announcing the Korean New Deal Plan as a response to the recession caused by COVID-19, interest in renewable energy infrastructure is increasing. Among the 10 projects that are part of this plan, the focus of the architectural field is the construction of green smart schools, which are eco-friendly and future educational spaces, around the country. Another architectural field of interest is green remodeling, which is aimed at improving the energy performance of buildings through the retroactive installation of solar panels and eco-friendly insulation in public buildings [
1].
Since the 2020 Paris Climate Agreement was ratified, globally, there has been a significant increase in interest in renewable energy, and several related studies have been conducted in this regard [
2]. According to the Intergovernmental Panel on Climate Change (IPCC), the temperature of the Earth has increased by 1 °C owing to industrialization beginning in the 1900s, and between 2030 and 2052, an additional increase of 1.5 °C is expected. Therefore, if carbon emission reduction measures are not implemented immediately through aggressive and preemptive measures, increases in global temperatures by an additional 5–6 °C in the future can be expected, and to appropriately address such an increase in temperature, ~5–20% of the global GDP will be required [
3,
4].
Since the Korean government increased the target for building sector-related greenhouse gas (GHG) emission reduction from 18.1% to 32.7% compared to the business-as -usual conditions following the Paris Climate Change Convention, the drive to conserve energy in the building sector and develop technologies that improve energy efficiency is increasing. Considering that the building sector-related energy consumption represents ~40% of the total energy consumed in most Organization for Economic Cooperation and Development (OECD) member countries, it is expected that energy consumption reduction in this regard will have a significant ripple effect [
5]. Further, to adequately reduce GHG emissions, in addition to decreasing energy consumption, a shift from the use of existing fossil fuel energy sources to the use of renewables is required [
6]. In Korea, industry-led investments in solar and wind power production are on the rise, and it is expected that by 2050, half of the energy consumed globally will be sourced from these two renewable resources [
7].
Further, in Korea, economic and industrial expansion have led to the development of the architectural and urban environment. However, interest in educational facilities remained low as faculty expansion was prioritized owing to the increase in the number of students that was observed in the 1970s and 1980s; thus, in the architectural field, retroactive improvement measures for old educational facilities have emerged as an important focal point [
8]. Among school buildings in Korea, presently, 47.5%, 29.3%, and 13.5% are older than 20, 30, and 40 years, respectively, indicating that mid- to long-term renovation measures are required for their improvement [
9].
Through the New Deal Policy, the Korean government has been promoting the green smart school project, which has the objective of creating safe and functional learning spaces that can accommodate both online and offline education. This project will be implemented through four stages, namely, the remodeling of old school facilities, Wi-Fi installation in all classrooms, the replacement of old PCs, and the construction of an integrated online education platform. Among these stages, the old school remodeling stage aims at improving the energy efficiency of old school buildings through the installation of solar photovoltaic (PV) facilities, and the use of eco-friendly insulation in 1299 out of 11,710 public elementary, middle and high schools by 2022 [
10,
11].
Based on the results of research on retrofitting measures that can be applied in national and public school-buildings, published by the Korea Energy Economics Institute, an increase in insulation from 50 to 400 mm would lead to an insignificant energy saving rate (~3.8%) in educational facilities. Since an energy saving rate of ~16.2% can be obtained using solar heat collectors, an additional 18.5% saving rate can be further realized based on the use solar panels. Therefore, considering the energy and hot water requirements of educational facilities, the installation of solar panel systems in school buildings is strongly recommended given that these PV panels require low building and floor area coverage and have relatively long lifespans [
12]. Additionally, educational facilities outfitted with renewable energy sources can foster student interest on the importance of conservation and sustainability.
The present study focused on the development of PV facilities that can be installed on building façades as part of the old school remodeling program of the green smart school project put forward by the Korean government; this extends solar panel installation beyond the traditional limitation of building rooftops. Owing to the nature of school buildings in Korea, with little shadow interference, and the placement of playgrounds on the southern side, façade-based solar energy production has high efficiency potential. This study on the school building façades pursues the production of highly efficient renewable energy by developing a customized solar energy device method through analysis of the environment of the target site. Further, using schools as research subjects, practical application can be pursed for modifying the design of a large number of existing schools. Further, the introduction of solar renewable energy facilities will enhance reductions in power consumption and play a significant role in reducing GHG emissions. Thus, the targets of the Paris Climate Change Convention can be met.
2. Research Scope
2.1. Educational Facilities in Korea
2.1.1. Old Educational Facilities
In the 1960s, Korean educational facilities were quantitatively expanded to accommodate the rapidly increasing number of students following the baby boom. Thus, in 2020, it was observed that 7980 school buildings, representing ~20% of all schools in Korea, were >40 years old, and this number is expected to increase to 14,286, 18,608, and 29,707 by 2030, 2040, and 2050, respectively (
Table 1) [
13]. This issue of aging educational facilities is compounded by low birth rates, which have led to a decrease in the number of students. Thus, additional studies have been conducted to assess the rapid increase in the number of closed school facilities in Korea and the recycling of old ones.
2.1.2. Energy Use in Education Facilities
In Korea, building energy consumption accounts for ~21% of the total energy consumption, and 13.6% of this proportion is associated with educational facilities. It has also been observed that older educational facilities exhibit higher energy consumption, and more than half of all elementary schools, which constitute a large proportion of the total number of educational facilities, were >40 years old by 2015 [
14]. Thus, measures aimed at reducing energy consumption associated with these older educational facilities are urgently required. With energy saving methods, significant ripple effects led by public agencies that will boost energy conservation and further propagate positive economic effects, are expected across all education facilities throughout the country.
The per student energy costs significantly increases with school age (
Table 2). In addition, the per student energy costs increase from elementary school to middle and high school because of the increase in class hours and the consideration of self-study at night, which leads to a large amount of time spent at school throughout the year. Considering that the energy cost per student can be over- or underestimated for over- or under-crowded classes, the energy cost per unit building area was also investigated. The results showed that more recently built school facilities are associated with lower energy consumption (
Table 3). In particular, energy costs declined sharply in the 2000s, largely owing to the 2001 Building Act that reinforced insulation standards for buildings [
15]. Additionally, schools constructed prior to 2000 exhibited lower energy efficiencies, partially owing to the deterioration of building insulation and facility age.
2.1.3. Educational Facility Façade Design
According to the declaration included in the “
Standard drawings for school facilities”, published by the Seoul Education Committee in 1975, the façade of a unit classroom should have a simple, repetitive common form [
17]. Although this standard design system was abolished in 1992, educational facilities in Korea have shown a tendency toward standardized classroom sizes, floor heights, and façade sizes, even after 2000. Further, even though such standardized interior and exterior designs have been criticized as being uncreative, if a façade PV design module for the generation of renewable energy is developed as proposed in this present study, its installation across the façades of all such buildings will be much easier. Furthermore, it is relatively easier to implement government-backed energy policies and technologies to educational facilities considering they are public facilities that are used according to a consistent and standard schedule [
18].
2.2. Analysis of Study Sites
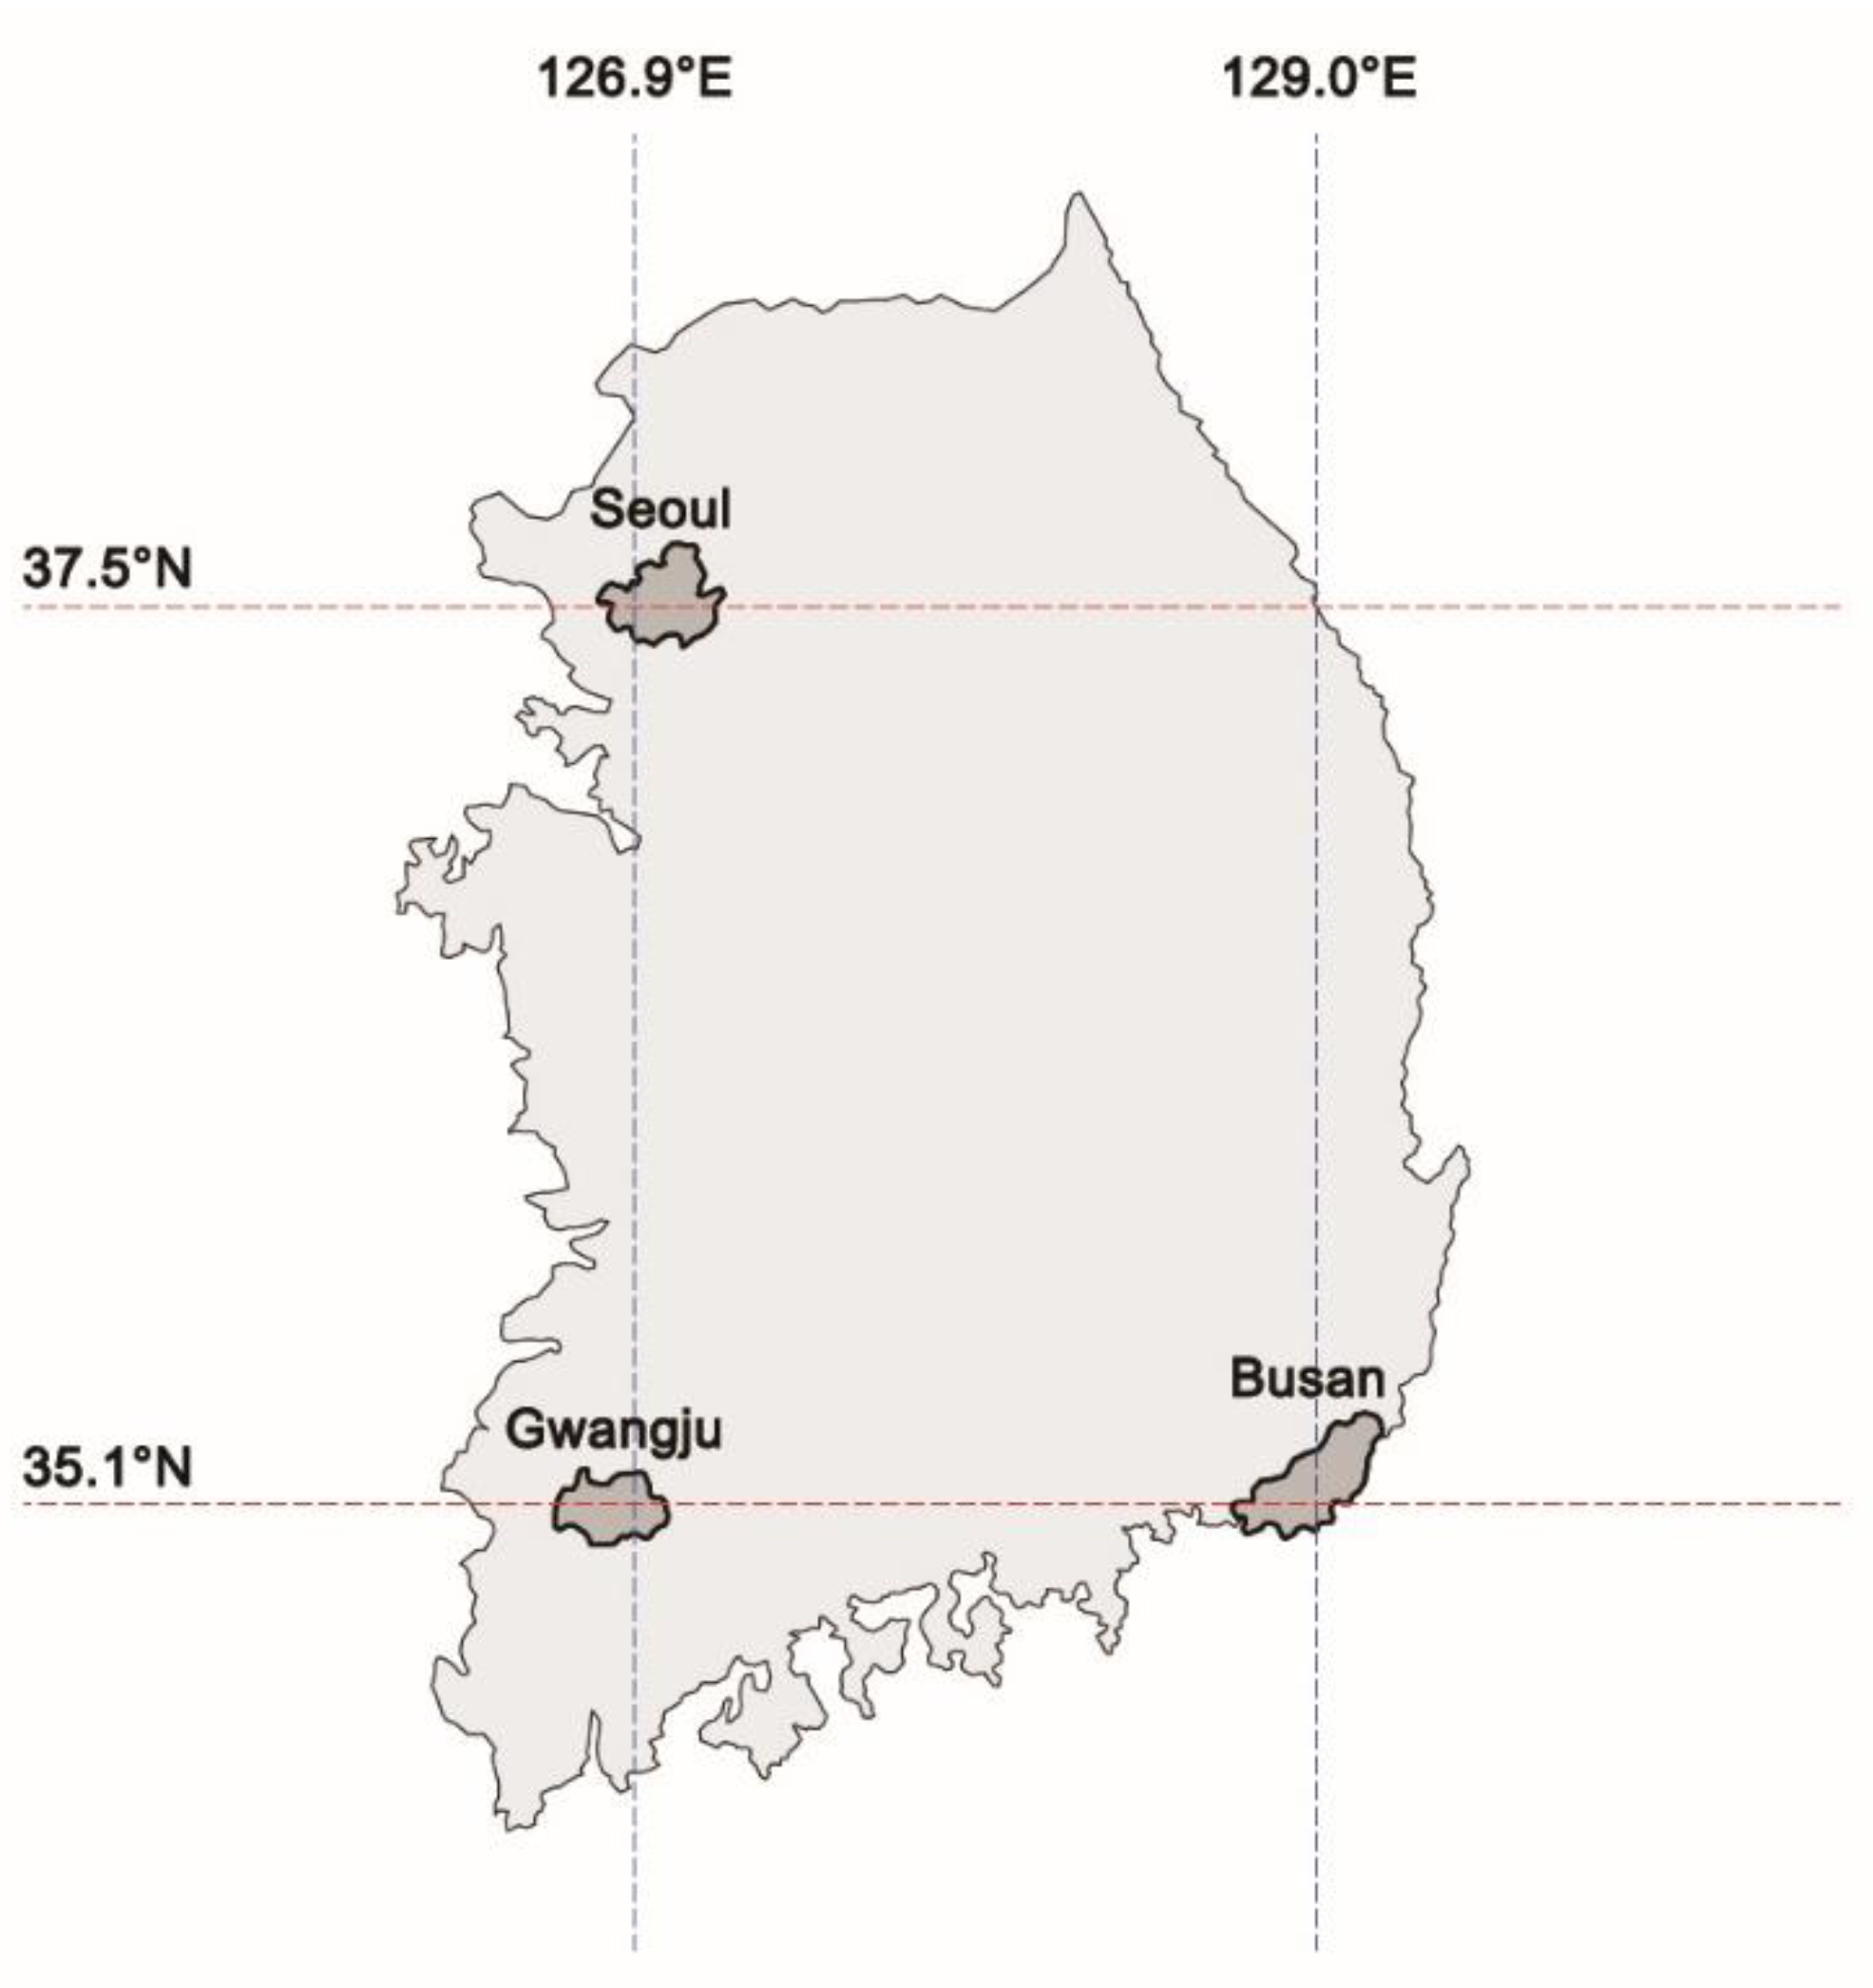
In this study, three elementary schools, located in large cities, Seoul, Gwangju, and Busan, were selected as the study sites (
Figure 1,
Table 4) based on their geographic locations. Seoul and Gwangju have the same longitude (126.9° E). Thus, they were selected to examine latitudinal effects on solar energy production. Further, given that Gwangju and Busan have the same latitude (35.1° N), they were used to examine longitudinal effects on solar energy generation. Therefore, this study involved the analysis of the solar irradiation reaching the façade of the target elementary school buildings as well as the simulation of the amount of power generated following the installation of the PV façade modules.
2.2.1. Won-Hyo Elementary, Seoul
The Won-Hyo elementary school, located in Yongsan-gu, Seoul (37.5° N, 126.9° E), was constructed in 1982. Its main building is toward the southeast and has three underground levels and four aboveground floors, with their façades facing the southeast and southwest directions. The cafeteria of this school, which is used by 670 students and 53 teachers, was expanded in 2001, while its information center building was expanded in 2004.
2.2.2. Jung-Ang Elementary School, Gwangju
The Jung-Ang elementary school is located in Dong-gu, Gwangju (35.1° N, 126.9° E). Even though it was established in 1907, it was rebuilt at its present location in 1913. The main building of this school was again reconstructed in 1958, and the current two-story main building remained after the tearing down the teacher’s building in 1995 and the rear building in 2002. The school is used by only 35 students and 35 teachers.
2.2.3. Cho-Rang Elementary School, Busan
The Cho-Rang elementary school, which was constructed in 1937, is located in Dong-gu, Busan (35.1° N, 129.0° E). This school, which is used by 327 students and 25 teachers, consists of five buildings, including a three-story main building.
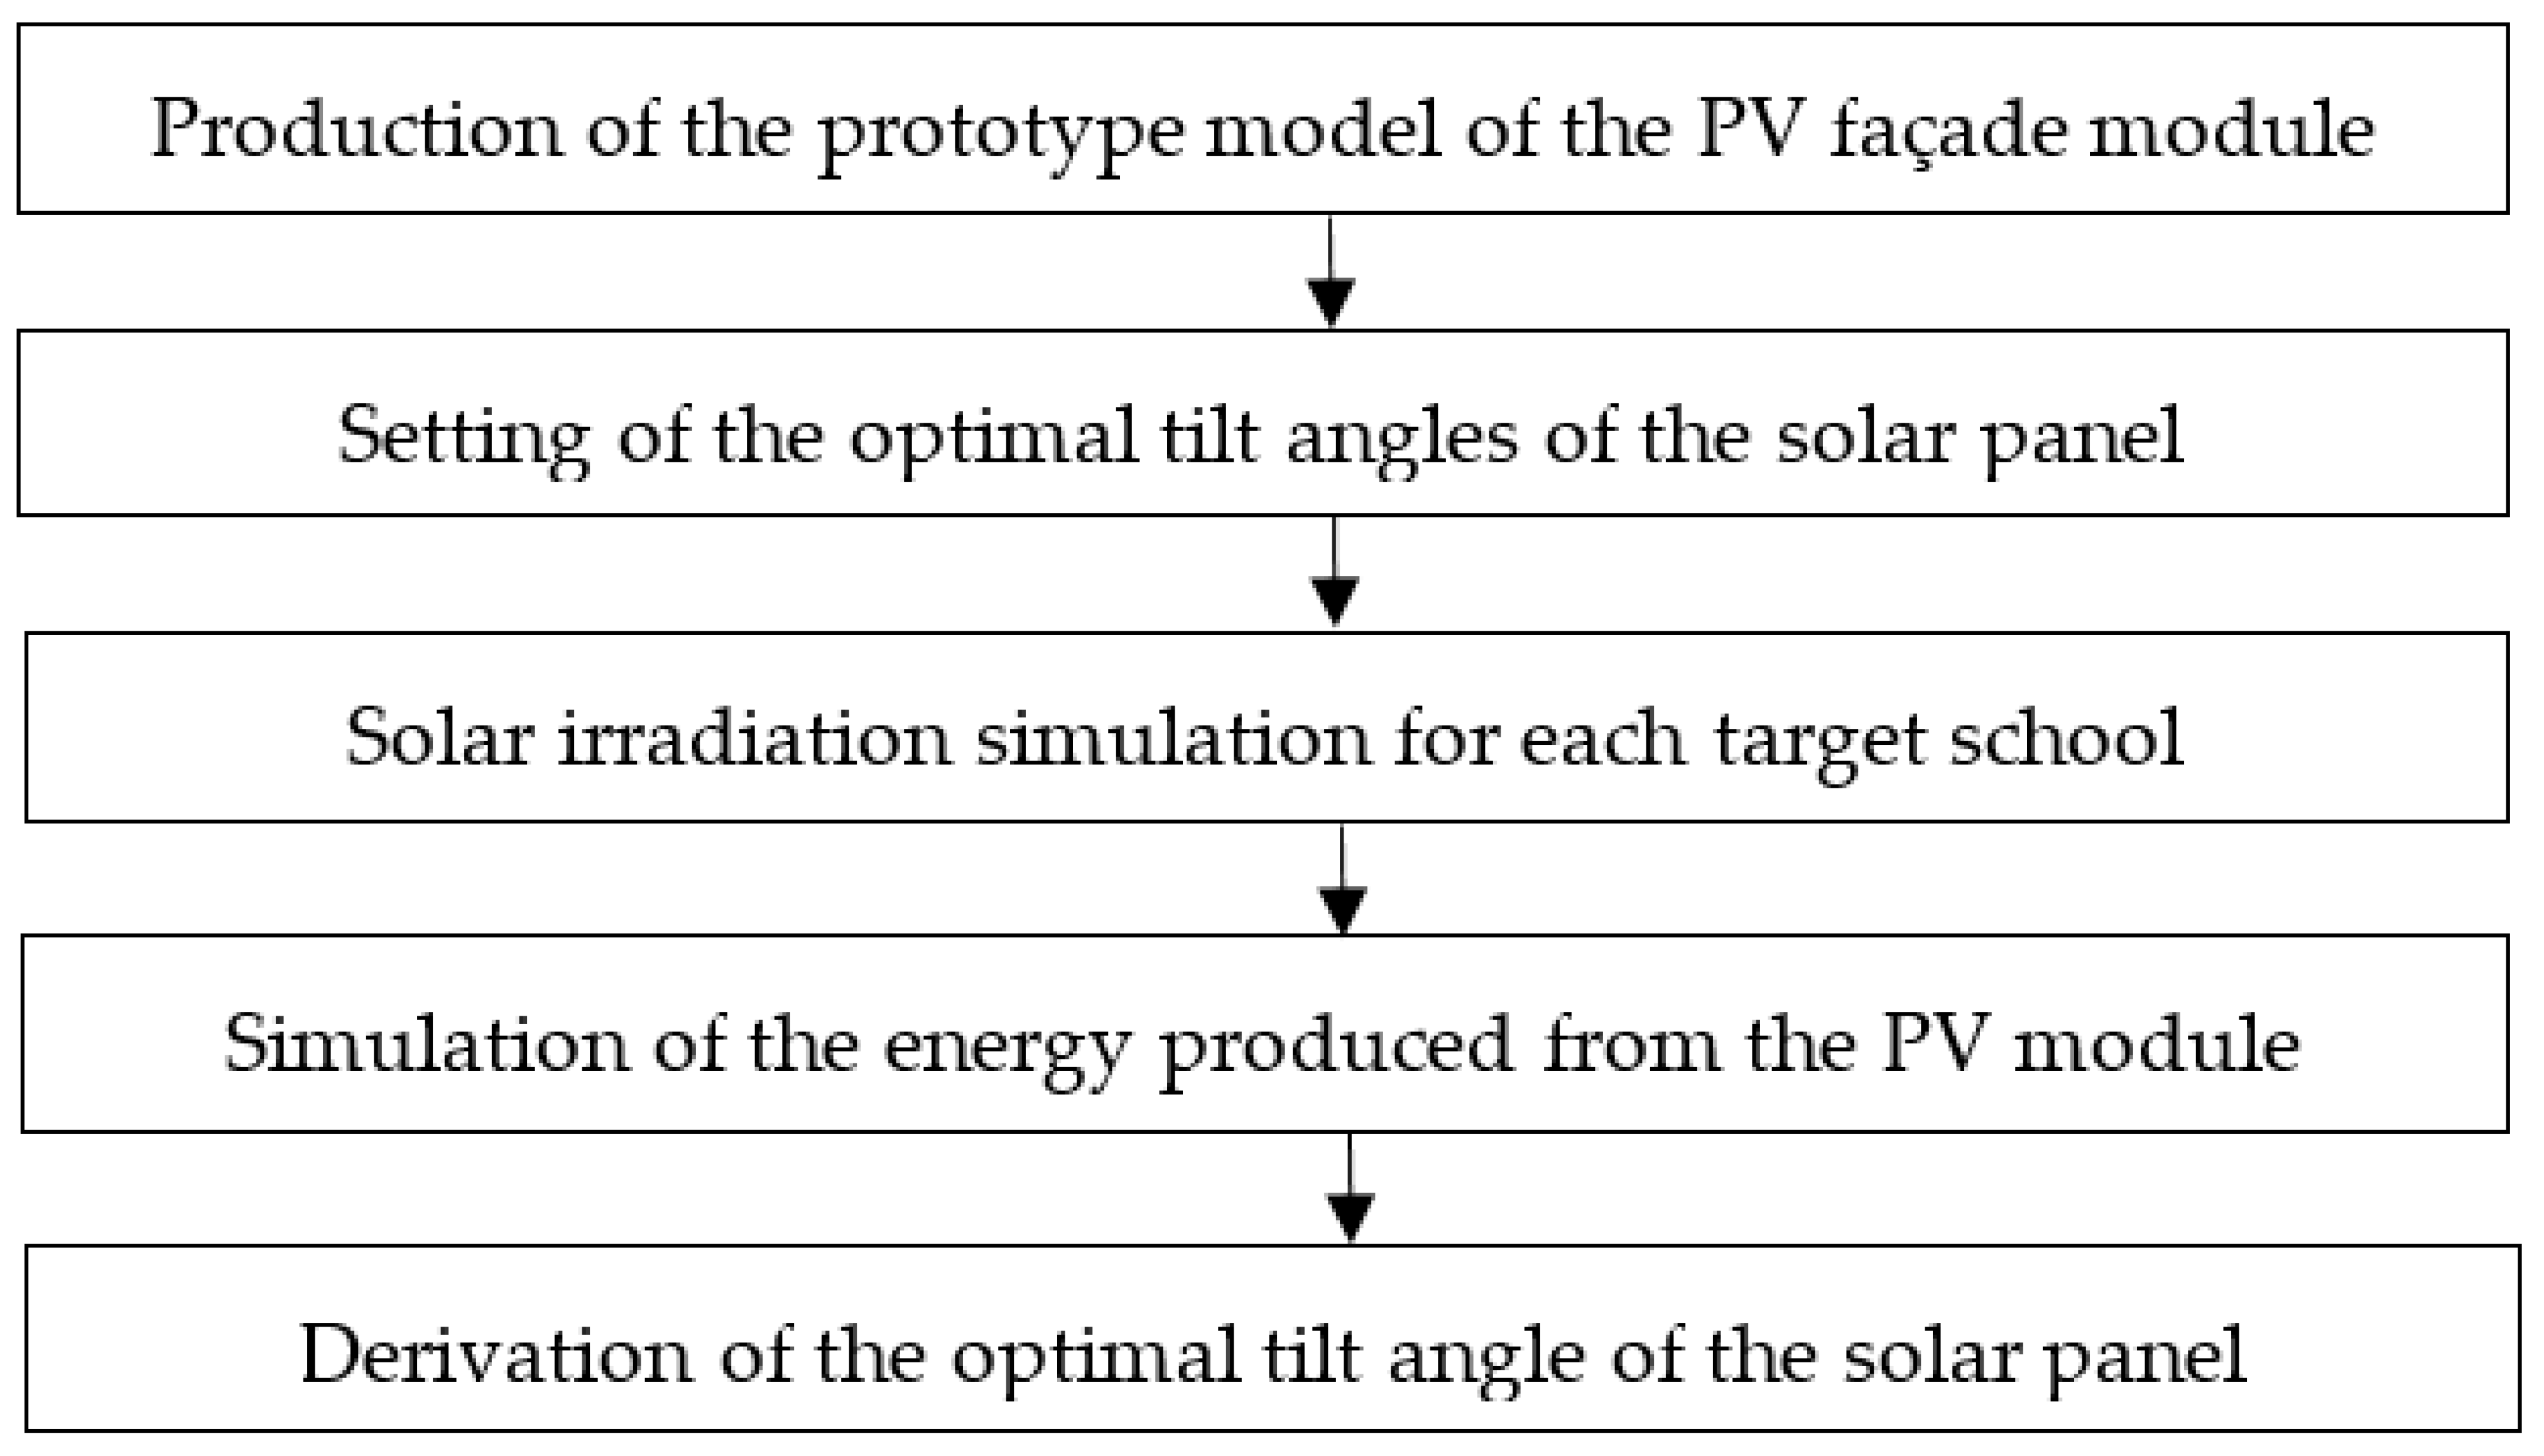
3. Methods
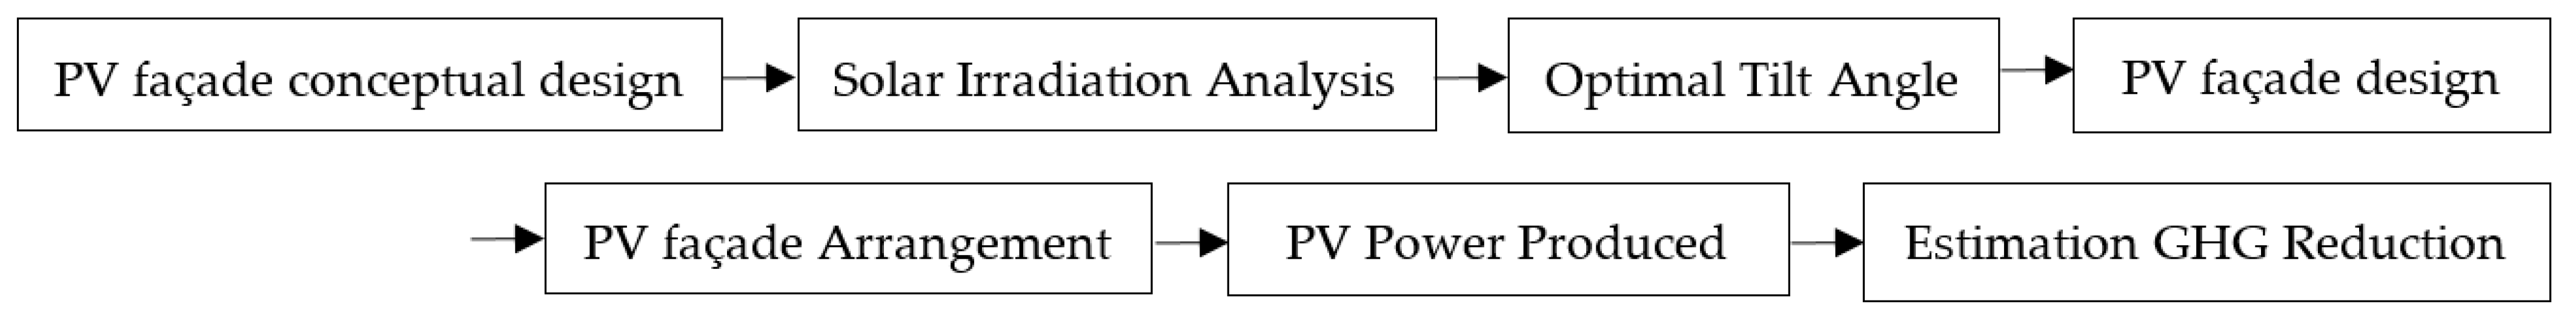
In this study, a PV façade design for elementary school buildings was developed as follows (
Figure 2):
The concept of the PV façade module was developed to provide renewable solar energy to elementary school buildings in Korea based on the hypothesis that it will be applicable to most, if not all, standardized school building façades in the country.
The annual average solar irradiation on the building façades was investigated using the Revit 2019 software, which is an architectural visualization software developed by Autodesk. After modeling the target elementary schools in three dimensions, the solar irradiation on the building façades at each elementary school was investigated over a given year based on the assumption that the solar panels are attached to the entire building façade, without considering the tilt angle. Based on the results obtained, the building façade that receives the optimal solar irradiation was selected.
The tilt angle (β) of the PV modules that is associated with the maximum energy production efficiency was calculated using the geographical location of the study sites. In this study, the tilt angle between the elementary school building façade and the PV module is presented as the most important variable for maximizing the renewable energy production.
The PV module with the determined optimal tilt angle (β0) was used in Revit, and the expected amount of solar energy produced was calculated using the Insight plugin of Revit.
To examine the actual amount of energy generated in real space, details regarding the solar panel to be used in this study were specified so as to facilitate the construction of a prototype. Further, the construction of the selected solar panel (Hanwha Q. CELLS’ solar panel) had to be readily achievable in Korea.
The distance between the designed PV modules was calculated considering that shadows from the upper set may affect the power generation capacity of the lower set. This distance was calculated using a function that facilitates the determination of horizontal shading. The designed solar panel was accordingly positioned on the modeled building façade, and irradiation was then simulated to derive the amount of potential solar energy generated.
The solar energy produced was calculated using the peak solar hour (PSH) value, derived from the above irradiation simulation. This was used to identify its impact on the energy sufficiency of the school.
Estimations of reduction CO2 emissions were determined according to the total amount of renewable energy generated in the simulations.
3.1. Conceptual Design of PV Façade Module
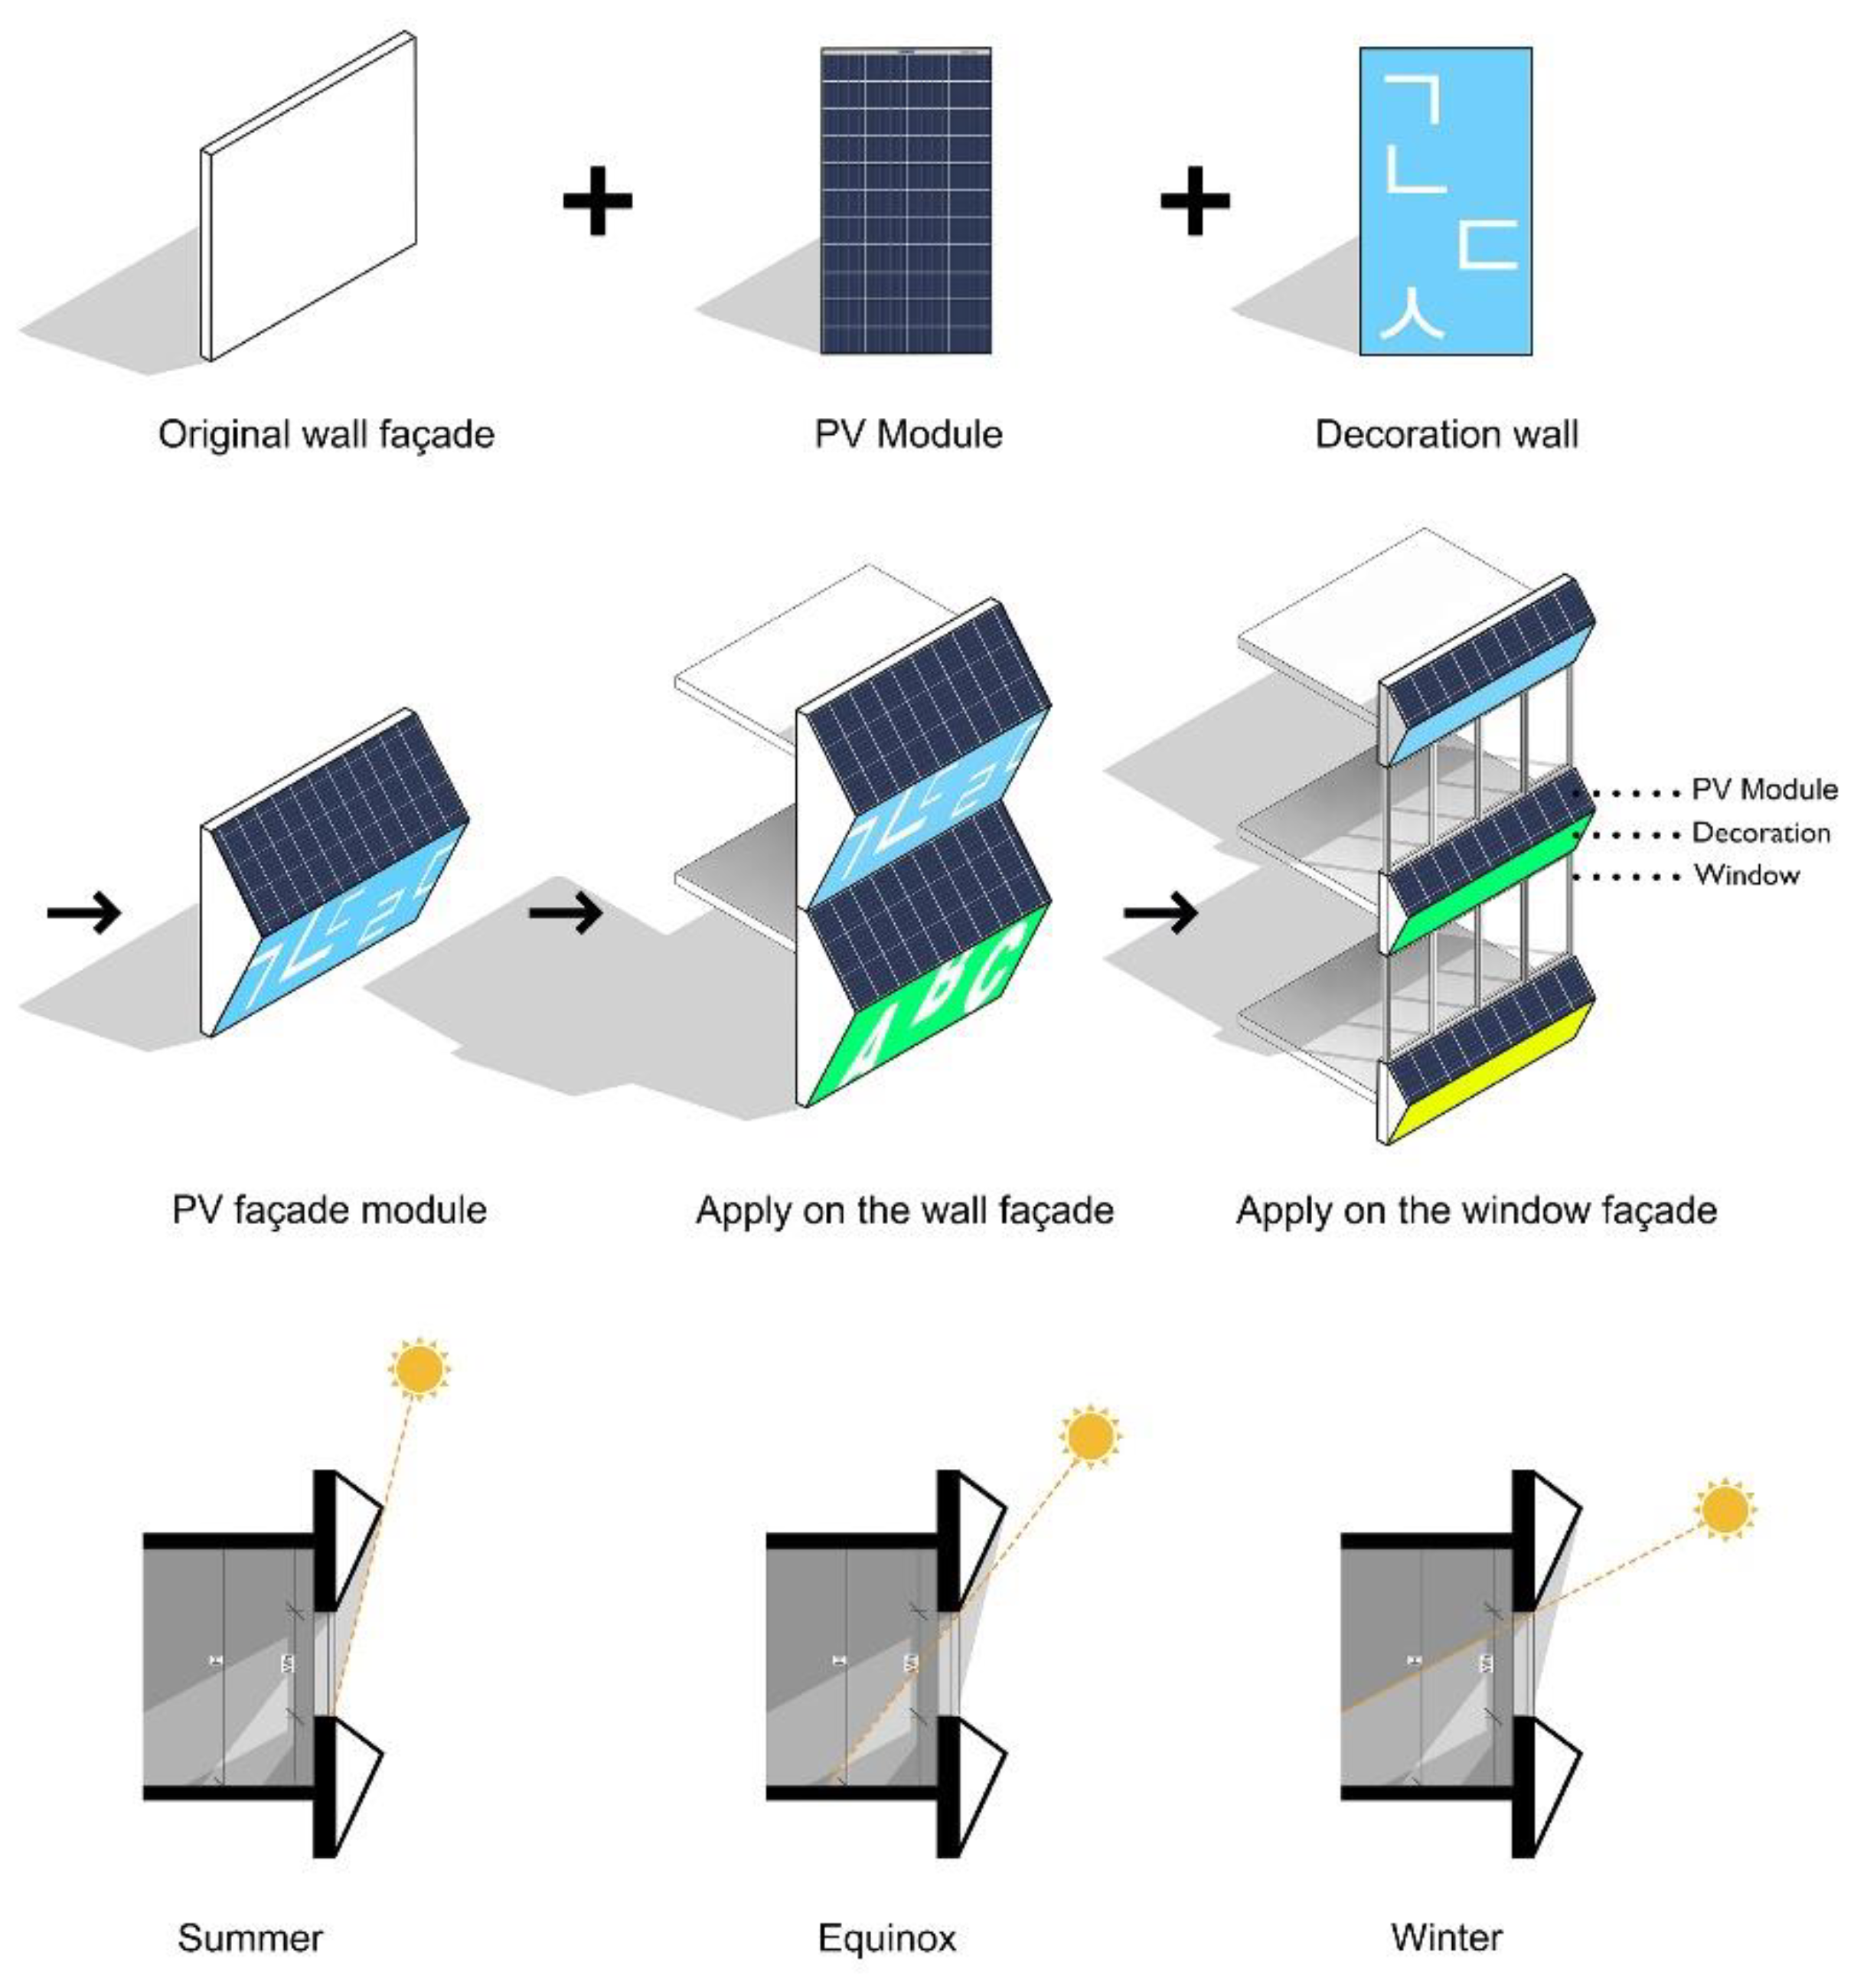
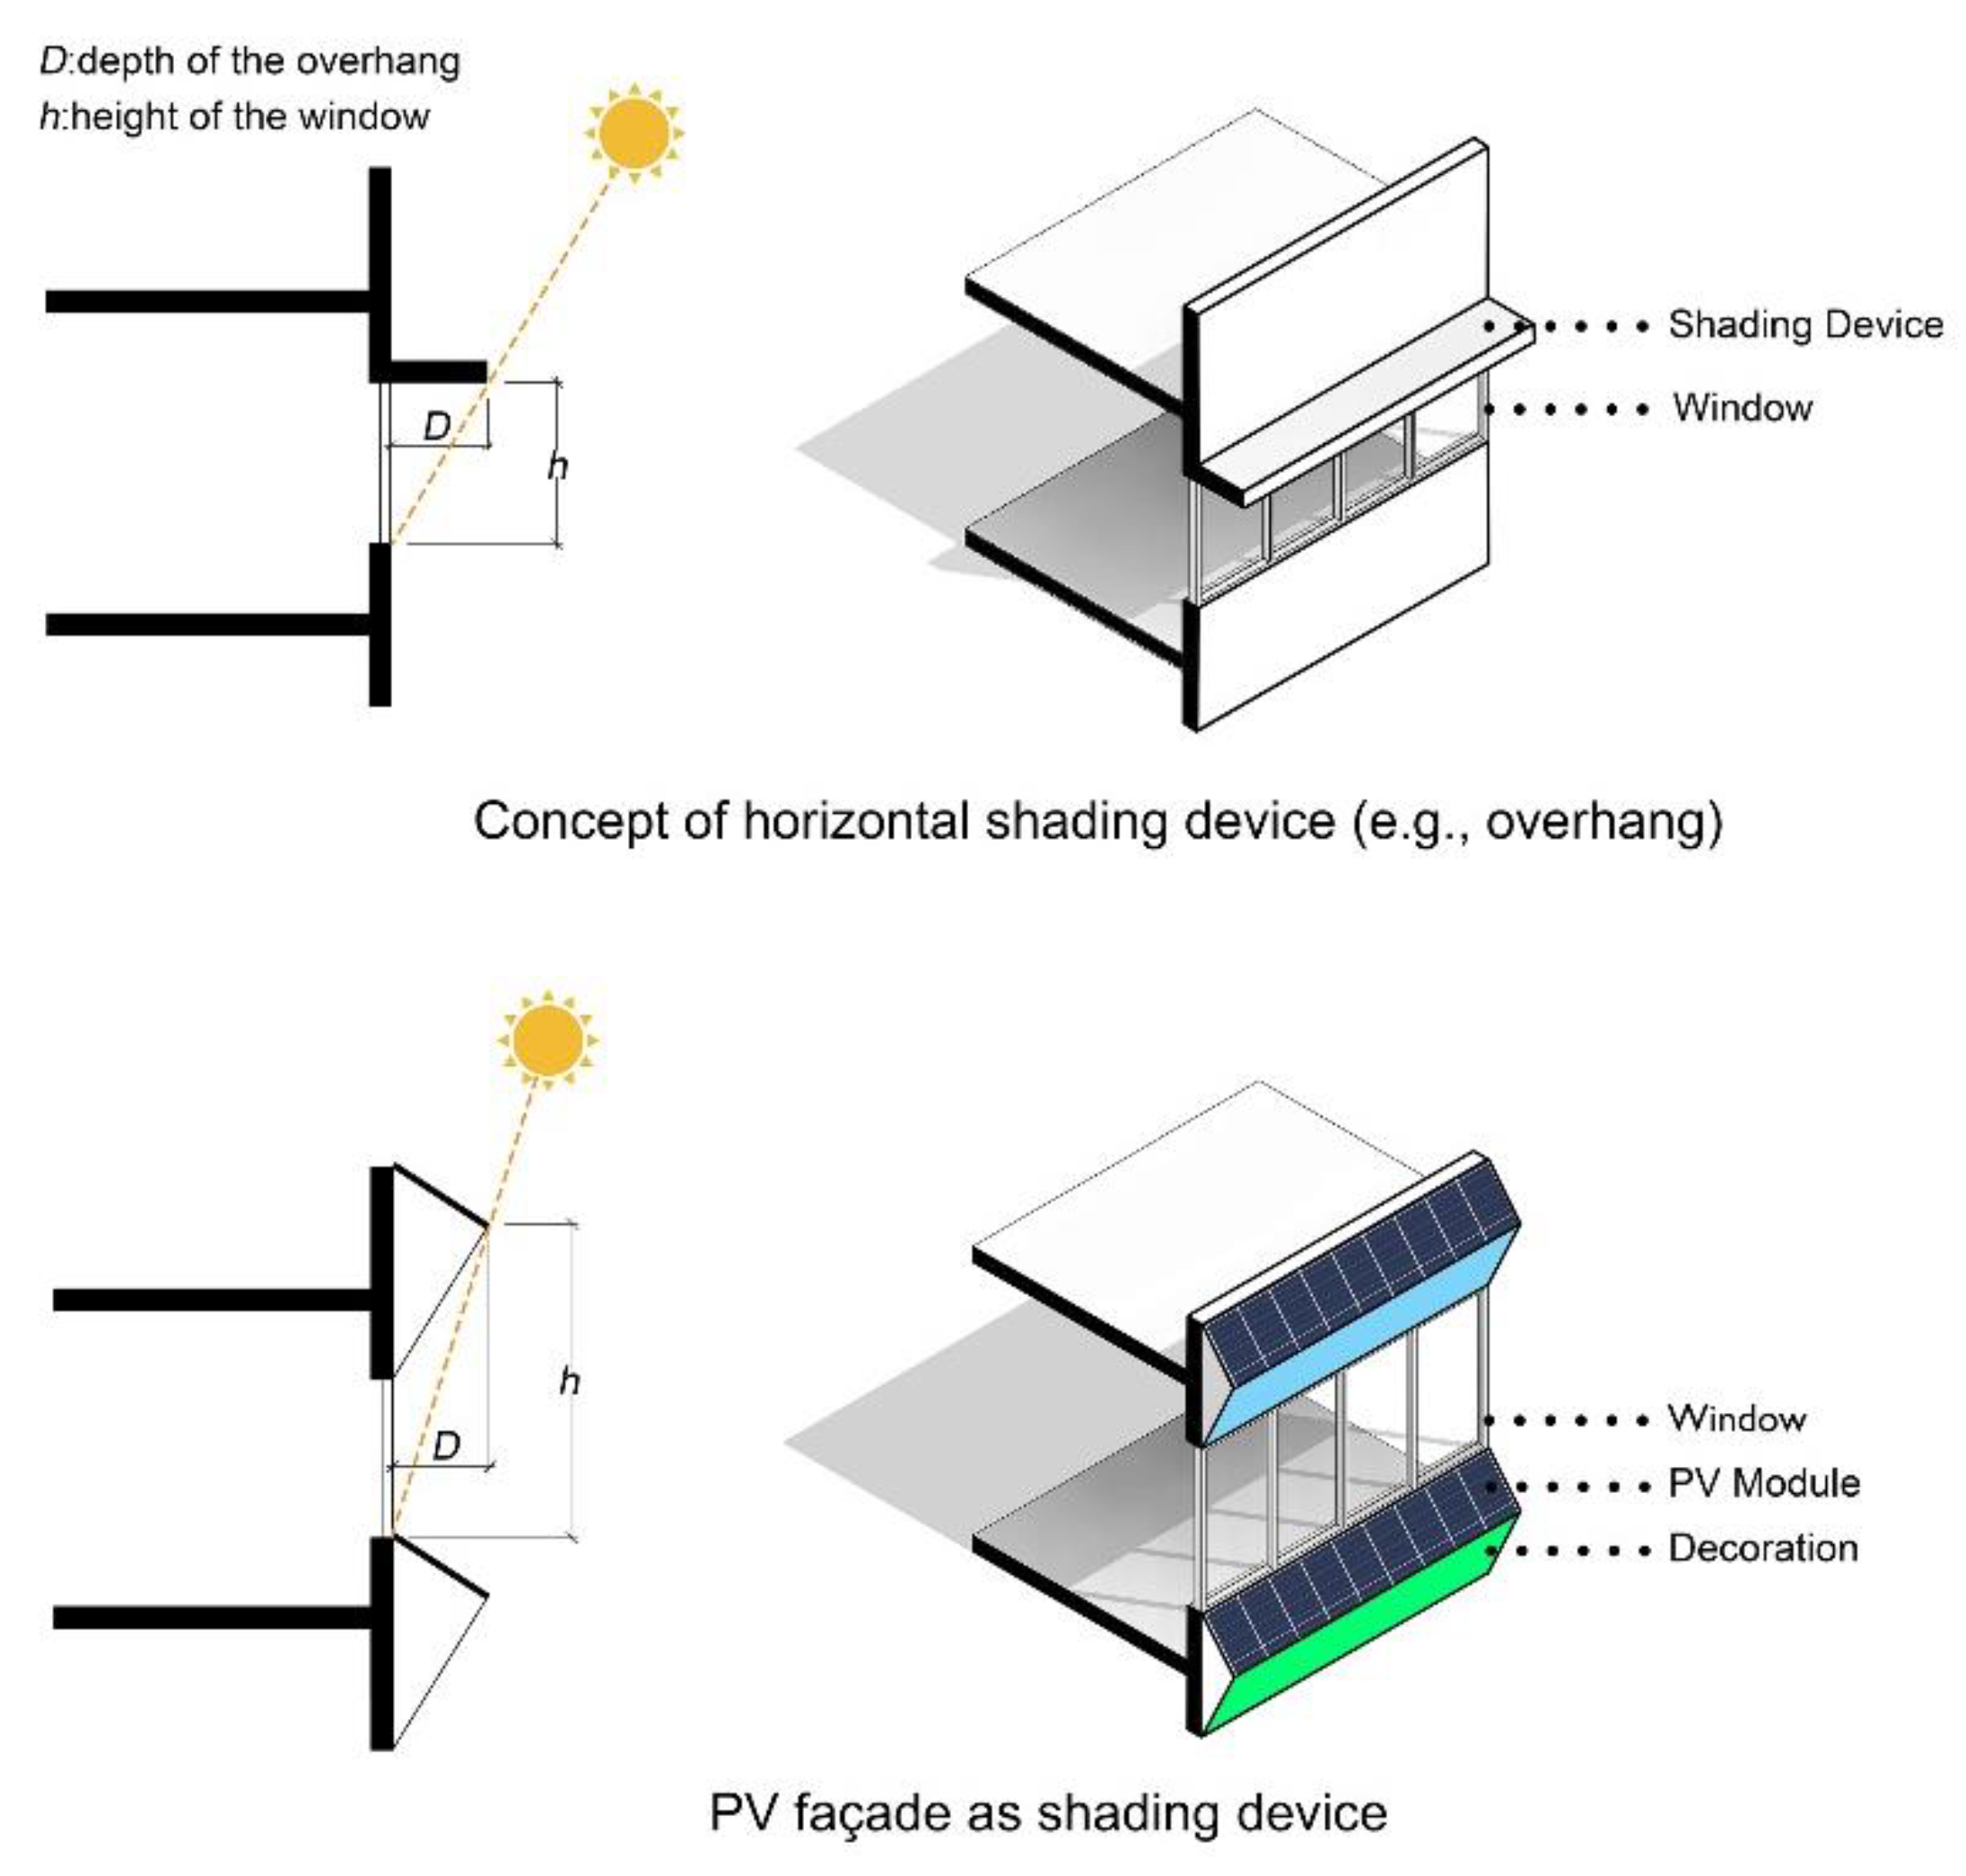
In Korean elementary schools, typical building façades involve the use of decorative bricks or windows. In this study, the PV modules consisted of an inclined solar panel in the upper part and a decorative panel in the lower part (
Figure 3), placed iteratively along the building. Implementing this eco-friendly design will not only lead to renewable energy production but also play a positive role in cultivating the importance of the environment and creative thinking in students who are always in contact with the educational space.
The main concepts of the proposed PV module were as follows: First, the renewable energy generated by the PV module will be supplied to school facilities. Second, the design specifications of the PV module are such that they can be easily implemented on typical Korean elementary school building façades. Third, the PV modules located above the windows are designed to limit the direct entry of sunlight during summer, when the sun height is high, while permitting direct sunlight in the winter when the sun height is low.
3.2. Façade Irradiation
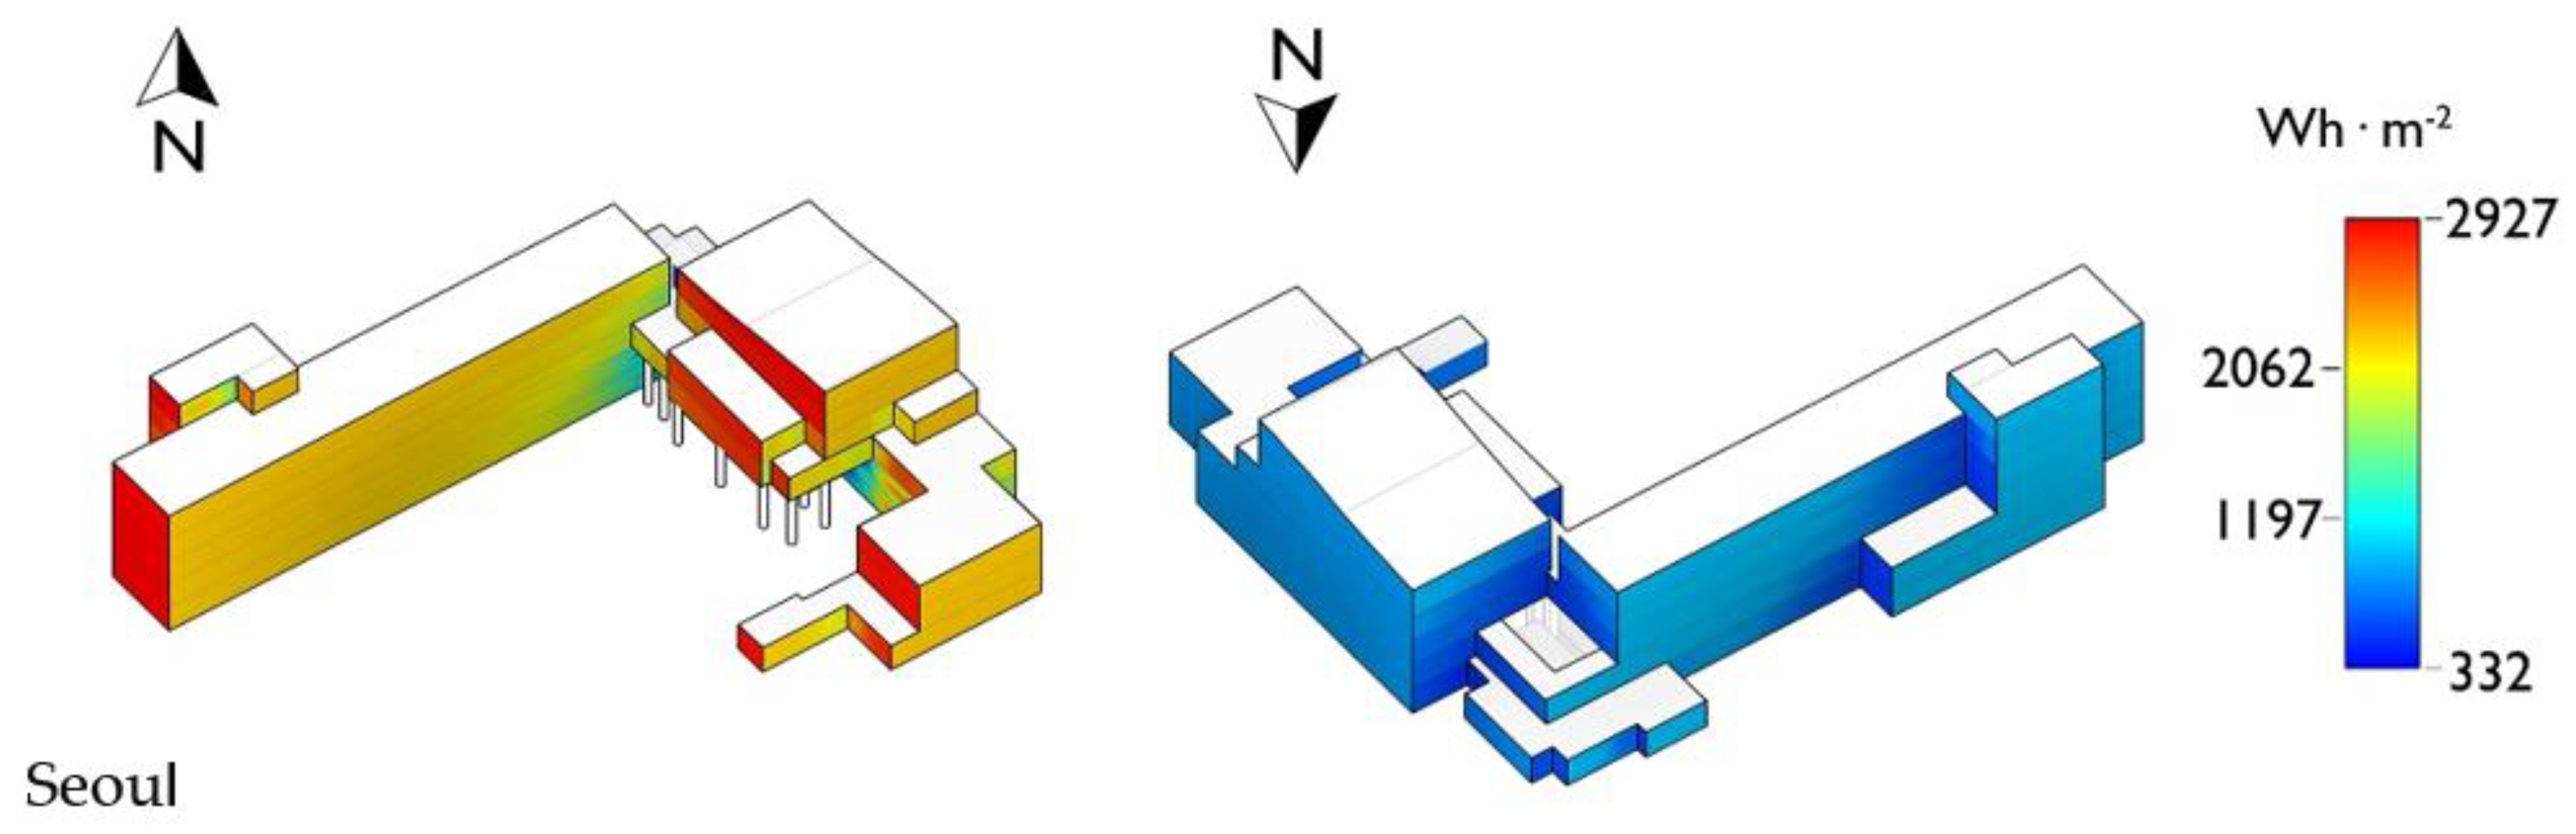
Irradiation simulation is an essential step in the process of designing PV modules. In this study, irradiation simulations were performed for the three target elementary schools using Autodesk’s Revit 2019 software [
19], which is widely used in the fields of architectural design, structural engineering, mechanical, electrical, and plumbing (MEP) engineering, and construction management. Specifically, the Insight plugin in Revit 2019 [
20] was used to analyze cooling/heating, irradiation, and sunlight data. The irradiation simulation results showed that the Won-Hyo elementary school (Seoul) had an incoming solar irradiation of 332–2927 Wh·m
−2, with the most intense irradiation received from its southeast-, south-, southwest-, and west-facing façades, indicating that these locations are optimal for solar energy capture (
Figure 4).
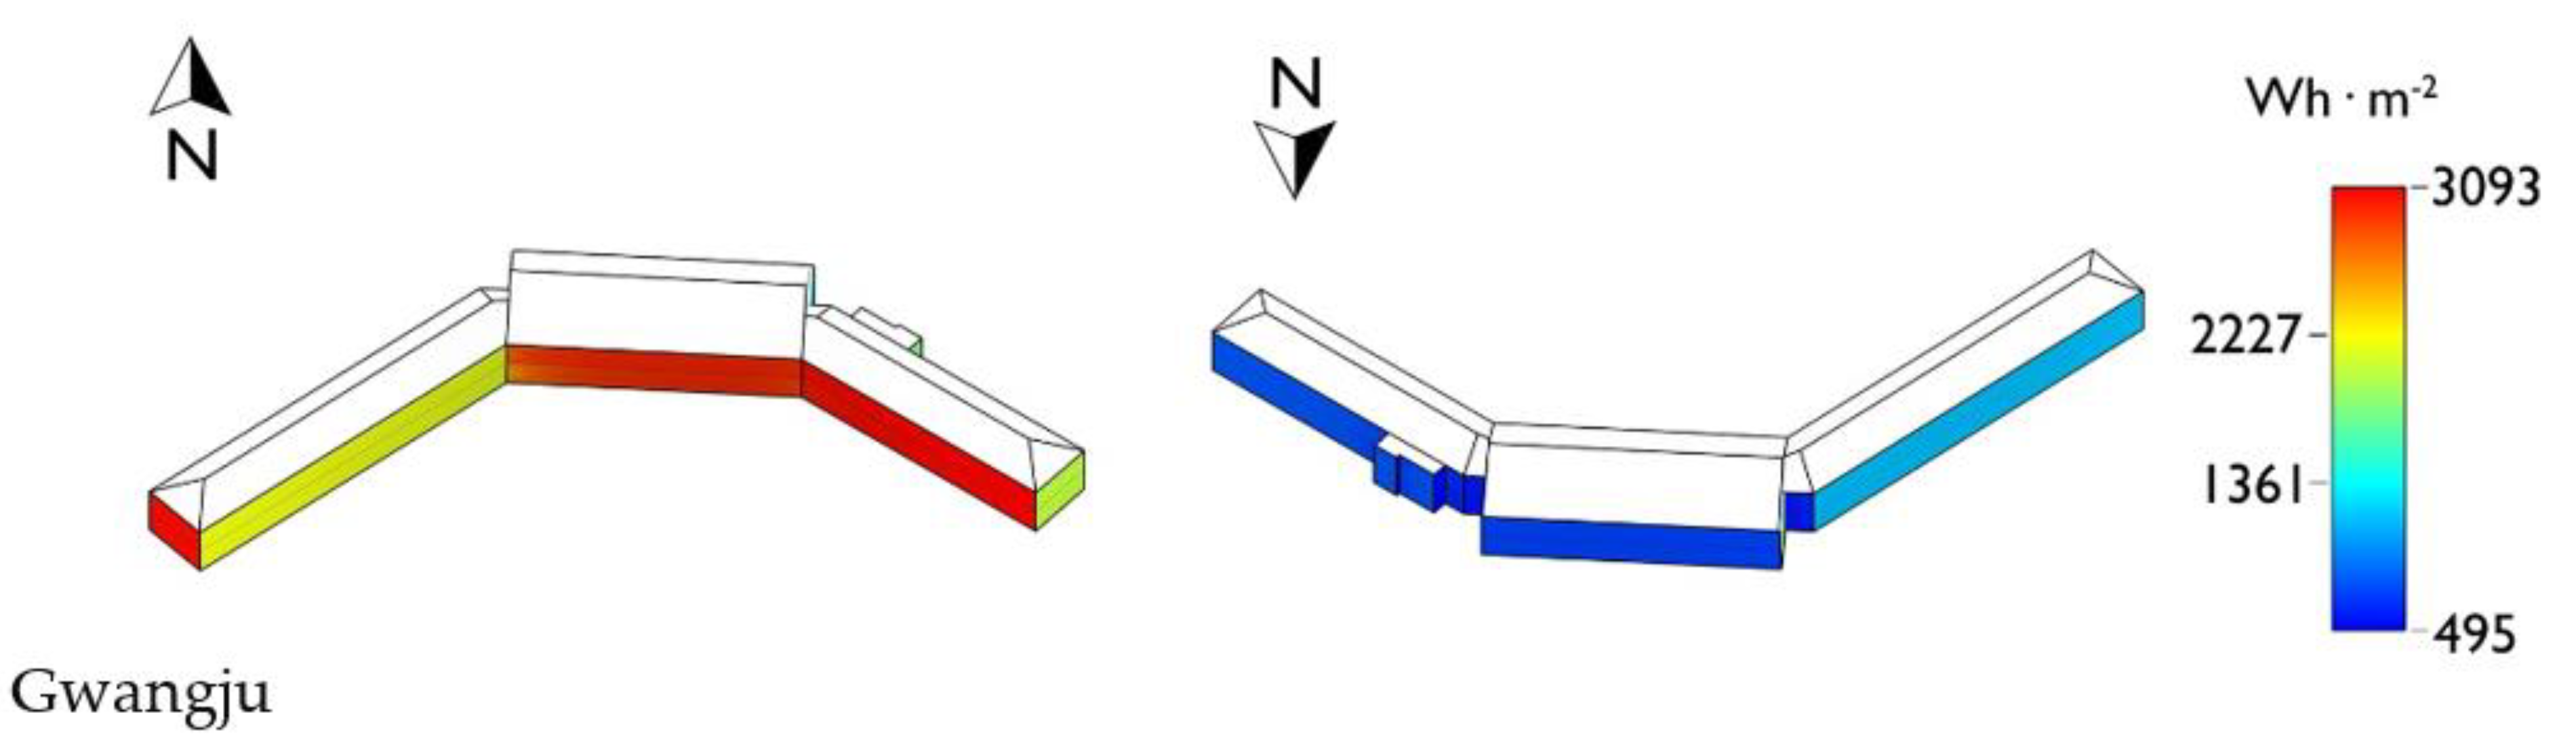
Second, the Jung-Ang elementary school in Gwangju had simulated incoming solar irradiation values of 495–3093 Wh·m
−2, with the façades facing the southeast, south, and southwest, receiving the most intense irradiation (
Figure 5).
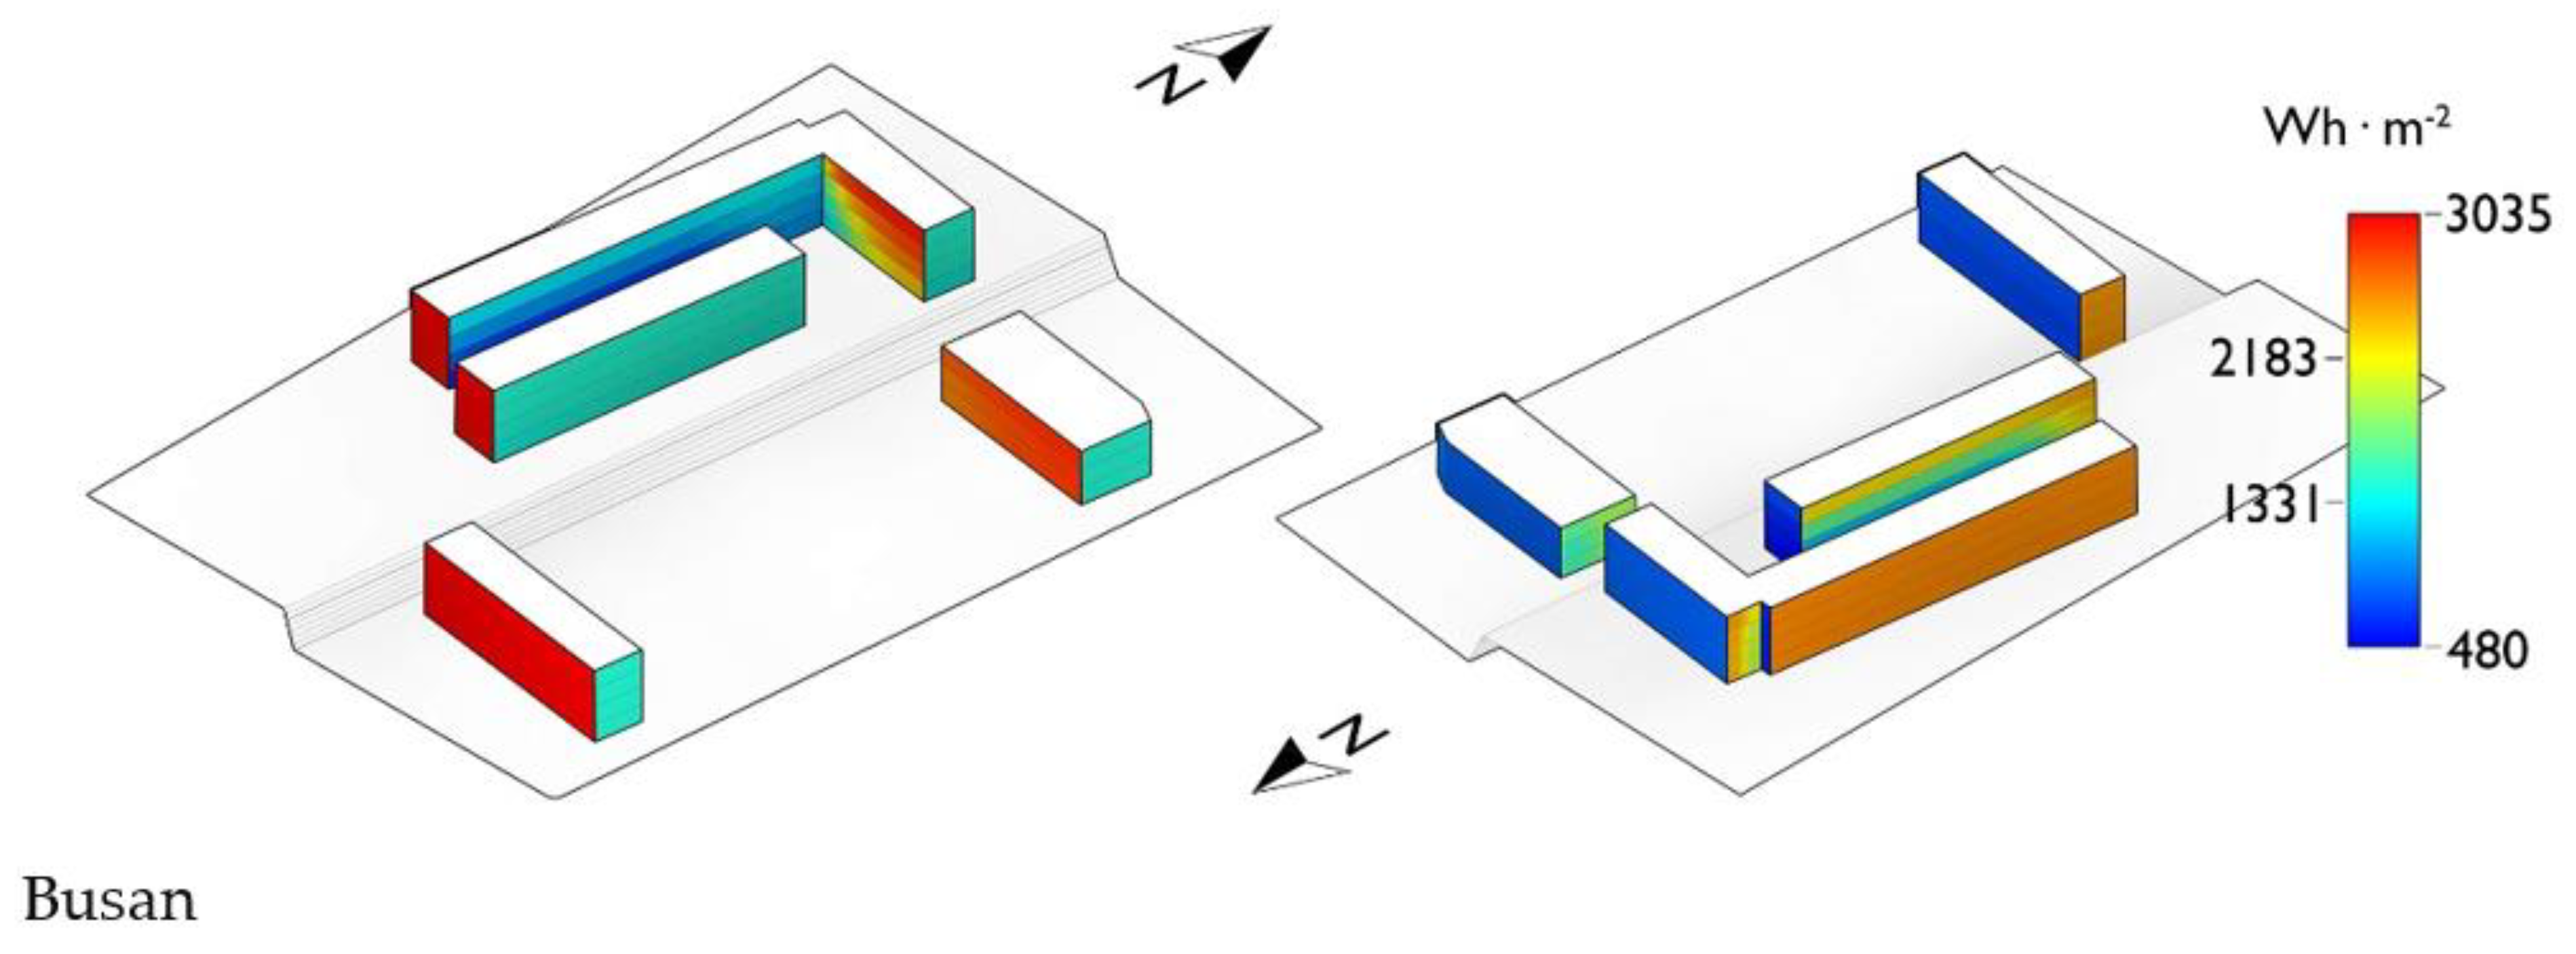
Third, the Cho-Rang elementary school in Busan showed simulated solar irradiation values in the range 480–3035 Wh·m
−2, with the maximum values recorded on the façades facing the south and west, indicating that these locations are optimal for solar energy production (
Figure 6).
The building façades for PV module installation that led to optimal energy generation were selected according to geographical location and the simulation results. Regardless of the geographical location, building façades facing the south and southeast directions exhibited the highest solar irradiation values, followed by those facing the east, southwest, and west, which showed average values. Therefore, in this study, at each target elementary school, the modeled PV modules were installed on building façades facing the south, southeast, east, southwest, and west directions.
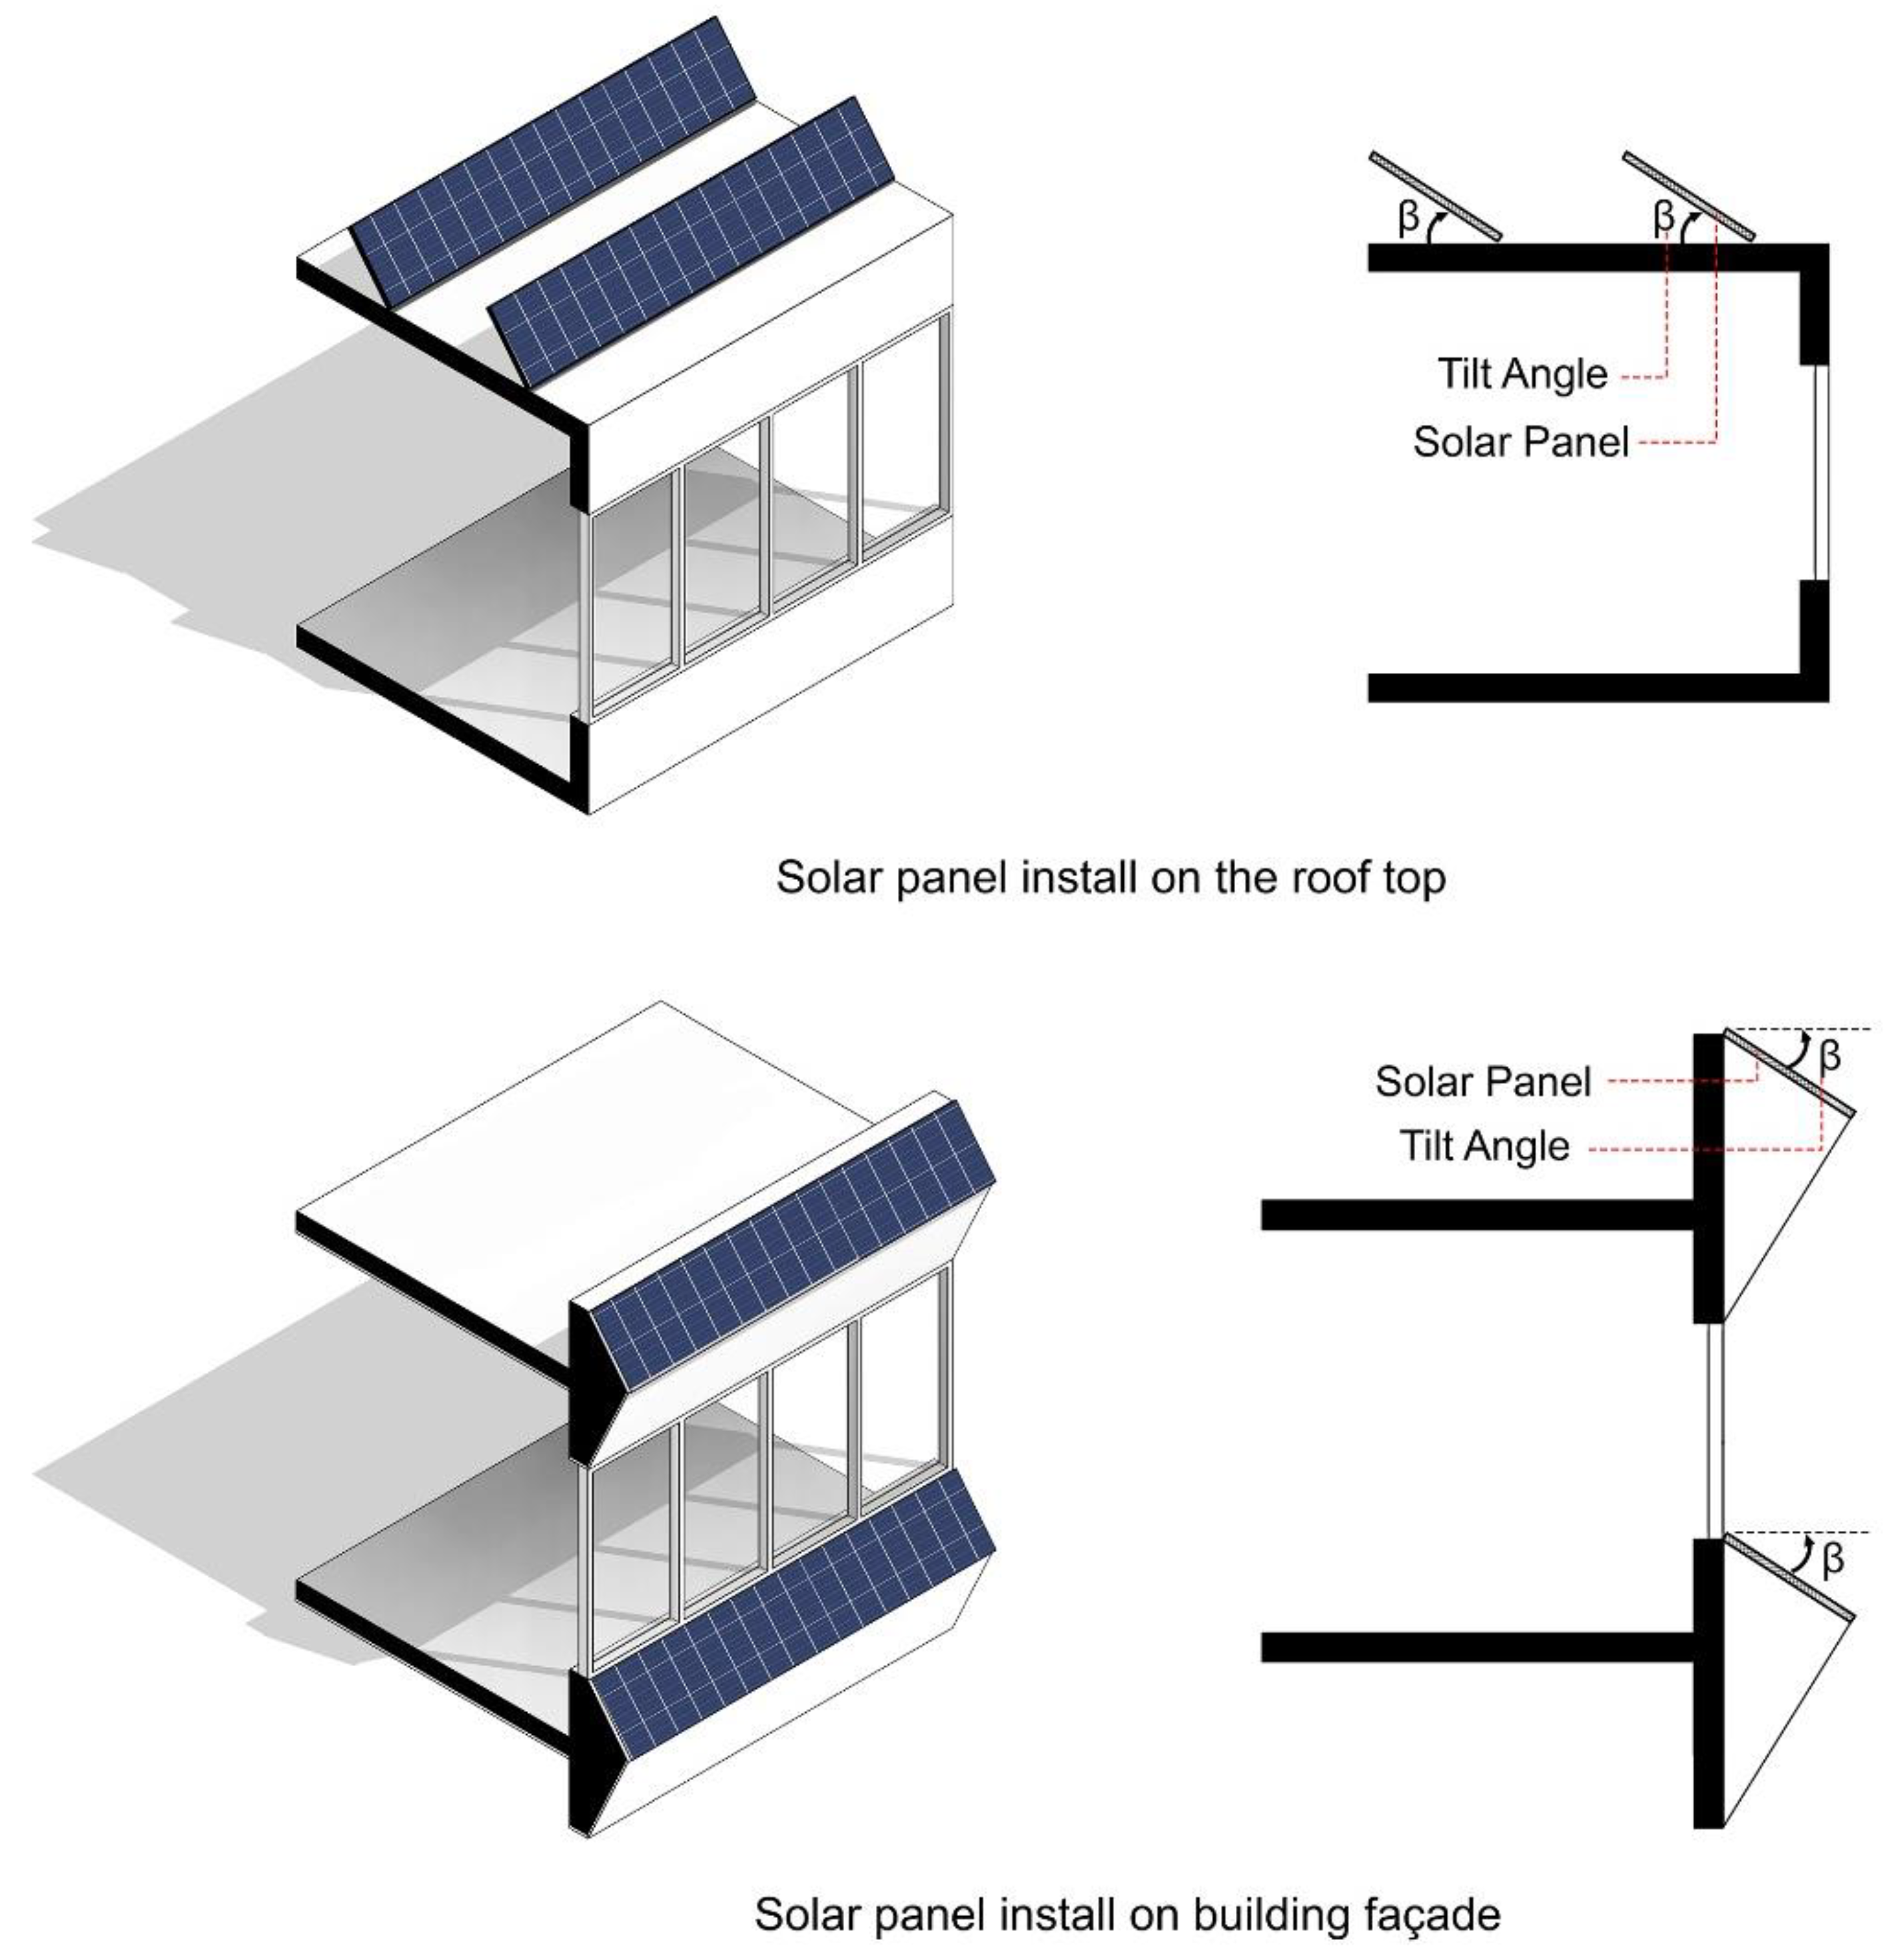
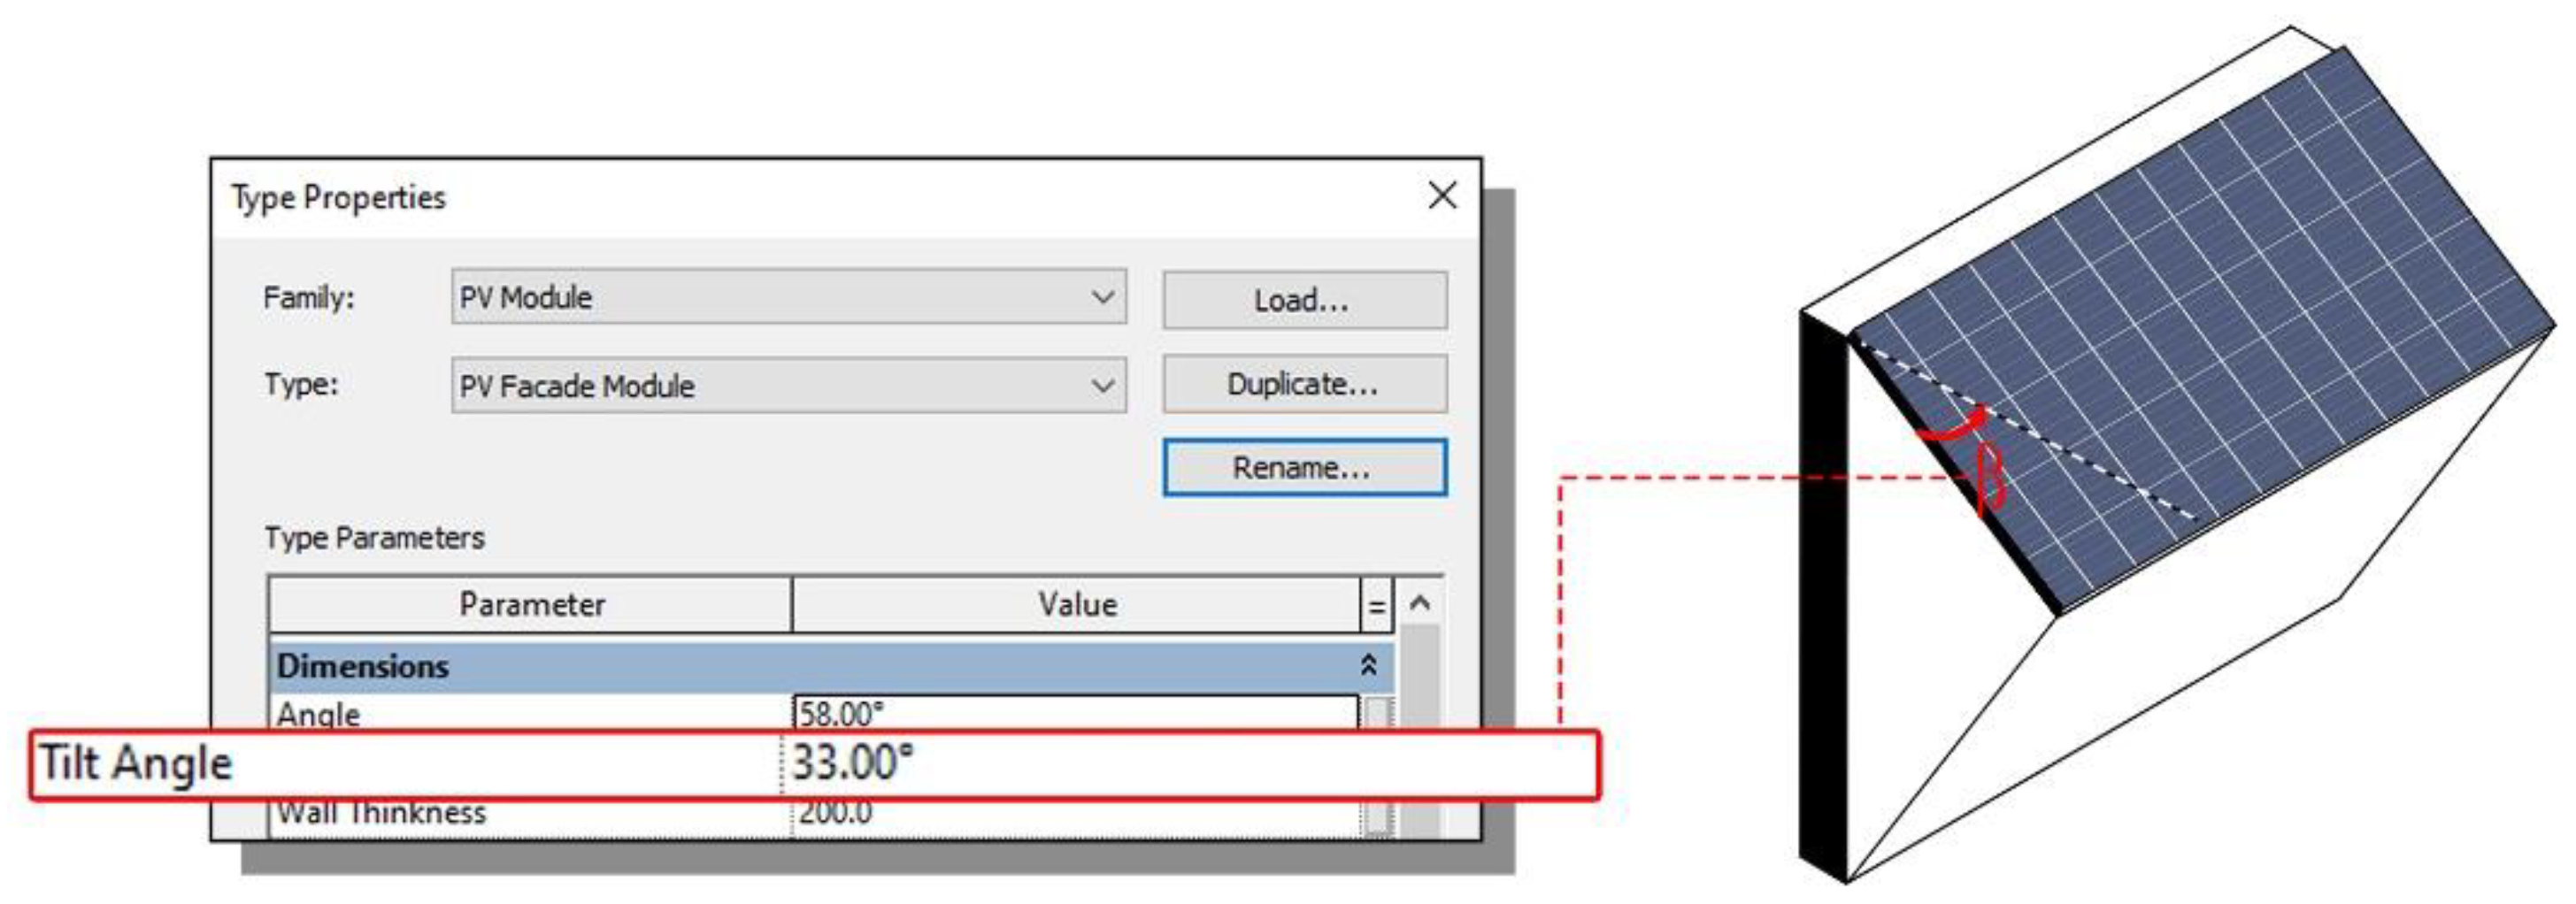
3.3. Solar Panel Optimal Tilt Angle (βo)
The β value, which is a key variable that determines the solar energy production efficiency, represents the angle between the solar panel and the horizontal plane (
Figure 7).
Optimal tilt angle (
βo) values, at which solar panels can produce maximum power generation efficiency, vary depending on the location of the PV panel and the time of the year. In this study, the optimal values for each site were calculated as a function of latitude, as proposed by Emanuele [
21] (Equation (1)).
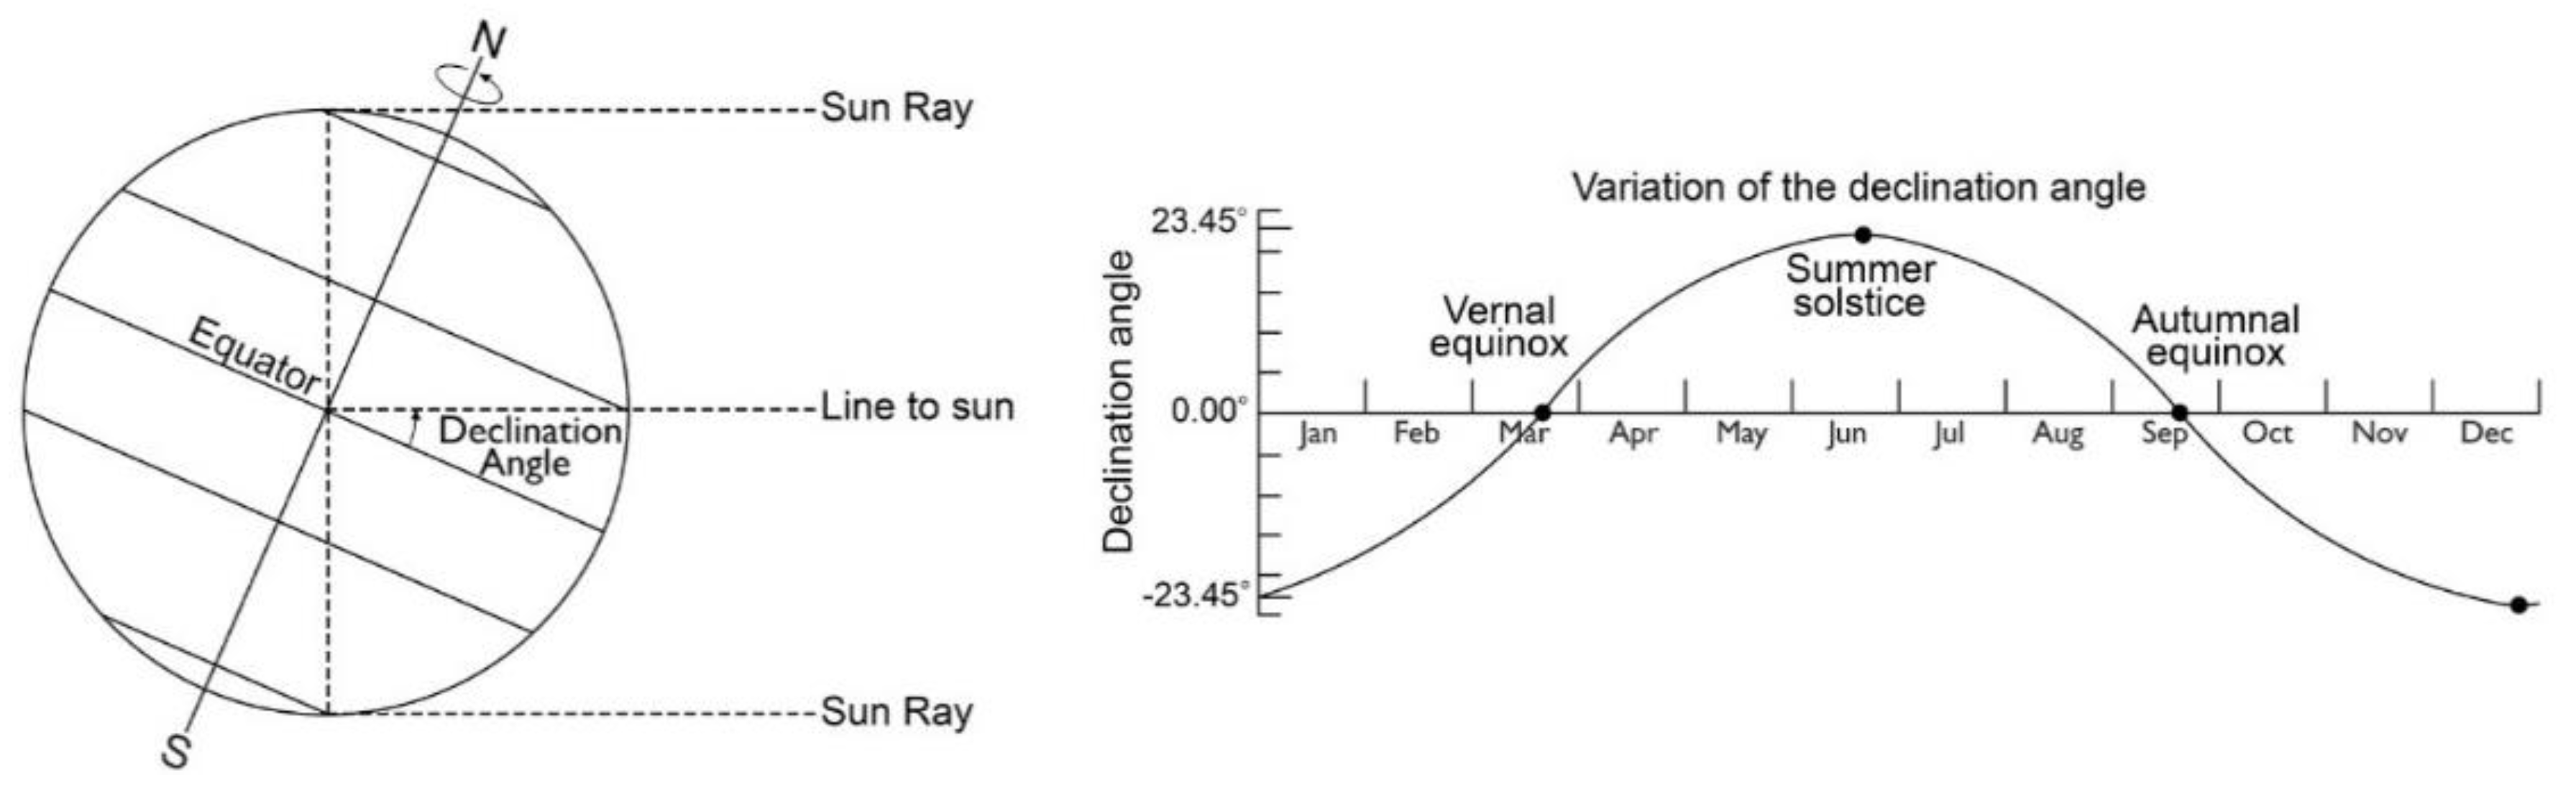
where
βo represents the optimal tilt angle,
φ represents the latitude of the study site, and the coefficients,
a1 and
a2, which are determined monthly based on the latitude, can be obtained from the absolute value of solar declination (
Figure 8) [
22]. Actual values are shown in
Table 5.
Table 6 summarizes the
βo values of the solar panels at each site. The table precisely displays the variation of
βo according to geographical location and sun height. Since the proposed PV façade module requires a fixed
βo value, the optimal value for each study site must be selected from among the derived optimal tilt angles.
3.4. Selection of Optimal Solar Panel Tilt Angle
In this study, the optimal tilt angle values were calculated for each study site on a monthly basis using the process shown in
Figure 9. Initially, the prototype of the PV façade module was modeled. Second, the
βo values were derived based on the solar declination and the coefficients,
a1 and
a2, for each month (
Table 5). Third, irradiation simulations were performed based on the façade module and the corresponding
βo values. Fourth, the modeled PV façade prototype module was installed in the directions determined to be optimal for energy generation based on solar irradiation analysis. Further, energy production simulations were run repeatedly for all the
βo values in
Table 6, and finally, the optimal
βo values of the PV modules that produce the highest energy were selected.
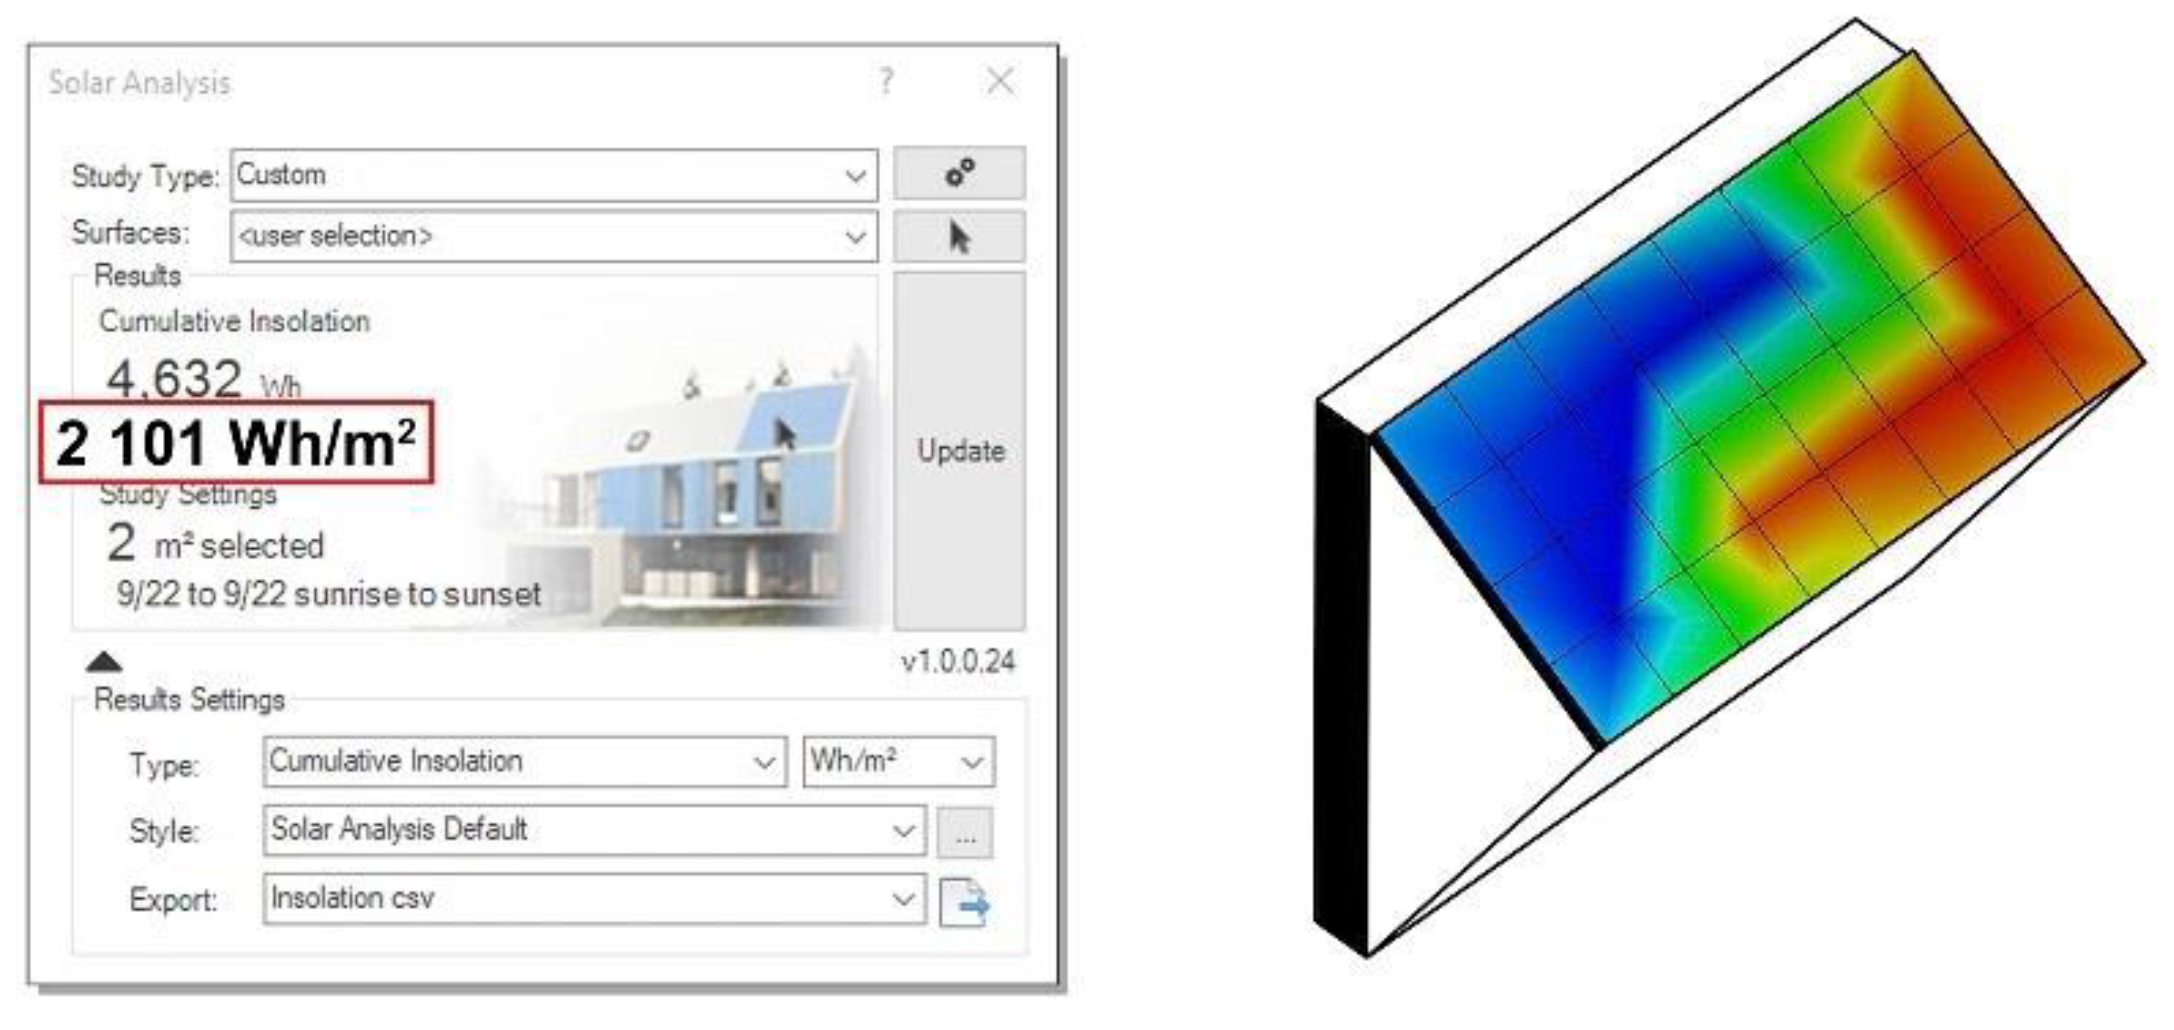
Figure 10 shows an example of a PV façade module prototype with
βo set to 33°; however, this value can be adjusted using the software. In this example, the irradiation simulation process indicated that 2101 Wh·m
−2·d
−1 will be produced on a clear day (
Figure 11).
Table 7,
Table 8 and
Table 9 present the simulated solar energy produced at each study site (Seoul, Gwangju, and Busan, respectively) based on the corresponding
βo value. From these tables, it is evident that the optimal value can vary even with the same façade direction depending on the site. Examining the annual energy production simulation results for the Won-Hyo elementary school showed that the maximum power generated by the PV façades facing the east (
βo = 13.41°), southeast (
βo = 17.73°), south (
βo = 35.35°), southwest (
βo = 38.35°), and west (
βo = 23.94°) directions were 881, 975, 1109, 1134, and 1006 kWh·m
−2·year
−1, respectively.
Table 8 shows the simulated solar energy production results corresponding to the Jung-Ang elementary school. From this table, it is evident that the maximum annual power generation by the PV modules installed on the façades facing east (
βo = 11.32°), south-east (
βo = 15.64°), south (
βo = 33.49°), south-west (
βo = 36.33°), and west (
βo = 22.14°) were 885, 960, 1080, 1110, and 997 kWh·m
−2, respectively.
Further,
Table 9 shows the simulated solar energy production results for the Cho-Rang elementary school, which were very similar to those corresponding to the Jung-Ang elementary school. Specifically, the annual power generation corresponding to the PV façades facing east (
βo = 11.34°), southeast (
βo = 15.66°), south (
βo = 33.51°), southwest (
βo = 36.35°), and west (
βo = 22.15°) were 929, 1009, 1134, 1162, and 1045 kWh·m
−2, respectively.
3.5. PV Module Design
3.5.1. Solar Panel Model Selection
In previous sections, the selected optimal tilt angle (βo) values corresponding to the generation of the maximum solar energy as well as the estimated maximum annual solar power generation, were calculated for the three target elementary schools; however, for practicality, actual solar panels were installed on the building façades of each of the target elementary schools.
Among the solar panel models commercially available in Korea, Hanwha Q. CELLS’ Q.PEAK.DUO L-G6 PV modules, which achieved the largest market share in the U.S. residential and commercial PV module market in the first half of 2020, were selected (
Table 10). This model was selected because its size (2.08 × 1.03 m) is optimal for installation on the standardized façades of the target schools in this study, coupled with its strong power generation efficiency (20.1%) as well as power generation capacity (425 Wp) [
23].
3.5.2. Solar Panel Placement
After installation of the solar panels, shadows are an important factor that can degrade their power generation efficiency [
24]. Thus, each solar panel must be installed to minimize shadow interference in order to realize optimal performance. Additionally, when solar panels are placed on an entire building’s façade, as was the case in this study, grid spacing must be calculated to minimize shadow interference owing to the presence of another solar panel above. For a horizontal shading device, the optimal distance between solar panels (
h) (
Figure 12) can be calculated using Equation (2) [
25]:
where
h represents the distance between the two panels,
D represents the width of the panels, α represents the sun height,
θ represents the solar azimuth, and ω represents the plane azimuth. When the appropriate sun height and solar azimuth corresponding to each study site were used, it was found that no shadow would occur when the distance between panels (
h) was ≥ 3.9 m (
Table 11). Considering that typical elementary school classrooms in Korea have a floor height of 3.5–4 m, it was determined that shadow interference could be eliminated even if the PV façade modules presented in the second image of
Figure 12 were placed on the entire building façade in grid form.
3.6. Application of the Designed PV Modules
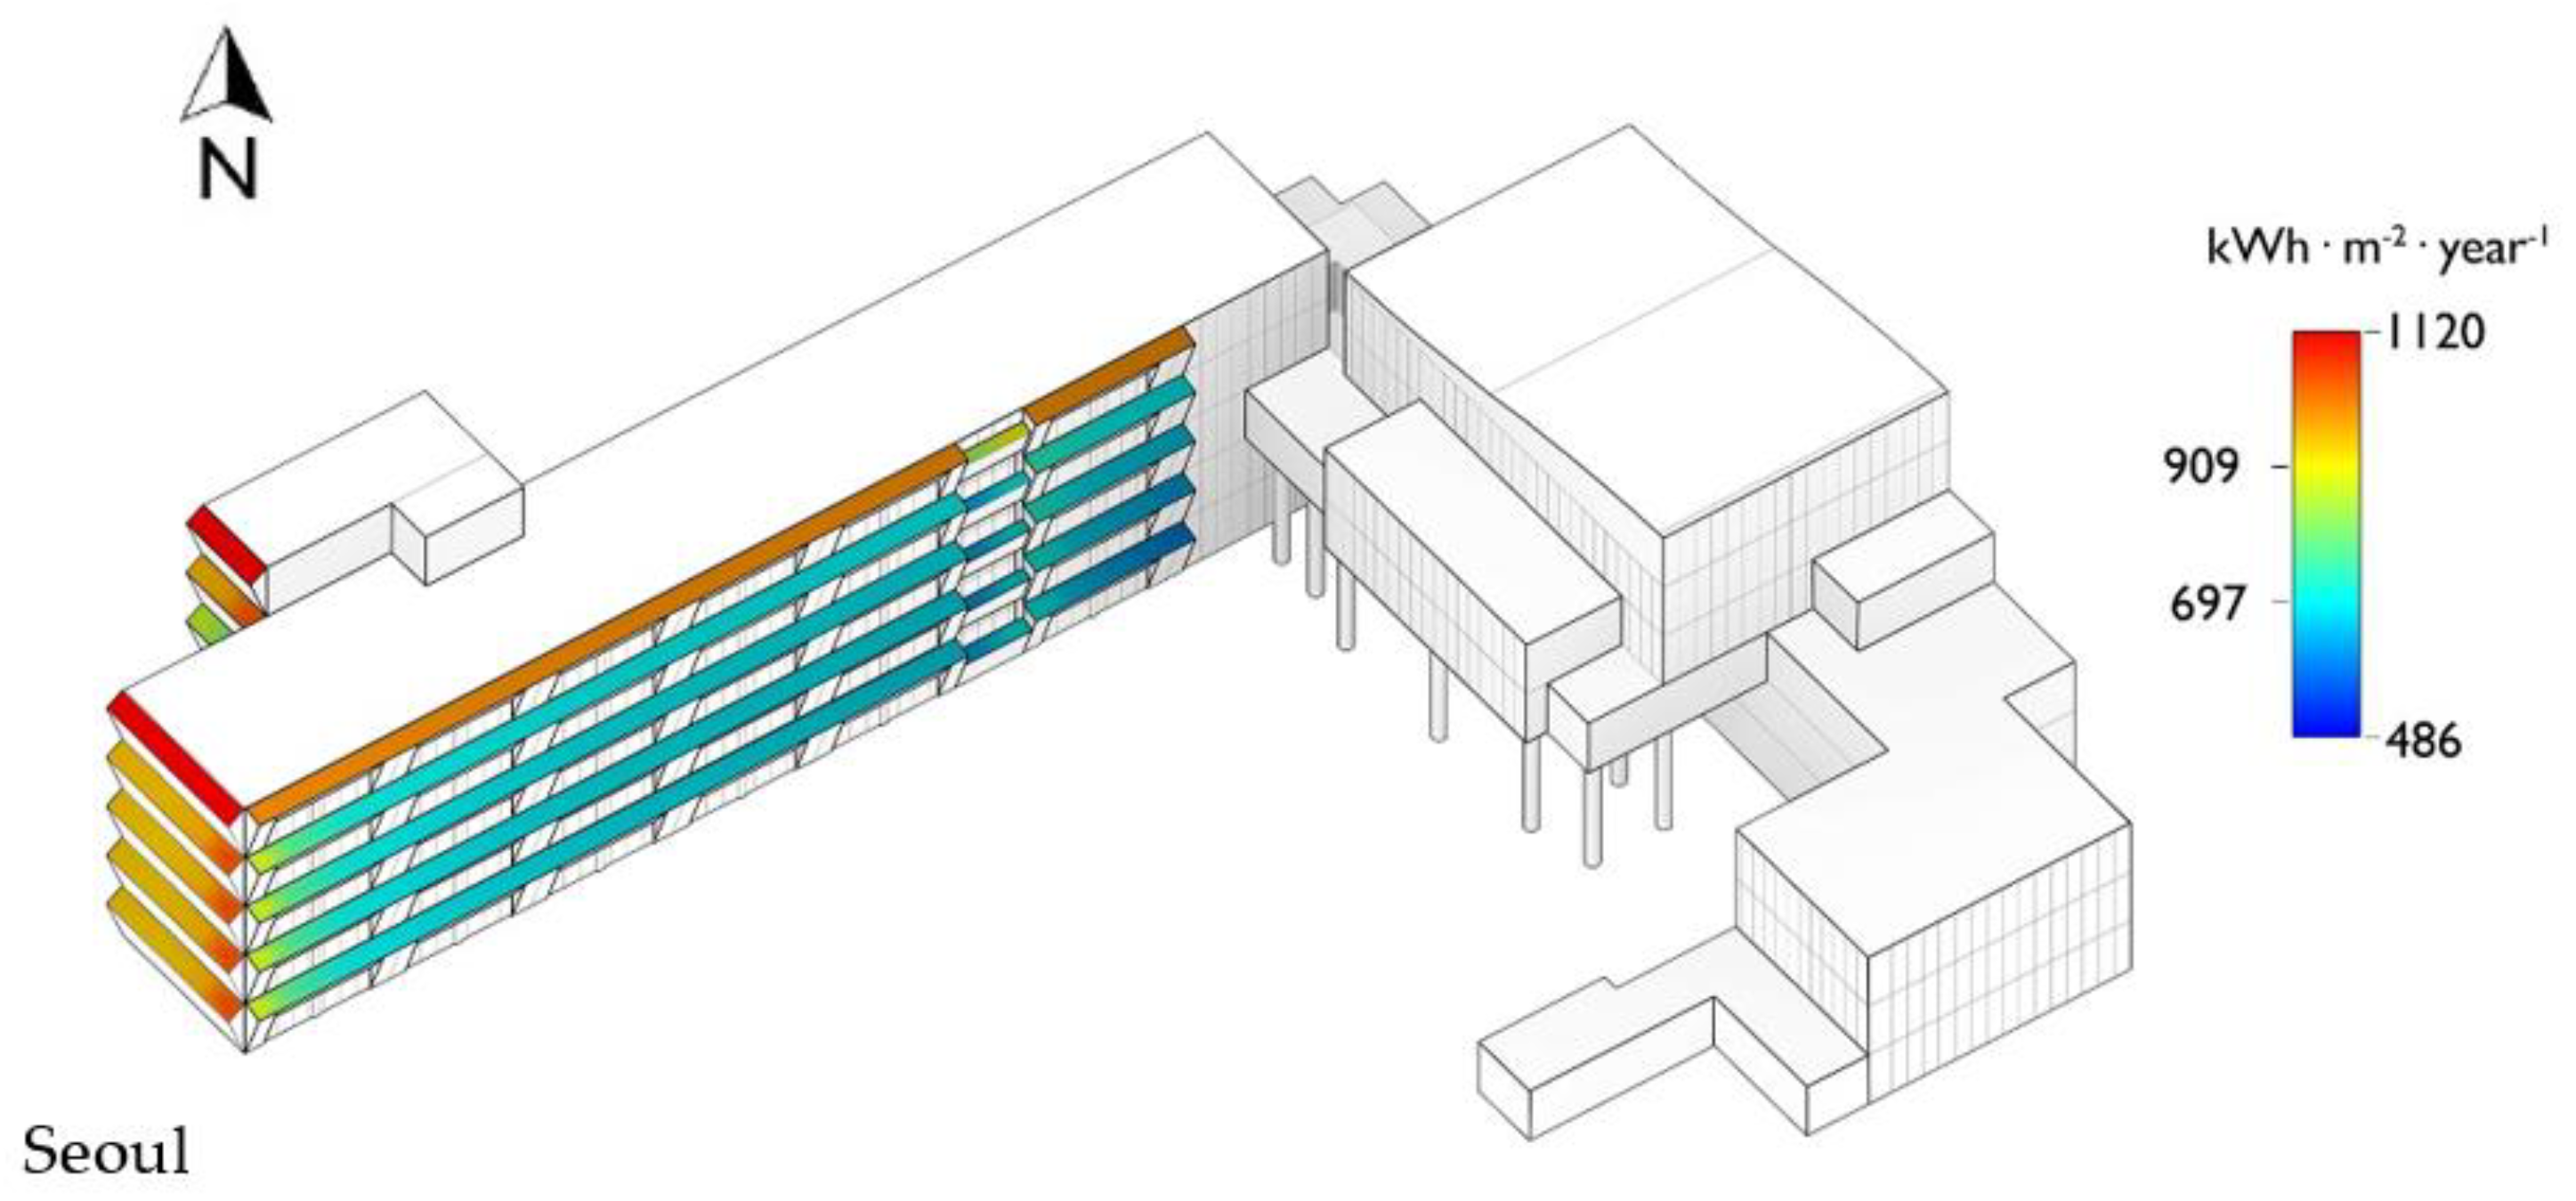
The designed PV modules were then installed on the façades of each of the target elementary school buildings based on the application of the optimal βo value for each façade. This indicates that solar panels were not installed on building façades with insufficient solar irradiation or installation space.
First, for the Won-Hyo elementary in Seoul, the PV façade module was installed on the façades of the main building facing the southeast and southwest directions, covering a total area of 448 m
−2. The simulation results recorded an annual average PSH of 795 h, and an expected power generation of 795 kWh·m
−2·year
−1 (
Figure 13).
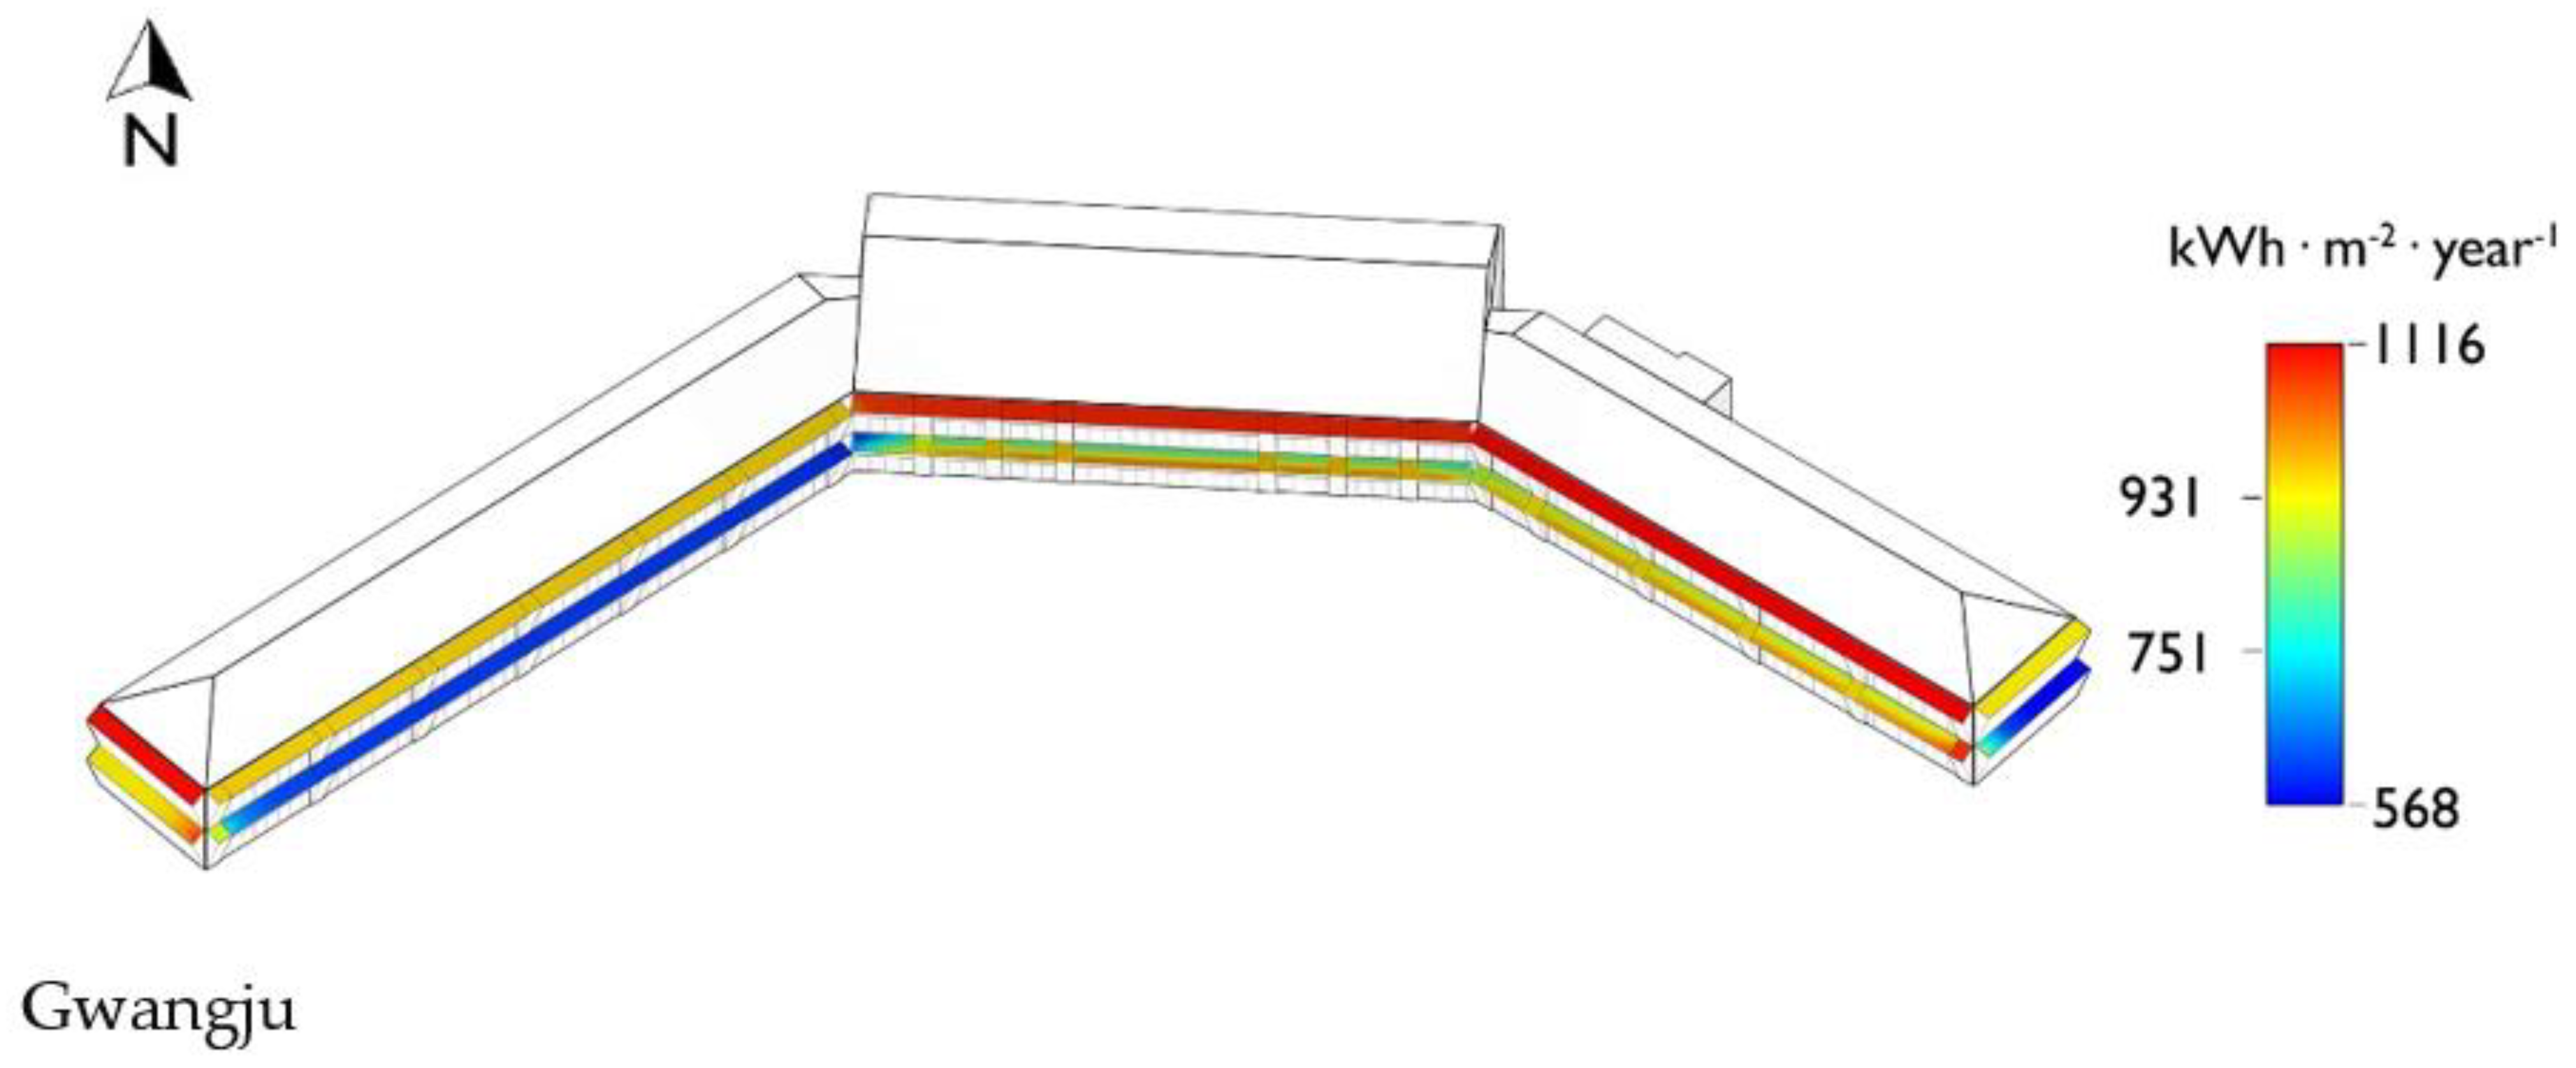
Second, for the Jung-Ang elementary school in Gwangju, the PV module was installed on the façades facing the south, southeast, and southwest directions, covering a total area of 375 m
−2. The simulation results recorded an annual average PSH of 949 h, and an expected power generation of 949 kWh·m
−2·year
−1 (
Figure 14).
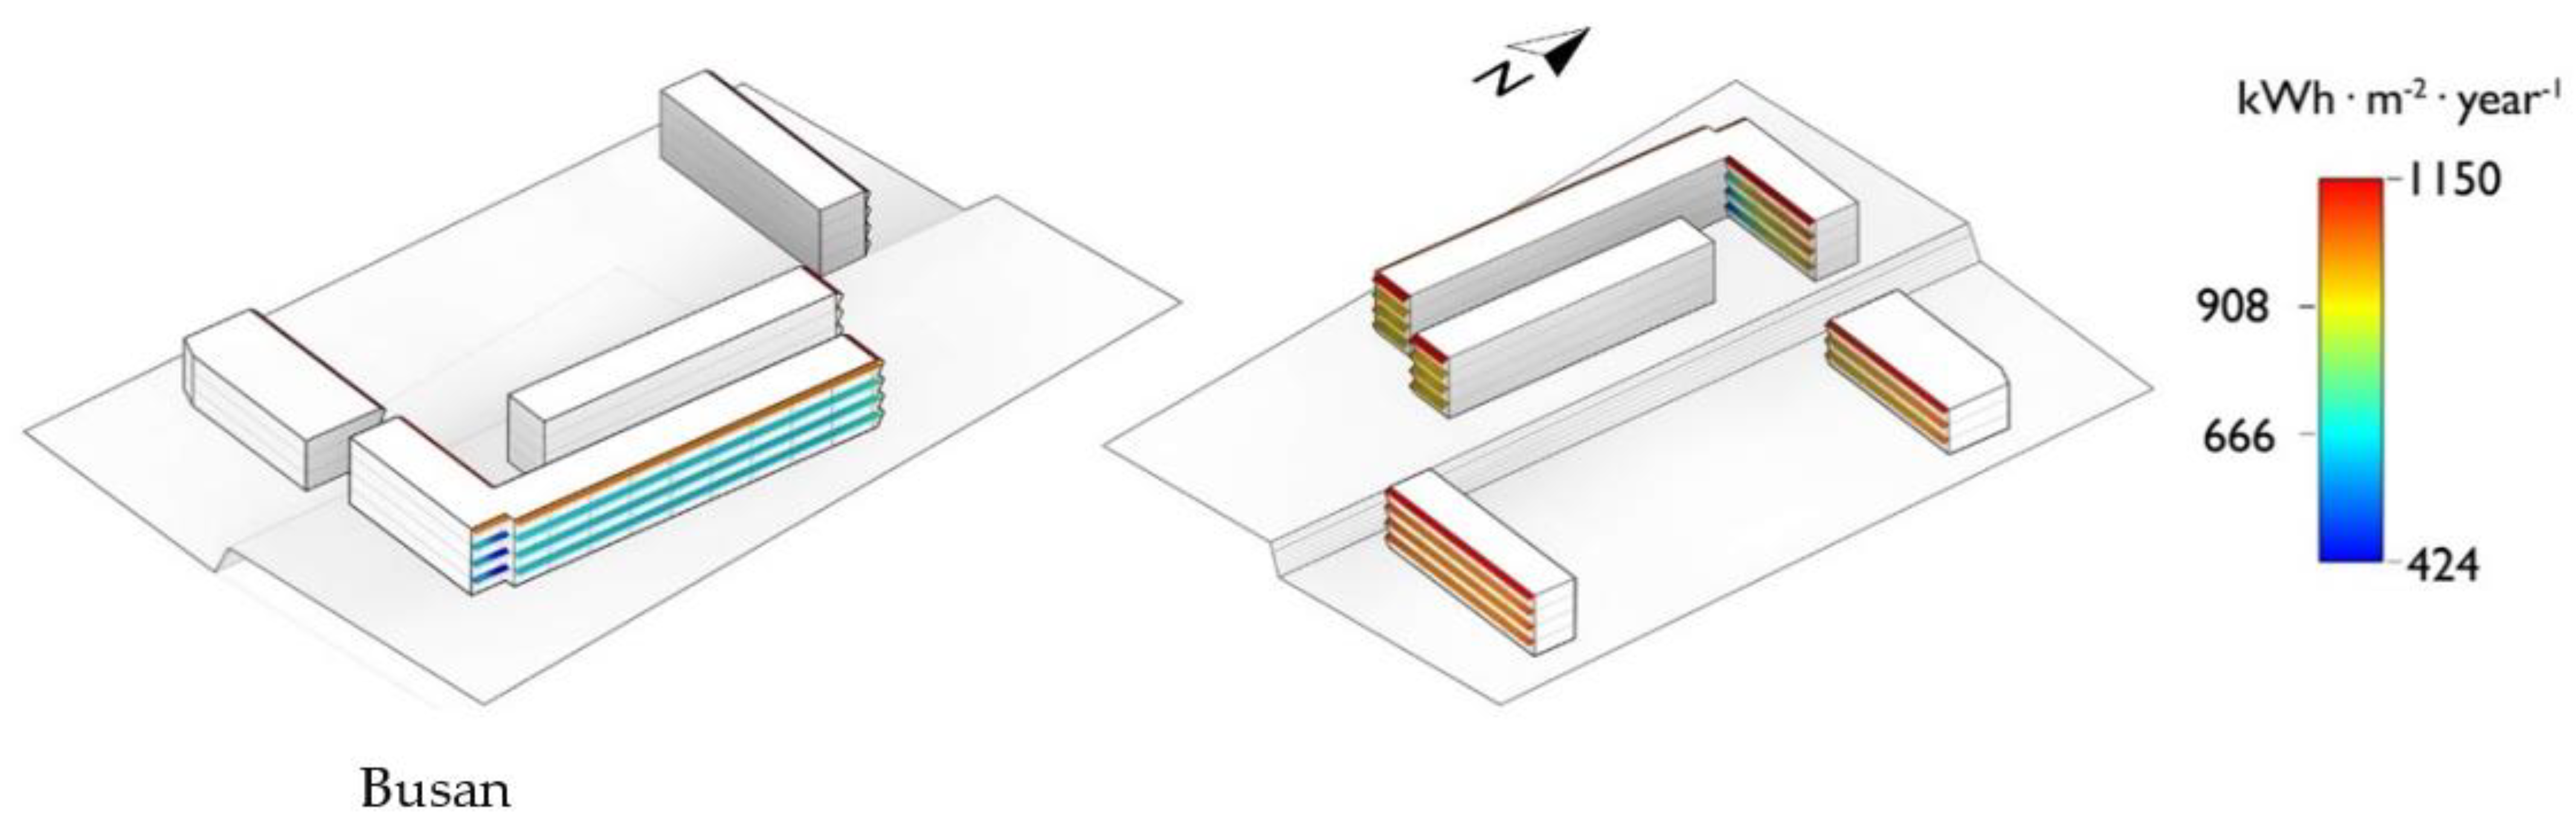
For the Cho-Rang elementary school in Busan, the PV module was installed on the façades facing the south and west directions, covering a total area of 1079 m
−2, which is the maximum, considering all the target schools. The simulation results recorded an annual average PSH of 915 h, and an expected power generation of 915 kWh·m
−2·year
−1 (
Figure 15).
3.7. Power Generation Using the Designed PV Modules
The PV façade modules installed across different areas at each target elementary school produced different amounts of solar energy annually, and this annual solar energy production rate was calculated according to Equation (3) [
26].
where
Pmax,actual, LT, LC, LM, Pmax, and PSH represent the power generated by the PV façade module, temperature loss factor 5.7%, cable loss factor 0.2%, module loss factor 3% [
27], maximum power of PV module, and peak solar hours, respectively.
Further, the expected solar energy production per year for the elementary schools in Seoul (PV module installation area = 448 m
−2), Gwangju (PV module installation area = 375 m
−2), and Busan (PV module installation area = 1079 m
−2) were found to be 64,498 kWh, 64,446 kWh, and 178,790 kWh, respectively (
Table 12).
4. Results
4.1. Optimal Solar Panel Tilt Angle for Each Study Site
In this study, it was observed that the optimal tilt angles vary based on the geographical latitude of the study site as well as the installation direction of the panel.
Table 13 summarizes the optimal solar panel tilt angle values corresponding to when the solar panels were installed on the building façades at the target schools.
4.2. Solar Energy Production and Designed Solar Panel Effects
The expected total solar energy production from the three target schools was 307,734 kWh·year
−1 (
Table 14), which is sufficient power to light 8431 LED bulbs (10 Wh) for 10 h each day. In addition to energy production, the reduction in CO
2 emissions due to the generation of renewable power using the solar panels was also calculated by multiplying the standard CO
2 emissions rate (0.4415 tCO
2·MWh
−1) [
28] by the simulated solar energy production (MWh·year
−1). Thus, a CO
2-emission reduction potential of 135.8 tCO
2·year
−1 was derived.
5. Discussion
In this study, a PV module for installation on building façades in elementary schools in Seoul, Gwangju, and Busan (South Korea) was developed. The module installation and the resulting energy production were simulated using the Revit software. Among the educational facilities in Korea, this study was focused on elementary schools owing to their standardized façade design, which could greatly facilitate the country-wide implementation of the designed PV modules. Furthermore, the solar energy produced could increase the energy independence of the educational facilities. In the field of architectural design, it may be possible to develop building materials and construction methods for the design of solar panel façades. This proposed method, which involves incorporating solar panels on building façades also expands PV module potential beyond the most common mode of installation, i.e., on building rooftops.
Given that the developed PV façade modules would inherently be installed perpendicular to the ground surface, they must be installed at a certain tilt angle for the maximum solar power generation efficiency. In this study, it was observed that the highest energy production efficiencies at the Won-Hyo elementary school (Seoul) corresponded to tilt angles of 17.73° and 38.35° on the southeast- and southwest-facing façades, respectively. At the Jung-Ang elementary school (Gwangju), the highest energy production efficiencies corresponded to tilt angles of 15.64°, 33.49° and 36.33° on the southeast-, south- and southwest-facing façades, respectively, and in the Cho-Rang elementary school (Busan), they corresponded to tilt angles 33.51° and 22.15° on the south- and west-facing façades, respectively.
Further, when the PV façade modules were virtually installed, the annual solar energy production for the elementary schools in Seoul, Gwangju, and Busan, where the PV module installation areas are 448, 375, and 1079 m−2, respectively, were found to be 64,498 kWh, 64,446 kWh, and 178,790 kWh, respectively. Furthermore, the total solar energy produced from the three target elementary schools was 307,734 kWh·year−1, which can significantly increase the energy independence of educational facilities. The calculated corresponding CO2 emission reductions were also found to be significant.
Global environmental pollution and the need to replace fossil fuels have led to the aggressive pursuit of renewable energy production technologies. Specifically, renewable energy utilization plans, such as the Green New Deal Policy put forward by the Korean government, can be directly applied to public school facilities, and the results can have a significant ripple effect all across the country. Furthermore, the scope of this study can be extended to high-rise apartment and residential buildings in Korea and across Asia, and it is likely that this study will develop interdisciplinary research collaborations involving urban and architectural planning as well as new material engineering fields. Our research focused on architectural design from the perspective of renewable energy provision. For location data pertaining to on-site use of the electricity produced by PV, as well as exported electricity and the introduction of electric storage, we will collaborate with experts in the electrical and electronic engineering field in future research.


