Abstract
A flow visualization study was carried out for flow boiling in a rectangular channel filled with and without metallic random porous media. Four main flow patterns are observed as intermittent slug-churn flow, churn-annular flow, annular-mist flow, and mist flow regimes. These flow patterns are clearly classified based on the high-speed images of the channel flow. The results of the flow pattern map according to the mass flow rate were presented using saturation temperatures and the materials of porous media as variables. As the saturation temperatures increased, the annular-mist flow regime occupied a larger area than the lower saturation temperatures condition. Therefore, the churn flow regime is narrower, and the slug flow more quickly turns to annular flow with the increasing vapor quality. The pattern map is not significantly affected by the materials of porous media.
1. Introduction
Flow through porous media is an important topic in various scientific and engineering fields such as groundwater hydrology [1], filters [2], mixers [3], catalytic reactors [4], and heat exchangers [5]. Open-cell metal foam is a typical irregular metallic porous medium [6]. The skeletal portion of the metal foam consists of many nodes and struts by Plateau’s border network [7]. Among characteristics of porous media, in particular, since high porosity open-cell metal foam has a very high heat transfer area, the performance of the heat exchanger can be improved. Many research groups have conducted studies with compact heat exchangers with metal foam and found an improved heat transfer performance, especially in case of single-phase liquid or gas flows [8,9,10,11,12,13,14].
The effect of the metal foam structure on the two-phase flow heat transfer when the phase change occurs inside the metal foam heat exchanger is an interesting topic. The porous media structure in the two-phase gas-liquid flow forms more nucleation and break down bubbles. In addition, porous media makes the flow field more uniform [15,16]. The porous media improves heat transfer performance by the aforementioned reasons. However, it can be expected that boiling phenomena in a channel filled with porous media are not common. In other words, a rectangular channel filled with porous media is expected to have different boiling heat transfer properties than those without porous media [17].
Topin et al. [18] studied on the convective boiling heat transfer of n-pentane flowing through a rectangular channel filled with porous medium, which is 40 PPI (pores per inch) copper foam. In biphasic conditions, the convective boiling regime showed significant heat transfer enhancement with very low-pressure drops. Zhao et al. [19] conducted experimental studies on the flow boiling heat transfer of R134a refrigerant flowing through a horizontal tube filled with porous media of 20 and 40-PPI copper foams. They also found heat transfer enhancement due to the porous media. Li and Leong [20] studied the flow boiling characteristics of water and FC-72. They examined the heat transfer process before nuclear boiling, the onset of nuclear boiling, and the hysteresis effect using numerical simulation and experiments. They found that boiling heat transfer is highly dependent on the two-phase flow pattern.
Baker [21] proposed the first flow pattern map for two-phase gas-liquid flow by observing the flow of gas and oil inside a horizontal pipe. Since then, many studies on two-phase flow pattern maps have been attempted. Among them, the most famous flow pattern maps are Hewitt and Roberts [22] for vertical flows and Mandhane et al. [23] for horizontal flows. However, most of the two-phase flow pattern maps are made by a controlled mixture of gas and liquid flow rates.
To characterize two-phase flow boiling, flow pattern mapping is a commonly used method. Zhao et al. [19] found two different flow patterns in the channel filled with 20 and 40-PPI copper foam by the local temperature fluctuation patterns. They named the two patterns as annular flow and wavy flow. An annular flow is a form in which liquid is evenly distributed throughout the channel, and a wavy flow is a form in which the liquid partially wets the channel wall. The flow patterns are subdivided into five flow patterns: stratified wave, slug/wave, plug/slug, plug, and annular flow, which are determined by mass flow and vapor quality [24].
Li et al. [25] carried out visualization study on the flow of R141b in filled channel with 20-PPI cooper foam. In this study, as a result of analyzing the boiling heat transfer performance and then analyzing it together in comparison with the flow pattern, an interesting correlation was found between HTC (Heat transfer coefficient) and the flow pattern. Overall, heat transfer has been greatly reduced when dry out occurs. The HTC increased with nucleation boiling and decreased from a specific vapor quality point. Recently, Kim et al. [26] discovered three different flow patterns (the intermittent flow, churn-annular flow, and annular-mist flow regime) in the planar channel through the results of experiments conducted with flow boiling heat transfer in a rectangular channel filled with open-cell copper foam (18-PPI, porous media). At lower vapor qualities, HTC increased as bubbles formed, and HTC increased greatly in the middle of the annular flow regime.
Until now, there have been studies that various flow patterns appear when flow boiling heat transfer occurs in pipes or channels with metal foam. However, a systematic study on the flow patterns at a wide range of boiling heat transfer parameters have not been conducted. This study is aimed to provide a two-phase flow pattern map when flow boiling occurs in a channel with metal foam using the flow visualization method for various conditions of vapor quality and mass flow rates. At the same condition, the two-phase flow patterns of the channel without metal foam are compared to find the effect of metal foam on the flow characteristics and boiling heat transfer.
2. Materials and Methods
2.1. Porous Media Specimens
The metallic foam used as porous media in this study is made of nickel and copper (Foamtech Global, Inc., Hwaseong, Korea). Figure 1a shows the 24-PPI nickel foam specimen. The detail structures of the windows, fibers, and pores were shown by SEM images as Figure 1b. The diameter values were measured by the SEM image by averaging 50 data points, which corresponds to 1.07 mm. Meanwhile the porosity of all samples was measured based on the perfect gas law properties using the method described by Beranek [27]. Porosity was measured by a custom-made pycnometer with a gauge pressure range of 0–350 kPa and an accuracy of 0.015% at the whole measurement range verified with a block gauge of 0.12 µm tolerance. The measurable porosity range was 0.87–0.93, and this porosity was measured in a previous study [11]. According to Table 1, the porous media made of copper are larger in diameter than those made of nickel. From the measurement results, the copper foam has a value of 18-PPI while the nickel is 24-PPI. Measured porosity of Cu and Ni foam was 0.89 and 0.92, respectively.
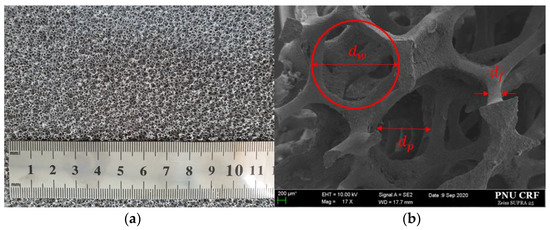
Figure 1.
Real-size images (a) and SEM images of porous media (b).

Table 1.
Geometrical characteristics of porous media.
2.2. Test Section of Experiments
The test module consists of the refrigerant-side channel and the hot water-side channel, and the thermal energy transfers through a 2-mm-thick stainless-steel sheet. The two-phase flow inside the test section was photographed with a camera through a Pyrex glass window. The refrigerant side has a vertical upward flow, and this direction is the counter flow to the hot water side, as shown in Figure 2. Since the channel is bolted rather than soldered, it is easy to convert the sample inside the channel to another sample. The hot-side channel was filled with the nickel porous foam sample to create a high-turbulence flow and a uniform temperature distribution. Between the plates, Vitron O-rings were used to prevent leakage. The size of porous media is 300 mm by 50 mm, the thickness is 50 mm, and porous media is located at the center of the main channel. The detailed dimensions of a test section are shown in Table 2. Because the same shape test section has been used in previous studies, this Table 2 has come from a previous paper [26]. Figure 2 is the configuration figure of the test section.
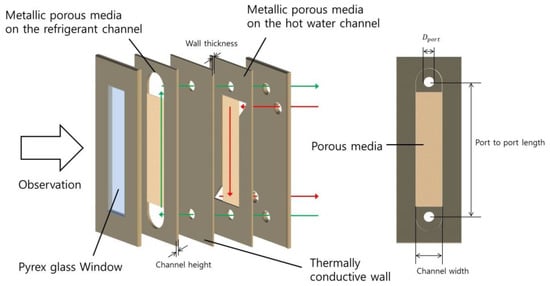
Figure 2.
Model of a test section figure.
Table 2.
Detailed dimensions of test module and metallic porous media.
2.3. Test Loop
Figure 3 shows the test loop. The test loop was constructed using a total of four different loops (a hot-water loop, a cooling-water loop, a R245fa loop, and a preheating water loop) to visualize the two-phase flow in a channel filled with porous foam and to measure the saturation boiling heat transfer of R245fa. The porous foam is located between the R245fa loop and the hot water loop. R245fa, which was used as the working fluid, circulated through the loop by a gear pump (Tuthill-DGS1), and its flow rate was measured with a gear-type flow meter (KEM-ZHA04) with a digital indicator.
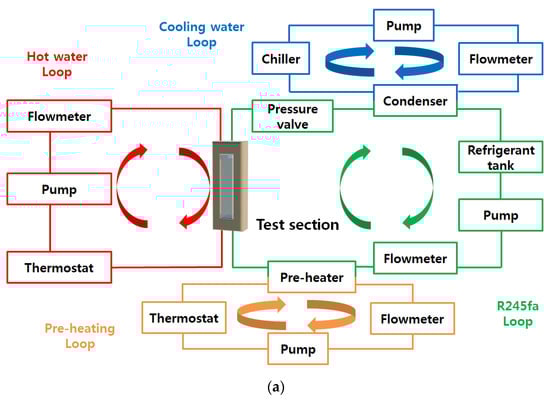
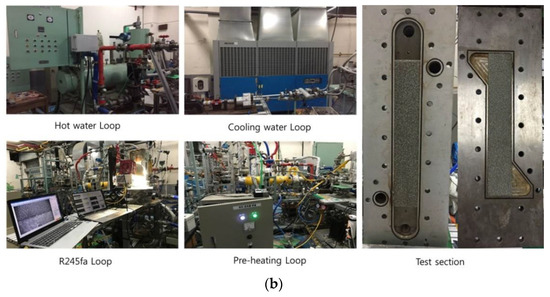
Figure 3.
Block diagram of the test loop (a) and actual pictures (b).
In the hot-water loop, a thermostat system consisting of a 30 kWe electric heater and a PID temperature controller was used to supply the desired heat energy to the test section. Meanwhile, among the experimental conditions, the vapor qualities of the incoming refrigerant are very important. The refrigerant heated by the hot water loop in the test section was cooled again by the cooling water loop in the condenser. Then, the desired condition of refrigerant was made through the pre-heater of the pre-heating loop and was re-injected to the test section. The pre-heating loop can cover a large range of heat capacity from 0 to 120 kWe, and it can use desired specifications of refrigerants. Pressure transducers and T-type thermocouples were used to measure the pressure and temperature of the inlet and outlet of all components of the loop during the experiment. The pressure at the inlet of the test section keeps it constant at saturation pressure during test loop operation because it is controlled by a pressure-regulating valve located downstream from the outlet port.
The experimental device in this study was connected to the data-gathering system (National Instruments). All values such as flow rate and pressure collected from the measuring device were collected with the LABVIEW program.
2.4. The Vapor Quality
As described above, temperature and pressure were measured in real time and data were collected, but the vapor quality is not a value that can be determined by measurement. In particular, when determining vapor quality values under saturated conditions indirectly calculated, we measured the heat transfer rate of single-phase liquid flow on the hot surface. In this study, the vapor quality value in the test section was estimated using the vapor quality at the outlet of the preheating loop, and can be calculated using the following equation [28].
where is the latent heat of the refrigerant and the heat transfer rate of the preheating water source, it is determined with
In this study, the thermodynamic equilibrium quality [29] was adopted to express the vapor quality in a saturated condition, which can be given on the basis of thermodynamic properties, as in Equation (3).
If this thermodynamic equilibrium quality is zero, it indicates saturated liquid, and 1 means saturated vapor. Likewise, this indicates that in the subcooled liquid state is x < 0, and the superheated vapor is x > 1.
The vapor quality change of the refrigerant through the test section, Δx, is derived from the heat transfer rate of the hot water side in the test section [30]:
3. Results
3.1. Classification of Flow Pattern
Visualization of the two-phase flow in the test section was taken using a high-speed camera (Phantom VEO410L, Wayne, NJ, USA). The visualization results were classified according to the mean vapor quality, , and the flow pattern can be confirmed through this result. The four flow patterns are observed as intermittent slug-churn flow, churn-annular flow, annular-mist flow, and mist flow in this study. The following shows the shape of the flow pattern observed in the test section.
3.1.1. Intermittent Slug Flow
In a two-phase flow, the slug flow is a pattern in which a gas, a lighter fluid, forms a bubble slug in the shape of a large bullet. In general, slug flow means heavier and slower fluid. However, slug flow in this study means lighter fluid bubbles. Therefore, it can be seen that the slug flow moves faster than the surroundings. Figure 4 shows the slug-churn flow patterns observed from the plain rectangular channel (a) and the copper foam structure filled channel (b). The conditions of the results below are mass flux (G) = 133, t = 0.0167 s, and mean vapor quality of 0.13 and 0.12, respectively.
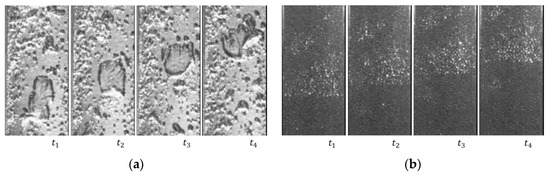
Figure 4.
Flow patterns observed from the plain rectangular channel (a) and the copper porous media filled channel (b) at mean vapor quality are (a) = 0.13, (b) = 0.12.
In the plain rectangular channel, a slug is clearly observed, and it is confirmed that small bubbles are continuously generated at the walls where heat energy is transferred; these bubbles enter into the channel flow. It can be seen that the bubble slug is divided or that it changed the direction of flow by the influence of small bubbles starting from the wall. In a channel filled with porous media, the bright part is the gas phase, and the dark part is the liquid phase. From this result, it is also confirmed that the gas flow shows a slug pattern.
3.1.2. Churn-Annular Flow
As mentioned in Section 3.1.1, the bubble slug is divided by the influence of small bubbles generating from the wall. As the vapor quality increases and this phenomenon intensifies, the bubble slug collapses and disrupts the flow. Wavy patterns are observed due to a time-varying characteristic of the flow, as shown in Figure 5.
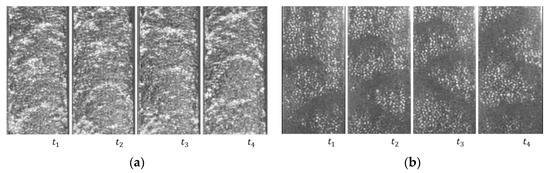
Figure 5.
Flow patterns observed from the plain rectangular channel (a) and the copper porous media filled channel (b) at mean vapor quality are (a) = 0.48, (b) = 0.48.
The conditions of the results below are mass flux (G) = 133, t = 0.0167 s, and mean vapor quality are 0.48 for both (a) and (b). In the empty rectangular channel, a deviating flow is observed in the center, and it shows a wavy pattern. Interestingly, the flow on the wall was observed to retreat due to the influence of the flow in the center. However, in the channel filled with the porous media, it can be seen that the boundary in the spanwise of the flow becomes very flat due to the influence of the porous media.
3.1.3. Annular-Mist Flow
When the mean vapor quality is 0.8 or higher, the wavy pattern disappears inside the channel and the stratified liquid film flow can be observed as shown in Figure 6. The conditions of the results below are mass flux (G) = 133, t = 0.0167 s, and mean vapor quality are 0.87 and 0.82, respectively. The wavy pattern tail away with increasing vapor quality. As a result, annular-mist flow is formed not only in the channel filled with porous media, but also in the plain rectangular channel.
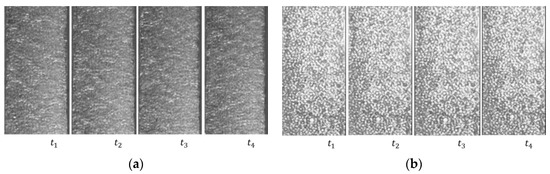
Figure 6.
Flow patterns observed from the plain rectangular channel (a) and the copper porous media filled channel (b) at mean vapor quality are (a) = 0.87, (b) = 0.82.
3.1.4. Mist Flow
When the mean vapor quality is above 0.9, the dry-out region finally widens, and only very small liquid particles are observed, as shown in Figure 7. The conditions of the results below are mass flux (G) = 133, t = 0.0167 s, and mean vapor quality are 1.02 and 1.07, respectively.
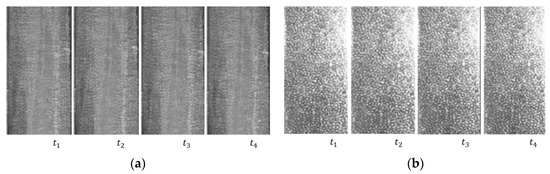
Figure 7.
Flow patterns observed from the plain rectangular channel (a) and the copper porous media filled channel (b) at mean vapor quality are (a) = 1.02, (b) = 1.07.
3.2. Experimental Flow Pattern Map
Figure 8 shows the flow pattern map of the plain channel and the channel filled with copper 18-PPI porous media at a saturation temperature of 68.8 ℃ based on the vapor quality and mass flow flux. Each symbol in the pattern map represents the four flow patterns introduced in Section 3.1 (such as slug flow, churn-annular flow, annular-mist flow, and mist flow). In both the plain channel and the channel filled with porous media, it was confirmed that as the mass flux increased, the slug flow occurred in a narrower range of mean vapor quality. As the mass flux increased, the slug flow gradually changed to the churn-annular flow regime. The slug flow could not be seen at the highest mass flux (G = 600) in this study.
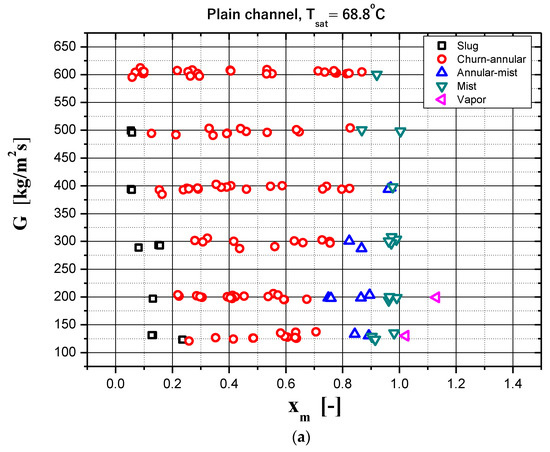
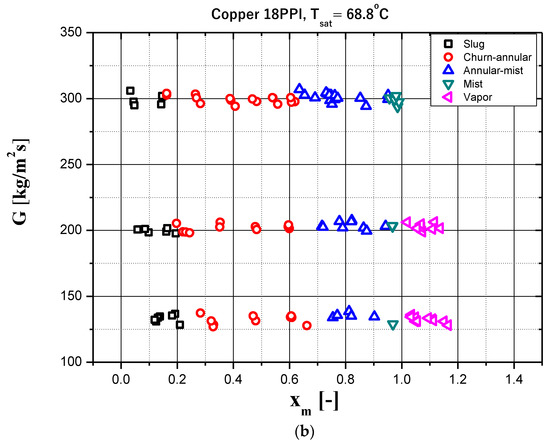
Figure 8.
Flow pattern maps based on the vapor quality and mass flux (a) in a plain channel and (b) in 18-PI copper porous media filled channel at Tsat = 68.8 °C.
On the other hand, it can be clearly seen that the area of the churn-annular flow area with the wavy liquid film pattern is widening as the mass flow flux of the planar channel increases. In other words, it can be inferred that not only slug flow, but also annular-mist flow, is converted to churn-annular flow under higher mass flux conditions. However, in the channel filled with porous media, the churn-annular flow was observed only when the mean vapor quality, , was less than 0.6, even when G = 300. Instead of churn-annular flow regime, the area of annular-mist flow regime is wider along to the increasing mass flux. For this flow, the wavy pattern of the liquid film is not observed; instead, a liquid film with droplets floating inside the porous media is observed. A mean vapor quality of 1.0 shows mist flow in all experimental cases, thus confirming the dry-out phenomenon.
The flow pattern map according to the change of saturated temperature can be seen in Figure 9. As the increased, the annular-mist flow regime occupied a larger area than the lower condition. Therefore, the churn flow regime was narrower, and the slug flow more quickly turned to annular flow with the increasing vapor quality.
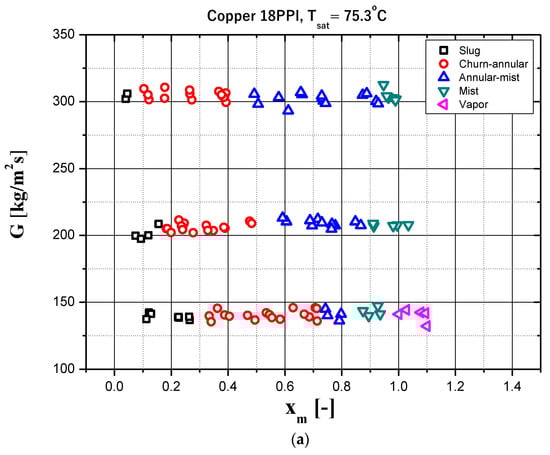
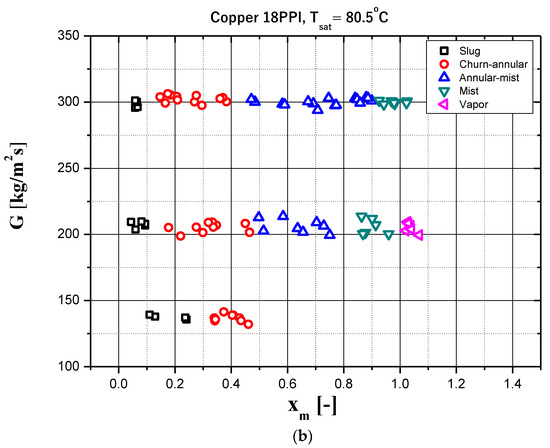
Figure 9.
Flow pattern maps based on the vapor quality and mass flux in 18-PPI copper porous media filled channel (a) at Tsat = 75.3 °C and (b) Tsat = 80.5 °C.
The flow pattern map of the channel filled with 24-PPI nickel porous media is shown in Figure 10 to study the effects of the different types of metallic porous media. The flow pattern map of nickel foam is different from that of copper foam at = 68.8 °C. According to Table 1, though nickel foam has a higher PPI, the porosity of nickel foam is higher than copper foam because of the thinner fiber thickness of the porous structure. The flow pattern map of the nickel foam is generally similar to that of the copper foam when compared to that of the plain channel.
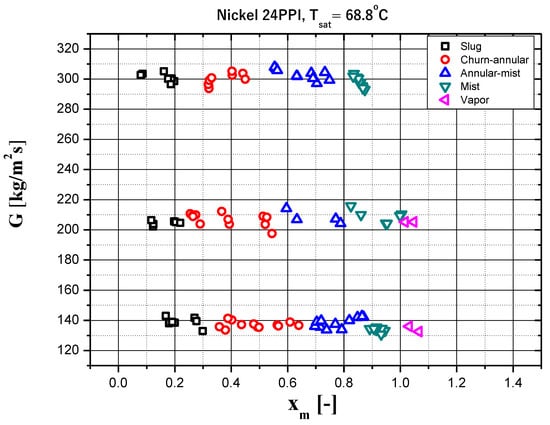
Figure 10.
Flow pattern maps based on the vapor quality and mass flux in 24-PPI nickel porous media filled channel at Tsat = 68.8 °C.
4. Discussion
According to the flow pattern map of the plain channel and the channel filled with copper 18-PPI porous media at a saturation temperature of 68.8 °C based on the vapor quality and mass flow flux (Figure 8), the intermittent slug flow tends to disappear with higher mass flux. This is explained by the bubbles; slugs quickly coalesce to form elongated bubbles and the higher turbulence flow breaks the bubbles that lead to churn-annular flow. It can be inferred that not only slug flow, but also annular-mist flow, is converted to churn-annular flow under higher mass flux conditions. Meanwhile, for the flow in a channel filled with porous media, the wavy pattern of the liquid film is not observed; instead, a liquid film with droplets floating inside the porous media is observed. Additionally, as the increased, the churn flow regime is narrower and the slug flow more quickly turns to annular flow with the increasing vapor quality.
The two-phase flow pattern transition line proposed by Taitel et al. [31], Kaichiro and Ishii [32], Akbar et al. [33], and Chen et al. [34] is assessed with the current experimental results. These flow pattern maps are based on the superficial liquid and vapor velocity, which are calculated as below:
The published transition lines are mainly focused on the low vapor quality conditions, and they predict the transition line between the slug flow and the annular flow regime. Akbar et al. [33] tried to model the flow pattern map based on the Weber number, which explains the boundary line of dispersed flow and annular flow. However, there was no study to predict the boundary line of annular flow and mist flow so far.
5. Conclusions
The two-phase flow pattern map of flow boiling has been successfully made by the flow visualization study when the flow boiling occurred in a rectangular channel with or without a metallic random porous medium. As the two-phase flow passes through the channel, the four main flow patterns are observed as intermittent slug-churn flow, churn-annular flow, annular-mist flow, and mist flow.
Intermittent slug flow is a pattern in which a gas, a lighter fluid, forms a bubble slug in the shape of a large bullet. It can be seen that a gas flow made slug moves faster than the surrounding liquid flow. The bubble slug is divided by the influence of small bubbles generating from the wall, and as the vapor quality increases and this phenomenon intensifies, the bubble slug collapses and disrupts the flow. This pattern is a churn-annular flow regime; due to the bubble slug collapses, the flow inside the channel becomes chaotic as a whole. Wavy patterns are observed due to a time-varying characteristic of the flow. The wavy pattern tails away with increasing vapor quality. As a result, annular-mist flow is formed not only in the channel filled with porous media, but also in the plain rectangular channel.
As the increased, the annular-mist flow regime occupied a larger area than the lower condition. Therefore, the churn flow regime was narrower, and the slug flow more quickly turned to annular flow with the increasing vapor quality. The pattern map is not significantly affected by the materials of porous media.
Author Contributions
Conceptualization, Y.K. and K.C.K.; methodology, Y.K.; software, D.Y.K.; validation, Y.K., D.Y.K. and K.C.K.; formal analysis, Y.K.; investigation, Y.K. and D.Y.K.; writing—original draft preparation, Y.K.; writing—review and editing, D.Y.K.; visualization, Y.K. and D.Y.K.; supervision, K.C.K.; project administration, K.C.K.; funding acquisition, K.C.K. All authors have read and agreed to the published version of the manuscript.
Funding
This work was supported by the National Research Foundation of Korea (NRF) grant, which is funded by the Korean government (MSIT) (No. 2020R1A5A8018822, No. 2021R1A2C2012469).
Conflicts of Interest
The authors declare no conflict of interest.
References
- Zhao, C.; Hobbs, B.; Ord, A. Chemical dissolution-front instability associated with water-rock reactions in groundwater hydrology: Analyses of porosity-permeability relationship effects. J. Hydrol. 2016, 540, 1078–1087. [Google Scholar] [CrossRef]
- Niu, S.; Park, K.; Yu, J.; Kim, Y. Operation and performance evaluation of high-speed filter using porous non-woven filamentous fibre for the treatment of turbid water. Environ. Technol. 2016, 37, 577–589. [Google Scholar] [CrossRef] [PubMed]
- Hidalgo, J.J.; Dentz, M. Mixing across fluid interfaces compressed by convective flow in porous media. J. Fluid Mech. 2018, 838, 105–128. [Google Scholar] [CrossRef]
- Nguyen, T.; Muyshondt, R.; Hassan, Y.A.; Anand, N.K. Experimental investigation of cross flow mixing in a randomly packed bed and streamwise vortex characteristics using particle image velocimetry and proper orthogonal decomposition analysis. Phys. Fluids 2019, 31, 025101. [Google Scholar] [CrossRef]
- Nematollahi, O.; Abadi, G.B.; Kim, D.Y.; Kim, K.C. Experimental study of the effect of brazed compact metal-foam evaporator in an organic Rankine cycle performance: Toward a compact ORC. Energy Convers. Manag. 2018, 173, 37–45. [Google Scholar] [CrossRef]
- Calmidi, V.V.; Mahajan, R.L. Forced Convection in High Porosity Metal Foams. J. Heat Transf. 2000, 122, 557–565. [Google Scholar] [CrossRef]
- Kraynik, A.M. The Structure of Random Foam. Adv. Eng. Mater. 2006, 8, 900–906. [Google Scholar] [CrossRef]
- Mancin, S.; Zilio, C.; Diani, A.; Rossetto, L. Air forced convection through metal foams: Experimental results and modeling. Int. J. Heat Mass Transf. 2013, 62, 112–123. [Google Scholar] [CrossRef]
- Mancin, S.; Zilio, C.; Rossetto, L.; Cavallini, A. Foam height effects on heat transfer performance of 20 ppi aluminum foams. Appl. Therm. Eng. 2012, 49, 55–60. [Google Scholar] [CrossRef]
- Mancin, S.; Zilio, C.; Cavallini, A.; Rossetto, L. Heat transfer during air flow in aluminum foams. Int. J. Heat Mass Transf. 2010, 53, 21–22. [Google Scholar] [CrossRef]
- Kim, D.Y.; Kim, K.C. An experimental study on the thermal and hydraulic characteristics of open-cell nickel and copper foams for compact heat exchangers. Int. J. Heat Mass Transf. 2019, 130, 162–174. [Google Scholar] [CrossRef]
- Kamath, P.M.; Balaji, C.; Venkateshan, S. Convection heat transfer from aluminium and copper foams in a vertical channel—An experimental study. Int. J. Therm. Sci. 2013, 64, 1–10. [Google Scholar] [CrossRef]
- Dukhan, N.; Bağcı, Ö.; Özdemir, M. Thermal development in open-cell metal foam: An experiment with constant wall heat flux. Int. J. Heat Mass Transf. 2015, 85, 852–859. [Google Scholar] [CrossRef]
- Dietrich, B. Heat transfer coefficients for solid ceramic sponges—Experimental results and correlation. Int. J. Heat Mass Transf. 2013, 61, 627–637. [Google Scholar] [CrossRef]
- Eggenschwiler, P.D.; Tsinoglou, D.N.; Seyfert, J.; Bach, C.; Vogt, U.; Gorbar, M. Ceramic foam substrates for automotive catalyst applications: Fluid mechanic analysis. Exp. Fluids 2009, 47, 209–222. [Google Scholar] [CrossRef]
- Butscher, D.; Hutter, C.; Kuhn, S.; Von Rohr, P.R. Particle image velocimetry in a foam-like porous structure using refractive index matching: A method to characterize the hydrodynamic performance of porous structures. Exp. Fluids 2012, 53, 1123–1132. [Google Scholar] [CrossRef]
- Zhao, C. Review on thermal transport in high porosity cellular metal foams with open cells. Int. J. Heat Mass Transf. 2012, 55, 3618–3632. [Google Scholar] [CrossRef]
- Topin, F.; Bonnet, J.-P.; Madani, B.; Tadrist, L. Experimental Analysis of Multiphase Flow in Metallic foam: Flow Laws, Heat Transfer and Convective Boiling. Adv. Eng. Mater. 2006, 8, 890–899. [Google Scholar] [CrossRef]
- Zhao, C.Y.; Lu, W.; Tassou, S.A. Flow Boiling Heat Transfer in Horizontal Metal-Foam Tubes. J. Heat Transf. 2009, 131, 121002. [Google Scholar] [CrossRef]
- Li, H.; Leong, K. Experimental and numerical study of single and two-phase flow and heat transfer in aluminum foams. Int. J. Heat Mass Transf. 2011, 54, 4904–4912. [Google Scholar] [CrossRef]
- Baker, O. Design of Pipelines for Simultaneous Flow of Oil and Gas. In Proceedings of the Fall Meeting of the Petroleum Branch of AIME, Dallas, TX, USA, 19 October 1953. [Google Scholar]
- Hewitt, G.F.; Roberts, D. Studies of Two-Phase Flow Patterns by Simultaneous X-ray and Flast Photography; Atomic Energy Research Establishment: Harwell, UK, 1969. [Google Scholar]
- Mandhane, J.; Gregory, G.; Aziz, K. A flow pattern map for gas—liquid flow in horizontal pipes. Int. J. Multiph. Flow 1974, 1, 537–553. [Google Scholar] [CrossRef]
- Lu, W.; Zhao, C.-Y. Numerical Modelling of Flow Boiling Heat Transfer in Horizontal Metal-Foam Tubes. Adv. Eng. Mater. 2009, 11, 832–836. [Google Scholar] [CrossRef]
- Li, H.-W.; Zhang, C.-Z.; Yang, D.; Sun, B.; Hong, W.-P. Experimental investigation on flow boiling heat transfer characteristics of R141b refrigerant in parallel small channels filled with metal foam. Int. J. Heat Mass Transf. 2019, 133, 21–35. [Google Scholar] [CrossRef]
- Kim, D.Y.; Nematollahi, O.; Kim, K.C. Flow-pattern-based experimental analysis of convective boiling heat transfer in a rectangular channel filled with open-cell metallic random porous media. Int. J. Heat Mass Transf. 2019, 142, 118402. [Google Scholar] [CrossRef]
- Beranek, L.L. Acoustic Impedance of Porous Materials. J. Acoust. Soc. Am. 1942, 13, 248–260. [Google Scholar] [CrossRef]
- Han, D.-H.; Lee, K.-J.; Kim, Y.-H. Experiments on the characteristics of evaporation of R410A in brazed plate heat exchangers with different geometric configurations. Appl. Therm. Eng. 2003, 23, 1209–1225. [Google Scholar] [CrossRef]
- Collier, J.G.; Thome, J.R. Convective Boiling and Condensation, 3rd ed.; Collier, J.G., Thome, J.R., Eds.; Oxford Science Publications: New York, NY, USA, 1994. [Google Scholar]
- Hsieh, Y.; Lin, T. Saturated flow boiling heat transfer and pressure drop of refrigerant R-410A in a vertical plate heat exchanger. Int. J. Heat Mass Transf. 2002, 45, 1033–1044. [Google Scholar] [CrossRef]
- Taitel, Y.; Dukler, A.E. A modelling flow pattern transitions for steady upward gas-liquid flow in vertical tubes. ALChE J. 1980, 26, 345–354. [Google Scholar] [CrossRef]
- Kaichiro, M.; Ishii, M. Flow regime transition criteria for upward two-phase flow in vertical tubes. Int. J. Heat Mass Transf. 1984, 27, 723–737. [Google Scholar] [CrossRef]
- Akbar, M.; Plummer, D.; Ghiaasiaan, S. On gas–liquid two-phase flow regimes in microchannels. Int. J. Multiph. Flow 2003, 29, 855–865. [Google Scholar] [CrossRef]
- Chen, L.; Tian, Y.S.; Karayiannis, T.G. Vertical upward flow patterns in small diameter tubes. In Proceedings of the 6th World Conference on Experimental Heat Transfer, Fluid Mechanics and Thermodynamics, Matsushima, Miyagi, Japan, 17–21 April 2005. [Google Scholar]
Publisher’s Note: MDPI stays neutral with regard to jurisdictional claims in published maps and institutional affiliations. |
© 2021 by the authors. Licensee MDPI, Basel, Switzerland. This article is an open access article distributed under the terms and conditions of the Creative Commons Attribution (CC BY) license (https://creativecommons.org/licenses/by/4.0/).