Article

Wind Power in Iran: Technical, Policy, and Financial Aspects for Better Energy Resource Management

by
Seyed Reza Mirnezami
1,* and
Amin Mohseni Cheraghlou
2
1
Research Institute for Science, Technology, and Industrial Policy (RISTIP), Sharif University of Technology, Tehran 1458889694, Iran
2
Department of Economics, American University, Washington, DC 20016, USA
*
Author to whom correspondence should be addressed.
Energies 2022, 15(9), 3230; https://doi.org/10.3390/en15093230
Submission received: 30 March 2022 / Revised: 23 April 2022 / Accepted: 26 April 2022 / Published: 28 April 2022
(This article belongs to the Special Issue Energy Resources Management)

Abstract

:
Iran is situated in a wind belt. However, the installed wind capacity in Iran is around 300 MW, which is minuscule compared with the global 651 GW capacity as of 2021. Using novel data from wind trackers across Iran, the paper’s findings show immense potential for wind energy in Iran from a technical perspective. While attractive policies are already in place to incentivize wind energy development in Iran, the feed-in tariff (FiT) for wind energy has dropped to around 3 cents per kWh because of the sharp depreciation of the Iranian rial between 2018 and 2020. This paper shows that there is no economic justification for the development of wind farms in Iran at such low FiTs. A minimum FiT of 12 cents per kWh is required to reinvigorate Iran’s wind energy industry investments. Given the extremely tight fiscal space of the Iranian government due to the sanctions and consequently reduced oil exports, the paper argues that a mere 2.14% of Iran’s wasteful fossil fuel subsidies are sufficient to provide a FiT of 12 cents per kWh for wind energy to meet 5% of the country’s total electricity demand.

1. Introduction

The installed wind capacity in Iran is around 300 MW, which is minuscule compared with the global 651 GW capacity as of 2021 (http://windea.org/information-2/information/, accessed on 10 October 2021). Iran is situated in a wind belt and has a relatively good potential for wind energy compared to other countries in the Middle East. However, wind power constitutes an insignificant share in Iran’s 80 GW power sector. This is mainly due to a limited number of wind power companies, highlighting the inadequate investment in this sector. In general, this is true for the renewable industry, which accounts for less than one percent of Iran’s total power generation capacity (https://www.tehrantimes.com/news/429697/Iran-s-power-generation-capacity-rises-1000-MW-since-March, accessed on 17 April 2021). However, important incentives for developing wind energy in Iran, such as 20 years power purchase agreements (PPAs), have been implemented in recent years. Considering the possibility of reducing or removing sanctions against Iran in a Biden administration, these incentives for developing renewable and wind energy could provide favorable opportunities for foreign investors compared to other countries in the Middle East or globally. In addition to the 20-year PPAs, the Iranian authority (SATBA) encourages domestic production of wind turbines and accessories by providing an additional 30% bonus if wind farms use Iranian turbines and components. Such a bonus could play an important role in promoting domestic R&D and production in the Iranian wind industry. It should also be noted that there is evidence for the mutually supportive role of increased R&D and capacity installation in making the wind industry more efficient and profitable in the long run [1,2].
Considering the intermittent nature of wind energy, including the diurnal and seasonal variation of wind power, it is important to assess the impact of this intermittent power on the Iranian grid. There should be a regional and national plan to build synergy between intermittent and dispatchable resources connected to the grid through strategies such as wind assessment, interconnection, integration, and efficient market design [3]. Among them, the assessment of wind power has noticeable importance [4].
While the literature does include a few studies on wind power assessment in Iran, the majority of such studies focus on only a specific region of the country: the city of Tehran [5], the province of Semnan [6], the city of Shahrbabak [7], the city of Zahedan [8], the province of Yazd [9], the city of Zarrineh [10], the cities of Tabriz and Ardabil [11], the region of Binalood [12], the province of Sistan and Balouchestan [11], the province of Bushehr [13], and the city of Aligoodarz [14]. More importantly, the literature lacks a detailed investigation of wind energy’s spatial and temporal variation across the country. A study for the Mah-Shahr region has conducted an economic feasibility analysis and assessed the wind resources in a specific region [15].
While region-specific studies are valuable, considering the significant potential but minimal development of wind power in Iran, it is important to conduct a country-level examination of wind energy from technical angles and financial and policy perspectives. This is important because the current studies are conducted at different times and employ varying assumptions, making it difficult for policymakers to have a uniform country-wide perspective. The unique contribution of this study is that it provides a comprehensive country-wide technical analysis using hourly data of wind meters in all provinces of Iran. Moreover, this study provides a novel country-level financial analysis of wind power in Iran and suggests potential sources of financing wind energy in Iran sustainably. Such country-level analyses are especially crucial at this juncture as the U.S. sanctions of the Iranian oil industry and exports have created a new technological, regulatory, and investment environment for the wind industry in Iran.
Some recent papers analyze the capacity and requirements for solar energy development in Iran [16,17], but there is no comprehensive research investigating technical, financial, and policy aspects of wind power in Iran. There are two main objectives for this paper. First, using novel data collected from wind trackers across Iran will present a comprehensive assessment of the temporal and spatial variation of wind energy in Iran and develop a high-level picture of its potential role in Iran’s electricity industry. Second, it will conduct an economic feasibility analysis and identify potential sources of revenue to finance the minimum FiT required for the continuous development of the Iranian wind industry. The rest of the paper is organized as follows to accomplish these objectives. Section 2 provides a brief background on wind energy in Iran. The geography and intermittency of wind power in Iran will be described in Section 3. Policy, technical, and economic assessments are conducted in Section 4, whereas Section 5 concludes the discussion.

2. Background

All wind farms in Iran, totaling about 300 MW installed capacity, are privately owned (Table 1). Despite having a high wind power potential, wind power plants in Iran have not developed according to what one would expect [18]. Studies concerning Iran’s wind power show an economic potential of about 18 GW of wind power in Iran (SATBA, satba.gov.ir, accessed on 14 May 2020). Until two years ago, there were around 50 MW of publicly owned installed wind capacity. However, because of sharp drops in oil exports owing to the U.S. imposed sanctions, the Iranian government has experienced significant budget deficits in 2018, 2019, and 2020. As a result, the government has stopped investing in renewable energy. It has transferred the ownership of government-owned wind farms to the private sector, leaving the private sector to develop this industry further. As electricity price is set centrally by the government, no market could be established based on the equilibrium between supply and demand through the price mechanism. Electricity generation cost is always higher than the retail price, and the government covers the difference in subsidies. Considering that there is no wholesale market for electricity in Iran, SATBA is the single buyer of wind-generated electricity, creating a monopsony market structure with some nuances for the electricity generated through wind and other renewable sources inside Iran.
Although guaranteed feed-in tariffs (FiT) in power purchase agreements (PPA) are subsidized by the government and are higher than the retail price of electricity (In November 2020, FIT for wind power in Iran is about 10 times the average retail price for residential consumption.), substantial investments in the renewable sector are yet to happen. This is mainly due to high-interest rates in Iran’s banking system, the absence of venture capital, and difficulties attracting foreign investments because of the decade-old financial sanctions.
In addition to the financing challenges, this industry faces severe technical challenges. In the grid, the supply and demand of electricity should be balanced. From a predictability and planning point of view, the amount of wind power generated at a certain point in time or year is highly unpredictable compared to conventional generation systems. As a result, the level of predictability is an important criterion and a deciding factor for investment in wind farms [19]. The main features of wind power that result in unpredictability are cross-spatial imbalances and inter-temporal variations, which need to be analyzed and forecasted. A study discusses the pros and cons of different forecasting methods such as numerical prediction from global to local scales, ensemble forecasting with upscaling and downscaling processes, statistical and machine learning approaches, and benchmarking techniques [20]. The models by which such variations are analyzed can significantly affect the project’s market value [21]. Benchmarking techniques and uncertainty checks are used to universally validate models’ total fit and forecast actual function and application. Hence, sophisticated parameterizations often provide a relatively accurate big picture and medium-term and long-term planning. On the other hand, recent statistical and machine learning innovations have resulted in efficient forecasting on short-term and local scales. Therefore, a combination of the long-term and short-term models is required for a comprehensive solution.
The cost of integrating wind power into the grid is another important factor. If the portion of wind power in total consumed power increases, integration costs increase because system reliability becomes more dependent on wind, an intermittent energy source. There is a need to deliberately calculate the capacity factor of wind power, measuring the average energy delivered compared to install capacity, varying in countries/regions according to geographical characteristics and policy settings. From a cost–benefit point of view, in addition to practical forecasting tools, wider geographical dispersion of wind turbines or transmission possibilities to neighboring areas must be heeded to, all of which increases the cost of wind energy as its share in the energy mix increases [22].

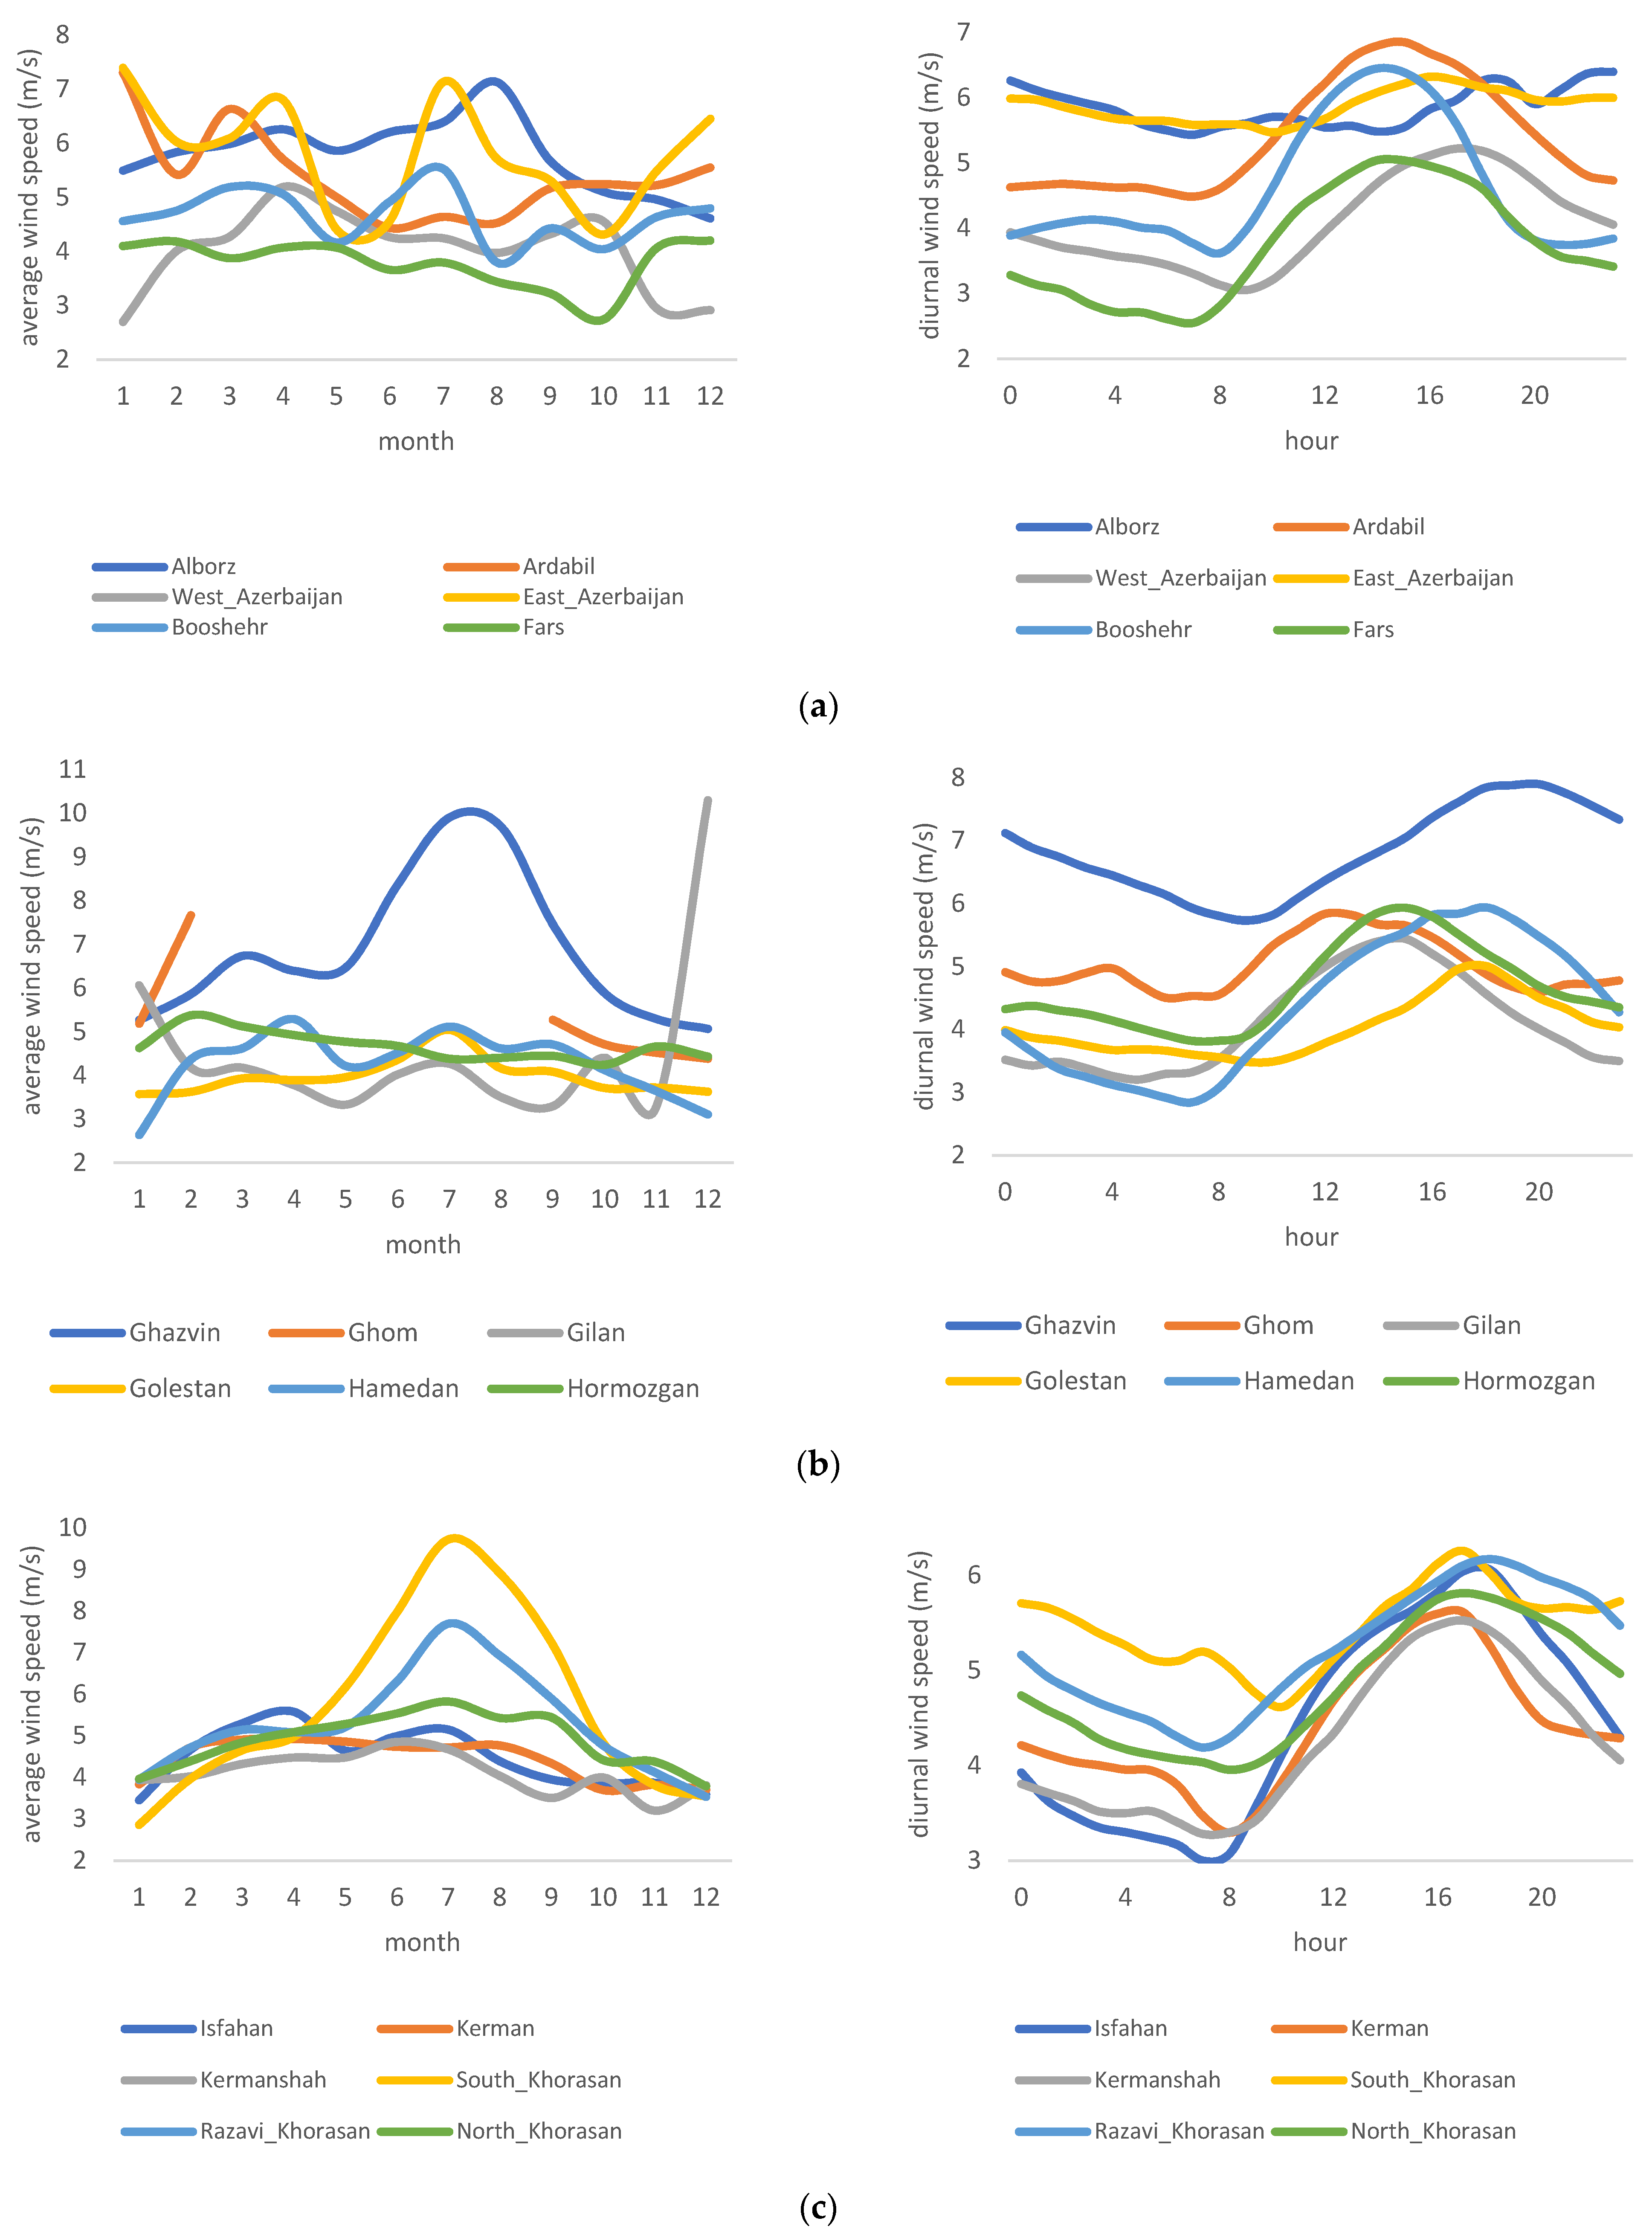
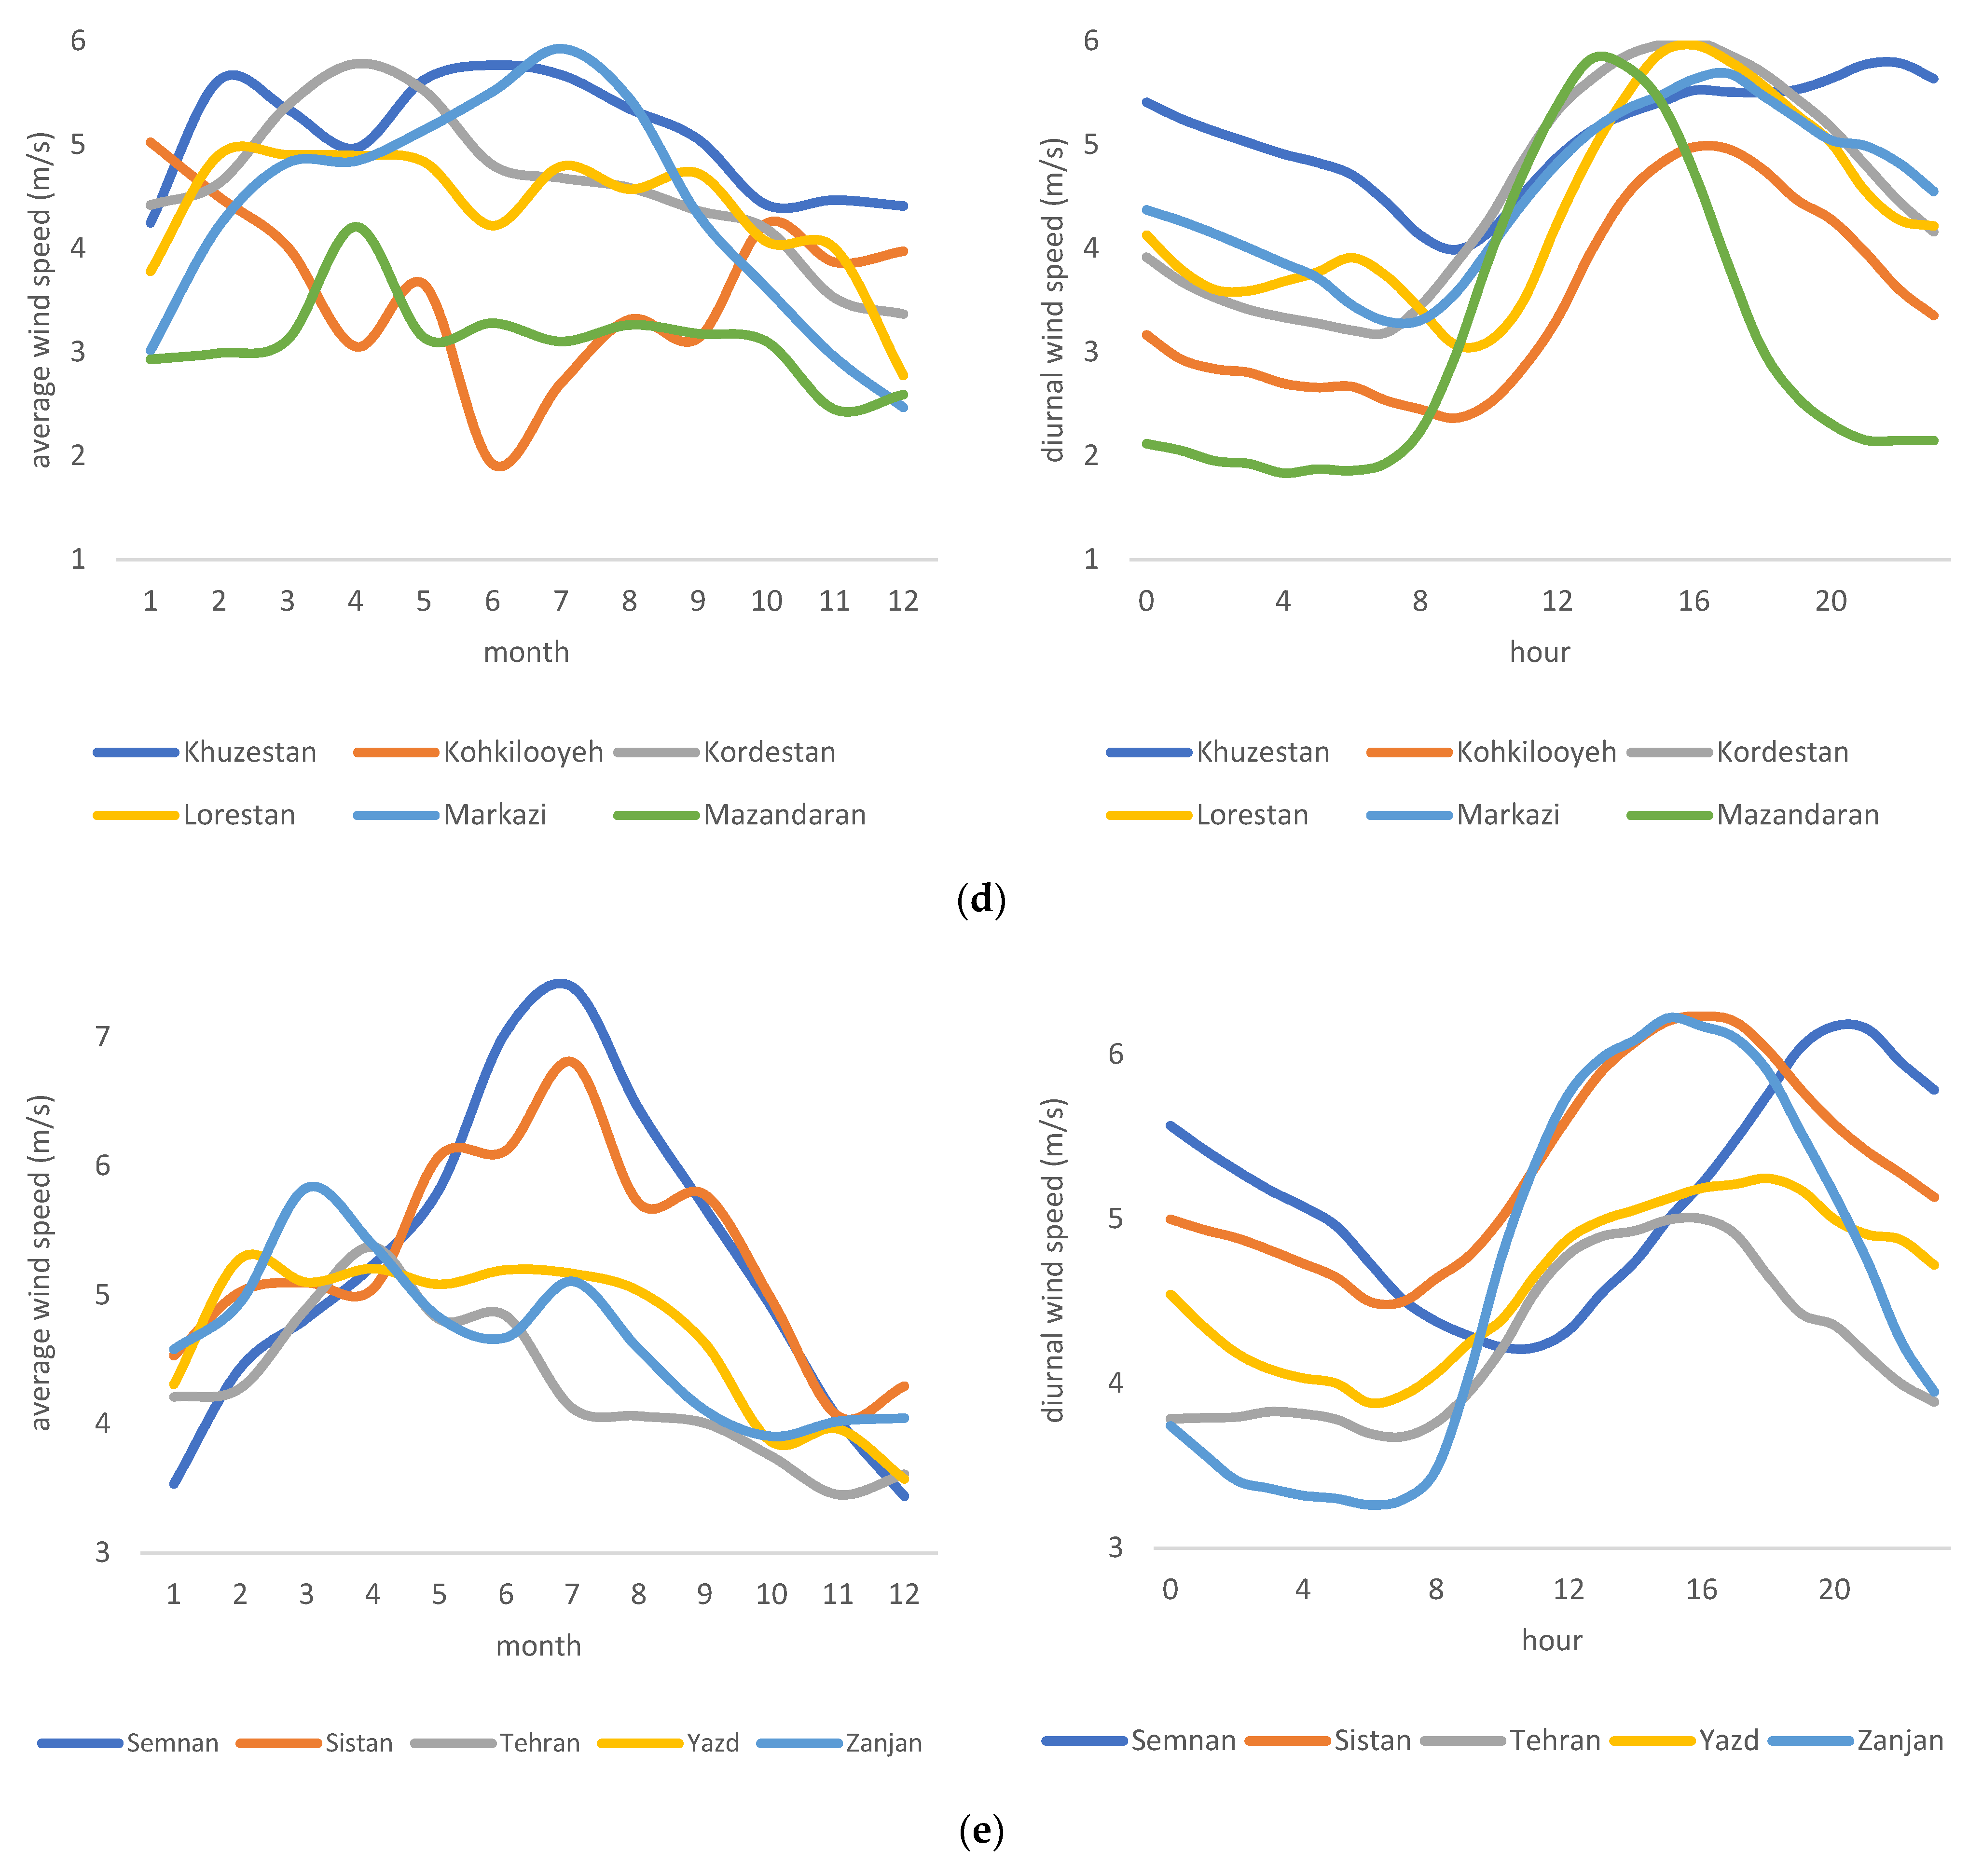
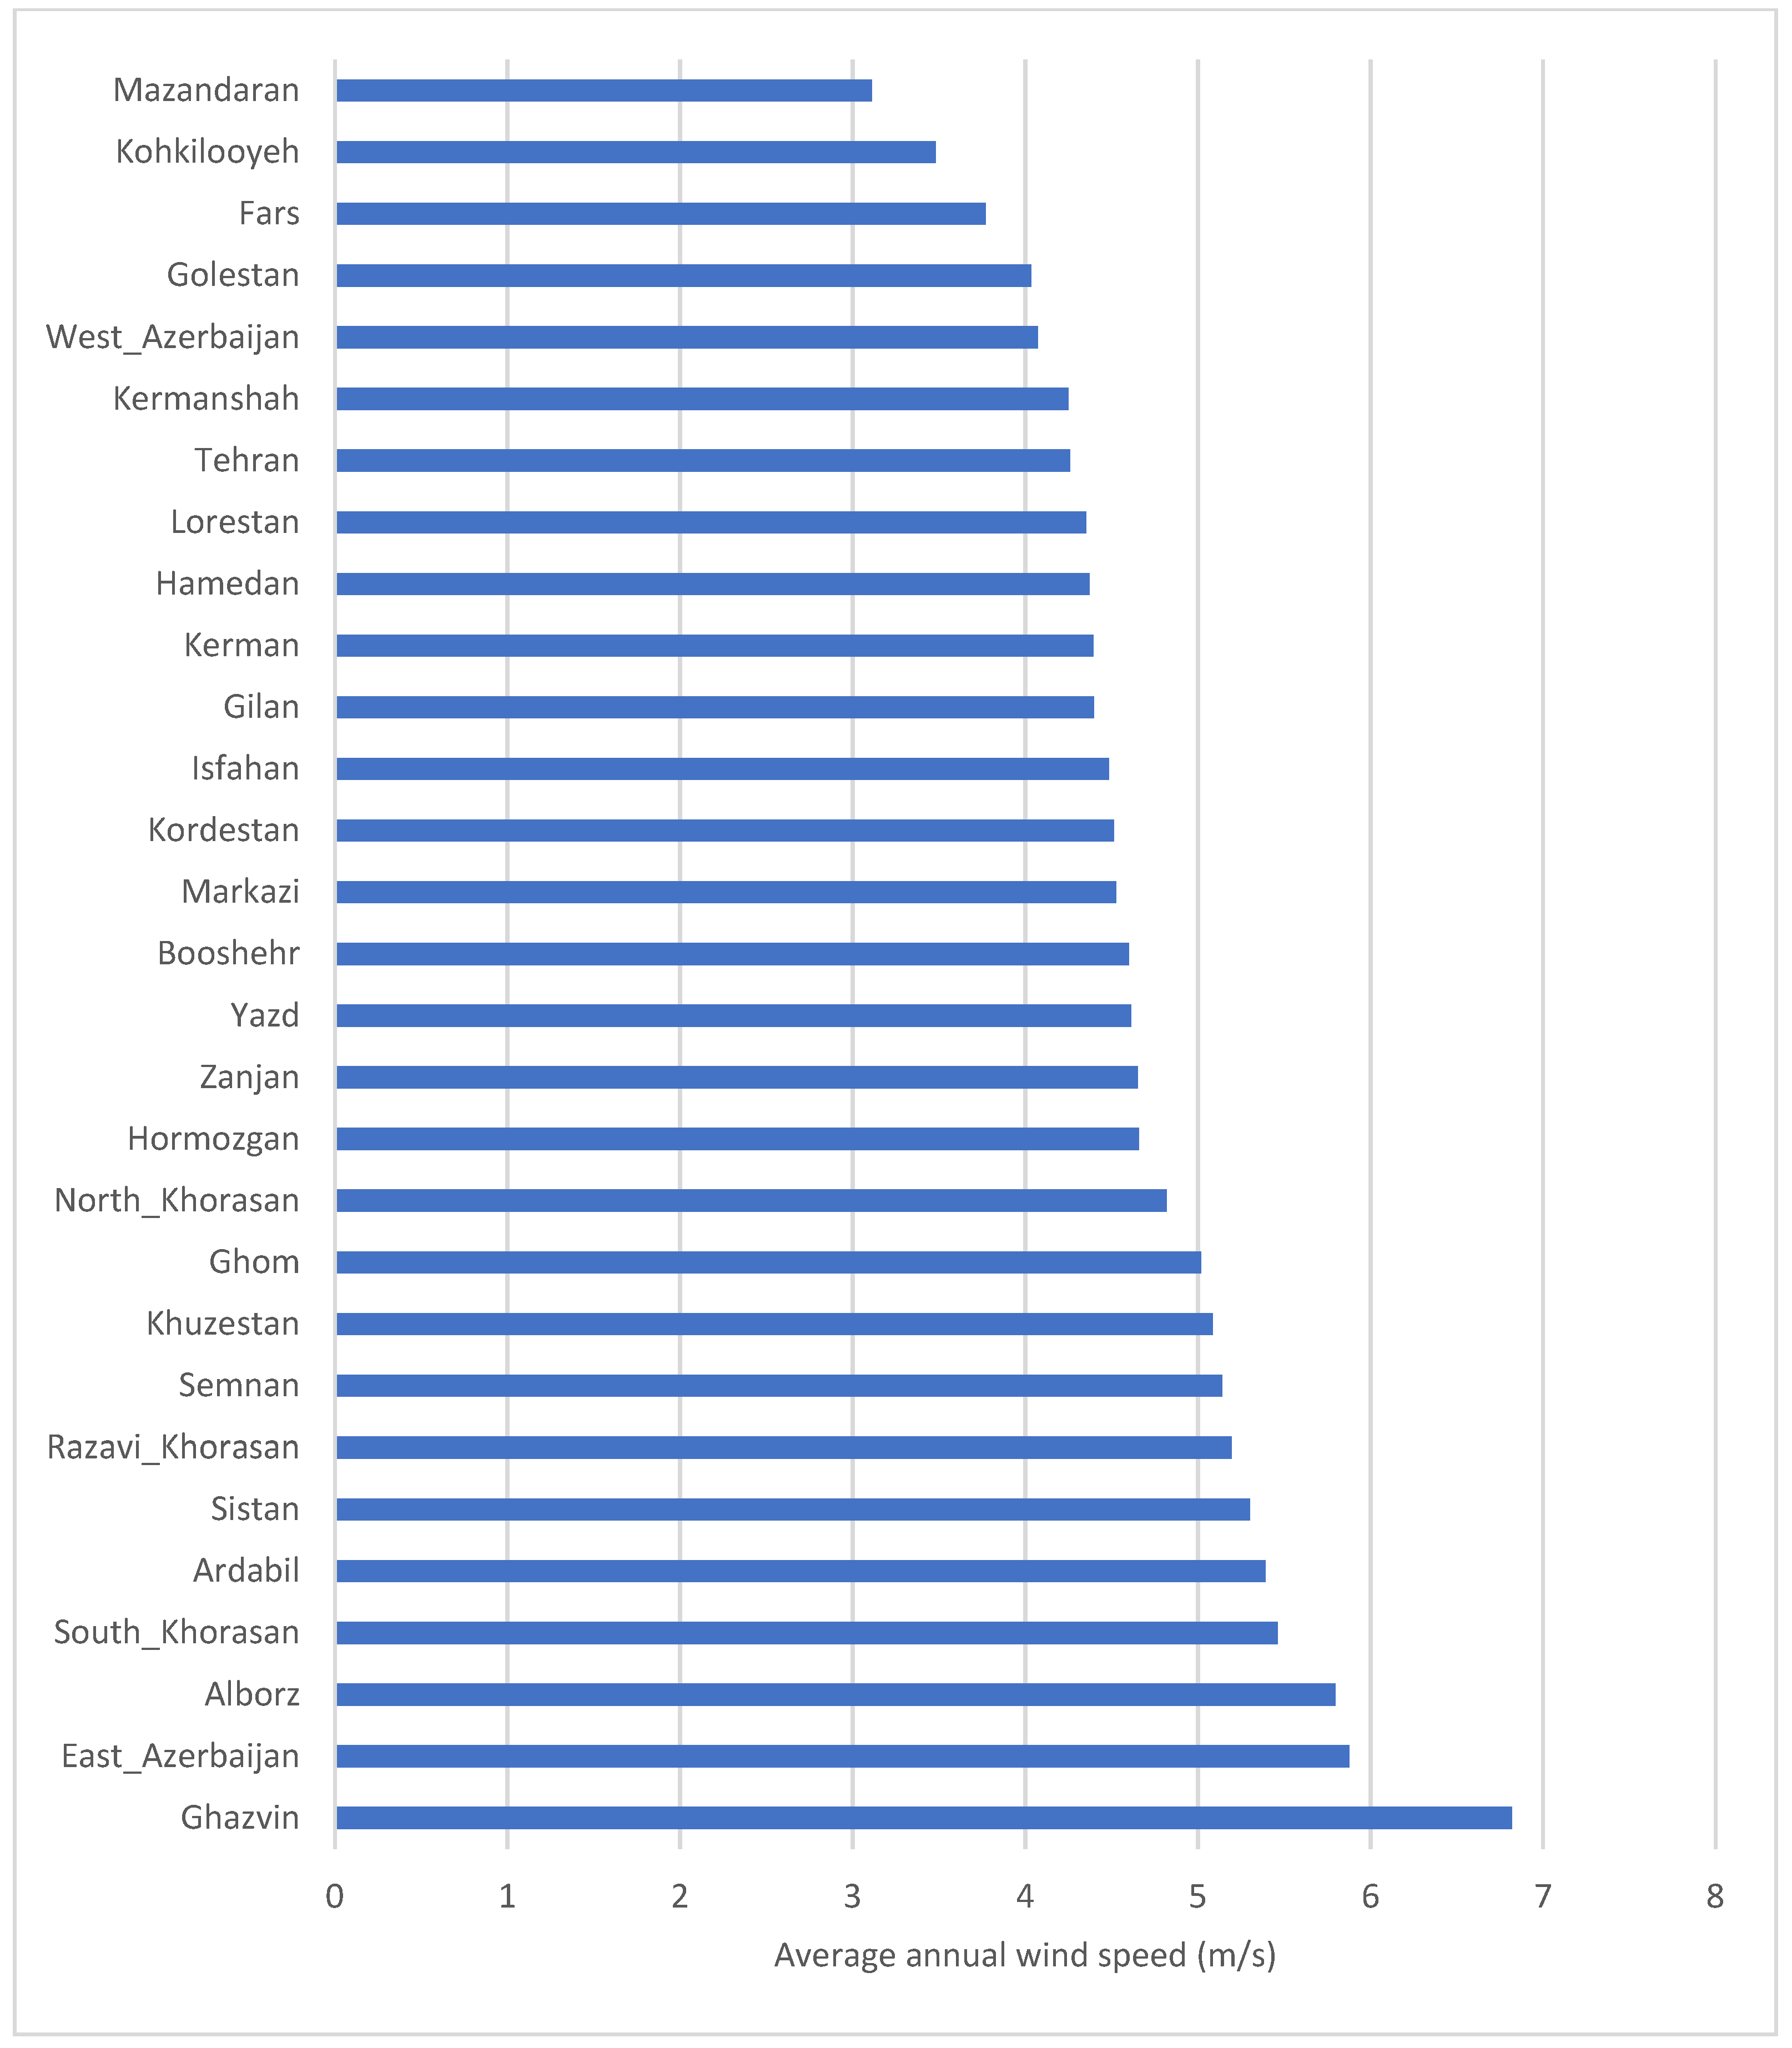
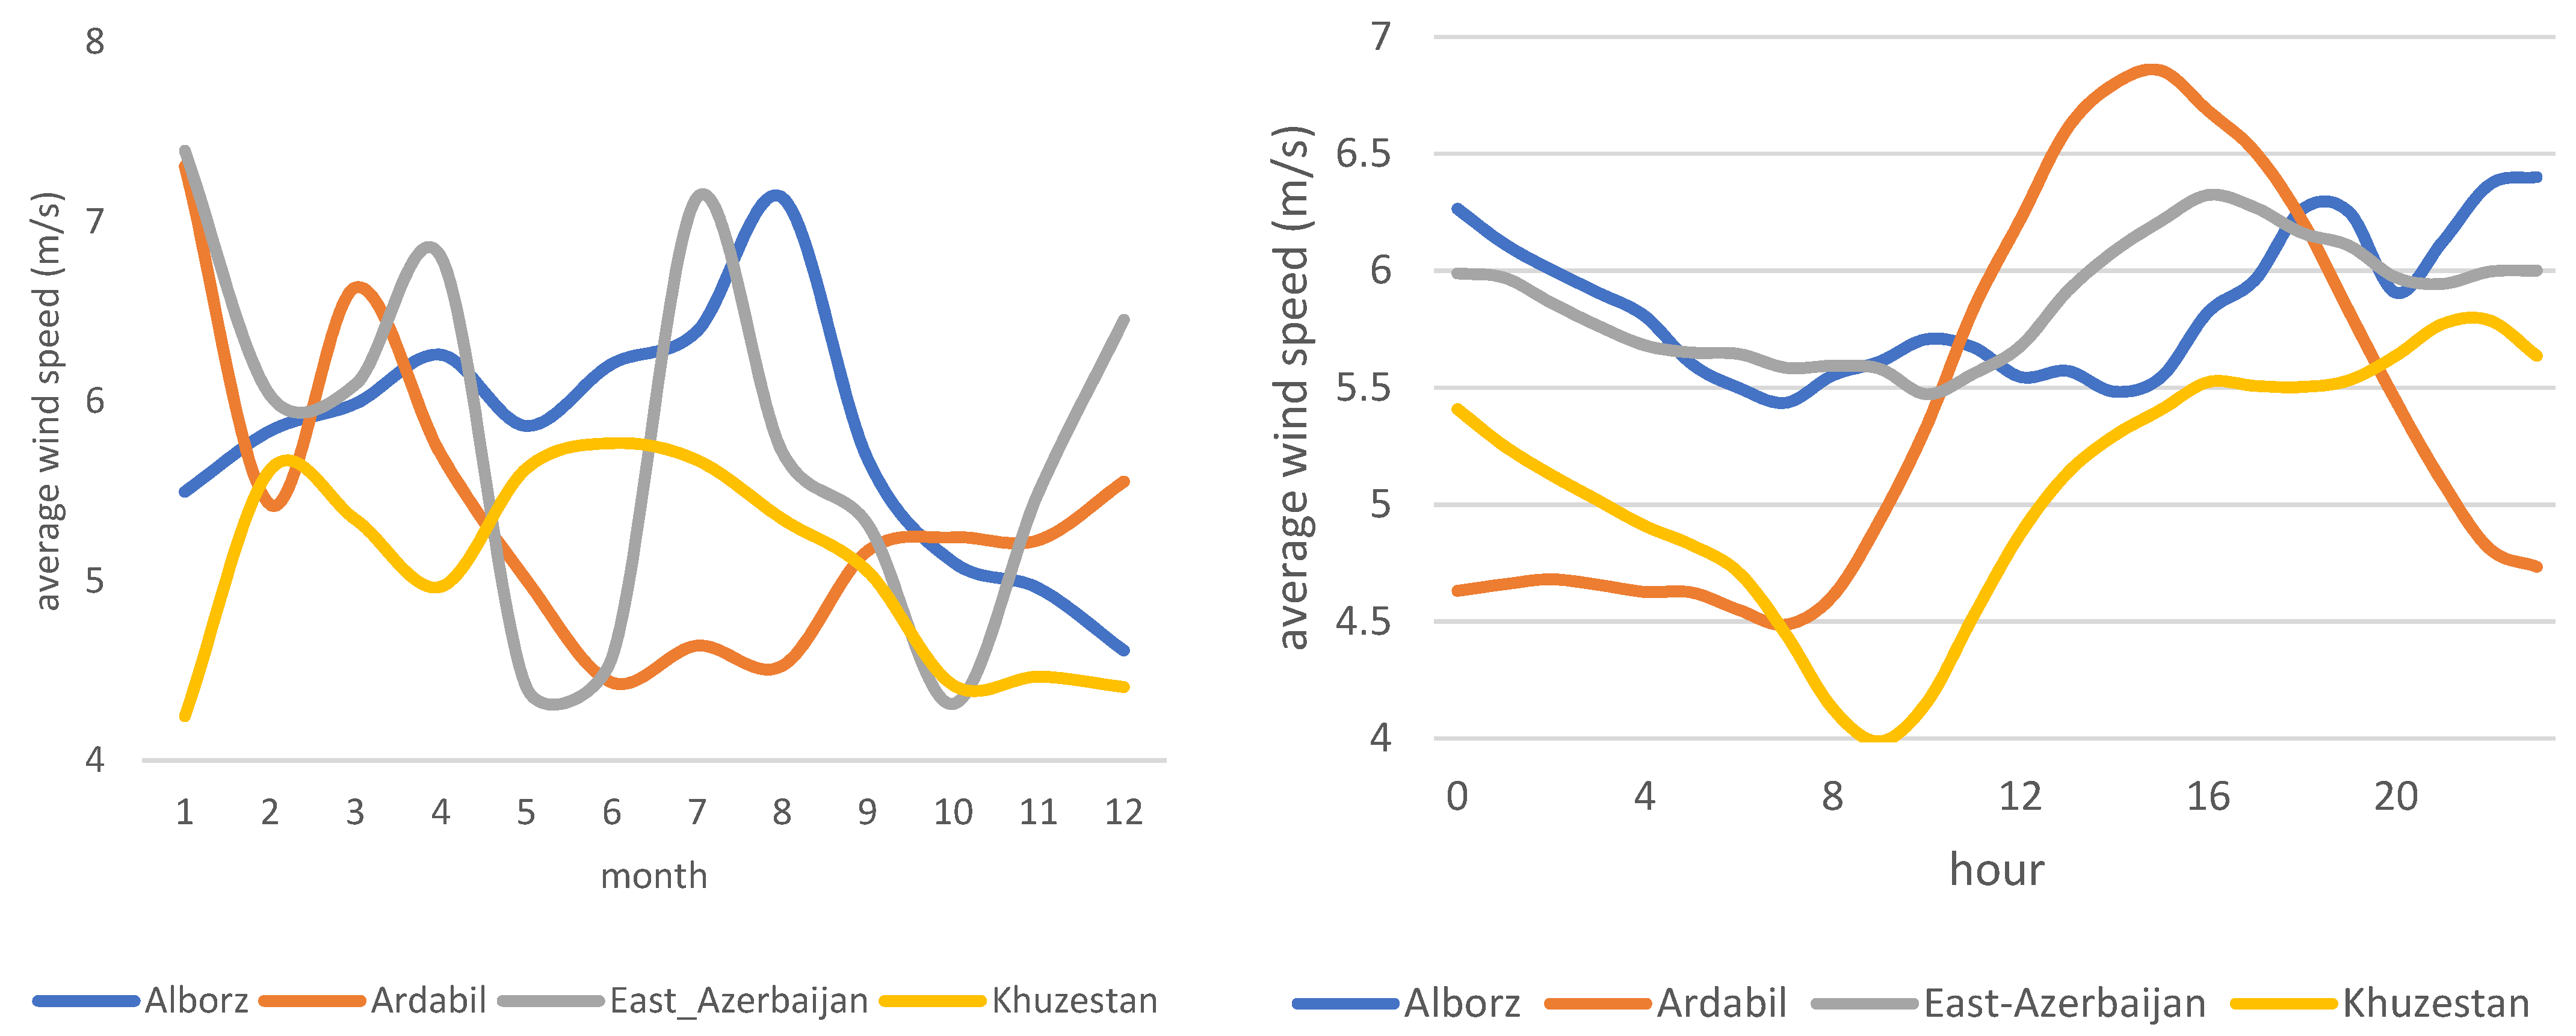
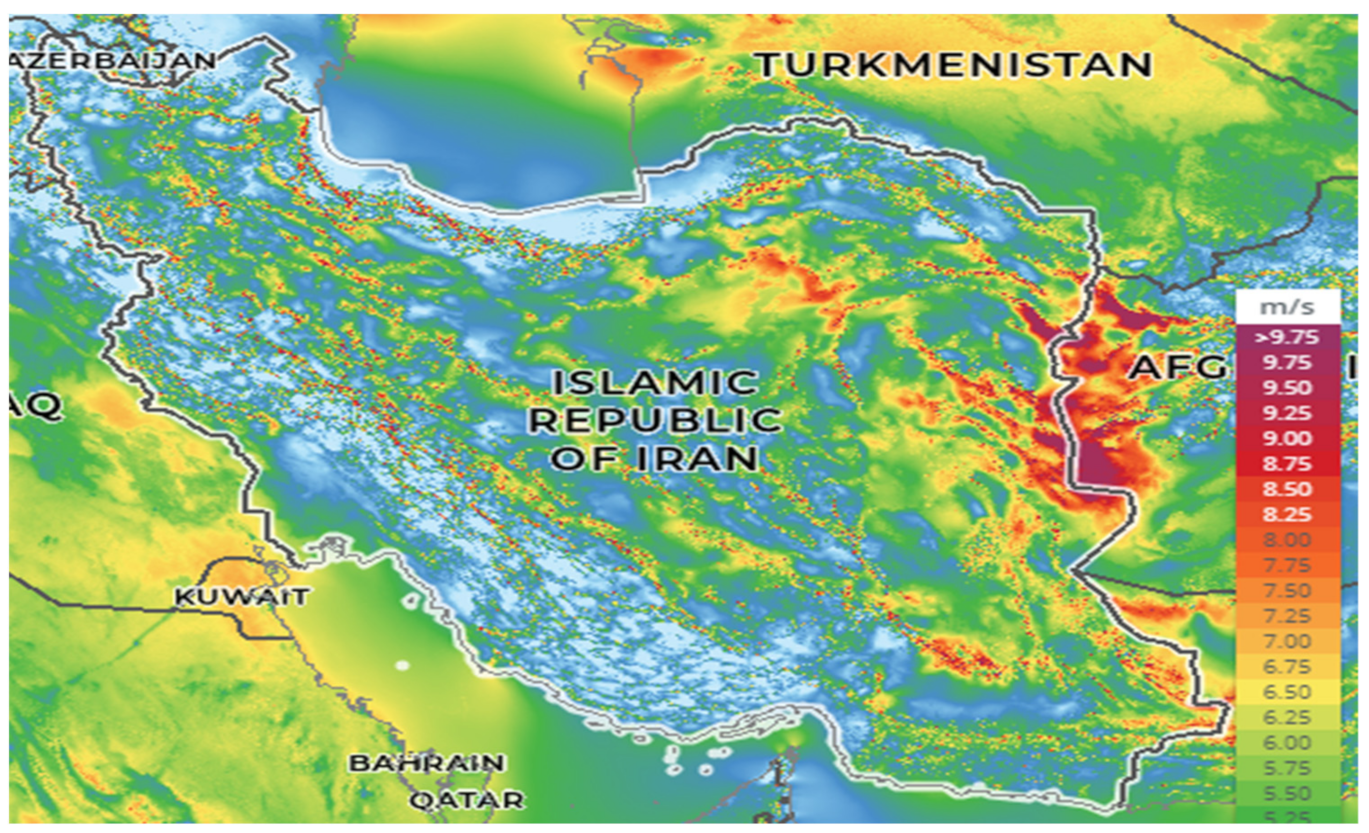
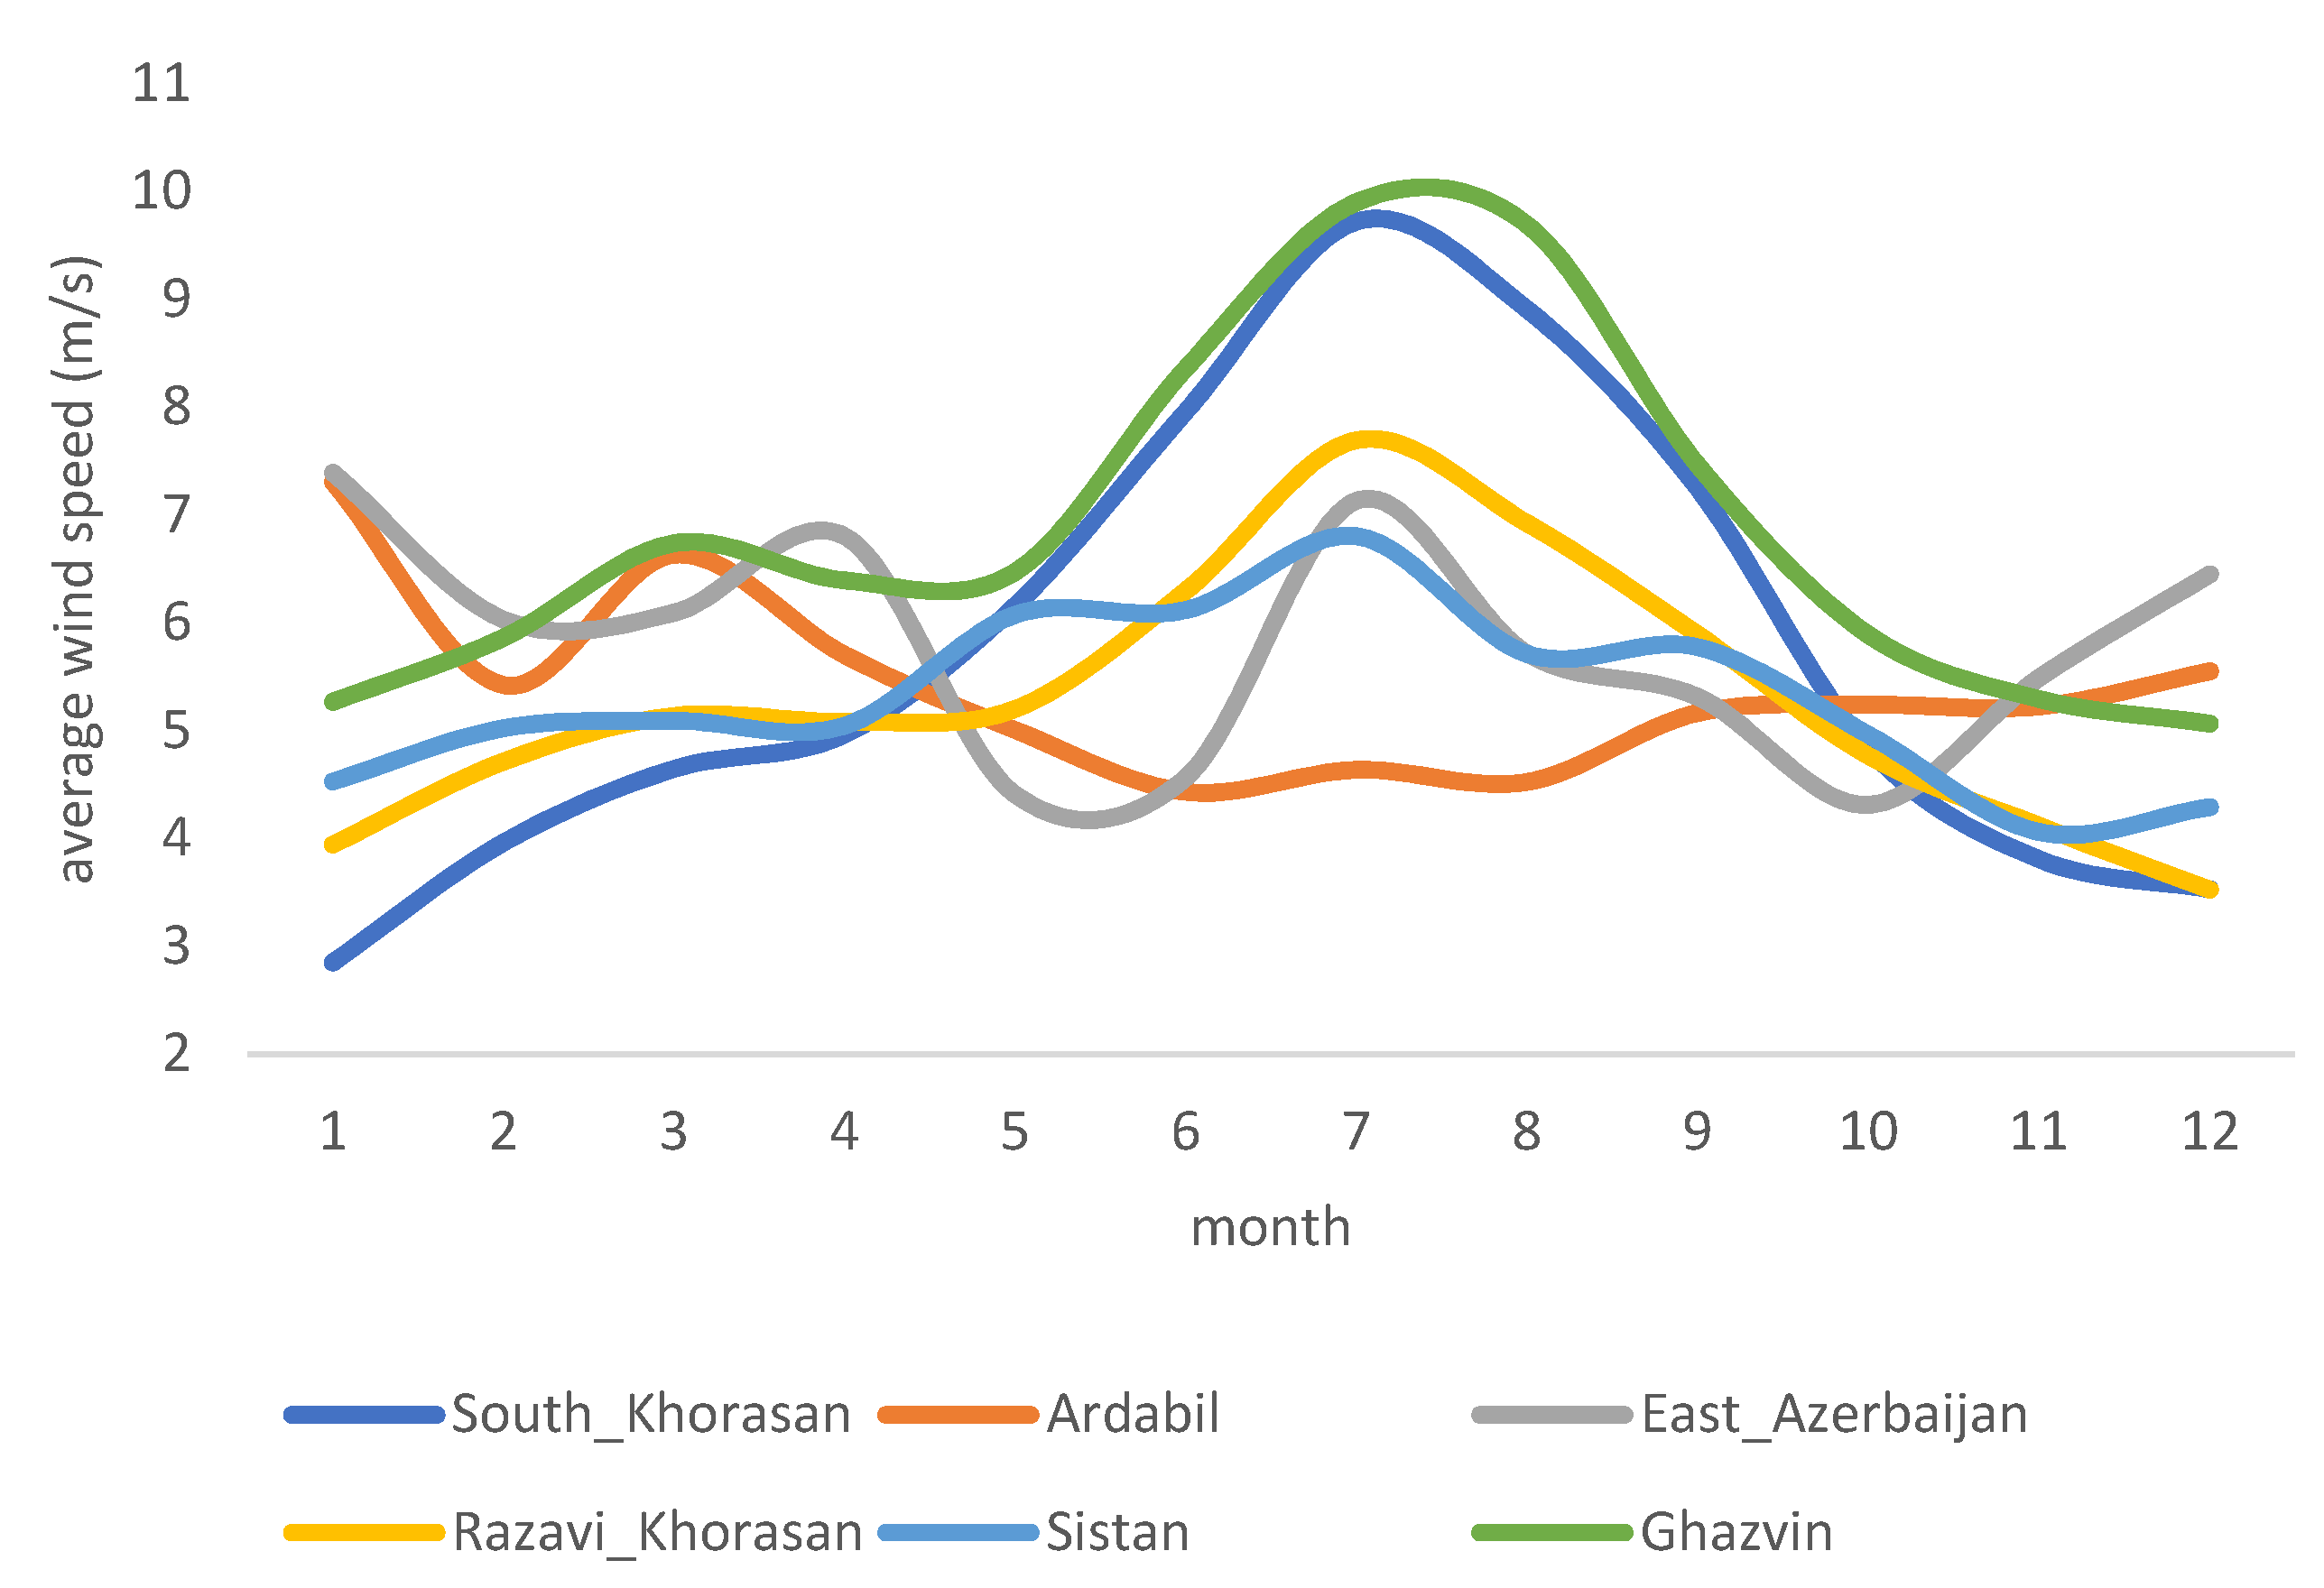
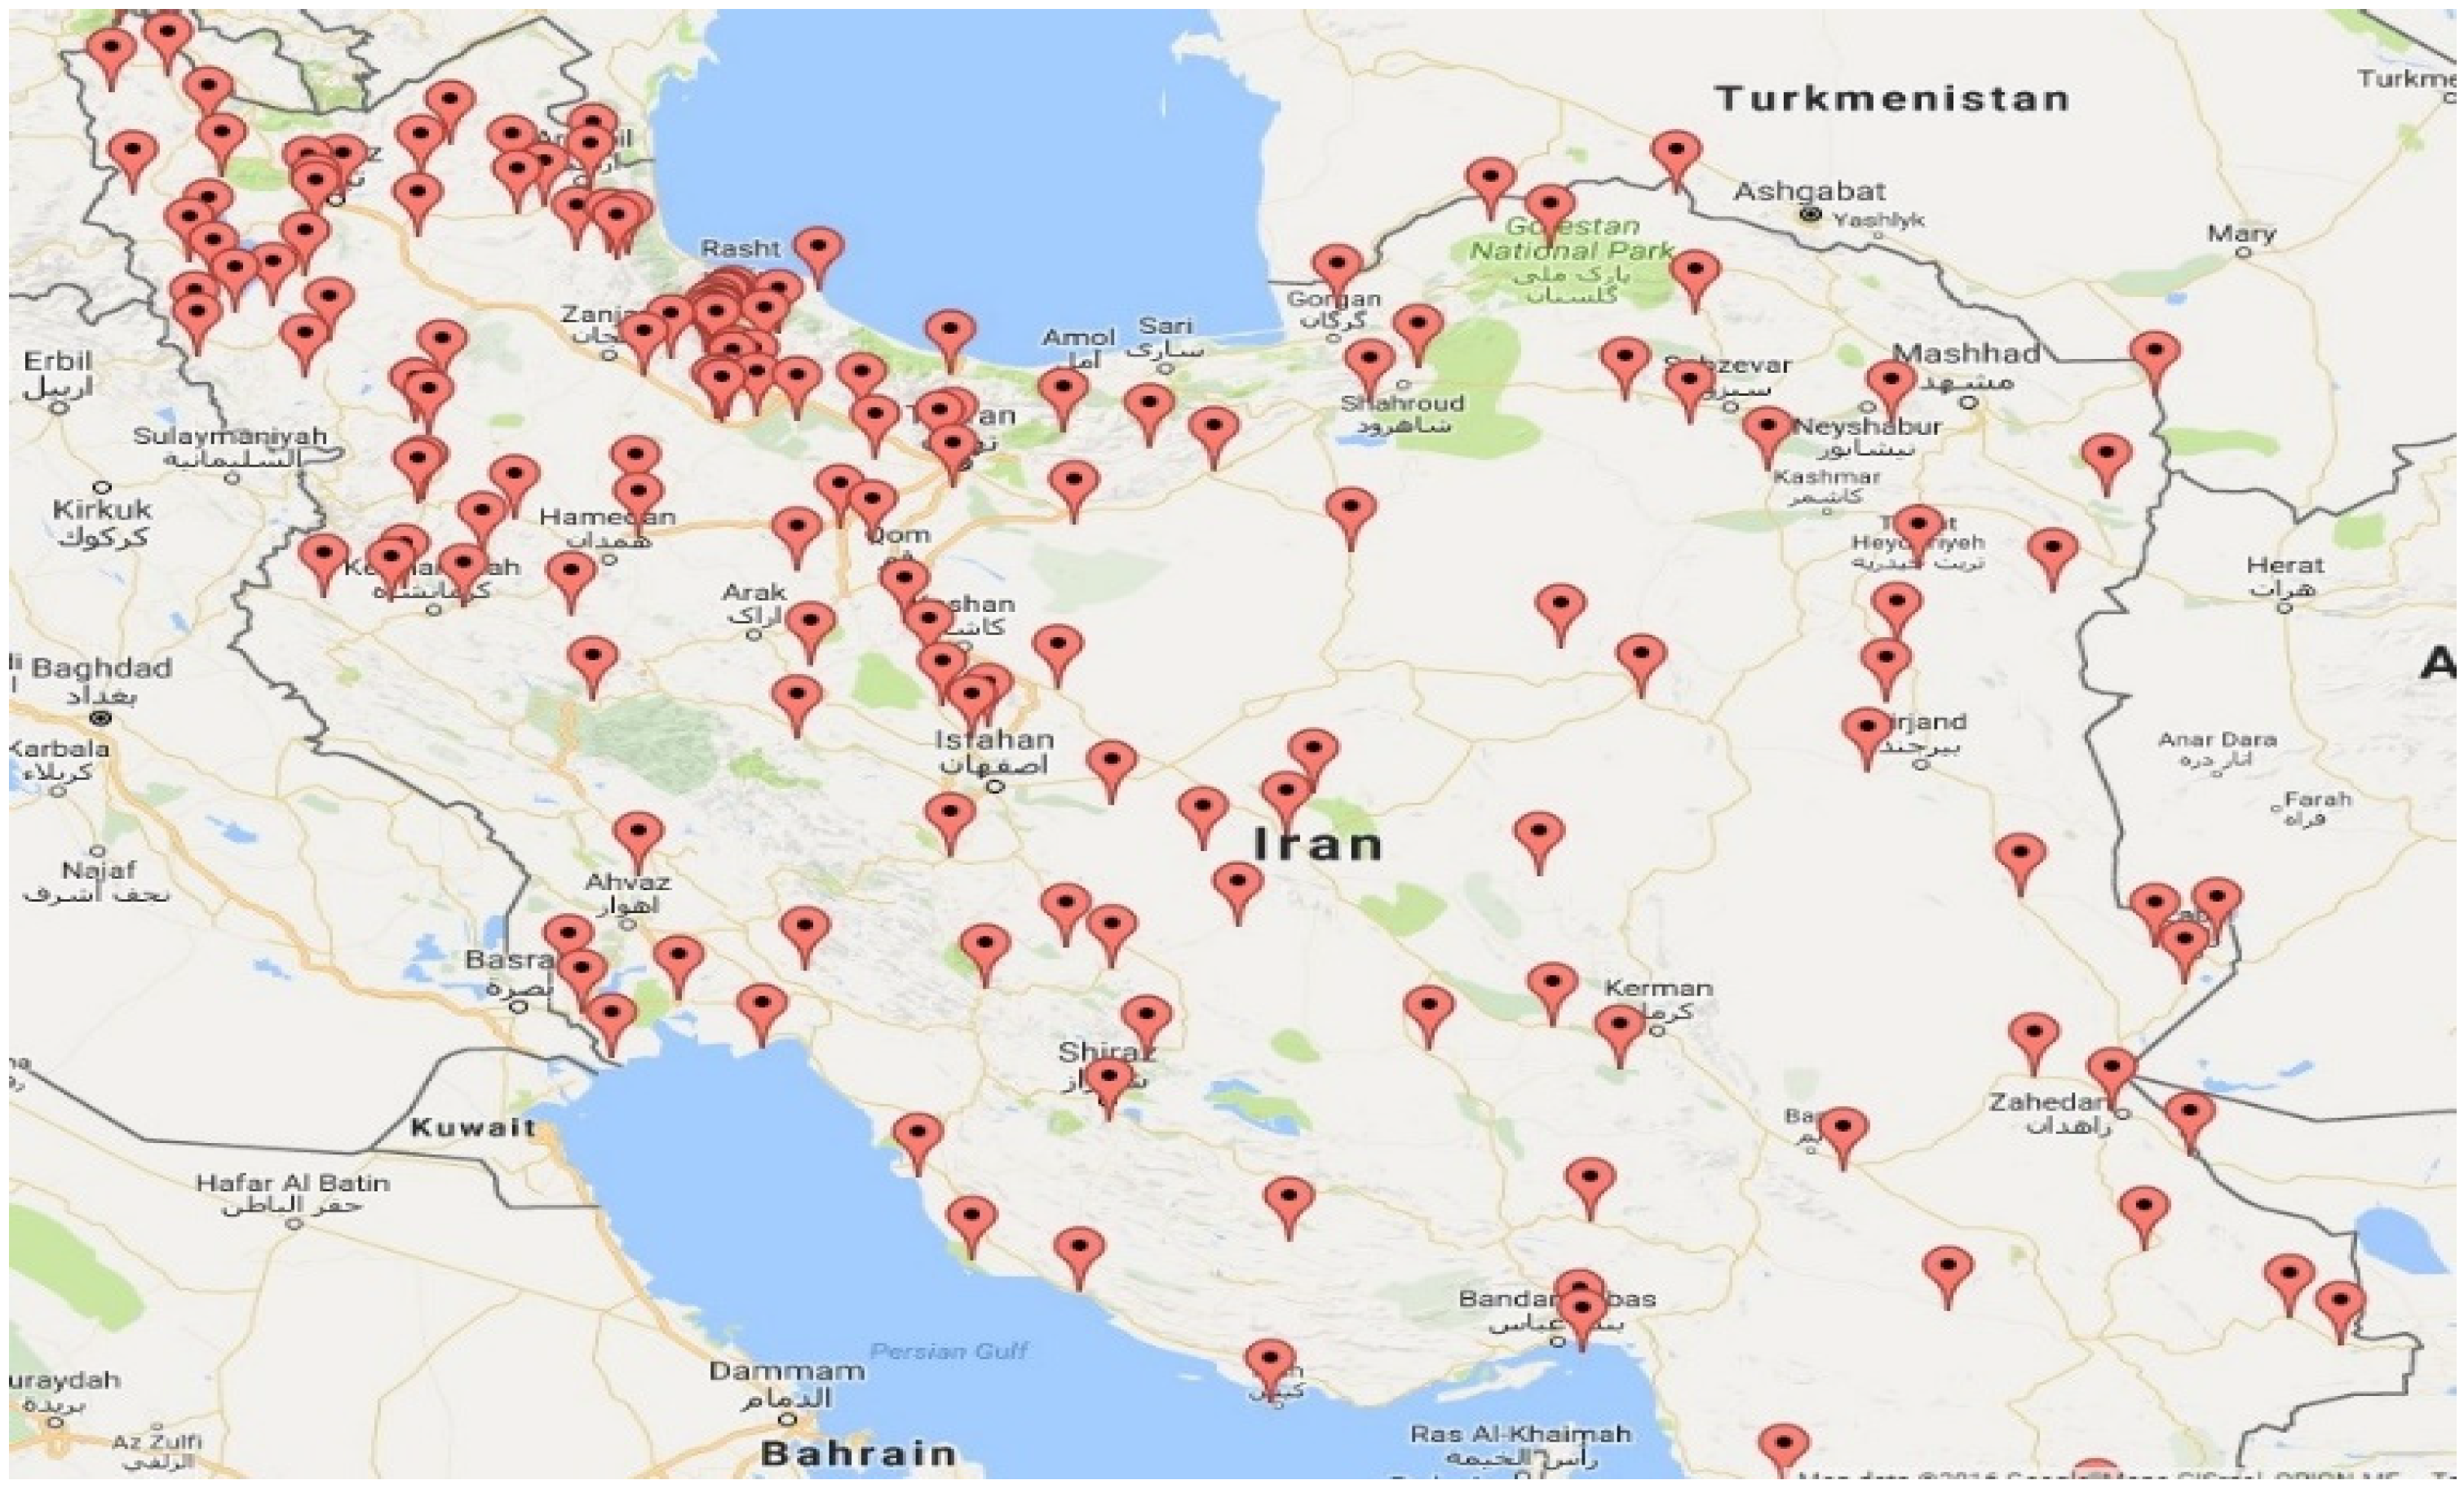
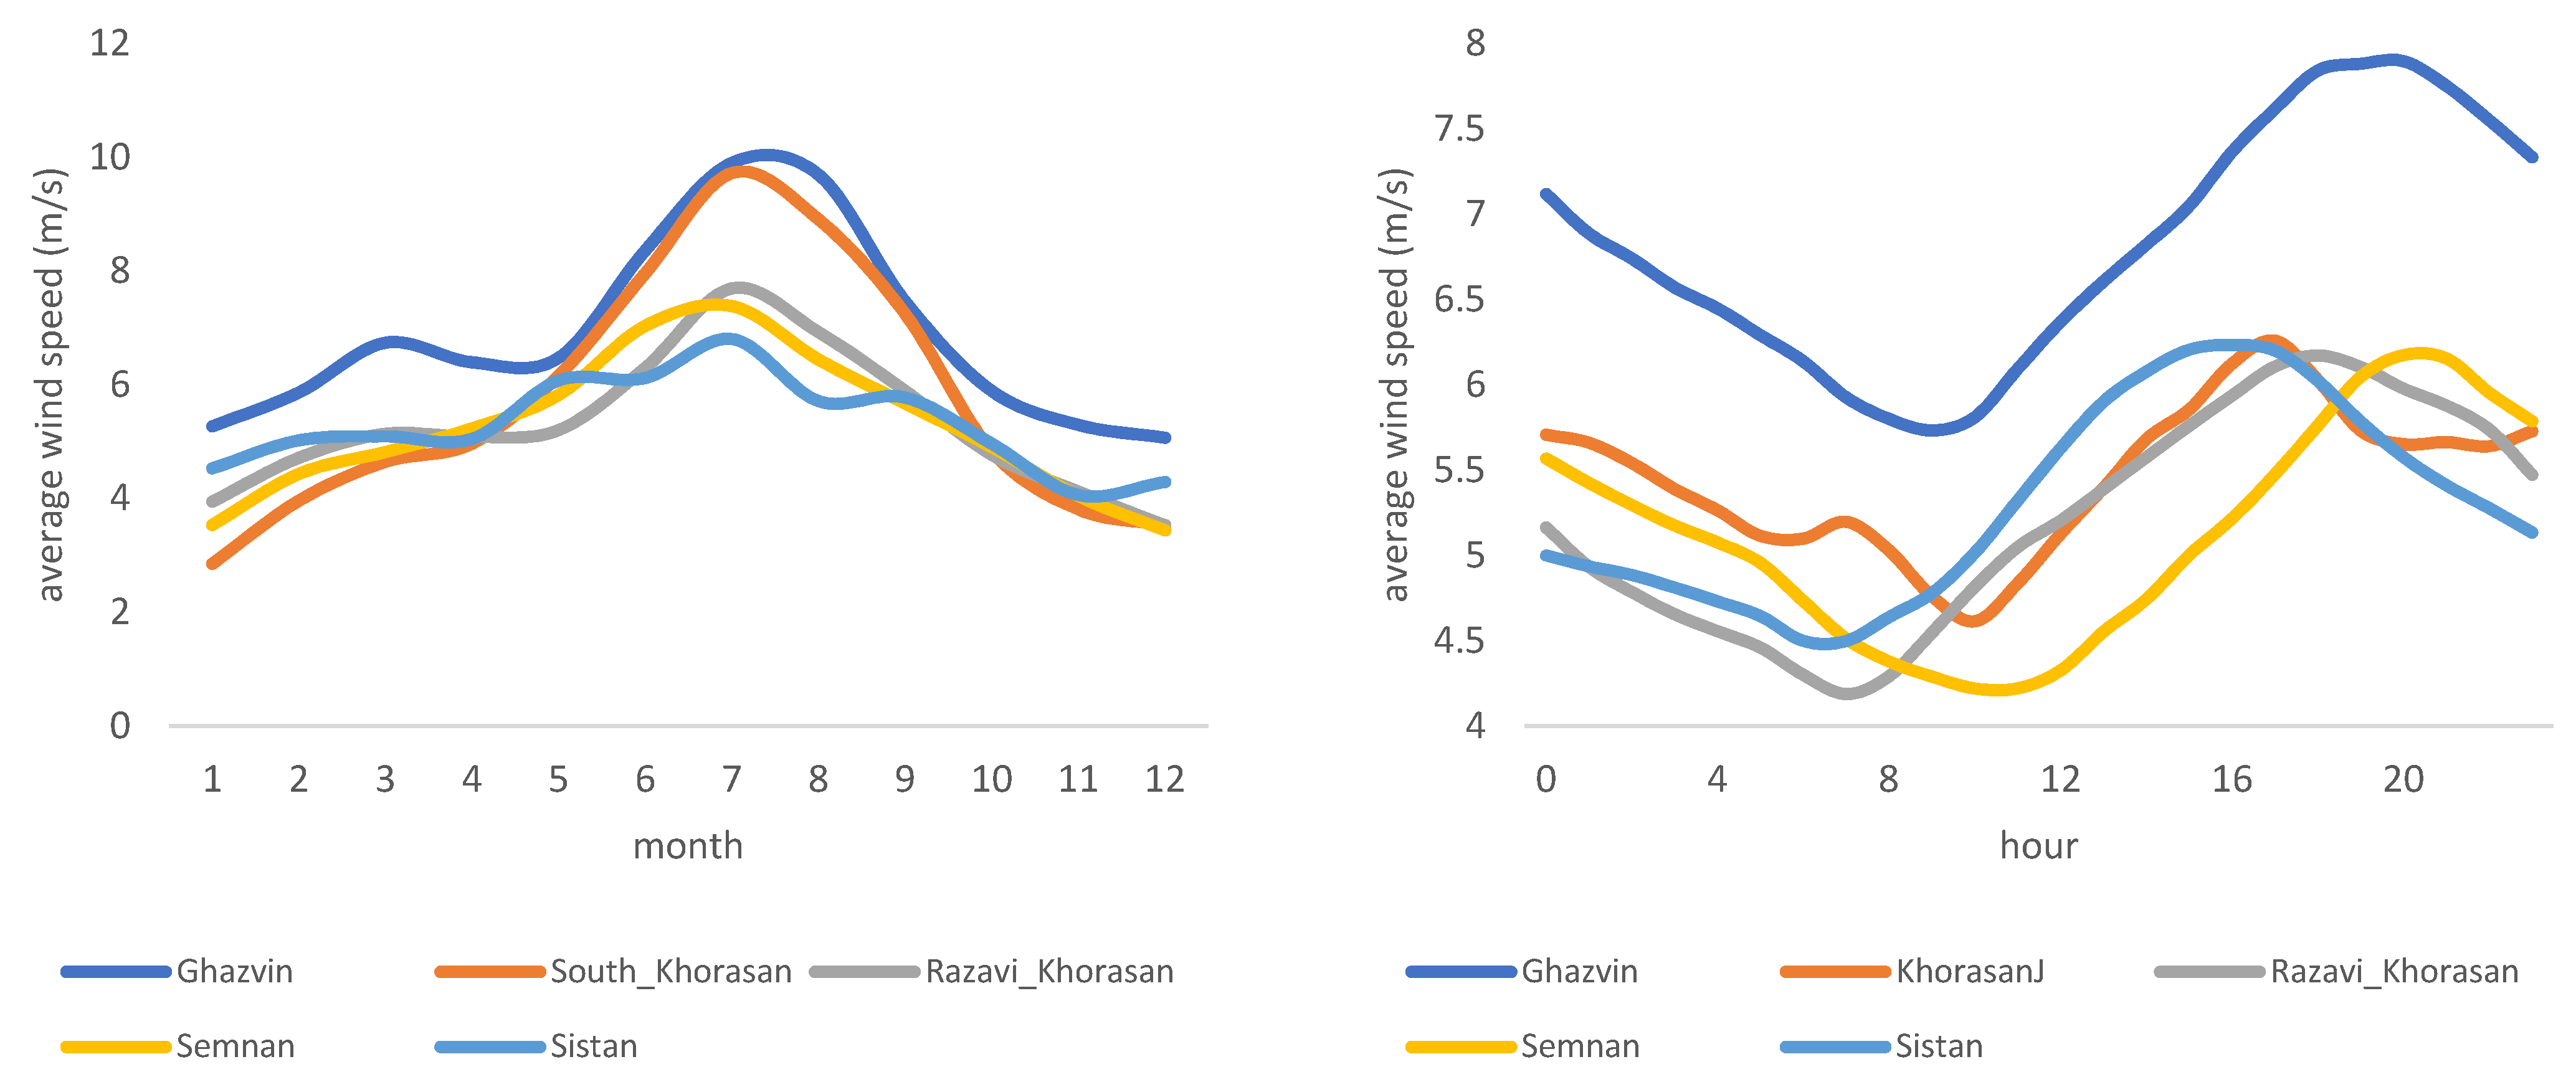
3. Wind Resource Assessment

This study is based on wind speed data collected from more than 160 wind data loggers across Iran, installed and operated by SATBA. The geographical distribution of data loggers provides widespread coverage and an accurate understanding of wind power sources in Iran. We have at least two years of data for most data loggers. Their year of operations varies from 2006 to 2015. Moreover, to have a higher number of data logging stations in our sample, we use the available data at the height of 40 m. The following map (Figure 1) shows the geographical distribution of the wind data loggers across the country, mainly concentrated on northwestern and western mountainous regions of Iran.
The spatial and temporal variation in wind power in Iran affects the availability, dispatchability, and reliability of the electricity generated from wind. To better interpret such variation, all provinces of Iran are compared (Figure 2a–e), both for diurnal and seasonal variation. A significant and similar pattern for diurnal variation in all provinces shows that wind power peaks in the noon or the afternoon. This expected intermittency forces grid companies to rely on wind power generation at specific times during the day and year. Given the relatively high standard deviation of wind power during peak concerning mean (=3.6052 and mean = 4.8283 m/s), grid companies need to install technologies that can deal with such intermittency. Among others, such technologies are pumped hydropower, compressed air energy storage, electrical batteries, supercapacitors, and thermal energy storage stations. There is no unique pattern in terms of seasonal variation; therefore, regional grid companies in each province must further investigate appropriate technologies and seasonal generation plans.
To better understand, it is best to focus the analysis on provinces with larger wind power capacity or average annual wind speed of greater than 5 m/s (5 m/s is the minimum wind speed required for a utility-scale wind power plant). (Figure 3) ranks all provinces based on their average wind speed. Based on this figure, provinces of Qazvin, East Azerbaijan, Alborz, South Khorasan, Ardabil, Sistan Baluchestan, Qom, Razavi Khorasan, Semnan, and Khuzestan all register average annual wind speeds larger than 5 m/s. Figure 4 provides an overview and comparison of these provinces in detail. As can be seen, diurnal variation has the same pattern as before, with wind speed increasing and reaching its peak in the afternoon hours. There is also a seasonal variation in a few provinces. There are noticeable increases in wind speeds between May and October (with a peak in July) for South Khorasan, Razavi Khorasan, Qazvin, Semnan, and Sistan Baluchestan provinces.
As seen above, ten Iranian provinces have annual average wind speeds larger than 5 m/s at the height of 40 m, making them attractive regions to harvest wind energy. To complement the above discussion, Figure 5 shows the wind map of Iran, confirming that large areas of Iran register wind speed larger than 5 m/s, which is highlighted by green, yellow, orange, and red, dark purple colors. However, the wind share in the Iran electricity mix has always been less than 0.5%, while the share of fossil fuel in the country’s installed capacity has remained well above 90%, followed by hydro of around 6% (https://www.eia.gov/international/analysis/country/IRN, accessed on 15 December 2020). Regulatory and economic hurdles play a major role in the minute share of renewable energy, specifically wind, energy in Iran.

4. Technical, Economic, and Regulatory Assessments

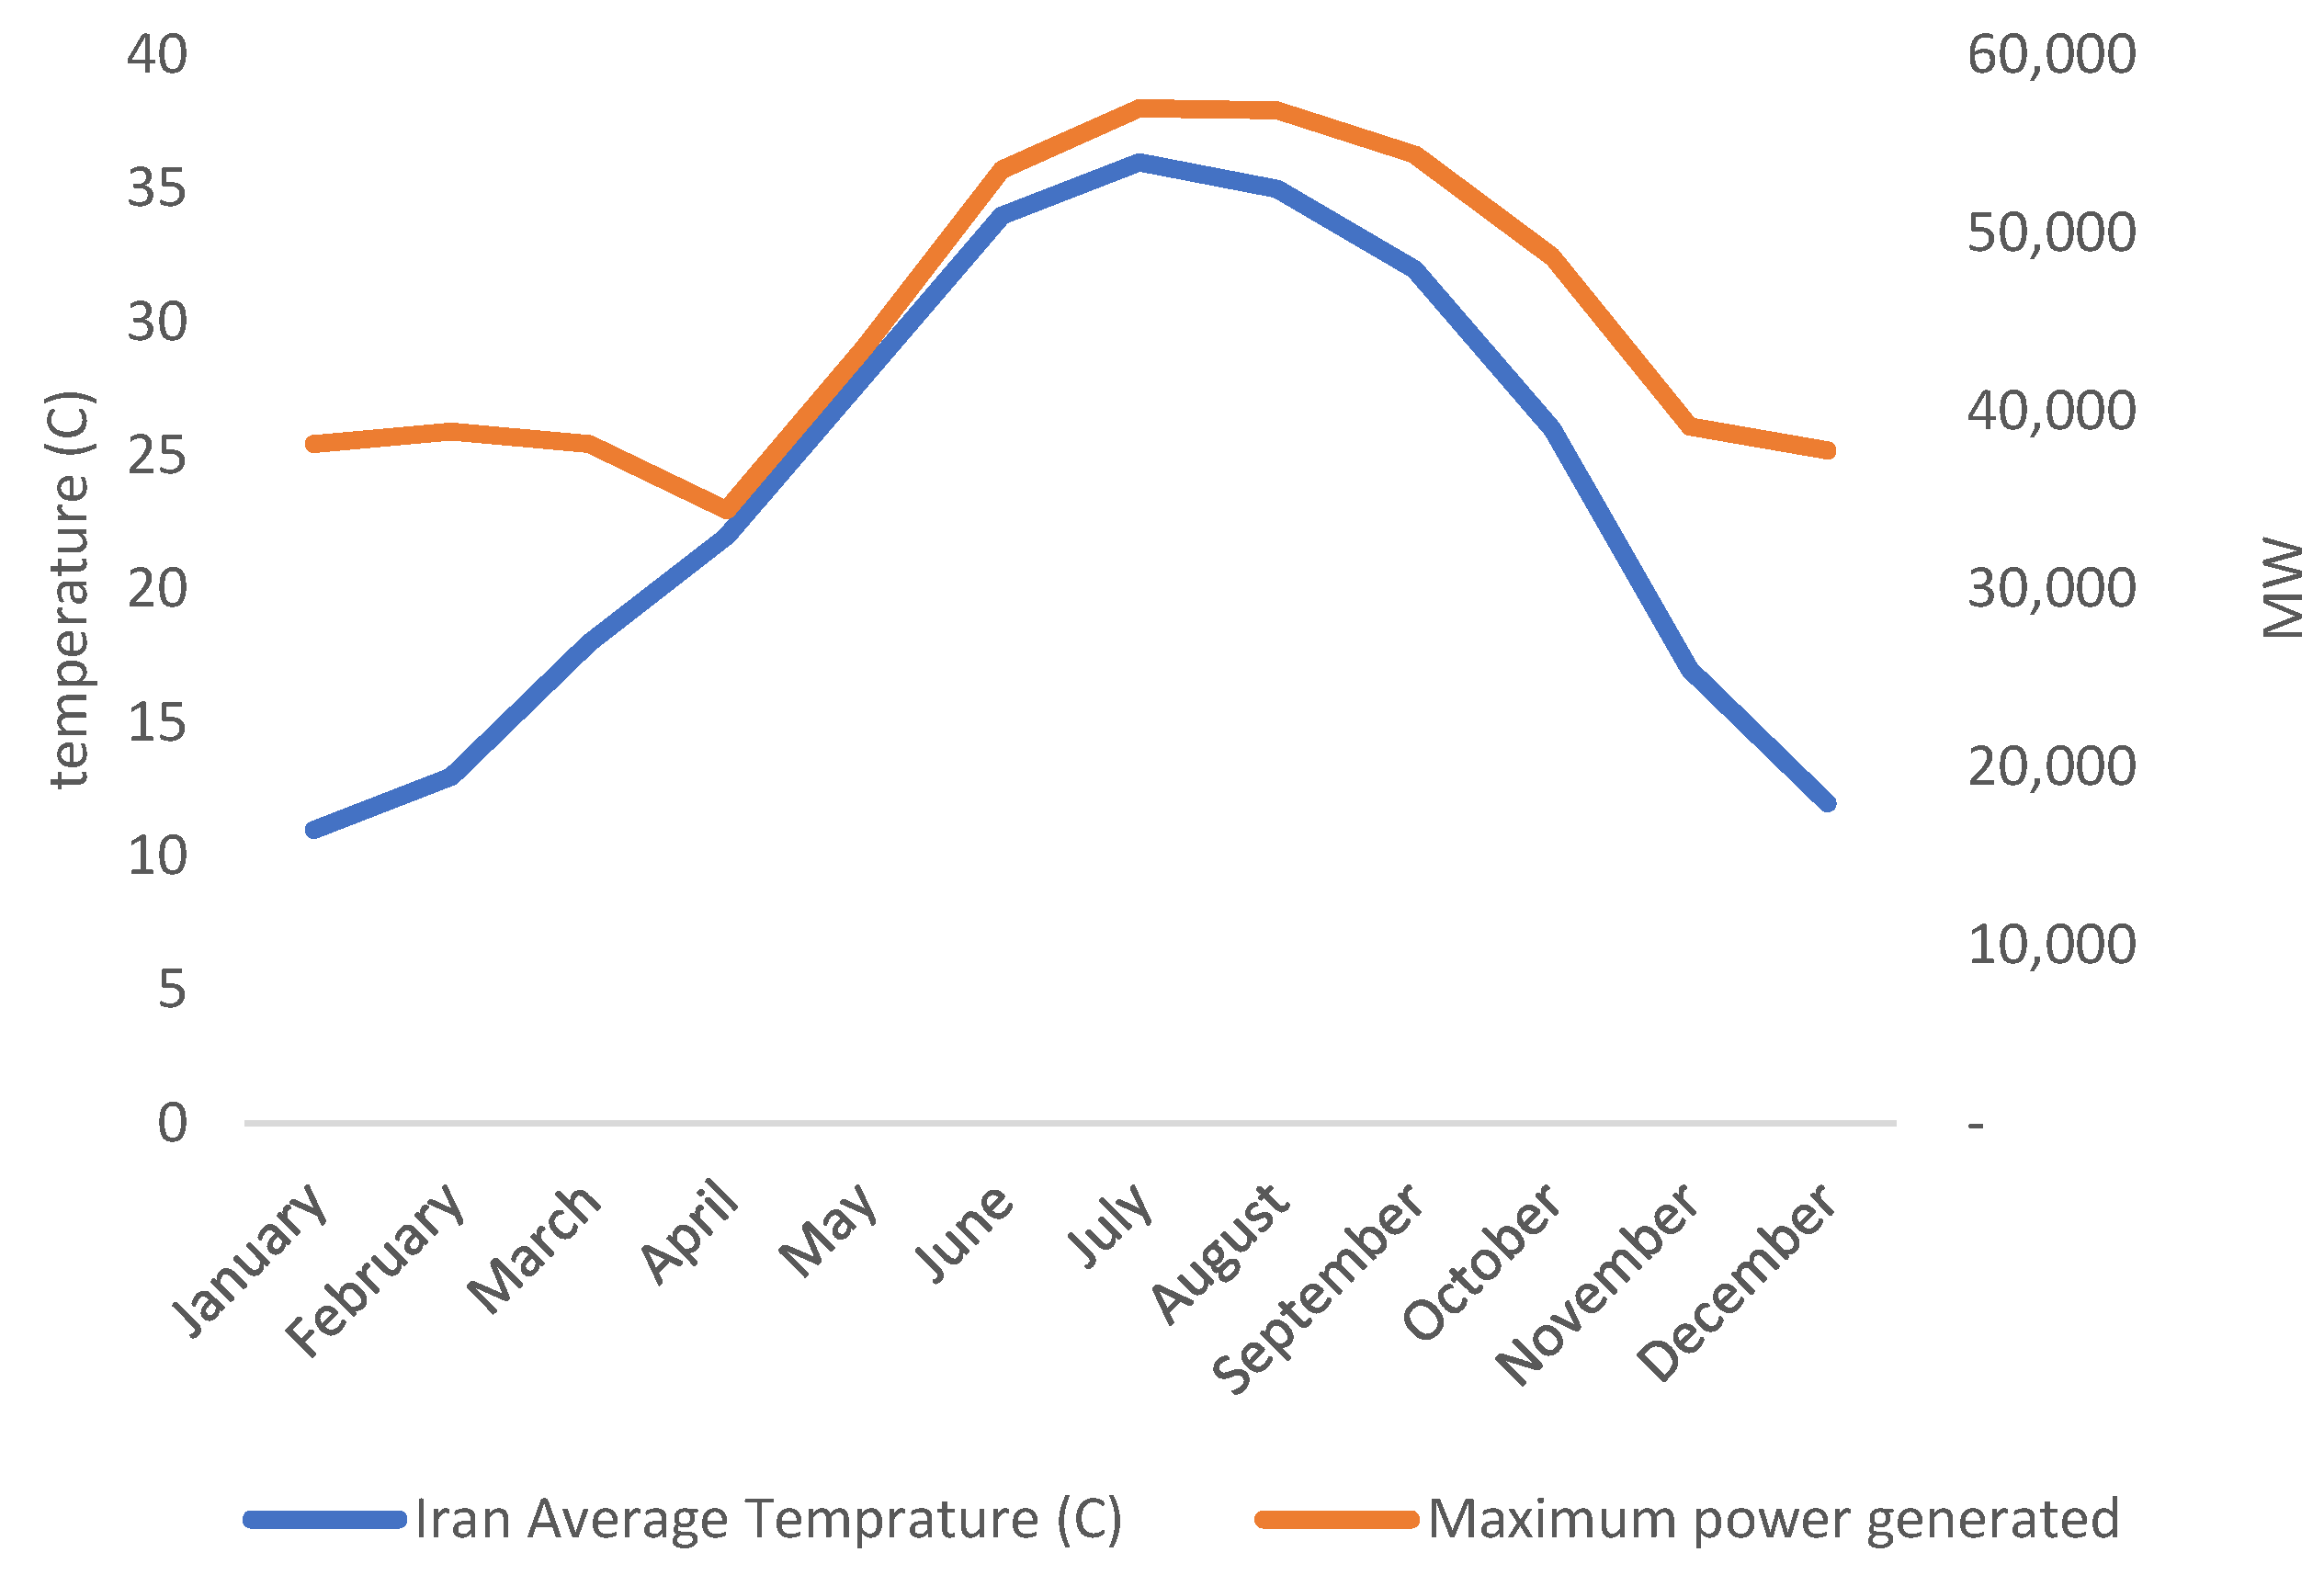
4.1. Technical Assessment

As of now, most of Iran’s wind turbines are installed in Qazvin and Razavi Khorasan provinces. However, wind power has good potential in other provinces such as East Azerbaijan, Ardabil, South Khorasan, and Sistan Baluchestan. These six provinces are home to wind trackers in the top quartile in terms of wind speeds (Figure 6 and Table 2). The data confirm that the peak wind speed in these provinces happens between May and September, which matches the peak electricity load and the average temperature in Iran (Figure 7). In recent years, policymakers have had a major concern to address the summer electricity peak demand economically feasible and technically reliable, as summer blackouts have become more commonplace across the country. The positive correlation between peak electricity demand and peak wind speeds in these provinces and several others, such as Semnan and Markazi provinces, has made wind an important piece of the puzzle in the proposed solutions for this increasing challenge.
The average wind speed data for the above six provinces are presented in Table 2. Based on the energy recovery potential of the most commonly utilized Vestas V47 wind turbines in Iran and applying a capacity factor (Cp) of 50% and Betz limit of 59%, the average monthly electricity that can be generated is presented in Table 3.

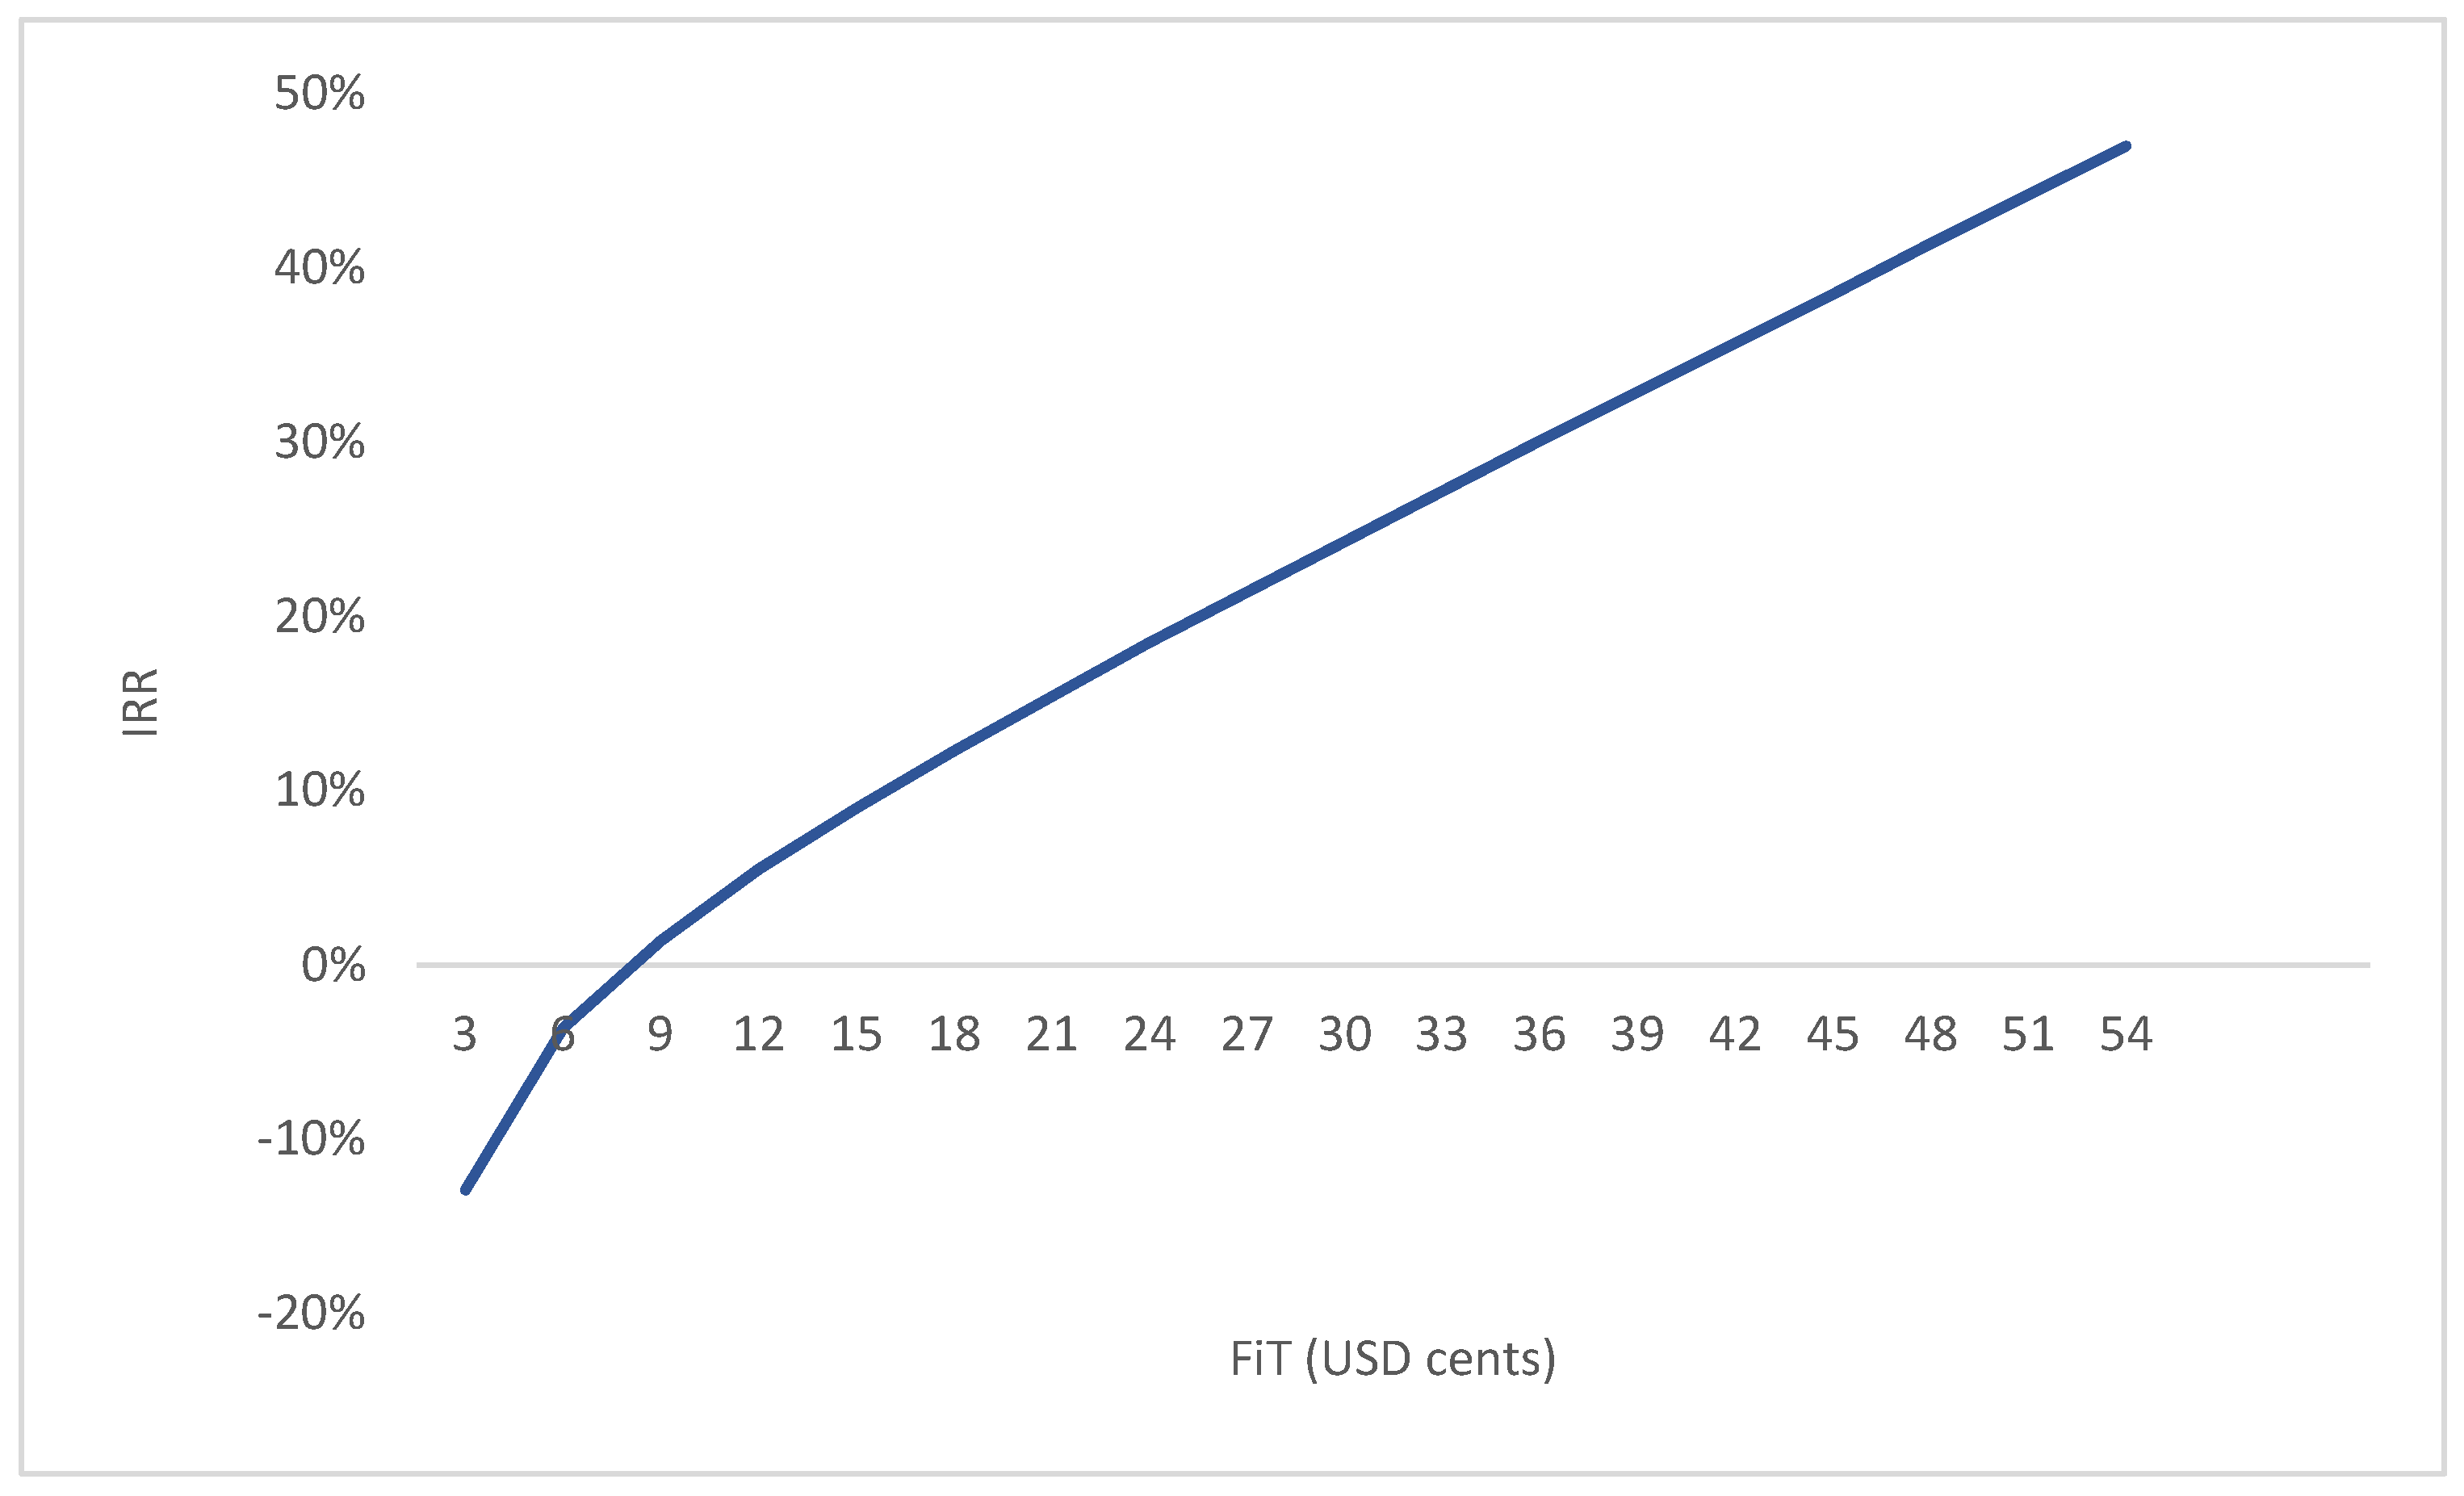
4.2. Economic Assessment

As seen in Table 4, for wind energy to meet 5% (The logic behind choosing 5% is because the share of wind in world’s total electricity generation is about 5.9%. Hence, given the current economic and policy environment in the country, 5% would be the maximum possible share of wind in Iran’s electricity industry in the foreseable future. See bp Statistical Review of World Energy July 2021 (http://www.bp.com/statisticalreview, accessed on 17 November 2021) for more) of the total electricity demand in the above six provinces, it is necessary to build wind farms with a total capacity of about 1616 MW which will require an initial investment (CapEx) of USD 1.89 billion. It should be note that the total demand estimation has been done using the previous studies conducted for the case of Iran [23,24,25]. As discussed earlier, although wind energy is technically an attractive and viable option in the above six provinces, the main factor discouraging investments in this sector is the extremely low FiT for electricity generated from wind farms. As seen in Table 4, the current FiT of 3.5 cents per kWh results in a large negative IRR of about −10.2%, which is not acceptable.
Massive depreciation of Iranian rial in the past three years and lack of subsequent adjustments to FiT have made the purchase price of electricity from wind drop from about 12.5 cents in 2017 to 3.5 cents per kWh in 2020. As a result, utility-scale investments in the Iranian wind sector have halted in the past three years, making adjustments to FiT a necessary policy requirement to reinvigorate investments in Iran’s wind energy industry. IRRs and NPVs associated with a few FiT scenarios are considered in Table 5:
  • Scenario 1 is based on the current FiT of 3.5 cents per kWh.
  • Scenario 2 refers to the 2010–2019 average FiT for wind energy in 26 OECD countries with such available data.
  • Scenario 3 refers to the 2010–2019 average FiT for wind energy in 45 OECD and non-OECD countries worldwide with such available data.
  • Scenario 4 is Switzerland’s 2010–2019 average FiT for wind, the highest figure among the 26 OECD countries.
  • Scenario 5 is the 2010–2019 average FiT for wind in the Dominican Republic, the highest figure among the 45 OECD and non-OECD countries worldwide (Please see Appendix B for available data on FiT for all countries between 2010 and 2019).
As suggested in Table 5 and Figure 8, for Iranian wind farms in these six provinces to provide a minimum positive IRR, a FiT of at least 8.1 cents per kWh is required for the next 20 years. However, to make investments in wind farms competitive in these provinces, a FiT of at least 12 cents per kWh is needed, equal to the global average FiT for wind energy. In other words, with a FiT that is at least equal to the world average, establishing wind farms in these six Iranian provinces would be economically feasible and attractive projects to invest in. As a result, the success of the Iranian wind energy industry depends heavily on the ability of the Iranian government to commit to a FiT that is equal to or larger than 12 cents per kWh in the long run.
At first look, the Iranian government seems to lack the ability to commit to such a FiT for 20 years. Severe and prolonged economic and financial sanctions and rapid depreciation of the Iranian rial have significantly impacted the government’s fiscal position, leaving no room for the government to provide and commit to economically suitable FiTs for wind and other renewable energy sources. However, reviewing the energy policies of the Iranian government in the past decades reveals the grim reality that fossil fuel subsidies have ranged somewhere between 20% and 30% of Iran’s GDP, year after year. For example, a 2019 IMF working paper estimates that Iran’s post-tax energy subsidies (including all kinds of fossil fuel, electricity, and water) were about USD 111 billion or around 30% of the country’s GDP in 2015 (Coady et al., 2019). In 2018, fossil fuel subsidies were reduced to USD 69 billion, 15.3% of the country’s GDP, and 16% of total global energy subsidies (https://financialtribune.com/articles/domestic-economy/98959/iran-largest-fuel-subsidizer-in-2018, accessed on 13 February 2020). However, energy subsidies have increased to about USD 110 billion because of the continuous depreciation of rial vis à vis significant currencies in the past three years.
What makes such massive subsidies even more unjustifiable is that more than 82% of such subsidies end up in the pockets of the Iranian households in the top income decile. Moreover, smuggling gasoline and diesel outside Iran has been commonplace, amounting to more than 8 million liters per day in 2019, declining from 2018’s 12 million per day figure (https://www.magiran.com/article/3962335, accessed on 13 February 2021). Fuel smuggling only benefits the smugglers and economies of the destination countries at the massive cost of the Iranian economy. The difference in the price of gasoline between Iran and its land neighbors ranges from 35 (Azerbaijan) to 81 (Turkey) cents per little. At 8 million liters per day and assuming that the smuggled fuel is divided equally between Iran’s land neighbors, the cost of fuel smuggling to Iran’s economy is about USD 1.5 billion a year. This amount is sufficient to cover a FiT of 12 cents per kWh for wind energy to meet 5% of Iran’s total electricity demand for the next 20 years (Table 6).
Considering the inequitable, inefficient, and ineffective nature of fossil fuel subsidies in Iran and its immense pressure on the government’s finances, it only makes sense to reduce or remove them altogether (https://www.mei.edu/publications/deja-vu-all-over-again-three-gasoline-subsidies-and-social-unrest-iran, accessed on 3 March 2022). As seen in Table 6, to meet 5% of Iran’s estimated total electricity demand through wind energy, the annual costs for FiTs of 12, 21.5, and 53 cents per kWh are USD 1.5, USD 2.69, and USD 6.63 billion. Based on a very conservative estimate of explicit (and not hidden) fossil fuel subsidies of USD 70 billion a year, these FiTs would be about 2.14%, 3.84%, 9.46% of the fossil fuel subsidies in Iran, respectively. Moreover, the capital needed to develop and maintain the wind farms hosting 16,500 of 660 kilowatt Vestas V47 wind turbines will be around USD 12.86 billion or just 18% of the total cost of fossil fuels subsidies in one year. These funds can be dispensed in zero-interest loans to develop and operate wind farms needed to meet 5% of Iran’s total electricity demand. Again, these estimates are based on very conservative fossil fuel subsidies of USD 70 billion per year. The case for subsidizing wind energy through reducing fossil fuel subsidies gets much more attractive if we consider the USD 111 billion energy subsidies figure mentioned in IMF’s 2019 working paper cited above. In a nutshell, even in the face of the harshest financial and economic sanctions, reducing fossil fuel subsidies in Iran even by small amounts (It must be noted that while reducing energy subsidies will automatically reduce fuel smuggling, as long as there is a gasoline price difference between Iran and its neighbors, the motivation for fuel smuggling will remain), could provide ample fiscal space for the Iranian government to provide the necessary FiT and initial capital investment to promote the development of wind and other renewable energy in Iran.
The case of fossil fuel to clean energy “subsidy swaps” is well established in the literature. A 2019 report completed by International Institute for Sustainable Development (IISD) and Global Subsidies Initiative (GSI) shows that such swaps, as well as promoting the use of clean energy over fossil fuel, could also lead to substantial net gains in several fronts: creating permanent jobs, improving public health outcomes, enhancing gender equity, promoting innovation, and expanding the fiscal space of the government. The report argues that just 10% of fossil fuel subsidies worldwide could make the transition to clean energy a reality, where renewables would be the primary source of energy consumption. This is because “almost everywhere, renewables are so close to being competitive that (a 10–30% subsidy swap) tips the balance, and turns them from a technology that is slowly growing to one that is instantly the most viable and can replace substantial amounts of generation”, said Richard Bridle of the IISD (https://www.theguardian.com/environment/2019/aug/01/fossil-fuel-subsidy-cash-pay-green-energy-transition, accessed on 3 February 2022). While policymakers and economists worldwide agree on the economics and social gains of such swap, the political economy remains the main obstacle for them to materialize. Nevertheless, the study refers to a few successful case studies from India, Indonesia, and Morocco, where such swaps have been successfully introduced, albeit at a small level and gradual. Indeed, there are valuable lessons for Iran in the experience of these countries.

4.3. Policy Assessment

The Iranian government has introduced attractive incentives to develop and maintain wind farms in the recent decade to increase the share of wind energy in Iran and reduce the country’s dependence on fossil fuels. Following the 1994 construction of Iran’s first wind power plant in Manjil in the Gilan province, the government’s policy has been to increase the participation of the private sector in the development of wind energy in the country. Most of Iran’s wind power plants have been constructed over the last decade. The main incentive for developing these plants is the power purchase agreements (PPAs) and attractive investment facilities provided by the Iranian government. Some of the supporting and enabling policies are as follows:
(1)
Announcement of guaranteed electricity purchase prices from renewable energy plants by SATBA in 2016 (Satba.gov.ir, accessed on 3 February 2022).
(2)
The possibility of exporting electricity from renewable energy plants in 2018.
(3)
Assigning 8% of total electricity sales to invest in rural electrification and construction of renewable farms in the annual budget of 2013 and afterward.
PPAs are the main incentives for the development of renewable energy in Iran. What makes these contracts extremely attractive is their 20 years terms. Additionally, the prices offered for renewable sources are about 6 to 8 times larger than the price of electricity purchased from thermal power plants. However, as we will see below, given the minimal fiscal space of the government because of sanctions, price adjustments have not happened in the aftermath of the 2017–2020 rapid depreciation of the Iranian rial, halting investment in the wind industry. Nevertheless, some PPAs’ terms and associated purchase prices from the wind farms are highlighted in Table 7. As a result of these supporting and enabling policies, Iran’s wind capacity grew by more than 10 folds between 2000 and 2018 (Figure 9).
Moreover, the temporal (seasonal and hourly) and spatial variation of wind energy, along with the lack of experience in distributed generation in Iran, calls for an appropriate strategy. As an important step, establishing new technologies to address such intermittency requires effective and comprehensive regulations. It is a well-known fact that effective regulation can influence innovation and appropriate choice of technology. The regulatory process has many stakeholders who interact in feedback loops. Such loops generally connect the consumers to producers. Therefore, it is important to identify how regulation affects consumers’ and producers’ behavior and decision-making process. R&D subsidies and demand-side regulation affect innovation activities [26]. In addition, programs for sharing fixed costs may lead to more R&D investment, increasing performance efficiency and consumers’ utility [27].
The subsidies and technical regulations can be combined with other tools to shape a framework for a real competition or a kind of artificial competition. Opening up the access of new firms to competitive markets levers up multifactor productivity and increases investment for new products [28]. For instance, if renewable power generators could sell electricity to consumers using the grid without any price restrictions, some activities such as cryptocurrency mining could be legally and transparently performed. Currently, this industry is forbidden to access electricity power centrally set and heavily subsidized electricity tariffs.
Regulations for inducing innovation can target four distinctive aims depending on the situation of firms and the market [29]. First, they can reduce the cost of production, either in the form of capital cost or operating cost. Second, they can target higher efficiency in new processes and products or promote firms to replace the low-efficiency plants with higher-efficiency ones. Third, they can focus on the quality of services provided by enforcing higher standards. Finally, they could be firm-specific policies that focus on selected firms to decrease their cost, upturn their efficiency, or improve their quality of service. This form of regulation should be adopted very carefully because asymmetric regulation that does not apply to all firms can often result in corruption and office capture, yielding sub-optimal results [30]. U.K.’s OFGEM RIIO-2 is a good example for all the regulatory areas highlighted above, with specific application to the first and second areas (https://www.ofgem.gov.uk/system/files/docs/2020/07/riio-2_draft_determinations_overview.pdf, accessed on 3 February 2022).

5. Conclusions

To conclude, from a purely technical perspective, the wind industry in Iran has excellent potential as Iran is situated in a wind-belt area. Heeding to this fact, the government has enabled policies to tap into this great potential. However, the collapse of the Iranian rial has reduced the FiT from 12.5 cents in 2017 to 3.5 cents per kWh in 2020, resulting in a significant negative IRR of −10.2% and consequently halting investments in this sector in the past three years. As a result, the primary missing piece of the puzzle in revitalizing the growth of the Iranian wind power industry is restoring the FiT to the 2017 minimum levels of 12.5 cents per kWh, a figure which happens to be equivalent to the world average in the past decade.
Reducing current wasteful and socially unjust fossil fuel subsidies by only 20% in the first year and 2.14% per year afterward can provide the necessary initial capital in the form of government grants to the private sector and the FiT necessary for the government to commit for 20 years to revitalize Iran’s wind energy industry. In addition to reducing dependency on fossil fuels, the development of the wind industry in Iran can also create tens of thousands of green jobs in Iran’s labor market, suffering from high unemployment rates, especially among the educated youth. International Renewable Energy Agency estimates that 1.2 million people are employed globally in the 651 GW wind energy industry (https://www.irena.org/Statistics, accessed on 3 February 2022). Meeting 5% of Iran’s electricity demand through wind energy would require around 11 GW of installed wind capacity, translating to more than 20,000 green jobs.
Iran Vice-Presidency of Science and Technology has recently set a specific mission on renewable energy to promote related technologies and support start-up firms to develop new products and technologies. Hence, the wind industry can act as a leading high-tech sector in Iran’s long-term plan to transform into a knowledge-based economy by supporting small and medium-sized firms. It would develop innovative products and solutions, with many positive externalities and spillover effects.
Moreover, according to estimates provided by American Wind Energy Association, 11 GW of installed wind capacity can reduce CO2 emission by around 18.5 million metric tons per year, an amount that is equivalent to CO2 emitted by 4.6 million cars or 27% of Iran’s transportation fleet. It can also reduce water consumption at Iran’s existing thermal plants by about 18.5 billion liters per year and result in more than USD 160 million savings in public health outcomes (https://www.awea.org/wind-101/benefits-of-wind/environmental-benefits, accessed on 3 January 2022). Although these estimates are small in comparison to the serious unemployment, ambient air pollution, and water scarcity challenges facing the Iranian economy and environment, they nevertheless highlight the fact that by tapping into its immense wind energy potential, not only can Iran reduce its dependence on fossil fuel as a source of energy in the long run, it can also take steps, albeit small, in making dents in other challenges facing the country.

Author Contributions

All authors contributed to the study conception and design. Material preparation, data collection and analysis were performed by S.R.M. and A.M.C. The first draft of the manuscript was written by S.R.M. All authors have read and agreed to the published version of the manuscript.

Funding

Seyed Reza Mirnezami has received research support from Tavanir Company (Contract number 4622).

Informed Consent Statement

Not applicable.

Data Availability Statement

The datasets analyzed during the current study are not publicly available due to some limitations made by Iran renewable energy organization (SATBA) but are available from the corresponding author on reasonable request.

Conflicts of Interest

The authors have no relevant financial or non-financial interests to disclose.

Appendix A

Table A1. 660 KW Vestas V47 Specifications.
Ρ1.225 kg/m3
d47 m
A1735 m2
Betz limit59%
Total yield losses 50%
Capacity factor50%
Capacity660 KW
Wind speed limitation3 m/s to 25 m/s
PriceUSD 593,000
Other costs (transportation, installation, and integration)USD 177,900 or 30% of the price of the turbine
Annual O&M cost8895

Appendix B

Table A2. Wind FiT (USD).
2010201120122013201420152016201720182019Average
2010–2019
Algeria0.0900.0900.0900.0900.090 0.090
Argentina0.0040.0040.0030.0030.0020.0000.0000.0000.0000.0000.002
Armenia0.0860.0930.0870.0800.074 0.084
Belarus0.0000.1530.1530.1530.153 0.122
Bosnia and Herzegovina0.0000.0950.0880.0910.091 0.073
Bulgaria0.1100.6790.6280.6480.6480.0000.0000.0000.0860.0810.288
China0.0830.0870.0890.0900.0910.0860.0770.0720.0690.0000.075
Croatia0.1170.1230.1630.1670.1660.1390.0000.0000.0000.0000.088
Cyprus0.2200.2310.1860.0000.0000.0000.0760.0770.0810.0000.087
Dominican Republic0.5300.5300.5300.5300.530 0.530
Ecuador0.0940.0910.0910.1170.000 0.079
India0.0760.0740.0910.0870.0880.0830.0800.0000.0000.0000.058
Indonesia0.1190.1230.1150.1030.0910.0810.0810.0970.0910.0910.099
Iran0.1200.1160.1010.0670.171 0.115
Jordan0.0000.0000.1130.1130.113 0.068
Kazakhstan0.0000.0000.0000.1490.127 0.055
Kenya0.1200.1200.1200.1200.120 0.120
North Macedonia0.1180.1240.1140.1180.118 0.119
South Africa0.1710.1290.0000.0000.0000.0000.0000.0000.0000.0000.030
Austria0.1290.1350.1220.1250.1250.1050.1050.1010.0970.0910.113
Canada0.1560.1620.1270.1130.1050.0000.0000.0000.0000.0000.066
Czech Republic0.1170.1290.1140.1080.0000.0000.0000.0000.0000.0000.047
Denmark0.0740.0770.0720.0740.0740.0620.0620.0630.0660.0000.062
Estonia0.0970.1020.0690.0710.0710.0600.0590.0610.0630.0600.071
Finland0.0000.1460.1350.1400.1400.1160.0920.0940.0990.0940.106
France0.1090.1140.1050.1090.1090.0000.0000.0000.0000.0000.055
Germany0.1090.1150.1150.1170.1180.0990.0980.0950.1140.1080.109
Greece0.1160.1220.1130.1170.1170.0970.1080.0000.0000.0000.079
Ireland0.0870.0940.0890.0930.0940.0790.0000.0000.0000.0000.054
Israel0.3810.3900.2420.1290.0000.0000.0000.0000.0000.0000.114
Italy0.0000.0000.0000.2520.2470.1720.2360.2410.0580.0560.126
Japan0.0000.0000.2760.2250.2080.1820.2020.1960.2540.2520.179
Korea0.0930.0970.0000.0000.0000.0000.0000.0000.0000.0000.019
Latvia0.1590.1670.1540.1590.0000.0000.0000.0000.0000.0000.064
Lithuania0.0000.0000.0000.0960.0960.0710.0000.0000.0000.0000.026
Luxembourg0.1090.1130.1040.1060.1220.1020.1010.1030.1080.1020.107
Netherlands0.1270.1860.1410.1460.1460.1530.1520.0950.0990.0780.132
Portugal0.0990.1040.0960.0990.0000.0000.0000.0000.0000.0000.040
Slovak Republic0.1070.1130.1040.0930.0930.0780.0780.0500.0520.0000.077
Slovenia0.1210.1270.1170.1210.1210.1010.1010.1030.0000.0000.091
Spain0.1030.1080.1000.0000.0000.0000.0000.0000.0000.0000.031
Switzerland0.1220.2250.2290.2320.2350.2230.2180.2180.2200.2310.215
Turkey0.7280.7270.0730.0730.0730.0730.0730.0730.0730.0730.204
United Kingdom0.0840.0870.0860.0780.2460.1640.0690.0630.0610.0560.099
United States0.0850.0720.0640.0600.0110.0040.0030.0020.011..0.035
Source: https://stats.oecd.org/Index.aspx?DataSetCode=RE_FIT, accessed on 22 February 2022.

References

  1. Moghaddam, N.B.; Mousavi, S.M.; Nasiri, M.; Moallemi, E.A.; Yousefdehi, H. Wind energy status of Iran: Evaluating Iran’s technological capability in manufacturing wind turbines. Renew. Sustain. Energy Rev. 2011, 15, 4200–4211. [Google Scholar] [CrossRef]
  2. Shafiei, E.; Saboohi, Y.; Ghofrani, M.B. Impact of innovation programs on development of energy system: Case of Iranian electricity-supply system. Energy Policy 2009, 37, 2221–2230. [Google Scholar] [CrossRef]
  3. Nelson, J.; Johnston, J.; Mileva, A.; Fripp, M.; Hoffman, I.; Petros-Good, A.; Blanco, C.; Kammen, D.M. High-resolution modeling of the western North American power system demonstrates low-cost and low-carbon futures. Energy Policy 2012, 43, 436–447. [Google Scholar] [CrossRef]
  4. DeCesaro, J.; Porter, K.; Milligan, M. Wind energy and power system operations: A review of wind integration studies to date. Electr. J. 2009, 22, 34–43. [Google Scholar] [CrossRef] [Green Version]
  5. Keyhani, A.; Ghasemi-Varnamkhasti, M.; Khanali, M.; Abbaszadeh, R. An assessment of wind energy potential as a power generation source in the capital of Iran, Tehran. Energy 2010, 35, 188–201. [Google Scholar] [CrossRef]
  6. Mirhosseini, M.; Sharifi, F.; Sedaghat, A. Assessing the wind energy potential locations in province of Semnan in Iran. Renew. Sustain. Energy Rev. 2011, 15, 449–459. [Google Scholar] [CrossRef]
  7. Mostafaeipour, A.; Sedaghat, A.; Dehghan-Niri, A.A.; Kalantar, V. Wind energy feasibility study for city of Shahrbabak in Iran. Renew. Sustain. Energy Rev. 2011, 15, 2545–2556. [Google Scholar] [CrossRef]
  8. Mostafaeipour, A.; Jadidi, M.; Mohammadi, K.; Sedaghat, A. An analysis of wind energy potential and economic evaluation in Zahedan, Iran. Renew. Sustain. Energy Rev. 2014, 30, 641–650. [Google Scholar] [CrossRef]
  9. Mostafaeipour, A. Feasibility study of harnessing wind energy for turbine installation in province of Yazd in Iran. Renew. Sustain. Energy Rev. 2010, 14, 93–111. [Google Scholar] [CrossRef]
  10. Mohammadi, K.; Mostafaeipour, A. Using different methods for comprehensive study of wind turbine utilization in Zarrineh, Iran. Energy Convers. Manag. 2013, 65, 463–470. [Google Scholar] [CrossRef]
  11. Fazelpour, F.; Soltani, N.; Soltani, S.; Rosen, M.A. Assessment of wind energy potential and economics in the north-western Iranian cities of Tabriz and Ardabil. Renew. Sustain. Energy Rev. 2015, 45, 87–99. [Google Scholar] [CrossRef]
  12. Mostafaeipour, A.; Sedaghat, A.; Ghalishooyan, M.; Dinpashoh, Y.; Mirhosseini, M.; Sefid, M.; Pour-Rezaei, M. Evaluation of wind energy potential as a power generation source for electricity production in Binalood, Iran. Renew. Energy 2013, 52, 222–229. [Google Scholar] [CrossRef]
  13. Dabbaghiyan, A.; Fazelpour, F.; Abnavi, M.D.; Rosen, M.A. Evaluation of wind energy potential in province of Bushehr, Iran. Renew. Sustain. Energy Rev. 2016, 55, 455–466. [Google Scholar] [CrossRef]
  14. Mohammadi, K.; Mostafaeipour, A. Economic feasibility of developing wind turbines in Aligoodarz, Iran. Energy Convers. Manag. 2013, 76, 645–653. [Google Scholar] [CrossRef]
  15. Nedaei, M.; Assareh, E.; Biglari, M. An extensive evaluation of wind resource using new methods and strategies for development and utilizing wind power in Mah-shahr station in Iran. Energy Convers. Manag. 2014, 81, 475–503. [Google Scholar] [CrossRef]
  16. Gorjian, S.; Zadeh, B.N.; Eltrop, L.; Shamshiri, R.R.; Amanlou, Y. Solar photovoltaic power generation in Iran: Development, policies, and barriers. Renew. Sustain. Energy Rev. 2019, 106, 110–123. [Google Scholar] [CrossRef]
  17. Hirbodi, K.; Enjavi-Arsanjani, M.; Yaghoubi, M. Techno-economic assessment and environmental impact of concentrating solar power plants in Iran. Renew. Sustain. Energy Rev. 2020, 120, 109642. [Google Scholar] [CrossRef]
  18. Moslem Mousavi, S.; Bagheri Ghanbarabadi, M.; Bagheri Moghadam, N. The competitiveness of wind power compared to existing methods of electricity generation in Iran. Energy Policy 2012, 42, 651–656. [Google Scholar] [CrossRef]
  19. Girard, R.; Laquaine, K.; Kariniotakis, G. Assessment of wind power predictability as a decision factor in the investment phase of wind farms. Appl. Energy 2013, 101, 609–617. [Google Scholar] [CrossRef] [Green Version]
  20. Foley, A.M.; Leahy, P.G.; Marvuglia, A.; McKeogh, E.J. Current methods and advances in forecasting of wind power generation. Renew. Energy 2012, 37, 1–8. [Google Scholar] [CrossRef] [Green Version]
  21. Elberg, C.; Hagspiel, S. Spatial dependencies of wind power and interrelations with spot price dynamics. Eur. J. Oper. Res. 2015, 241, 260–272. [Google Scholar] [CrossRef] [Green Version]
  22. Albadi, M.; El-Saadany, E. Overview of wind power intermittency impacts on power systems. Electr. Power Syst. Res. 2010, 80, 627–632. [Google Scholar] [CrossRef]
  23. Kazemi, A.; Bashirzadeh, R.; Aryaee, S. Iran’s Electrical Energy Demand Forecasting Using Meta-Heuristic Algorithms. Iran. J. Energy 2020, 22, 27–44. [Google Scholar]
  24. Rostami, M.; Khademvatani, A.; Omidali, M. Forecasting Electricity Demand in Iran: The application of a Hybrid Dynamic Partial Adjustment and ARIMA Model. J. Appl. Econ. Stud. Iran 2018, 7, 177–199. [Google Scholar] [CrossRef]
  25. Fatemi Ardestani, S.F.; Barakchian, S.M.; Shokoohian, H. Short-term Forecast of Hourly Electricity Demand in Iran Using a Forecast Combination Method. J. Plan. Budg. 2020, 24, 57–73. [Google Scholar] [CrossRef]
  26. Walz, R.; Schleich, J.; Ragwitz, M. How Regulation Influences Innovation: An Indicator based Approach for the Case of Renewable Energy Technologies. 2008. Available online: https://hdl.handle.net/1853/39796 (accessed on 11 March 2020).
  27. Palmer, K. Diversification by Regulated Monopolies and Incentives for Cost-Reducing R&D. Am. Econ. Rev. 1991, 81, 266–270. [Google Scholar]
  28. Nicoletti, G.; Scarpetta, S. Regulation and Economic Performance; OECD Publishing: Paris, France, 2005. [Google Scholar]
  29. Viljainen, S. Regulation Design in the Electricity Distribution Sector: Theory and Practice; Lappeenranta University of Technology: Lappeenranta, Finland, 2005. [Google Scholar]
  30. Schankerman, M. Symmetric regulation for competitive telecommunications. Inf. Econ. Policy 1996, 8, 3–23. [Google Scholar] [CrossRef]
Figure 1. Geographical locations of SATBA wind data loggers. Source: SATBA.
Energies 15 03230 g001
Figure 2. (ae) Diurnal and seasonal variation of wind speed in Iranian provinces.
Energies 15 03230 g002aEnergies 15 03230 g002b
Figure 3. Average annual wind speed in Iranian provinces.
Energies 15 03230 g003
Figure 4. Diurnal and seasonal wind speed variation for Iranian provinces with average annual wind speed larger than 5 m/s.
Energies 15 03230 g004aEnergies 15 03230 g004b
Figure 5. Wind atlas of Iran at height 50 m. Source: https://globalwindatlas.info/area/Islamic%20Republic%20of%20Iran, accessed on 22 September 2020.
Energies 15 03230 g005
Figure 6. Seasonal variation of wind speed, selected provinces of Iran with annual average wind speeds of larger than 5 m/s.
Energies 15 03230 g006
Figure 7. Electricity load and average temperature for Iran.
Energies 15 03230 g007
Figure 8. IRR for each give FiT. FiTs larger than 8.1 cents provide a positive IRR.
Energies 15 03230 g008
Figure 9. Development of wind capacity in Iran, 2000–2018. Source: Tavanir, detailed statistics of Iran electric power generation, 2018.
Energies 15 03230 g009
Table 1. Wind farms in Iran.
NameCityProvinceInstalled
Capacity
Year
Developed
MahbadSiaahPoushGhazvin61.22017
MapnaAghkandAzerbaijan Sharghi502017
MapnaKahakGhazvin552015
AtrinKhaafKhorasan Razavi2.52016
BehinKhaafKhorasan Razavi1.52013
BinaloodBinalodKhorasan Razavi28.52010
DizbadNeyshabourKhorasan Razavi42015
ManjilManjilGilan92.51994
Ben AliTbarizAzarbayjan Sharghi22009
Source: SATBA.
Table 2. Average monthly wind speed at the height of 40 m for six high wind provinces, m/s.
QazvinRazavi
Khorasan
East
Azerbaijan
Sistan
Baluchestan
ArdabilSouth
Khorasan
January5.35.311.34.915.23.4
February5.96.58.15.76.14.6
March6.78.77.65.89.24.8
April6.412.48.66.36.45.0
May6.58.94.07.96.56.7
June8.48.14.510.54.47.7
July9.911.76.913.25.19.7
August9.710.35.411.04.49.0
September7.511.05.38.75.77.7
October5.98.74.86.37.66.0
November5.35.97.34.89.05.0
December5.14.910.14.912.04.7
Table 3. Average monthly electricity generated by one Vestas V47 turbine, kWh (Most of the installed turbines in the Iran are Vestas V47 660 KW turbines. See Appendix A, for detailed technical specifications and pricing of this turbine).
QazvinRazavi
Khorasan
East
Azerbaijan
Sistan
Baluchestan
ArdabilSouth
Khorasan
January17,07217,538169,52214,062407,1644611
February22,00529,63957,26019,71724,85610,629
March35,71675,60151,64223,16090,96012,670
April29,529216,77571,14627,58529,34013,726
May31,68482,854725257,62331,32735,433
June66,05359,88110,187132,512976552,239
July113,289188,67938,660266,26715,564106,974
August106,207128,52917,939155,427990985,191
September46,924148,56217,21173,95520,93951,595
October23,84377,31312,50729,24252,17424,771
November16,76322,70043,74312,14581,88313,803
December15,18513,725120,92314,018202,17711,944
Total524,2701,061,795617,992825,714976,058423,588
Table 4. Financial analysis of wind power for provinces with high wind potentials for a PPA of 20 years and a FiT of 3.5 cents per kWh.
QazvinRazavi
Khorasan
East
Azerbaijan
Sistan
Baluchestan
ArdabilSouth
Khorasan
Total
Estimated total demand (GWh)4675.8215,164.507958.685733.721854.551710.9937,098.26
Number of turbines needed to meet 5% of the estimated demand446714644347952022448
Farm capacity (MW)294.32471.30424.98229.1562.70133.301615.75
CapEx (million USD)343.77550.50496.39267.6573.24155.691887.25
OpEx (million USD)3.976.355.733.090.851.8021.78
Annual revenue (million USD)8.1826.5413.9310.033.252.9964.92
IRR−17.2%−4.8%−10.7%−7.5%−5.7%−15.4%−10.2%
NPV (million USD)−296.05−153.13−338.12−131.83−26.07−133.54−1078.74
Note: The IRR and NPV are based on a discount rate of 2% and an average annual growth rate of 3% for O&M costs. Power Purchase agreement (PPA) of 20 years is assumed. Capex is based on Vestas general info, the turbine that is mostly installed in Iran (Appendix A: 660 KW Vestas V47 Specifications). Opex is based on Iran Engineering and Construction Companies Association (http://ecca-opi.com/, accessed on 13 January 2021), which is miuscule in comparison to Capex.
Table 5. Financial analysis of wind power to meet 5% of total electricity demand in six provinces with high wind potentials for PPA of 20 years and different FiT scenarios.
Scenario 1
Fit = 3.5 Cents
per kWh
Scenario 2
Fit = 9 Cents
per kWh
Scenario 3
Fit = 12 Cents
per kWh
Scenario 4
Fit = 21.5 Cents
per kWh
Scenario 5
Fit = 53 Cents
per kWh
Annual revenue (million USD)64.92166.94222.59398.81983.10
IRR−10.2%1.4%5.5%15.9%46.0%
NPV (million USD)−1078.74910.631995.745431.9216,825.56
Note: The IRR and NPV are based on a discount rate of 2% and an average annual growth rate of 3% for O&M costs. Power Purchase agreement (PPA) of 20 years is assumed. These estimates are based on meeting 5% of the estiamted total demand, as shown in the last column of Table 4.
Table 6. Estimated cost of FiT and capital expenditures for the wind to meet 5% of Iran’s estimated total electricity demand.
FiT = 12 Cents per kWhFiT = 21.5 Cents per kWhFiT = 53 Cents per kWh
Estimated total electricity demand for Iran (TWh)250250250
5% of the estimated total electricity demand (TWh)12.512.512.5
Number of turbines needed to meet 5% of demand16,49716,49716,497
CapEx & OpEx (million USD)12,86512,86512,865
CapEx & OpEx as a percentage of a conservative figure of USD 70 billion fossil fuel subsidies (%)18%18%18%
Total cost of the FiT for the Government (million USD)150026886625
Cost of FiT as a percentage of a conservative figure of USD70 billion fossil fuel subsidies (%)2.14%3.84%9.46%
Table 7. Terms of power purchase agreements offered by SATBA.
PPA Terms
IssueTerm
Term20 years, the developer can sell the electricity produced to the open market.
Completion Due DateThere is a grace period between the signing of the contract and the actual generation of electricity. This period varies on the source of energy.
Payment CurrencyIranian rials
TaxationThe developer will be subject to Iranian corporate and VAT taxes but will receive tax credits for investing in less developed regions of Iran.
Land CostTo be covered by the developer.
Guarantee purchase tariff rates
Installed CapacityFeed-in-Tariff (cents per kWh)
Wind Farm50 MW and less3.5
1 MW and less4.75
Publisher’s Note: MDPI stays neutral with regard to jurisdictional claims in published maps and institutional affiliations.

