Article

Evaluation on Enhanced Heat Transfer Using Sonochemically Synthesized Stable Zno-Eg@Dw Nanofluids in Horizontal Calibrated Circular Flow Passage

by
Waqar Ahmed
1,2,*,
Zaira Zaman Chowdhury
3,*,
Salim Newaz Kazi
2,*,
Mohd. Rafie Bin Johan
3,
Irfan Anjum Badruddin
4,5,
Manzoore Elahi M Soudagar
2,
Sarfaraz Kamangar
5,
Muhammad Abbas Mujtaba
6,
Mustabshirha Gul
7 and
T.M. Yunus Khan
4,5
1
Institute of Advance Studies, University of Malaya, Kuala Lumpur 50603, Malaysia
2
Department of Mechanical Engineering, Faculty of Engineering, University of Malaya, Kuala Lumpur 50603, Malaysia
3
Nanotechnology & Catalysis Research Centre, University of Malaya, Kuala Lumpur 50603, Malaysia
4
Research Center for Advanced Materials Science (RCAMS), King Khalid University, Abha, Asir 61413, Saudi Arabia
5
Mechanical Engineering Department, College of Engineering, King Khalid University, Abha 61421, Saudi Arabia
6
Department of Mechanical, Mechatronics and Manufacturing Engineering, New Campus, University of Engineering and Technology, Lahore 54890, Pakistan
7
Department of Mechanical Engineering, Faculty of Engineering and Technology, Bahauddin Zakariya University, Multan 60000, Pakistan
*
Authors to whom correspondence should be addressed.
Energies 2021, 14(9), 2400; https://doi.org/10.3390/en14092400
Submission received: 5 October 2020 / Revised: 5 November 2020 / Accepted: 23 November 2020 / Published: 23 April 2021
(This article belongs to the Collection Advances in Heat Transfer Enhancement)

Abstract

:
In this research, Zinc Oxide-Ethylene @ glycol distilled water based nanofluid was synthesized using the sonochemical method. The convective heat transfer properties of as synthesized nanofluid were observed for a closed single circular tube pipe in turbulent flow regimes. The prepared nanofluids were characterized by ultra violet spectroscopy (UV–VIS), UV–VIS absorbance, X-Ray diffraction (XRD), Fourier transform infrared spectroscopy (FTIR), Transmission electron microscopy (TEM) and stability analysis. Five calibrated k-type thermocouples were mounted on the surface of the test section. Analytical data related to heat transfer properties of the synthesized nanofluid for the heat exchanger, incorporated with the closed circular tube test section were collected. The addition of ZnO solid nanoparticles in the EG@DW mixture enhanced the value of thermal conductivity and other thermophysical characteristics of the nanofluids. Maximum thermal conductivity was observed at 45 °C for using 0.1 wt.% of ZnO nanoparticles EG@DW nanofluid. Increasing the wt.% of ZnO solid nanoparticles in the EG@DW mixture had increased the thermal conductivity subsequently with change in temperature from 20 to 45 °C. Furthermore, Nusselt numbers of ZnO-EG@DW-based nanofluid was estimated for the various concentration of ZnO present in EG@DW-based fluid. The presence of ZnO solid nanoparticles into the EG@DW base fluid escalate the Nusselt (Nu) number by 49.5%, 40.79%, 37% and 23.06% for 0.1, 0.075, 0.05 and 0.025 wt.% concentrations, respectively, at room temperature. Varying wt.% of ZnO (0.1, 0.075, 0.05 and 0.025) nanoparticles had shown improved heat transfer (h) properties compared to the base fluid alone. The absolute average heat transfer of ZnO-EG@DW nanofluid using the highest concentration of 0.1 wt.% was improved compared to the EG@DW mixture. The magnitude of absolute average heat transfer was increased from 600 W/m2k for the EG@DW mixture to 1200 W/m2k for ZnO-EG@DW nanofluid. Similarly, the heat transfer improvement for the other three wt.% (0.075, 0.05 and 0.025) was noticed as 600–1160, 600–950 and 600–900 W/m2k, respectively, which is greater than base fluid.

1. Introduction

Energy crises are one of the most crucial issues for various engineering industries. Various technology-based applications like solar collectors, liquid to gas conversion, direct solar absorption, heat exchanger, geothermal extraction, energy conversions and cooling devices, etc. are suffering from these energy issues. It can decrease the overall efficiency of any system. To handle this technical problem efficiently, the application of conventional fluids might not be enough to recover the energy losses. However, dispersing the solid nanoparticles in the base fluids can effectively change the thermos physical properties of the nanofluids and could lead to enhanced energy recovery of the system. The new generation of conducting fluids with homogeneously dispersed solid nanoparticles in base fluids are called nanofluids [1]. The variations in thermos physical characteristics exhibited by nanoparticles incorporated base fluid are sometimes fairly outstanding and are much better than the base fluid alone [2,3]. It was observed that the addition of solid nanoparticles in the base liquid with varying weight percentages from 0.1% to 5% can change several thermophysical characteristics of nanofluids including density, specific heat, viscosity and thermal conductivity [4,5]. These nanofluids are mainly used in heat convection applications—specifically in the thermal and solar thermal fields [6,7,8].
Nanofluids are suspensions of solid nanoparticles (<100 nm size) in base fluid (like Ethylene Glycol (EG), Poly ethylene Glycol (PEGs), water, diathermic oil, transformer oil, paraffin oil, etc.). Nanofluids can be contemplated as an upcoming era of heat-exchanging fluids. In addition, their heat-transference characteristics are innovative than other base liquids, where they showed astonishing performance for application in microelectronics, lubricants, transportation, refrigeration, high voltage appliances, etc. [9,10]. Earlier literature revealed that substantially higher heat transfer properties and thermal conductivity of the system can be achieved using uniform nanoparticle concentrations lesser than 5 wt.% [11]. The addition of metals or metal oxide into the conventional base liquid can improve the thermal properties of the conventional base fluids, i.e., Brownian motion, fluid atoms layering and the heat transfer (h) properties of nanofluids [12]. The application of heat exchangers in several industrial processes is challenging and complicated as it needs to show improved performances with effective output. Different methods were applied in the past studies to increase the heat exchanging performances like unadulterated fluid forced heat convection and strained out surfaces to raise the heat exchange [13,14].
Metals or metal oxides are generally used as thermal carriers in many base liquids, due to their optimum characteristics like higher thermal conductivity, viscosity, density and outstanding compatibility with conventional fluids with high charge performance ratios [15,16]. ZnO, Al2O3, CuO and TiO2 are the best choices among the metal oxides nanoparticle for improvement of the heat transfer. Thus, nanofluids prepared by these metal oxides have been extensively used for convective heat transfer applications. Maria et al. [17] executed studies on density, thermal conductivity and viscosities of EG-based Al2O3 nanofluids and has observed a substantial improvement in thermal conductivity around 19%. Vasheghani et al. [18] used a hot-wire technique to estimate the thermal conductivities of nanofluid. At 3 wt.% concentration of TiO2 nanofluid in engine oil, they observed a supreme development of 57% in heat transfer. Yu et al. [19] investigated the viscosities and thermal conductivities of ZnO-EG nanofluids. The researcher reported that the thermal conductivity of ZnO-EG base nanofluids is dependent on solid nanoparticle concentrations. With the increment in concentration of certain nanoparticles, the thermal conductivity also increases nonlinearly [3,20].
Compared to natural heat convection, the forced heat convection evolves a greater heat transfer coefficient. Several research works were carried out to examine the forced heat convection characteristics of different nanofluids. Sun et al. [21] experimentally considered the flow and heat transfer characteristics of Cu-water, Al-water, Al2O3-water and Fe2O3-water nanofluids in a built-in twisted belt outside thread tube. They observed that Cu-water nanofluids displayed better heat transfer properties [22,23]. The results confirmed that the heat transfer percentage of varying nanofluids is generally reliant on the size of the nanoparticles, different states of the particles, thermophysical characteristics of base liquids and shape of the solid particles. [24,25]. Das et al. [26] observed that the study of aluminum oxide nanofluids confirmed an agreement with the previous model developed by Crosser and Hamilton to evaluate the convective heat transfers.
In contrast, experimental data of copper oxide-based nanofluids illustrated lower improvement. Different researches have been conducted previously on the dispersion and stability of solid particles in conventional base fluids for enhancement of convective heat transfer. However, it is noticeable that the bigger solid nanoparticle size led to sedimentation, settling, clogging and erosion, which lowered the materials’ thermal conductivity and heat transfer ratio [27,28]. To resolve such issues, the researchers focused on different nanofluids for enhanced thermal conductivities [29]. Over time, the rapid advancement in nanomaterials technology led to the development of effective nanofluids that substituted the traditional fluids with less effective convective heat transfer [30,31]. Furthermore, the ethylene glycol (EG) or polyethylene glycol-water (PEG)-based nanofluids have been used for heat transfer (h) studies and other thermal performances, where it showed improved results [32,33,34].
The core intention of this exploration was to prepare well-stable ZnO-EG@DW nanofluids with different wt.% (0.1, 0.075, 0.05 and 0.025) of ZnO solid nanoparticles in the EG@DW mixture as a base liquid for the active transport of convective heat transfer in a single-tube closed flow passage. The ZnO nanoparticles were synthesized using the facile one-pot sonochemical method. Different characterizations have been conducted to confirm the proper synthesis of ZnO solid particles. The ZnO-EG@DW-based nanofluids were prepared using a mixture of EG@DW 50:50 with the addition of ZnO solid nanoparticles. Finally, the investigation was carried out to analyze the improvement in local Nusselt (Nu) numbers, average Nusselt (Nu) numbers, average heat transfer and local heat transfer at different points across the closed circular test section in the turbulent flow regimes. The EG@DW blend with the addition of sonochemically synthesized ZnO nanoparticles can enhance the thermal conductivity, compared to conventional EG@DW with negligible sedimentation.

2. Materials and Methodology

The sodium hydroxide (NaOH), Zinc acetate dihydrate (Zn(CH3COO)2H2O) and ethylene glycol grade AR-M/Wt 62.07 g-mol as raw materials were procured from Sigma Aldrich, USA, for the synthesis of ZnO-EG@DW nanofluids. All the entire materials used in the stated investigation were of analytical grade and the EG@DW mixture was used as a base fluid throughout the experiment.

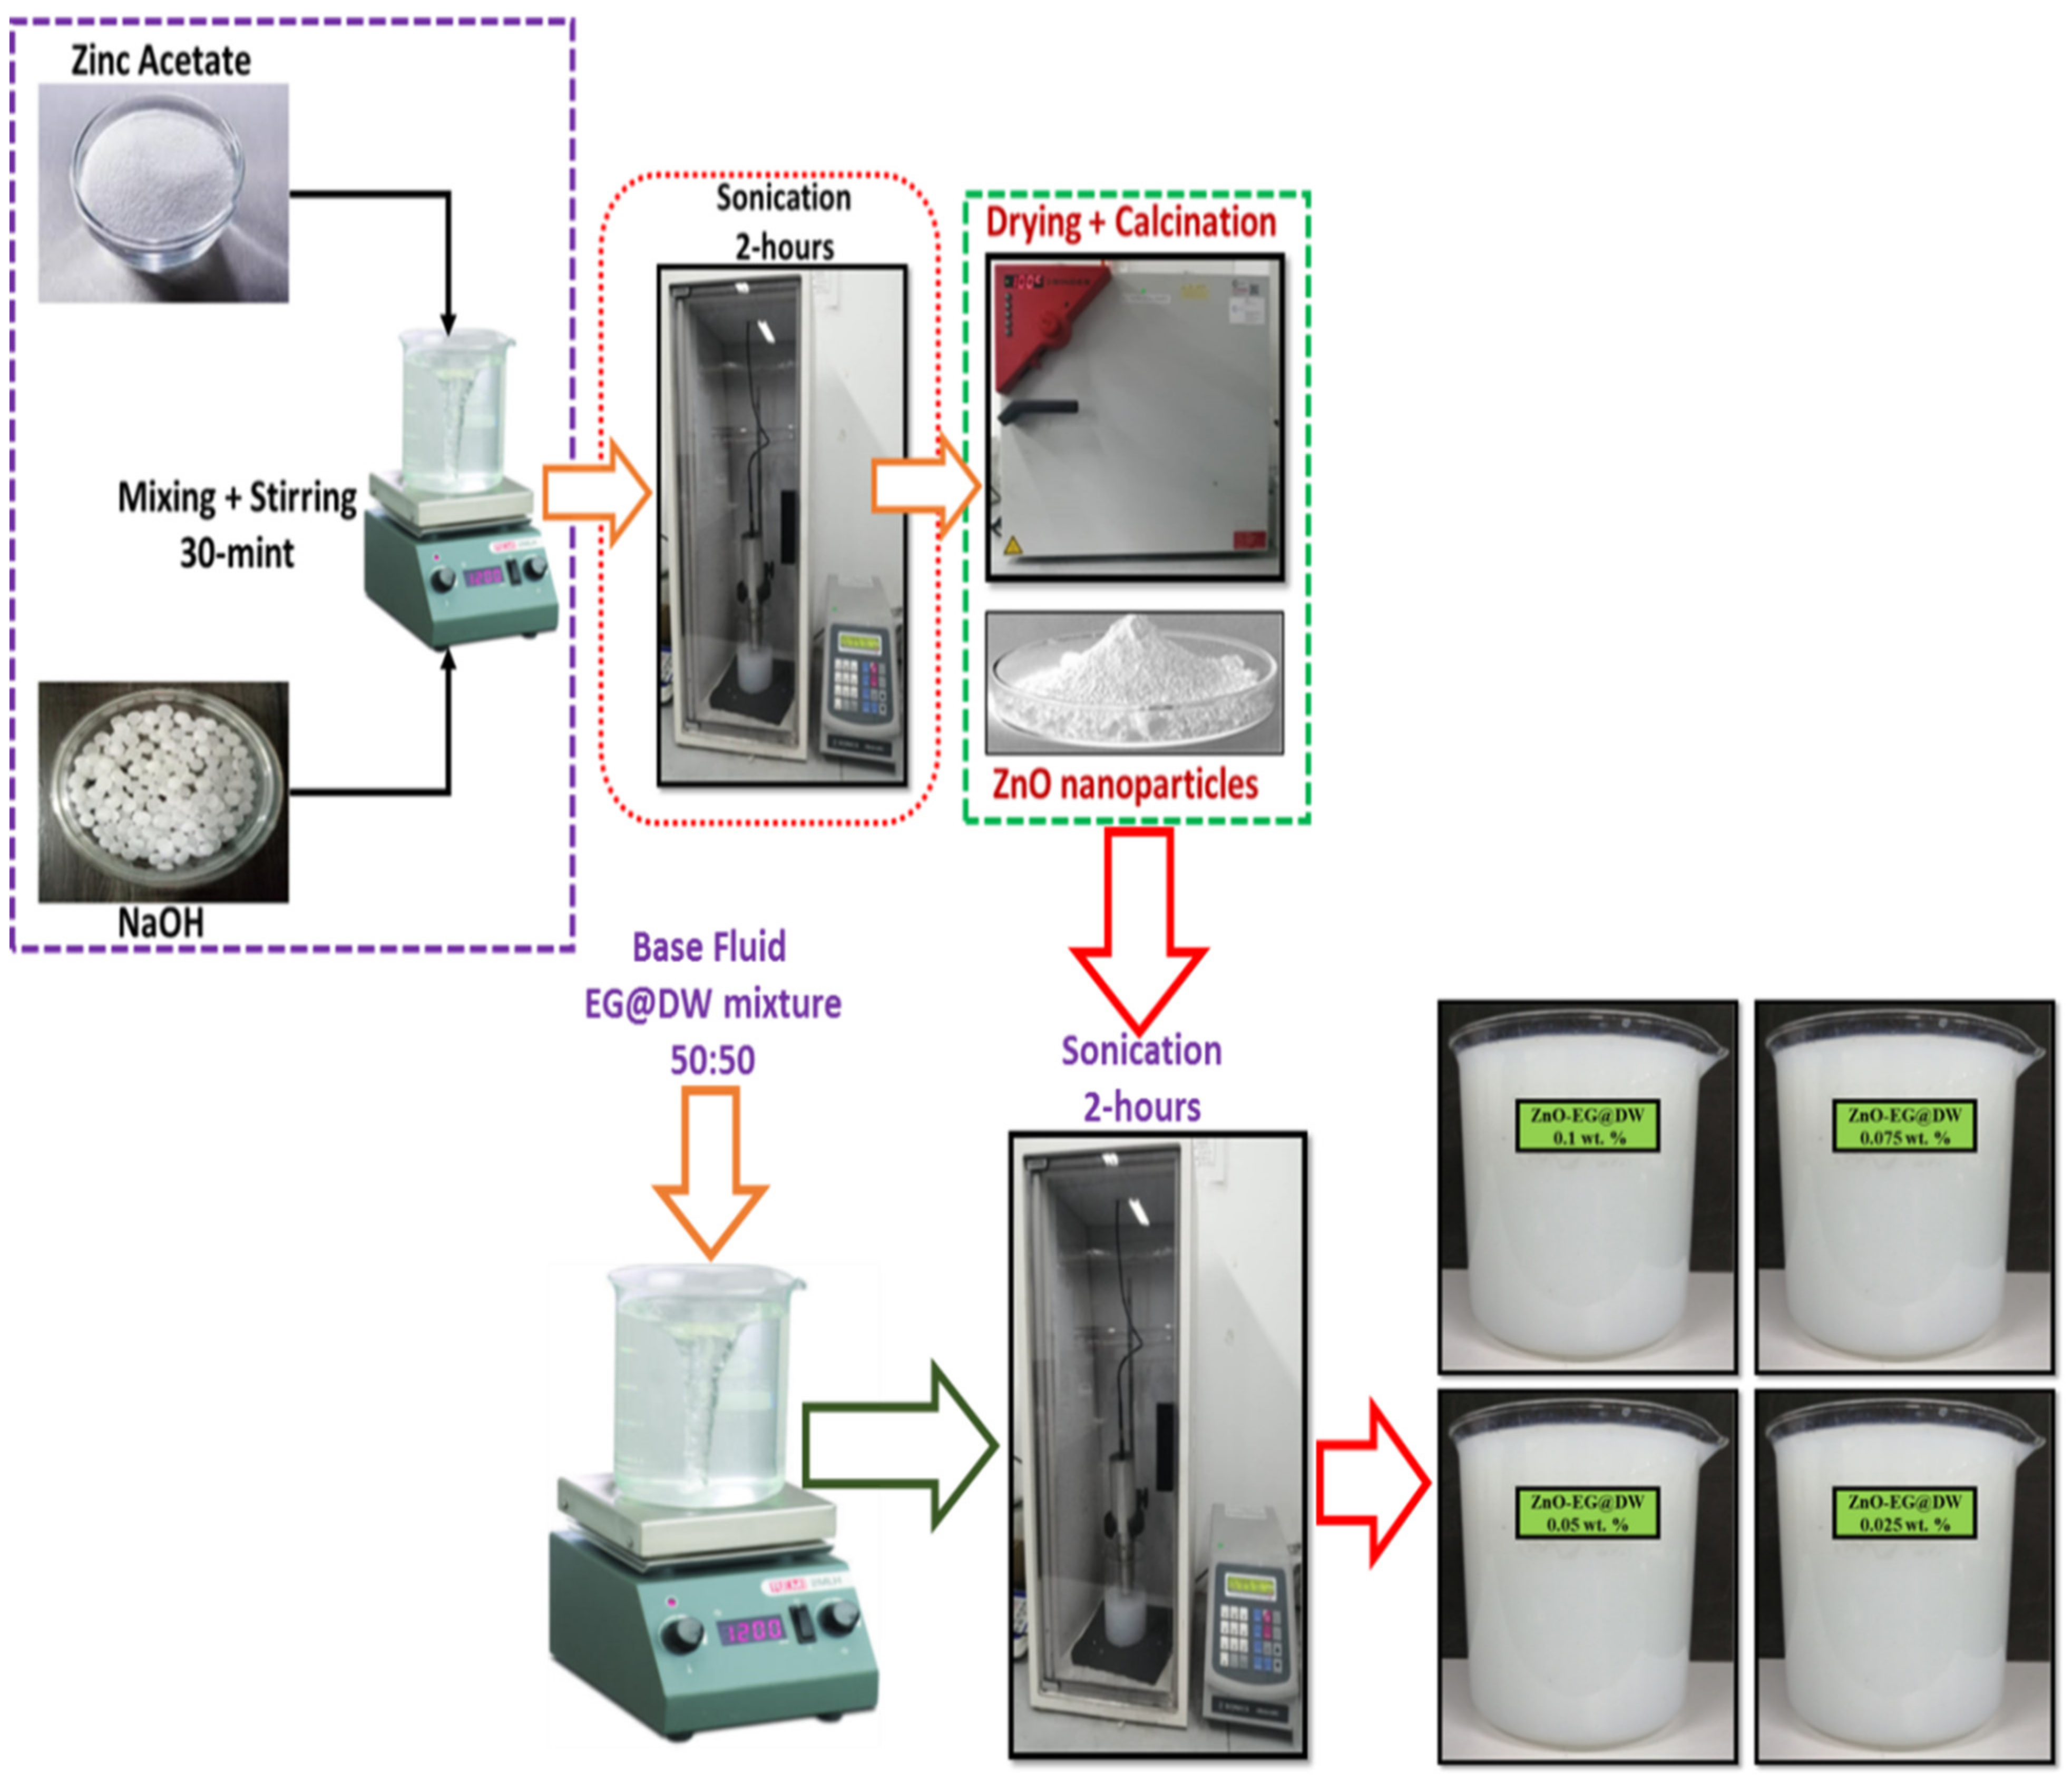
2.1. ZnO Synthesis Procedure

Single-pot sonochemical procedures were followed to synthesis the ZnO solid nanoparticles. A single line flow to synthesize the ZnO solid nanoparticles is shown in Figure 1. In this synthesis technique, zinc acetate as a precursor was dissolved in 100 mL DW and EG blend with (50:50) ratio according to (2:1) M and stirred continuously for 10 min using a magnetic stirrer. Further, the sodium hydroxide was dissolved in the 100 mL EG and DW solution with (50:50) wt.% ratio and stirred continuously for 15 min using a magnetic stirrer. In the next step, the sodium hydroxide mixture was added dropwise slowly into zinc acetate mixture under high probe sonication. The setting of probe sonicator is necessary before starting the synthesis; for this purpose, the sonicator power was retained at 750 W, the pulse amplitude is 80% with 3 and 2 s on/off mode and the total delivered energy was 360,000 J and 220 V of input alternating current and voltage, respectively. During the mixing of sodium hydroxide mixture in aqueous zinc acetate mixture, the white precipitate was formed. After some time, these precipitates transform into thicker precipitate. The bulk mixture was highly sonicated for 2 h continuously without using coolant. The white precipitates were washed by DW water four times using a centrifuge at 6000 rpm and finally washed with ethanol. The precipitate was dried overnight in an oven at 80 °C. For more crystal and distinct morphology of the ZnO solid nanoparticles, the mixture was required to calcined at least for 3 h continuously at a temperature of 200 °C [35,36,37,38,39].

2.2. Two-Step Synthesis of ZnO-EG@DW Nanofluids

Figure 1 shows a two-step synthesis technique of the ZnO-EG@DW nanofluids using Probe sonicator. In the first step, the ZnO solid particles were produced by one-pot sonochemical procedure; in the second step, the sonochemically synthesized solid ZnO nanoparticles were dispersed in EG@DW mixture using probe sonication. The sonicator specifications were adjusted according to (20-kHz frequency, Input AC volt 220 V, Pulse-amplitude 80%, Energy 36,000 J) and pulse rate was maintained at 3 s/2 s on and off respectively and Probe Max Power 750 W. The sonicator parameters (power/time) were adjusted for ZnO-DW@EG nanofluids at 0.1 wt.%. ZnO-EG@DW nanofluids at 0.1, 0.075, 0.05 and 0.025 wt.% were sonicated with a selection of 70% pulse amplitude until 3 h of each wt.%. All these wt.% concentrations of ZnO-EG@DW-based nanofluids were primed according to data deliberated in Table 1 accordingly. For each concentration, the remaining base fluid mixture of EG@DW was taken at least 7 L. Uniform and homogeneous dispersion of ZnO solid nanoparticles in EG@DW were investigated at various nanoparticles wt.%, varied dimensions and time of sonication. It was observed using similar nanofluids with similar wt.% at different sonication times provides changed dispersion and stability in the EG@DW. Further, 0.2 mg of zinc oxide was mixed in 30 mL EG@DW and was sonicated for 30, 60, 90 and 120 min, then the stability and dispersion at each of the concentrations were evaluated.

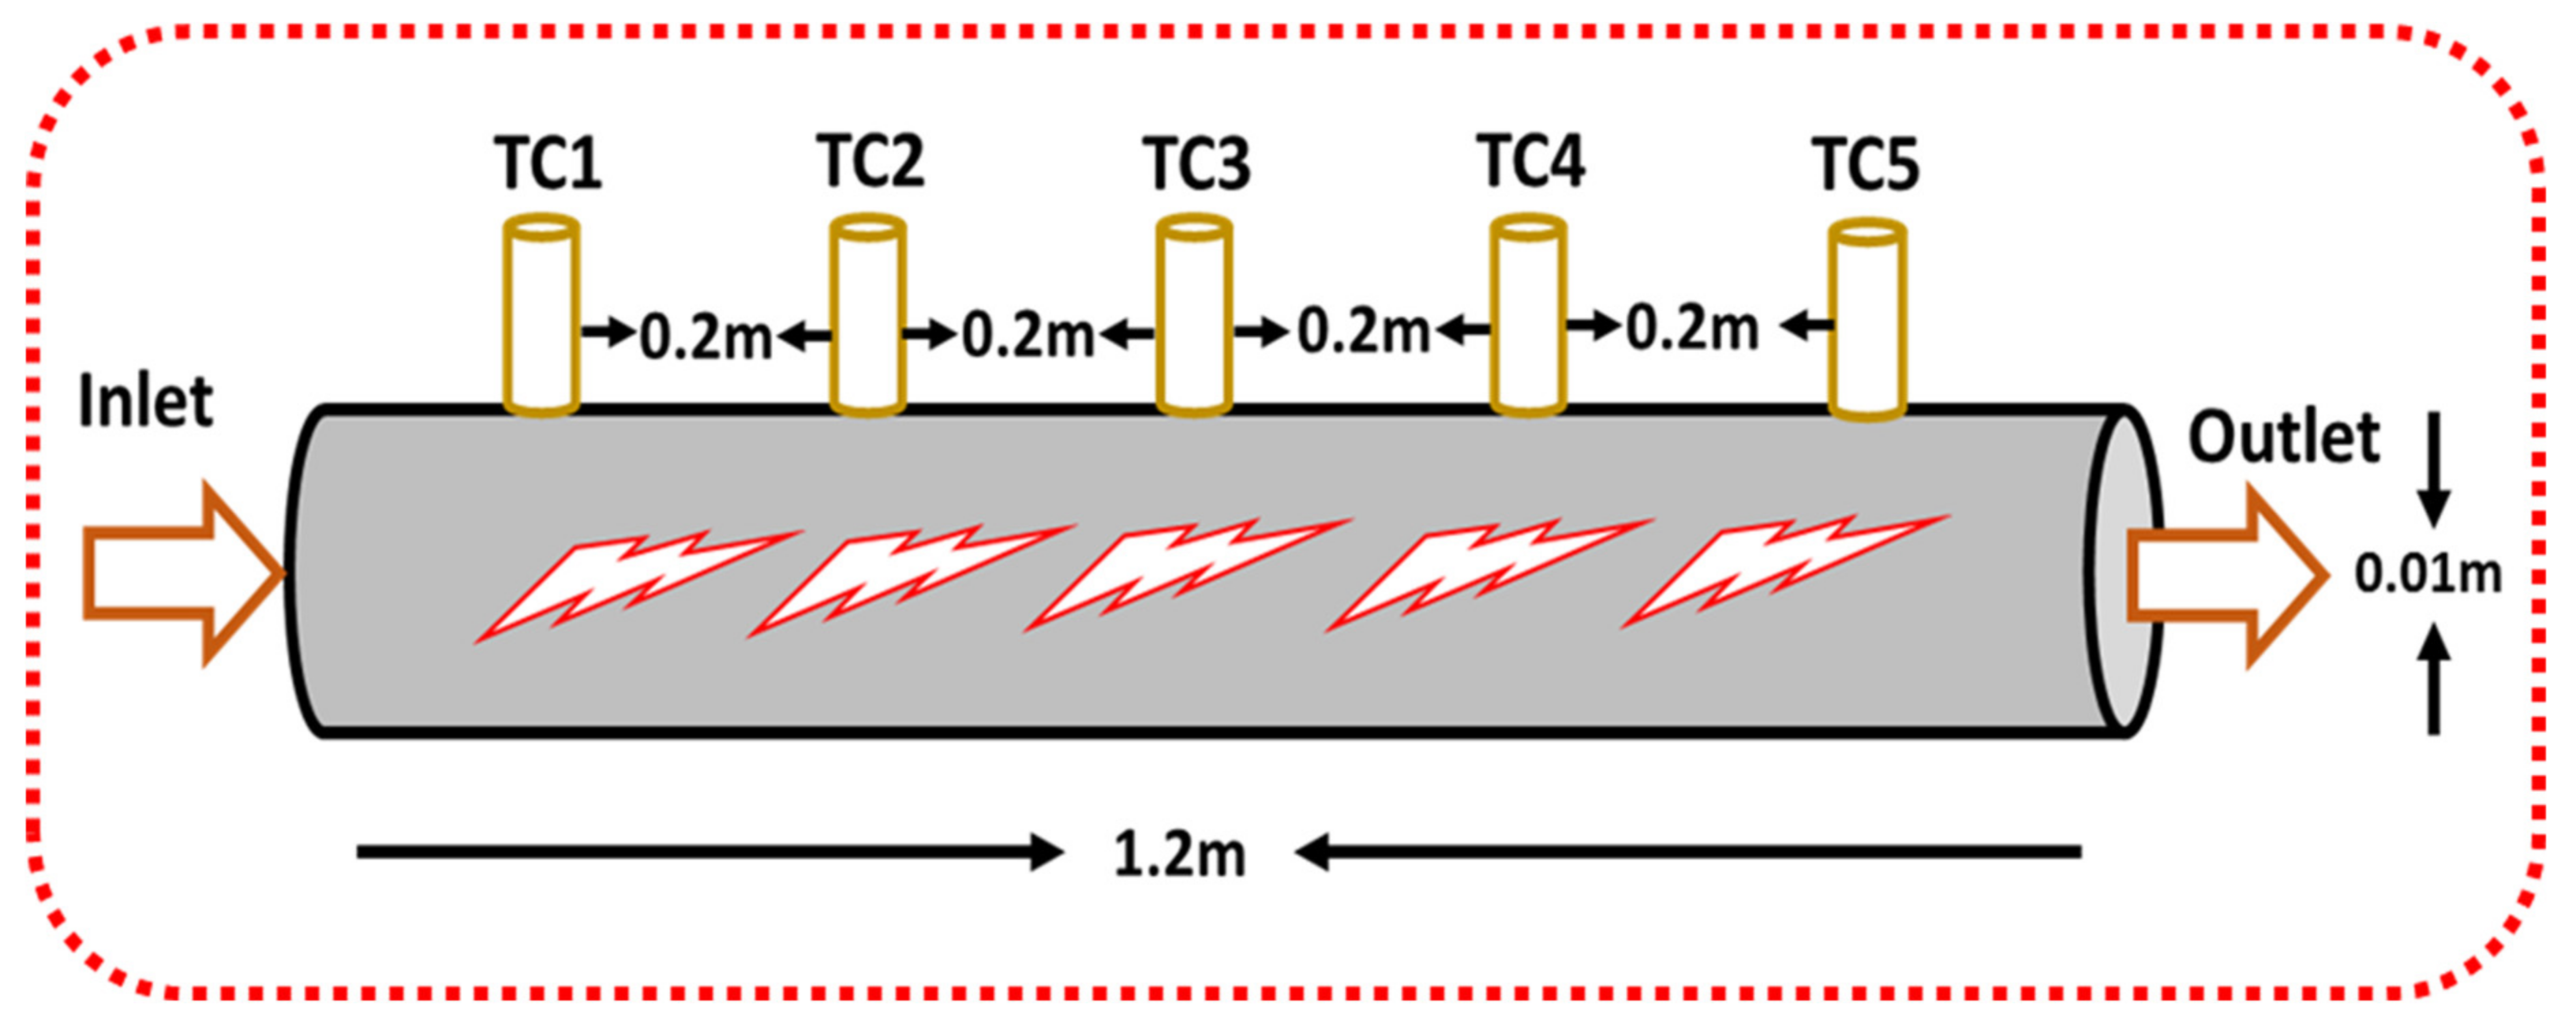
2.3. The Geometry of the Test Section

A circular closed single tube aluminum pipe of 1.2 m length and 0.01 m diameter was used as a heat exchanger for heat transfer studies. Five k-type highly sensitive thermocouples were mounted at a depth of 1 mm on the periphery at an equal distance (0.2 m) from the entry point. The 2-D geometric view of a single tube closed annular heat exchanger is shown in Figure 2. Two additional highly sensitive thermocouples were attached at the inlet/outlet locations of a single tube closed circular heat exchanger shown in Figure 3 to see the difference in temperatures.

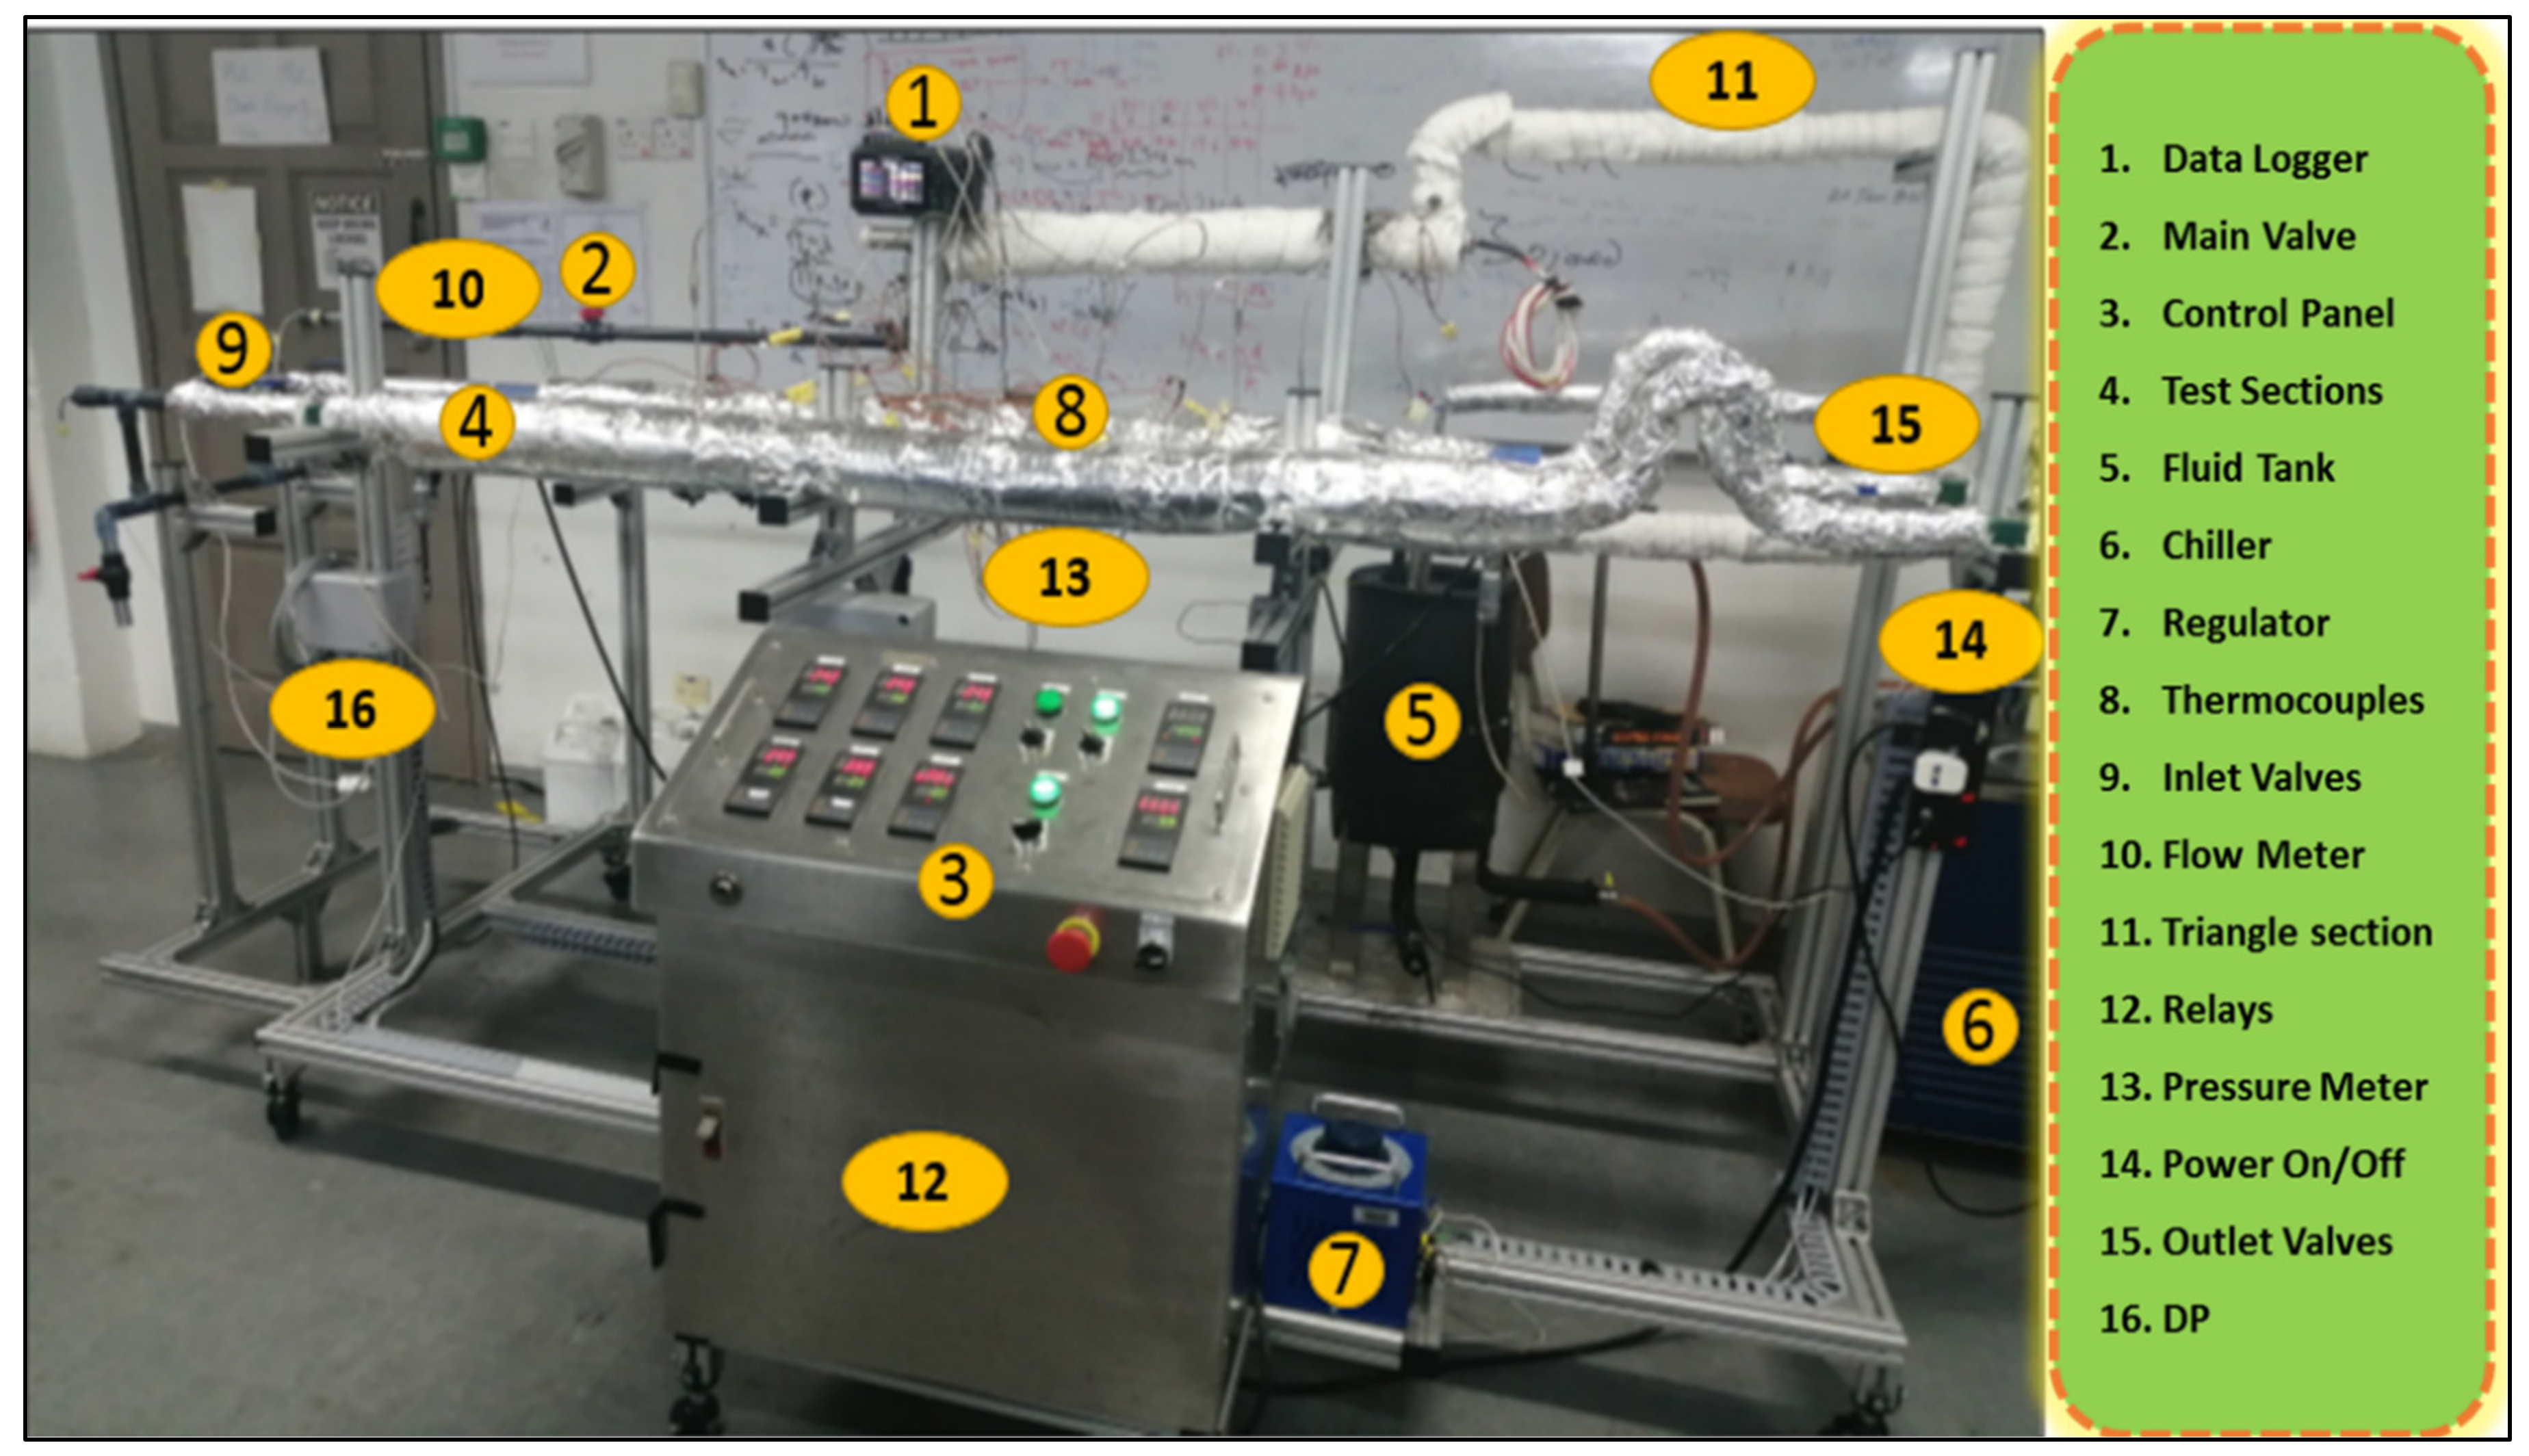
2.4. Experimental Setup

The heat transfer and hydrodynamic characteristics of ZnO-EG@DW nanofluid flowing through a single tube heat exchanger were investigated on an experimental test rig, as presented in Figure 3. The given experimental setup just consists of a control panel, voltage regulator, electrical heater, inlet and outlet valves, main valves, flow meter, pressure meter, fluid pump, fluid tank, chiller, frequency control meter and digital data logger. Preceding to run the sample, the thermocouples on the test section were calibrated by applying the Wilson plot [38]. Here, the thermal convection and hydrodynamic characteristics of ZnO-DW@EG-based nanofluid were inspected by calculating the Nusselt (Nu) values, pressure drop-in (Pa/m), the friction factor (f), local heat transfer and average heat transfer. Different flow rates, i.e., 2.5, 3, 4, 5, 6, 7, 8 and 9 L/min and constant heat flux were considered to study heat transfer improvement. As per Newton’s law of cooling, for both outlet and inlet temperatures and their differences, the nanofluids temperature and varying surface temperatures were considered to evaluate the heat transfer coefficients.

3. Characterizations of Sonochemically Synthesized ZnO Nanoparticles

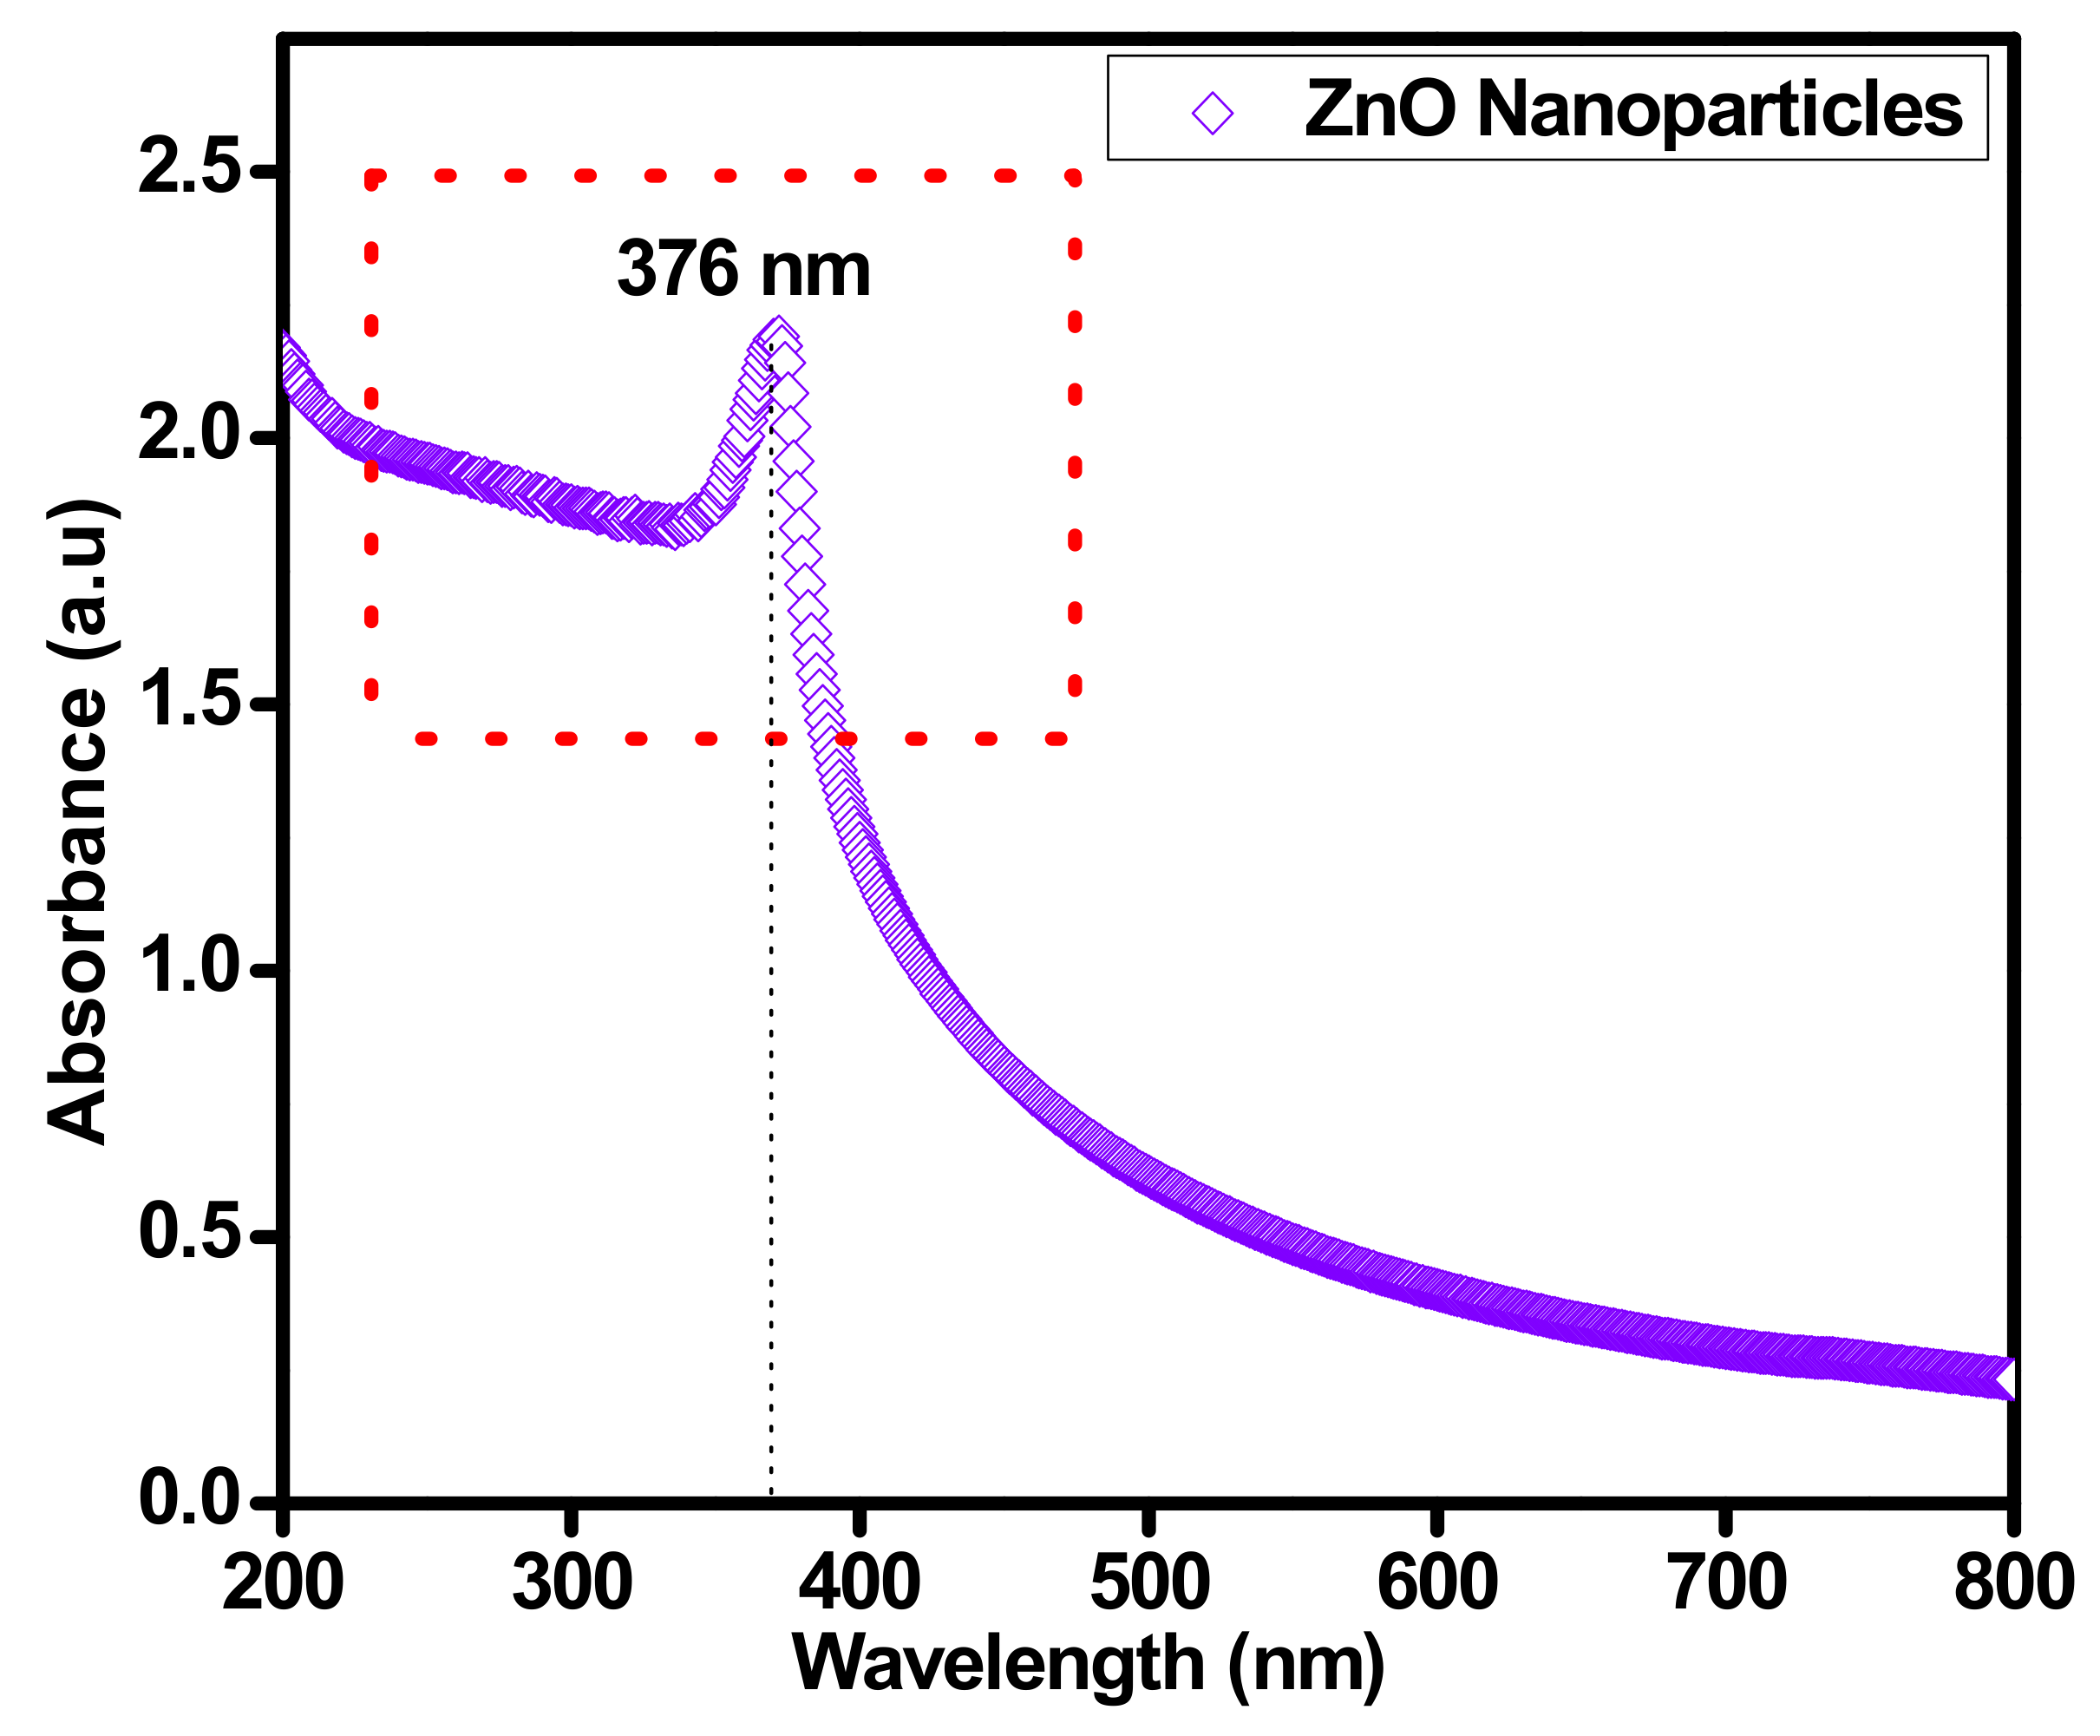
3.1. UV–VIS Spectrum

UV–VIS spectrum analysis spectroscopy was performed to understand the optical characteristics of sonochemically synthesized ZnO nanoparticles. The optical absorption spectrum was restrained using a UV–VIS NIR spectrophotometer (SHIMADZU-1800, Energy-240-volt, SOFT, Fisher scientific Sdn Bhd Malaysia) with diffuse reflectance mode with ZnO powder dispersed in a base fluid by 0.025 wt.%. The UV–VIS spectroscopy technique was used to confirm the proper synthesis of ZnO nanoparticles. The highlighted peak at 376 nm in Figure 4 stipulates the influential absorption energy band of ZnO nanoparticles, which is dependent on the blue shift of ZnO solid particles in the majority. The prominent peak at 376 nm is the identification of ZnO material. The increase in absorbance peak from 300 to 800 nm is dependent on the content of ZnO in the base fluid. As the ZnO nanoparticles increased in the base fluid, the absorbance increased accordingly. The maximum absorption significance amplified its energy gap from 3.37 to 3.6 eV. This improvement in the energy gap is significantly valuable in the existence of sunlight.

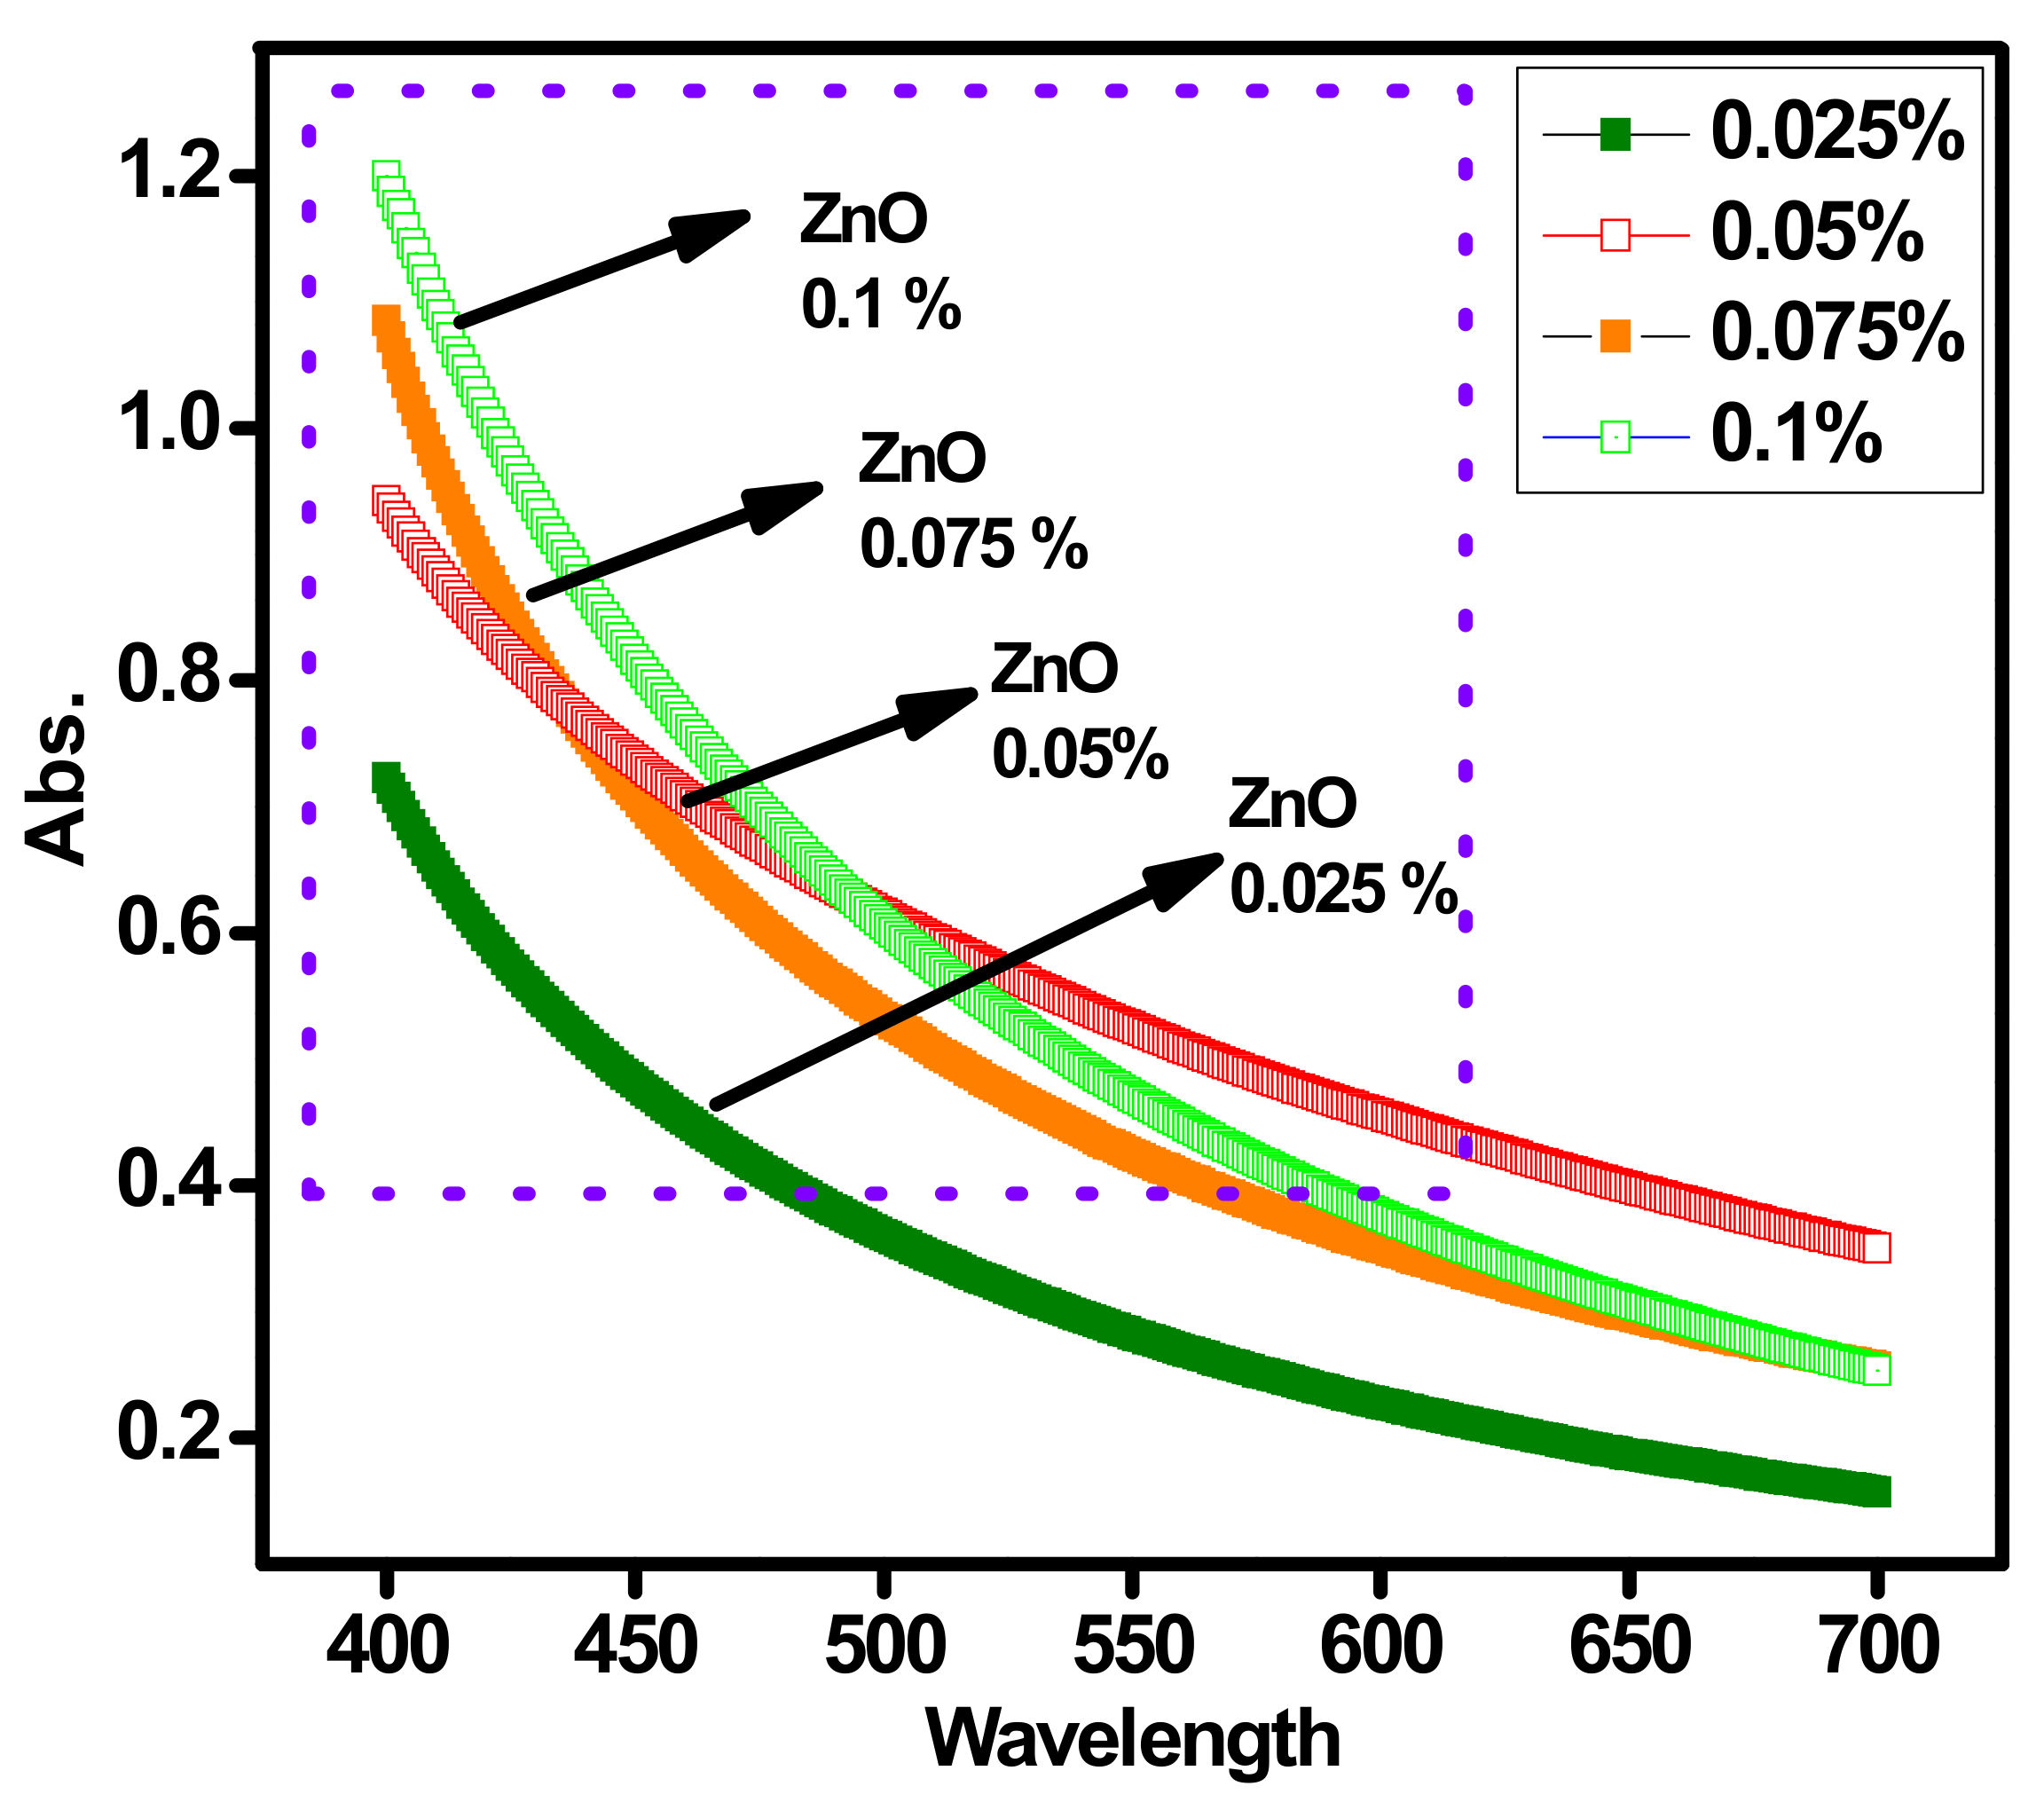
3.2. UV–VIS Absorption of Different Concentrations

Figure 5 represents the absorption band behavior of ZnO-DW@EG nanofluids having different (0.1, 0.075, 0.05 and 0.025) wt.%. A typical single-pot sonochemical process was used to produce the ZnO solid nanoparticles. The subsequent peak at 376 nm for different concentrations validate the presence of ZnO nanoparticles. Further to check the absorbance level, the same UV–VIS spectroscopy analysis was conducted for all wt.% concentrations of the ZnO-EG@DW-based nanofluids. During the analysis, it has observed that the absorbance increases with an increase in ZnO nanoparticles in the base fluid. As can be seen in Figure 5, the increase in wt.% of ZnO in the base fluid increases the absorption band level optical light passing through the nanofluids. The maximum presence of ZnO nanoparticles causes to increase in the viscosity of nanofluids, which may lead to more increased light absorption.

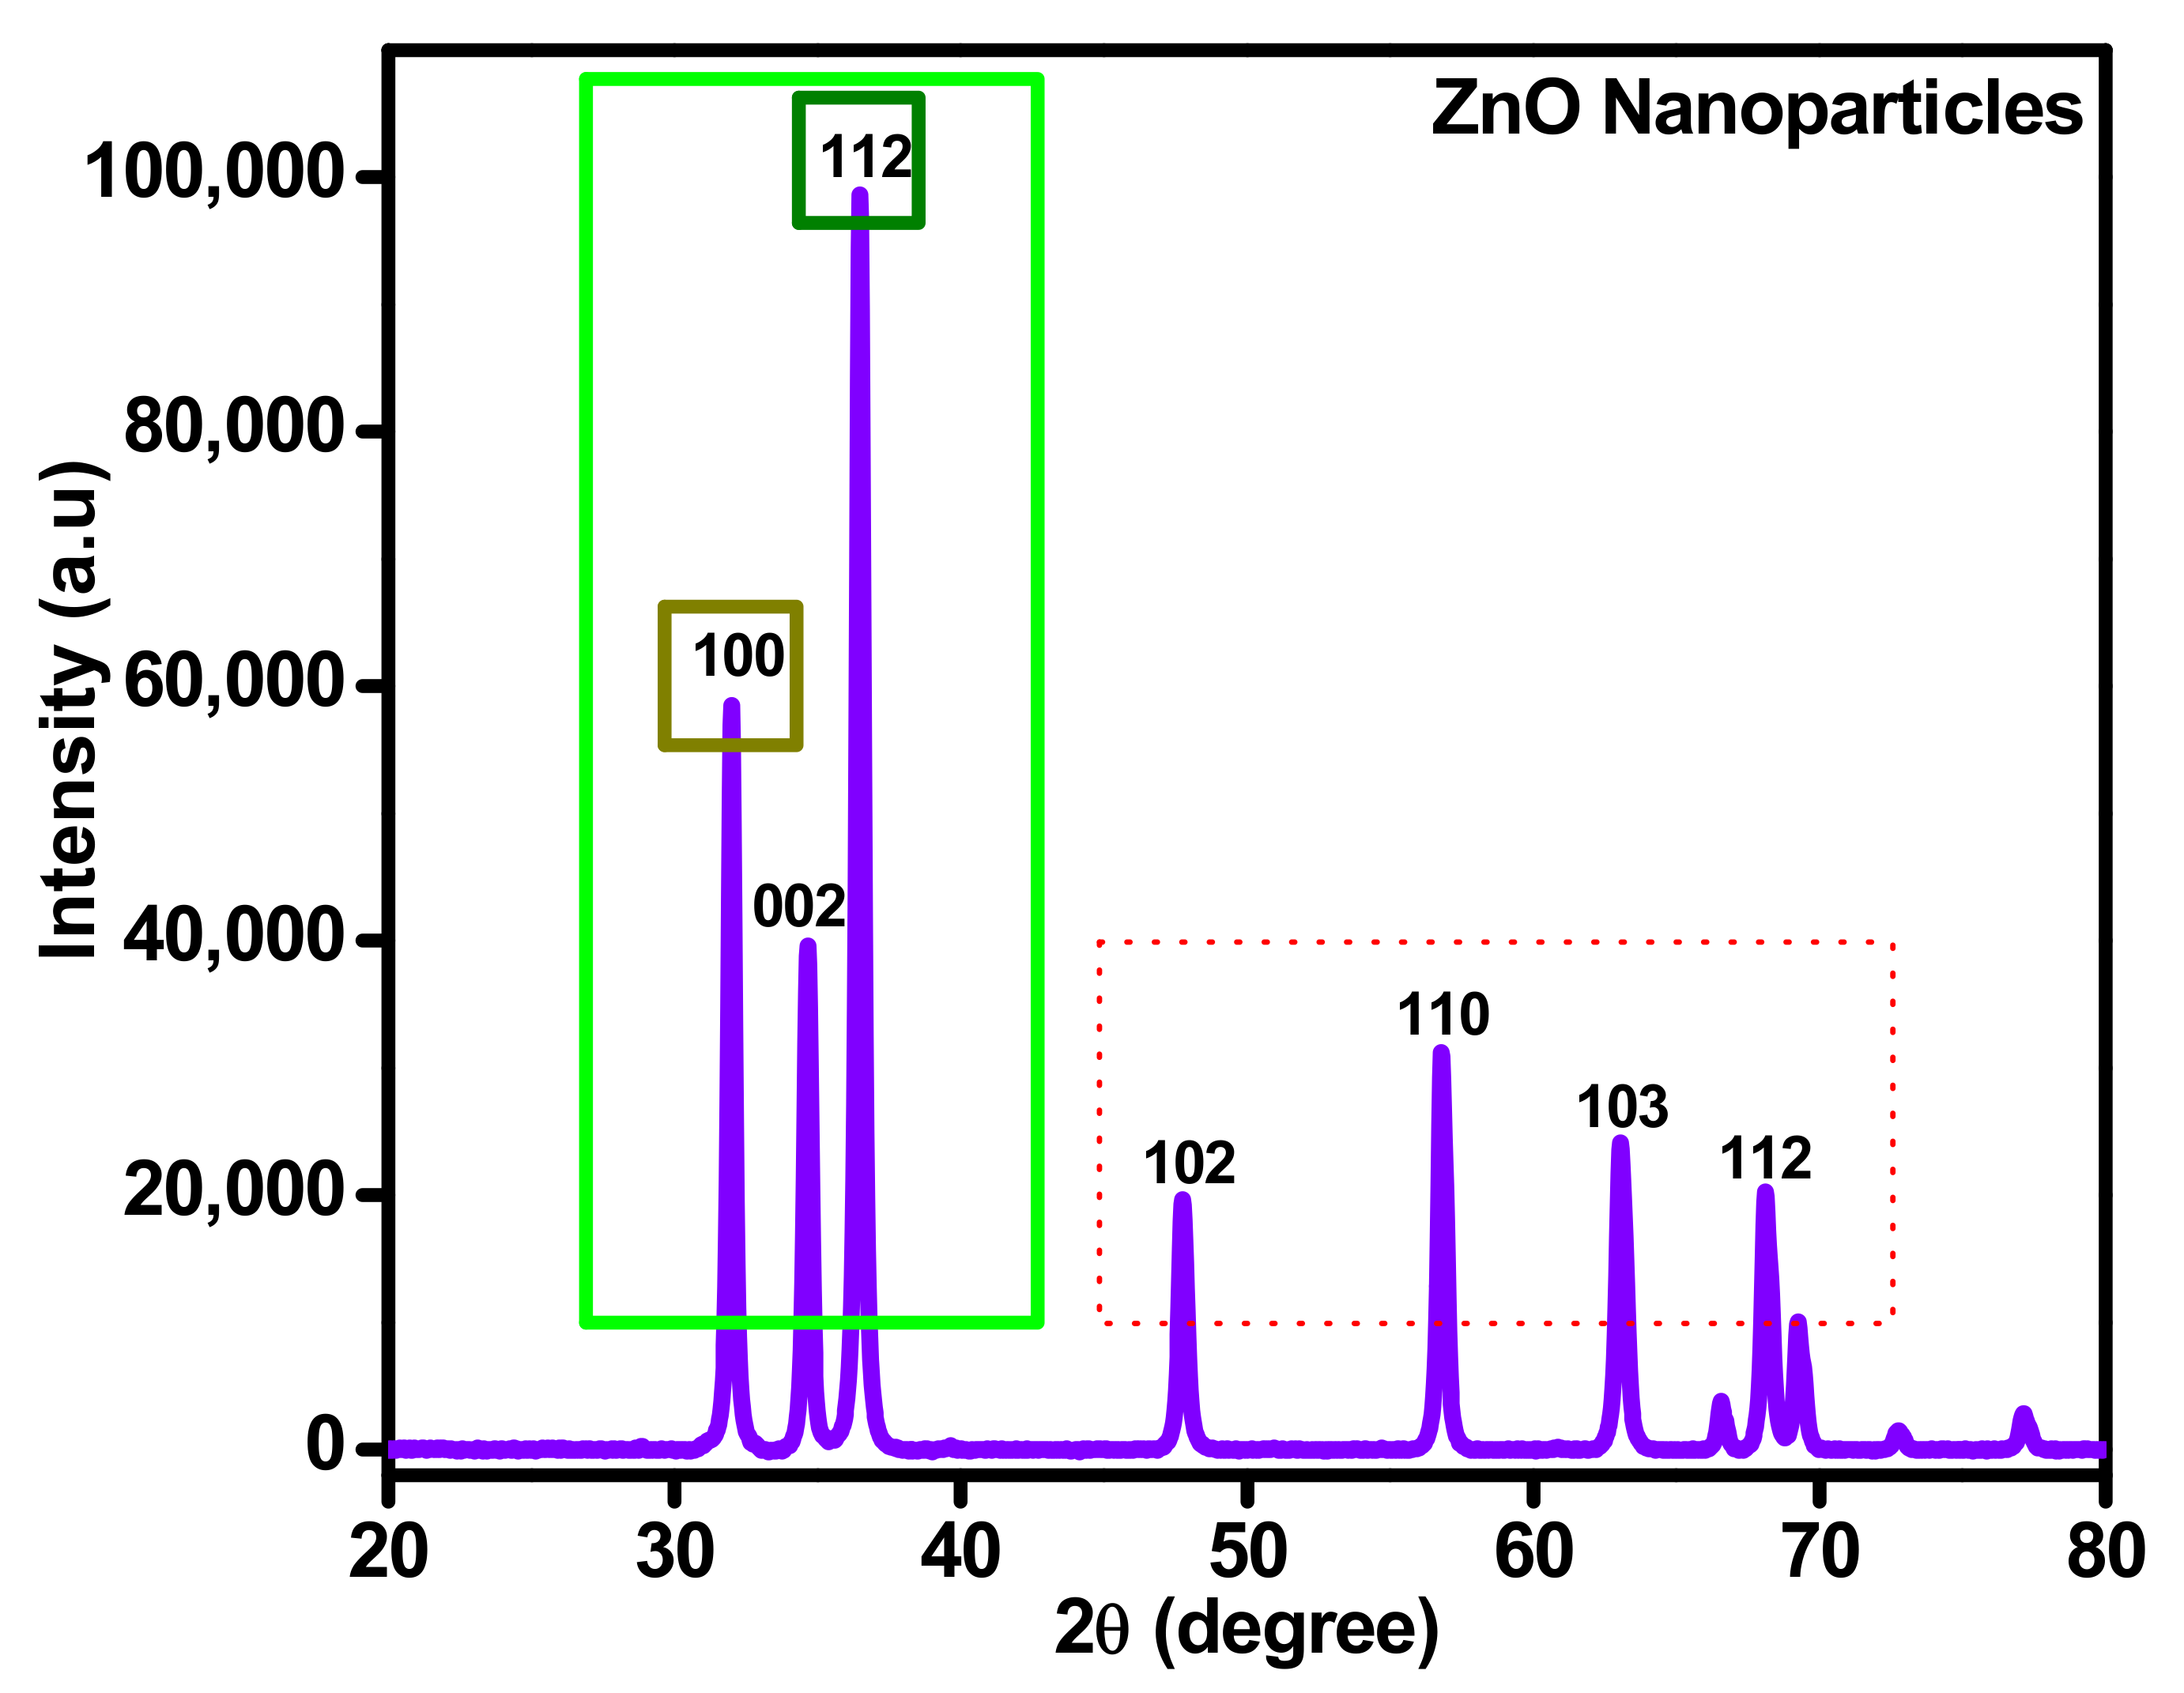
3.3. X-ray Diffraction (XRD) Analysis of ZnO Nanoparticles

Generally, ZnO solid nanoparticles produced using sonochemical synthesis procedure were inclined to an amorphous state. X-ray diffraction of ZnO powder ensured the existence of phase transition and its different effects on phase transition of zinc oxide nanoparticles. That analysis was conducted using Advanced level diffractometer (Malvern Panalytical-D8/0000000011092674) Makmal Sinaran-X,301, Aras 1, Bangunan Utama (J22), Jabatan Geologi) associated with a very sensitive detector (Lynx Eye position and Cu electrode). The deflection patterns were obtained in the condition of 5–95° 2θ sectors, 0.01° per step size, each stepper second and 0.3° deviation slit and 2.5° second Soller slit was used. Under similar conditions, to find the fundamental parameters, the XRD patterns were obtained for standard specimens and original specimens (LaB6, NIST, SRM, Gaithersburg, MD, USA).
In Figure 6, X-ray diffraction (XRD) study for ZnO solid nanoparticles are exposed, where the results present the appropriate materialization of ZnO and its crystallite index. The prominent peaks define the behavior of zinc oxide and its quartz level. Through ZnO preparation, the crystalline index and morphology of nanoparticles are dependent on synthesis procedure, calcination time and temperature. Calcining on low temperatures leads to formless particle size and high temperatures lead to crystalline particles.

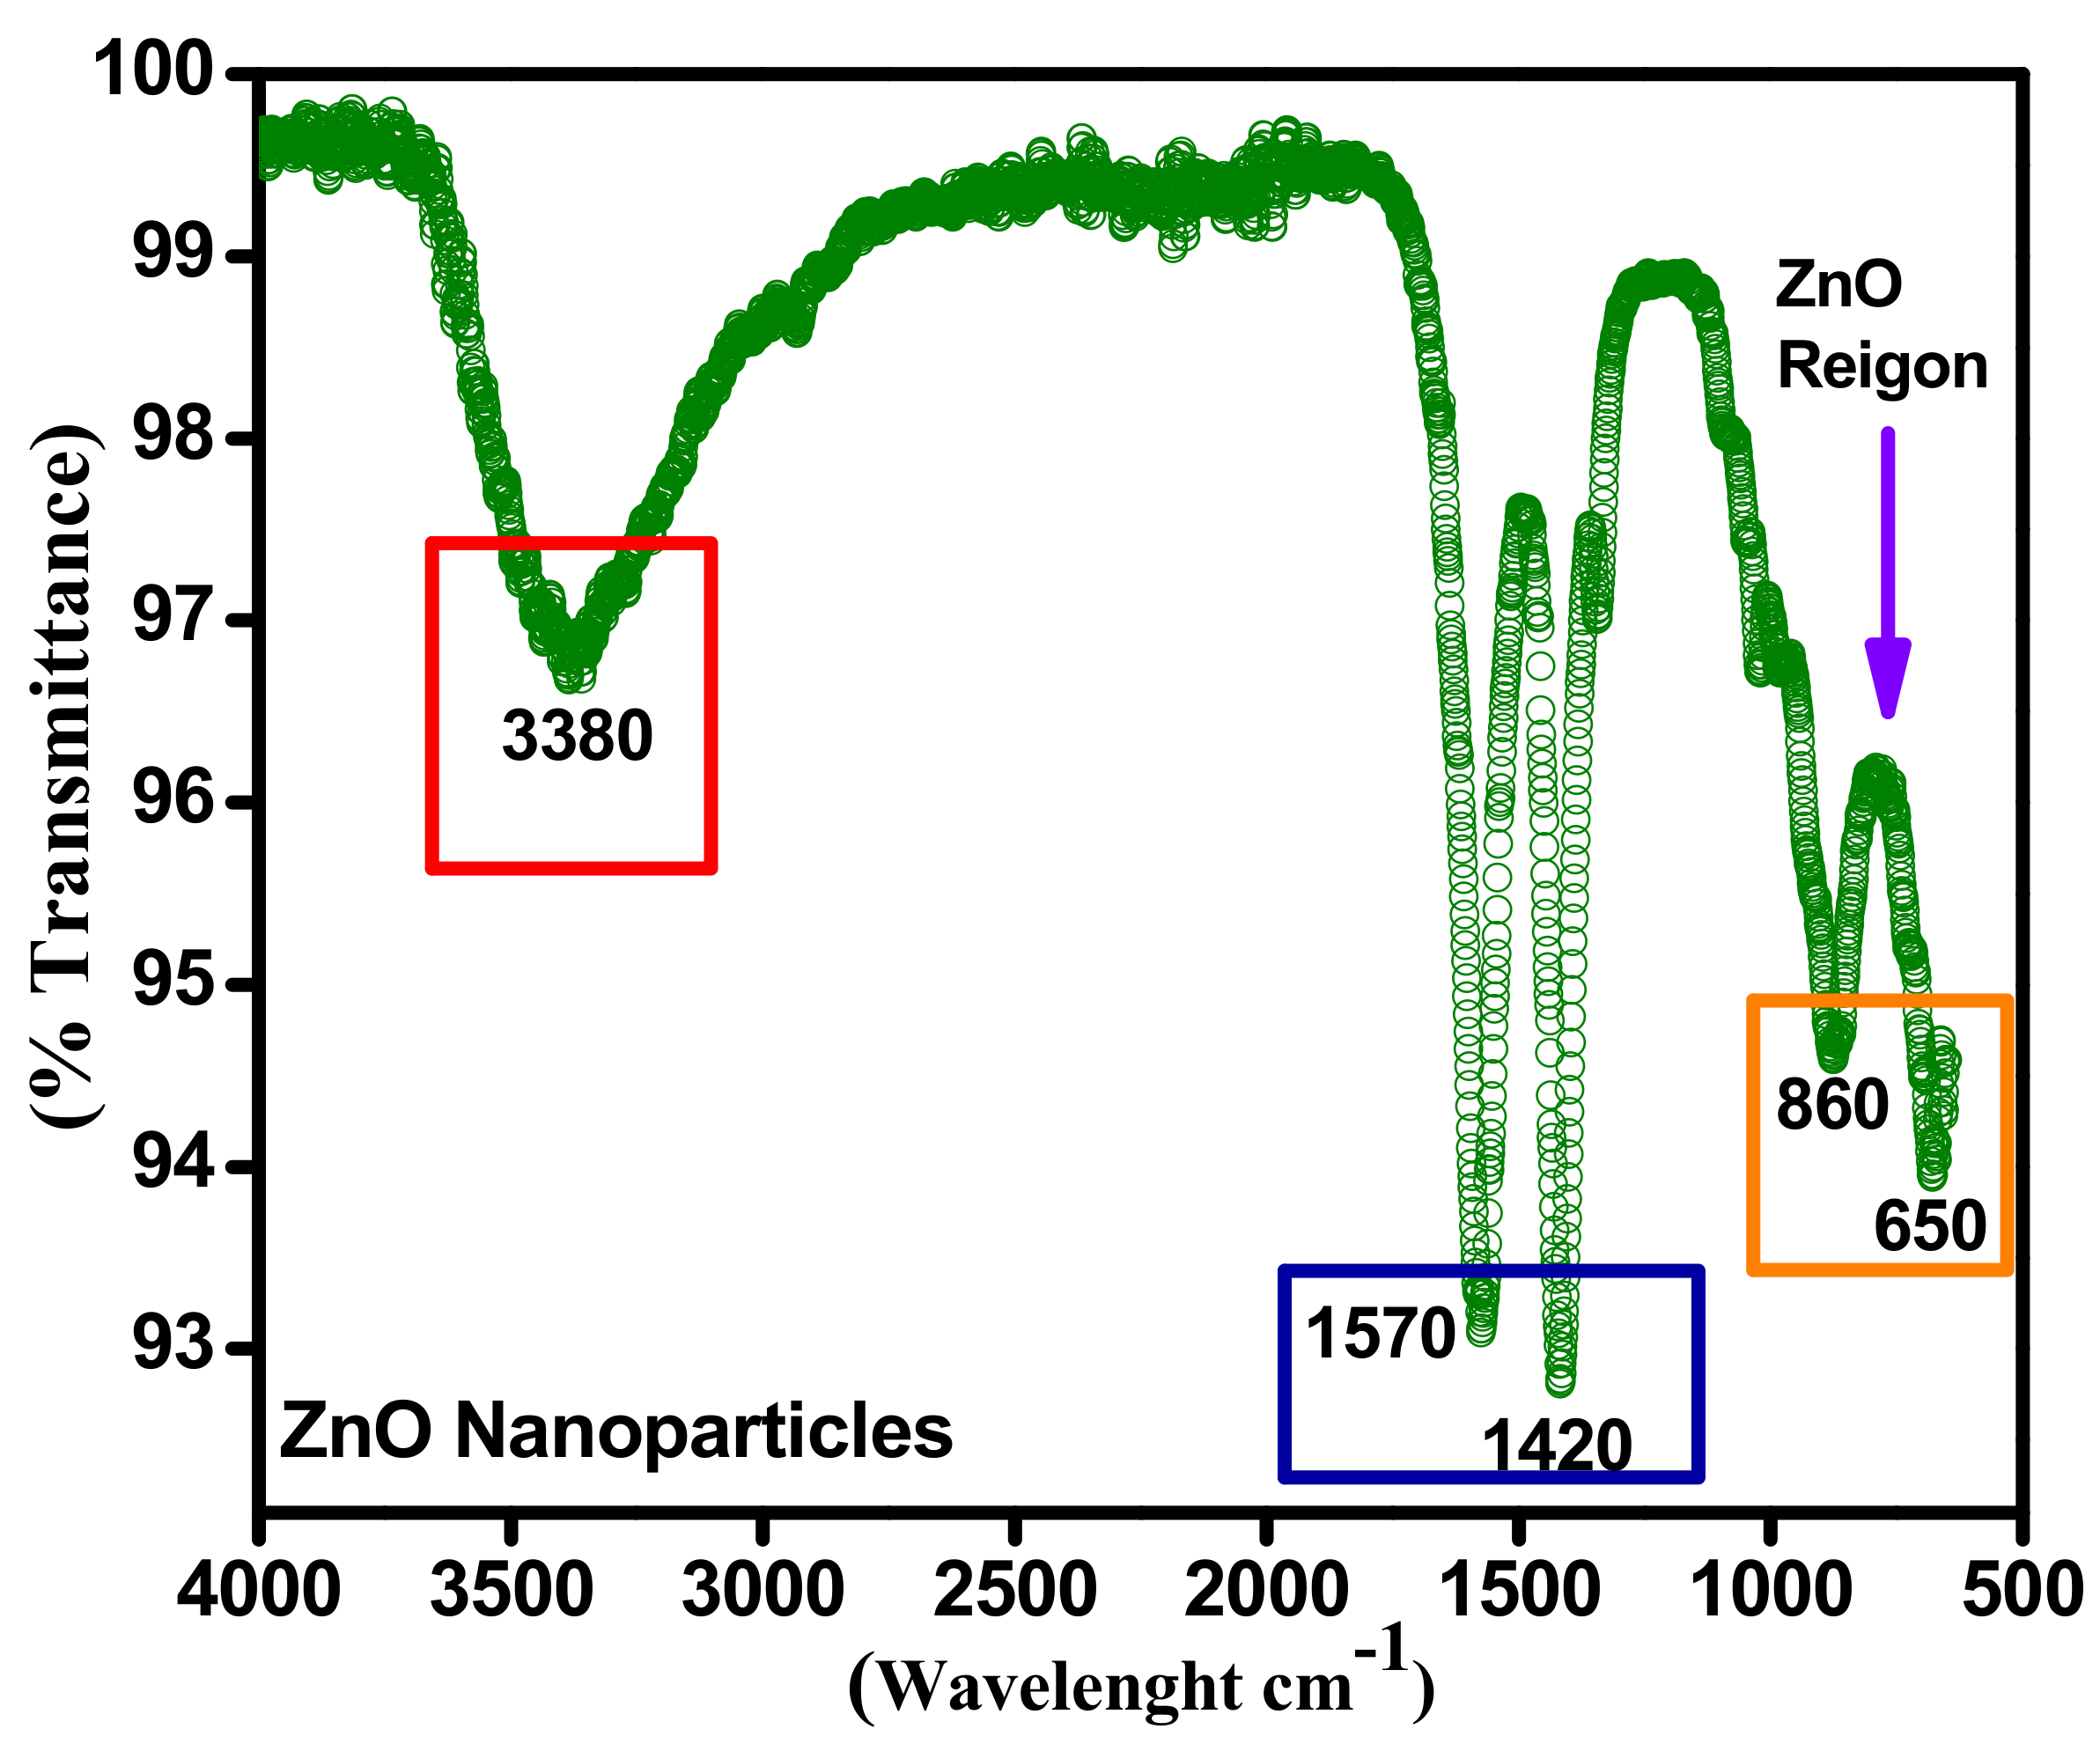
3.4. FTIR of ZnO Nanoparticles

Figure 7 represents the Fourier-transform infrared spectroscopy (FTIR) of sonochemically synthesized zinc oxide nanoparticles. This FTIR spectrum approves the physical investigation with Sargassum muticum considering diverse energy bands. The sonochemically synthesized zinc oxide nanoparticles were inspected by Perkin Elmer/Spectrum-100 Makmal Petroleum Geokimia 2,GB108, Aras Bawah, Bangunan Baru (J21), Jabatan Geologi model working with resolution (4000–400 cm−1) an occurrence of transmission modes. Typical absorption in area 1627–1423 cm−1 poorly entails an aromatic ring. A too weak absorption spectrum was at about 2950–2790 cm−1, which defines the actuality of aromatics aldehydes.
Further, the identical frail absorption peak was at 2076 cm−1 owing to cation exchange capacity (CEC) maximum vibrations. The maximum OH stretching can be perceived at an intensive and broad energy band at about 3337–3576 cm−1. Besides, the absorption at 450–540 cm−1 identifies the occurrence of zinc oxide. While the infrared bands at 3337 cm−1, 1457 cm−1 and 2923 cm−1 recognize the existence of OH. Concentrated broadband on 3460 cm−1 stipulates the OH- vibration. The band nearby 2920 cm−1 connotes irregular fluctuations of alkyl elements.

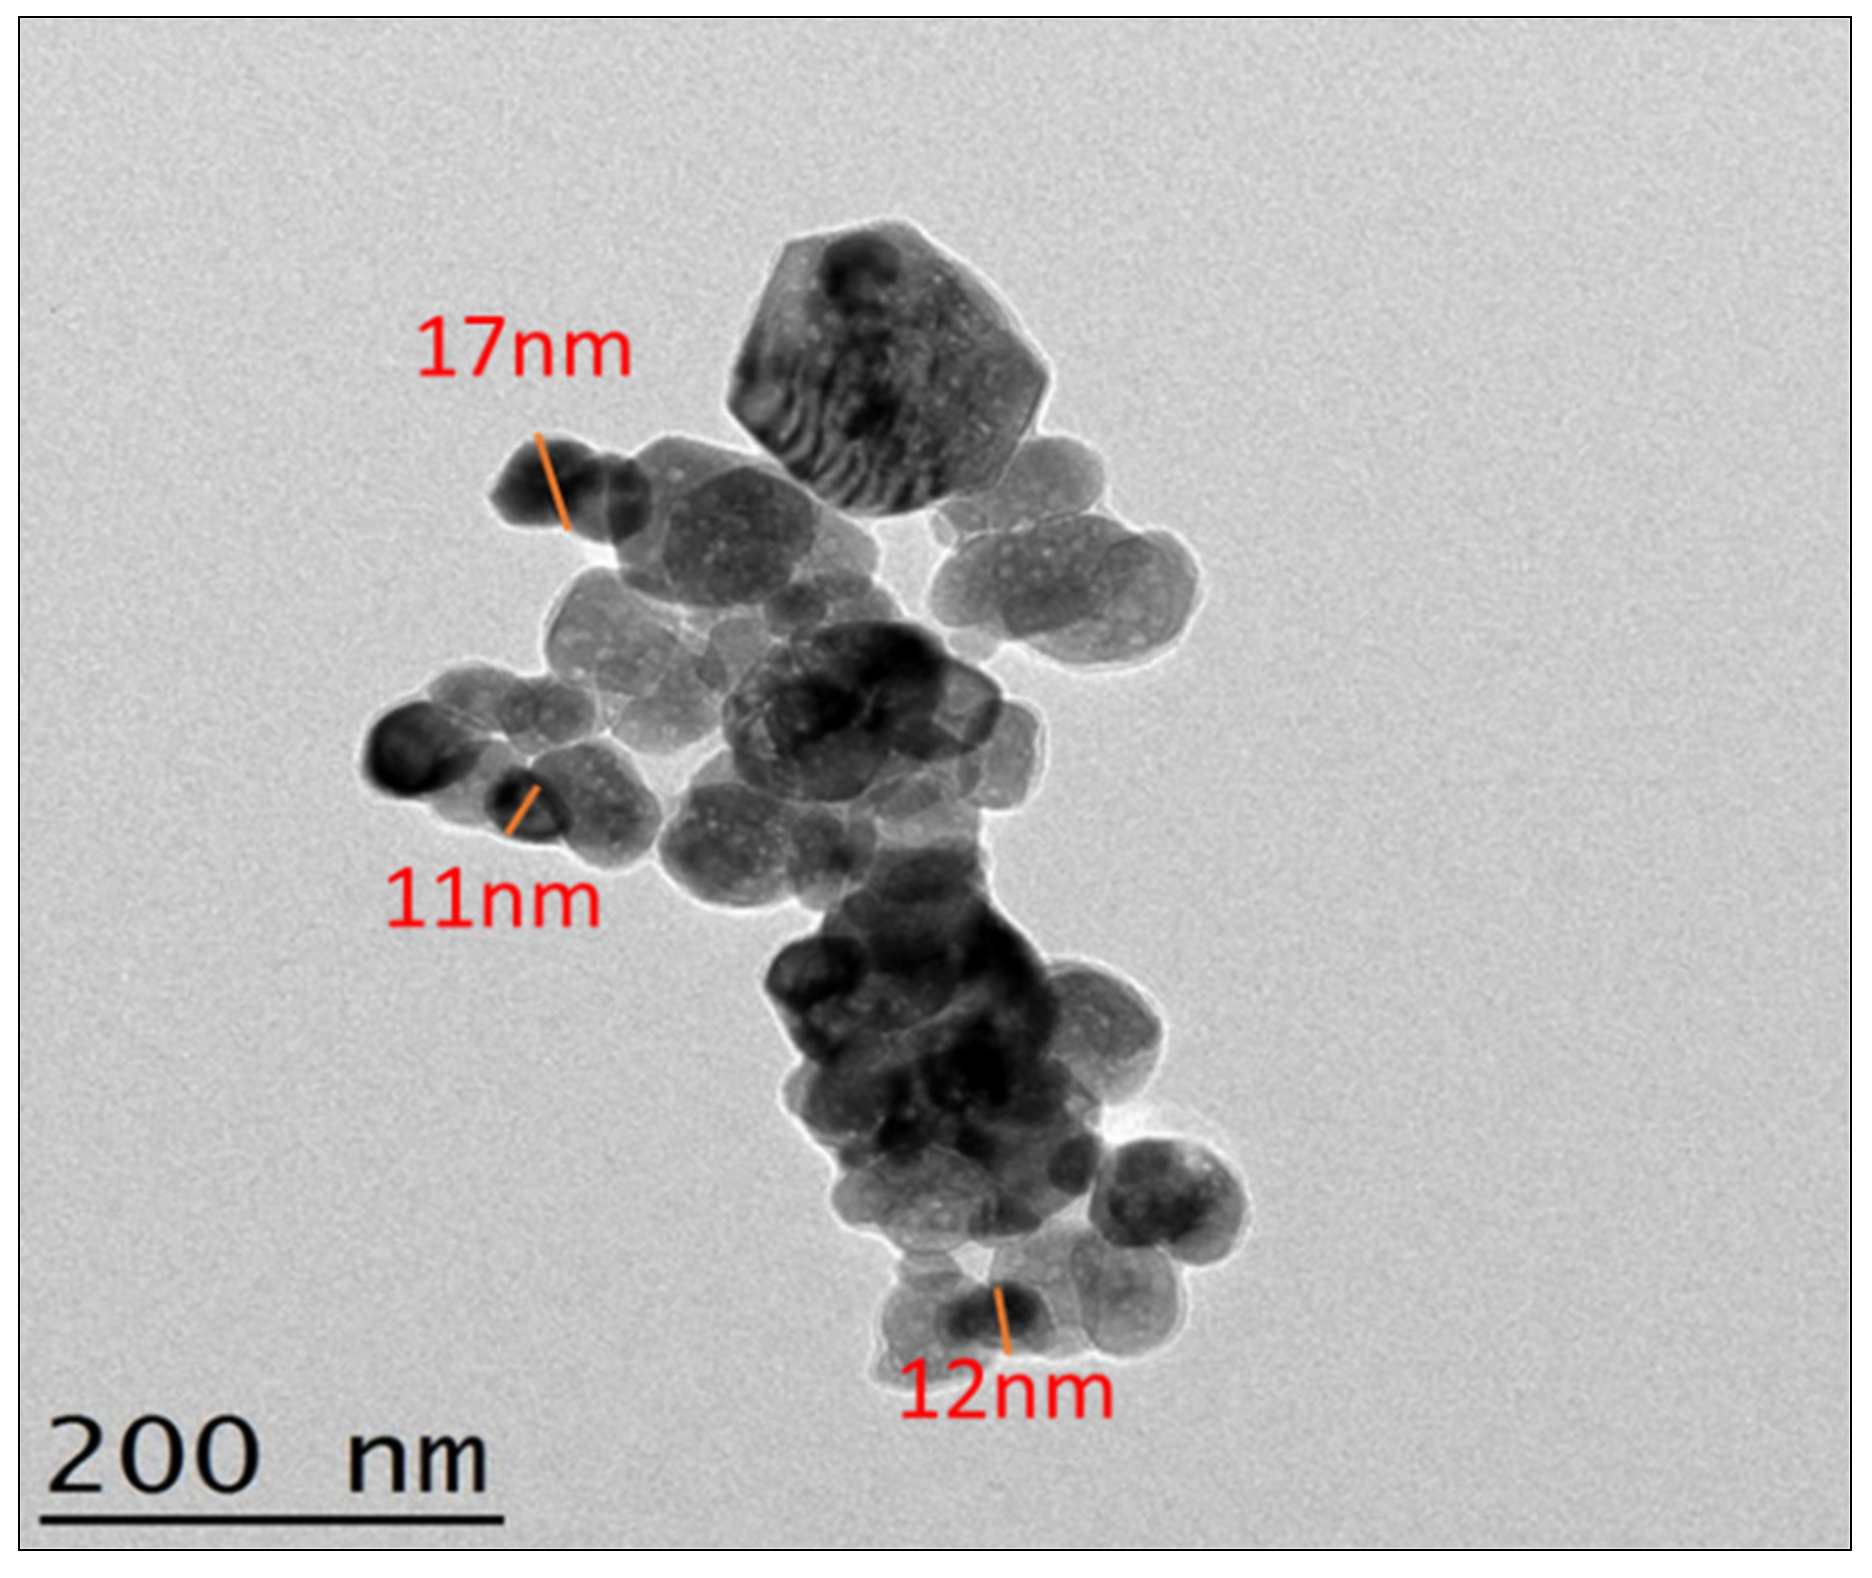
3.5. Transmission Electron Microscopy (TEM)

The morphology of sonochemical produced ZnO solid particles was been reflected by TEM analysis with EDX from MIMOS Semiconductor (M) Sdn Bhd (498484-V) Nano Characterization & QRA Services Lab Technology Park Malaysia 57000 Kuala Lumpur. Figure 8 shows the morphological study of the TEM image for sonochemical synthesized ZnO solid particles. The average size of sonochemical produced ZnO was measured by the TEM size coordinates tool, the picture representing in Figure 8 shows that the average size is around 15 nm, which is generously smaller within the spectacle of ultrasound. In addition, TEM analysis specified that the monodispersed morphology, which was credited to the cavitational case due to ultrasound waves. The TEM picture indicates that ZnO particles are attached, as compared to SEM/FESEM. The ZnO nanoparticles in TEM analysis shows chain-like structural arrangement of the particles because of their connection to one another.

4. Results and Discussions

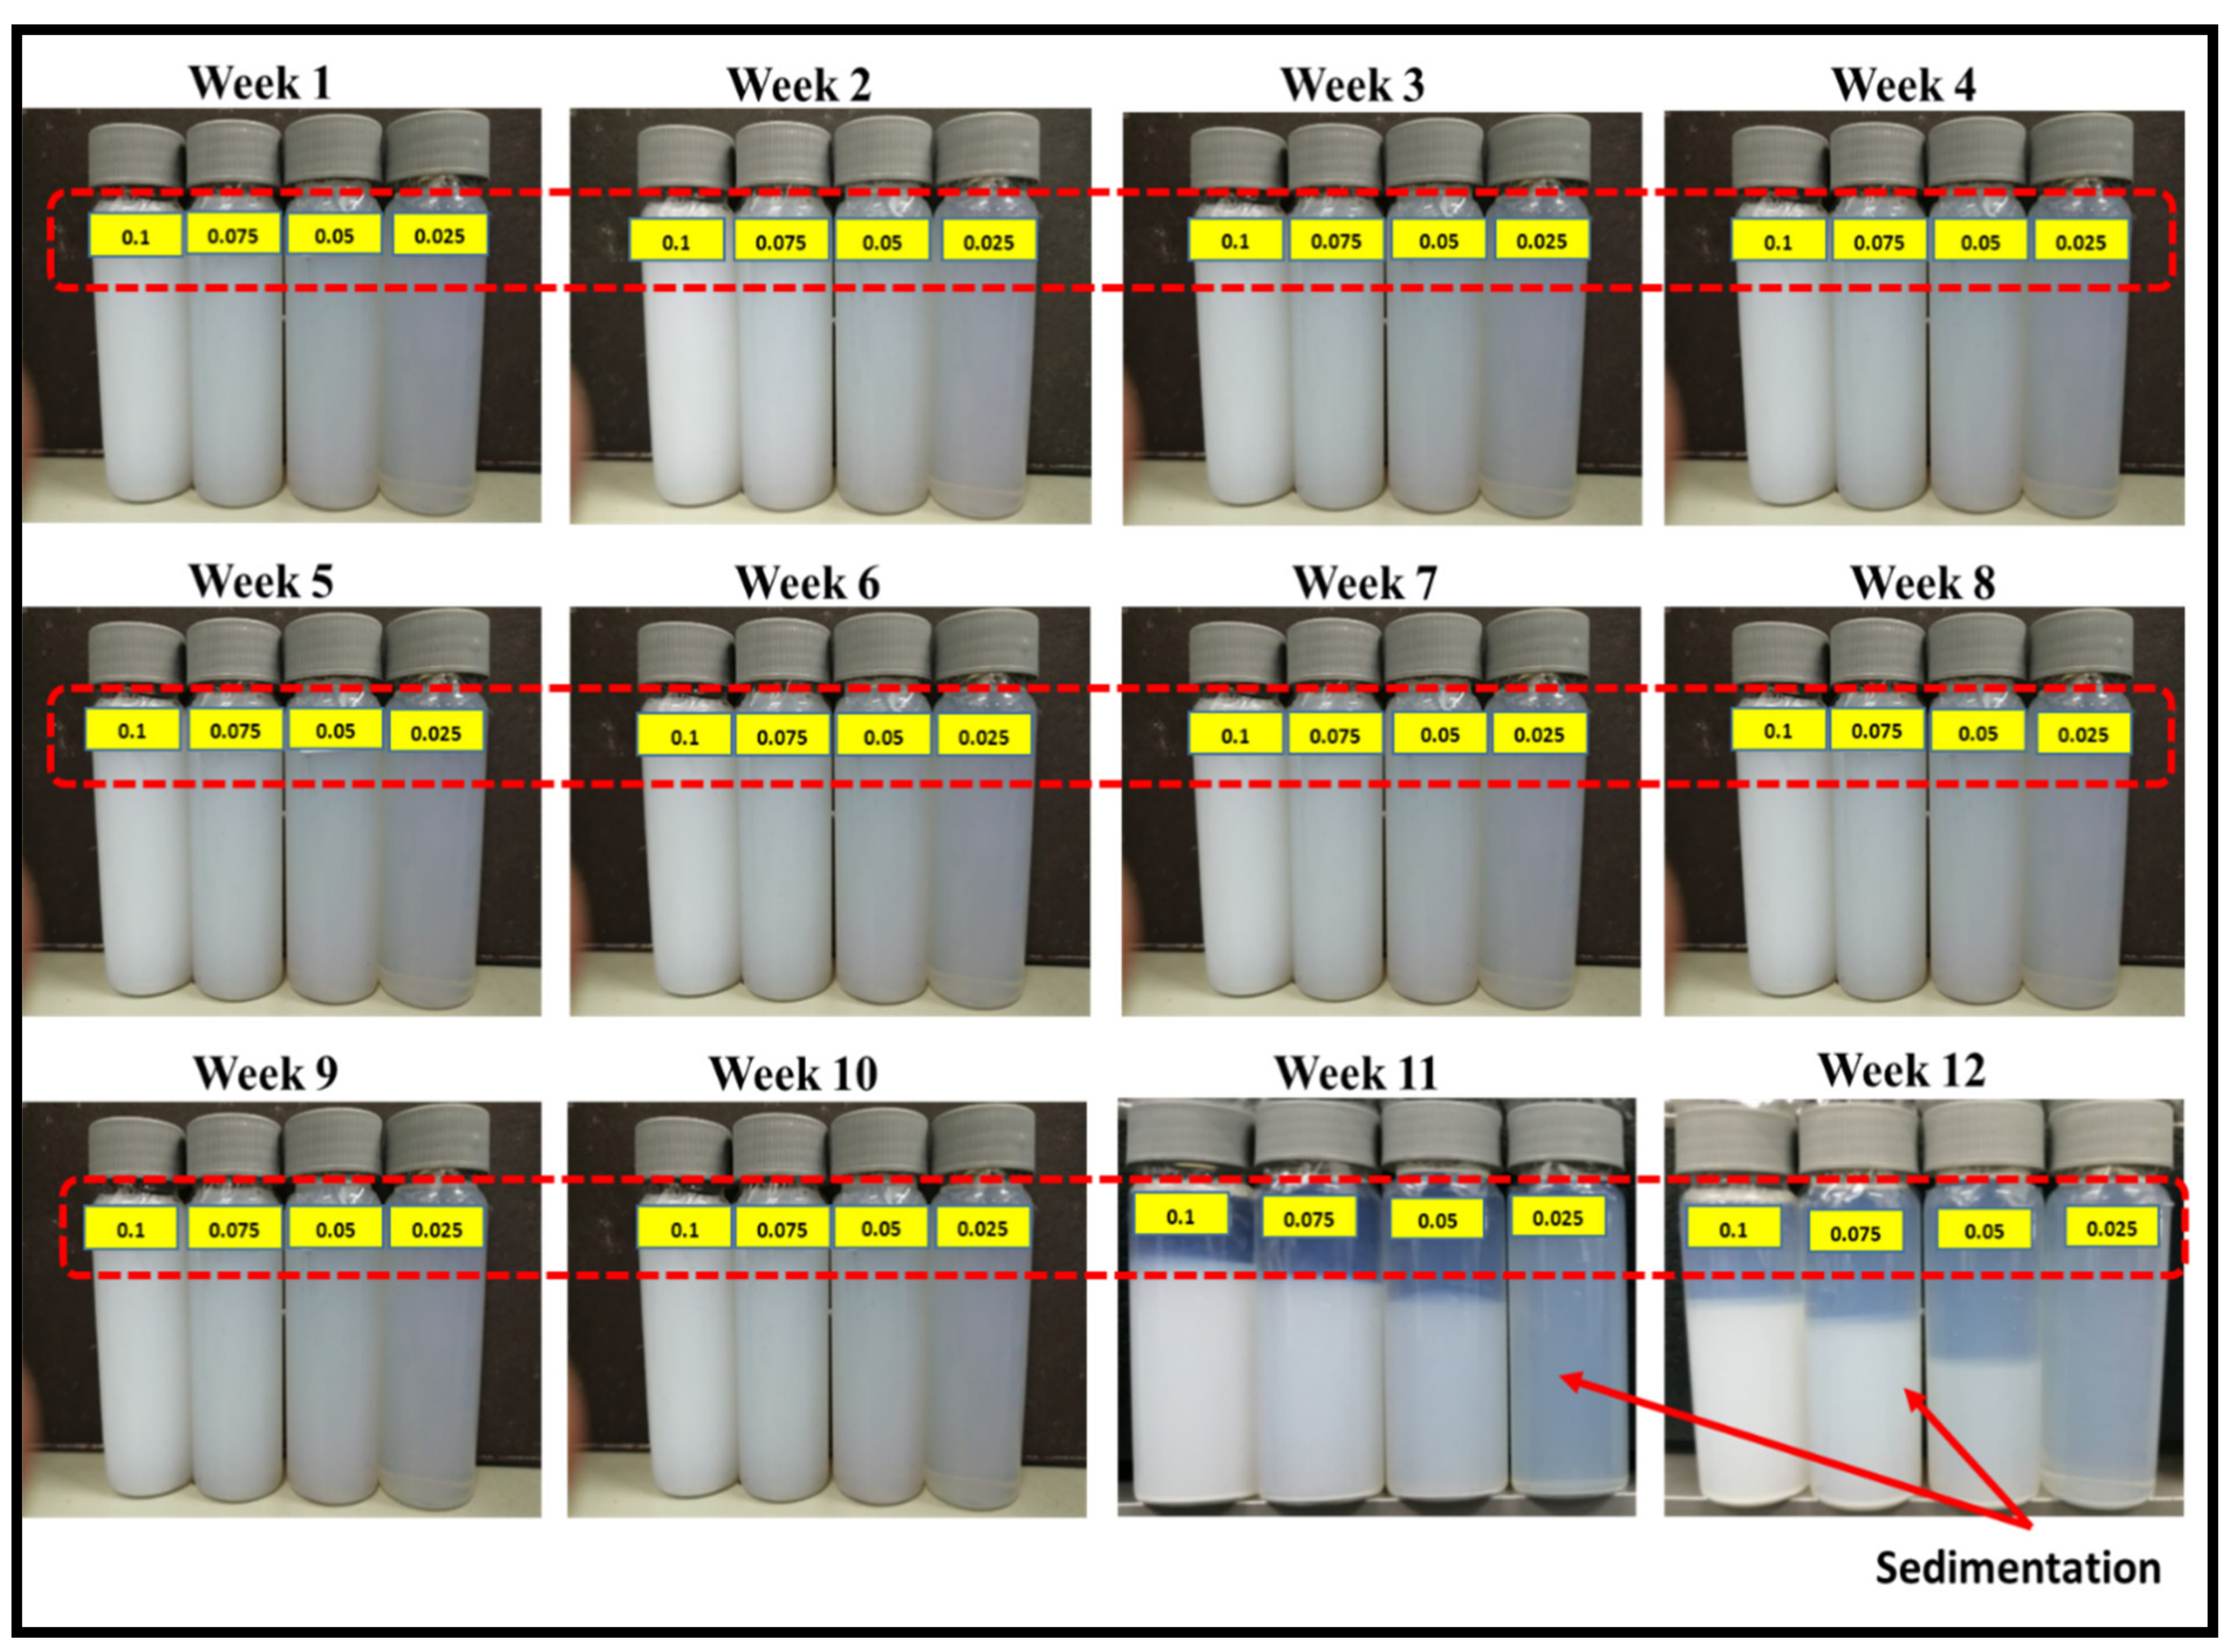
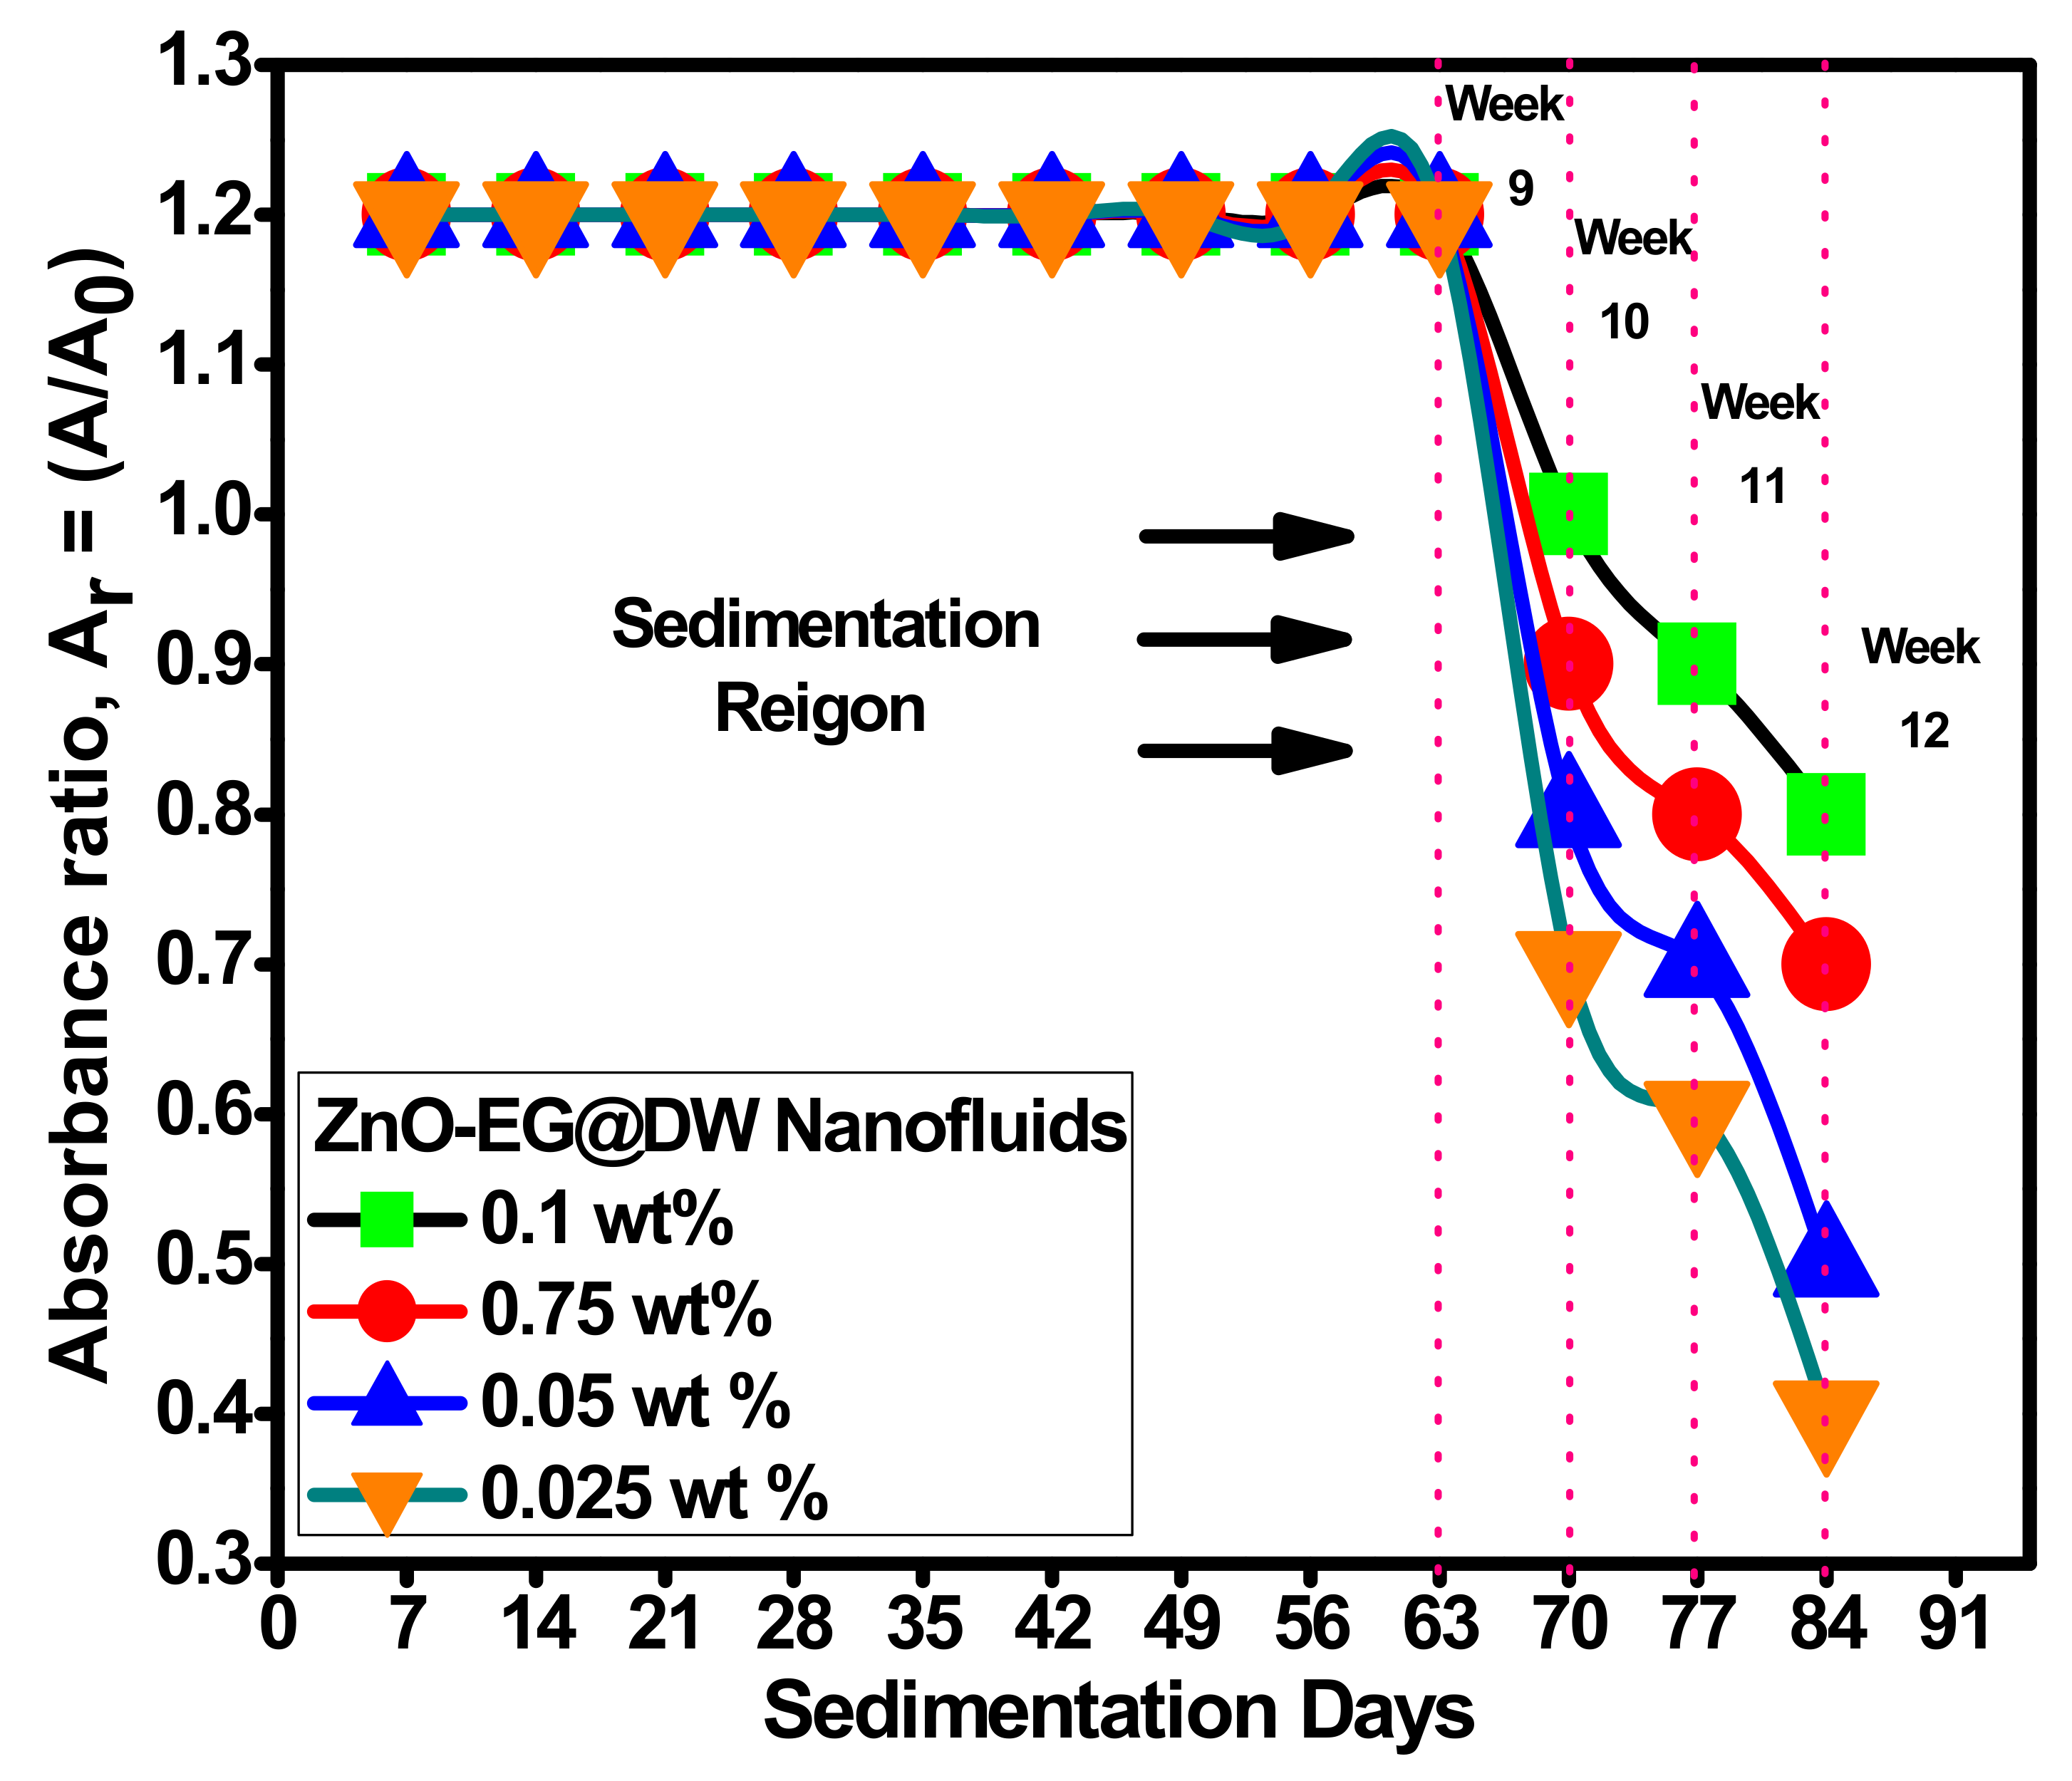
4.1. Homogeneous Dispersion and Stability of ZnO Nanoparticles in EG@DW Base Fluid

Figure 9 depicts the consistency of zinc oxide nanoparticles suspension in EG@DW visible to probe sonication with changing times. Further, the probe sonicator (I/P 220 V, 20-kHz, Amp 80, pulse rate 3/2 on and off, 36,000 J energy, probe temperature 0 °C and maximum power 750 W) was selected for ZnO-EG@DW nanofluids sonication until 2 h successively [40]. Figure 10 shows the equal dispersion of ZnO and its stability in EG@DW water. By physical observation, it can be seen, in Figure 9, that up to 63 days, nanoparticles are well dispersed and stable in EG@DW without mixing of any surfactant. After 63 days of preparation, it slightly starts to sediment, which can be seen in Figure 9.
Dispersion and stability analysis of 0.01 g zinc oxide nanoparticles were performed by diluting it into 30 mL EG@DW (15:15), then sonicated for 2 h consecutively maintaining the similar sonicator operating parameters [41]. Figure 10 describes the stability and sedimentation behavior of the ZnO-EG@DW nanofluids with 0.1, 0.075, 0.05 and 0.025 wt.%. From preparation until 9 weeks, all the concentrations of nanofluid preparations look well stable and dispersed, whereas at 10 weeks, it started to sediment, slightly about 2.7%. For 0.1 wt.% concentration of nanofluid, the absorbance level decreased from 1.2 to 0.8 within 8 weeks, while at 0.025 wt.%, the decline of absorbance was recorded from 1.2 to 0.4, which showed that the dropping of concentration level was proportional to the enhancement of sedimentation percentage. The same trend was noticed for the other two 0.075 and 0.05 wt.% nanofluids, as represented in Figure 10.

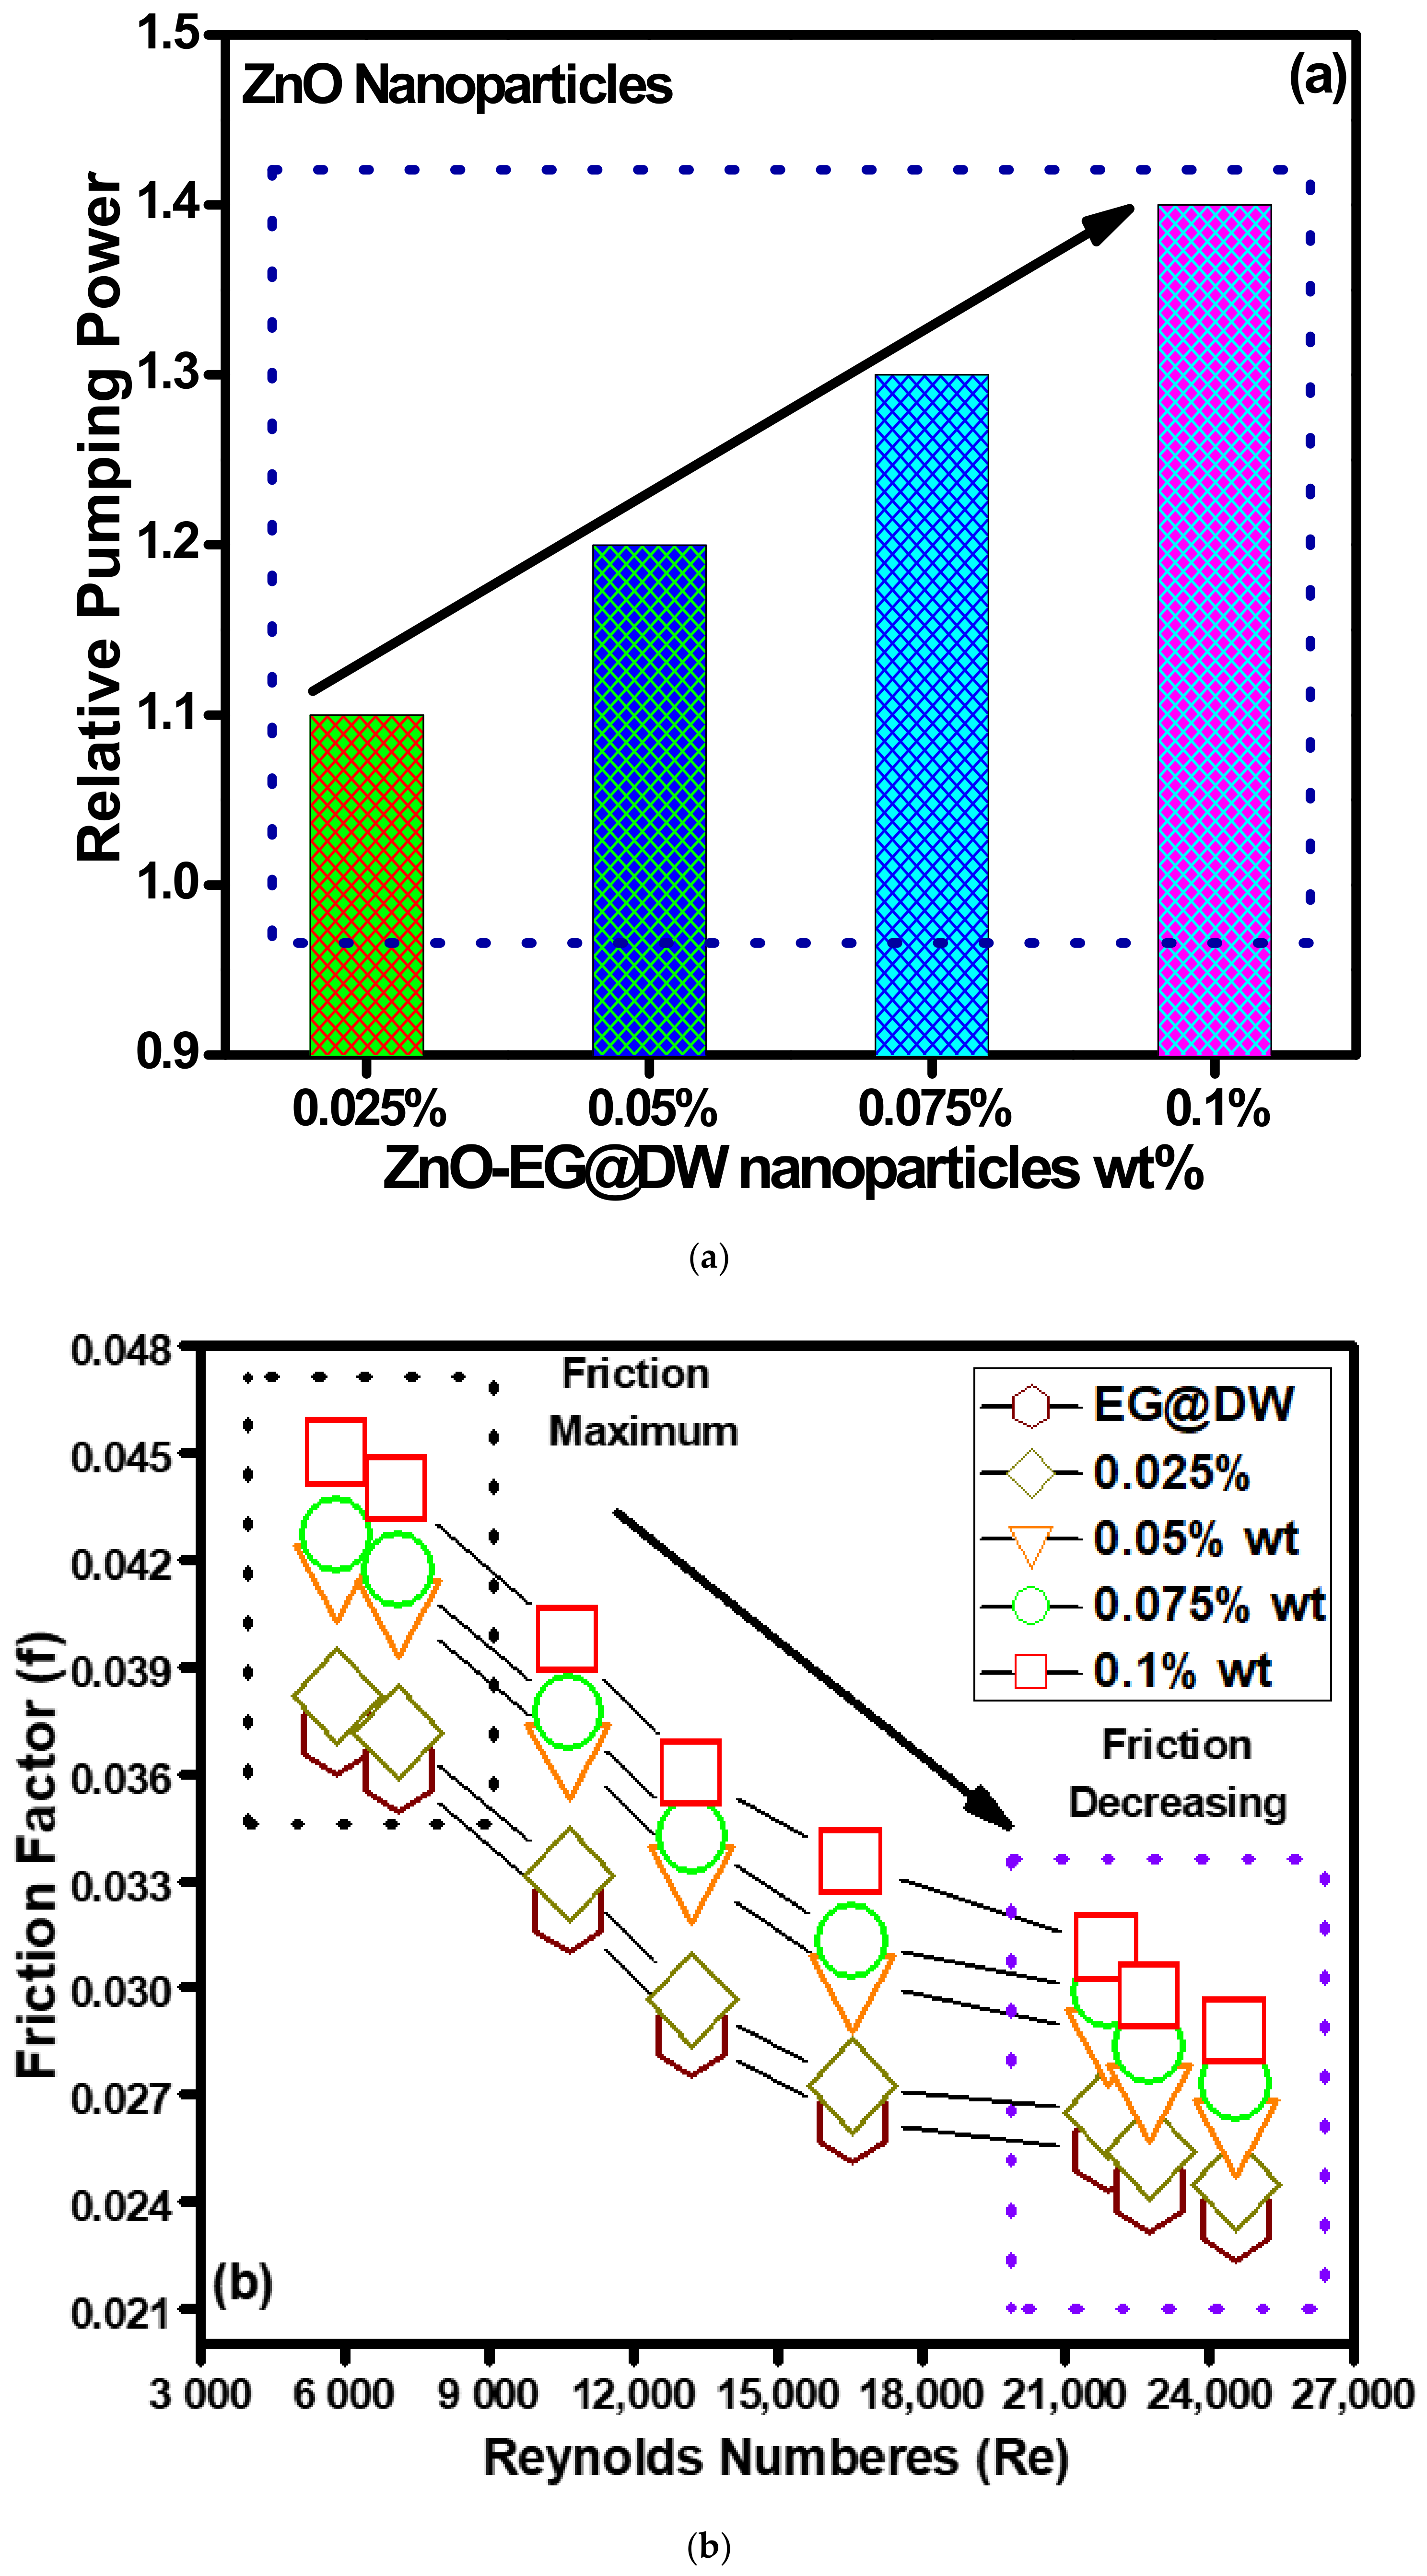
4.2. Hydrodynamic Properties

The pumping power for convective heat transfer using nanofluids is most vital since it needed to consider the energy consumption to enhance the energy utility of any thermal system. In the presented study, the pumping power required for ZnO-EG@DW nanofluids at each 0.1, 0.075, 0.05 and 0.025 wt.% was evaluated using Equation (12). The required pumping power for ZnO-EG@DW nanofluids and distilled water is shown in Figure 11a and the present results seem positive since the pumping power increases concerning the increase in ZnO nanoparticle wt.% concentrations. The addition of ZnO solid nanoparticles in base fluid causes increase in the viscosity of nanofluids, which requires more pumping power to pump the nanofluid in the flow pipe. More prominently, the pumping power requirement for 0.1 wt.% of the ZnO-EG@DW nanofluids is quite high as compared to other concentrations and EG@DW as well. This is due to the higher amount of the ZnO solid nanoparticles in the base fluid.
Figure 11b describes the friction coefficient for all wt.% concentrations of ZnO-EG@DW nanofluids and EG@DW as well, where the friction of all fluids starts to decrease as the Reynolds numbers increases. The friction loss happens due to the walls of the heat exchanger, nanoparticle collisions, nanoparticle shape, the shape of the heat exchanger and wt.% of the solid nanoparticles in the base fluid. The 0.1 wt.% concentration showed high friction on the lowest value of Reynolds number due to the presence of maximum ZnO solid nanoparticles.

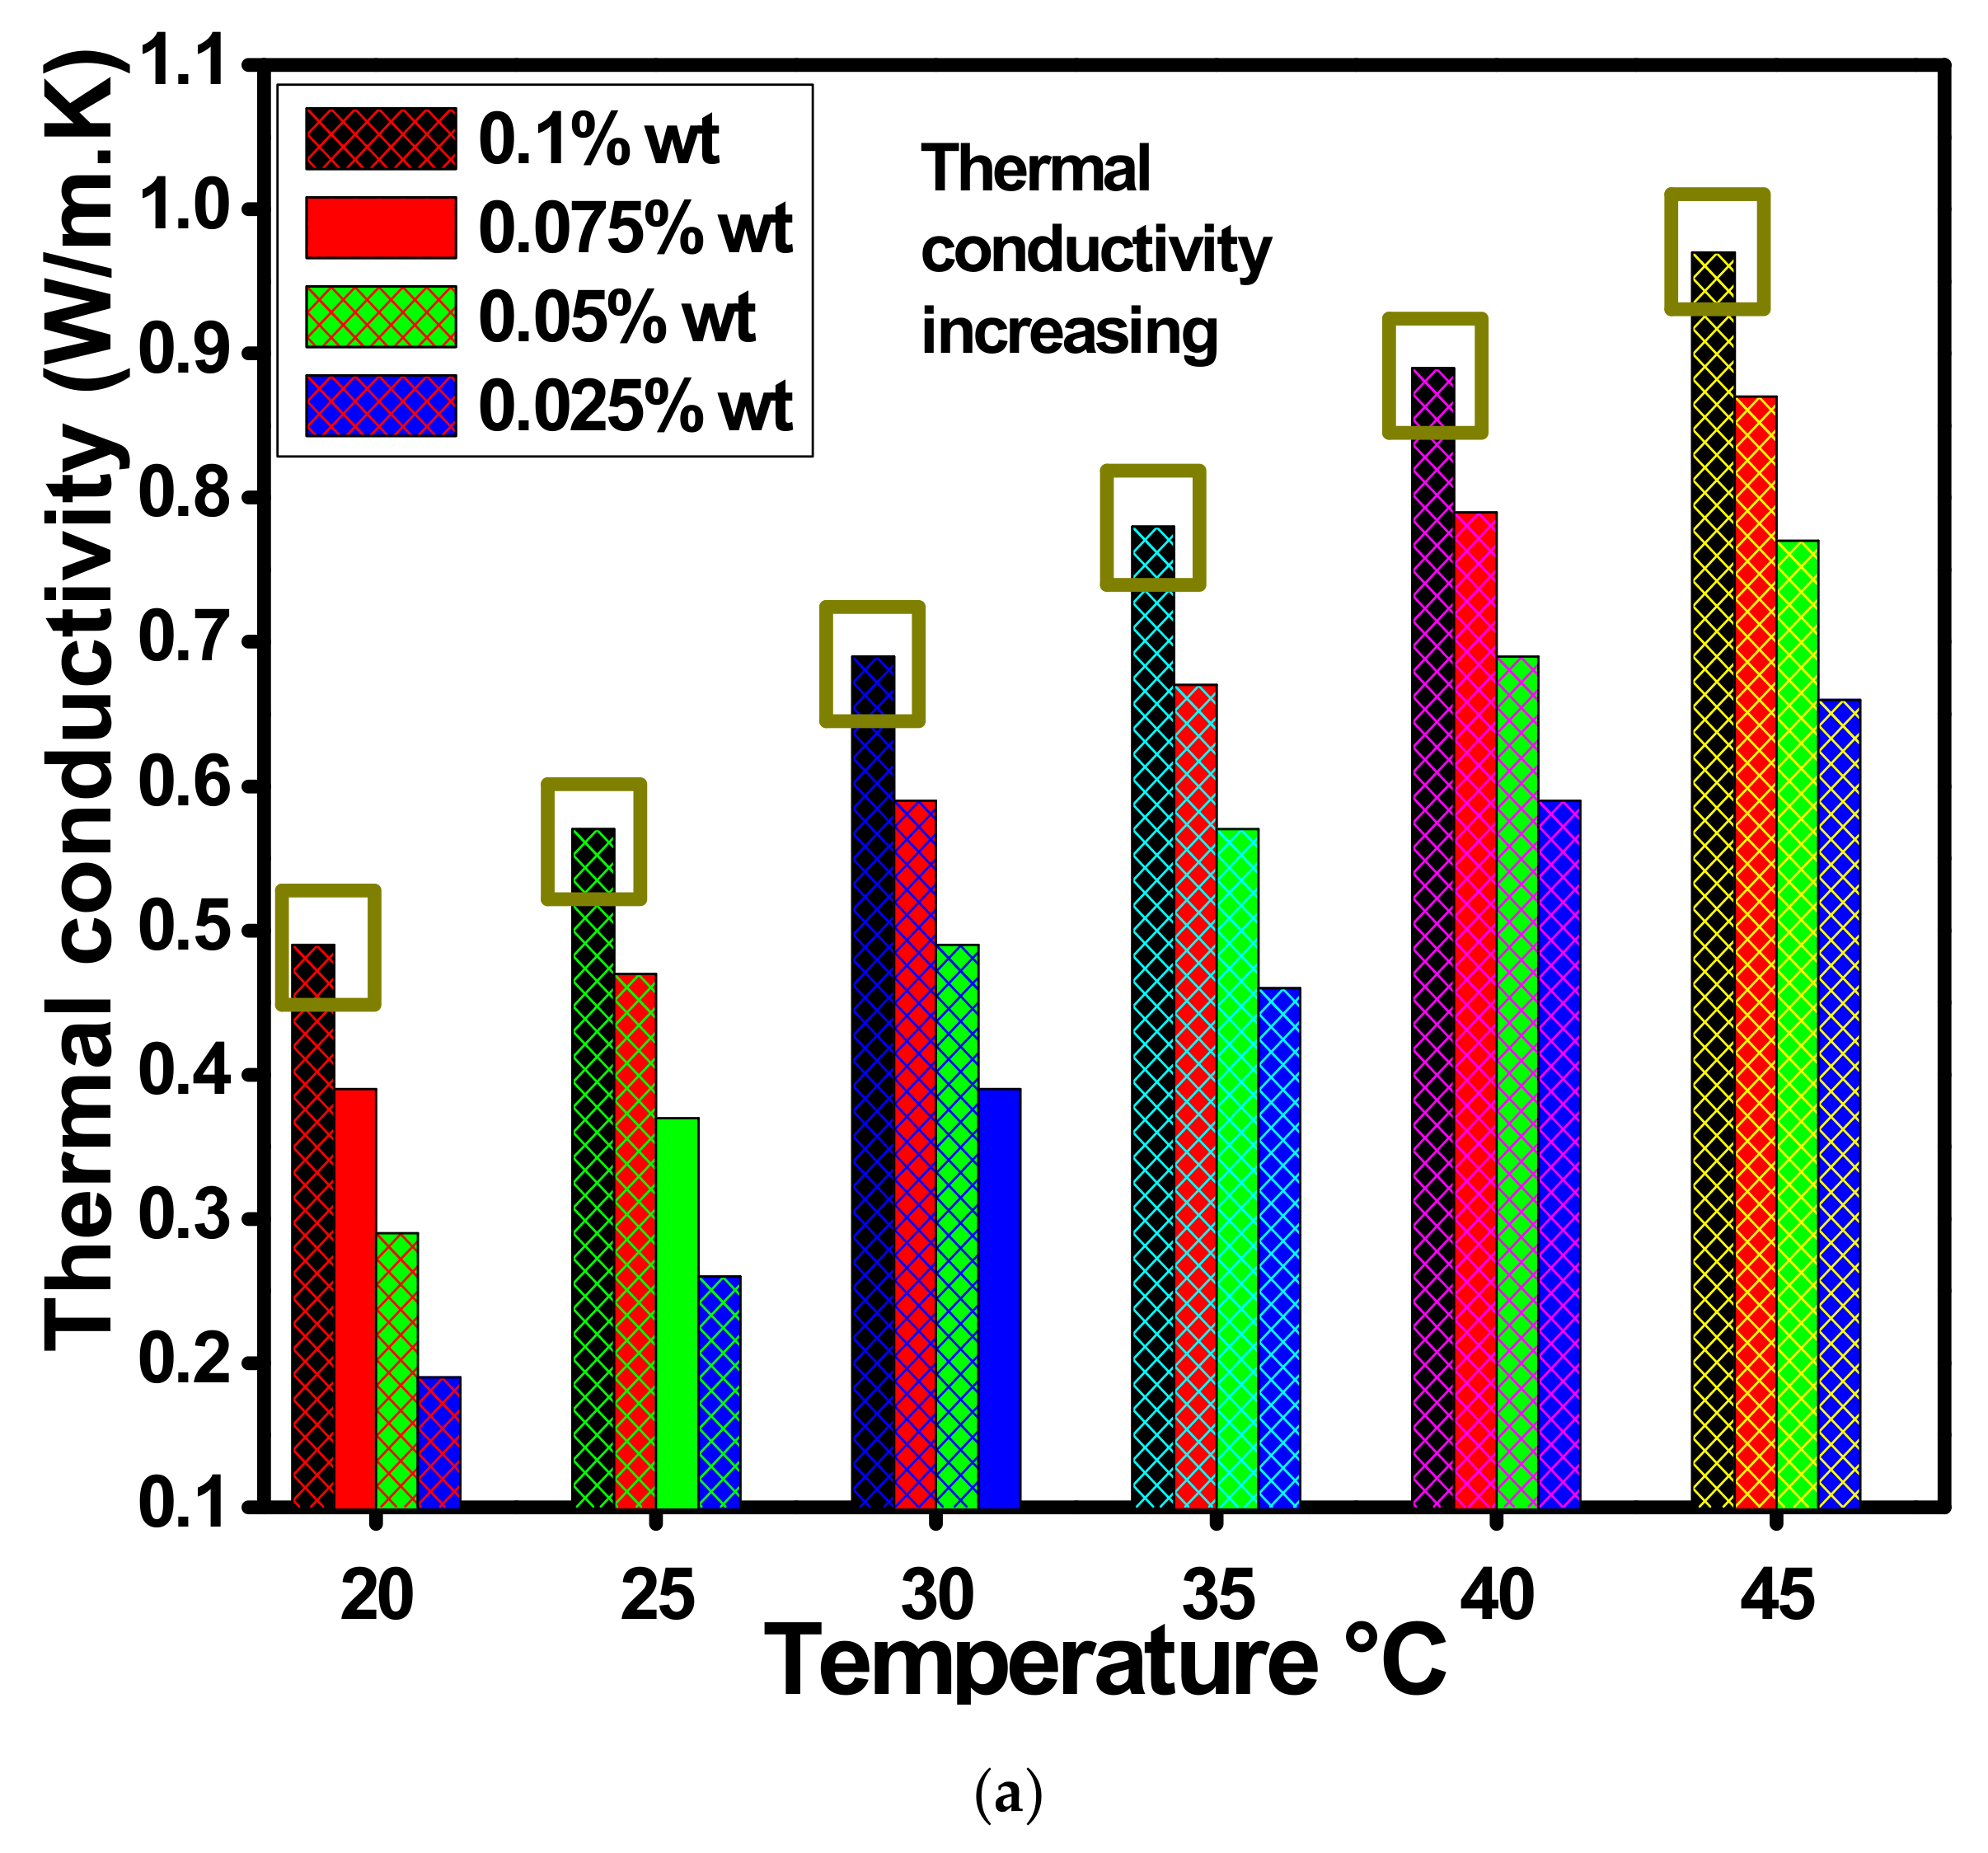
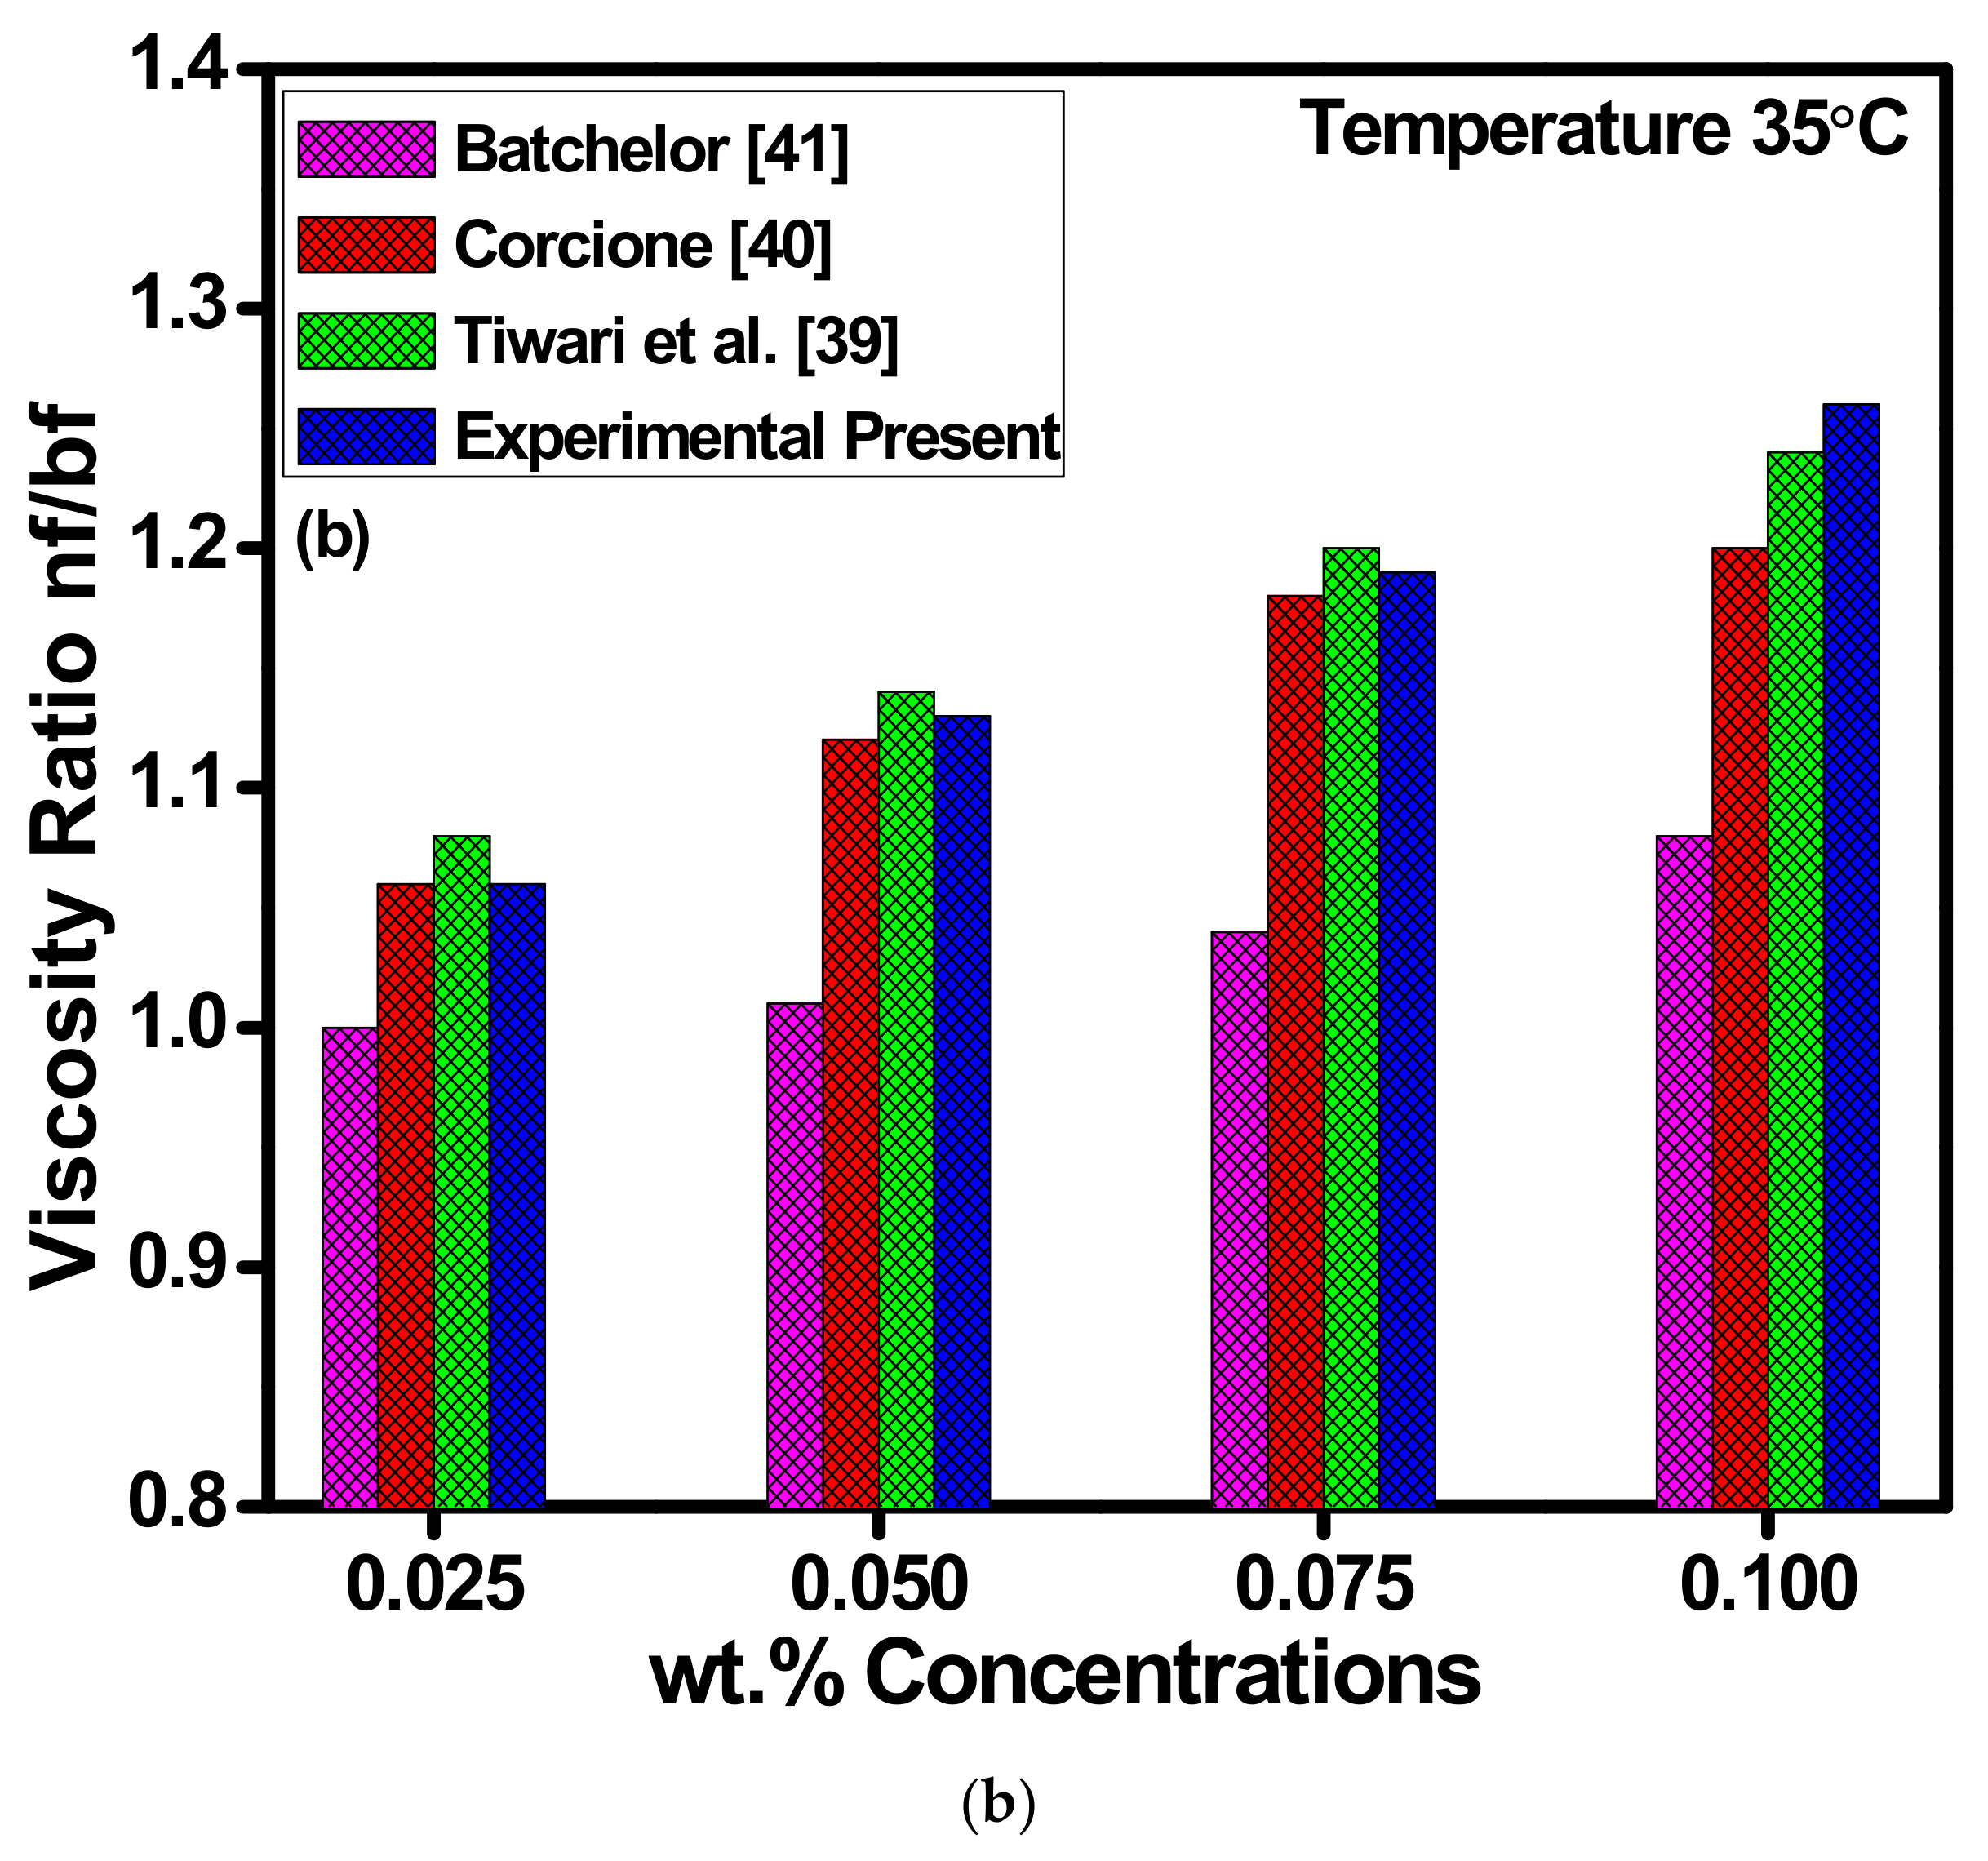
4.3. Thermal Conductivity and Viscosity Analysis

Figure 12a describes the thermal conductivity with changed 0.1, 0.075, 0.05 and 0.025 wt.% of ZnO-EG@DW-based nanofluids with temperature variations. The thermal conductivity analysis was conducted using advanced thermal properties analyzer KD-2 Pro (DECAGON devices, INC Sdn Bhd Malaysia Kuala Lumpur), where all the wt.% concentrations of the ZnO-EG@DW-based nanofluids were tested at a specific temperature range from 20 to 45 °C. The growing trend in Figure 12a reveals the mounting conduct of the overall thermal conductivity at each concentration of ZnO-EG@DW nanofluids with the temperature rise. Additionally, the outcome of the experiment at the lowest 20 °C and highest 45 °C was considered here. The assessed thermal conductivity was 0.99 W/mK against 45 °C and 0.5 W/mK for 25 °C of 0.1 wt.% of ZnO-EG@DW nanofluids, 0.85 W/mK on 45 °C and 0.4 W/mK against 25 °C of 0.075 wt.% of ZnO-EG@DW nanofluids, 0.72 W/mK on 45 °C and 0.3 W/mK on 25 °C of 0.05 wt.% of ZnO-EG@DW nanofluids and 0.68 W/mK on 45 °C and 0.2 W/mK on 25 °C of 0.025 wt.% of ZnO-EG@DW nanofluids. Figure 12 shows a growing trend in thermal conductivities with an increase in temperature for each wt.% of ZnO-EG@DW nanofluids. Furthermore, the EG@DW combination provides a homogeneous dispersion of ZnO and its stability. Moreover, the increase in wt.% of ZnO expands the thermal conductivities of nanofluids. Further, the supreme evolution in thermal conductivity drives up to 53% greater for 45 °C and of 0.1 wt.% of ZnO solid particles in a mixture of EG@DW fluid. This improvement in thermal conductivity ensues on the base of ZnO Brownian motion in the mixture of EG@DW fluid with the temperature change.
Figure 12b shows the viscosity profile of ZnO-EG@DW-based nanofluids and their correlation between experimental data and previously published data. The viscosity of ZnO-EG@DW-based nanofluids was measured using a viscometer at a constant temperature of 35 °C. Four different 0.1, 0.075, 0.05 and 0.025 wt.% concentrations of the ZnO-EG@DW-based nanofluids were measured for dynamic and kinematic viscosity. During the viscosity measurement, it was noticed that the viscosity of ZnO-EG@DW-based nanofluids was increasing with the addition of ZnO solid nanoparticles in the base fluid. From Figure 11b, it can be observed that as the wt.% of ZnO-EG@DW-based nanofluids increases the viscosity also increases. The higher 0.1 wt.% of the ZnO-EG@DW-based nanofluids showed higher viscosity at the same temperature as compared to other wt.%. The increase in viscosity is mainly attributed to the addition of the ZnO solid nanoparticles. Further, the experimental data were compared with different model data and found to be in good comparison [42,43,44].

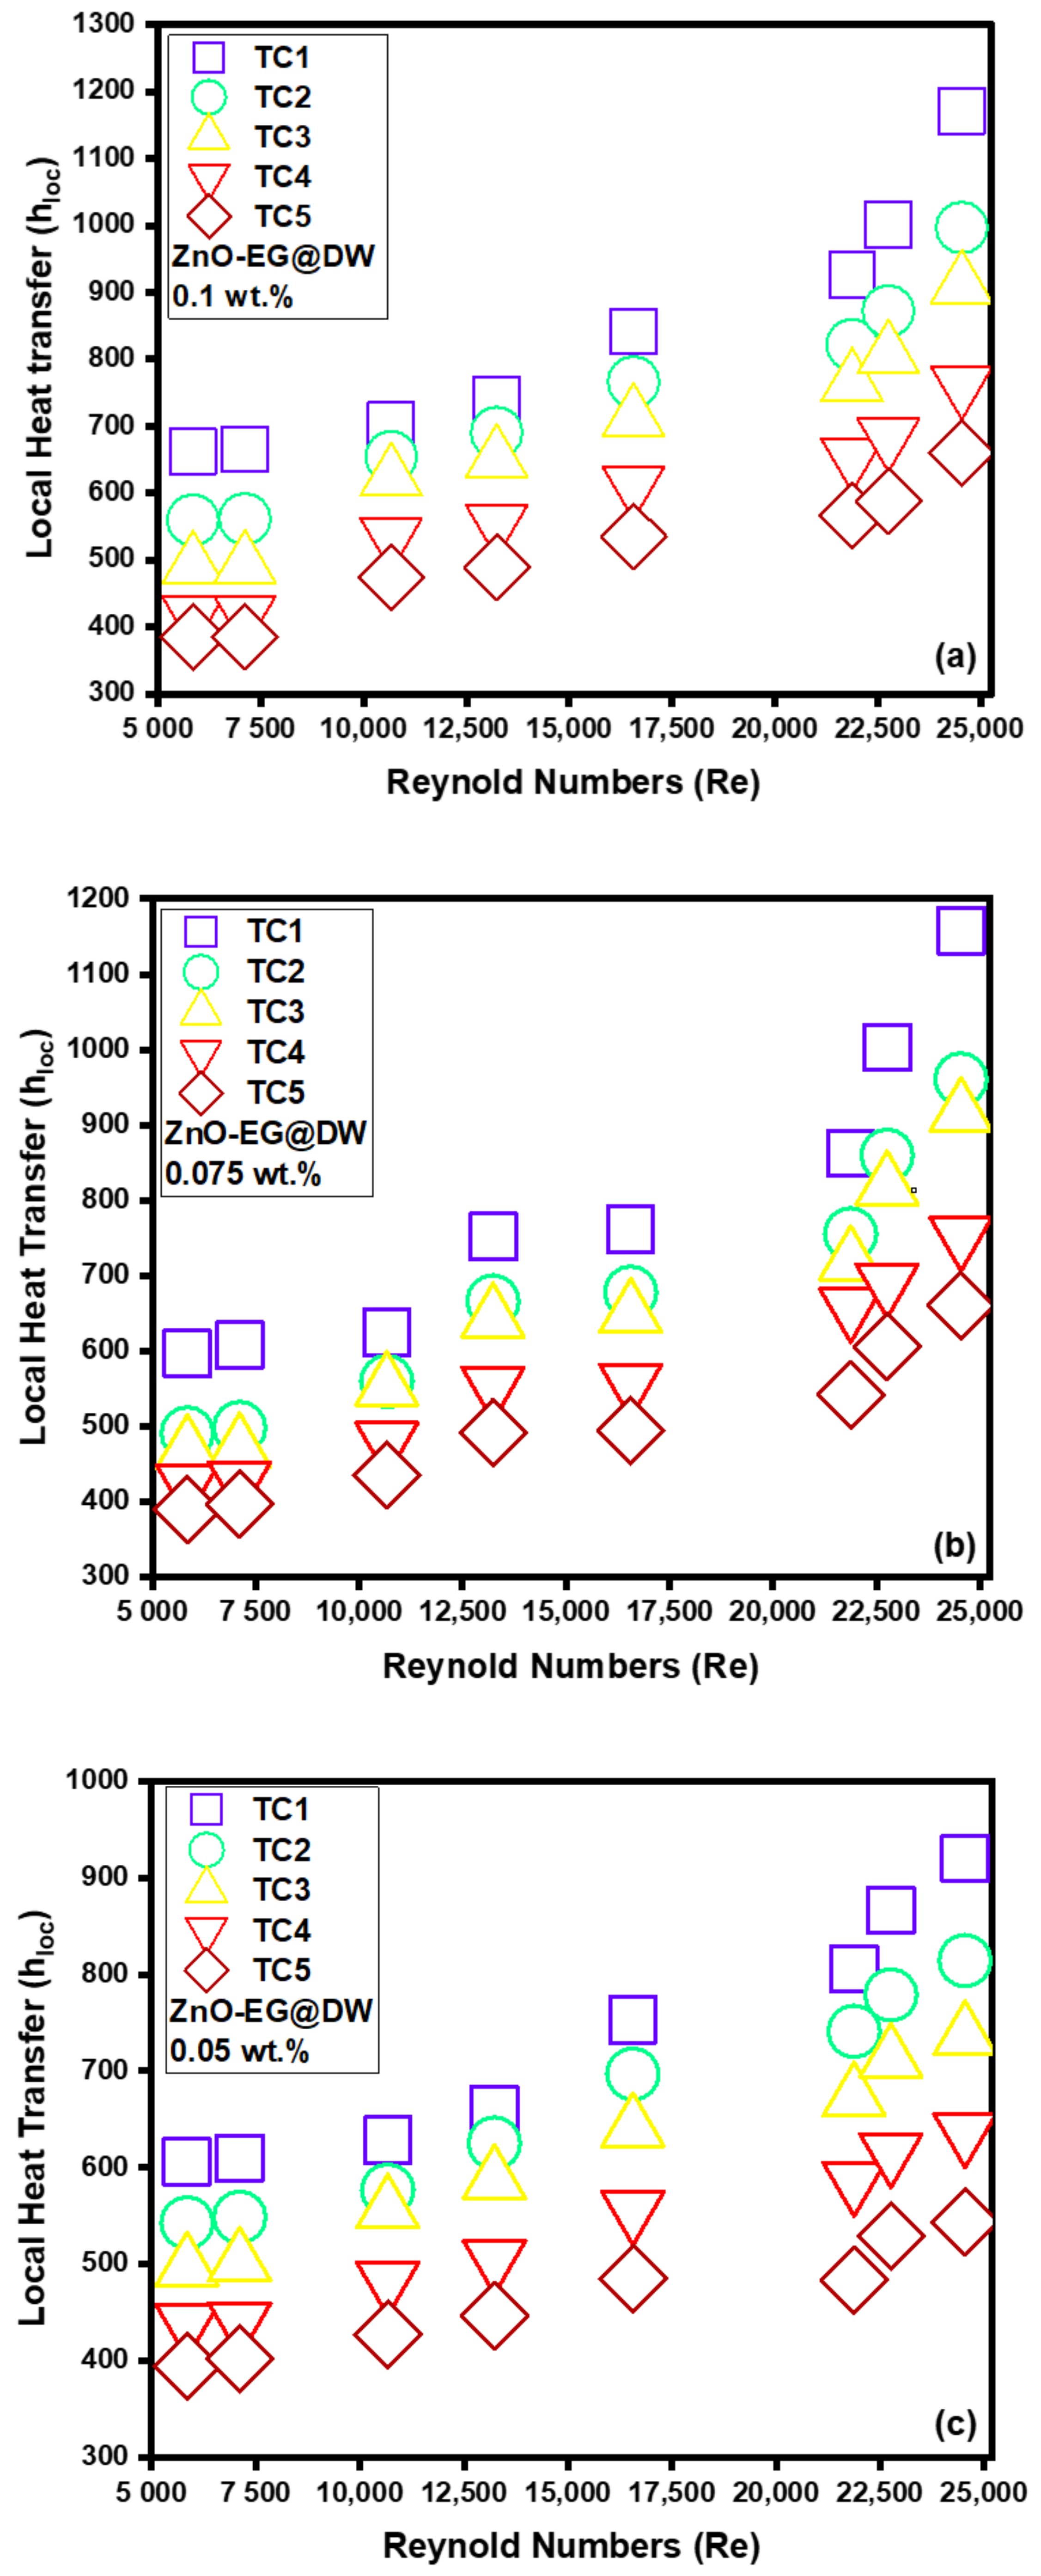
4.4. Average and Local Heat Transfer (h)

To evaluate the local/average Nusselt (Nu) and local/average heat transfer (h) measurements of ZnO-EG@DW nanofluids with 0.1, 0.075, 0.05 and 0.025 wt.%, the succession of tests has performed considering the specific variable parameters: power 600 W, Reynolds (Re) varying from 5849 to 24,544 and input temperature of 30 °C. The varying output variables were evaluated by applying different equations. Heat transfer (h) can evaluate by Equation (1).
h = q T w T b ,
where Tb = describes to bulk temperature, Tw = wall temperature and q is heat flux.
Similarly, Tb could directly be evaluated from ( T o u t + T i n ) / 2 ; here, Tout and Tin are the outlet/inlet temperatures, respectively.
The heat flux could be analyzed by Equation (2),
q = Q A ,
where Q, represents to I/P power that is equal to current and voltage product (P = IV). A represents to heated inner surface area for a single tube closed circular heat exchanger. For the circular test section, the area could be calculated using Equation (3).
A = π D L .
For the present tentative setup, the supreme input power was retained as 600 W.
By the way, the Nusselt values are nondimensional, so mathematically can be represented by Equation (4)
N u = h D h k ,
where h is the heat transfer, Dh denotes the hydraulic diameter of circular medium and k describes the nanofluids thermal conductivity.
The Reynolds numbers (Re) have been calculated using Equation (5).
R e = ρ v D µ .
Here, ρ = density, Re = Reynolds numbers, µ = fluid viscosity and v = velocity. Considering the nanofluids as single-phase liquids, some of the standard correlations (Equations (6)–(8)) were applied to evaluate the Nu numbers (Dittus-Boelter, Gnielinski and Petukhov) [45,46,47].
N u = f 8 R e 1000 P r 1 + 12.7 f 8 0.5 P r 2 / 3     1 .
Here, Pr is the Prandtl number, Re denotes Reynolds number and f describes friction factor.
N u = f 8 R e P r 1.07 + 12.7 f 8 0.5 ( Pr 2 / 3 1 )
If 3 × 10³ (< Re < 5 × 10⁶) and 0.5 (< Pr < 2000), then the use of Equation (6) is valid
N u = 0.023 R e 0.8   Pr 0.4 .
Furthermore, Equation (7) is valid in the specified range (Re > 104 and 0.7 < Pr < 160).
The friction loss in Equation (6) and (7) were introduced from Equation (9) of Petukhov.
f = { 0.79 L n R e 1.64 2 } .
Here, in the range of 104 < Re < 106, for the samples ZnO/EG/DW nanofluid and DW water, the friction factors were evaluated experimentally by Equation (10).
f = P L D ρ v 2 2 .
where P = fluid Pressure drop and v is the velocity. To evaluate the friction factor, Equation (11) introduced by Blasius can be used.
f = 0.3164 R e 0.25 .
If (Re) remains within 3000 ˂ Re ˂ 105, then the driving power of turbulent regimes flow can be evaluated by Equation (12).
W = 0.158 4 π 1.74 L m 2.75 µ 0.25 ρ 2 D 4.75 ,
where m is the mass flow in the test medium.
By inserting v = V/A and ρ = m/v into Equation (5) and by inserting the altered Equation (5) into Equation (12), the resultant driving power expression of Pumping power for nanofluid to pumping power for base fluid (Wnf/Wbf) can be represented by Equation (13) for any specific Reynolds number.
W n f W b f = ρ b f ρ n f 2 µ n f µ b f 3 .
Figure 13a–d represents the variations in local heat transfer against varying Reynolds (Re) at different locations (TC1, TC2, TC3, TC4 and TC5) alongside the single tube closed circular heat exchanger with changing 0.1, 0.075, 0.05 and 0.025 wt.% of ZnO-EG@DW nanofluids. For each location, the bulk temperature was calculated using inlet temperature, outlet temperature and distance from inlet point (0.2, 0.4, 0.6, 0.8 and 1 m) correspondingly. In addition, for the local heat transfer measurement at each location, the bulk temperature Tb, wall temperature Tw and heat flux are considered. The cumulative inclination of heat transfer with the escalation of Reynolds (Re) and wt.% of sonochemically synthesized solid ZnO in EG@DW is presented in Figure 13a–d. Each wt.% of ZnO-EG@DW nanofluid validates that the heat transfer is growing against the incremental variations of Reynolds (Re).
Figure 13a shows that at 0.1 wt.% of ZnO-EG@DW nanofluids, the local heat transfer (h) was noticed at the end of the circular test section, which was perceived to be mounting within 600–1200 W/m2K with Reynolds (Re) extension within 5849–24,544. Figure 13b shows that at 0.075 wt.% of ZnO-EG@DW nanofluids, the local heat transfer was about 600–1170 W/m2K for the same Reynolds (Re) numbers. Similarly, Figure 13c shows that at 0.05 wt.% of ZnO-EG@DW, nanofluids showed less local heat transfer about 400–970 W/m2K and lastly, the 0.025 wt.% of ZnO-EG@DW nanofluids presented data that varied from 400–900 W/m2K as shown in Figure 13d. This cumulative behavior is due to turbulent improvement in circular medium with the rise in the flow velocities or Reynolds (Re) number that eventually increased the heat transfer, where it could be reliant on boundary width reduction in circular medium to fix eddies damage at great Reynolds (Re) number, which amplified the heat transfer. During the experiment, a high Re number strengthened the uncontrolled movement of zinc oxide nanoparticles in EG@DW base fluid, which also maintained the rise of heat transfer.
Figure 13e exposed the mounting trend in average heat transfer for all 0.1, 0.075, 0.05 and 0.025 wt.% of ZnO-EG@DW nanofluids and EG@DW as well. The increasing trend displays that average heat transfer (h) has enhanced with the increase in the Reynolds (Re) number. The experiential augmentation could be owed to a drastic reduction in ZnO particles agglomeration. Further, the rise in Reynolds (Re) number will progressively affect condensed agglomeration, which enhances the heat transfer of ZnO-EG@DW nanofluids. An additional reason for the amplified heat transfer (h) is that the growth in ZnO particles wt.% driven force occurs owing to the rise in velocity or Reynolds (Re) numbers. Besides, the increase in velocities, the movement and collision among ZnO nanoparticles rise, which attributes the growth in heat transfer. The tentative outcomes showed that 0.1 wt.%. contributed to the maximum heat transfer of about 600–1000 W/m2K at the peak value of Reynolds (Re) number, which is higher than the EG@DW heat transfer.

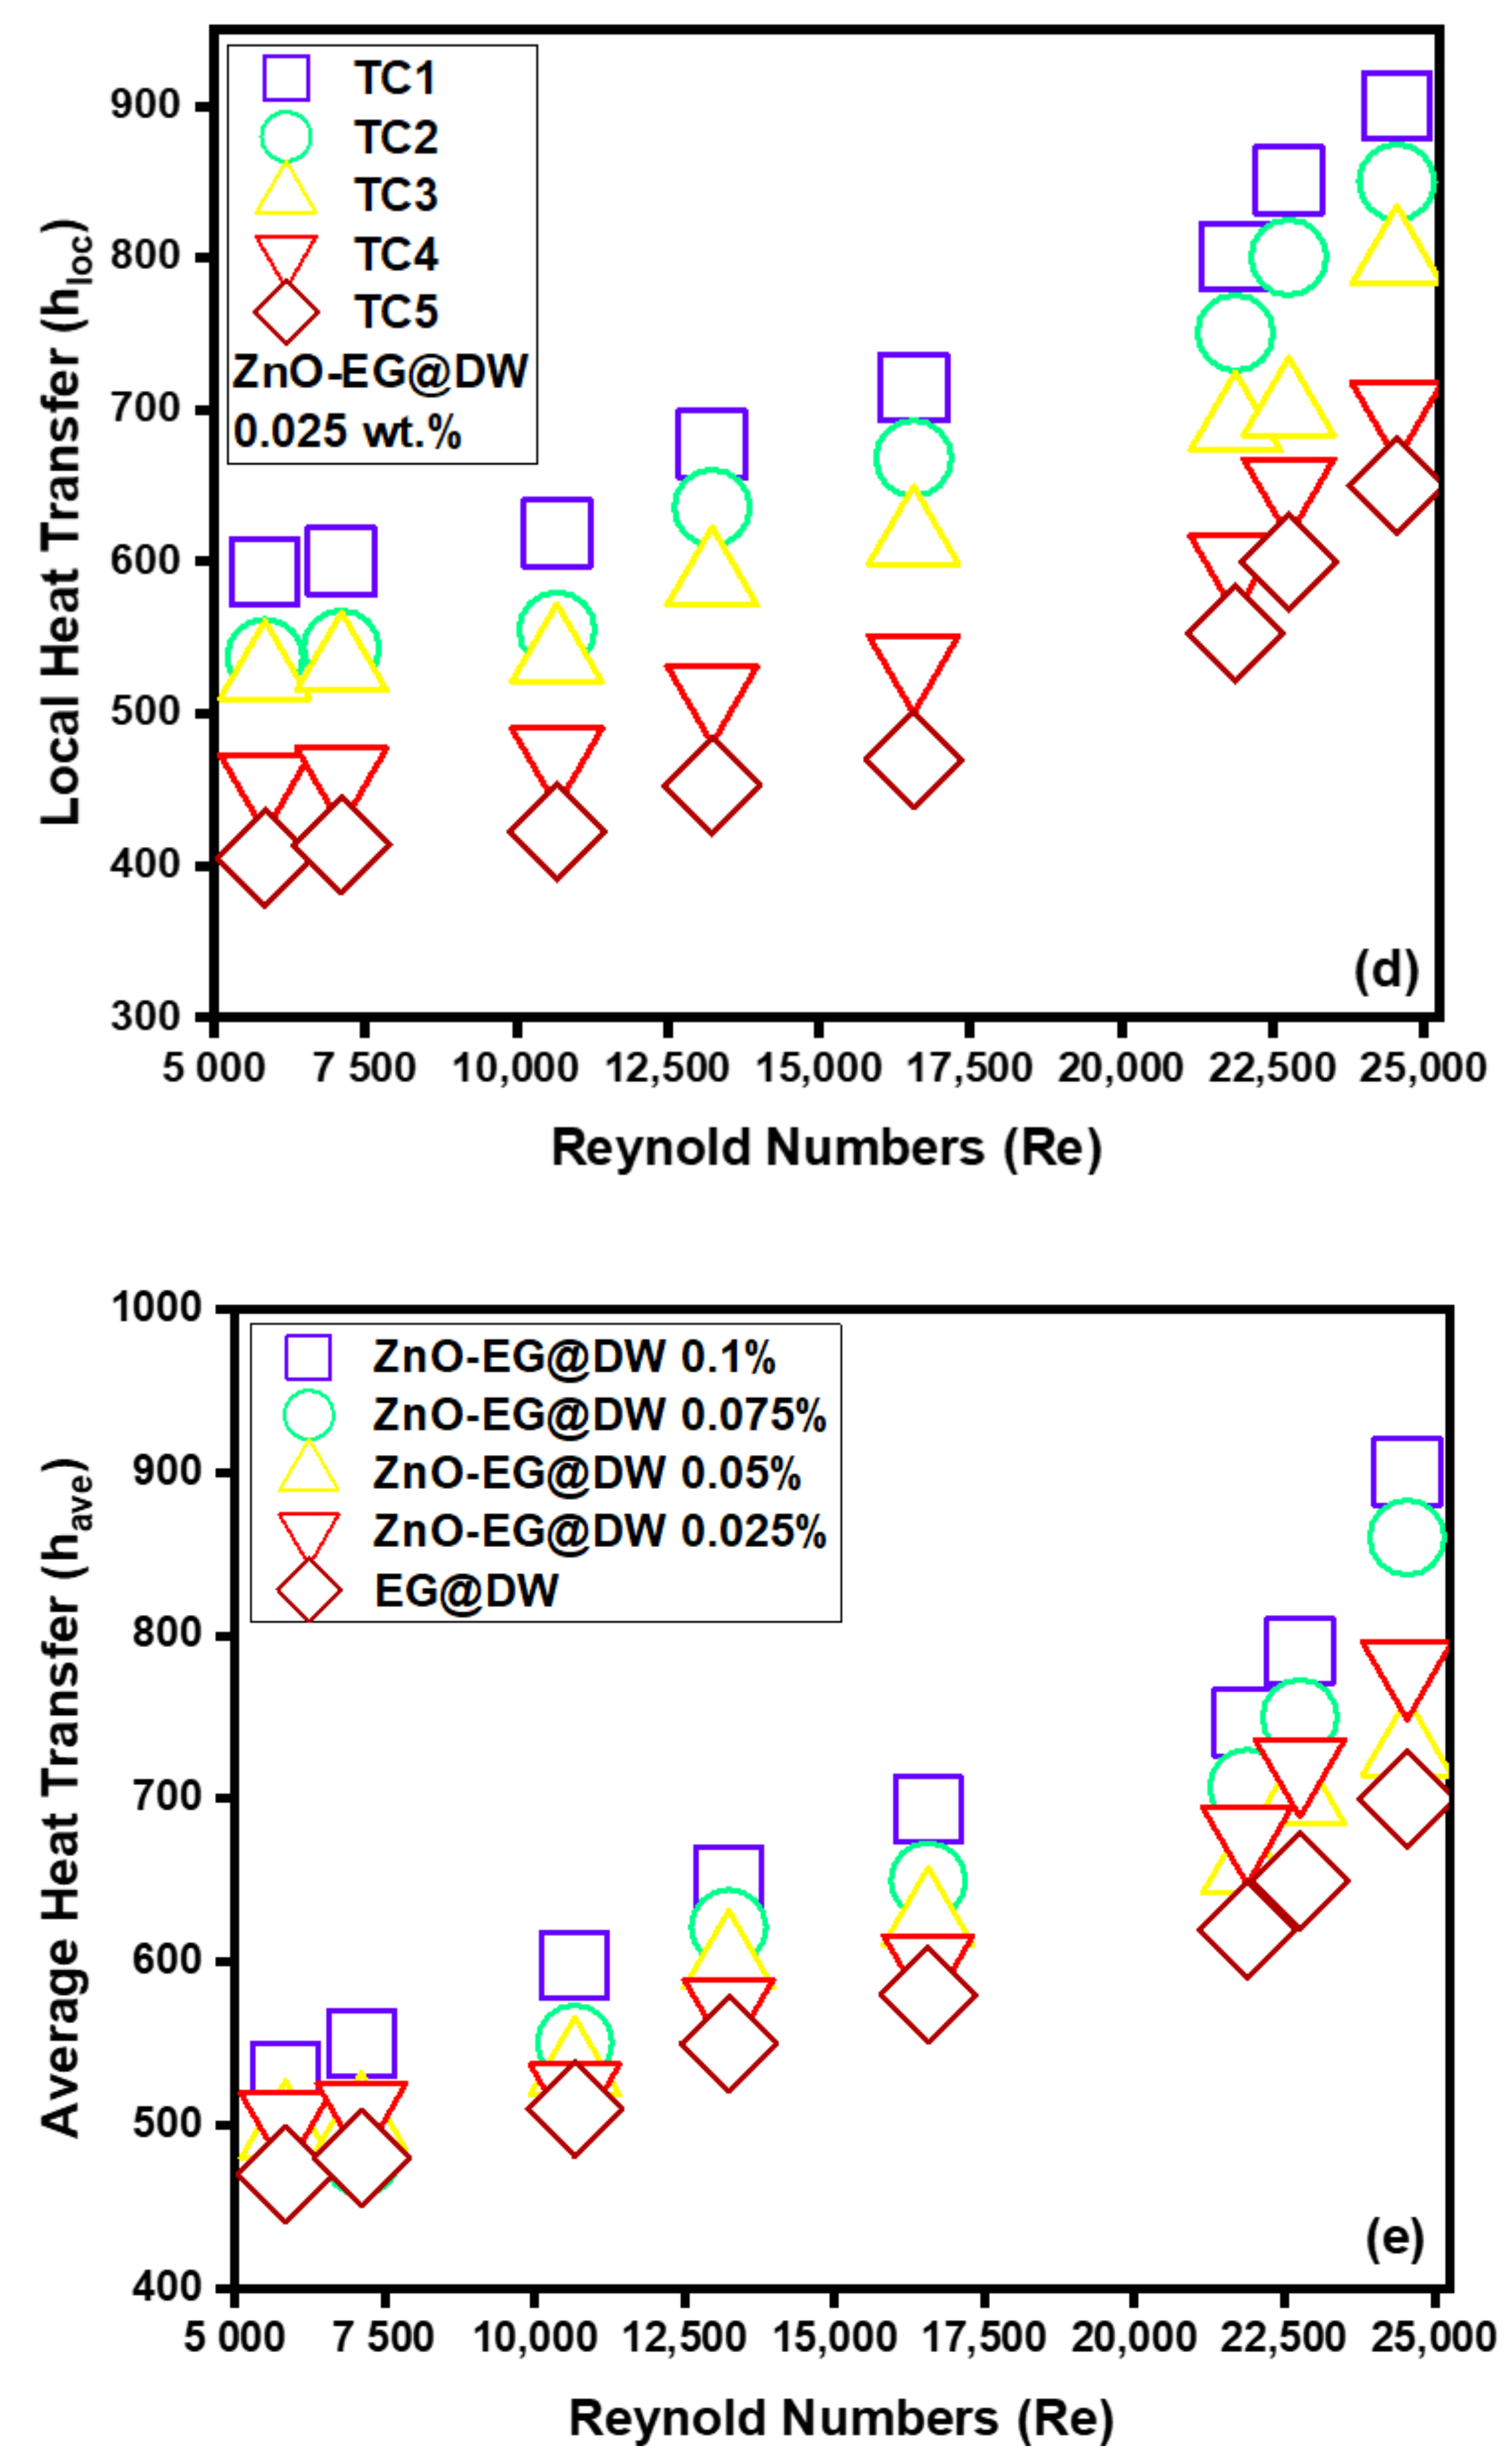
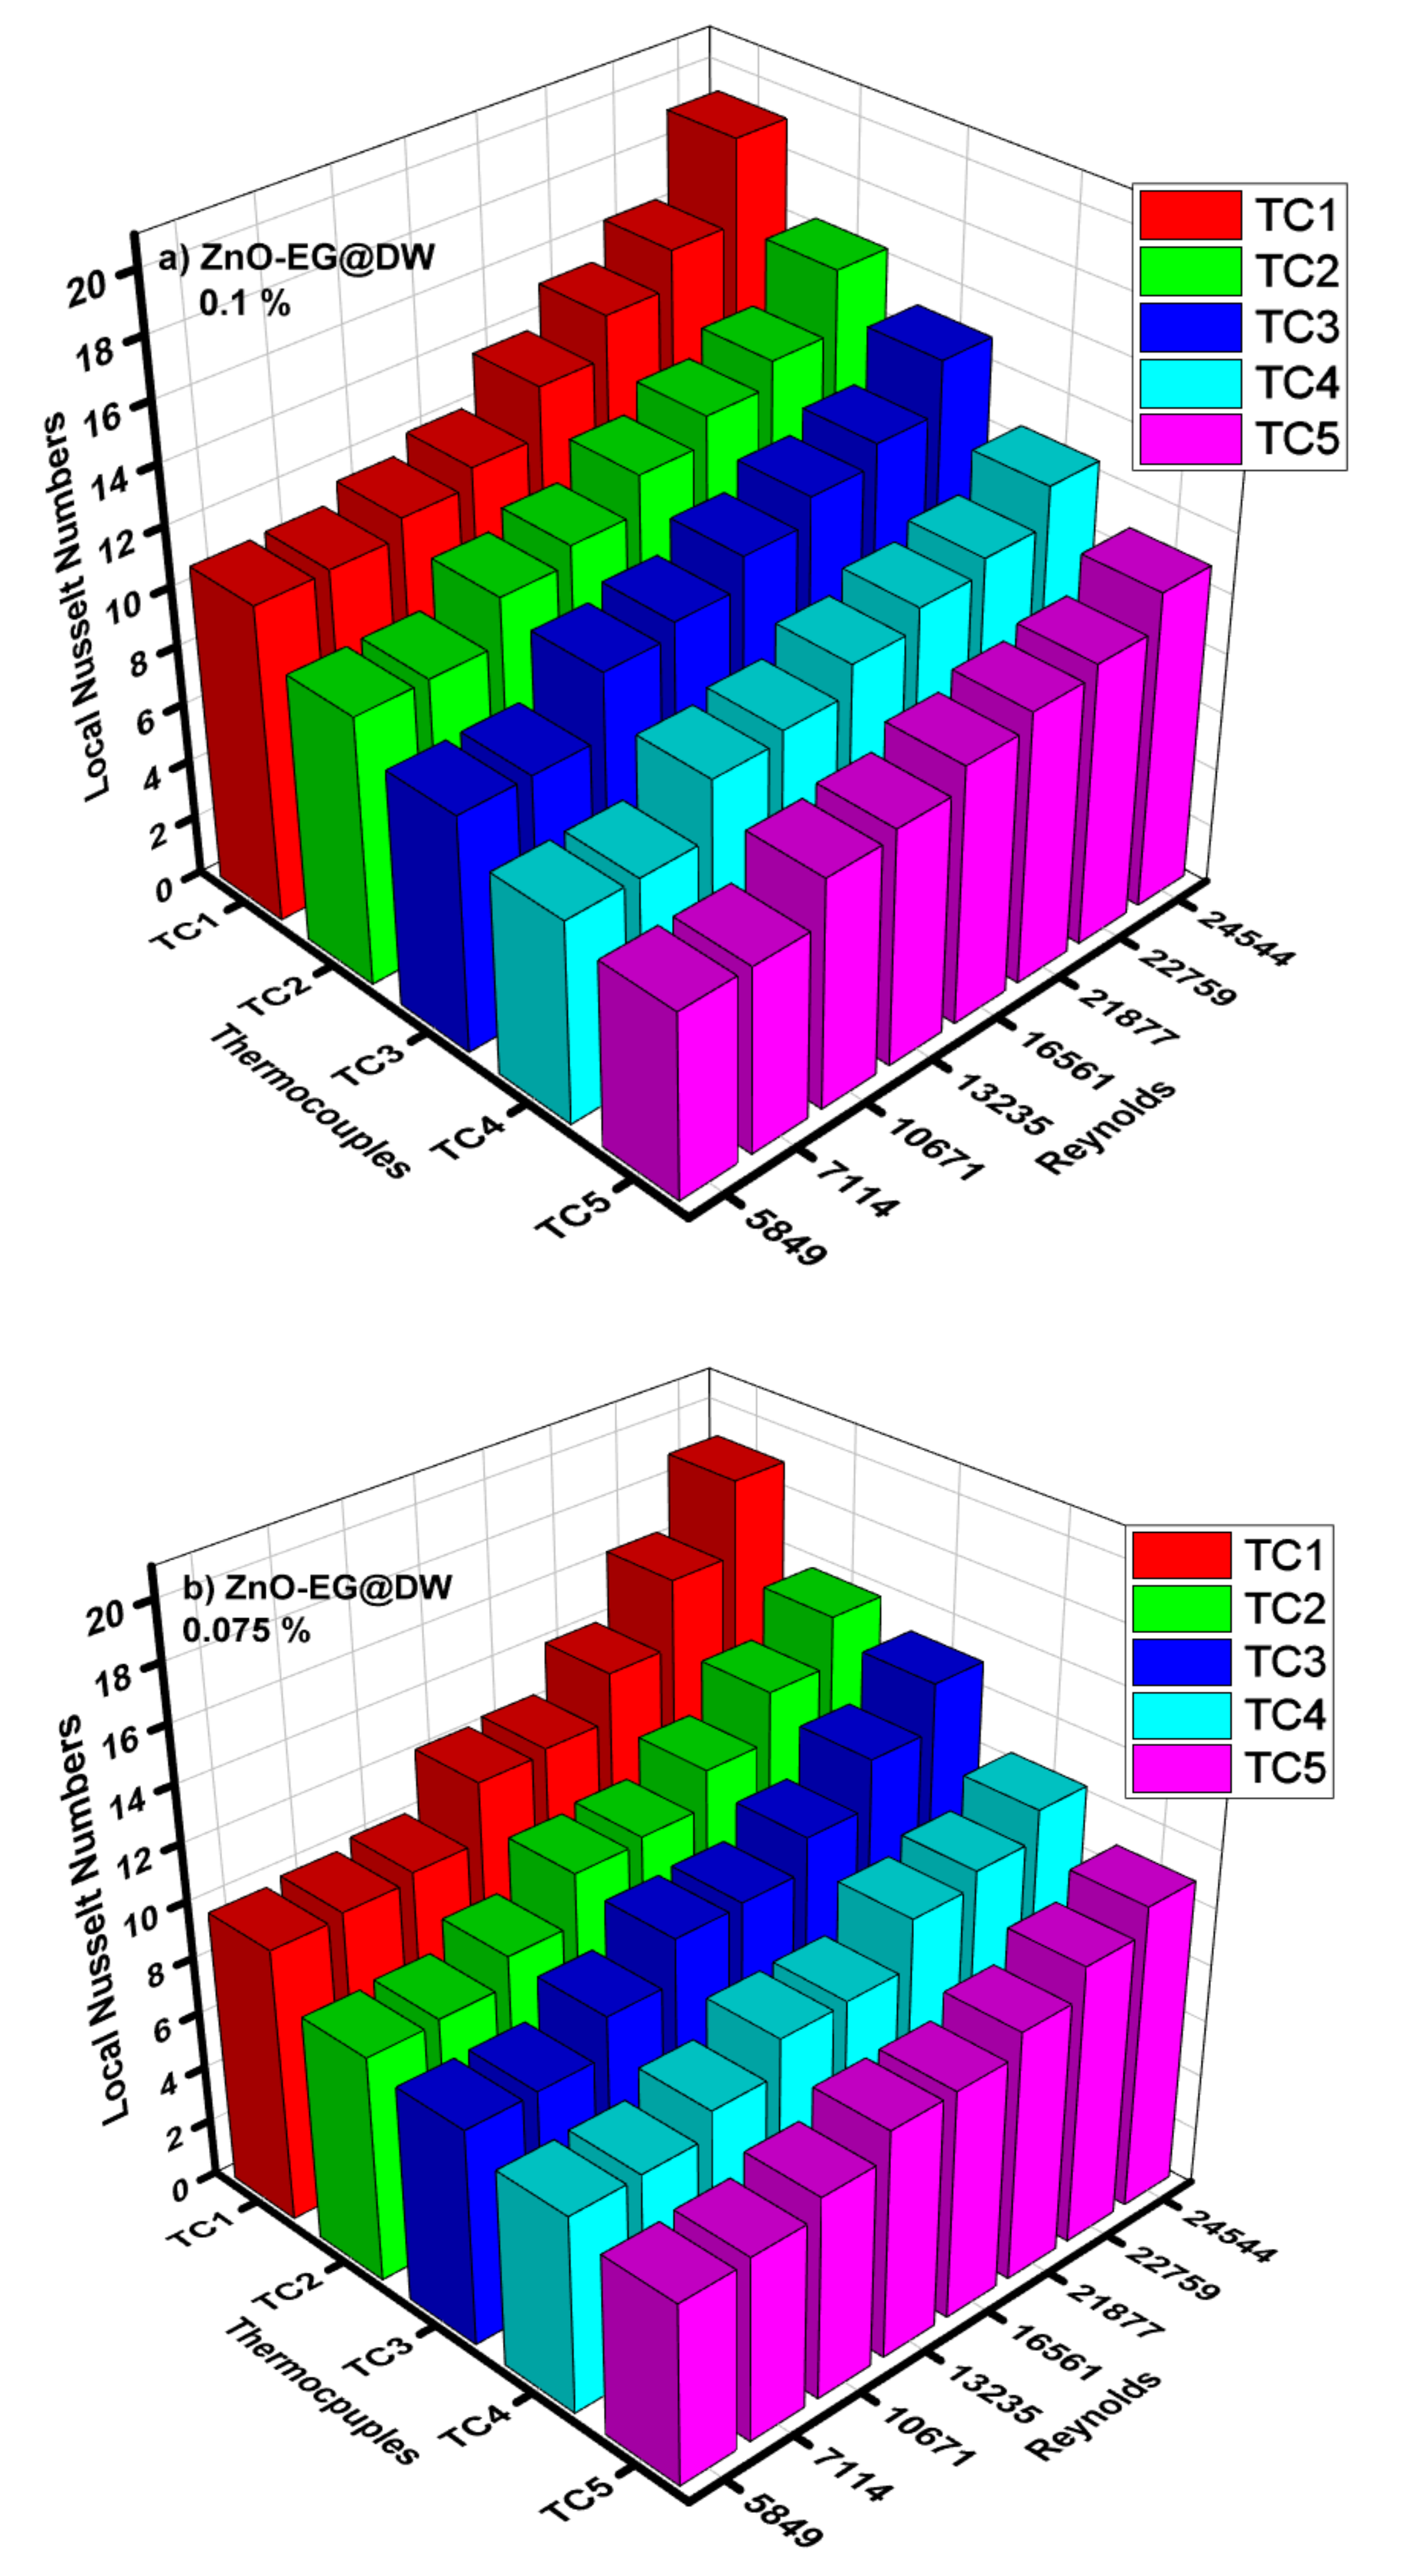
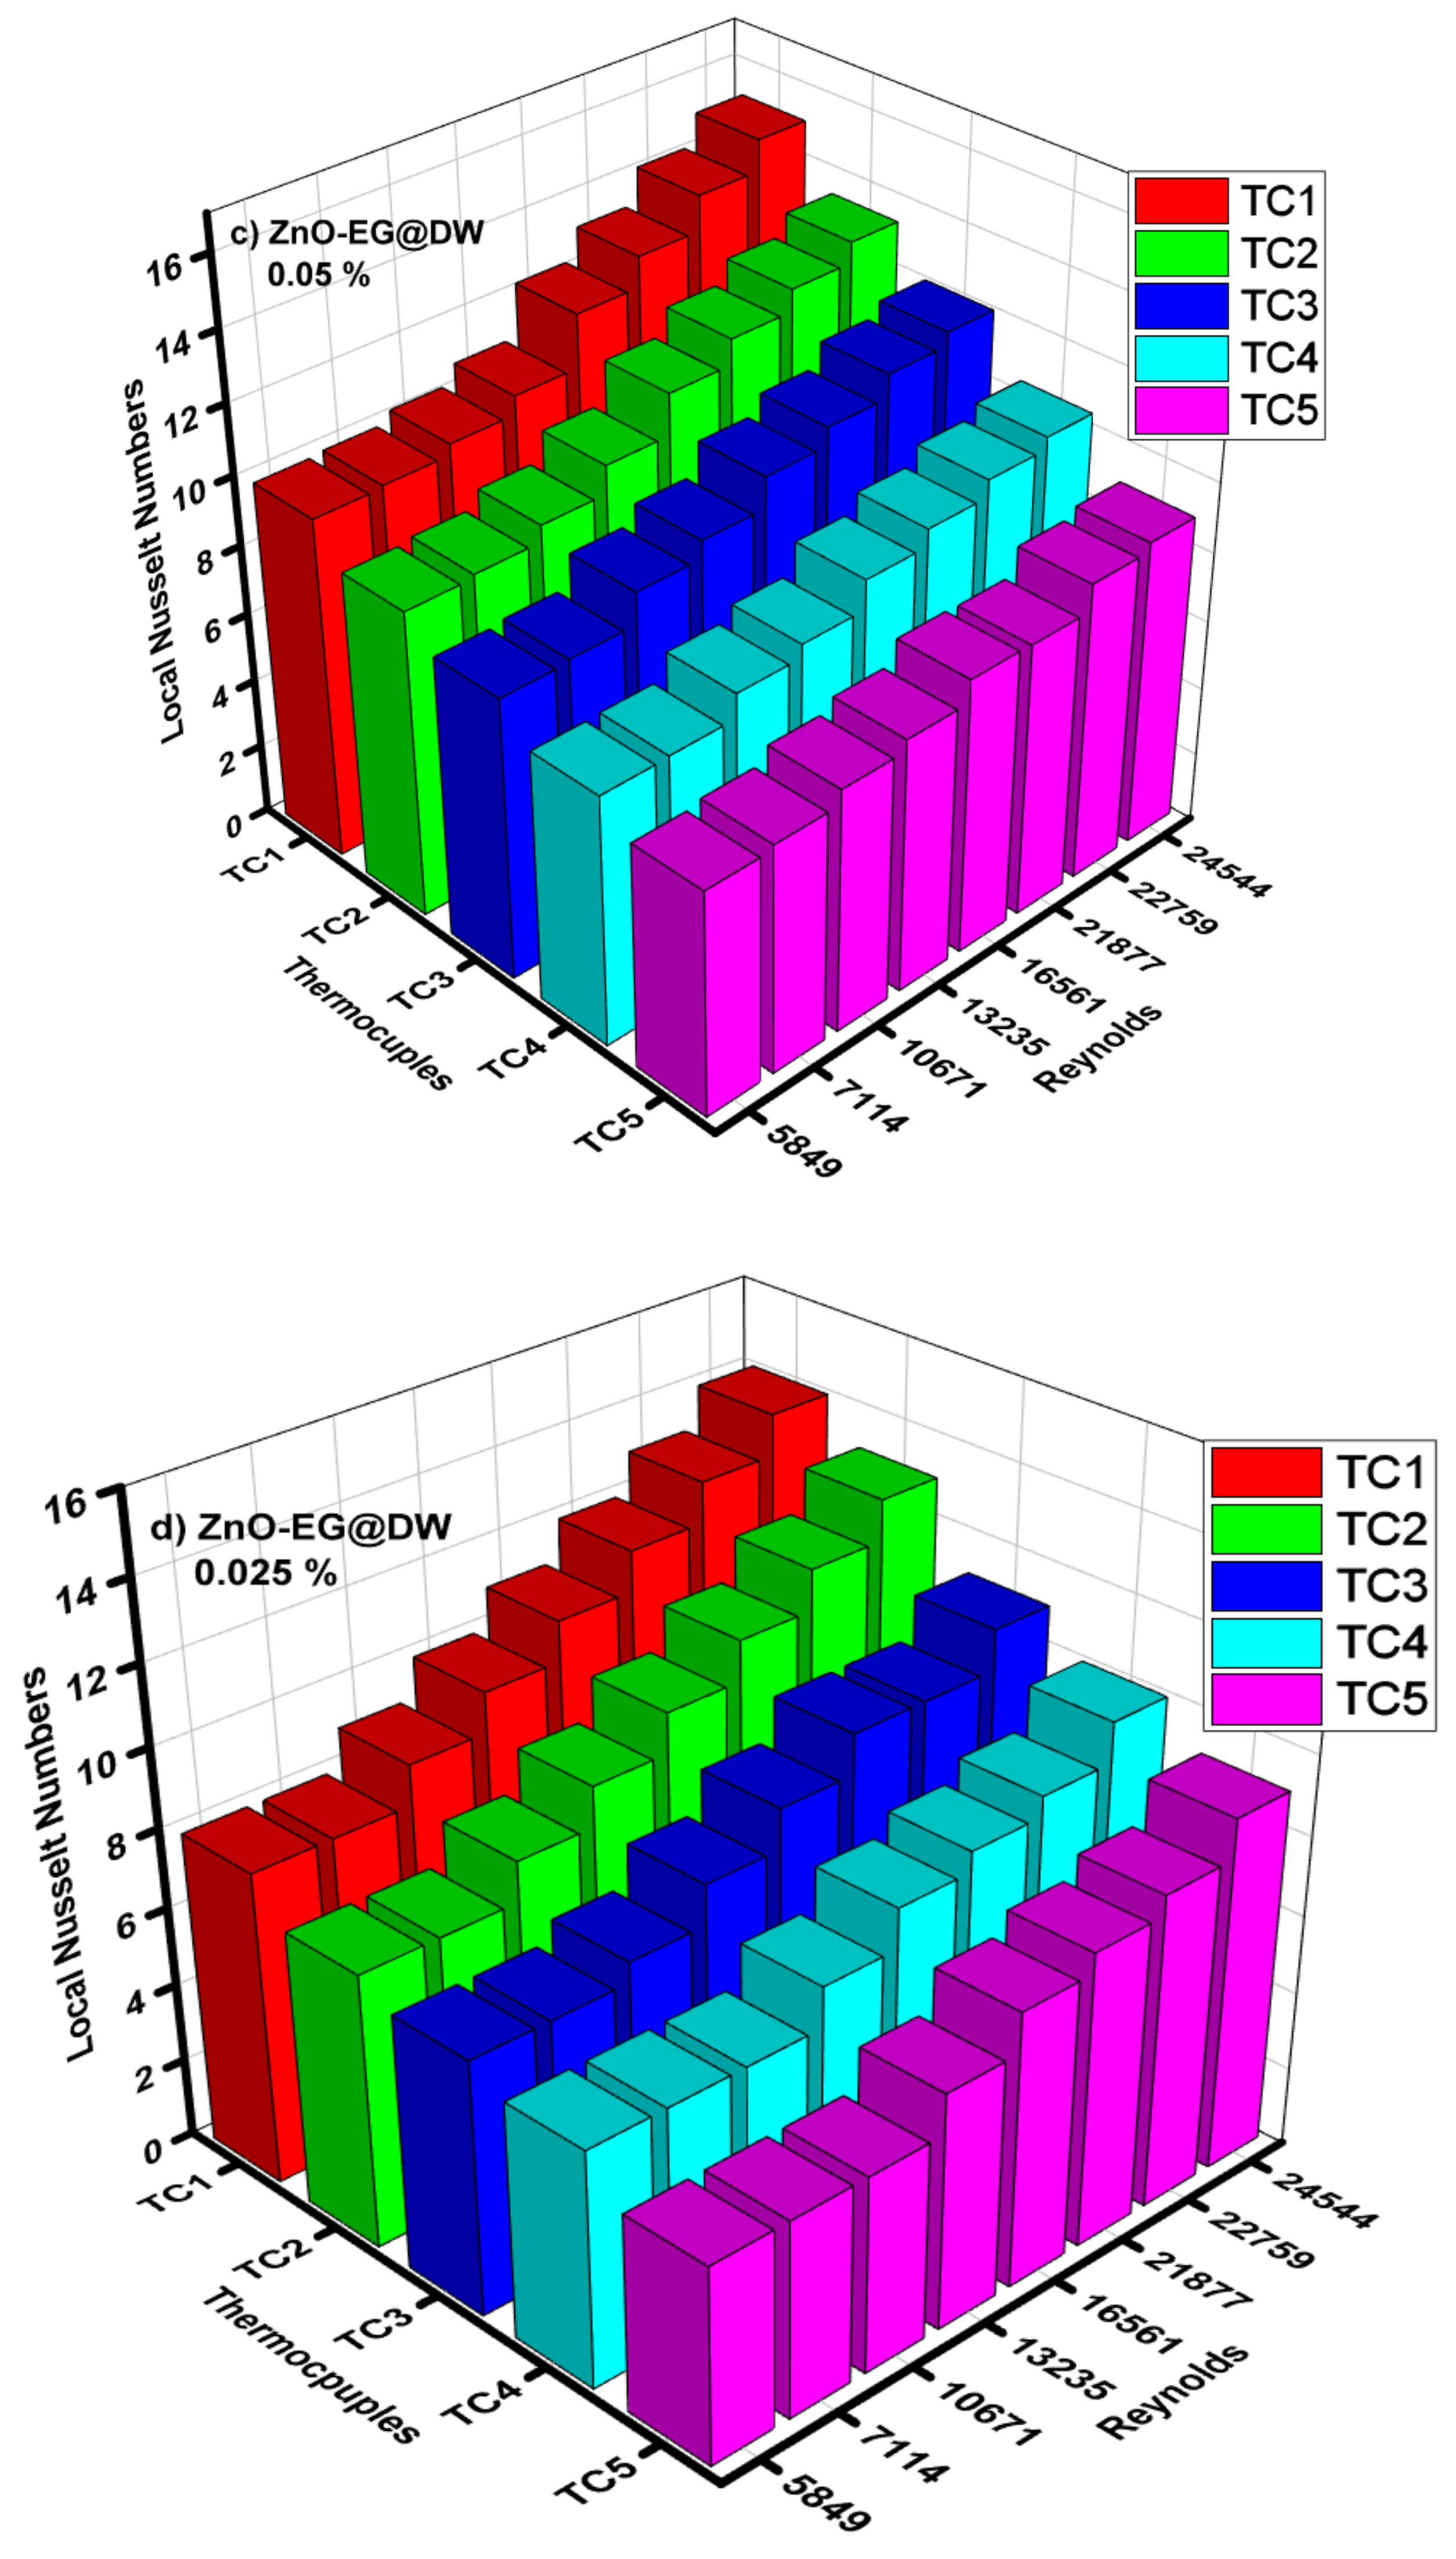
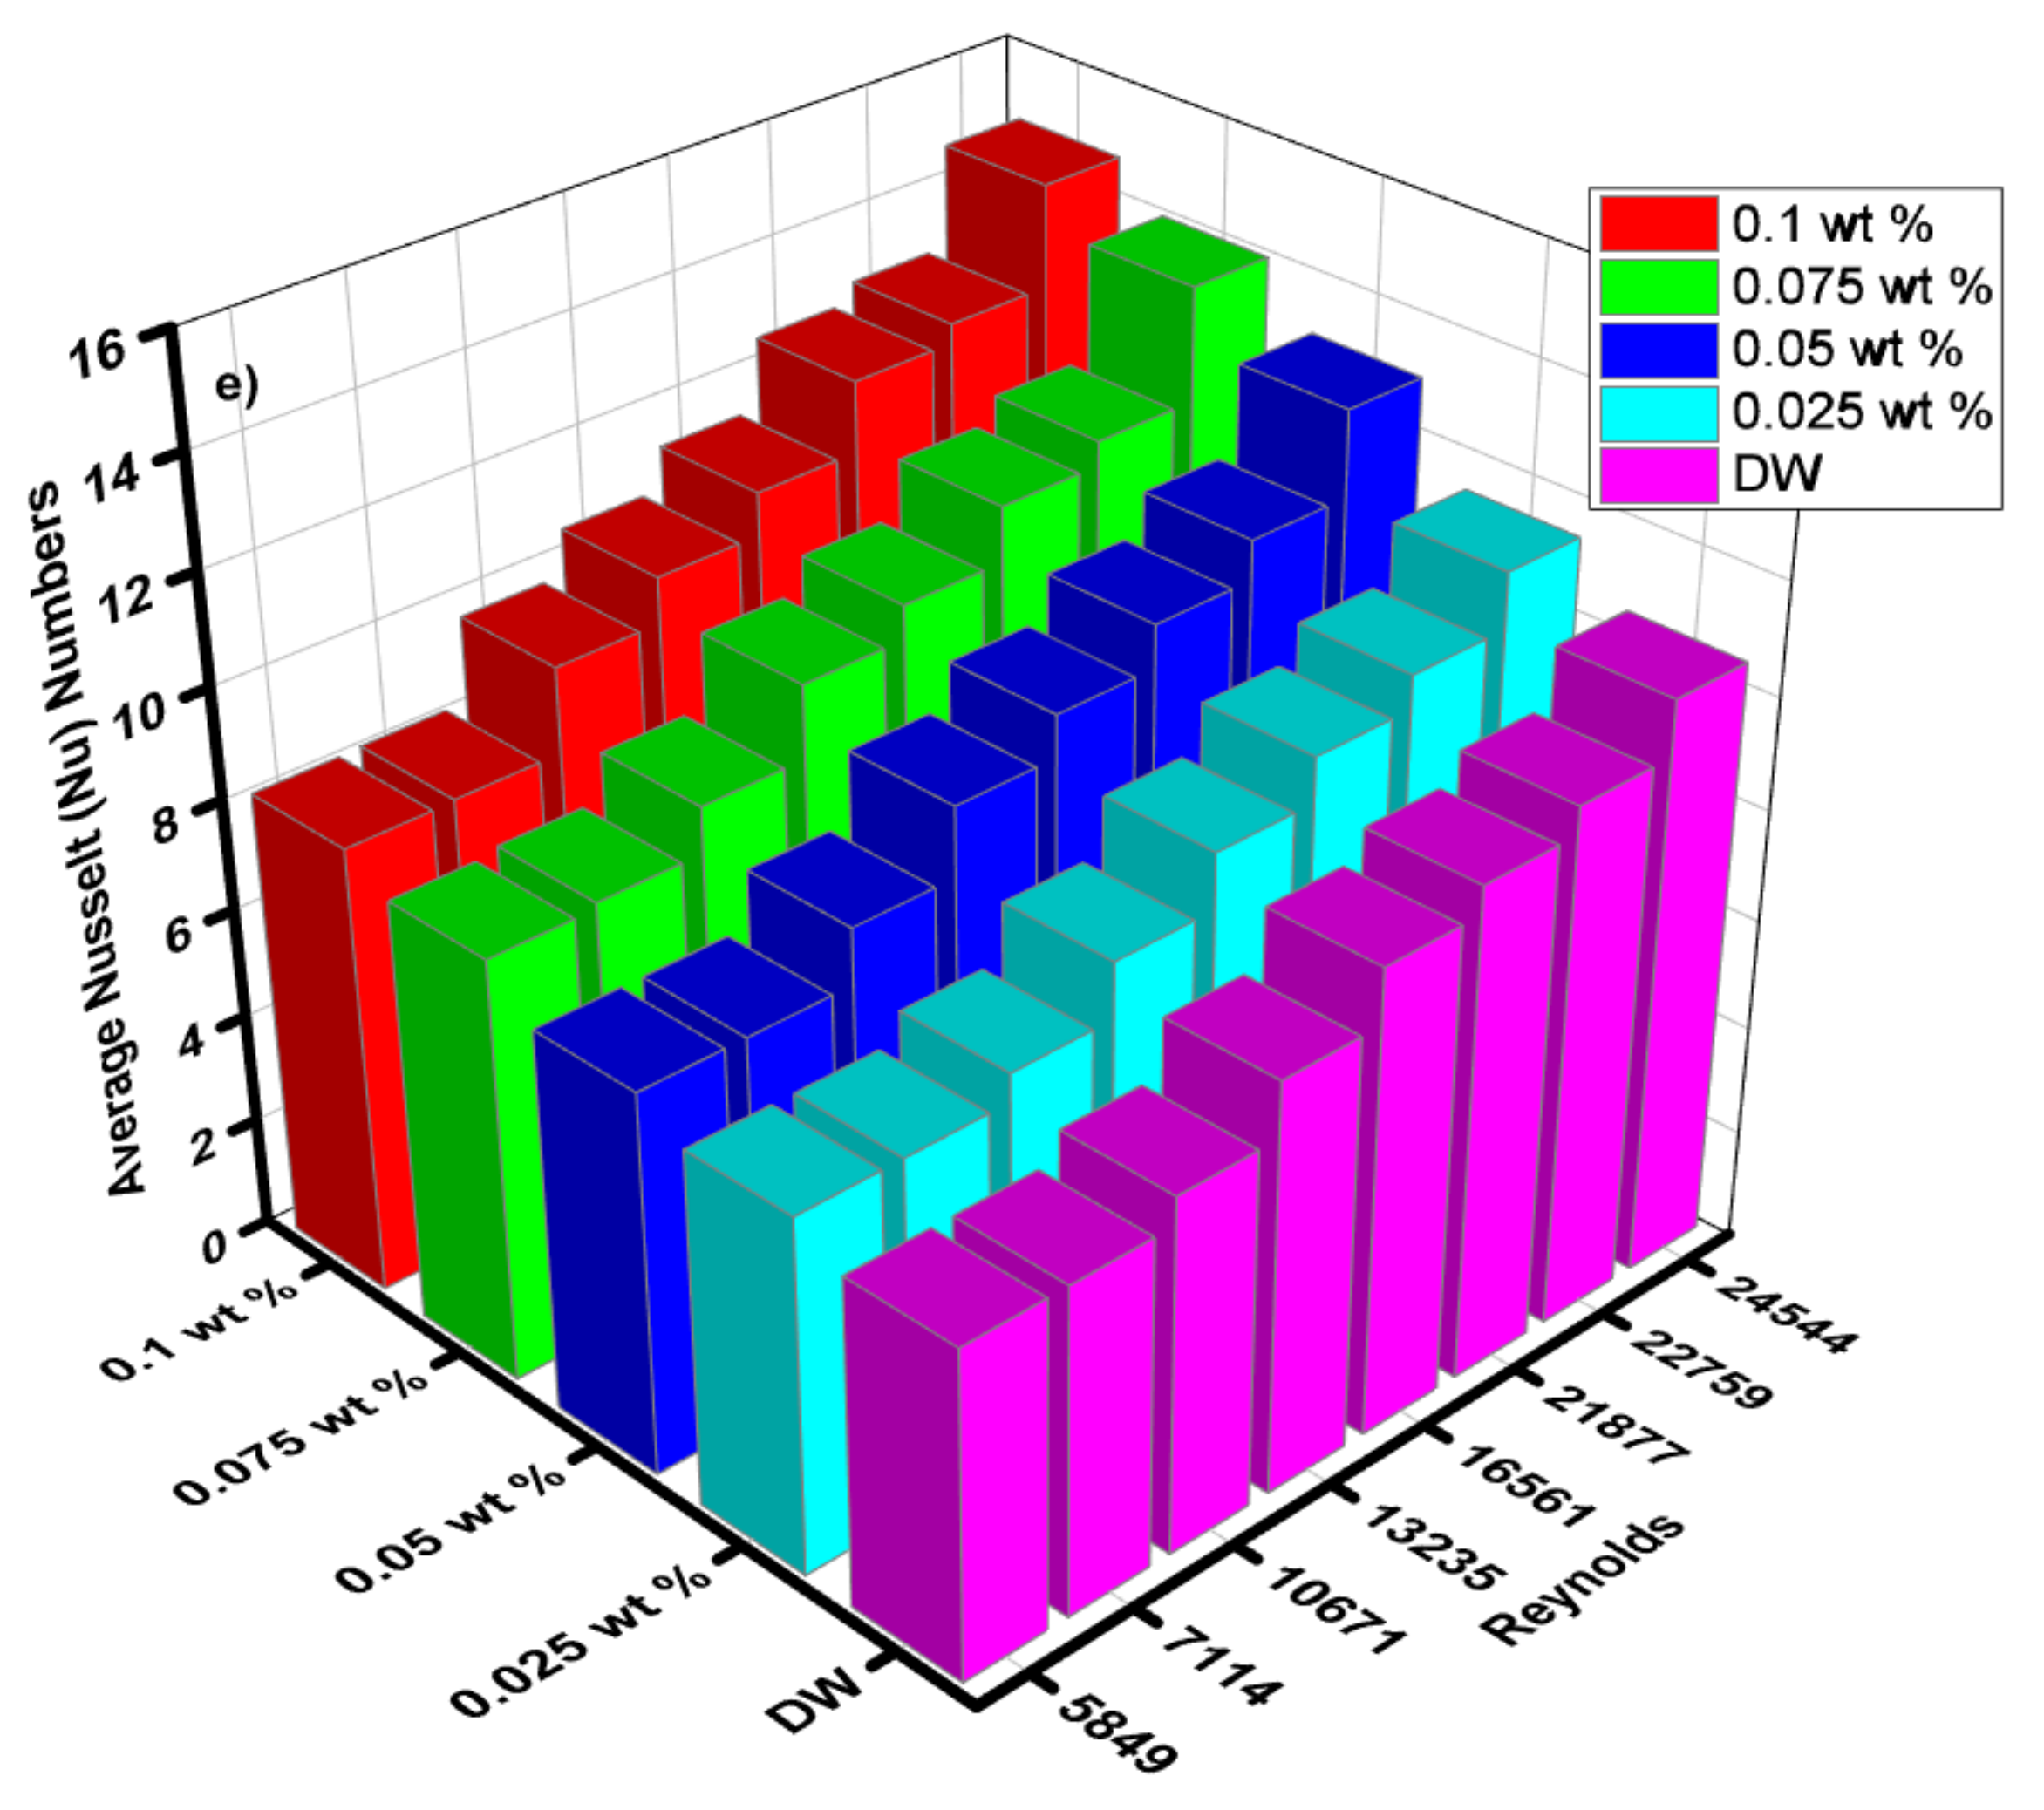
4.5. Average and Local Nusselt Numbers

Figure 14a–e illustrates the performance of local Nusselt (Nu) number against changed Reynolds (Re) number and varying 0.1, 0.075, 0.05 and 0.025 wt.% of ZnO-EG@DW nanofluids at different locations (TC1, TC2, TC3, TC4 and TC5) of the circular heat exchanger. The Nusselt (Nu) number was analyzed at each location using the values of local heat transfer, which were calculated previously. The investigational outcomes showed that the Nusselt (Nu) amplified with a rise in Reynolds (Re) for each wt.% of ZnO-EG@DW nanofluids and the heat exchanger pipe diameter was persistent. It was recorded for 0.1 wt.%. The Nusselt (Nu) number improved up to 20 with at maximum Reynolds (Re) number. The 0.075 wt.% gives the Nusselt (Nu) number elevation up to 18 with the highest Reynolds (Re) number. The 0.05 wt.% of ZnO-EG@DW nanofluids projected the Nusselt (Nu) number up to 15 with augmentation of Reynolds number. Finally, the 0.025 wt.% showed the maximum Nusselt (Nu) number augmentation up to 14 at the highest Reynolds (Re) value. The following mathematical equations are generally used to calculate the Nusselt values, friction loss, pumping power and uncertainty, etc. for all kinds of nanofluids and base fluids.
Average Nusselt (Nu) number from heat transfer (h) of varying wt.% 0.1, 0.075, 0.05 and 0.025 of ZnO-EG@DW nanofluids with variant Reynolds (Re) number is shown in Figure 14e. Equation (4) was used to evaluate Nusselt (Nu) data. It can be seen that there is a sluggish swell in Nusselt (Nu) number with a rise in Reynolds (Re) number. Additionally, the Nusselt (Nu) surges with the increase in wt.% of ZnO in the EG@DW mixture. Development of average Nusselt (Nu) of ZnO-EG@DW nanofluids is owed to its amended thermal conductivities from convection of ZnO solid particles and Brownian motion in EG@DW. Here, the augmentation of average Nu is 8–15 for 0.1 wt.%, 7–14 for 0.075 wt.%, 7–13 for 0.05 wt.% and 6.5–12 for 0.025 wt.%., agreeing to the highest Reynolds Re = 24,544.

4.6. Uncertainties in Experimental Test Setup

In the existing investigations on ZnO-EG@DW nanofluids for heat transfer calculations, the velocity, flow rates, temperatures, Reynolds (Re), pressure drop, Nusselt (Nu) and heat transfer (h) were inspected with different tools. Through the investigational quantities of given parameters, the uncertainty scrutiny is described in Table 2. Provident associated errors and parted factors represented by (xn) error valuations of dependent parameters were accomplished using Equation (14). The remaining uncertainties found for projected investigational outcomes are as specified in Table 2. The repeatability method displays that all parameters of the agreed experimental results are inside the uncertainty limitations.
W = x 1 2 + x 2 2 + + x n 2 2 .

5. Conclusions

The current study deals with the successful development of ZnO solid nanoparticles using a facile single pot sonochemical route. The cost-effective and time-saving preparation of ZnO-EG@DW well-dispersed nanofluids were achieved by a commonly used two-step technique. The heat transfer (h) improvement of varying 0.1, 0.075, 0.05 and 0.025 wt.% concentrations of ZnO-EG@DW-based nanofluids inside a single tube closed circular heat exchanger at turbulent flow regimes and uniform heat flux conditions were assessed in detail. The following essential conclusions are figured out from the stated findings.
  • ZnO solid nanoparticles synthesized by standard single-pot sonochemical technique provided ZnO nanoparticles having sizes from 12 to 19 nm. A two-step method was used to produce relevant nanofluids with four different wt.% of the ZnO nanoparticles.
  • The proper synthesis of ZnO nanoparticles was confirmed with different characterization X-ray diffraction (XRD), Fourier-transform infrared spectroscopy (FTIR), transmission electron microscopy (TEM), elements detection (EDX) mapping and UV–VIS spectrum analysis.
  • In the investigation, the ZnO-EG@DW nanofluids were varied from 0.1, 0.075, 0.05 and 0.025 wt.% concentrations, the Reynolds number ranged from 5849 to 24,544.
  • The significant thermal conductivities of ZnO-EG@DW-based nanofluids were found higher than that of the water data and further improvement was noticed with the rise of nanofluid concentrations.
  • The magnitude of the convective heat transfer (h) was enhanced from 600 to 1200 W/m2k. Nusselt (Nu) number also increased from 6 to 17 with the variation of nanoparticle concentrations. ZnO-EG@DW-based nanofluids grew Nusselt number (Nu) values from 79% as compared to the base fluid data in the specific inspected range of Reynolds number (Re).
  • Thus, the improvement in thermal conductivities and convective heat transfer (h) properties with improved Nusselt (Nu) numbers can initiate the application of the stated nanofluid as a promising choice for heat exchanging fluid for several industries and household applications.

Author Contributions

Conceptualization, W.A.; methodology, investigation and analysis; Z.Z.C., S.N.K. and M.R.B.J.; supervision, project administration and resources, I.A.B. and M.E.M.S.; reviewing and proofreading, M.A.M. and M.G.; analysis of thermophysical properties, formal analyses, review and editing, S.K. and T.M.Y.K. All authors have read and agreed to the published version of the manuscript.

Acknowledgments

The authors extend their appreciation to the Deanship of Scientific Research at King Khalid University for funding this work through a research group program under grant number R.G.P. 2/105/41. The research was also conducted under ICF 073-2019 and 17AET-RP44C under Zaira Zaman Chowdhury as principal investigator from the University of Malaya, Malaysia. In addition, the author is grateful of the following grants.
1. Project No: RU001-2020.
2. FRGS Grant FP143-2019A.

Conflicts of Interest

There is no competing conflict of interest.

Nomenclature

EGEthylene glycol
kThermal conductivity (W/m.K)
DWDistilled water
APipe inner area
ToutOutlet temperature
TinInlet temperature
CpHeat capacity for nanofluid
ZnOzinc oxide
hHeat transfer coefficient
Greek Symbols
ρFluid density (kg/m3)
µViscosity (MPa.s)
ΦPercentage volume concentration
ωPercentage of weight concentration
TsSurface outer temperature
TbBulk temperature
fFriction
VVelocity
ReReynolds numbers
ρFluid density (kg/m^3)
PPPumping power
NuNusselt numbers
Subscripts
npNanoparticles
nfNanofluid
bfBase fluid

References

  1. Dehghan, P.; Azari, A.; Azin, R. Measurement and correlation for CO2 mass diffusivity in various metal oxide nanofluids. J. Environ. Chem. Eng. 2020, 8, 103598. [Google Scholar] [CrossRef]
  2. Khanafer, K.; Vafai, K. A critical synthesis of thermophysical characteristics of nanofluids. Int. J. Heat Mass Transf. 2011, 54, 4410–4428. [Google Scholar] [CrossRef]
  3. Lynn, T.Z.; Baheta, A.T.; Akilu, S. Experimental Investigation of the Effect of Inclination Angle on Heat Pipe Thermal Performance Using Cu-Nanofluids. In Advances in Material Sciences and Engineering; Springer: Berlin/Heidelberg, Germany, 2020; pp. 445–452. [Google Scholar] [CrossRef]
  4. Umer Ilyas, S.; Pendyala, R.; Shuib, A.; Marneni, N. A review on the viscous and thermal transport properties of nanofluids. In Advanced Materials Research; Trans Tech Publications Ltd.: Baech, Switzerland, 2014; Volume 917, pp. 18–27. [Google Scholar] [CrossRef]
  5. Nagarajan, F.C.; Kannaiyan, S.; Boobalan, C. Intensification of heat transfer rate using alumina-silica nanocoolant. Int. J. Heat Mass Transf. 2020, 149, 119127. [Google Scholar] [CrossRef]
  6. Dincer, I. Renewable energy and sustainable development: A crucial review. Renew. Sustain. Energy Rev. 2000, 4, 157–175. [Google Scholar] [CrossRef]
  7. Sven, E.; Reinhard, H. Specific heat capacity enhancement studied in silica doped potassium nitrate via molecular dynamics simulation. Sci. Rep. (Nat. Publ. Group) 2019, 9. [Google Scholar] [CrossRef]
  8. Bhunia, M.M.; Das, S.; Chattopadhyay, K.K.; Chattopadhyay, P. Enhanced heat transfer properties of RGO-TiO2 based Ethylene Glycol Nanofluids. Mater. Today Proc. 2019, 18, 1096–1107. [Google Scholar] [CrossRef]
  9. Razavi, R.; Sabaghmoghadam, A.; Bemani, A.; Baghban, A.; Chau, K.W.; Salwana, E. Application of ANFIS and LSSVM strategies for estimating thermal conductivity enhancement of metal and metal oxide based nanofluids. Eng. Appl. Comput. Fluid Mech. 2019, 13, 560–578. [Google Scholar] [CrossRef]
  10. Barai, D.P.; Bhanvase, B.A.; Saharan, V.K. Reduced Graphene Oxide-Fe3O4 Nanocomposite Based Nanofluids: Study on Ultrasonic Assisted Synthesis, Thermal Conductivity, Rheology and Convective Heat Transfer. Ind. Eng. Chem. Process Des. Dev. 2019. [Google Scholar] [CrossRef]
  11. Li, Y.; Fernández-Seara, J.; Du, K.; Pardiñas, Á.Á.; Latas, L.L.; Jiang, W. Experimental investigation on heat transfer and pressure drop of ZnO/ethylene glycol-water nanofluids in transition flow. Appl. Therm. Eng. 2016, 93, 537–548. [Google Scholar] [CrossRef]
  12. Kumar, A.; Hassan, M.A.; Chand, P. Heat transport in nanofluid coolant car radiator with louvered fins. Powder Technol. 2020, 376, 631–642. [Google Scholar] [CrossRef]
  13. Radkar, R.N.; Bhanvase, B.A.; Barai, D.P.; Sonawane, S.H. Intensified convective heat transfer using ZnO nanofluids in heat exchanger with helical coiled geometry at constant wall temperature. Mater. Sci. Energy Technol. 2019, 2, 161–170. [Google Scholar] [CrossRef]
  14. Islam, R.; Shabani, B. Prediction of electrical conductivity of TiO2 water and ethylene glycol-based nanofluids for cooling application in low temperature PEM fuel cells. Energy Procedia 2019, 160, 550–557. [Google Scholar] [CrossRef]
  15. Li, H.; Wang, L.; He, Y.; Hu, Y.; Zhu, J.; Jiang, B. Experimental investigation of thermal conductivity and viscosity of ethylene glycol based ZnO nanofluids. Appl. Therm. Eng. 2015, 88, 363–368. [Google Scholar] [CrossRef]
  16. Chaurasia, P.; Kumar, A.; Yadav, A.; Rai, P.K.; Kumar, V.; Prasad, L. Heat transfer augmentation in automobile radiator using Al2O3–water based nanofluid. SN Appl. Sci. 2019, 1, 257. [Google Scholar] [CrossRef] [Green Version]
  17. Pastoriza-Gallego, M.J.; Lugo, L.; Legido, J.L.; Piñeiro, M.M. Thermal conductivity and viscosity measurements of ethylene glycol-based Al2O3 nanofluids. Nanoscale Res. Lett. 2011, 6, 221. [Google Scholar] [CrossRef] [PubMed] [Green Version]
  18. Vasheghani, M.; Marzbanrad, E.; Zamani, C.; Aminy, M.; Raissi, B. Thermal Conductivity and Viscosity of TiO2–Engine Oil Nanofluids. Nanosci. Technol. Int. J. 2013, 4. [Google Scholar] [CrossRef]
  19. Yu, W.; Xie, H.; Chen, L.; Li, Y. Investigation of thermal conductivity and viscosity of ethylene glycol based ZnO nanofluid. Thermochim. Acta 2009, 491, 92–96. [Google Scholar] [CrossRef]
  20. Zhu, D.; Wang, L.; Yu, W.; Xie, H. Intriguingly high thermal conductivity increment for CuO nanowires contained nanofluids with low viscosity. Sci. Rep. 2018, 8, 1–12. [Google Scholar] [CrossRef] [Green Version]
  21. Sun, B.; Yang, A.; Yang, D. Experimental study on the heat transfer and flow characteristics of nanofluids in the built-in twisted belt external thread tubes. Int. J. Heat Mass Transf. 2017, 107, 712–722. [Google Scholar] [CrossRef]
  22. Sun, B.; Zhang, Z.; Yang, D. Improved heat transfer and flow resistance achieved with drag reducing Cu nanofluids in the horizontal tube and built-in twisted belt tubes. Int. J. Heat Mass Transf. 2016, 95, 69–82. [Google Scholar] [CrossRef]
  23. Yang, J.C.; Li, F.C.; He, Y.R.; Huang, Y.M.; Jiang, B.C. Experimental study on the characteristics of heat transfer and flow resistance in turbulent pipe flows of viscoelastic-fluid-based Cu nanofluid. Int. J. Heat Mass Transf. 2013, 62, 303–313. [Google Scholar] [CrossRef]
  24. Poongavanam, G.K.; Kumar, B.; Duraisamy, S.; Panchabikesan, K.; Ramalingam, V. Heat transfer and pressure drop performance of solar glycol/activated carbon based nanofluids in shot peened double pipe heat exchanger. Renew. Energy 2019, 140, 580–591. [Google Scholar] [CrossRef]
  25. Wang, X.; Yan, X.; Gao, N.; Chen, G. Prediction of thermal conductivity of various nanofluids with ethylene glycol using artificial neural network. J. Therm. Sci. 2019, 1–9. [Google Scholar] [CrossRef]
  26. Das, S.K.; Putra, N.; Thiesen, P.; Roetzel, W. Temperature dependence of thermal conductivity enhancement for nanofluids. J. Heat Transf. 2003, 125, 567–574. [Google Scholar] [CrossRef]
  27. Motevasel, M.; Nazar, A.R.S.; Jamialahmadi, M. Experimental study on turbulent convective heat transfer of water-based nanofluids containing alumina, copper oxides and silicon carbide nanoparticles. J. Therm. Anal. Calorim. 2019, 135, 133–143. [Google Scholar] [CrossRef]
  28. Zing, C.; Mahjoob, S.; Vafai, K. Analysis of porous filled heat exchangers for electronic cooling. Int. J. Heat Mass Transf. 2019, 133, 268–276. [Google Scholar] [CrossRef]
  29. Xie, H.Q.; Wang, J.C.; Xi, T.G.; Liu, Y. Thermal conductivity of suspensions containing nanosized SiC particles. Int. J. Thermophys. 2002, 23, 571–580. [Google Scholar] [CrossRef]
  30. Kherbeet, A.S.; Mohammed, H.A.; Salman, B.H. The effect of nanofluids flow on mixed convection heat transfer over microscale backward-facing step. Int. J. Heat Mass Transf. 2012, 55, 5870–5881. [Google Scholar] [CrossRef]
  31. Teng, T.P.; Hsiao, T.C.; Chung, C.C. Characteristics of carbon-based nanofluids and their application in a brazed plate heat exchanger under laminar flow. Appl. Therm. Eng. 2019, 146, 160–168. [Google Scholar] [CrossRef]
  32. Suganthi, K.S.; Rajan, K.S. ZnO propylene glycol water nanofluids with improved properties for potential applications in renewable energy and thermal management. Coll. Surf. Physicochem. Eng. Asp. 2016, 506, 63–73. [Google Scholar] [CrossRef]
  33. Hilo, A.; Talib, A.A.; Nfawa, S.R.; Sultan, M.H.; Hamid, M.F.A.; Bheekhun, M.N. Heat transfer and thermal conductivity enhancement using graphene nanofluid: A review. J. Adv. Res. Fluid Mech. Therm. Sci. 2019, 55, 74–87. [Google Scholar]
  34. Krishnakumar, T.S.; Sheeba, A.; Mahesh, V.; Prakash, M.J. Heat transfer studies on ethylene glycol/water nanofluid containing TiO2 nanoparticles. Int. J. Refrig. 2019, 102, 55–61. [Google Scholar] [CrossRef]
  35. Bao, Y.; Gao, L.; Feng, C.; Ma, J.; Zhang, W.; Liu, C.; Simion, D. Sonochemical synthesis of flower-like ZnO assembled by hollow cones toward water vapor permeability and water resistance enhancement of waterborne film. J. Ind. Eng. Chem. 2020, 82, 180–189. [Google Scholar] [CrossRef]
  36. Noman, M.T.; Petru, M.; Militký, J.; Azeem, M.; Ashraf, M.A. One-Pot Sonochemical Synthesis of ZnO Nanoparticles for Photocatalytic Applications, Modelling and Optimization. Materials 2020, 13, 14. [Google Scholar] [CrossRef] [Green Version]
  37. Shaikshavali, P.; Reddy, T.M.; Gopal, T.V.; Venkataprasad, G.; Kotakadi, V.S.; Palakollu, V.N.; Karpoormath, R. A simple sonochemical assisted synthesis of nanocomposite (ZnO/MWCNTs) for electrochemical sensing of Epinephrine in human serum and pharmaceutical formulation. Coll. Surf. Physicochem. Eng. Asp. 2020, 584, 124038. [Google Scholar] [CrossRef]
  38. Ahmed, W.; Chowdhury, Z.Z.; Kazi, S.N.; Johan, M.R.; Akram, N.; Oon, C.S. Effect of ZnO-water based nanofluids from sonochemical synthesis method on heat transfer in a circular flow passage. Int. Commun. Heat Mass Transf. 2020, 114, 104591. [Google Scholar] [CrossRef]
  39. Ahmed, W.; Chowdhury, Z.Z.; Kazi, S.N.; Johan, M.R.; Akram, N.; Oon, C.S.; Abdelrazek, A.H. Characteristics investigation on heat transfer growth of sonochemically synthesized ZnO-DW based nanofluids inside square heat exchanger. J. Therm. Anal. Calorim. 2020, 1–18. [Google Scholar] [CrossRef]
  40. Ahmed, W.; Kazi, S.N.; Chowdhury, Z.Z.; Johan, M.R. One-pot sonochemical synthesis route for the synthesis of ZnO@ TiO 2/DW hybrid/composite nanofluid for enhancement of heat transfer in a square heat exchanger. J. Therm. Anal. Calorim. 2020, 1–17. [Google Scholar] [CrossRef]
  41. Ahmed, W.; Kazi, S.N.; Chowdhury, Z.Z.; Johan, M.R.B.; Akram, N.; Mujtaba, M.A.; Gul, M.; Oon, C.S. Experimental investigation of convective heat transfer growth on ZnO@ TiO 2/DW binary composites/hybrid nanofluids in a circular heat exchanger. J. Therm. Anal. Calorim. 2020, 1–20. [Google Scholar] [CrossRef]
  42. Fernandez-Seara, J.; Uhía, F.J.; Sieres, J.; Campo, A. A general review of the Wilson plot method and its modifications to determine convection coefficients in heat exchange devices. Appl. Therm. Eng. 2007, 27, 2745–2757. [Google Scholar] [CrossRef] [Green Version]
  43. Mansour, R.B.; Galanis, N.; Nguyen, C.T. Effect of uncertainties in physical properties on forced convection heat transfer with nanofluids. Appl. Therm. Eng. 2007, 27, 240–249. [Google Scholar] [CrossRef]
  44. Batchelor, G.K. The effect of Brownian motion on the bulk stress in a suspension of spherical particles. J. Fluid Mech. 1977, 83, 97–117. [Google Scholar] [CrossRef]
  45. Corcione, M. Empirical correlating equations for predicting the effective thermal conductivity and dynamic viscosity of nanofluids. Energy Convers. Manag. 2011, 52, 789–793. [Google Scholar] [CrossRef]
  46. Gnielinski, V. New equations for heat and mass transfer in the turbulent flow in pipes and channels. STIA 1975, 41, 8–16. [Google Scholar]
  47. Petukhov, B.S. Heat transfer and friction in turbulent pipe flow with variable physical properties. Adv. Heat Transf. 1970, 6, i565. [Google Scholar]
Figure 1. One-pot facile synthesis of ZnO nanoparticles and preparation of ZnO-EG@DW-based nanofluids with different wt.% (0.1, 0.075, 0.05 and 0.025) of ZnO.
Energies 14 02400 g001
Figure 2. The 2-D geometric model of the circular heat exchanger.
Energies 14 02400 g002
Figure 3. Experimental setup of a heat transfer test rig for studying heat transfer and friction loss.
Energies 14 02400 g003
Figure 4. Confirmation of sonochemically synthesized ZnO by UV–VIS spectrum.
Energies 14 02400 g004
Figure 5. Absorption profile of ZnO-EG@DW nanofluids and their changed 0.1, 0.075, 0.05 and 0.025 wt.%.
Energies 14 02400 g005
Figure 6. XRD spectrum analysis for sonochemically synthesized ZnO.
Energies 14 02400 g006
Figure 7. FTIR spectra confirmation of ZnO.
Energies 14 02400 g007
Figure 8. ZnO nanoparticles size and morphology confirmation using TEM.
Energies 14 02400 g008
Figure 9. Stability and dispersion of ZnO nanoparticles at different concentrations for 12 weeks.
Energies 14 02400 g009
Figure 10. Sedimentation analysis of ZnO-EG@DW nanofluids with different wt.% of ZnO in EG@DW base fluid.
Energies 14 02400 g010
Figure 11. (a) Variations in relative pumping power for all concentrations of ZnO-EG@DW nanofluids and (b) friction loss during experimental.
Energies 14 02400 g011
Figure 12. (a) Variations in thermal conductivities of ZnO-EG@DW-based nanofluids against temperature at different wt.% of ZnO and (b) viscosity ratio for each of the concentrations at 35 °C.
Energies 14 02400 g012aEnergies 14 02400 g012b
Figure 13. (a) Local heat transfer for 0.1 wt.%, (b) local heat transfer for 0.075 wt.%, (c) local heat transfer for 0.05 wt.%, (d) local heat transfer for 0.025 wt.% and (e) average Heat transfer for each wt.% of ZnO-EG@DW nanofluids and EG@DW at Reynolds number 5849 to 24,544.
Energies 14 02400 g013aEnergies 14 02400 g013b
Figure 14. (a) Local Nusselt numbers for 0.1 wt.%, (b) local Nusselt numbers for 0.075 wt.%, (c) local Nusselt numbers for 0.05 wt.%, (d) local Nusselt numbers for 0.025 wt.% and (e) average Nusselt (Nu) for each of wt.% and EG@DW at Reynolds (Re) numbers 5849–24,544.
Energies 14 02400 g014aEnergies 14 02400 g014bEnergies 14 02400 g014c
Table 1. Sequential data table for ZnO-EG@DW nanofluids at different concentrations.
S. Nowt.% ConcentrationBase Fluid in LiterDW in LiterEG in LiterNanoparticles in Grams
10.173.53.57
20.07573.53.55.25
30.0573.53.53.5
40.02573.53.51.75
Table 2. Uncertainties of varying parameters of the experimental test rig.
S. NoParametersSymbolsUncertainty %
1NF inlet temperatureTin±0.141
2NF outlet temperatureTout±0.141
3Ambient temperatureTe±0.140
4NF mass flow ratev±1.92
5NF differential pressurehh±2.22
6NF thermal conductivityknf±4.42
7NF viscosity measurementµnf±3.6
8NF specific heat measurementCpnf±4.21
9VoltageV± 0.15
10CurrentI± 0.152
11Heat fluxQ± 0.15
12PowerP± 0.151
13Reynolds numbersRe± 4.2
14Convective heat transferh± 3.33
15Nusselt numbersNu± 4.31
16Pumping powerPP± 4.37
Publisher’s Note: MDPI stays neutral with regard to jurisdictional claims in published maps and institutional affiliations.

