Article

Experimental Study of Absorbent Hygiene Product Devolatilization in a Bubbling Fluidized Bed

Department of Industrial and Information Engineering and Economics (DIIIE), University of L’Aquila, Piazzale E. Pontieri 1-loc. Monteluco di Roio, 67100 L’Aquila, Italy
*
Author to whom correspondence should be addressed.
Energies 2021, 14(9), 2399; https://doi.org/10.3390/en14092399
Submission received: 7 April 2021 / Revised: 18 April 2021 / Accepted: 20 April 2021 / Published: 23 April 2021
(This article belongs to the Special Issue Advanced Technologies for Biomass)

Abstract

:
This paper aims to investigate the usage of waste from Absorbent Hygienic Products (AHP) as a fuel for gasification or pyrolysis, two attractive routes to obtain valuable products and dispose of this kind of waste. The study experimentally investigated the devolatilization of coarsely shredded materials from diapers, in a laboratory-scale bubbling fluidized bed made of sand, as a representative preparatory step of the above-mentioned thermochemical conversions. Two versions of shredded materials were considered: as-manufactured diapers (AHPam, as a reference), and the cellulosic fraction of sterilized used diapers (AHPus). Results were presented, obtained from physical-chemical characterization of AHPam and AHPus (TGA, CHNS/O, proximate and ultimate analyses, XRF, ICP-AES, SEM-EDS), as well as from their devolatilizations at 500–600–700–800 °C under two different atmospheres (air plus nitrogen, or pure nitrogen as a reference). Generally, temperature influenced syngas composition the most, with better performances under pure nitrogen. At 700–800 °C under pure nitrogen, the highest syngas quality and yield were obtained. For AHPam and AHPus, respectively: (i) H2 equaled 29.5 vol% and 23.7 vol%, while hydrocarbons equaled 14.8 vol% and 7.4 vol% on dry, dilution-free basis; (ii) 53.7 Nl and 46.0 Nl of syngas were produced, per 100 g of fuel. Overall, AHP emerged as an interesting fuel for thermochemical conversions.

1. Introduction

Since recent years, research efforts regarding renewable and sustainable energy sources have been more and more intensified because of the complexity of current global energy issues and the urgency of global warming containment [1].
The world population is expected to increase up to more than 11 billion people by the end of the 21st century, geographically concentrated in the currently least developed regions of the world [2]. This will involve net economic growth in those regions, which will in turn cause the growth of world energy demand and the consumption of resources with attendant waste generation, if the current model of linear economy is kept [3].
In September 2018, the World Bank announced that global waste production was predicted to increase by 70% (referring to 2018) by 2050 [4], unless actions were taken to break the “take-make-waste” paradigm of linear economy. Humankind in 2018 (7.6 billion people) produced two billion tonnes of waste per year; therefore, the expected world population growth should be compensated by avoiding the current gross mismanagement of waste [3].
In this framework, the European Union (EU) has promoted thematic strategies regarding waste prevention and recycling, as well as regulations concerning the transition towards a circular and sustainable economy [5]. In this scenario, several governmental programs have sustained actions to contrast climate change, as recently required by the Paris Agreement and the subsequent Conferences of the Parties to the United Nations Framework Conventions on Climate Change [6,7,8,9]. The European Green Deal represents an important response to climate change, setting the final goal of EU climate neutrality by 2050; the EU aims to couple this goal with a new growth strategy and a just transition towards a modern, competitive and resource efficient socio-economic system [10].
The use of waste as a feedstock is fundamental in a circular economy for applications in energy and biofuel production, since it is one of the pillars of the 2030 Agenda for Sustainable Development and contributes to decarbonization and landfill diversion [11]. Thermochemical conversions may serve as an essential part of a sustainable, integrated waste management system, as they are suitable routes to produce energy and fuels from waste [12,13,14]. In the first place, thermal treatment plants can directly convert the chemical energy content of waste in power and heat [15]. In addition, thermochemical conversions such as pyrolysis and gasification allow obtaining more valuable fuels or chemical products (e.g., by catalytic conversions of syngas [16]), bringing in the advantage of a unified, efficient treatment applicable to different types of solid waste [12,13,14,15].
Although biomass utilization in thermochemical processes for energy and chemical production has been extensively studied in the literature [1,17,18], analogue studies concerning solid wastes lead to less unitary conclusions because of the broader heterogeneity of waste materials. This causes the need to specifically study each given class of waste in order to develop the related waste-to-energy/fuel/chemicals chain. This necessity has indeed promoted the birth of various projects, such as: “optiCOM”, an industrial project aiming to implement fluidized-bed gasification of several solid wastes at industrial scale; “Lig2Liq”, a European research project co-funded by the Research Fund for Coal and Steel of the European Commission, which investigates the co-gasification of lignite with Solid Recovered Fuel (SRF) [13,19]; and more than sixty projects funded in the Biomass, Biofuels and Alternative fuel field, by the EU HORIZON 2020 program [20].
Absorbent Hygiene Products (AHP) constitute one of those class of waste, classified as a sanitary waste according to the European Waste Catalogue code (EWC, Directive 2000/532/EC). AHP consist of a broad set of products, including diapers for babies, sanitary protection pads, tampons, adult incontinence products and personal care wipes. AHP waste currently represents about 2–3% of municipal solid waste and 15–25% of the residual waste stream in some treatment facilities [21].
Nowadays, waste from AHP is quite challenging from the sustainability point of view, since it is usually disposed of via either landfill or incineration, losing its recycling potential [22]. This is a strong motivation of interest in studying possible alternative processes to better exploit this kind of waste. In the literature, some studies reported the separation of AHP waste into its different components, which can then be recycled into secondary raw materials with multiple potential uses (e.g., plastic, cellulose fiber plus super absorbent polymers) [23,24,25].
In view of the implementation of an integrated and sustainable management of AHP waste, pyrolysis and gasification may represent a viable process option because of their versatility concerning fed feedstock and uniformity of product classes (e.g., syngas or liquid hydrocarbons) [26,27,28,29]. In other words, AHP waste is a potential feedstock for thermochemical conversion pathways; this aspect appeared as worthy of a scientific investigation, considering what is stated above about the need of specific studies for the thermochemical conversion of each given kind of waste, and that waste from AHP has not been extensively utilized in this way yet (to our best knowledge).
The present work is the first attempt to fill this gap. The option of the thermochemical conversion of AHP waste materials was studied from the experimental point of view. Two different AHP waste materials were investigated: as-manufactured, coarsely shredded diapers, and the cellulosic fraction of sterilized, used diapers. Devolatilizations of samples from those AHP wastes were performed in a laboratory-scale bubbling fluidized bed made of sand, as a representative preparatory step of pyrolysis or gasification, respectively, intended as thermochemical conversions in the absence of oxidants or in the presence of sub-stoichiometric oxidants (in comparison to combustion) [30]. Physical-chemical characterization of investigated materials was presented and discussed, together with their devolatilization performances, evaluated in terms of syngas yield, carbon conversion, syngas composition and cold gas efficiency. Results were compared, from devolatilizations at different temperatures (from 500 °C to 800 °C), and under fully anoxic or slightly oxidant atmospheres.
These investigations provided novel results concerning the behavior of AHP waste in thermochemical conversions based on fluidized beds, which could be exploited for both scale-up studies and model validations.

2. Materials and Methods

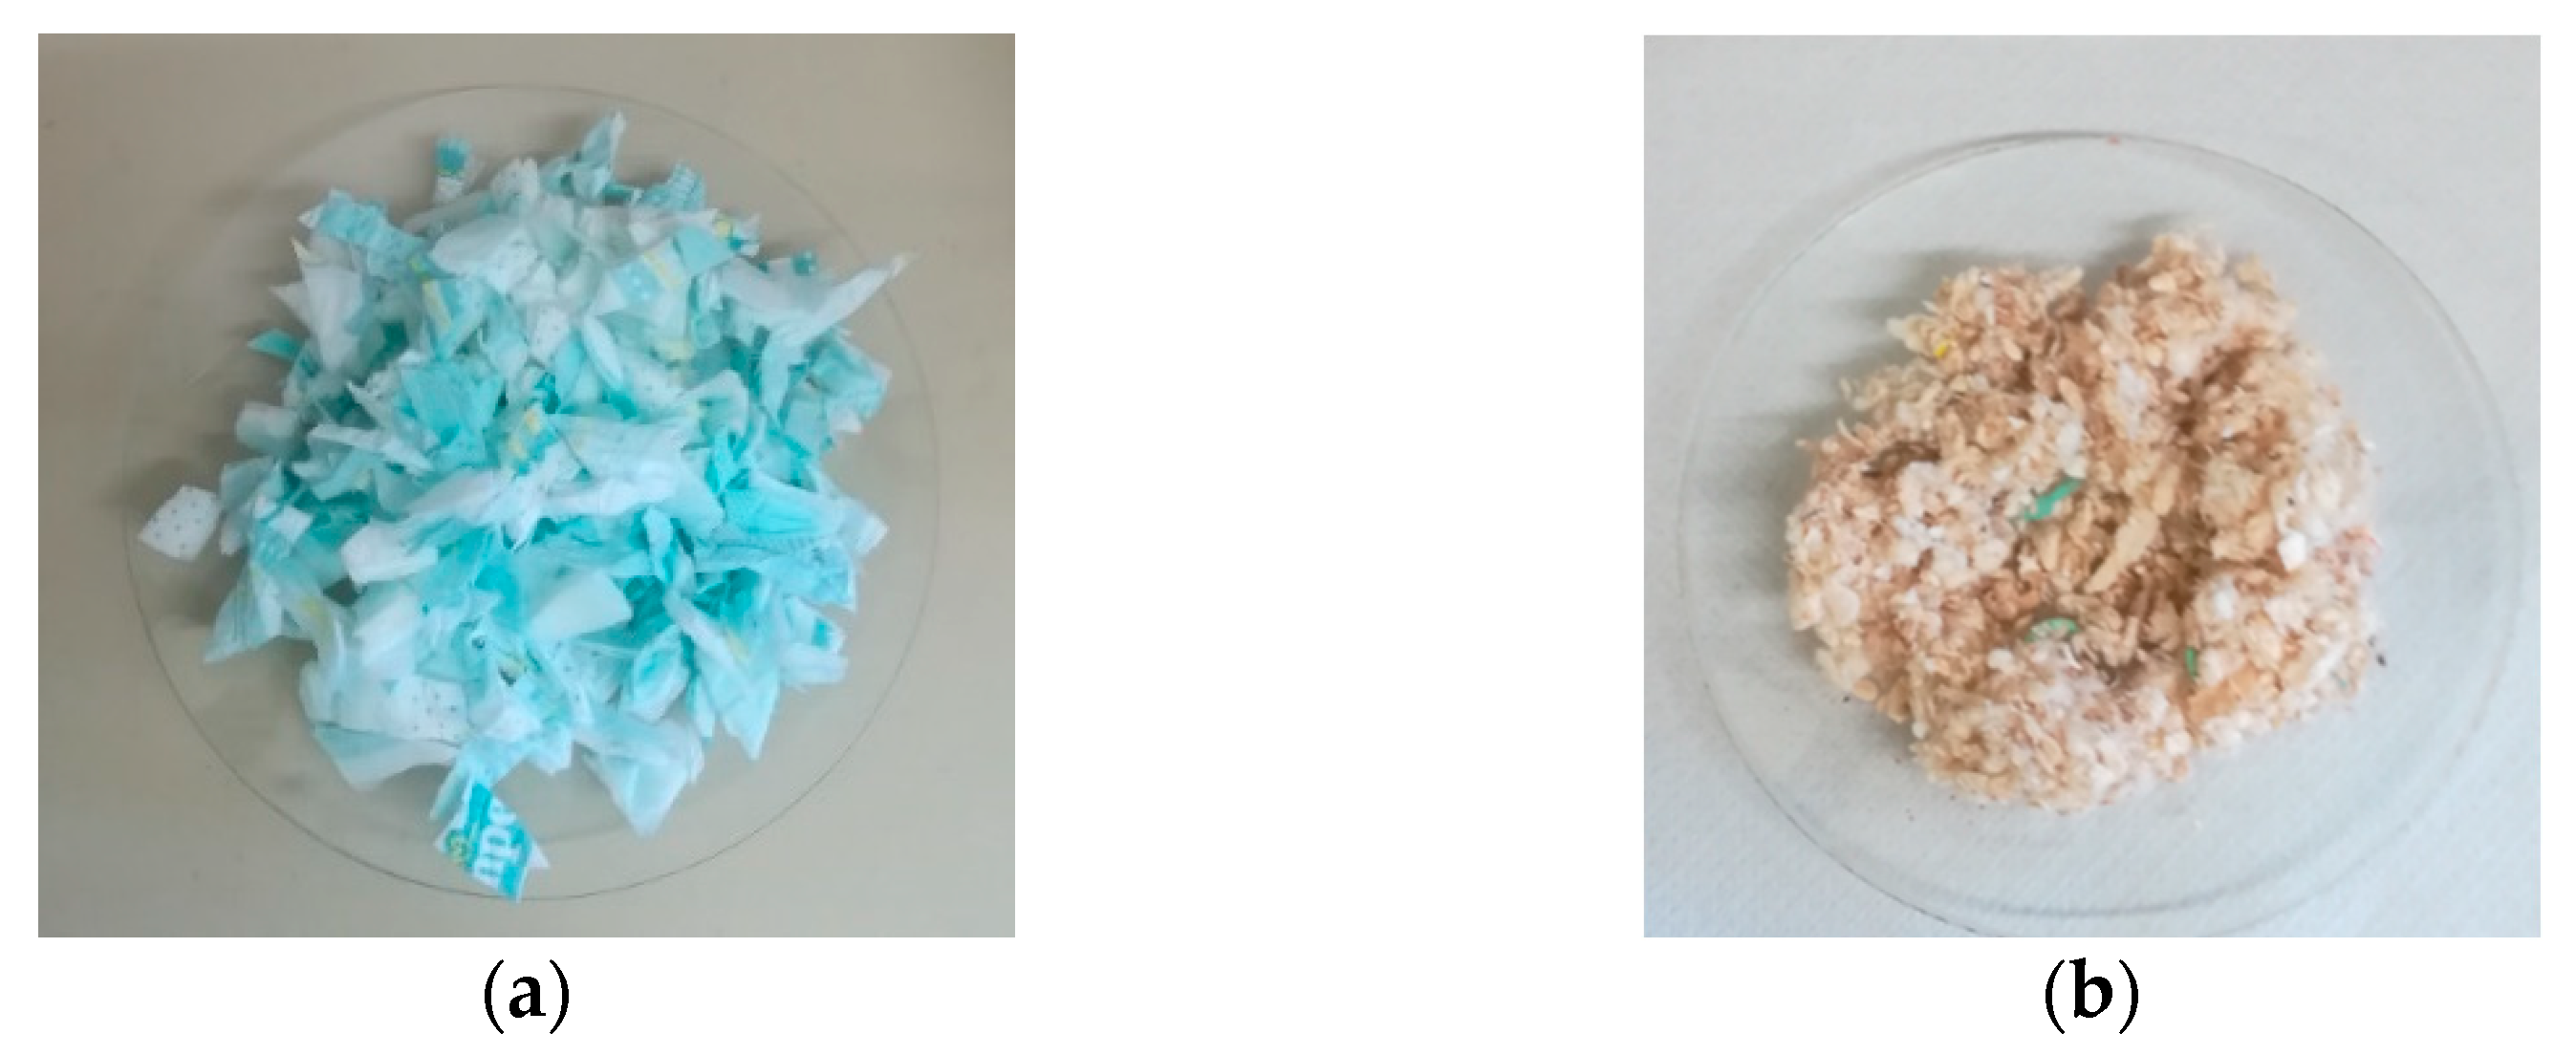
2.1. Waste Materials from AHP for Devolatilization Tests

Two raw materials were selected in this work: (i) as-manufactured, coarsely shredded diapers (AHPam), which represent an industrial post-production waste (Figure 1a); (ii) the cellulosic fraction of sterilized used diapers (AHPus), deriving from a diaper sterilization cycle, followed by the separation of organic and plastic fractions, which are both a post-consumer material (Figure 1b). AHPam and AHPus are classified according to the EWC code as sanitary waste.

2.2. Characterization of Waste Materials from AHP

Several physical-chemical characterizations of waste materials from AHP were performed.
Proximate and ultimate analyses were determined by means of Thermo-Gravimetric Analysis (TGA), muffle test, oven test and elemental analysis, which quantified carbon (C), hydrogen (H), nitrogen (N), sulfur (S) and oxygen (O) (from here on named CHNS/O).
TGA tests were carried out by the Linesis STA PT100 equipment, to determine volatile matter and fixed carbon fraction. The tests were performed as specified by the standard ASTM D142/02 [31]. Three samples of AHPam and three of AHPus (masses in the range 13.0–27.0 mg) underwent TGA tests under pure N2 or air fluxes. The treatment under pure N2 (16 Nl h−1) consisted of: (i) 10 °C min−1 heating rate from room temperature to 105 °C and 15 min dwell at 105 °C; (ii) 10 °C min−1 heating rate from 105 °C to 950 °C and a 7 min dwell at 950 °C. The treatment under air (16 Nl h−1) consisted of: (i) 10 °C min−1 heating rate from room temperature to 700 °C and 15 min dwell at 700 °C; (ii) 10 °C min−1 heating rate from 700 °C to 950 °C and 10 min dwell at 950 °C. For each kind of treatment, blank tests were carried out and used to correct TGA data from actual samples.
Additional TGA tests were carried out, concerning combustion under air flux, in order to evaluate the temperature at which thermal oxidative phenomena could be considered as extinguished. For both AHPam and AHPus, TGA combustion tests were carried out under 10 Nl h−1 of air, heating from room temperature up to 950 °C at rates of 5, 10 or 20 °C min−1.
Moisture fractions of AHPam and AHPus were determined by measuring the samples mass variation caused by a drying treatment in an oven (model MPIM factory Oven SL), keeping the temperature at 105 °C for 24 h (BSE EN 15414-3:2011 standard [32]).
Muffle tests (LENTON type ECF 12/10 equipment) were carried out to quantify AHPam and AHPus ash fractions, with reference to the ISO18122:2015 and 1016-104.4:1998 standard [33], according to the thermal program: (i) 8 °C min−1 heating rate from room temperature up to 500 °C with 1 h dwell at 500 °C; (ii) 8 °C min−1 heating rate from 500 °C up to 815 °C with 2 h dwell at 500 °C.
The elemental analyzer CHNS/O PerkinElmer 2400 Series-II was used to perform the ultimate analysis of AHPam and AHPus, obtaining mass percentages of C, H, N, S and O on dry basis.
The AHPam and AHPus ashes, obtained from the abovementioned muffle treatment at 815 °C, were analyzed by X-Ray Fluorescence (XRF) to determine their semi-quantitative elemental composition. The XRF device was a Spectro Xepos I instrument, with wavelength dispersion method, equipped with a detector that does not allow detecting elements with atomic mass lower than that of magnesium (Mg).
Inductively Coupled Plasma Atomic Emission Spectroscopy (ICP-AES) analyses were carried out with VARIAN 720 ES ICP-AES instrument in order to detect sodium (Na) in the AHPam material, a key element contained in the super-absorbent polymer of diapers (sodium polyacrylate) [34].
XRF and ICP-AES techniques are of interest, since the presence of Na and other mineral elements (e.g., K, Si, Ca, Na, Mg, Al) can lead to the formation of eutectics [35], which can in turn generate low-melting ashes at the temperatures of those processes investigated in this work; these melting species may be responsible for important process issues, as they can develop agglomerates in fluidized beds or obstructions by recondensation in colder areas [36,37].

2.3. Bed Material and Fluid-Dynamic Conditions for Devolatilization Tests

The bed material used for devolatilization tests was sand; its physical properties of fluid-dynamic interest (range of particle diameter dp and particle density ρp) are summarized in Table 1. At experimental conditions of devolatilization tests (see Section 2.4), this sand belongs to Group B of generalized Geldart classification [38], for which minimum fluidization velocity coincides with minimum bubbling velocity, i.e., Group B materials cannot provide homogeneous fluidization. From here on, the term “minimum fluidization velocity (umf)” is used to name the beginning of sand fluidization, which is for sure at bubbling regime. Values of umf (Table 1), used as references to set devolatilization experimental conditions in this work (see Section 2.4), were determined according to the method described by Di Giuliano et al. [36].

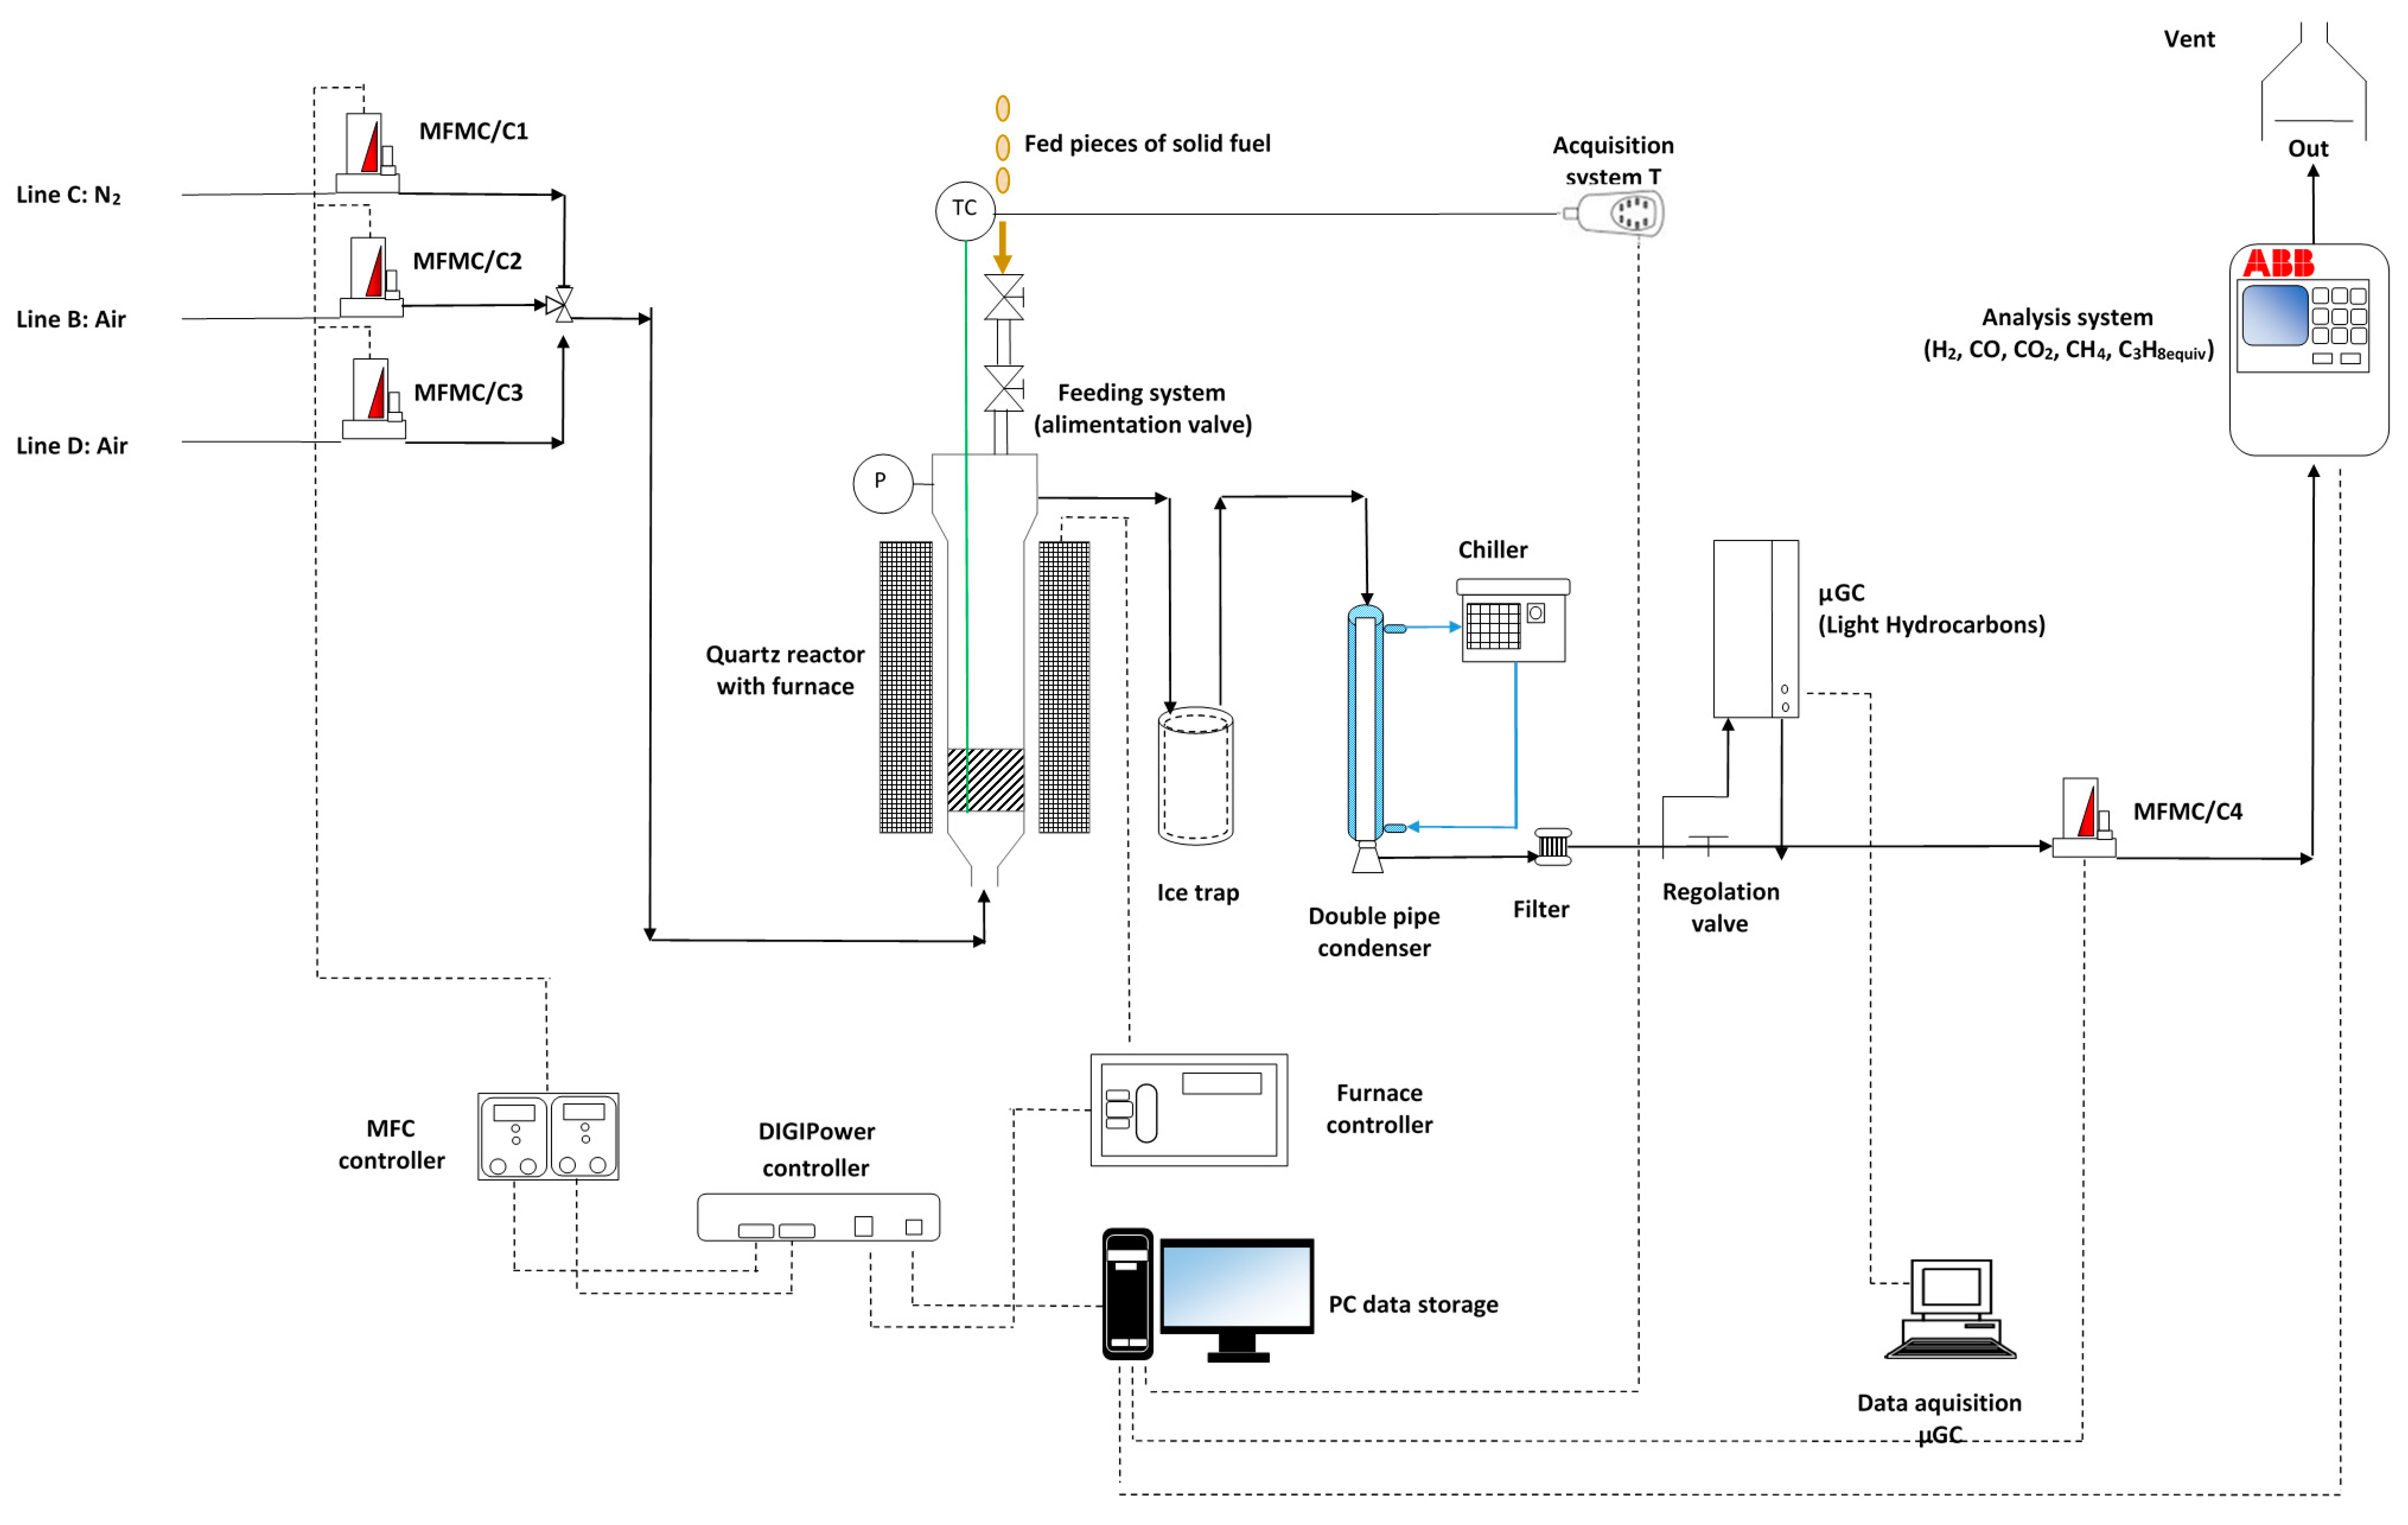
2.4. Devolatilization Tests: Experimental Rig and Procedure

Devolatilization tests were performed for both waste materials from AHP, introduced in Section 2.1 (AHPam and AHPus). Each material was investigated at four temperature levels (500, 600, 700, 800 °C), with two fluidizing agents (pure N2 or air diluted by N2 to obtain 1.3–2.3 vol% of O2 at the bed inlet). Devolatilizations with pure N2 may be considered as preparatory experiments for a pyrolysis process, while those with diluted air have the same role related to gasification.
The laboratory-scale plant for devolatilization tests is described in detail elsewhere [36]. For the sake of brevity and clarity, only basic information is given here about this experimental rig (Figure 2). It included (Figure 2) one fluidized bed quartz reactor (5 cm internal diameter), heated by a cylindrical electric furnace, in turn controlled by a thermocouple submerged in the bed. The reactor was fed upward by the fluidizing agent, with its flow rate set to always develop 1.4 times umf (Table 1) at chosen test conditions. The mass of sand in the reactor was selected to obtain 7.5 cm high beds (1.5 times the bed diameter).
Devolatilization products left the reactor from its top, together with the fluidizing agent which also served as a carrier; condensable species were separated by an ice trap and a double-pipe glass condenser at 0 °C. The composition of dry product gases was measured online by an ABB analysis system and a micro gas-chromatograph (μCG) AGILENT 490 (see [36] for further details). The ABB system measured the volume percentages of CO, CO2, CH4 and H2, and the overall hydrocarbons content as ppmv of equivalent C3H8. The raw values of equivalent C3H8 measured by the ABB system included CH4 contribution; in this work, the quantity presented as “equivalent C3H8” is intended as already reduced by the contribution of CH4. From here on, “equivalent C3H8” means “hydrocarbons other than methane”.
Due to the fluffy nature of raw waste materials from AHP (Figure 1), prior to devolatilization AHPam and AHPus were compacted in the form of circular tablets by means of a press; those circular tablets were then cut in half to obtain individual pieces small enough to be fed into the reactor (about 0.2–0.4 g per piece).
AHPam and AHPus pieces were fed individually by hand, thanks to a vertical double valve system at the top of the reactor (Figure 2, see [36] for further details). Each piece experienced an abrupt heating, from room temperature to the one of the fluidized bed, just in the small duration of piece falling. This fast temperature increase could not be performed by TGA equipment.
For each set of parameters “material kind/fluidizing agent/bed temperature”, three individual waste pieces were devolatilized, constituting three repetitions of a given test condition. The thermal decomposition of each piece was carried out until completion, before feeding the following; therefore, the process could be considered as a semi-batch, intrinsically at unsteady state.
Outlet molar flow rates (Fi,out, with i = H2, CO, CO2, CH4 and equivalent C3H8) as functions of time (t) were obtained from ABB measurements, thanks to the assumption of the N2 inlet flow rate as the internal standard. With regard to tests involving diluted air, it is reasonable to hypothesize that fed O2 was mostly converted and, in any case, it represented a negligible flow rate in comparison to the N2 one; therefore, fed N2 was always assumed as the internal standard. Once Fi,out, masses of fuel pieces (mp) and their compositions (see Section 3.1) were known, mole balances were performed. On the basis of these balances, for each devolatilization, integral-average values (“av” superscript in Equations (1)–(3)) were calculated for the following quantities:
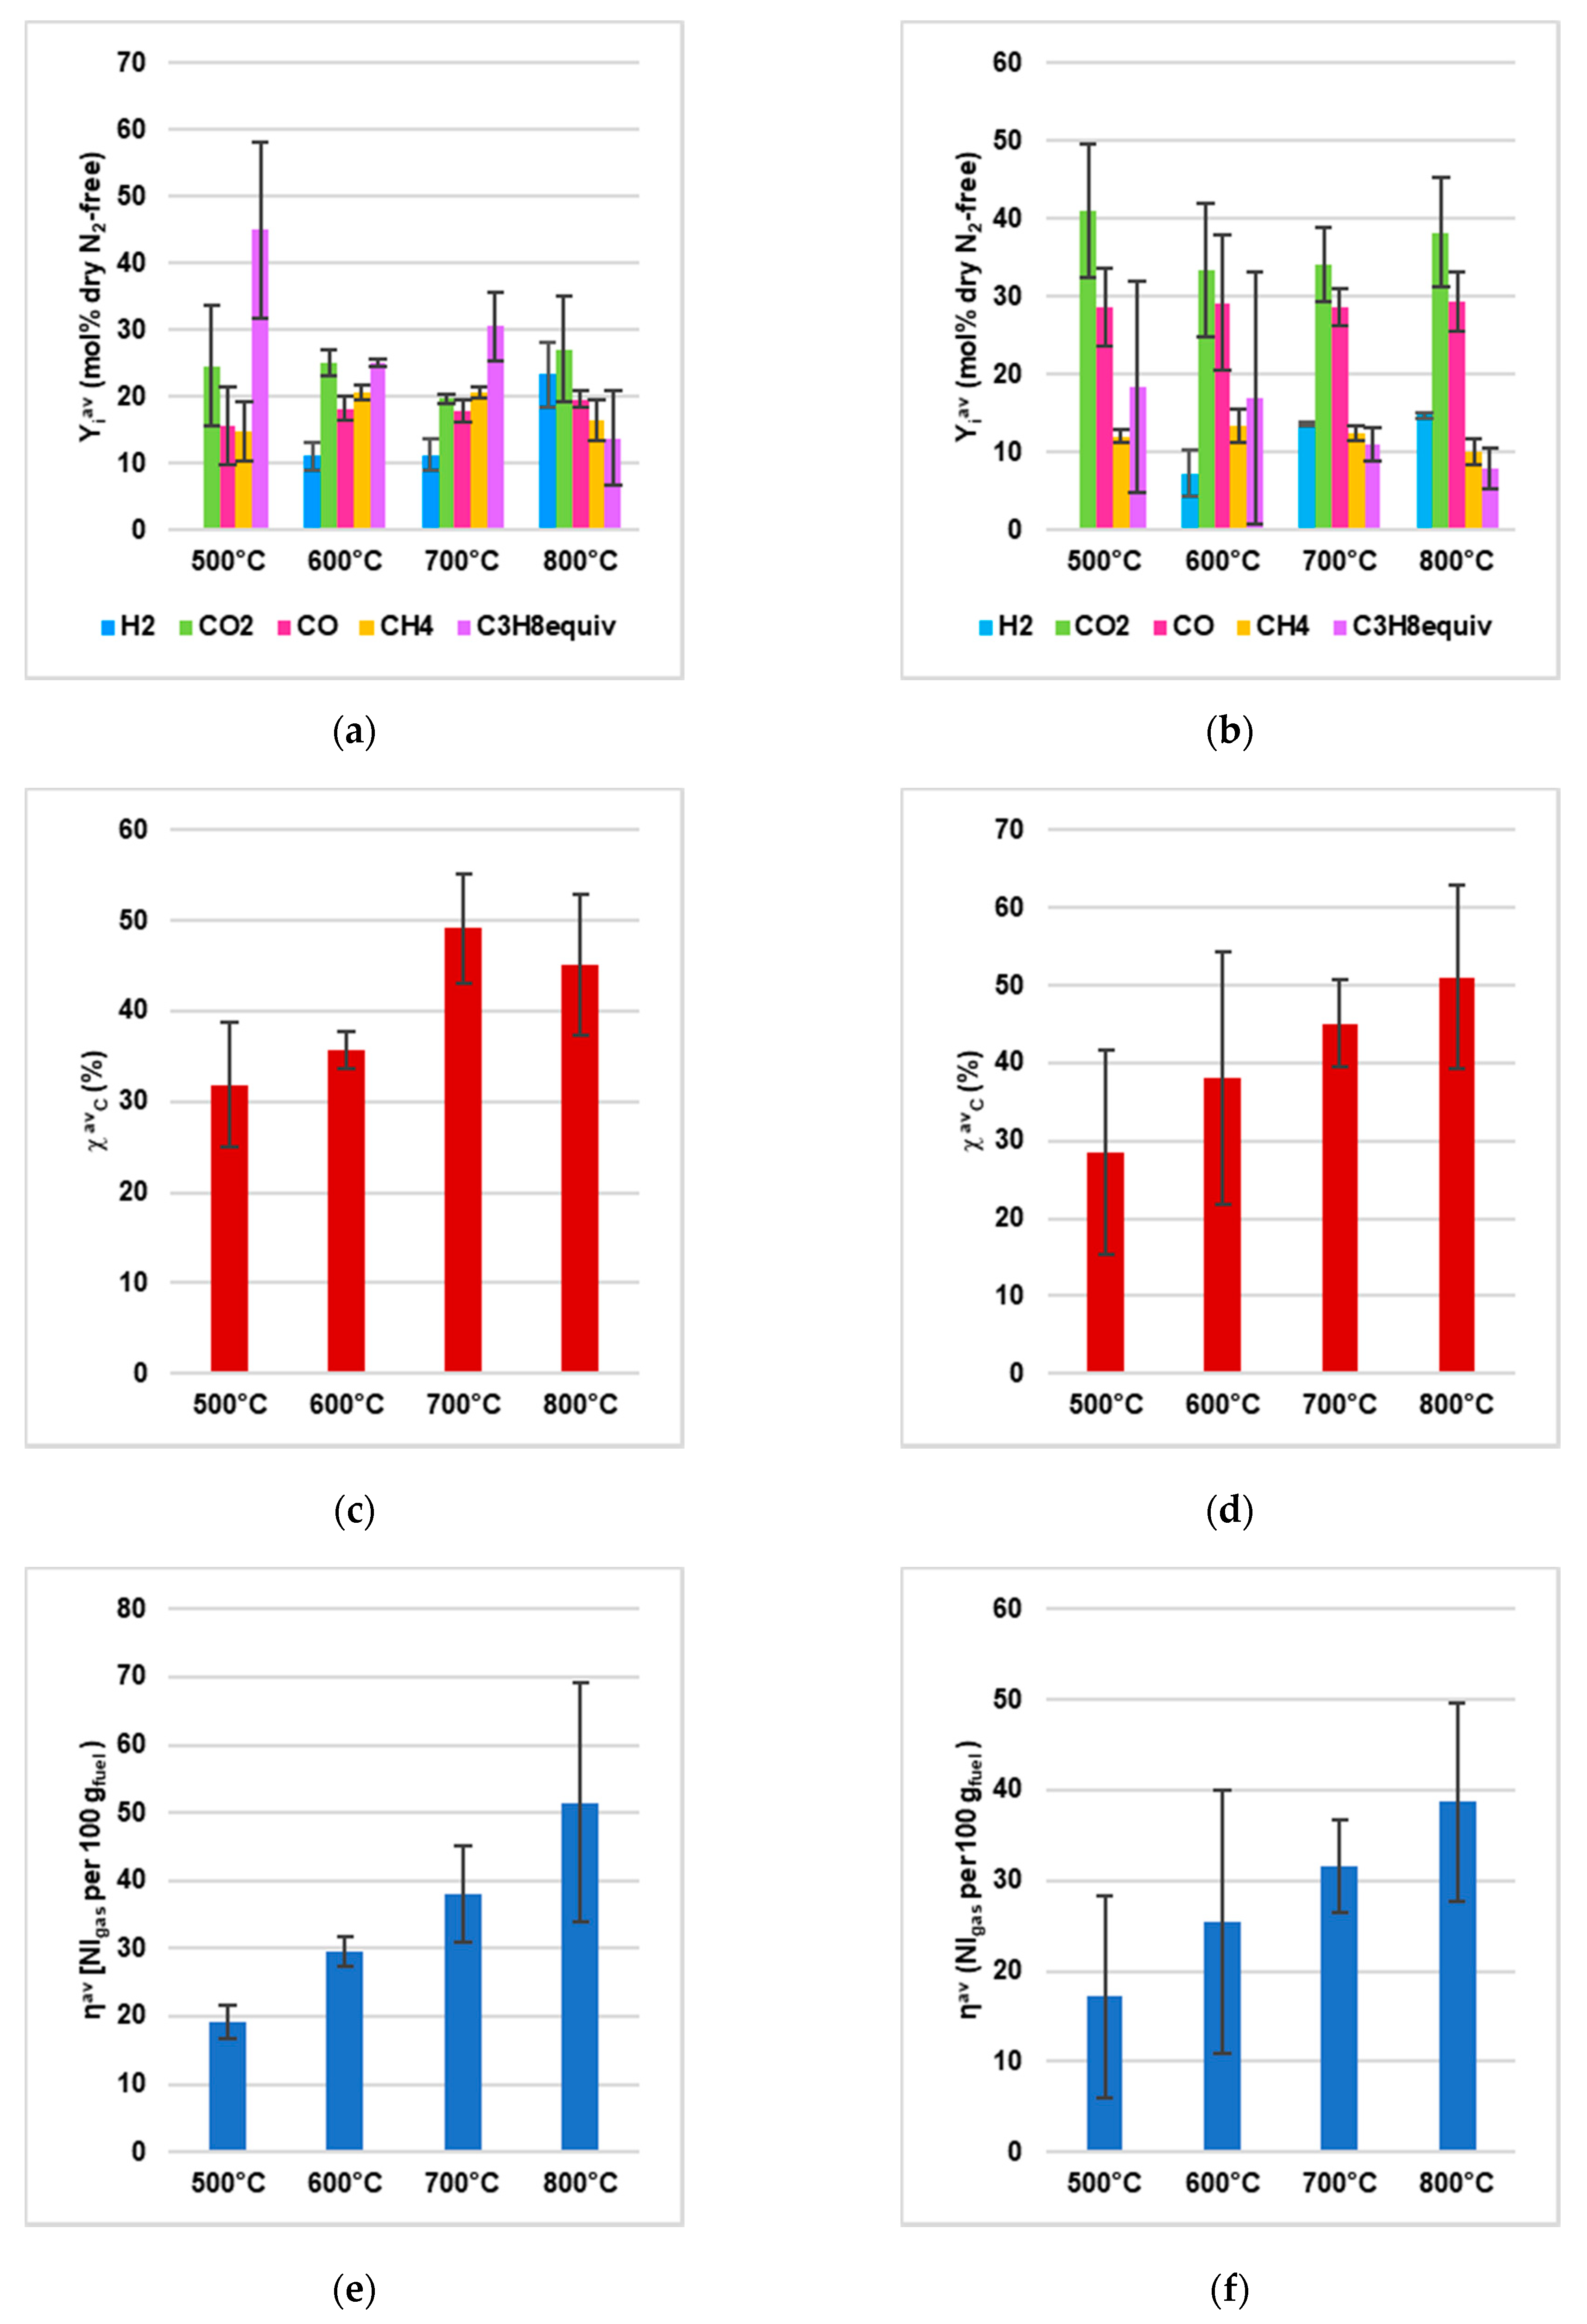
  • Gas yield (ηav, Equation (1));
  • Percentage of i on dry and dilution free basis (Yiav, Equation (2));
  • Carbon conversion (χavC, Equation (3), with nj as the number of C atoms in C-containing species j).
For those quantities defined in Equations (1)–(3), averages out of the three repetitions were calculated for each set “material kind/fluidizing agent/bed temperature”, provided with related standard deviations.
η a v = i F i , o u t   d t m p w i t h   i = H 2 ,   C O ,   C O 2 ,   C H 4   a n d   e q u i v a l e n t   C 3 H 8
Y i a v = F i , o u t   d t i F i , o u t   d t 100 w i t h   i = H 2 ,   C O ,   C O 2 ,   C H 4   a n d   e q u i v a l e n t   C 3 H 8
χ C a v = ( 12   g   m o l 1 ) × j ( n j F j , o u t   d t ) m p ( 100 w t % a r   o f   m o i s t u r e 100 ) ( w t % d b   o f   C 100 ) 100 w i t h   j = C O ,   C O 2 ,   C H 4   a n d   e q u i v a l e n t   C 3 H 8
Cold gas efficiency (ξ, Equation (4), with LHVg,i as the Lower Heating Value of gaseous species i in the product gas, LHVp as Lower Heating Value of the solid fuel) was calculated as an additional overall evaluation parameter, out of the three repetitions for each set “material kind/fluidizing agent/bed temperature”.
ξ = k [ ( i ( L H V g , i F i , o u t d t ) ) k / m p , k ] 3 · L H V p w i t h   i = H 2 ,   C O ,   C O 2 ,   C H 4   a n d   e q u i v a l e n t   C 3 H 8 ;   k = r e p e t i t i o n s   1 ,   2 ,   3
Lower heating values in Equation (4) were found in the literature for the syngas components [39,40] and tested waste materials from AHP [34] (Table 2).

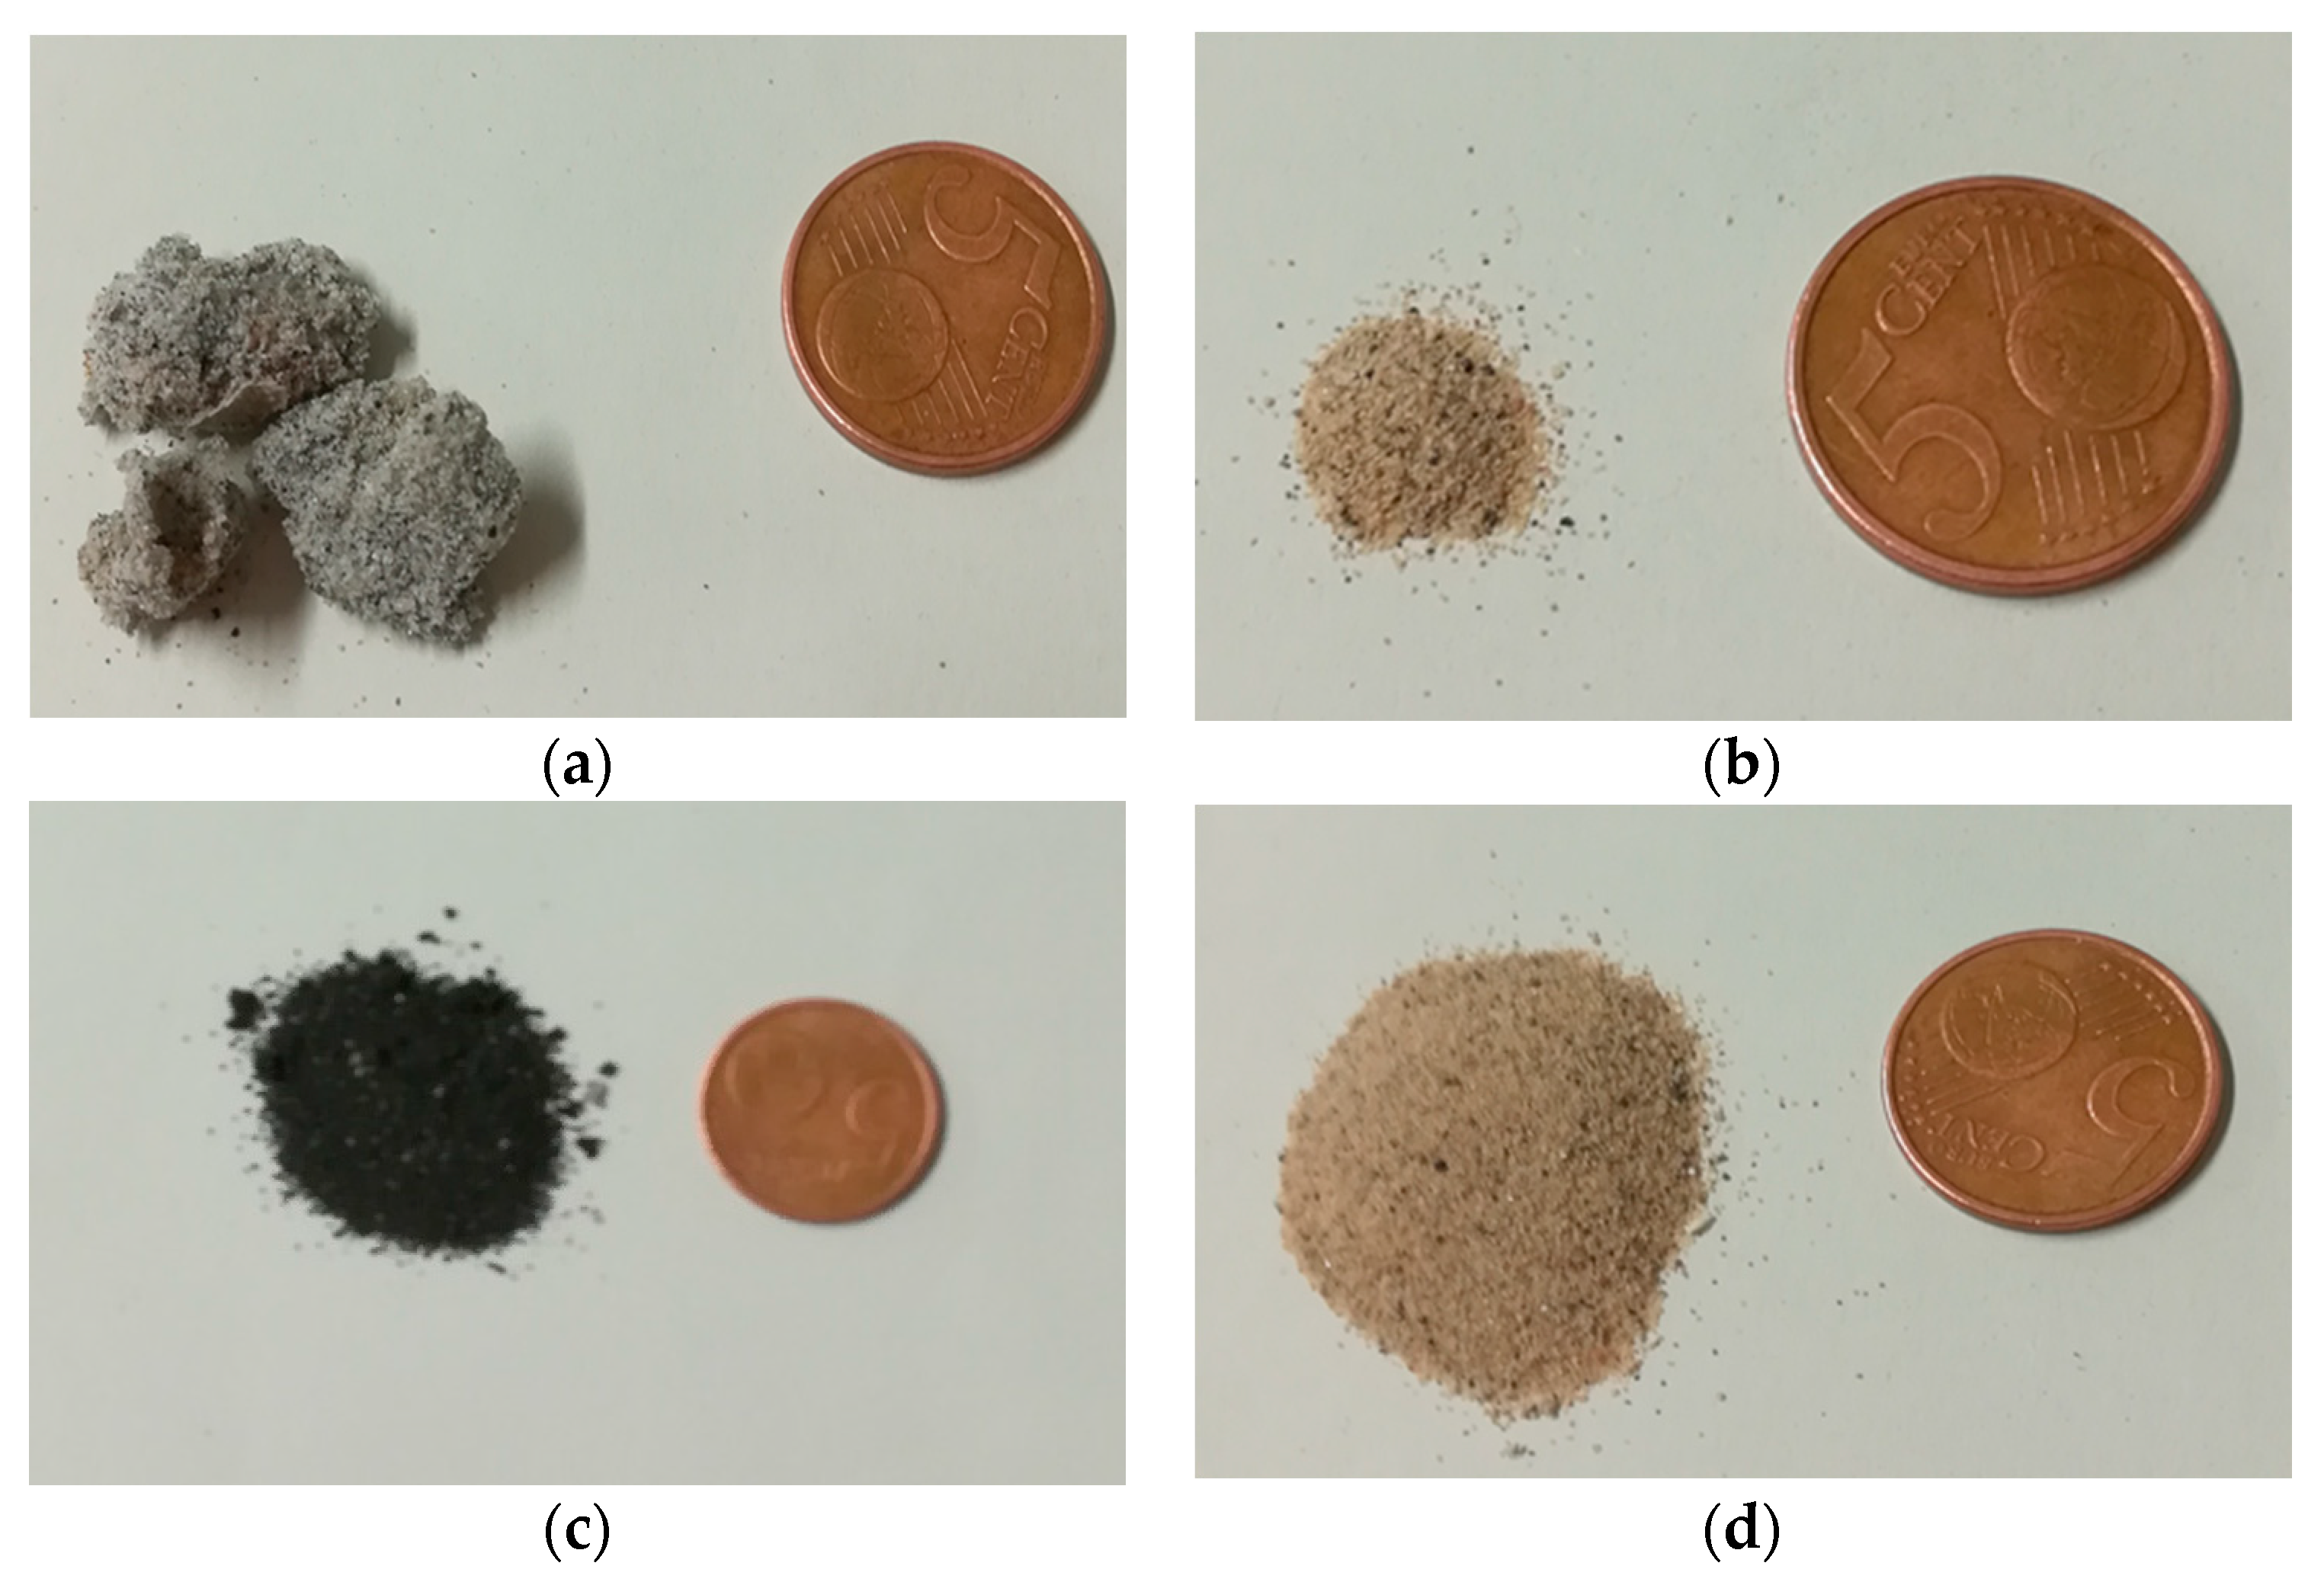
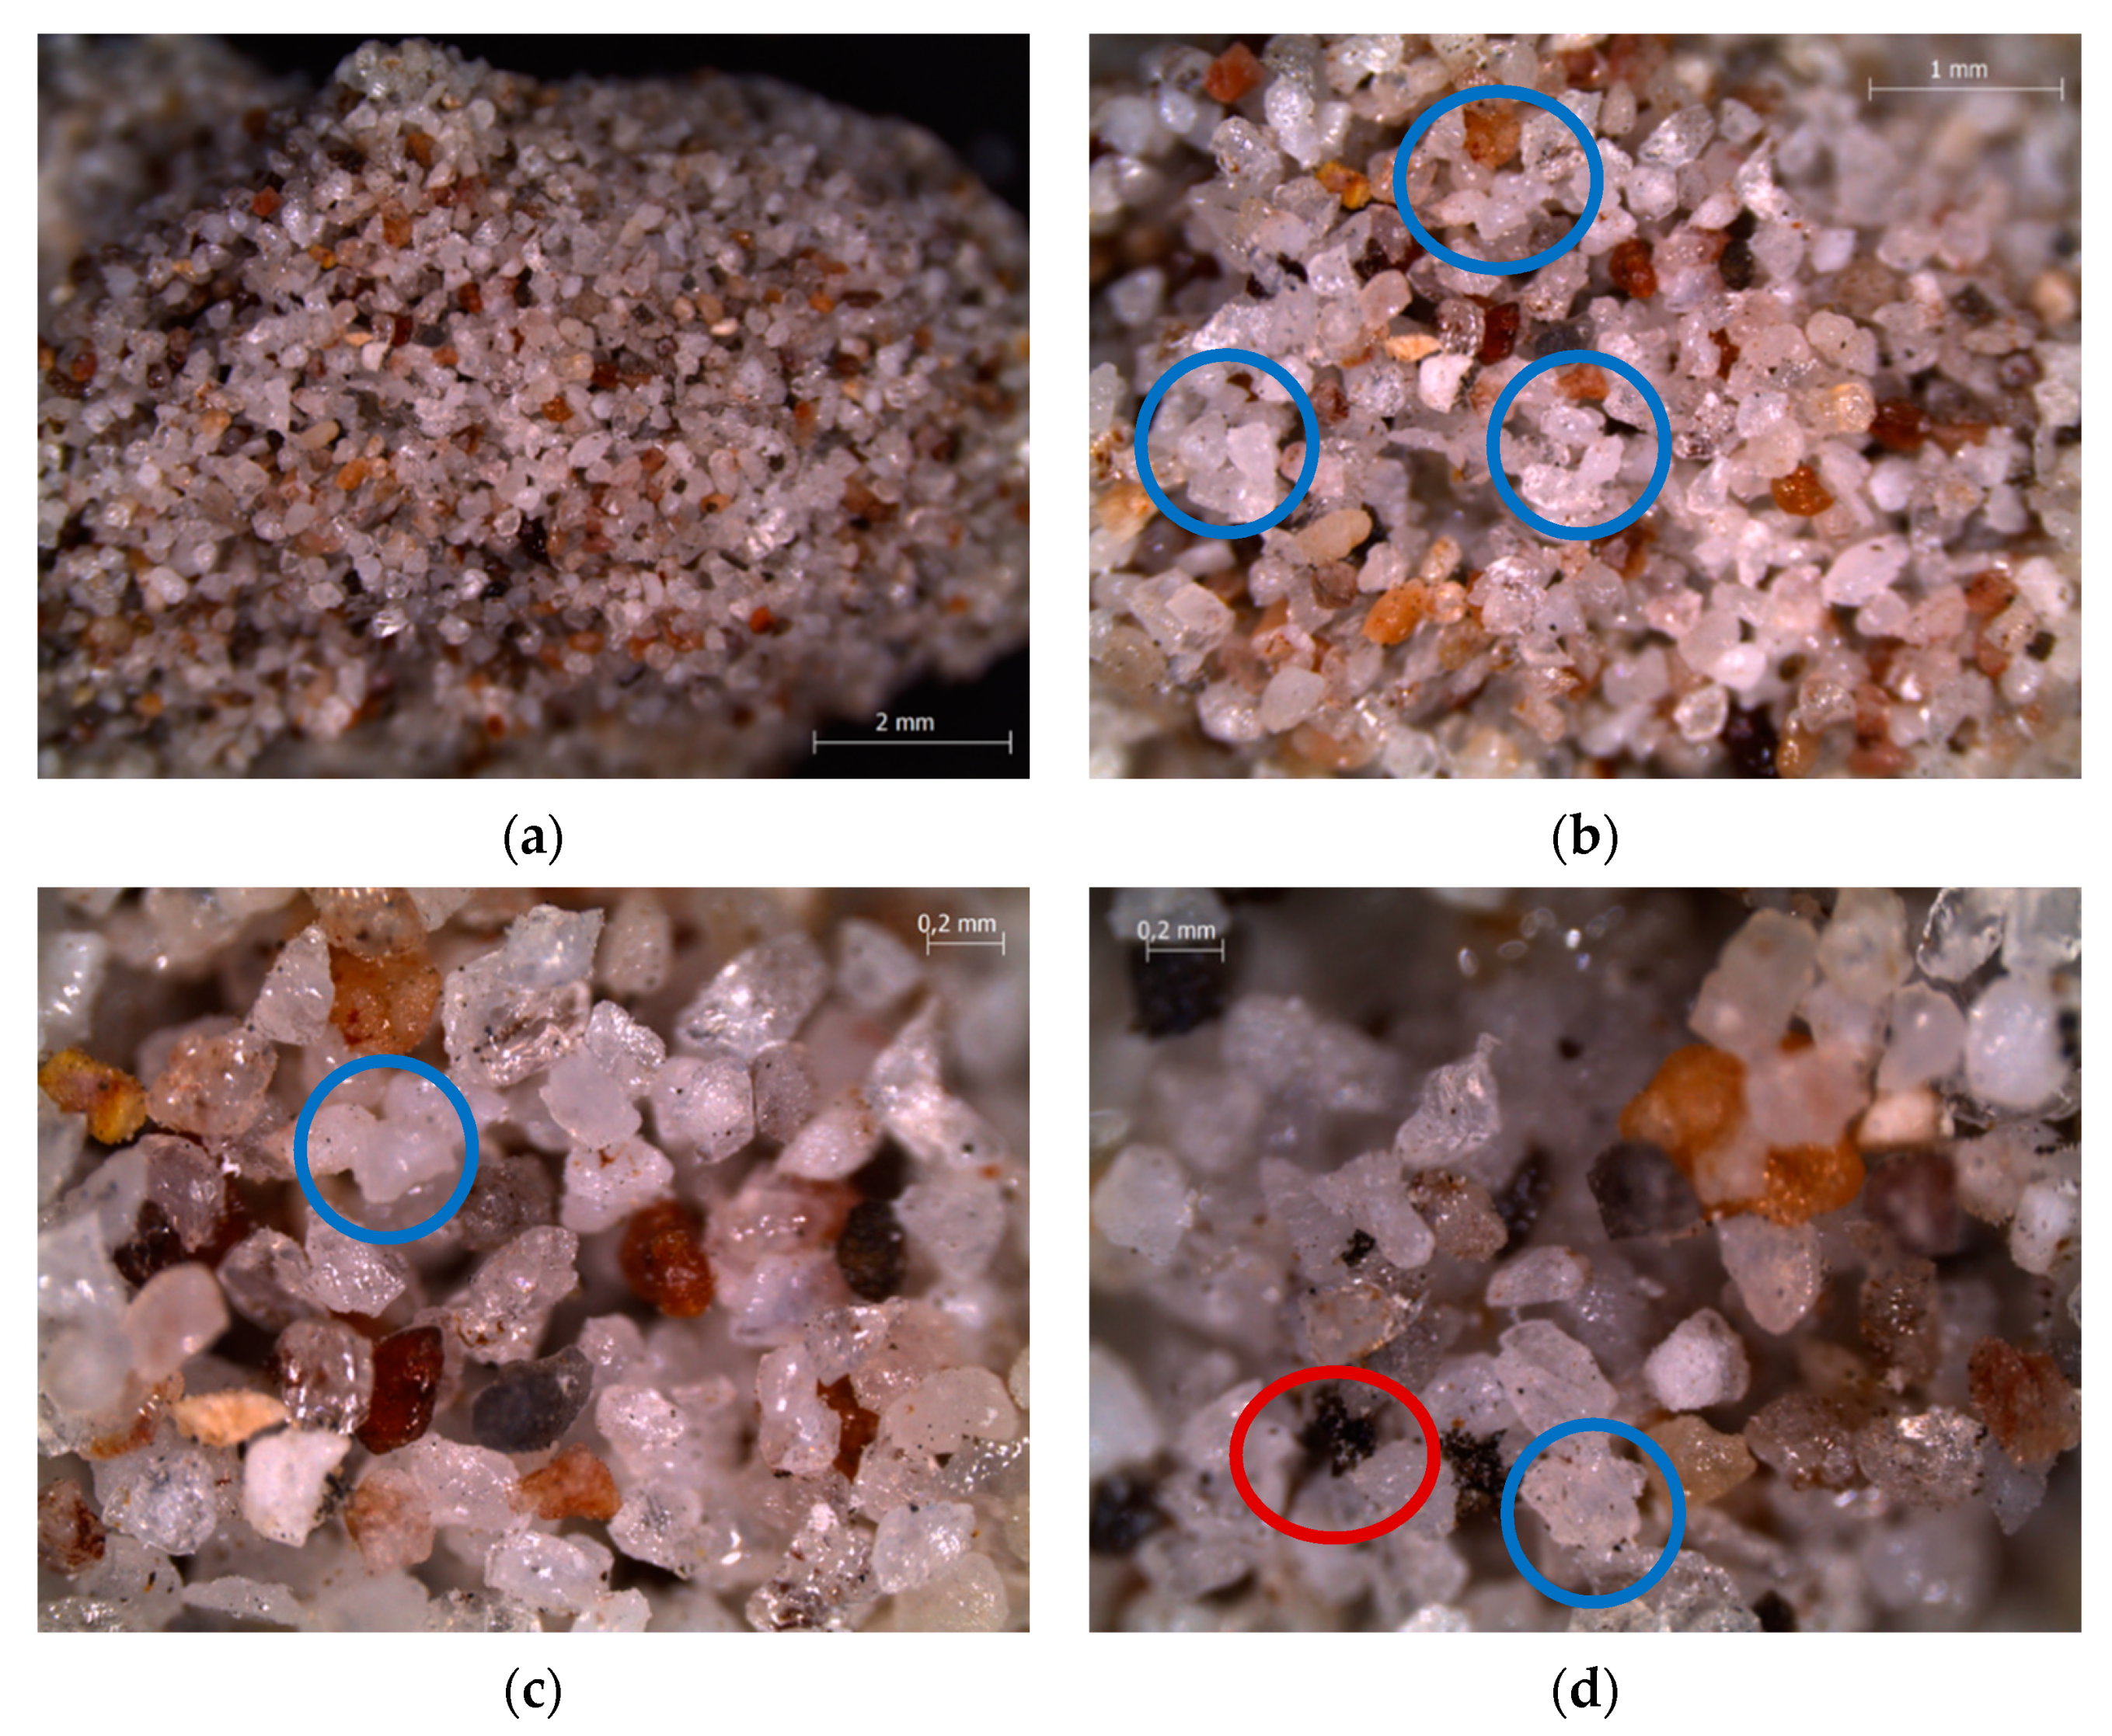
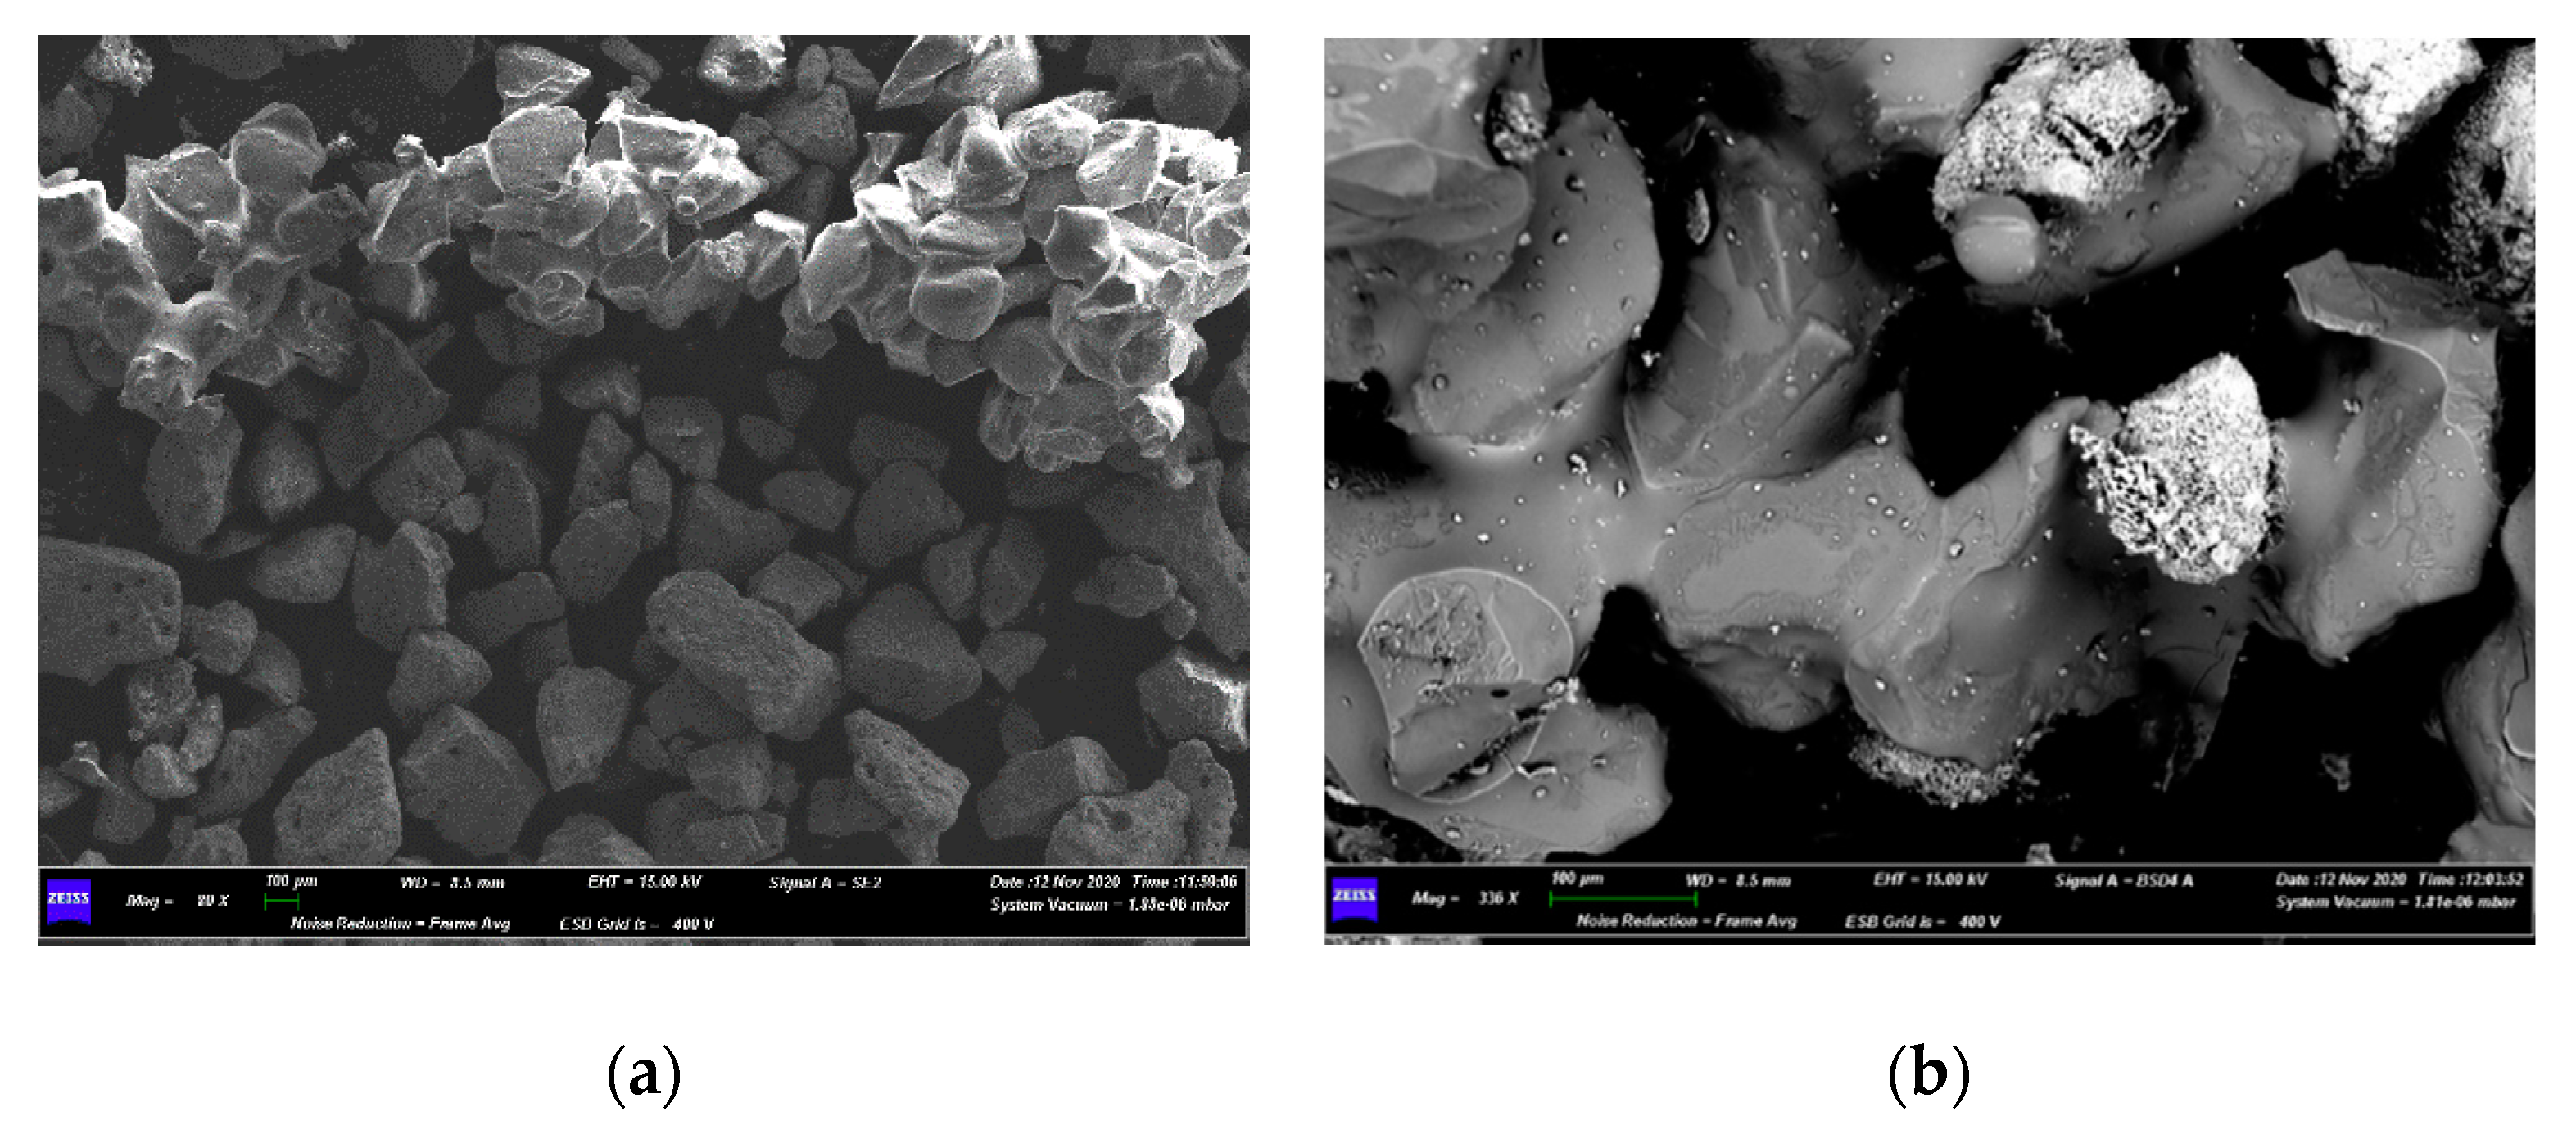
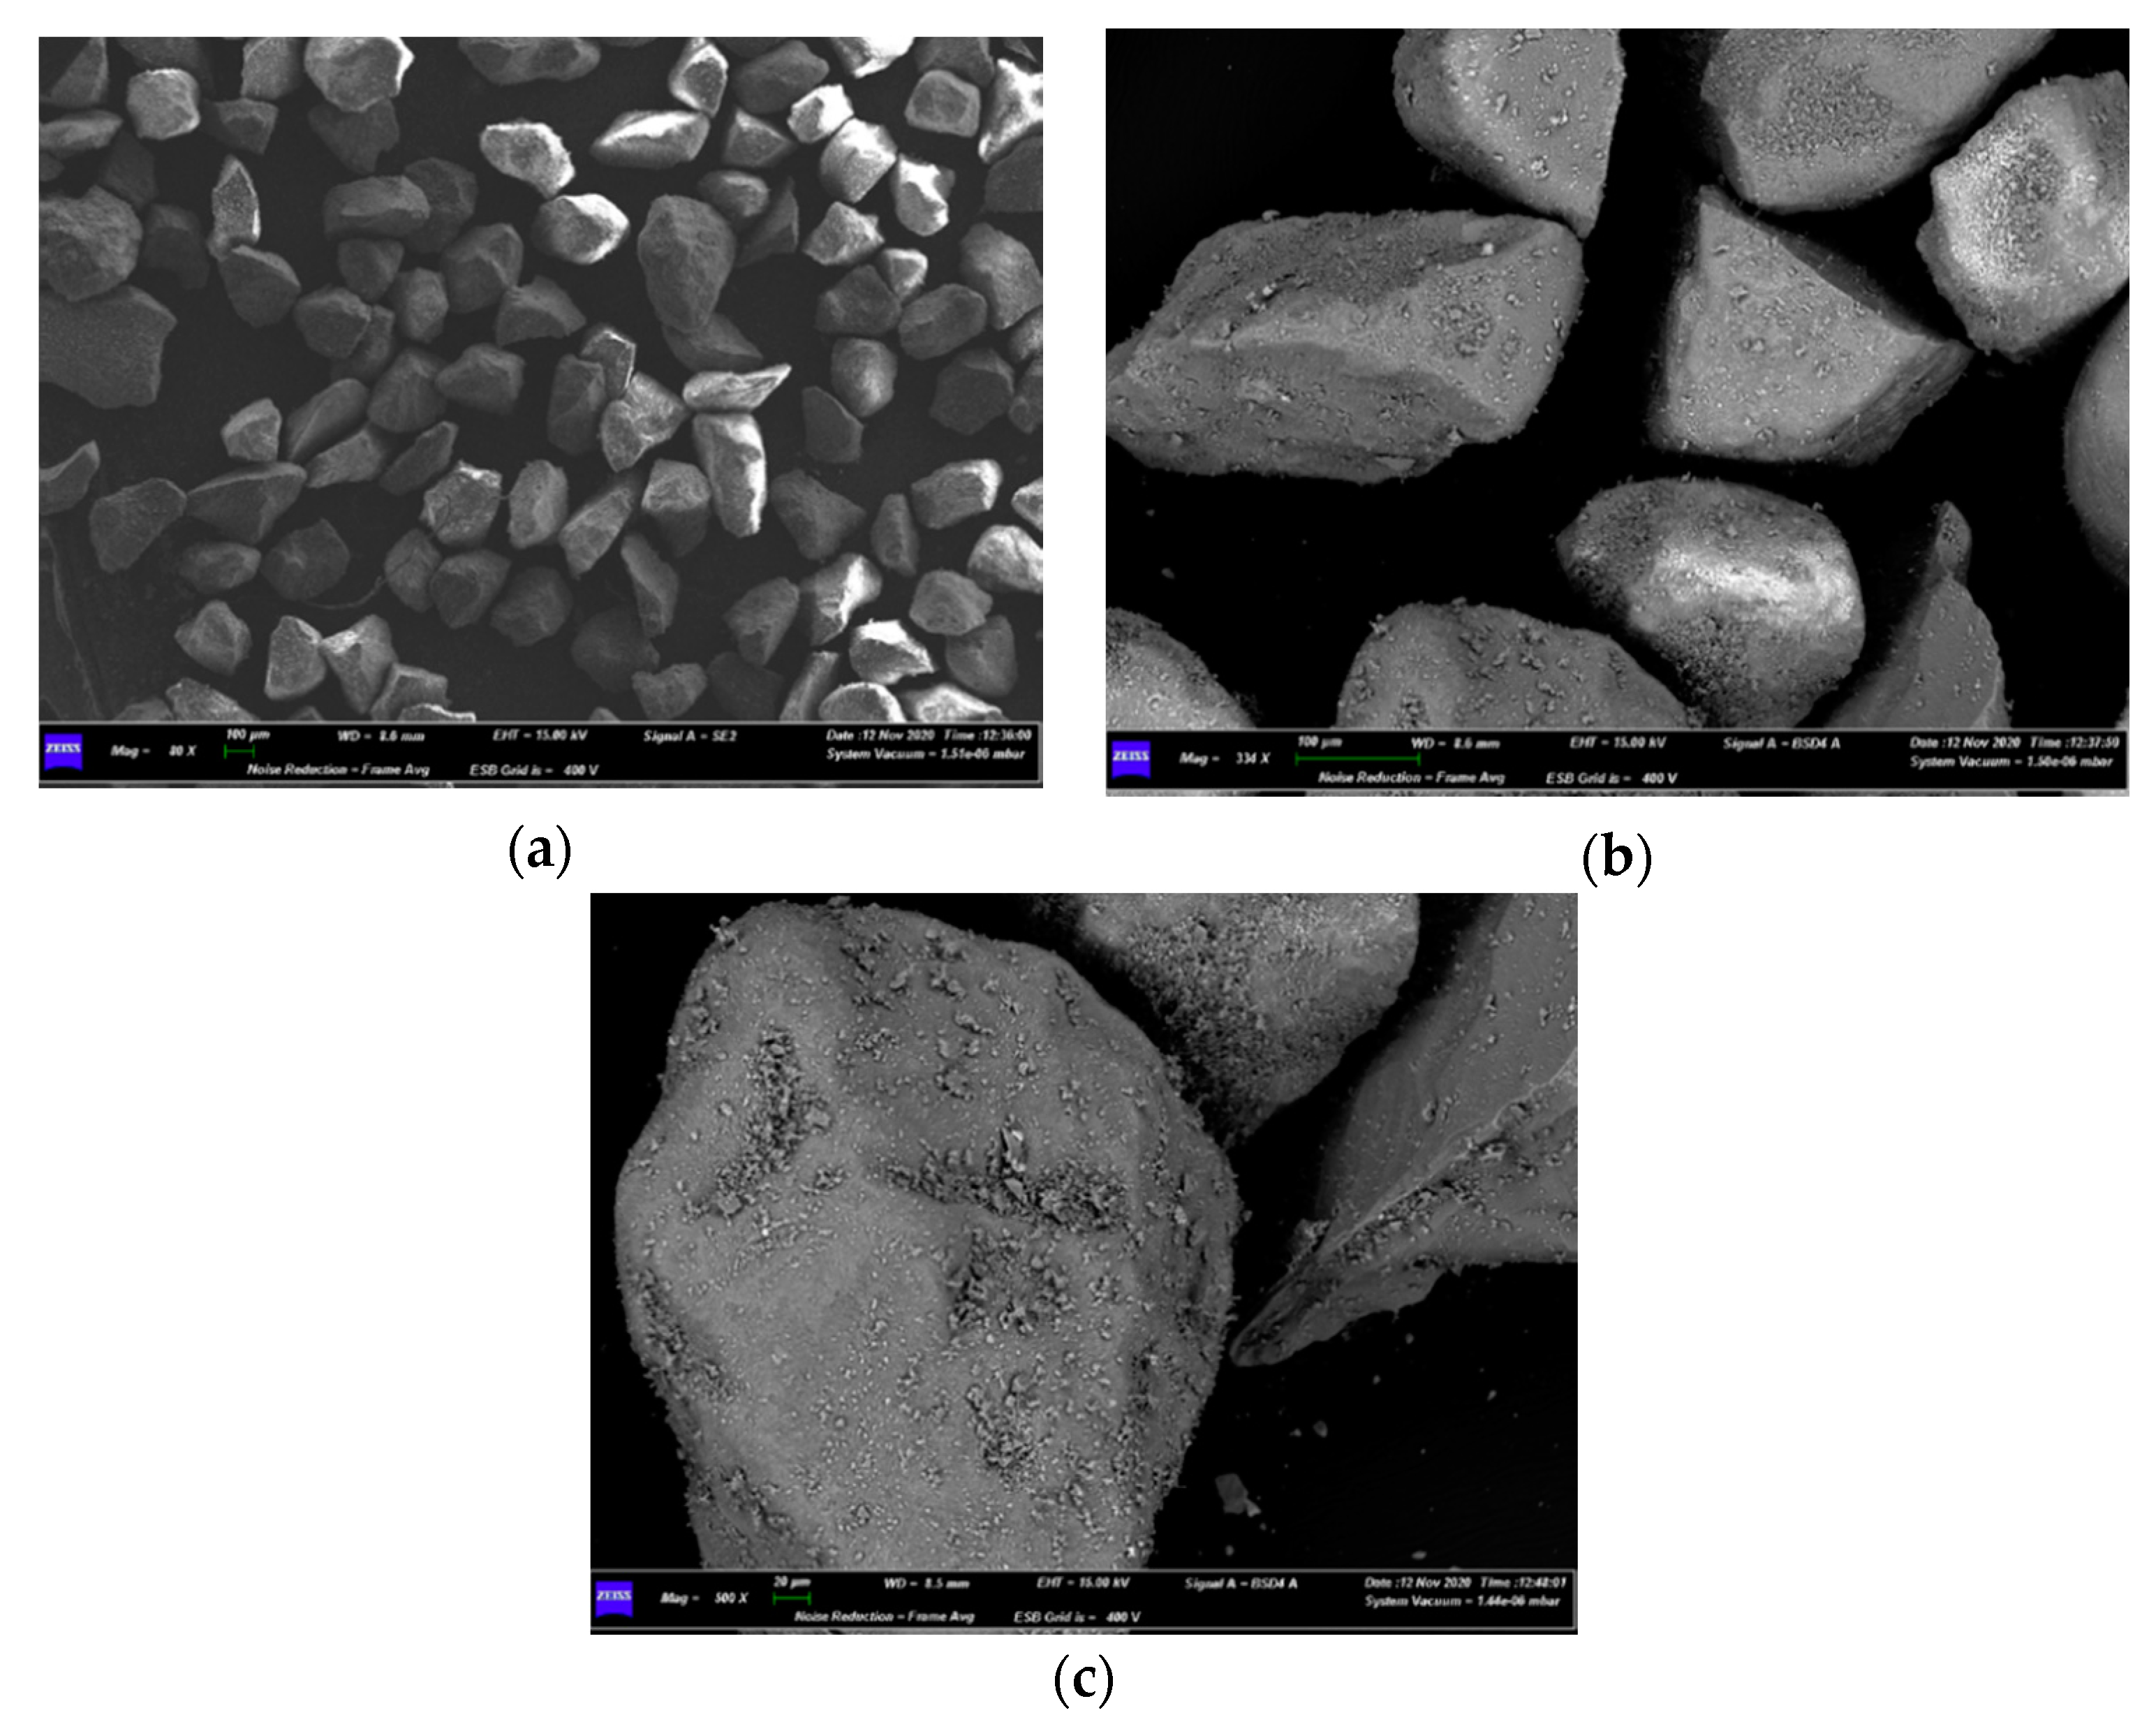
2.5. Characterization of the Fluidized Bed after Devolatilization Tests
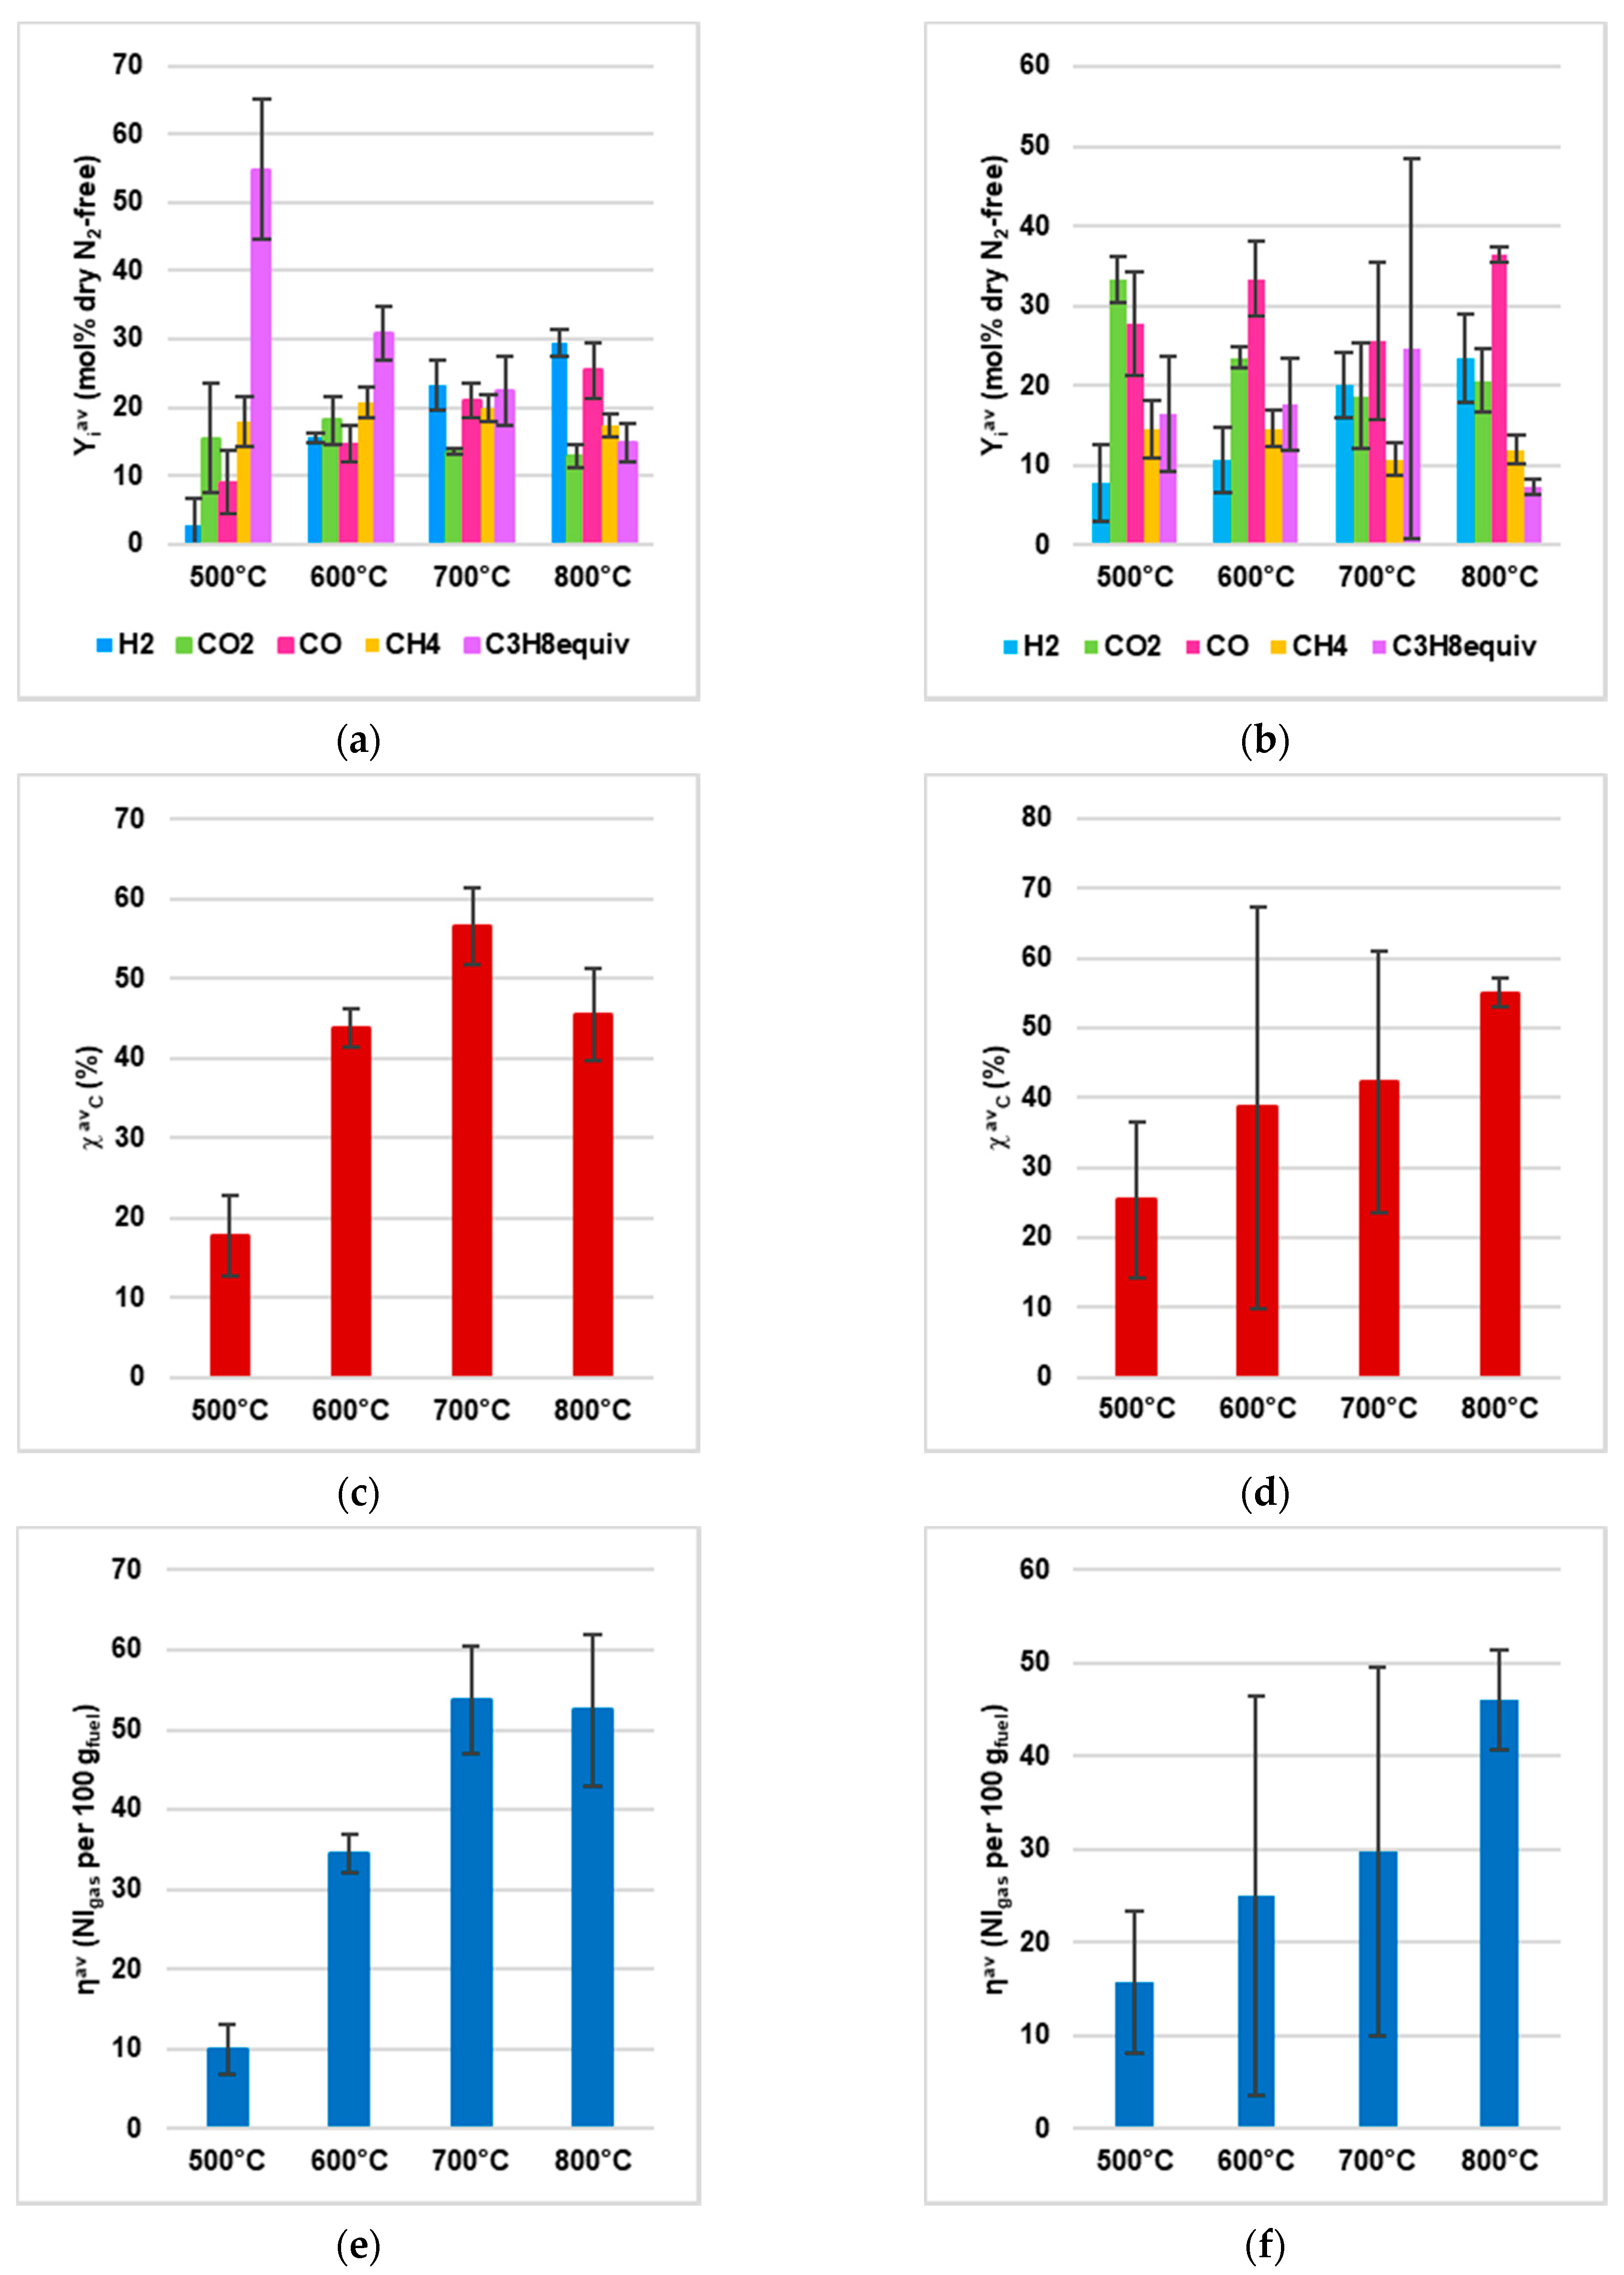
Some morphological and topological aspects were observed by microscopy techniques, namely: (i) Scanning Electron Microscopy (SEM) with Zeiss GeminiSEM 500 microscope equipped with Energy Dispersive X-ray Spectrometry (EDS) for elemental analyses; (ii) observation by means of a stereomicroscope Leica s8 Apo model.
Results of EDS analyses are mentioned in Section 3.3, but only related SEM micrographs are shown. Both microscopy techniques were exploited to study possible agglomeration or sintering phenomena in the fluidized bed, which can interfere with the fluidization quality by increasing the average diameter of bed particles, therefore affecting the performance of thermochemical conversion [39].
This characterization was carried out on the spent fluidized sand at the end of the devolatilization tests (see Section 2.3); the sampling of spent bed particles was performed in different zones: coarse agglomerates of the sand bed (Figure 3a), top of the sand bed (Figure 3b), bottom of the sand bed (Figure 3c), intermediate part of the sand bed (Figure 3d).

3. Results

3.1. Physical-Chemical Characterizations of AHPam and AHPus

Table 3 shows the numerical results of proximate and ultimate analyses of AHPam and AHPus, obtained by TGA, oven tests, muffle tests, and the CHNS/O analyzer (see Section 2.2).
Table 4 summarizes the semi-quantitative elemental compositions of AHPam and AHPus, measured by XRF (see Section 2.2).
Table 5 summarizes temperatures at which oxidative decomposition phenomena were no longer detectable during combustions in TGA equipment, for both AHPam and AHPus.

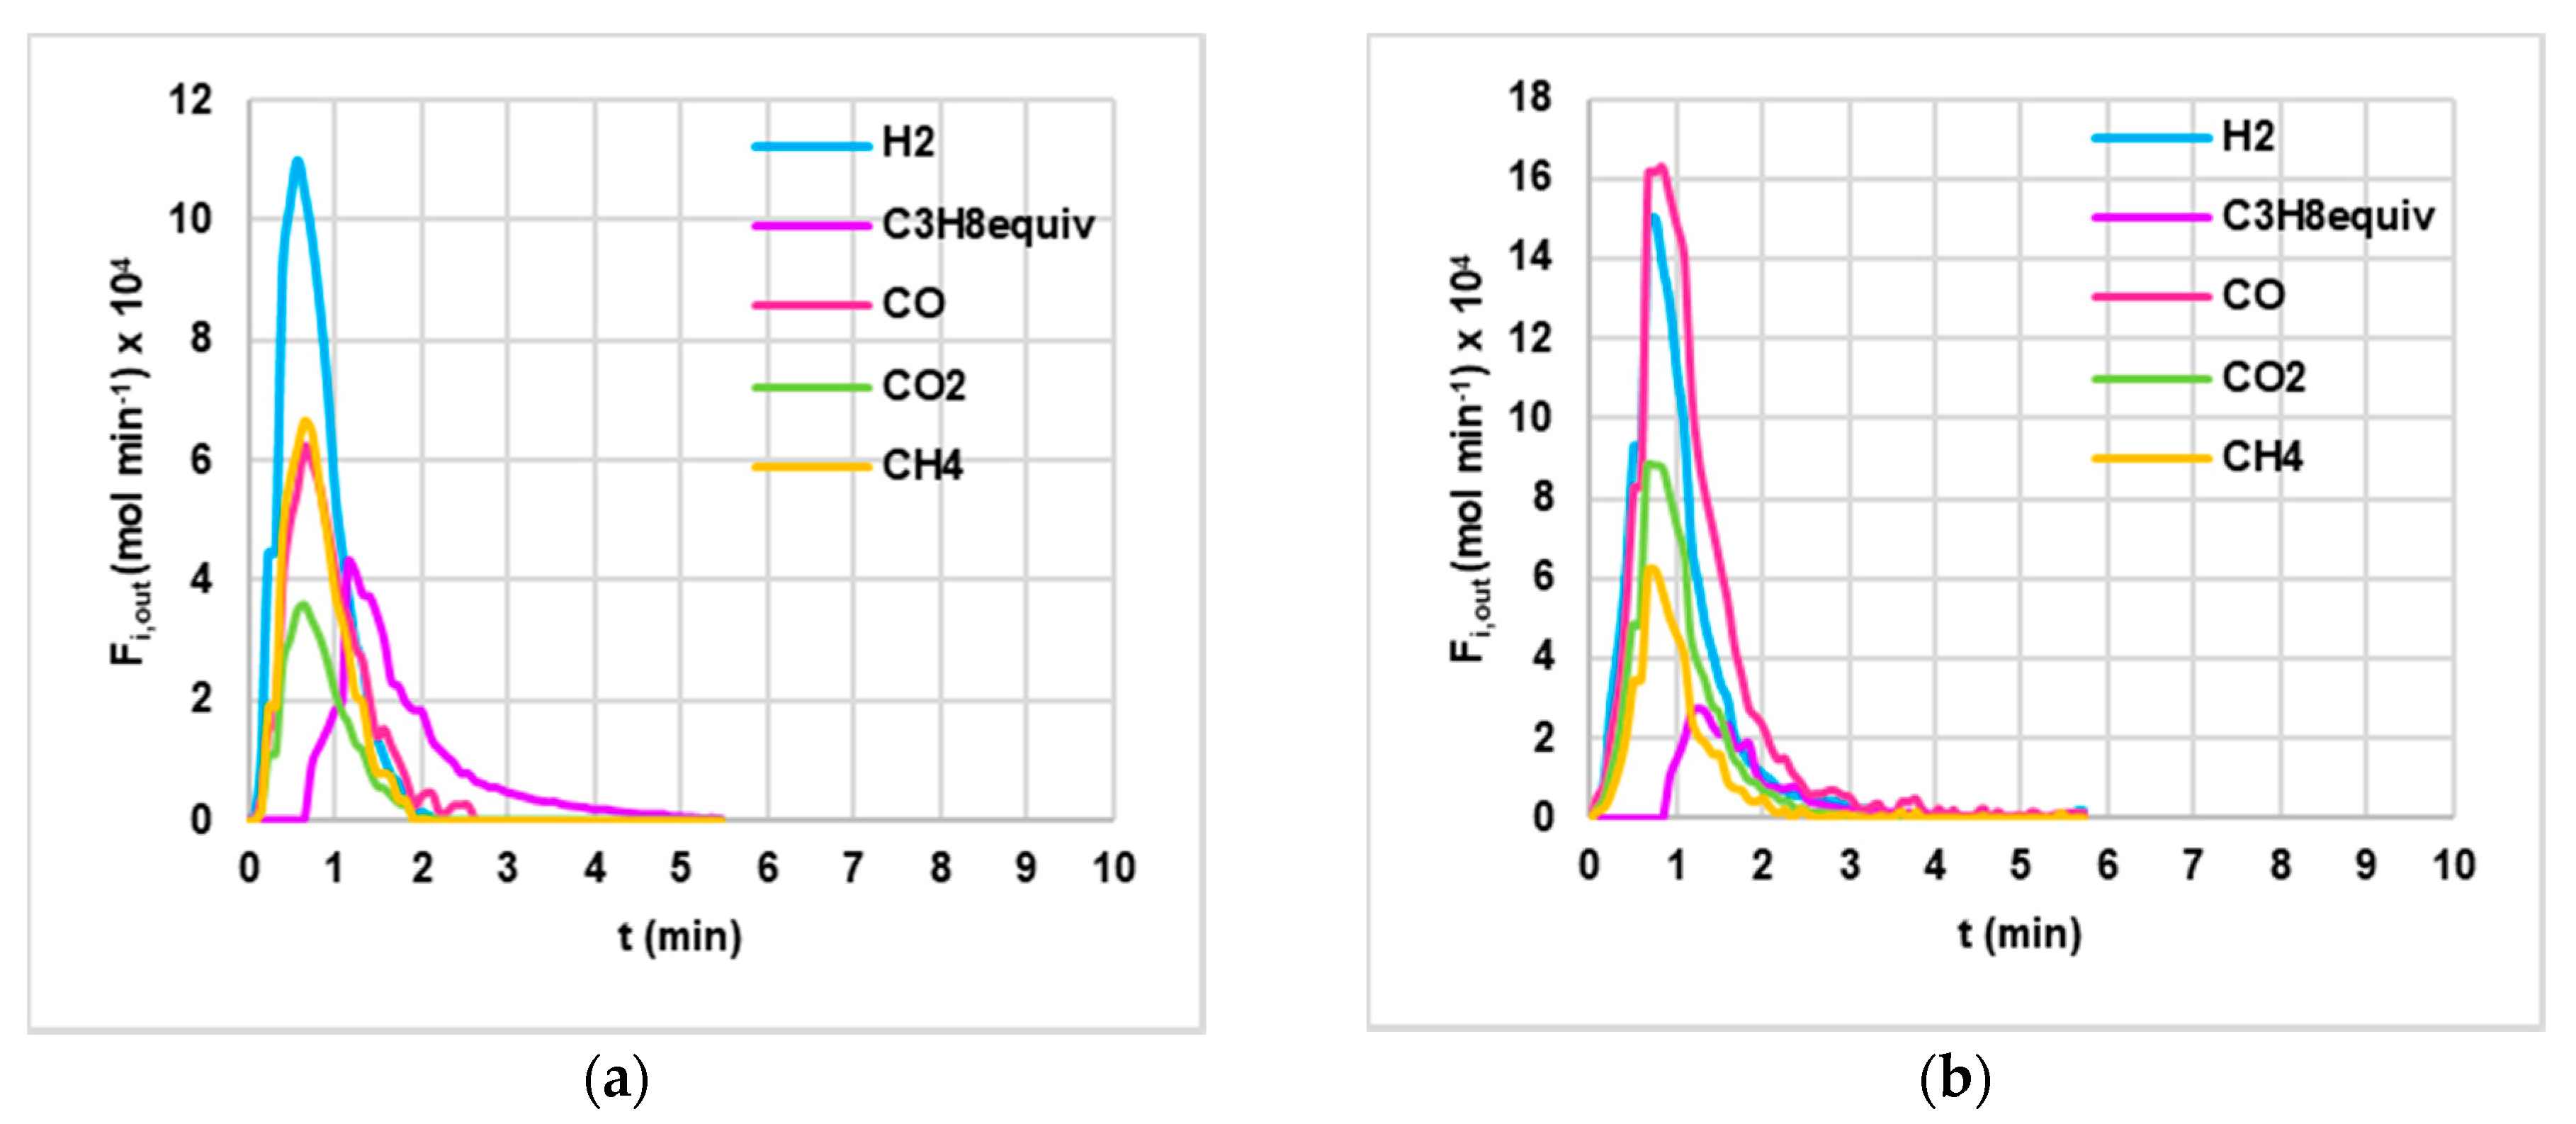
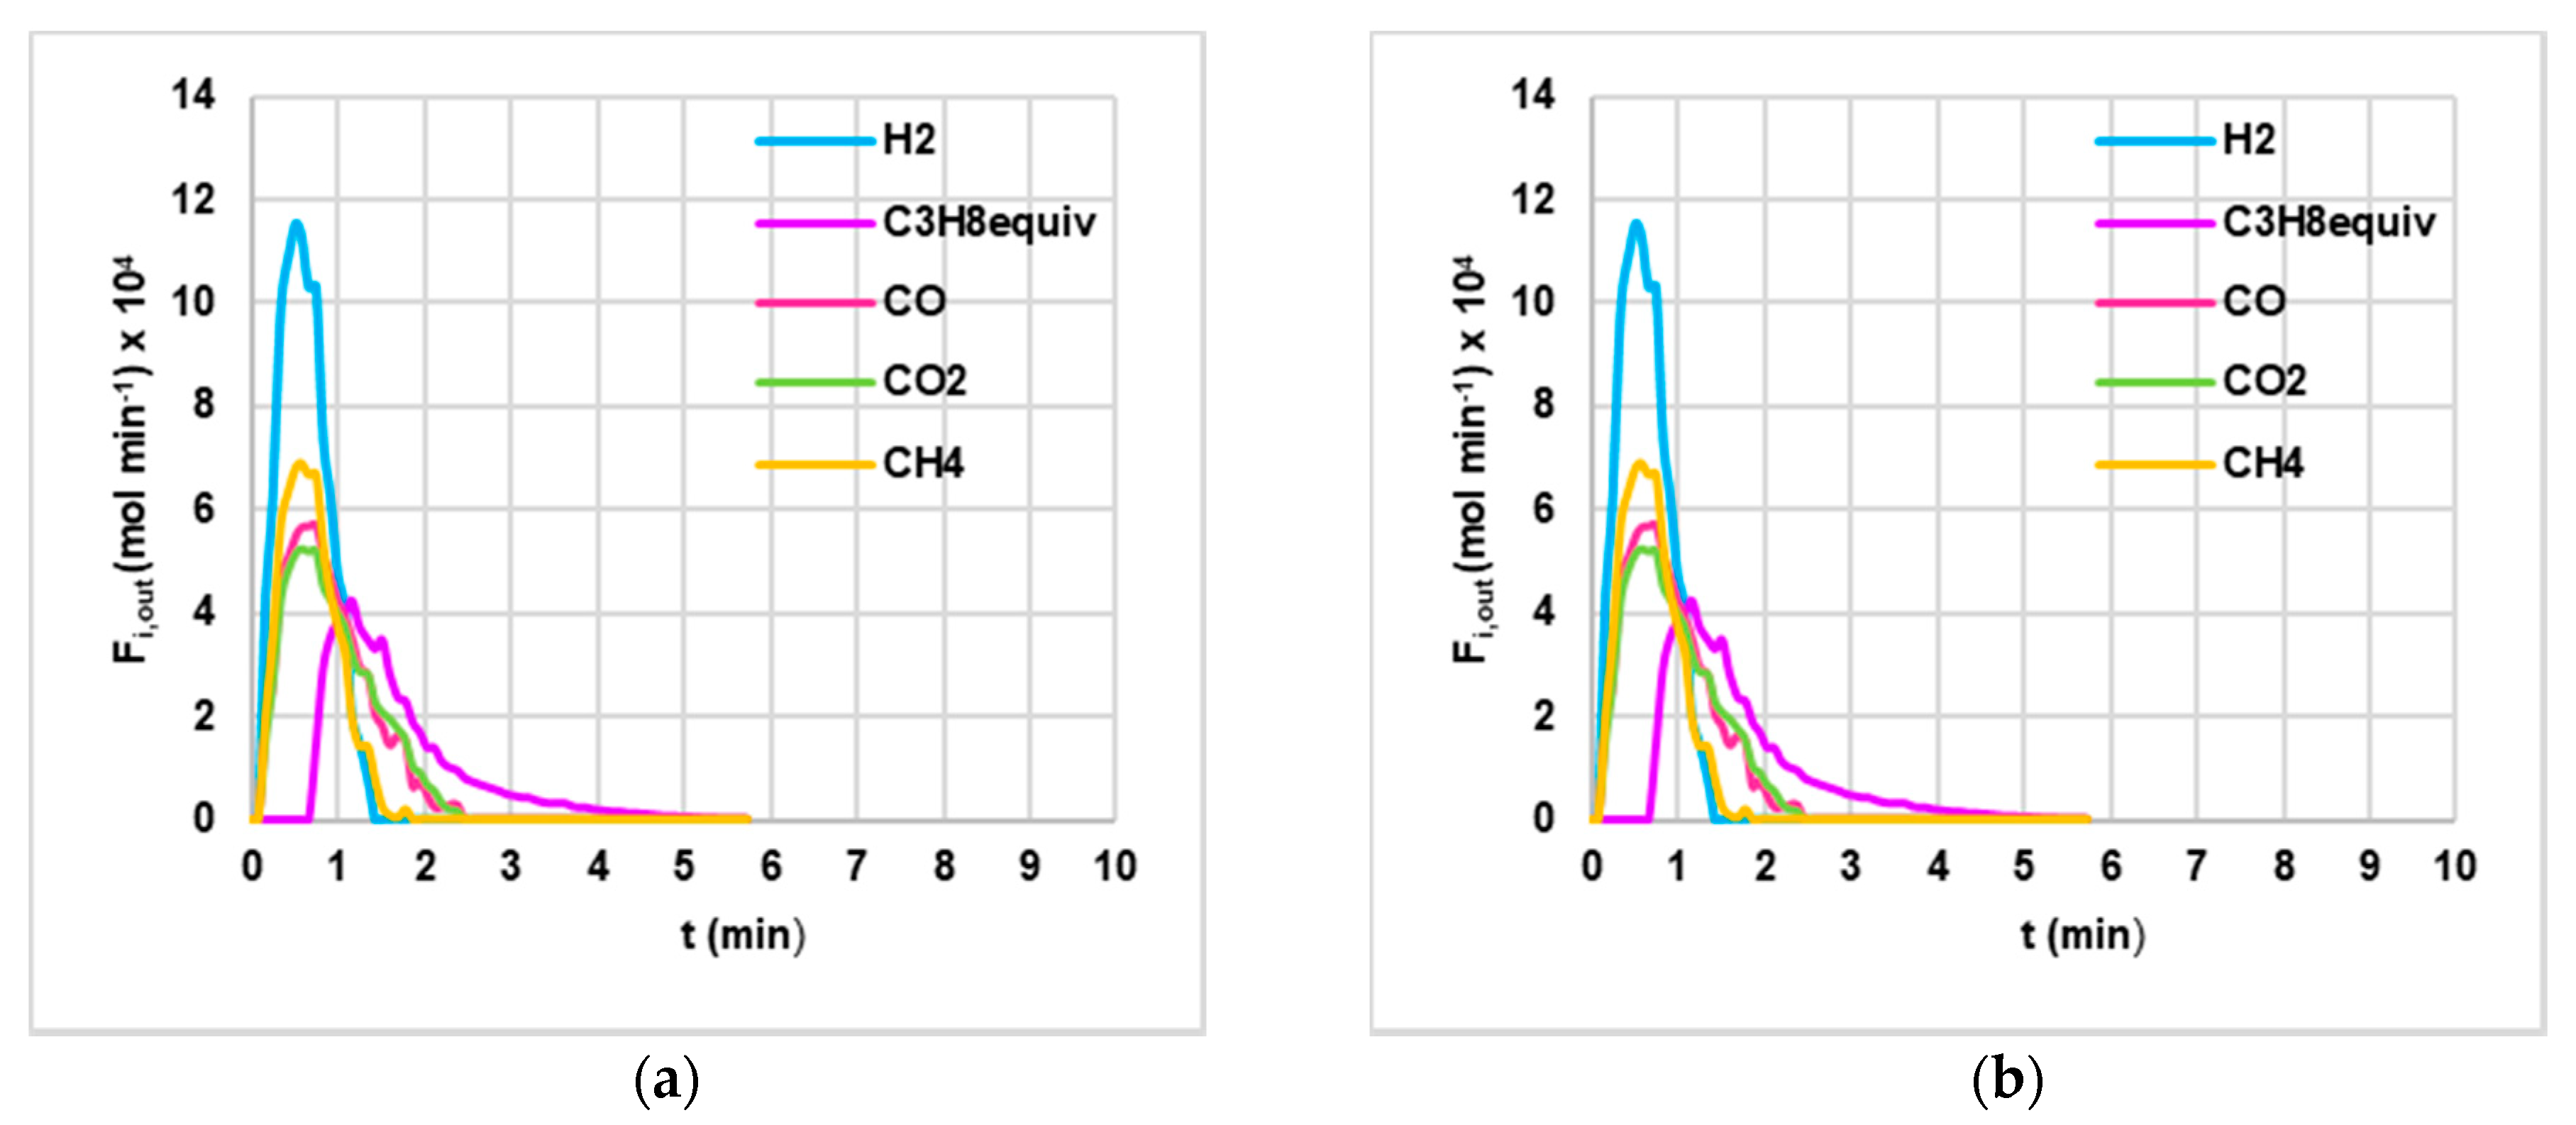
3.2. Devolatilization Tests

Figure 4 and Figure 5 show four examples of devolatilizations at 800 °C, one for each combination “fluidizing agent/material kind”. As already noted by Di Giuliano et al. [36] about similar experiments with biomass pellets, the gaseous products (H2, CO, CO2, CH4, equivalent C3H8 hydrocarbons) were released by an unsteady state process, as evidenced by the characteristic asymmetric shape of Fi,out (t) peaks. The numerical integration of Fi,out (t) curves with respect to time (t) allowed the calculation of integral-average parameters defined by Equations (1)–(3) (see Section 2.4); these values were then averaged out of the three repetitions of pellet devolatilizations for each set of condition “material kind/fluidizing agent/bed temperature”. In addition, cold gas efficiencies (Equation (4)) were calculated on the basis of abovementioned numerical integrations.
Bar charts were used to summarize the devolatilization performances of AHP materials under pure nitrogen (Figure 6) or diluted air (Figure 7), in terms of syngas composition Yiav (Equation (2), Figure 6a,b and Figure 7a,b), carbon conversion χavC (Equation (3), Figure 6c,d and Figure 7c,d), and gas yield ηav (Equation (1), Figure 6e,f and Figure 7e,f). In both figures, the left column concerns AHPam, while the right one concerns AHPus.
Colored bars in Figure 6 and Figure 7 represent average values out of the three repetitions for each set “material kind/fluidizing agent/bed temperature”; errors bars quantify the related standard deviations.
Numerical data showed in Figure 6 and Figure 7 are detailed in Appendix A of this work.
Table 6 summarizes numerical values of cold gas efficiency (ξ, Equation (4)), calculated for each set “material kind/fluidizing agent/bed temperature”, as described in Section 2.4.

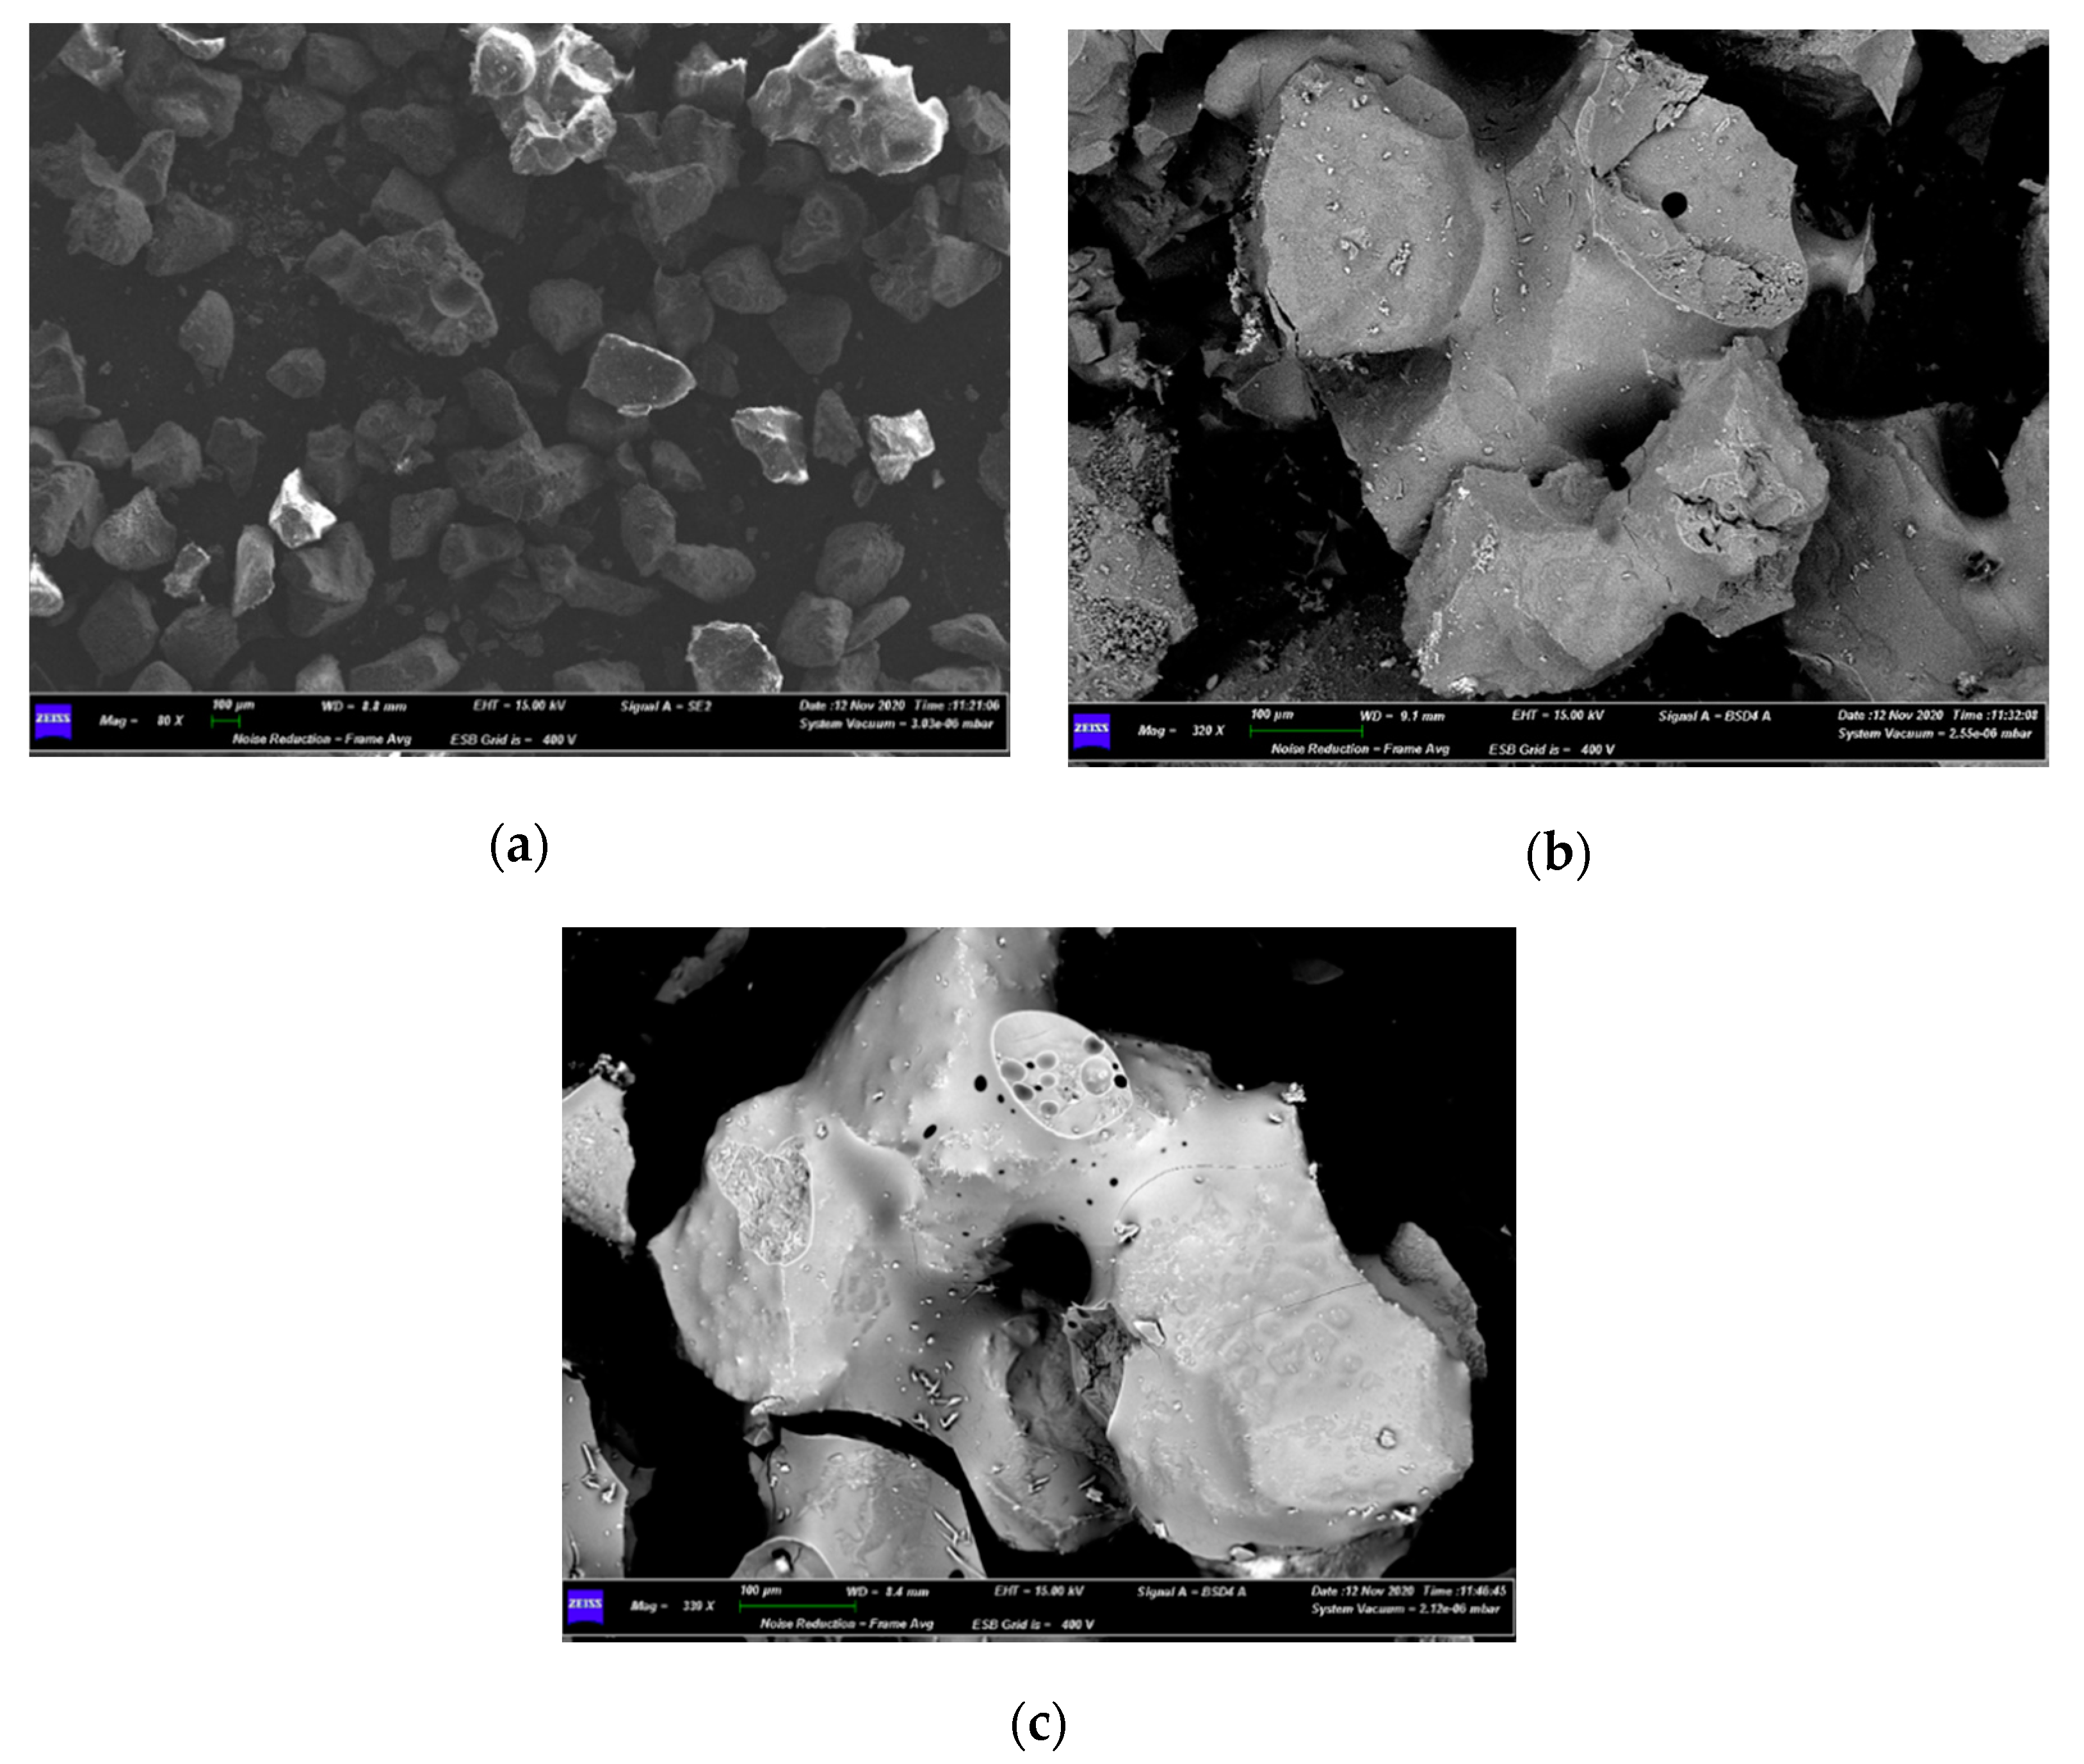
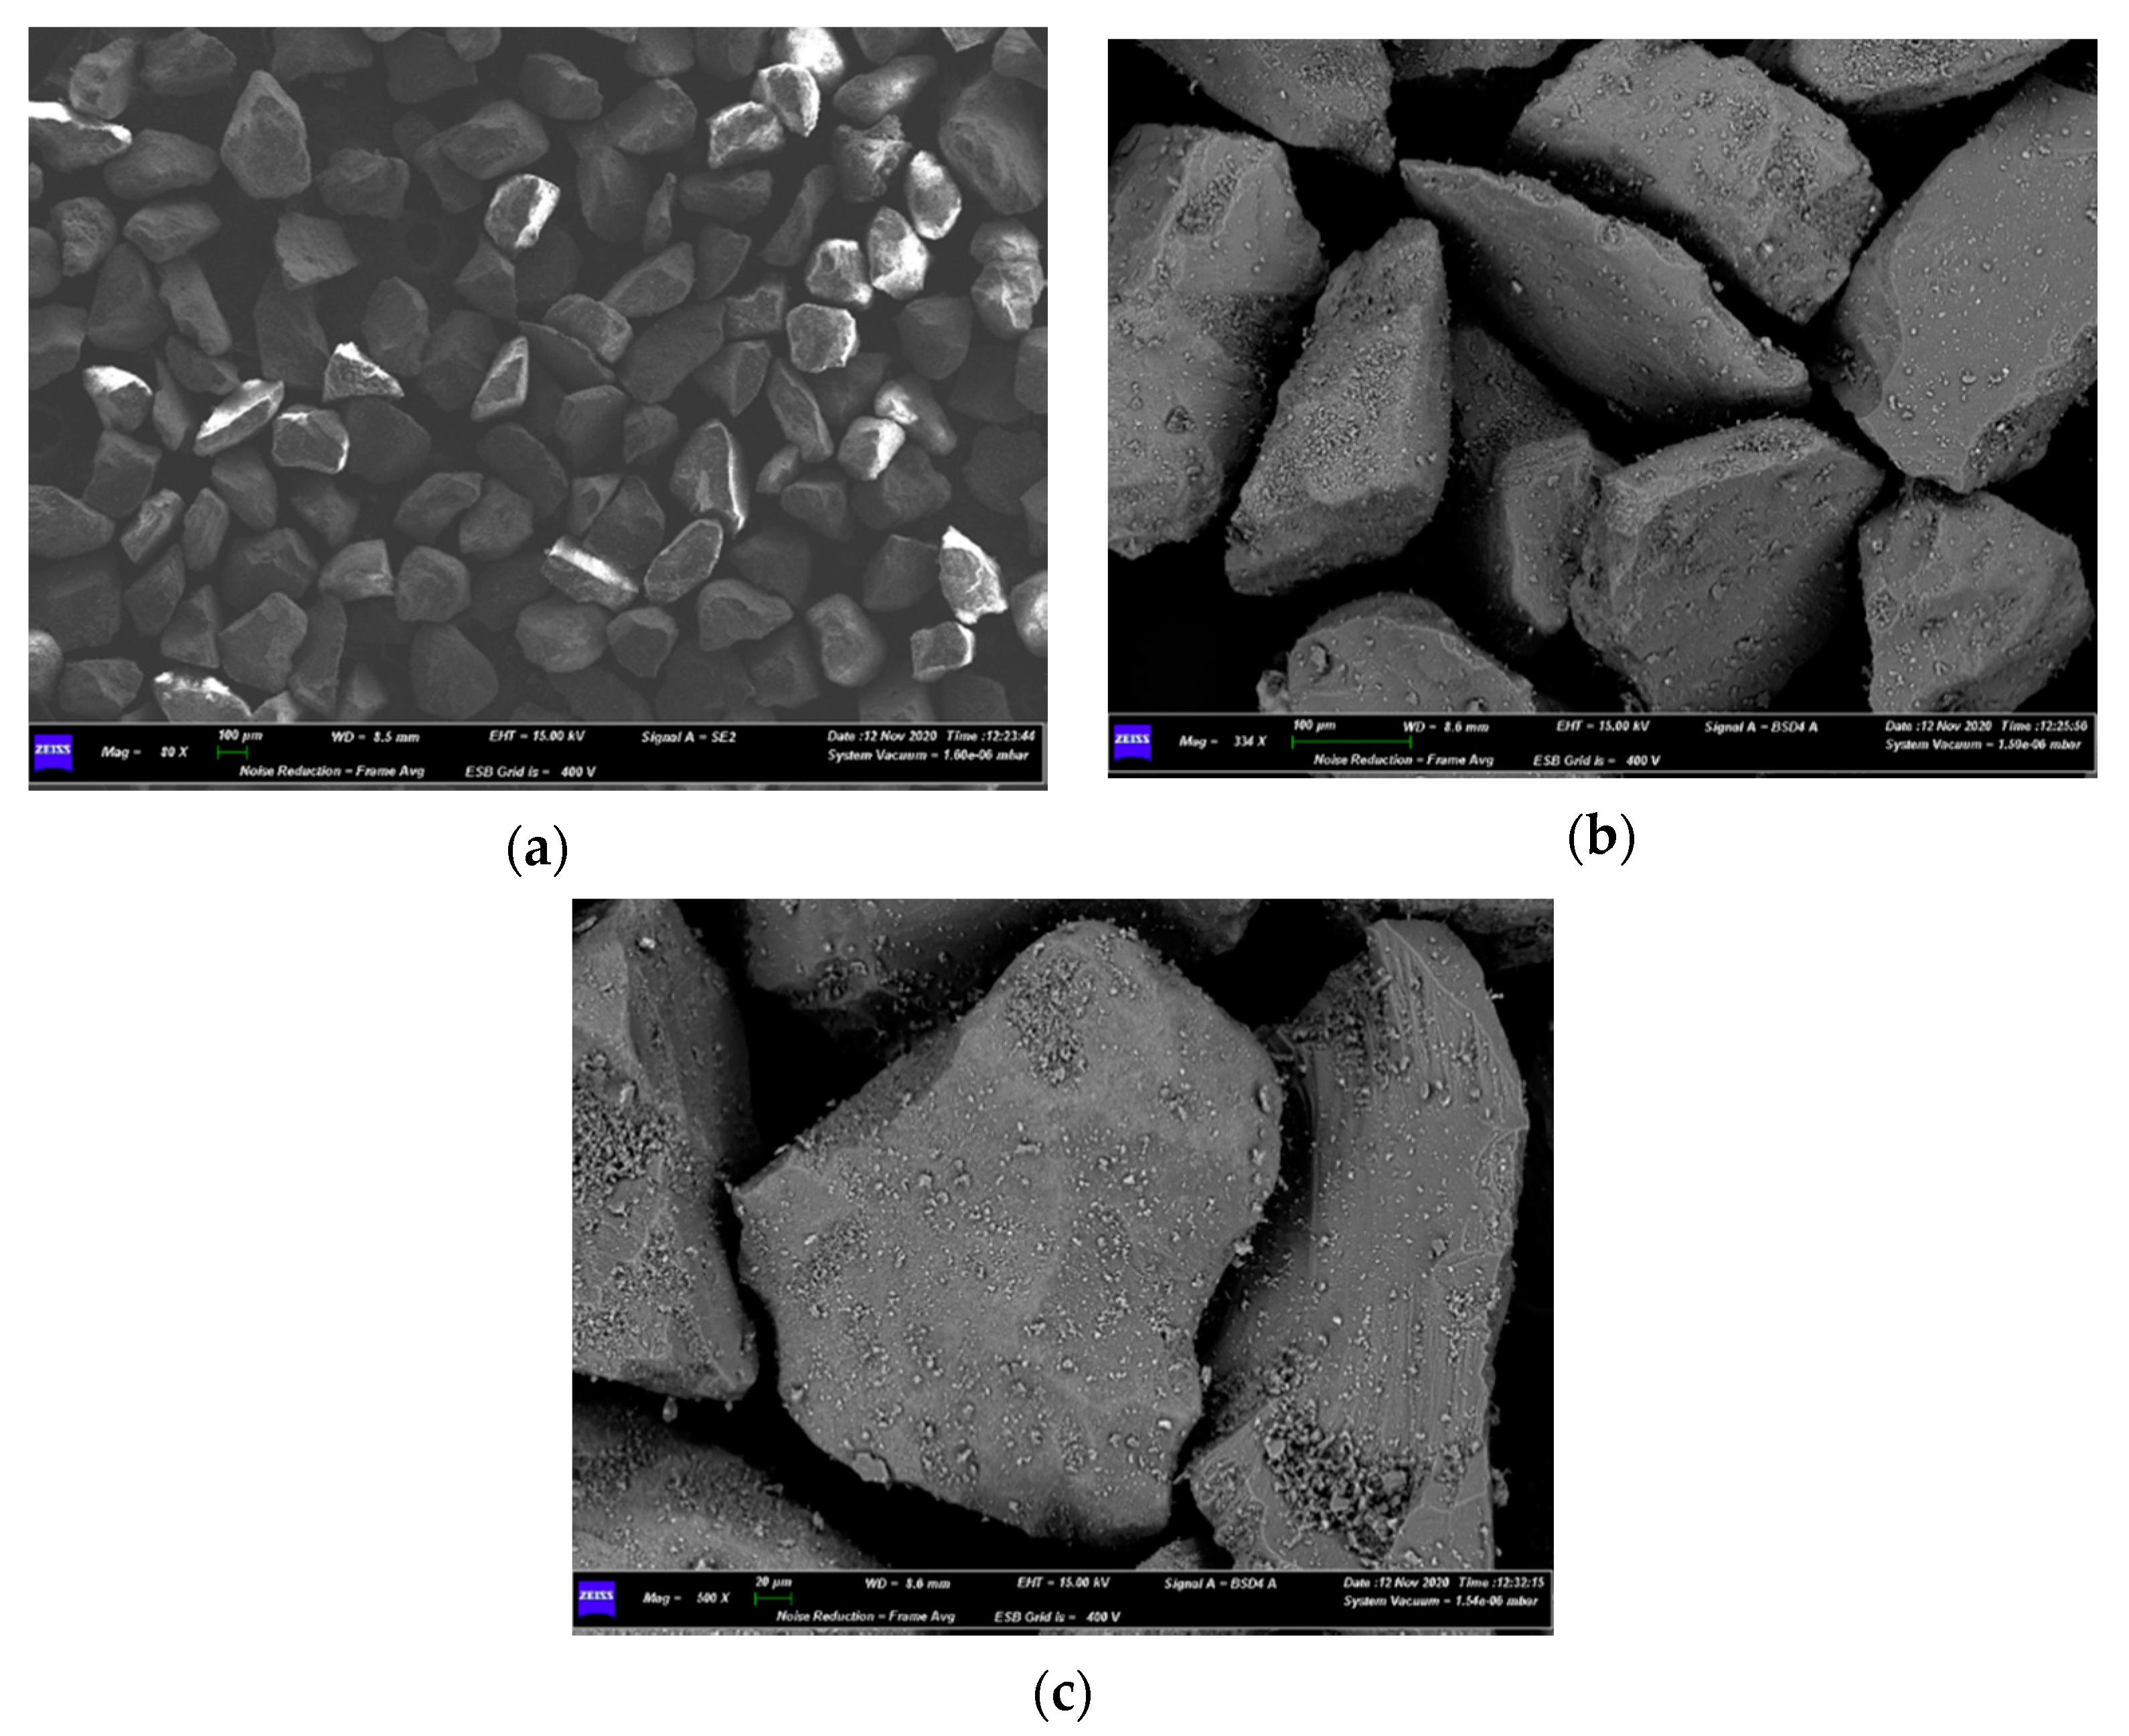
3.3. Characterizations of Spent Fluidized Bed

After devolatilization tests ended, the spent bed material was recovered and sampled by the procedure described in Section 2.5. Figure 8 shows pictures taken by the stereomicroscope on coarse sand agglomerates (Figure 3a). Figure 9, Figure 10, Figure 11 and Figure 12 show SEM micrographs of different samples from the spent bed; more in detail, these picture reveal morphological and topological aspects of coarse agglomerates (Figure 9), bed bottom (Figure 10), bed intermediate zone (Figure 11) and bed top (Figure 12).

4. Discussion

4.1. Physical-Chemical Characterizations

Table 3 shows results from proximate and ultimate analyses of AHPam and AHPus. A high volatile content resulted from proximate analyses of both materials (82.8 wt% ar for AHPam and 81.5 wt% ar for AHPus), as well as an important ash fraction (12.5 wt% for AHPam and 11.4 wt% for AHPus), for instance, higher than that of SRF [19]. The high content of volatiles was considered to be a positive factor, since the conversion of these species is favored in the thermochemical processes considered in this work [39]. The ultimate analysis highlighted the absence of nitrogen or its presence in traces (0.0 wt% db in AHPam and 0.1 wt% db in AHPus, Table 3): this could be an interesting feature in an oxyfuel conversion, as it may allow expecting no development of nitrogen-based pollutants. In general, the ultimate analysis (Table 3) for AHPam and AHPus makes them appropriate for thermochemical processes.
The semi-quantitative elemental composition, measured by XRF (Table 4), identified the main elements in the ashes of AHPam and AHPus. Ashes from AHPam mainly contained Mn, Ca and Ti, while in ashes from AHPus there were mainly Si, P, K, Cl, and Ca. With regard to S, a not negligible quantity was found in AHPus, higher by one order of magnitude than S in AHPam.
ICP-AES analyses indicated that Na content in AHPam was in the range of 2–3 wt%; it is reasonable to assume a similar Na content in AHPus.
The Na-Si phase diagram [35] shows the formation of an eutectic in the range of temperature 500–800 °C, corresponding to 45 wt% of Na in Si. This range of temperature is exactly the same considered in devolatilizations of this work. Even though only 2–3 wt% of Na was detected or assumed in waste materials from AHP, this value could have become locally higher, therefore triggering the agglomeration of sand particles. This phenomenon was demonstrated by SEM-EDS analyses of bed samples after devolatilization tests (see Section 3.2, Figure 8, Figure 9 and Figure 10).

4.2. Experimental Data from Devolatilization Tests

With regard to devolatilization tests, it is worth to stress again that they were carried out with two fluidizing agents: pure N2 or N2 plus air (i.e., diluted air). Tests with pure N2 represented a preliminary experimentation which simulated the pyrolysis of waste materials from AHP, while those with diluted air did the same for the gasification process [30]. In addition, and more interestingly for the purposes of this work, tests with pure N2 served as a reference to evaluate effects due to the slightly oxidizing atmosphere of experiments with diluted air.
The chosen devolatilization temperatures matched well with results from the combustion tests performed in TGA (Table 5), which highlighted how the combustion process ended in a range of temperatures between 500 and 600 °C. From the analysis of these results at 20 °C min−1 (the fastest heating rate performed in TGA, Table 5), decomposition by combustion extinguished at 540 °C for both AHPam and AHPus; considering that devolatilization tests involved a definitively more abrupt temperature increase from room to 500, 600, 700 or 800 °C and that thermal decomposition phenomena tend to overlap as the heating rate is increased, it is reasonable to assume that conditions in the laboratory-scale fluidized bed were sufficient to induce a substantial thermal decomposition of AHP-derived fuels.
The results from devolatilizations were presented in Section 3.2. With both fluidizing agents and both AHPam and AHPus, some general effects emerged due to the temperature increase, which were quantified by means of the parameters defined in Section 2.4.
Integral-average gas yield (ηav, Equation (1)) for AHPam had maximum values (net of standard deviations) at 700–800 °C in N2 atmosphere (Figure 6e) and at 800 °C in N2 plus air atmosphere (Figure 7e), while ηav always increased as the temperature was increased for AHPus with both fluidizing agents, reaching maximum values at 800 °C (Figure 6f and Figure 7f).
Carbon conversion (χavC, Equation (3)) for AHPam had its maximum value at 700 °C with both fluidizing agents (Figure 6c and Figure 7c); for AHPus, an increasing trend was observed as the temperature was increased, with the highest values at 800 °C, even though there were important standard deviations at 600 and 700 °C for AHPus in diluted air (Figure 6d and Figure 7d). These observations highlighted a significant differentiation of behaviors due to the solid fuel nature: with AHPam, it is not needed to heat a fluidized bed up to 800 °C to obtain the maximum χavC.
As for integral-average gas compositions (Yiav, Equation (2), Figure 6a,b and Figure 7a,b), generally the temperature increase involved an increase in H2 percentage and a decrease in hydrocarbons fraction (equivalent C3H8), with the variations of their two Yavi appearing in reciprocal correlation; it is sensible to hypothesize that hydrogen atoms which were converted in gaseous H2 came from the cellulosic and plastic matrix of the AHP materials [34].
Differences emerged concerning the formation of gaseous hydrocarbons, when comparing the gas developed from the two materials: under both atmospheres, the decomposition of AHPam produced a syngas with higher equivalent C3H8 fraction (Figure 6a vs. Figure 6b, Figure 7a vs. Figure 7b). This difference was exalted at 500 °C, the lowest investigated temperature: under N2, YavC3H8equiv was 54.8 vol% for AHPam (Figure 6a) and 16.5 vol% for AHPus (Figure 6b) on dry and dilution-free basis; the same trends and orders of magnitude were observed in the N2 plus air case (Figure 7a vs. Figure 7b). This aspect could be correlated to the composition of the material, since the AHPam contained higher carbon and hydrogen fractions than those of AHPus (elemental analyses, Table 3). This effect, due to the nature of waste materials from AHP, decreased as the temperature was increased.
A deeper qualitative insight about hydrocarbons’ nature came from the μCG analyses. Peaks with retention times compatible with those of ethylene/acetylene and propene were often detected at all tested temperatures, while those of benzene were occasionally found in syngas from tests at 800 °C under diluted air. In any case—as evidenced by Di Giuliano et al. for similar tests on the same rig of this work—those μGC analyses are only an optional means to identify some of the hydrocarbons quantified by the ABB system as “equivalent C3H8”; it must be taken into account that the μCG sampling was manually started and occurred on a flow produced by an unsteady process [36].
As for oxidized carbon in gases (CO and CO2), it is reasonable to assume that oxygen could come only from the solid phases in tests under pure N2, while fed O2 acted as an additional source in tests with N2 plus air. This assumption found confirmation in the experimental results: for both waste materials and all temperatures, devolatilizations under diluted air produced syngas with higher fractions of CO and CO2 (Figure 7a,b), in comparison with those obtained from devolatilizations under pure N2 (Figure 6a,b). On the other hand, under both atmospheres, AHPus developed higher fractions of CO and CO2 (Figure 6b and Figure 7b) than those obtained from AHPam (Figure 6a and Figure 7a), in agreement with the oxygen content of the two solid fuels (Table 3). The non-linear behavior of CO2 concentration with respect to temperature could be ascribed to the network of exothermic and endothermic reactions and the competitive trend of their thermodynamic and kinetic peculiarities.
Numerical data represented in Figure 6 and Figure 7 are reported in Appendix A of this work (Table A1 and Table A2): sometimes, important standard deviations were observed. This variability was ascribed to: (i) the macroscopic inhomogeneity of the AHP materials, which made it difficult to obtain solid pressed tablets which were fully representative of the average composition of each whole solid bulk inventory; (ii) the low density of the analyzed materials, together with small allowed dimensions of pressed tablets, involved small absolute masses of fed solid fuel per each devolatilization test, then implying a more significant relative weight of the inherent experimental errors on determined quantities.
The cold gas efficiency (ξ, Equation (4), Table 6) was used as an overall parameter to better evaluate and compare the experimental devolatilization performances. The results in Table 6 confirmed that the temperature increase produced positive effects, since it made the ξ grow for both materials and both atmospheres in the range 500–800 °C. At a given temperature, AHPus devolatilizations under both atmospheres resulted in higher ξ values than those related to AHPam (with the minor exception for pure N2 at 600 °C, Table 6). The highest ξ occurred for AHPus, at 800 °C: 56.5% in N2 atmosphere and 33.1% in N2 plus air atmosphere, respectively (Table 6). This evidence was corroborated by the higher volatile content in AHPus samples (Table 3). These results are in further agreement with the detected improvements of the composition of the produced gas (Figure 6a,b and Figure 7a,b), i.e., an increase in gaseous compounds with a higher calorific value (H2, CO and CH4) as the temperature was increased, with the concomitant increase in gas yield ηav. This suggested that the endothermic reactions of devolatilization were favored as the temperature was increased, and that the light hydrocarbon compounds, collectively reported as equivalent C3H8, were widely decomposed at 800 °C.
Overall, among all tested conditions, the range 700–800 °C appears as the best for the thermal decomposition of both waste materials from AHP, with the best performances in terms of cold gas efficiencies achieved with AHPus at 800 °C.
As a side note, the experimenters of this work would like to underline that important and progressive deposition of allegedly carbonaceous species occurred on the reactor walls and inside downstream pipelines. This made it impossible and unrealistic to close carbon balances; as a first approximation, it can be assumed that the share (100—χavC) is attributable to these deposits. This is also a significative issue, which must be considered in hypothetical scaled-up processes of the thermochemical conversion of waste materials from AHP.

4.3. Characterization of Spent Fluidized Bed

The SEM-EDS and stereoscopic microscope analyses allowed us to deepen the insight about the agglomeration of ashes and bed particles during the devolatilization tests (see Section 2.5).
Figure 8 shows pictures taken by the stereomicroscope on coarse sand agglomerates, shown at 1:1 scale in Figure 3a. Figure 8a is an overall view of bed particles after the whole devolatilization campaign under N2 and air atmosphere: many sand particles in the diameter range of 212–250 μm (Table 1) appeared as stuck in a very compact block, i.e., agglomerated into coarse groups in the order of 1–2 cm. This phenomenon could negatively affect the fluidization quality of the bed. Magnifications of stereomicroscope pictures (Figure 8b–d) evidenced the occurrence of Si particles fusion (blue circles) and carbon deposition (red circle).
Figure 9, Figure 10, Figure 11 and Figure 12 show SEM micrographs of the spent sand bed after the last test; more in detail, these pictures revealed morphological and topological aspects of coarse agglomerates (Figure 9), bed bottom (Figure 10), bed intermediate zone (Figure 11) and bed top (Figure 12).
Figure 9a shows irregularly shaped particles (dark grey) and some agglomerates (light grey, top right). Those agglomerates were detailed by Figure 9b,c, which shows: smooth bridges and jagged areas characterized by crusts and holes, together with melted covers adhering to the original grains. EDS microanalyses highlighted the presence of Si as the main constituent of those bridges, with a lower amount of Na and traces of other elements such as Al, Mg, K and Fe, documented elsewhere as possible causes of sintering phenomena [41].
In its upper part, Figure 10a shows a relatively huge chain of agglomerates, quite evident by contrast with the smaller, well segregated particles below. Figure 10b evidences the presence of the same kind of smooth bridges already found in Figure 9b,c, and areas covered by melted layers (brighter zone in Figure 10b), mainly containing Si, Na and traces of K, Al and Ca, according to EDS analyses. In addition, EDS determined that the lightest zone in Figure 10b consists of a porous structure mainly made up of Ca.
Intermediate (Figure 11) and top (Figure 12) zones of the bed revealed a very similar morphology, also at the single-particle level, as can be seen by magnified micrographs in Figure 11c and Figure 12c. A superficial, spread deposition of fine particles was observed (Figure 11b,c and Figure 12b,c), but no sintering occurred on the whole. SEM-EDS results confirmed that the spread fine particles were made up of Si and traces of Al, Mg, Na, K and Ca.
Overall, the following observations could be inferred from this microscopic characterization:
  • A priori, it was expected to find a greater number of melted particles/agglomerates in the upper part of the bed, because it is the zone of the first contact between its free surface and the falling pieces of waste materials from AHP; however, the exact opposite was found, as the smaller particles had moved to the top of the bed, while the larger ones, allegedly formed on the top, were found on the bottom. This is proof of the good mixing within the fluidized bed;
  • Agglomerations did not diffusely involve the whole bed inventory. This suggested that only where the bed had experienced locally high Na concentrations the eutectic had formed [35], even though the quantity of Na in the fed fuel was low (2–3 wt%) compared to Na eutectic concentration in Si (45 wt%) [35].

5. Conclusions

This work dealt with devolatilizations of two kinds of waste generated from Absorbent Hygiene Products (AHP): shredded scraps of as-manufactured diapers (AHPam) and shredded cellulosic fraction of used and sterilized diapers (AHPus). Tests were carried out in a laboratory-scale bubbling fluidized bed made of sand, at temperatures between 500 °C and 800 °C, under inert and mildly oxidizing atmospheres. This experimental campaign served as a preparatory step for possible scaling-up of thermochemical conversion processes with waste materials from AHP as the solid fuel feedstock.
Devolatilization performances were evaluated in terms of gas yield, carbon conversion and cold gas efficiency.
Temperature in the range 500–800 °C appeared as the most influential process parameter, followed by the oxygen content in the fluidization agent and the nature of solid fuel. Devolatilization tests performed at 700 and 800 °C, using pure nitrogen as the fluidizing agent, allowed us to obtain the highest values of gas yield (53.7 Nl 100 gfuel−1 for AHPam at 700 °C; 46.0 Nl 100 gfuel−1 for AHPus at 800 °C), carbon conversion (56.5% for AHPam at 700 °C; 55.0% for AHPus at 800 °C), and cold gas efficiency (28.8% for AHPam, 51.6% for AHPus both at 800 °C).
The oxidative atmosphere determined poorer performances in terms of cold gas efficiency (e.g., at 800 °C, 23.8% for AHPam and 33.1% for AHPus), sensibly because of the more pronounced oxidation of gaseous products, leading to a reduction in the lower heating value of syngas.
According to cold gas efficiency, AHPus appeared as the more interesting fuel feedstock when the main aim of thermochemical conversion is the production of power and heat.
SEM-EDS analyses evidenced the occurrence of agglomeration and sintering of the bed particles, ascribed to low-melting elements in the fuel ashes, such as Na, Ca, Si and K. Nevertheless, this phenomenon did not spread within the whole bed inventory and the bed mixing was kept during devolatilizations.
Important depositions of allegedly carbonaceous species were noted inside the reactor and on internal walls of downstream pipelines.
The presented experimental investigation provided results and useful information concerning the behavior of waste materials from AHP in thermochemical conversions occurring in fluidized beds. Technical issues, such as sand particle agglomeration and dirt depositions, were documented in view of the possible scale-up of thermochemical conversion processes of waste materials from AHP. In addition, devolatilization experimental results were made available for possible model validations in further studies, which could also be used to investigate process economics at hypothetical industrial scales.
Overall, AHP waste appeared as an interesting feedstock for thermochemical processes, especially if aimed at power/heat production.

Author Contributions

Conceptualization, K.G. and A.D.G.; methodology, K.G. and A.D.G.; software A.D.G. and B.M.; validation, K.G. and A.D.G.; formal analysis, K.G. and A.D.G.; investigation, K.G., A.D.G. and B.M.; resources, K.G.; data curation, K.G., A.D.G. and B.M.; writing—original draft preparation, B.M.; writing—review and editing, K.G., A.D.G. and B.M.; visualization, K.G., A.D.G. and B.M.; supervision, K.G.; project administration, K.G.; funding acquisition, K.G. All authors have read and agreed to the published version of the manuscript.

Funding

This research was funded by ALMACIS s.r.l.

Institutional Review Board Statement

Not applicable.

Informed Consent Statement

Not applicable.

Data Availability Statement

The data presented in this study are available on request from the corresponding author.

Acknowledgments

The provision of AHP materials by ALMACIS s.r.l. is acknowledged. The authors warmly thank Giampaolo Antonelli for his technical support, and Fabiola Ferrante for XRF and CHNS/O analyses and management.

Conflicts of Interest

The authors declare no conflict of interest. The funders had no role in the design of the study; in the collection, analyses, or interpretation of data; in the writing of the manuscript, or in the decision to publish the results.

Appendix A

This appendix summarizes the numerical results discussed in this manuscript. Table A1 and Table A2 show the experimental data of devolatilization tests, discussed in the main text and reported as bar charts in Figure 6 and Figure 7.
Table A1. Experimental results of devolatilization tests under nitrogen atmosphere, as functions of temperature (av3: average of results from the three individual pellets; sd3: standard deviation of results from the three individual pellets).
SampleηavχavCYavH2YavC3H8equivYavCOYavCO2YavCH4
(Nl Per 100 gfuel)(%)(mol% Dry N2-Free)(mol% Dry N2-Free)(mol% Dry N2-Free)(mol% Dry N2-Free)(mol% Dry N2-Free)
av3sd3av3sd3av3sd3av3sd3av3sd3av3sd3av3sd3
500 °C
AHPam10.03.1117.85.12.803.9054.810.29.004.6215.57.9117.83.63
AHPus15.87.6725.411.17.904.8016.57.2627.86.5033.33.0014.59.96
600 °C
AHPam34.52.4343.82.515.60.6330.83.9614.72.7118.13.5020.82.24
AHPus25.021.438.628.710.74.0717.75.8633.44.6623.51.4014.70.38
700 °C
AHPam53.76.6656.54.923.33.7222.55.0321.02.5513.50.3819.82.02
AHPus29.819.842.218.720.14.0724.723.825.79.7918.76.6210.84.00
800 °C
AHPam52.59.5145.55.829.52.0514.82.8025.44.0412.91.7417.51.73
AHPus46.05.4055.02.123.55.537.400.9836.40.8920.73.9512.01.36
Table A2. Experimental results of devolatilization tests under nitrogen plus air atmosphere, as functions of temperature (av3: average of results from the three individual pellets; sd3: standard deviation of results from the three individual pellets).
SampleηavχavCYavH2YavC3H8equivYavCOYavCO2YavCH4
(Nl Per 100 gfuel)(%)(mol% Dry N2-Free)(mol% Dry N2-Free)(mol% Dry N2-Free)(mol% Dry N2-Free)(mol% Dry N2-Free)
av3sd3av3sd3av3sd3av3sd3av3sd3av3sd3av3sd3
500 °C
AHPam19.22.5331.96.90.000.0045.013.315.75.9024.69.0014.84.40
AHPus17.211.228.413.20.000.0018.413.628.65.0041.08.5012.00.80
600 °C
AHPam29.62.1435.72.0011.12.125.00.6018.21.9025.02.1020.61.20
AHPus25.514.638.016.37.33.316.916.229.18.7033.48.6013.32.10
700 °C
AHPam38.07.1149.16.0011.32.3030.55.0317.91.7019.70.6030.50.80
AHPus31.65.1445.15.5013.60.3011.12.2028.62.5034.24.8011.11.00
800 °C
AHPam51.517.645.17.9023.35.0013.87.1019.61.2027.07.9016.33.10
AHPus38.710.951.111.814.70.407.802.6029.33.8038.27.1010.01.70

References

  1. Perea-Moreno, M.A.; Samerón-Manzano, E.; Perea-Moreno, A.J. Biomass as renewable energy: Worldwide research trends. Sustainability 2019, 11, 863. [Google Scholar] [CrossRef] [Green Version]
  2. Bongaarts, J. Development: Slow down population growth. Nature 2016, 530, 409–412. [Google Scholar] [CrossRef] [PubMed] [Green Version]
  3. Ellen MacArthur Foundation Circular Economy-UK, USA, Europe, Asia & South America-The Ellen MacArthur Foundation. Available online: https://www.ellenmacarthurfoundation.org/ (accessed on 23 March 2021).
  4. The World Bank What a Waste: An Updated Look into the Future of Solid Waste Management. Available online: https://www.worldbank.org/en/news/immersive-story/2018/09/20/what-a-waste-an-updated-look-into-the-future-of-solid-waste-management (accessed on 11 March 2021).
  5. EC European Commission–Environment–Circular Economy Strategy. Available online: http://ec.europa.eu/environment/circular-economy/index_en.htm (accessed on 11 March 2021).
  6. Obama, B. The irreversible momentum of clean energy: Private-sector efforts help drive decoupling of emissions and economic growth. Science 2017, 355, 126–129. [Google Scholar] [CrossRef] [PubMed] [Green Version]
  7. Marris, E. Why young climate activists have captured the world’s attention. Nature 2019, 573, 471–473. Available online: https://www.nature.com/articles/d41586-019-02696-0 (accessed on 11 March 2021). [CrossRef] [PubMed]
  8. United Nations Climate Change The Paris Agreement|UNFCCC. Available online: https://unfccc.int/process-and-meetings/the-paris-agreement/the-paris-agreement (accessed on 11 March 2021).
  9. COP 24|UNFCCC. Available online: https://unfccc.int/process-and-meetings/conferences/past-conferences/katowice-climate-change-conference-december-2018/sessions-of-negotiating-bodies/cop-24 (accessed on 11 March 2021).
  10. A European Green Deal|European Commission. Available online: https://ec.europa.eu/info/strategy/priorities-2019-2024/european-green-deal_en (accessed on 3 January 2021).
  11. Johnston, R.B. Arsenic and the 2030 Agenda for sustainable development. Arsen. Res. and Glob. Sustain. As 2016, 12–14. [Google Scholar] [CrossRef]
  12. Arena, U. Process and technological aspects of municipal solid waste gasification. A review. Waste Manag. 2012, 32, 625–639. [Google Scholar] [CrossRef] [PubMed]
  13. Lombardi, L.; Carnevale, E.; Corti, A. A review of technologies and performances of thermal treatment systems for energy recovery from waste. Waste Manag. 2015, 37, 26–44. [Google Scholar] [CrossRef] [PubMed]
  14. Materazzi, M.; Foscolo, P.U. The role of waste and renewable gas to decarbonize the energy sector. In Substitute Natural Gas from Waste: Technical Assessment and Industrial Applications of Biochemical and Thermochemical Processes; Academic Press: London, UK, 2019; ISBN 9780128155547. [Google Scholar]
  15. Lig2Liq–Cost Effective Conversion of Lignite and Waste to Liquid Fuels. Available online: https://www.lig2liq.eu/ (accessed on 3 January 2021).
  16. Weber, G.; Di Giuliano, A.; Rauch, R.; Hofbauer, H. Developing a simulation model for a mixed alcohol synthesis reactor and validation of experimental data in IPSEpro. Fuel Process. Technol. 2016, 141, 167–176. [Google Scholar] [CrossRef]
  17. Rapagnà, S.; Gallucci, K.; Foscolo, P.U. Olivine, dolomite and ceramic filters in one vessel to produce clean gas from biomass. Waste Manag. 2018, 71, 792–800. [Google Scholar] [CrossRef] [PubMed]
  18. Molino, A.; Chianese, S.; Musmarra, D. Biomass gasification technology: The state of the art overview. J. Energy Chem. 2016, 25, 10–25. [Google Scholar] [CrossRef]
  19. Savuto, E.; Di Carlo, A.; Gallucci, K.; Di Giuliano, A.; Rapagnà, S. Steam gasification of lignite and solid recovered fuel (SRF) in a bench scale fluidized bed gasifier. Waste Manag. 2020, 114, 341–350. [Google Scholar] [CrossRef] [PubMed]
  20. European Comission Innovation and Networks Executive Agency. Available online: https://ec.europa.eu/inea/en/connecting-europe-facility/cef-transport/projects-by-country/multi-country/2014-eu-tm-0196-s (accessed on 23 March 2021).
  21. Treatment of Absorbent Hygiene Products for Improved Recycling of Materials|Green Best Practice Community. Available online: https://greenbestpractice.jrc.ec.europa.eu/node/131#bemp_general_title_id (accessed on 23 March 2021).
  22. Waldheim, L. Gasification of Waste for Energy Carriers–A Review. 2018. Available online: https://www.etipbioenergy.eu/databases/reports/353-gasification-of-waste-for-energy-carriers-a-review (accessed on 23 March 2021).
  23. Deliverable Number 1.7–Blueprint for the Replication of the AHP Pretreatment Technol; Establishing a Multi-Purpose Biorefinery for the Recycling of the Organic Content of AHP Waste in Circular Economy Domain Grant Agreement No.: 745746. Available online: https://www.embraced.eu/repository/EMBRACED_D1.7_Blueprint_DEF.pdf (accessed on 23 March 2021).
  24. Mendoza, J.M.F.; D’Aponte, F.; Gualtieri, D.; Azapagic, A. Disposable baby diapers: Life cycle costs, eco-efficiency and circular economy. J. Clean. Prod. 2019, 211, 455–467. [Google Scholar] [CrossRef] [Green Version]
  25. Kashyap, P.; Ko Win, T.; Visvanathan, C. Absorbent Hygiene Products-An emerging urban waste management issue. In Proceedings of the Asia-Pacific Conference on Biotechnology for Waste Conversion 2016, Hong Kong, China, 5–8 December 2016. [Google Scholar]
  26. Arena, U.; Ardolino, F.; Gregorio, F.D.I. Sustainability of an Integrated Recycling Process of Absorbent Hygiene Products. In Proceedings of the 15th International Waste Management and Landfill Symposium, Cagliari, Italy, 5–9 October 2015. [Google Scholar]
  27. Gerina-Ancane, A.; Eiduka, A. Research and analysis of Absorbent Hygiene Product (AHP) recycling. In Proceedings of the Engineering for Rural Development, Jelgava, Latvia, 25–27 May 2016; Volume 2016, pp. 904–910. [Google Scholar]
  28. Khanyile, A.; Caws, G.C.; Nkomo, S.L.; Mkhize, N.M. Characterisation study of various disposable diaper brands. Sustainability 2020, 12, 437. [Google Scholar] [CrossRef]
  29. Khoo, S.C.; Phang, X.Y.; Ng, C.M.; Lim, K.L.; Lam, S.S.; Ma, N.L. Recent technologies for treatment and recycling of used disposable baby diapers. Process Saf. Environ. Prot. 2019, 123, 116–129. [Google Scholar] [CrossRef]
  30. Roddy, D.J.; Manson-Whitton, C. Biomass Gasification and Pyrolysis. In Comprehensive Renewable Energy-Biomass & Biofuels 2012; Elsevier: Amsterdam, The Netherlands, 2012; Volume 5, ISBN 9780080878737. [Google Scholar]
  31. Bassano, C.; Deiana, P.; Ricci, G.; Veca, E.; Rse, R. Analisi Termogravimetrica su Campioni di Carbone. 2009. Available online: https://docplayer.it/2987461-Analisi-termogravimetrica-su-campioni-di-carbone.html (accessed on 23 March 2021).
  32. BS EN 15414-3:2011Solid Recovered Fuels. Determination of Moisture Content Using the Oven Dry Method. Moisture in General Analysis Sample. Available online: https://www.en-standard.eu/din-en-15414-3-solid-recovered-fuels-determination-of-moisture-content-using-the-oven-dry-method-part-3-moisture-in-general-analysis-sample/ (accessed on 23 March 2021).
  33. BS 1016-104.4-1998: Methods for Analysis and Testing of Coal and Coke. Proximate Analysis. Determination of ash. Available online: https://shop.bsigroup.com/ProductDetail/?pid=000000000030013765 (accessed on 23 March 2021).
  34. Ambiente Italia s.r.l. Analisi Ambientale della Raccolta e del Riciclo di Prodotti Sanitari Assorbenti Risultati Sintetici. Available online: https://www.senato.it/application/xmanager/projects/leg17/attachments/documento_evento_procedura_commissione/files/000/000/636/Documentazione_FATER.pdf (accessed on 23 March 2021).
  35. Okamoto, H. Supplemental Literature Review of Binary Phase Diagrams: Ag-Nd, Ag-Zr, Al-Nb, B-Re, B-Si, In-Pt, Ir-Y, Na-Si, Na-Zn, Nb-P, Nd-Pt, and Th-Zr. J. Phase Equilibria Diffus. 2014, 35, 636–648. [Google Scholar] [CrossRef]
  36. Di Giuliano, A.; Lucantonio, S.; Gallucci, K. Devolatilization of Residual Biomasses for Chemical Looping Gasification in Fluidized Beds Made Up of Oxygen-Carriers. Energies 2021, 14, 311. [Google Scholar] [CrossRef]
  37. Scala, F. Particle agglomeration during fluidized bed combustion: Mechanisms, early detection and possible countermeasures. Fuel Process. Technol. 2018, 171, 31–38. [Google Scholar] [CrossRef]
  38. Gibilaro, L.G. Fluidization-Dynamic; Butterworth-Heinemann: Oxford, UK, 2001; ISBN 978-0-7506-5003-8. Available online: https://books.google.co.jp/books?hl=zh-CN&lr=&id=RlZutdBFy4sC&oi=fnd&pg=PP1&dq=Gibilaro,+L.G.+Fluidization-Dynamic%3B+Butterworth-Heinemann:+2001%3B+ISBN+978-0-7506-5003-8,+doi:10.1016/B978-0-7506-5003-8.X5000-9.&ots=Jn_kGOQKRB&sig=IisegBeCakEykL43CA6MirBVotk&redir_esc=y#v=onepage&q&f=false (accessed on 23 March 2021). [CrossRef]
  39. Basu, P. Combustion and Gasification in Fluidized Beds; CRC Press/Taylor & Francis: Abingdon, UK, 2006; ISBN 9780849333965. [Google Scholar]
  40. Green, D.W.; Robert, H.P. Perry’s Chemical Engineers’ Handbook, 8th ed.; McGraw-Hill: New York, NY, USA, 2017; ISBN 978007142294. [Google Scholar]
  41. Namkung, H.; Xu, L.H.; Kim, C.H.; Yuan, X.; Kang, T.J.; Kim, H.T. Effect of mineral components on sintering of ash particles at low temperature fouling conditions. Fuel Process. Technol. 2016, 141, 82–92. [Google Scholar] [CrossRef]
Figure 1. Coarsely shredded diapers (AHPam) (a); cellulosic fraction of sterilized diapers (AHPus) (b).
Energies 14 02399 g001
Figure 2. Schematic view of the laboratory-scale experimental apparatus for devolatilization tests.
Energies 14 02399 g002
Figure 3. Examples of samples from the spent bed after the devolatilization tests: (a) coarse agglomerates of the bed, (b) top of the bed, (c) bottom of the bed, (d) intermediate part of the bed.
Energies 14 02399 g003
Figure 4. Example of H2, CO, CO2, CH4 and equivalent C3H8 outlet molar flow rates (Fi,out) as functions of time (t), produced by devolatilizations of AHPam (a) and AHPus (b), in the sand fluidized bed, at 800 °C, under nitrogen atmosphere.
Energies 14 02399 g004
Figure 5. Example of H2, CO, CO2, CH4 and equivalent C3H8 outlet molar flow rates (Fi,out) as functions of time (t) produced by devolatilizations of AHPam (a) and AHPus (b), in the sand fluidized bed, at 800 °C, under nitrogen plus air atmosphere (diluted air).
Energies 14 02399 g005
Figure 6. Experimental results of devolatilization tests under nitrogen atmosphere, in the sand fluidized bed, as functions of temperature: integral-average mol% dry, dilution-free (Yiav, Equation (2)) of AHPam (a) AHPus (b); integral-average carbon conversion (χavC, Equation (3)) of AHPam (c) AHPus (d); integral-average gas yield (ηav, Equation (1)) of AHPam (e) AHPus (f); colored bars represent average values out of the three repetitions for each set “material kind/fluidizing agent/bed temperature”, errors bars quantify the related standard deviations.
Energies 14 02399 g006
Figure 7. Experimental results of devolatilization tests under nitrogen plus air atmosphere, in the sand fluidized bed, as functions of temperature: integral-average mol% dry, dilution-free (Yiav, Equation (2)) of AHPam (a) AHPus (b); integral-average carbon conversion (χavC, Equation (3)) of AHPam (c) AHPus (d); integral-average gas yield (ηav, Equation (1)) of AHPam (e) AHPus (f); colored bars represent average values out of the three repetitions for each set “material kind/fluidizing agent/bed temperature”, errors bars quantify the related standard deviations.
Energies 14 02399 g007
Figure 8. Stereo-microscope images of agglomerates from the spent sand bed after the last test, magnified at: 1× (a); 2× (b); 4× (c); 4× (d).
Energies 14 02399 g008
Figure 9. SEM micrographs of the coarse agglomerates from the spent sand bed after the last test, magnified at: 80× (a); 320× (b); 339× (c).
Energies 14 02399 g009
Figure 10. SEM micrographs of bottom of spent sand bed after the last test, magnified at: 80× (a); 336× (b).
Energies 14 02399 g010
Figure 11. SEM micrographs of intermediate part of spent sand bed after the last test, magnified at: 80× (a); 336× (b); 500× (c).
Energies 14 02399 g011
Figure 12. SEM micrographs of top of spent sand bed after the last test, magnified at: 80× (a); 334× (b); 500× (c).
Energies 14 02399 g012
Table 1. Bed material: physical properties of fluid-dynamic interest and minimum fluidization velocity (umf) as a function of temperature at devolatilization conditions described in Section 2.4.
Bed MaterialSand
dp (μm)212–250
ρp (kg m−3)2587
T (°C)umf (cm s−1)
5002.9
6002.7
7002.5
8002.3
Table 2. Lower heating values of gas components (LHVg,i) and waste materials from AHP (LHVp), defined for Equation (4).
GasLHVg,i [MJ kmol−1]Ref
CO282.99[39]
CO20
H2241.83[39]
CH4802.34[39]
C3H846.2[40]
MaterialLHVp [MJ kg−1]
AHPam23.60[34]
AHPus10.36[34]
Table 3. Proximate and ultimate analyses of AHPam and AHPus (wt% ar = weight percent on as-received basis; wt% db = weight percent on dry basis).
wt% ar
AHPamAHPus
Dry weight94.293.4
Moisture5.86.6
Ashes7.510.7
Volatile matter82.881.5
Fixed carbon3.91.2
wt% db
C65.343.5
H10.36.6
N0.00.1
S1.11.8
O23.348.0
Table 4. Semi-quantitative elemental composition of AHPam and AHPus, measured by X-ray fluorescence (XRF) (abs. err. = absolute error).
ElementAHPamAHPus
(wt %)abs. err. (wt %)(wt %)abs. err. (wt %)
Mg1.0070.031<0.00200.0
Al<0.00200.0<0.00200.0
Si0.10160.00241.2720.008
P0.05810.0010.52380.0034
S0.039470.000494.4670.005
Cl0.00790.000161.4250.002
K0.046410.000692.9350.003
Ca11.990.011.1570.002
Ti1.4020.0010.081080.00029
V0.053970.00060.004650.00013
Cr<0.000100.00.007960.00006
Mn0.012070.000080.009060.00007
Fe0.30680.00090.21590.0006
Table 5. End decomposition temperature of AHPam and AHPus, measured during TGA combustions under air flux.
Heating Rates (°C min−1)51020
Temperature of decomposition end for AHPam (°C)690660540
Temperature of decomposition end for AHPus (°C)530520540
Table 6. Cold gas efficiency (ξ, Equation (4)) for each set “material kind/fluidizing agent/bed temperature”.
TTests with N2Tests with N2 Plus Air
(°C)AHPam
(%)
AHPus
(%)
AHPam
(%)
AHPus
(%)
5002.616.56.813.8
60027.627.114.323.9
70029.132.218.629.7
80028.851.623.833.1
Publisher’s Note: MDPI stays neutral with regard to jurisdictional claims in published maps and institutional affiliations.

