
Plug-in Hybrid Ecological Category in Real Driving Emissions


Abstract
:1. Introduction
2. Aim of the Paper
- The proposal to categories vehicles was not developed on a large scale (with the exceptions quoted above), particularly in road emission tests. The projects so far have been mainly based on the exhaust emission results of homologation tests, in which the only criterion was the maximum value of exhaust emission. There is a research niche in the approach proposed in the paper—the authors propose two extreme values: maximum (used so far), but they also outline the methodology for determining the minimum value of exhaust emission.
- The information defining the categorization of vehicles in road emissions tests in terms of, among other things, exhaust emissions reflects the latest literature data well:
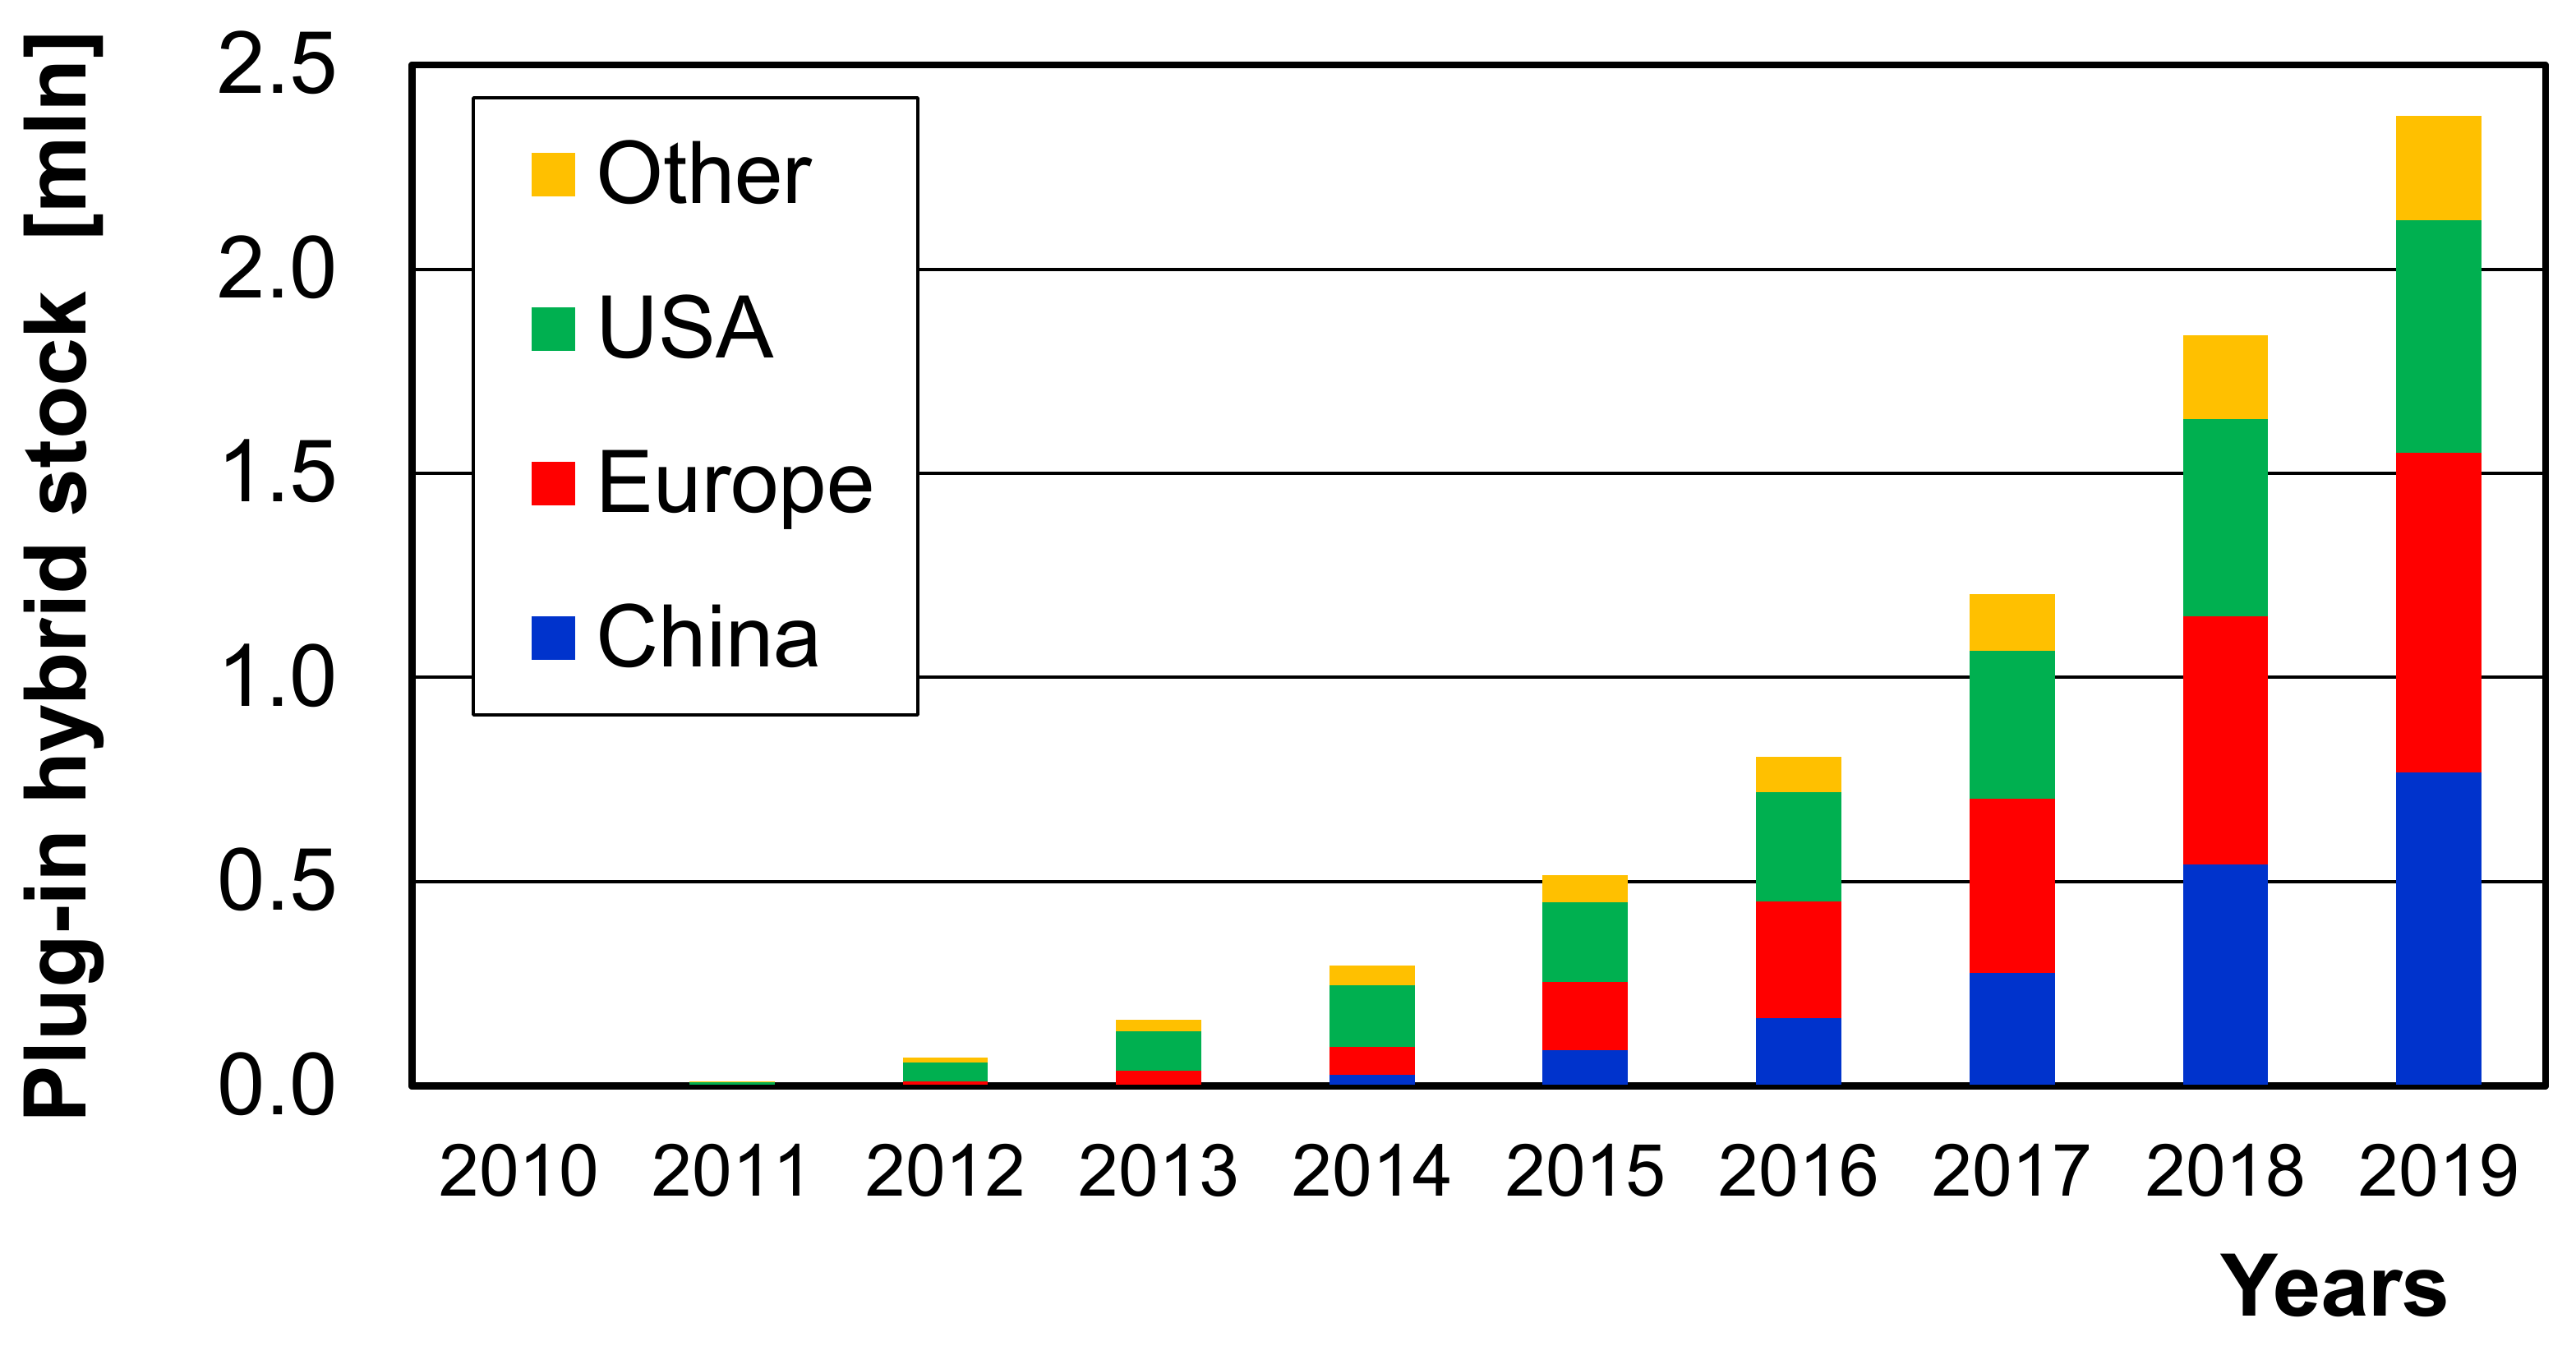
- Electrified vehicles (ZEV and PHEV) will have a significantly large share (about 90%) of the European market in 2030, of which more than 70% of such vehicles will be equipped with internal combustion engines [18].
- The environmental impact of hybrid combustion vehicles powered, e.g., by hydrogen is significantly lower than that of cars powered only with electric motors [19].
- The proposal to categorize vehicles is not required by any legislation; however, the proposed method of exhaust emission assessment may be an indication of the direction of the development of regulations. Using the authors’ methodology, the trend of evaluating the exhaust gas emission in the road tests could be maintained, e.g., with partial elimination of very complex type-approval tests.
- Increase public awareness of the environmental aspects of vehicles, which have a local and direct impact on human health (exhaust emissions), as opposed to energy consumption, which can be produced in a very distant area or from renewable sources.
3. Methodology
3.1. Requirements for the Tests under Actual Traffic Conditions
3.2. Research Equipment
- Flame ionization detector (FID), which uses the change in electrical potential resulting from ionization of the particles in the flame; it is used to determine the total concentration of hydrocarbons;
- NDUV (non-dispersive ultra violet)-type analyser, using ultraviolet radiation to measure concentrations of nitrogen oxide and nitrogen dioxide;
- NDIR (non-dispersive infrared) analyser, using infrared radiation to measure concentrations of carbon monoxide and carbon dioxide;
- Electrochemical analyser to determine the oxygen concentration in the exhaust gas.
3.3. Characteristics of the Research Objects
3.4. Adopted Method to Search for the Function Minimum
4. Results
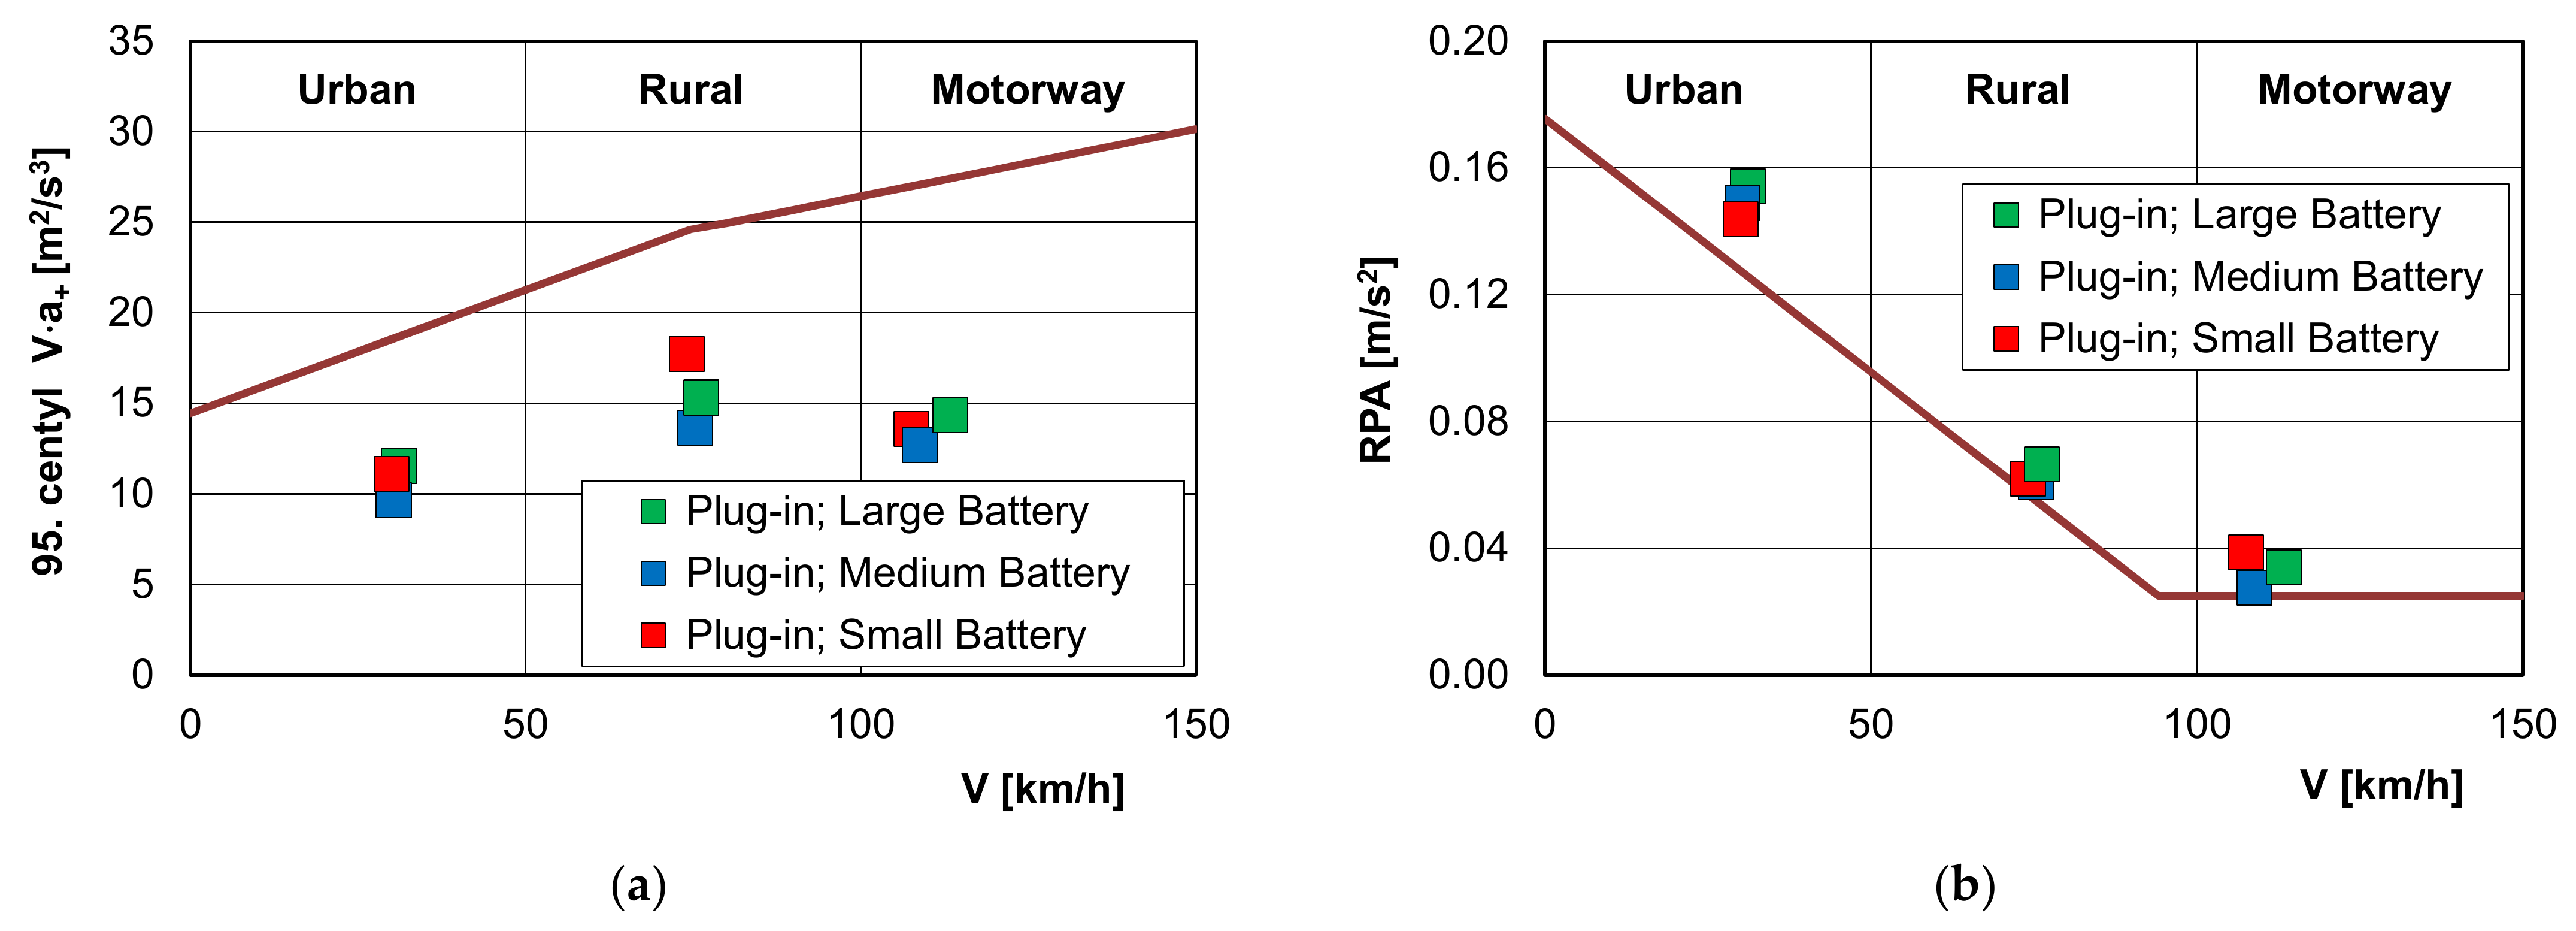
4.1. Validation of the Tests for Compliance with the Requirements
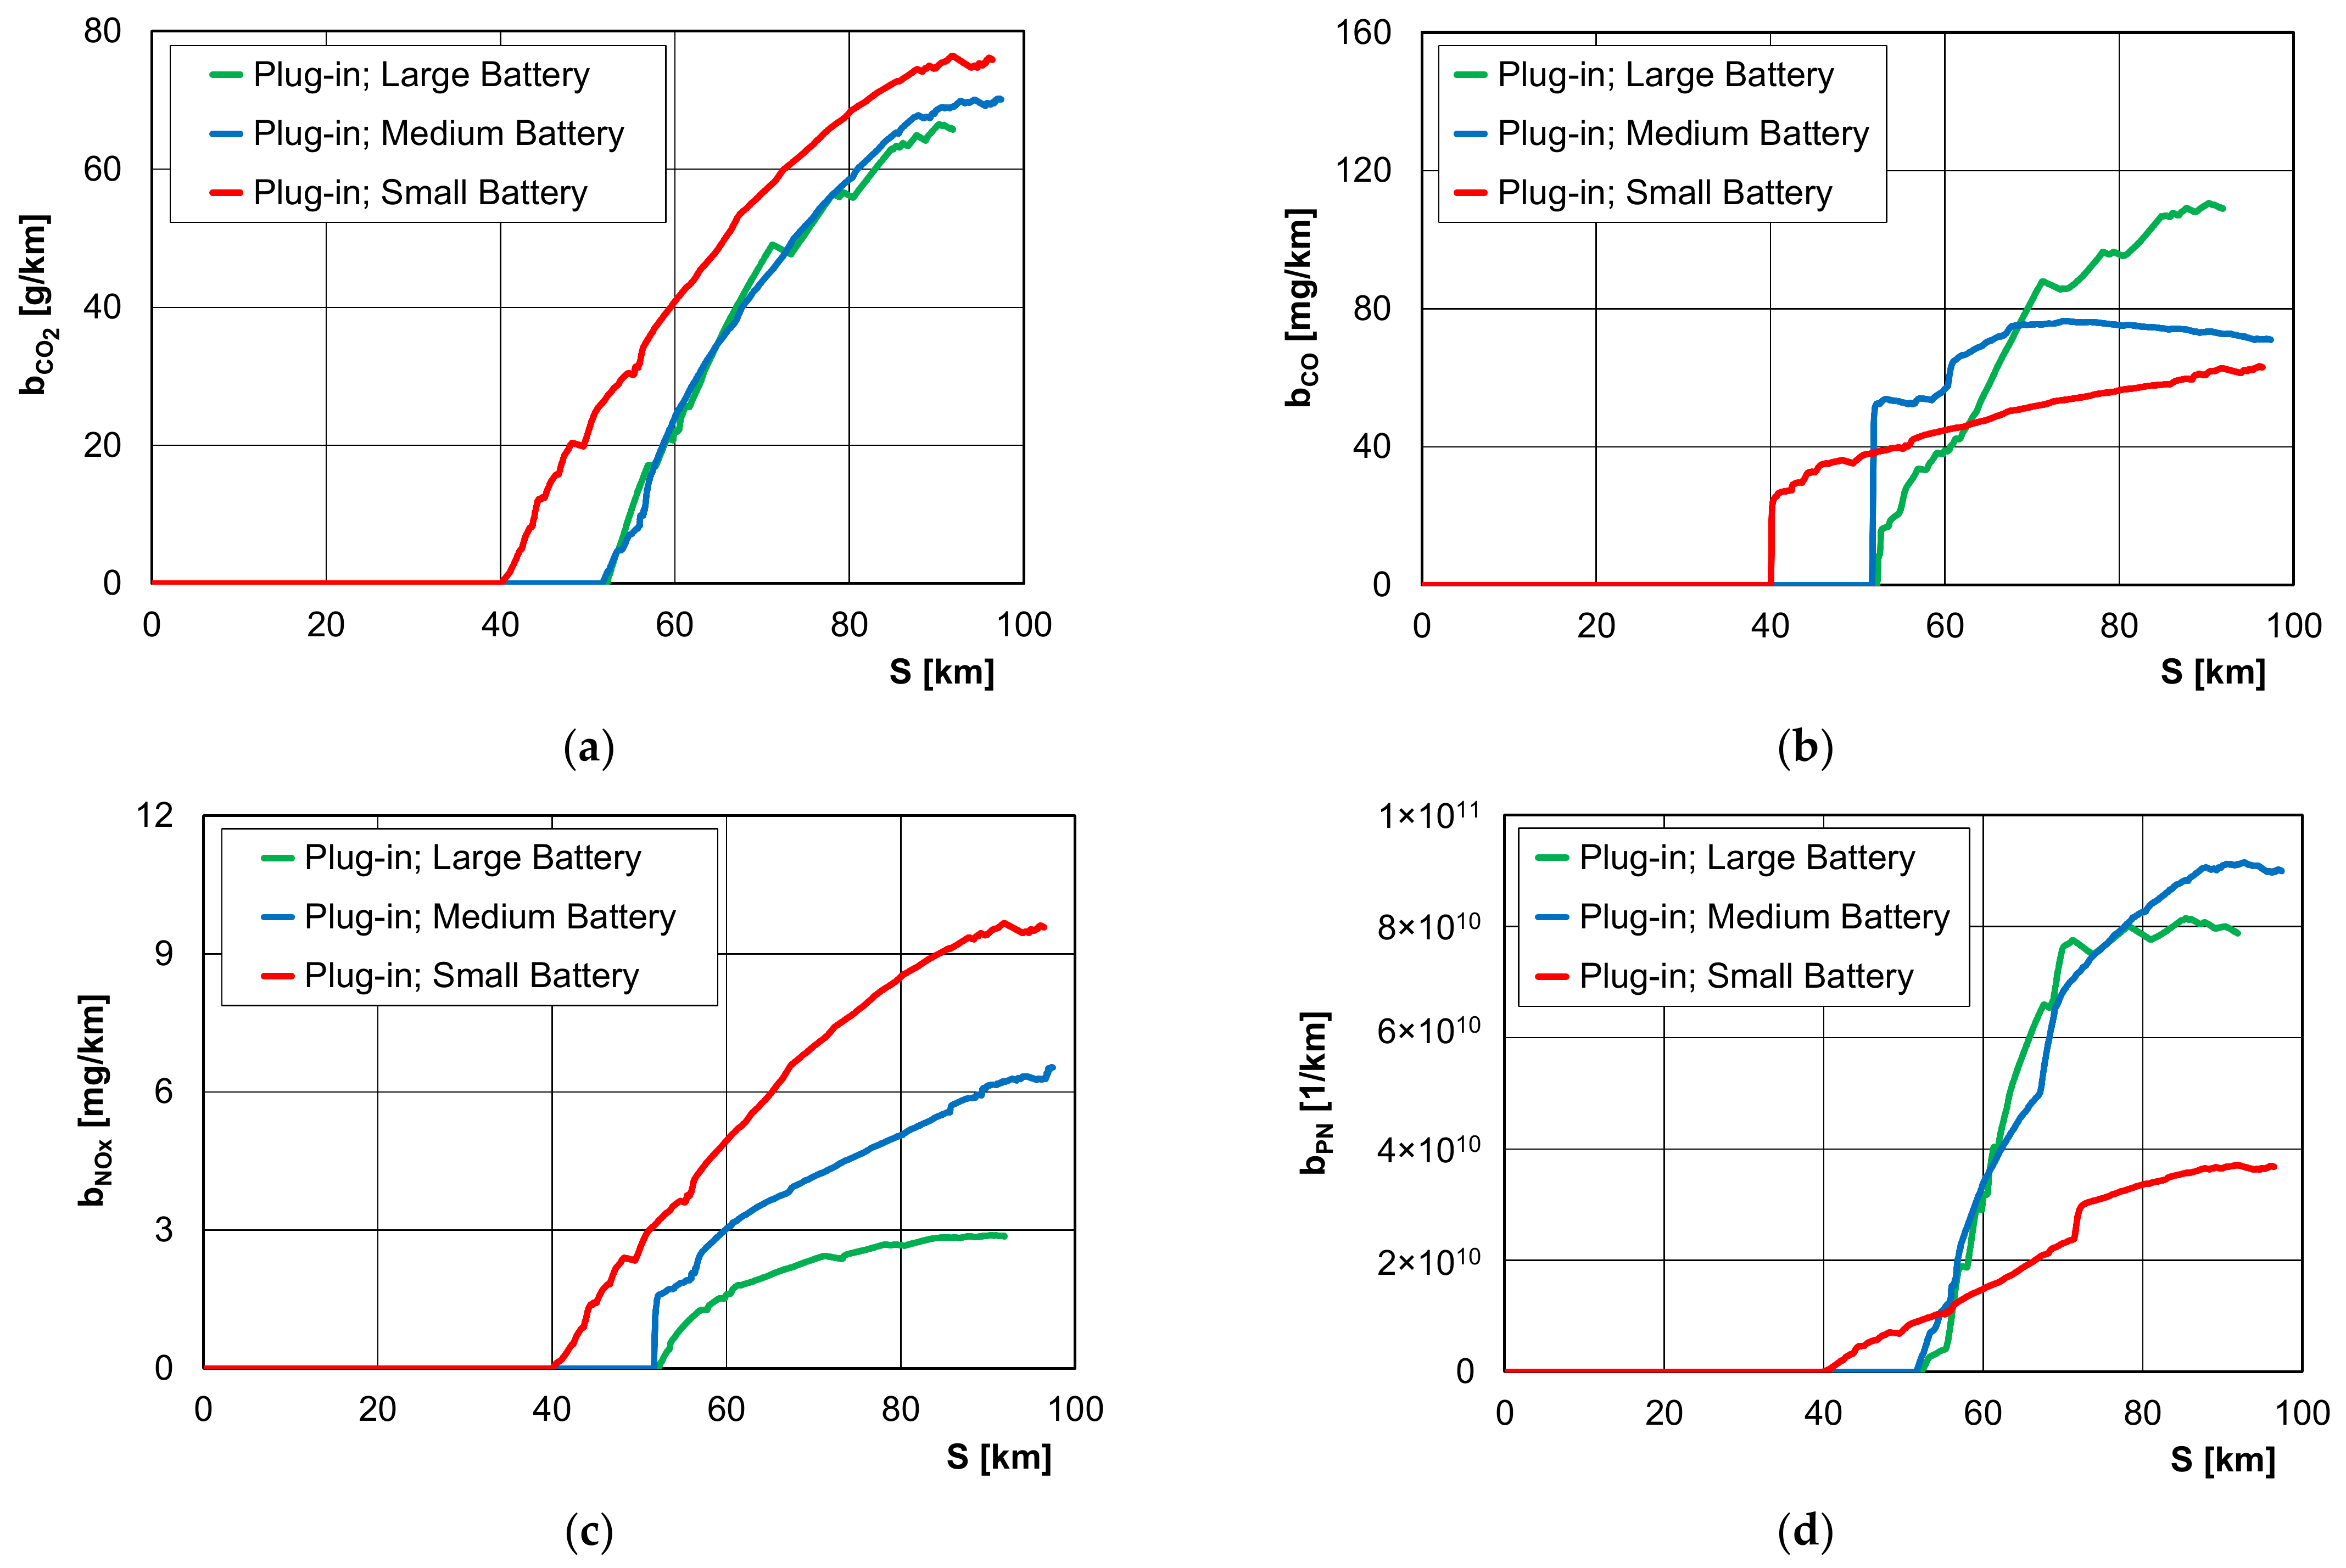
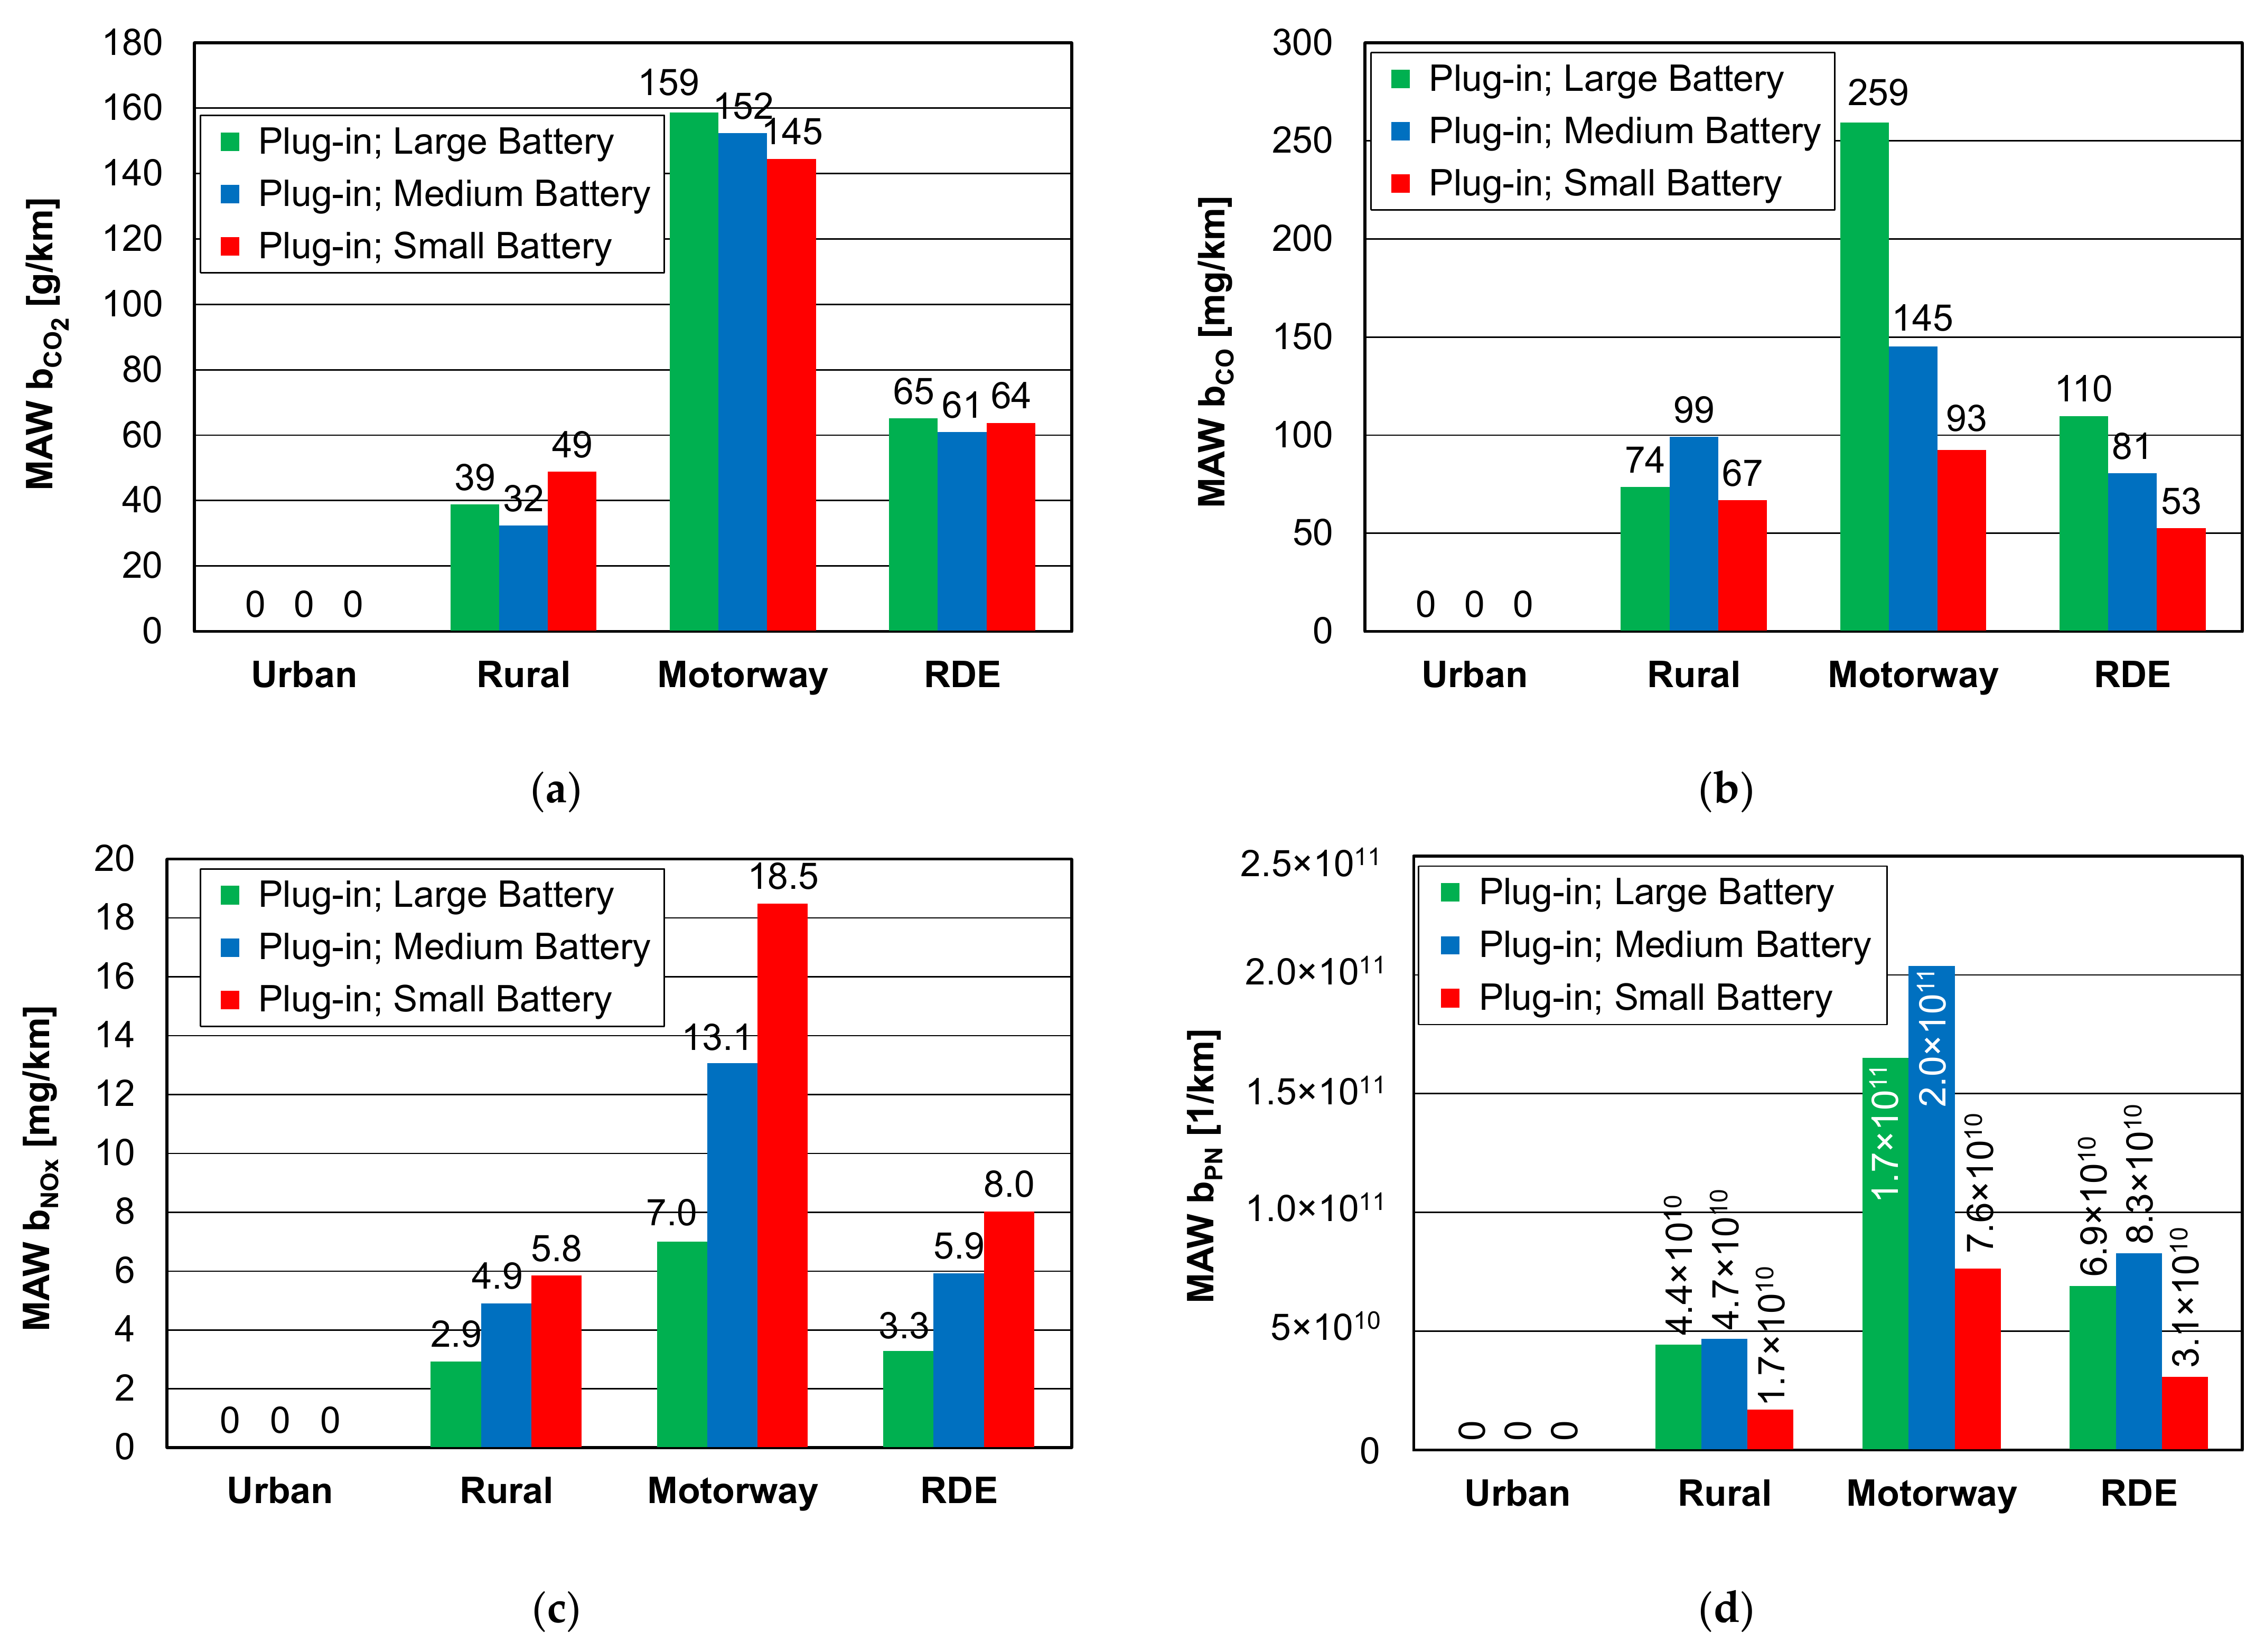
4.2. Exhaust Emission Results
5. Discussion
5.1. Determining the Minimum Road Emissions
5.1.1. Constant Road Emission Intensity
- The sum of the entire test duration: tU + tR + tM (90–120 min);
- Average speed in the urban phase SU/tU (15–40 km/h);
- Average speed in the rural phase SR/tR (40–80 km/h);
- Average speed in the motorway phase SM/tM (80–140 km/h).
5.1.2. Variable Road Emission Intensity
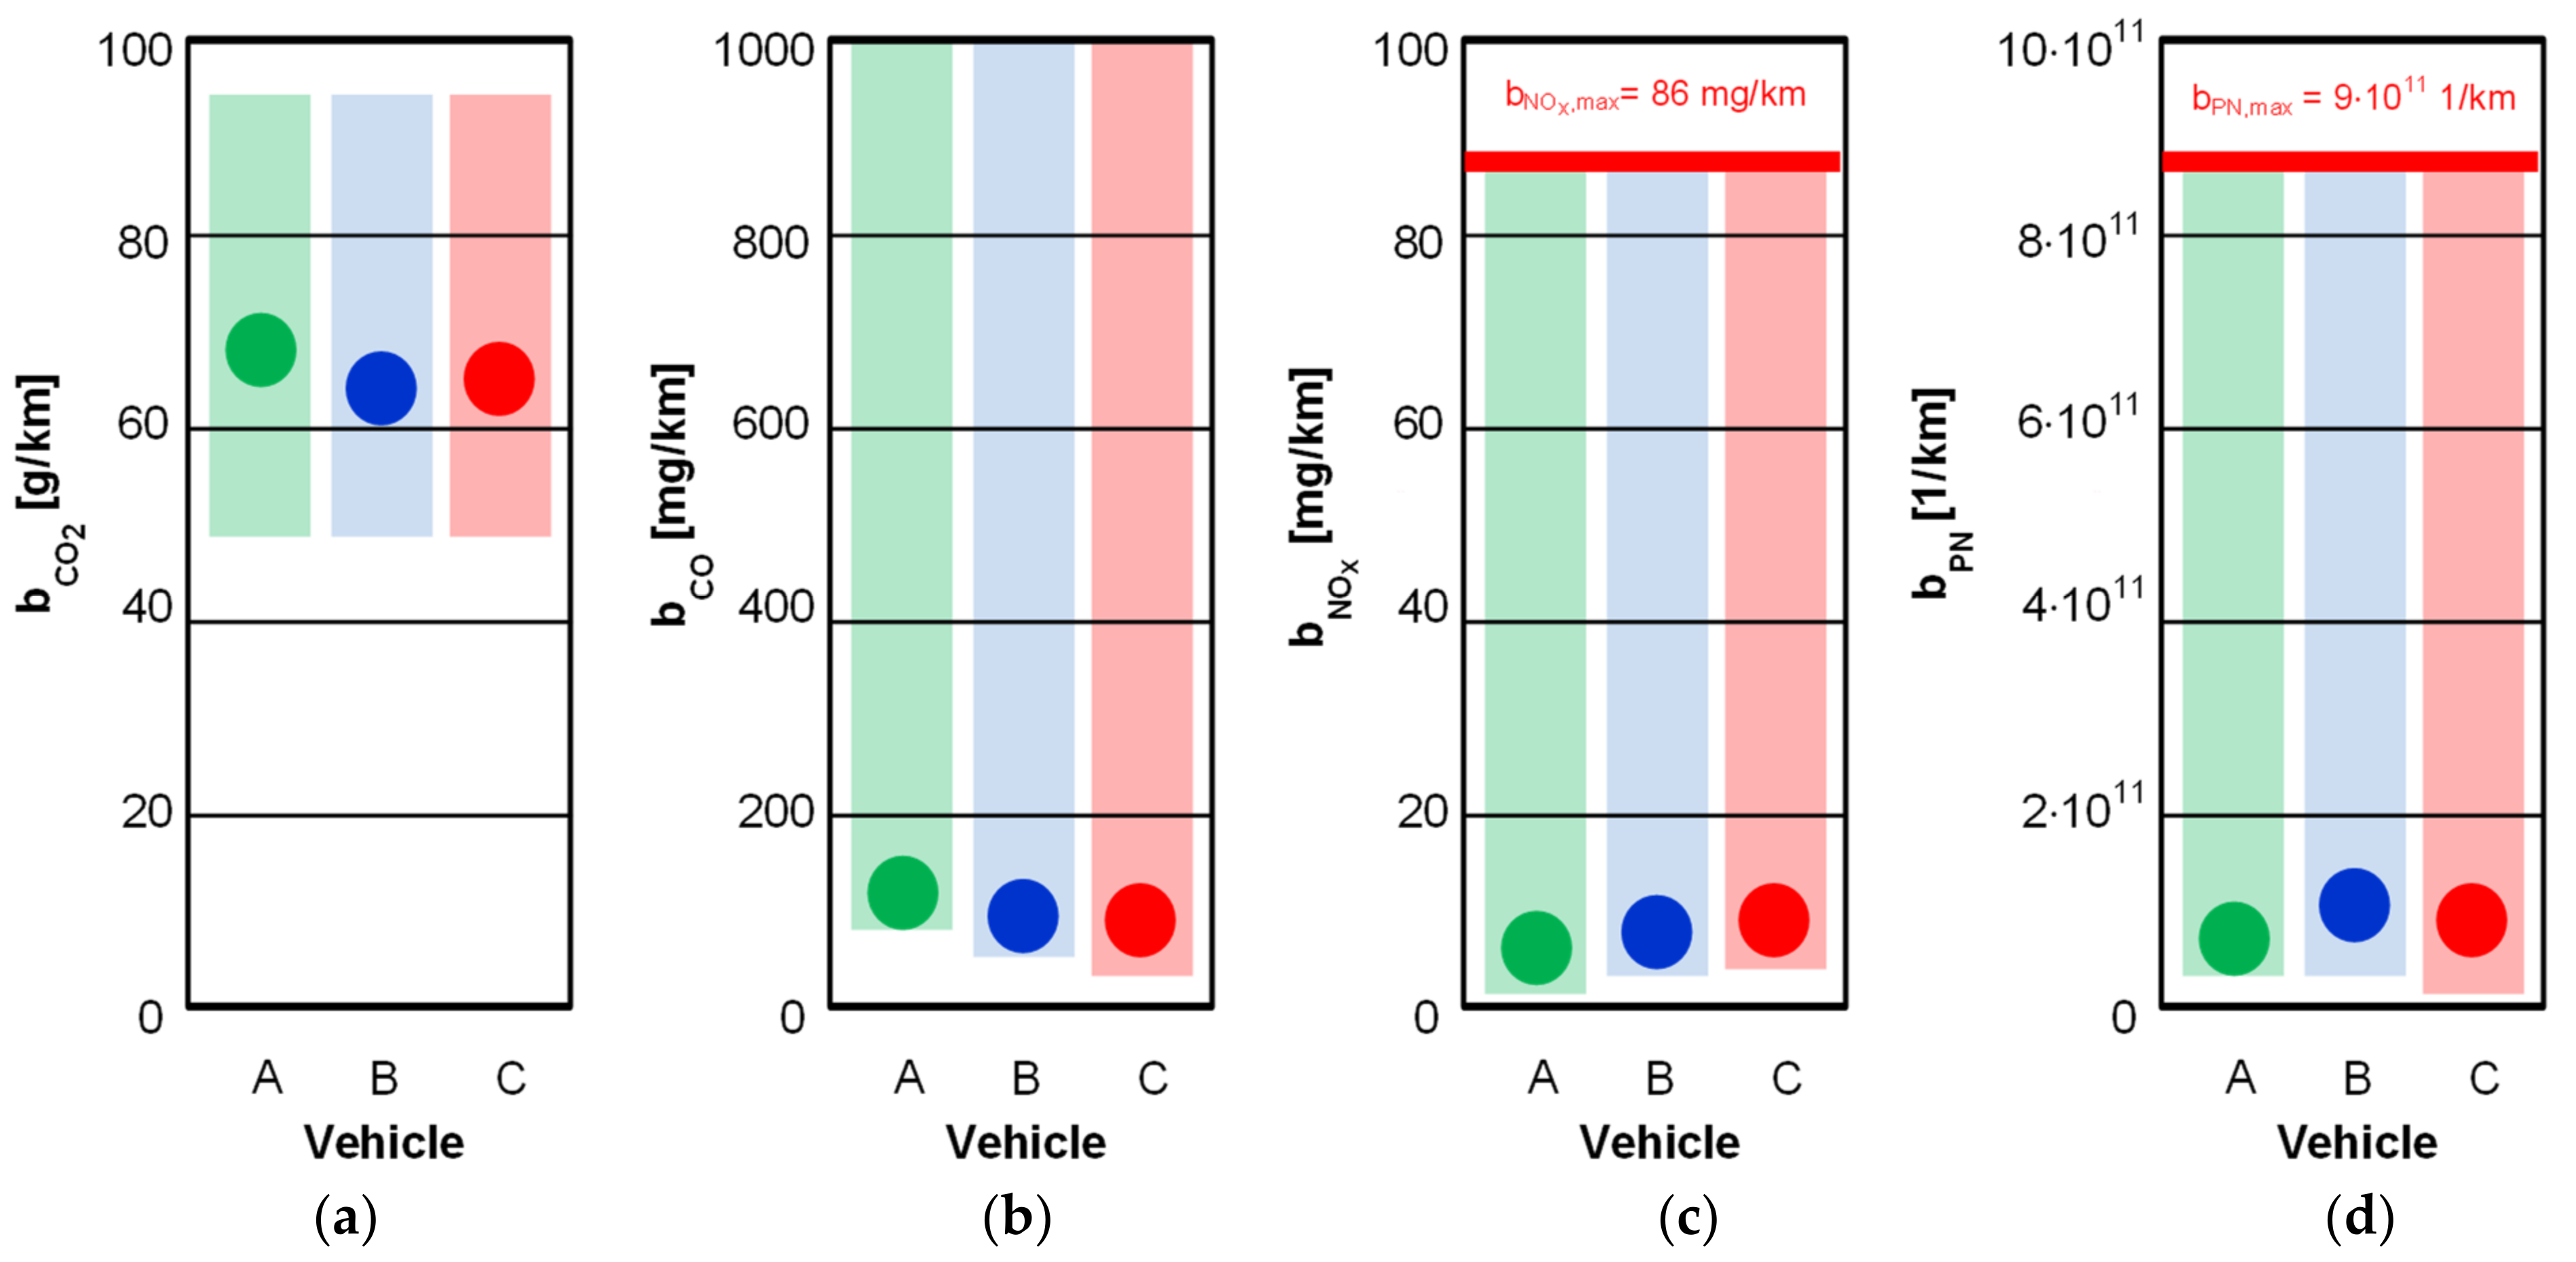
5.2. Plug-in Vehicles Emission Category
6. Conclusions
- The concept of this paper was aimed at indicating the methodology of processing of the hybrid vehicles exhaust emission results, but it could also be of use for either conventional vehicles or electric ones, in which instead of analyzing the exhaust emissions one could focus on the energy consumption. The authors see no contraindications to applying the methodology in heavy-duty vehicles, in the case of which other indexes are used for the description of their emissions-related performance (referred to the performed work of a vehicle).
- The estimated minimum exhaust emission results for the RDE test assuming constant emission rates are about 20–40% less than the actual values. However, estimating the minimum values, for variable emission rates, reveals the largest differences, as the minimum values can be zero. This is a characteristic feature of hybrid vehicles, especially PHEVs, whereby using a large electric capacity of the battery, zero emissions can be achieved in the RDE test. Therefore, the next stage of the research should be a parallel analysis consisting in the evaluation of emission aspects on the one hand, and energy consumption aspects on the other.
- In the era of fighting for environmental protection, the additional emission class indicator of a vehicle may be an important aspect in the consumer’s choice of a vehicle. Due to the campaigns of the European Union and member states, consumer awareness of the harmfulness of exhaust emissions is constantly rising. The proposed method of categorizing hybrid vehicles (the authors plan to extend the RDE study and publish an article on the energy consumption of vehicles in the future) is clear and transparent, which may support the choice of greater ecological power unit.
- The research presented in this paper describes an alternative way to evaluate the environmental performance of vehicles, although limiting oneself only to emissions for PHEVs is not a closed solution. The next stage of work will be to develop a methodology for evaluating the energy consumption of hybrid and electric vehicles in road tests. The result of such a procedure will be the ecological evaluation of vehicles powered only by combustion engines (evaluation on the basis of exhaust emissions), hybrid vehicles—HEVs and PHEVs (evaluation on the basis of exhaust emissions and energy consumption), and vehicles powered by electricity or fuel cells (evaluation on the basis of energy consumption).
Author Contributions
Funding
Institutional Review Board Statement
Informed Consent Statement
Data Availability Statement
Conflicts of Interest
Abbreviations
| a | acceleration vehicle |
| b | road exhaust emission |
| CF | Conformity Factor |
| CoV | coefficient of variation |
| E | exhaust emission rate |
| EC | ecological category |
| EV | Electric Vehicle |
| FID | flame ionization detector |
| GNG | Generalized Reduced Gradient |
| h | driving test altitude |
| HEV | Hybrid Electric Vehicle |
| M | motorway |
| MAV | Moving Average Windows |
| NDIR | non-dispersive infrared |
| NDUV | non-dispersive ultra violet |
| NEDC | New European Driving Cycle |
| PEMS | Portable Emission Measurement System |
| PHEV | Plug-in Hybrid Electric Vehicle |
| R | rural |
| RDE | Real Driving Emissions |
| RPA | Relative Positive Acceleration |
| S | distance |
| t | time |
| u | share |
| U | urban |
| V | vehicle speed |
| WLTC | Worldwide-harmonized Light duty vehicles Test Cycle |
| WLTP | Worldwide-harmonized Light duty vehicles Test Procedure |
Appendix A

| Trip Characteristics | Vehicle A | Vehicle B | Vehicle C | Valid | Unit |
|---|---|---|---|---|---|
| Distance | 91.90 | 97.40 | 96.45 | – | km |
| Duration | 106.17 | 104.52 | 107.83 | 90–120 | min |
| Cold start duration | 5.00 | 5.00 | 5.00 | 5.00 | min |
| Urban distance | 33.73 | 32.22 | 32.88 | >16 | km |
| Rural distance | 25.25 | 30.79 | 31.58 | >16 | km |
| Motorway distance | 32.92 | 34.39 | 31.98 | >16 | km |
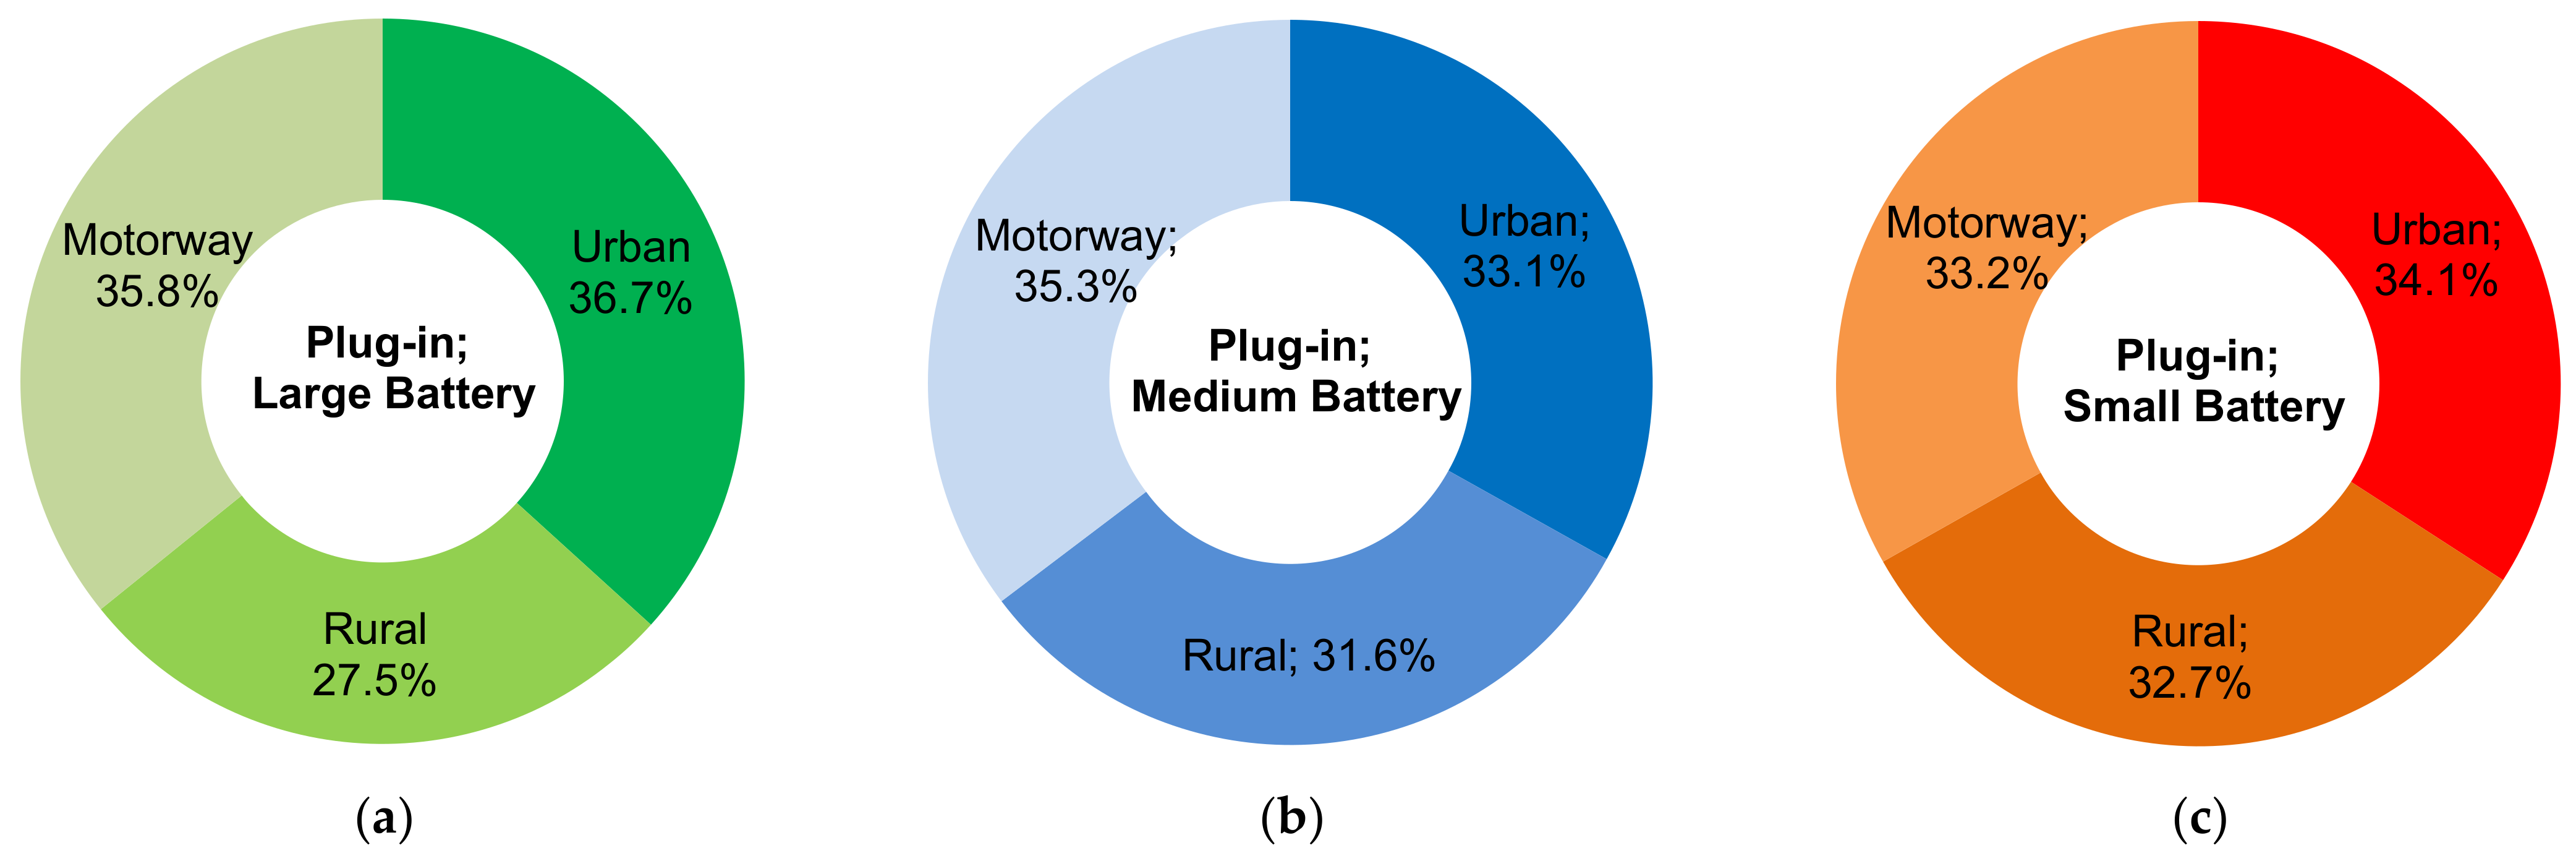
| Urban distance share | 36.70 | 33.08 | 34.10 | 29–44 | % |
| Rural distance share | 27.48 | 31.61 | 32.74 | 23–43 | % |
| Motorway distance share | 35.82 | 35.31 | 33.16 | 23–43 | % |
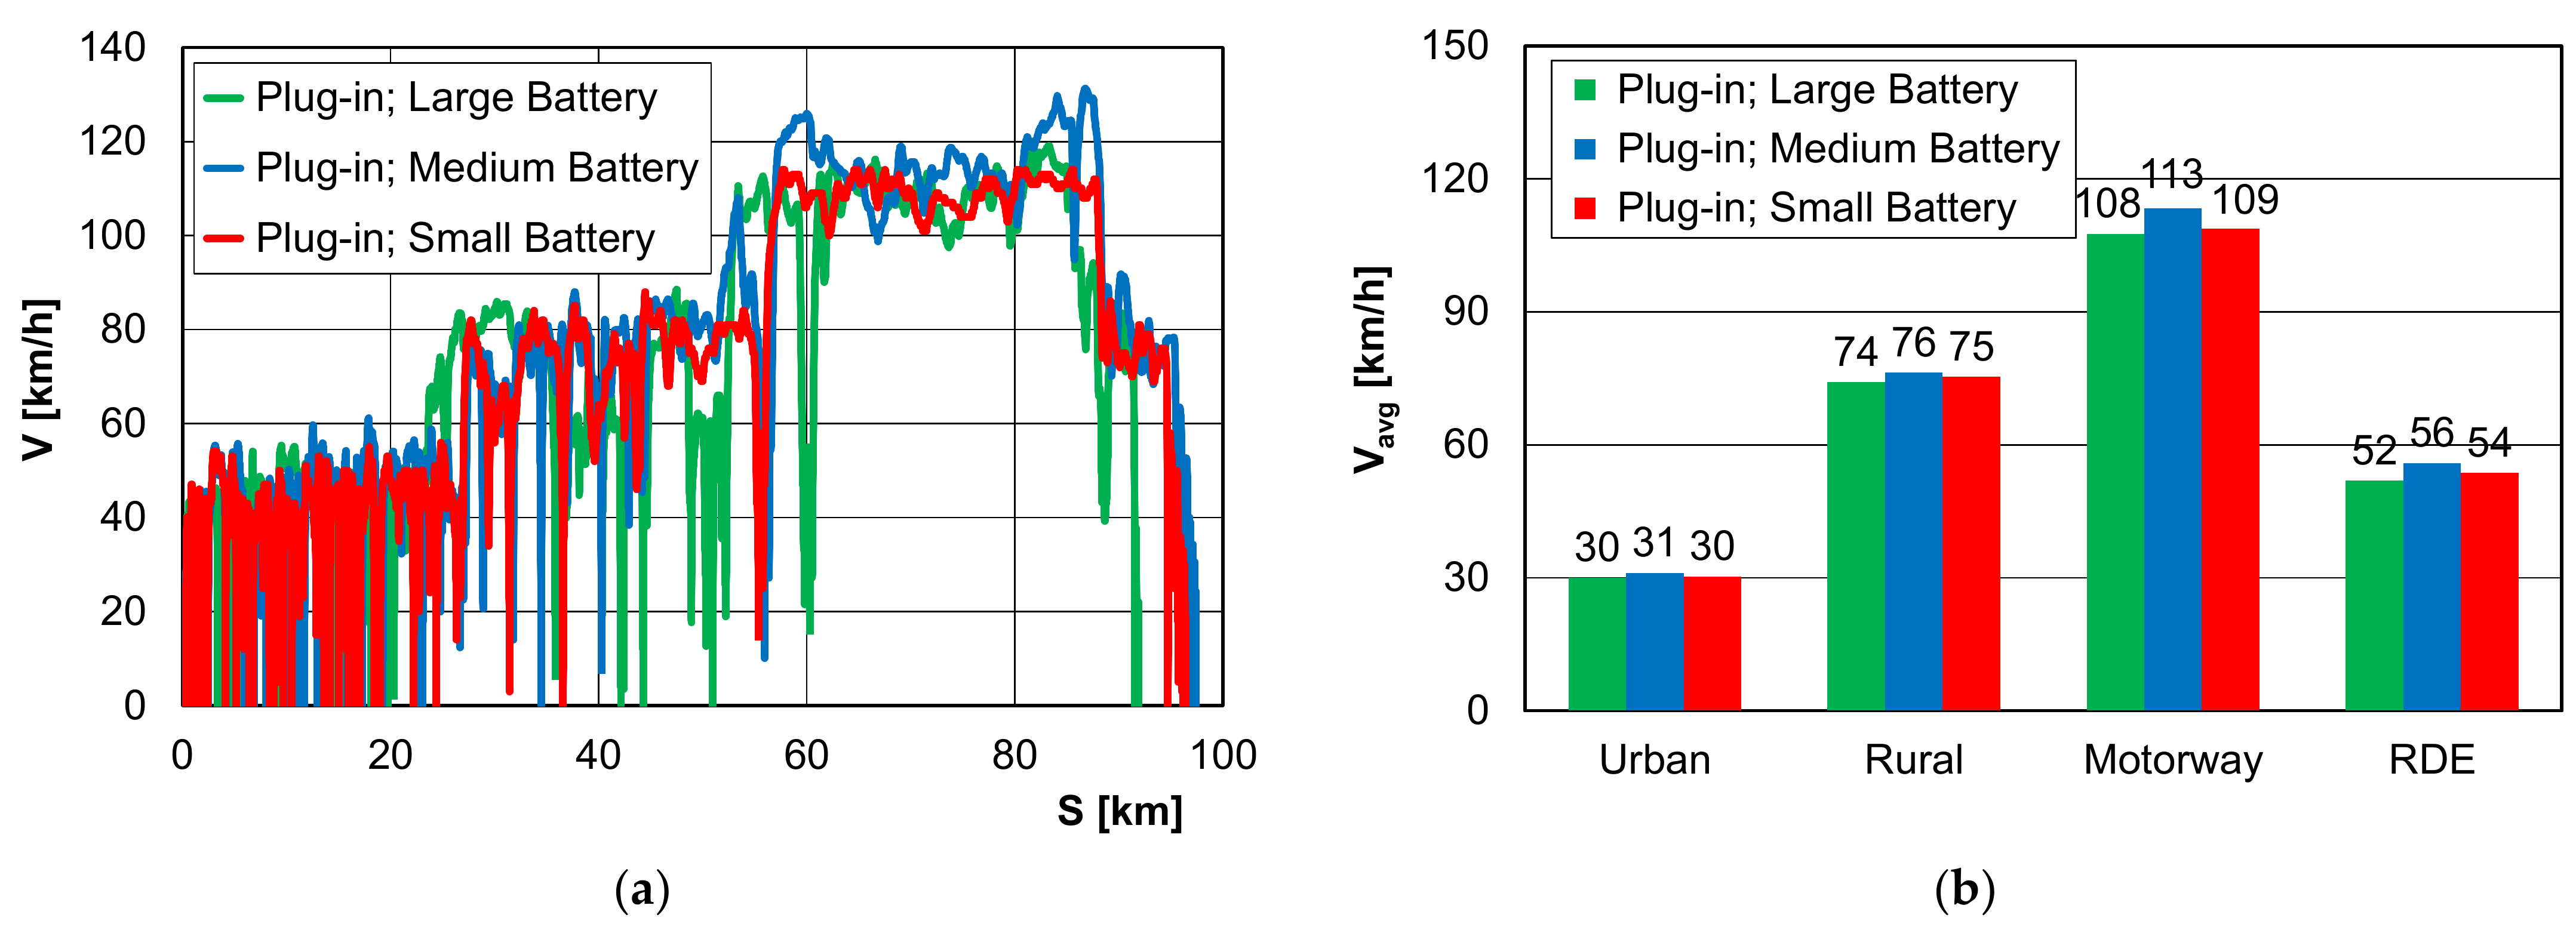
| Urban average speed | 30.05 | 31.14 | 30.33 | 15–40 | km/h |
| Rural average speed | 74.09 | 76.23 | 75.34 | – | km/h |
| Motorway average speed | 107.55 | 113.37 | 108.83 | – | km/h |
| Total trip average speed | 51.94 | 55.91 | 53.66 | – | km/h |
| Motorway speed above 145 km/h | 0.00 | 0.00 | 0.00 | <3% mot. time | % |
| Motorway speed above 100 km/h | 16.28 | 16.63 | 17.32 | ≥5 | min |
| Stop share (Urban phase) | 20.09 | 17.91 | 15.12 | 6–30 | % |
| Initial idling duration | 0.00 | 0.00 | 0.00 | ≤15 | s |
| Cold start average speed | 23.70 | 23.68 | 21.33 | 15–40 | km/h |
| Cold start maximum speed | 44.25 | 45.86 | 47.00 | <60 | km/h |
| Cold start stop time | 0.00 | 31.00 | 18.00 | ≤90 | s |
| Exhaust Components | t | S | U | b | ||||||
|---|---|---|---|---|---|---|---|---|---|---|
| U | R | M | U | R | M | U | R | M | RDE | |
| [s] | [s] | [s] | [km] | [km] | [km] | [–] | [–] | [–] | ||
| CO2 | 4157 | 640 | 603 | 19.1 | 16.0 | 24.3 | 0.321 | 0.270 | 0.409 | 49.4 g/km |
| CO | 3999 | 717 | 684 | 18.6 | 17.9 | 27.5 | 0.290 | 0.280 | 0.430 | 83.4 mg/km |
| NOx | 4106 | 640 | 654 | 18.9 | 16.0 | 26.3 | 0.309 | 0.261 | 0.430 | 2.51 mg/km |
| PN | 3999 | 718 | 683 | 18.6 | 18.0 | 27.5 | 0.290 | 0.280 | 0.430 | 5.2⋅1010 1/km |
| Average | 4065 | 679 | 656 | 18.8 | 17.0 | 26.4 | 0.303 | 0.273 | 0.425 | – |
| St. deviation | 68.8 | 38.8 | 33.0 | 0.21 | 0.97 | 1.33 | 0.01 | 0.01 | 0.01 | – |
| CoV [%] | 1.7% | 5.7% | 5.0% | 1.1% | 5.7% | 5.0% | 4.4% | 2.9% | 2.1% | – |
| Exhaust Components | t | S | U | b | ||||||
|---|---|---|---|---|---|---|---|---|---|---|
| U | R | M | U | R | M | U | R | M | RDE | |
| [s] | [s] | [s] | [km] | [km] | [km] | [–] | [–] | [–] | ||
| CO2 | 4096 | 878 | 427 | 16.0 | 21.9 | 17.2 | 0.290 | 0.398 | 0.312 | 48.4 g/km |
| CO | 4013 | 710 | 677 | 18.4 | 17.8 | 27.2 | 0.290 | 0.280 | 0.430 | 65.2 mg/km |
| NOx | 4004 | 715 | 681 | 18.5 | 17.9 | 27.4 | 0.290 | 0.280 | 0.430 | 4.68 mg/km |
| PN | 4040 | 640 | 720 | 22.4 | 16.0 | 29.0 | 0.333 | 0.237 | 0.430 | 6.6⋅1010 1/km |
| Average | 4038 | 736 | 626 | 18.8 | 18.4 | 25.2 | 0.301 | 0.299 | 0.400 | – |
| St. deviation | 35.8 | 87.2 | 116.4 | 2.31 | 2.18 | 4.69 | 0.02 | 0.06 | 0.05 | – |
| CoV [%] | 0.9% | 11.8% | 18.6% | 12.3% | 11.8% | 18.6% | 6.1% | 20.0% | 12.8% | – |
| Exhaust Components | t | S | U | b | ||||||
|---|---|---|---|---|---|---|---|---|---|---|
| U | R | M | U | R | M | U | R | M | RDE | |
| [s] | [s] | [s] | [km] | [km] | [km] | [–] | [–] | [–] | ||
| CO2 | 3673 | 915 | 812 | 22.7 | 22.9 | 32.7 | 0.290 | 0.292 | 0.418 | 49.3 g/km |
| CO | 4015 | 709 | 676 | 18.4 | 17.7 | 27.2 | 0.290 | 0.280 | 0.430 | 41.4 mg/km |
| NOx | 4002 | 716 | 682 | 18.5 | 17.9 | 27.5 | 0.290 | 0.280 | 0.430 | 6.2 mg/km |
| PN | 3811 | 911 | 678 | 20.5 | 22.8 | 27.3 | 0.290 | 0.323 | 0.387 | 2.4⋅1010 1/km |
| Average | 3875 | 813 | 712 | 20.0 | 20.3 | 28.7 | 0.290 | 0.294 | 0.416 | – |
| St. deviation | 142 | 101 | 58 | 1.75 | 2.51 | 2.32 | 0.00 | 0.02 | 0.02 | – |
| CoV [%] | 3.7% | 12.4% | 8.1% | 8.7% | 12.4% | 8.1% | 0.0% | 6.0% | 4.2% | – |
| Exhaust Components | t | S | U | b | ||||||
|---|---|---|---|---|---|---|---|---|---|---|
| U | R | M | U | R | M | U | R | M | RDE | |
| [s] | [s] | [s] | [km] | [km] | [km] | [–] | [–] | [–] | ||
| CO2 | 3665 | 1338 | 397 | 16.0 | 16.0 | 16.0 | 0.333 | 0.333 | 0.333 | 0 |
| CO | 3665 | 1338 | 397 | 16.0 | 16.0 | 16.0 | 0.333 | 0.333 | 0.333 | 0 |
| NOx | 3665 | 1338 | 397 | 16.0 | 16.0 | 16.0 | 0.333 | 0.333 | 0.333 | 0 |
| PN | 3665 | 1338 | 397 | 16.0 | 16.0 | 16.0 | 0.333 | 0.333 | 0.333 | 0 |
| Average | 3665 | 1338 | 397 | 16.00 | 16.00 | 16.00 | 0.333 | 0.333 | 0.333 | – |
| St. deviation | 0.00 | 0.00 | 0.00 | 0.00 | 0.00 | 0.00 | 0.00 | 0.00 | 0.00 | – |
| CoV [%] | 0.0% | 0.0% | 0.0% | 0.0% | 0.0% | 0.0% | 0.0% | 0.0% | 0.0% | – |
| Exhaust Components | t | S | U | b | ||||||
|---|---|---|---|---|---|---|---|---|---|---|
| U | R | M | U | R | M | U | R | M | RDE | |
| [s] | [s] | [s] | [km] | [km] | [km] | [–] | [–] | [–] | ||
| CO2 | 3602 | 1338 | 460 | 16.0 | 16.0 | 18.5 | 0.317 | 0.317 | 0.367 | 0 |
| CO | 3602 | 1338 | 460 | 16.0 | 16.0 | 18.5 | 0.317 | 0.317 | 0.367 | 0 |
| NOx | 3602 | 1338 | 460 | 16.0 | 16.0 | 18.5 | 0.317 | 0.317 | 0.367 | 0 |
| PN | 3602 | 1338 | 460 | 16.0 | 16.0 | 18.5 | 0.317 | 0.317 | 0.367 | 0 |
| Average | 3602 | 1338 | 460 | 16.0 | 16.0 | 18.5 | 0.317 | 0.317 | 0.367 | – |
| St. deviation | 0.0 | 0.0 | 0.0 | 0.00 | 0.00 | 0.00 | 0.00 | 0.00 | 0.00 | – |
| CoV [%] | 0.0% | 0.0% | 0.0% | 0.0% | 0.0% | 0.0% | 0.0% | 0.0% | 0.0% | – |
| Exhaust Components | t | S | U | b | ||||||
|---|---|---|---|---|---|---|---|---|---|---|
| U | R | M | U | R | M | U | R | M | RDE | |
| [s] | [s] | [s] | [km] | [km] | [km] | [–] | [–] | [–] | ||
| CO2 | 3665 | 1338 | 397 | 16.0 | 16.0 | 16.0 | 0.333 | 0.333 | 0.333 | 6.0 g/km |
| CO | 3665 | 1338 | 397 | 16.0 | 16.0 | 16.0 | 0.333 | 0.333 | 0.333 | 11.4 mg/km |
| NOx | 3665 | 1338 | 397 | 16.0 | 16.0 | 16.0 | 0.333 | 0.333 | 0.333 | 2.3 mg/km |
| PN | 3665 | 1338 | 397 | 16.0 | 16.0 | 16.0 | 0.333 | 0.333 | 0.333 | 2.0⋅109 1/km |
| Average | 3665 | 1338 | 397 | 16.0 | 16.0 | 16.0 | 0.333 | 0.333 | 0.333 | – |
| St. deviation | 0 | 0 | 0 | 0.00 | 0.00 | 0.00 | 0.00 | 0.00 | 0.00 | – |
| CoV [%] | 0.0% | 0.0% | 0.0% | 0.0% | 0.0% | 0.0% | 0.0% | 0.0% | 0.0% | – |
References
- The European Parliament and The Council of The European Union. Commission Regulation (EC) 715/2007 of the European Parliament and of the Council of 20 June 2007 on Type Approval of Motor Vehicles with Respect to Emissions from Light Passenger and Commercial Vehicles (Euro 5 and Euro 6) and on Access to Vehicle Repair and Maintenance Information. Off. J. Eur. Union 2007, L 171, 1–16. [Google Scholar]
- The Commission of the European Communities. Commission Regulation (EC) 692/2008 of 18 July 2008 Implementing and Amending Regulation (EC) 715/2007 of the European Parliament and of the Council on Type-Approval of Motor Vehicles with Respect to Emissions from Light Passenger and Commercial Vehicles (Euro 5 and Euro 6) and on Access to Vehicle Repair and Maintenance Information, European Commission (EC). Off. J. Eur. Union 2008, L 199, 1–136. [Google Scholar]
- The European Commission. Commission Regulation (EU) 2016/427 of 10 March 2016 Amending Regulation (EC) No. 692/2008 as Regards Emissions from Light Passenger and Commercial Vehicles (Euro 6), Verifying Real Driving Emissions. Off. J. Eur. Union 2016, L 82, 1–98. [Google Scholar]
- The European Commission. Commission Regulation (EU) 2016/646 of 20 April 2016 Amending Regulation (EC) No. 692/2008 as Regards Emissions from Light Passenger and Commercial Vehicles (Euro 6), Verifying Real Driving Emissions. Off. J. Eur. Union 2016, L 109, 1–22. [Google Scholar]
- Commission Regulation (EU) 2017/1151 of 1 June 2017 Supplementing Regulation (EC) No 715/2007 of the European Parliament and of the Council on Type-Approval of Motor Vehicles with Respect to Emissions from Light Passenger and Commercial Vehicles (Euro 5 and Euro 6) and on Access to Vehicle Repair and Maintenance Information, Amending Directive 2007/46/EC of the European Parliament and of the Council, Commission Regulation (EC) No 692/2008 and Commission Regulation (EU) No 1230/2012 and Repealing Commission Regulation (EC) No 692/2008. Off. J. Eur. Union L 175. 2017, pp. 1–643. Available online: http://data.europa.eu/eli/reg/2017/1151/oj (accessed on 22 December 2020).
- The European Commission. Commission Regulation (EU) 2017/1154 of 7 June 2017 Amending Regulation (EU) 2017/1151 Supplementing Regulation (EC) No 715/2007 of the European Parliament and of the Council on Type-Approval of Motor Vehicles with Respect to Emissions from Light Passenger and Commercial Vehicles (Euro 5 and Euro 6) and on Access to Vehicle Repair and Maintenance Information, Amending Directive 2007/46/EC of the European Parliament and of the Council, Commission Regulation (EC) No 692/2008 and Commission Regulation (EU) No 1230/2012 and Repealing Regulation (EC) No 692/2008 and Directive 2007/46/EC of the European Parliament and of the Council as Regards Real-Driving Emissions from Light Passenger and Commercial Vehicles (Euro 6). Off. J. Eur. Union 2017, L 175, 708–732. [Google Scholar]
- Pielecha, J.; Andrych-Zalewska, M.; Skobiej, K. The impact of using an in-cylinder catalyst on the exhaust gas emission in real driving conditions tests of a Diesel engine. IOP Conf. Ser. Mater. Sci. Eng. 2018, 421, 042064. [Google Scholar] [CrossRef]
- Pielecha, J.; Skobiej, K. Evaluation of ecological extremes of vehicles in road emission tests. Arch. Transp. 2020, 4, 33–46. [Google Scholar] [CrossRef]
- Katrašnik, T. Hybridization of powertrain and downsizing of IC engine—A way to reduce fuel consumption and pollutant emissions—Part 1. Energy Convers. Manag. 2007, 48, 1411–1423. [Google Scholar] [CrossRef]
- Wirasingha, S.G.; Schofield, N.; Emadi, A. Plug-in hybrid electric vehicle developments in the US: Trends, barriers, and economic feasibility. In Proceedings of the IEEE Vehicle Power Propulsion Conference, Harbin, China, 3–5 September 2008. [Google Scholar] [CrossRef]
- Khan, M.; Kockelma, K.M. Predicting the market potential of plug-in electric vehicles using multiday GPS data. Energy Policy 2012, 46, 225–233. [Google Scholar] [CrossRef] [Green Version]
- Cieslik, W.; Szwajca, F.; Golimowski, W.; Berger, A. Experimental analysis of residential photovoltanic (PV) and battery electric vehicle (BEV) systems in terms of annual energy utilization. Energies 2021, 14, 1085. [Google Scholar] [CrossRef]
- Yi, Z.; Bauer, P.H. Effects of environmental factors on electric vehicle energy consumption: A sensitivity analysis. IET Electr. Syst. Transp. 2017, 7, 3–13. [Google Scholar] [CrossRef]
- Li, G.; Zhang, X.P. Modeling of plug-in hybrid electric vehicle charging demand in probabilistic power flow calculations. IEEE Trans. Smart Grid 2012, 3, 492–499. [Google Scholar] [CrossRef]
- Pielecha, J.; Skobiej, K.; Kurtyka, K. Exhaust emissions and energy consumption analysis of conventional, hybrid, and electric vehicles in real driving cycles. Energies 2020, 13, 6423. [Google Scholar] [CrossRef]
- IEA. Global EV Outlook 2020. 2020. Available online: https://www.iea.org/reports/global-ev-outlook-2020 (accessed on 21 October 2020).
- Lang, M. Initial GVI Roadmap, Österreichischer Automobil Motorrad und Touring Club (ÖAMTC), GVI—Green Vehicle Index, Horizon 2020, Grant Agreement ID: 814794. 2019. Available online: https://www.gvi-project.eu/wp-content/uploads/sites/2/D4.1-Roadmap.pdf (accessed on 22 March 2021).
- Kapus, P. Passenger Car Powertrain 4.x—Fuel Consumption, Emissions and Cost, Webinar, AVL List GmbH. 2020. Available online: https://www.avl.com/-/passenger-car-powertrain-4.x-fuel-consumption-emissions-and-cost (accessed on 2 June 2020).
- Korn, T. The most effective technology to comply with CO2-legislation: The new generation of hydrogen internal combustion engines. In Proceedings of the International Vienna Motor Symposium, Vienna, Austria, 22–24 April 2020. [Google Scholar]
- Lasdon, L.S.; Waren, A.D.; Jain, A.; Ratner, M. Design and testing of a generalized reduced gradient code for nonlinear programming. ACM Trans. Math. Softw. 1978, 4, 34–50. [Google Scholar] [CrossRef]


| 2015 | 2016 | 2017 | 2018 | 2019 | 2020 | 2021 | 2022 |
|---|---|---|---|---|---|---|---|
| Euro 6b | Euro 6d-Temp | Euro 6d | |||||
| NEDC | WLTC | ||||||
| research and concept phase | Conformity Factor (CF) | ||||||
| CFNOx = 2.1 | CFNOx = 1.5 CFPN = 1.5 | CFNOx = 1.43 CFPN = 1.5 | |||||
| Parameter | Requirement |
|---|---|
| ambient temperature (ta) | normal range: 0 °C ≤ ta ≤ 30 °C lower extended range: –7 °C ≤ ta < 0 °C (emission corrective factor 1/1.6) upper extended range: 30 °C < ta ≤ 35 °C (emission corrective factor 1/1.6) |
| driving test altitude (h) | normal range: h ≤ 700 m a.s.l.; extended range: 700 < h ≤ 1300 m a.s.l. |
| impact evaluation of ambient weather and road conditions as well as the driving style | total altitude increase: less than 1200 m/100 km; relative positive acceleration (RPA): move than RPAmin (for all road conditions); the product of velocity and acceleration (V ∙ a+): less than V ∙ a+ max (for all road conditions) |
| cold start | duration of the cold start period is defined from engine start to first of 5 min or coolant temp ≥70 °C; max velocity during cold start ≤60 km/h; the average speed (including stops) shall be between 15 km/h and 40 km/h; total stop time during cold start <90 s; idling after ignition <15 s |
| any vehicle stop | no longer than 180 s |
| vehicle aftertreatment systems operation | a single regeneration of the particulate filter justifies repeating the RDE test; the occurrence of two filter regenerations is to be included in the results of the RDE test |
| driving comfort systems operation | regular use as intended by the manufacturer (for example: use of the air conditioning) |
| vehicle load | vehicle mass: driver (and passenger) along with the PEMS equipment; maximum load <90% of the sum of the mass of the passengers and the vehicle curb weight |
| test requirements | duration 90 min–120 min |
| urban test phase requirements | 29–44% share of the whole test time; distance: more than 16 km; vehicle speed: up to 60 km/h; average speed: 15 km/h–40 km/h; vehicle stop: 6–30% of the urban phase of the test time |
| rural test phase requirements | 23–43% share of the whole test time; distance: more than 16 km; vehicle speed (V): 60 km/h < V ≤ 90 km/h |
| motorway test phase requirements | 23–43% share of the whole test time; distance: more than 16 km; vehicle speed: more than 90 km/h; vehicle speed over 100 km/h for at least 5 min; vehicle speed over 145 km/h no more than 3% of the test phase time |
| Uncertainty | NDIR Analyser Indications | NDUV Analyser Indications | ||
|---|---|---|---|---|
| Component | Carbon Monoxide | Carbon Dioxide | Nitrogen Oxide | Nitrogen Dioxide |
| measuring range | 0–8% | 0–20% | 0–2500 ppm | 0–500 ppm |
| extended uncertainty of measurement | ±3% reading (or 50 ppm CO) | ±3% of reading (or 0.1% CO2) | ±3% reading (or 15 ppm) | ±3% reading (or 10 ppm) |
| whichever is greater | ||||
| Parameter | Value |
|---|---|
| range of measured particle diameters | 5.6 nm–560 nm |
| measurement resolution (number of channels) | 16 channels per decade (total 32) |
| reading frequency | 10 Hz |
| airflow | 40 dm3/min |
| flue gas sample flow | 10 dm3/min |
| sample temperature range | 10 °C–52 °C |
| operating temperature of the device | 0 °C–40 °C |
| analyser weight | 32 kg |
| Technical Parameters | Vehicle A Large Battery | Vehicle B Medium Battery | Vehicle C Small Battery |
|---|---|---|---|
| engine | gasoline, Turbo, R4 | gasoline, R4 | gasoline, R4 |
| fuel system | direct injection | multipoint injection | direct injection |
| engine displacement | 1395 cm3 | 1798 cm3 | 1999 cm3 |
| max. power | 115 kW + 85 kW (electric) | 72 kW + 53 kW (electric) | 113 kW + 50 kW (electric) |
| max. torque | 250 Nm/1500–3500 rpm + 330 Nm (electric) | 142 Nm/3600 rpm + 163 Nm (electric) | 189 Nm/5000 rpm + 205 Nm (electric) |
| gearbox | automatic, 6 gears | automatic infinitely variable e-CVT | automatic, 6 gears |
| size (length/width/height) | 4869/1864/1503 mm | 4540/1760/1490 mm | 4855/1860/1470 mm |
| curb weight | 1655 kg | 1375 kg | 1740 kg |
| average CO2 emissions | 31–42 g/km (WLTP) | 28–35g/km (WLTP) | 33 g/km (WLTP) |
| euro standard | Euro 6d-Temp | Euro 6-Temp | Euro 6 |
| model year | 2020 | 2020 | 2019 |
| battery | 13.6 kW⋅h | 8.8 kW⋅h | 3.3 kW⋅h |
| Exhaust Components | Vehicle A | Vehicle B | Vehicle C | |||
|---|---|---|---|---|---|---|
| Rural | Motorway | Rural | Motorway | Rural | Motorway | |
| CoVCO2 [%] | 93.9 | 21.7 | 78.3 | 28.4 | 125.4 | 14.6 |
| CoVCO [%] | 86.0 | 33.5 | 77.5 | 61.0 | 552.0 | 17.5 |
| CoVNOx [%] | 83.2 | 30.6 | 77.5 | 17.2 | 125.9 | 14.6 |
| CoVPN [%] | 128.2 | 61.8 | 77.2 | 35.5 | 131.7 | 104.3 |
| Emission Intensity | Vehicle A | Vehicle B | Vehicle C | |||
|---|---|---|---|---|---|---|
| Rural | Motorway | Rural | Motorway | Rural | Motorway | |
| ECO2 [g/s] | 0.80 | 4.74 | 0.69 | 4.80 | 1.02 | 4.37 |
| ECO [mg/s] | 1.51 | 7.75 | 2.10 | 4.57 | 1.40 | 2.80 |
| ENOx [mg/s] | 0.06 | 0.21 | 0.10 | 0.41 | 0.12 | 0.56 |
| EPN [1/s] | 9.1⋅108 | 4.9⋅109 | 9.9⋅108 | 6.4⋅109 | 3.6⋅108 | 2.3⋅109 |
| k | Vehicle A | Vehicle B | Vehicle C | |
|---|---|---|---|---|
| j | ||||
| SEV [km] | 52.2 | 51.6 | 40.0 | |
| bCO2 [g/km] | x | –0.0351 | –0.0332 | –0.0201 |
| y | 6.6697 | 6.5103 | 4.1145 | |
| z | –250.92 | –248.93 | –132.92 | |
| R2 | 0.996 | 0.998 | 0.998 | |
| bCO [mg/km] | x | –0.0579 | –0.0322 | –0.0067 |
| y | 10.922 | 5.2708 | 1.5469 | |
| z | –404.81 | –138.60 | –24.207 | |
| R2 | 0.990 | 0.919 | 0.995 | |
| bNOx [mg/km] | x | –0.0024 | –0.0013 | –0.0021 |
| y | 0.4972 | 0.2977 | 0.3557 | |
| z | –16.292 | –10.467 | –12.417 | |
| R2 | 0.976 | 0.994 | 0.998 | |
| bPN [1/km] | x | –5.91⋅107 | –9.62⋅107 | –6.33⋅106 |
| y | 1.08⋅1010 | 1.59⋅1010 | 1.58⋅109 | |
| z | –4.05⋅1011 | –5.76⋅1011 | –5.51⋅1010 | |
| R2 | 0.983 | 0.996 | 0.979 | |
| Parameter | Vehicle A | Vehicle B | Vehicle C |
|---|---|---|---|
| bCO2 [g/km] | 65 | 61 | 64 |
| bCO [mg/km] | 110 | 81 | 53 |
| bNOx [mg/km] | 3.3 | 5.9 | 8 |
| bPN [1/km] | 6.90⋅1010 | 8.30⋅1010 | 3.10⋅1010 |
| bCO2, max [g/km] | 95 | 95 | 95 |
| bCO, max [mg/km] | 1000 | 1000 | 1000 |
| bNOx, max [mg/km] | 86 | 86 | 86 |
| bPN, max [1/km] | 9.00⋅1011 | 9.00⋅1011 | 9.00⋅1011 |
| bCO2, min [g/km] | 0 | 0 | 5.99 |
| bCO, min [mg/km] | 0 | 0 | 11.43 |
| bNOx, min [mg/km] | 0 | 0 | 2.35 |
| bPN, min [1/km] | 0 | 0 | 2.00⋅109 |
| ECCO2 | 68% | 64% | 65% |
| ECCO | 11% | 8% | 4% |
| ECNOx | 4% | 7% | 7% |
| ECPN | 8% | 9% | 3% |
Publisher’s Note: MDPI stays neutral with regard to jurisdictional claims in published maps and institutional affiliations. |
© 2021 by the authors. Licensee MDPI, Basel, Switzerland. This article is an open access article distributed under the terms and conditions of the Creative Commons Attribution (CC BY) license (https://creativecommons.org/licenses/by/4.0/).
Share and Cite
Skobiej, K.; Pielecha, J. Plug-in Hybrid Ecological Category in Real Driving Emissions. Energies 2021, 14, 2340. https://doi.org/10.3390/en14082340
Skobiej K, Pielecha J. Plug-in Hybrid Ecological Category in Real Driving Emissions. Energies. 2021; 14(8):2340. https://doi.org/10.3390/en14082340
Chicago/Turabian StyleSkobiej, Kinga, and Jacek Pielecha. 2021. "Plug-in Hybrid Ecological Category in Real Driving Emissions" Energies 14, no. 8: 2340. https://doi.org/10.3390/en14082340
APA StyleSkobiej, K., & Pielecha, J. (2021). Plug-in Hybrid Ecological Category in Real Driving Emissions. Energies, 14(8), 2340. https://doi.org/10.3390/en14082340