Article

Fuel Cell Electric Vehicle (FCEV) Energy Flow Analysis in Real Driving Conditions (RDC)

by
Andrzej Szałek
1,
Ireneusz Pielecha
2,* and
Wojciech Cieslik
2
1
Toyota Motor Poland, ul. Konstruktorska 5, 02-673 Warszawa, Poland
2
Faculty of Civil and Transport Engineering, Poznan University of Technology, ul. Piotrowo 3, 60-965 Poznan, Poland
*
Author to whom correspondence should be addressed.
Energies 2021, 14(16), 5018; https://doi.org/10.3390/en14165018
Submission received: 19 July 2021 / Revised: 9 August 2021 / Accepted: 11 August 2021 / Published: 16 August 2021
(This article belongs to the Special Issue Energy Transfer in Alternative Vehicles)

Abstract

:
The search for fossil fuels substitutes forces the use of new propulsion technologies applied to means of transportation. Already widespread, hybrid vehicles are beginning to share the market with hydrogen-powered propulsion systems. These systems are fuel cells or internal combustion engines powered by hydrogen fuel. In this context, road tests of a hydrogen fuel cell drive were conducted under typical traffic conditions according to the requirements of the RDE test. As a result of the carried-out work, energy flow conditions were presented for three driving phases (urban, rural and motorway). The different contributions to the vehicle propulsion of the hydrogen system and the electric system in each phase of the driving route are indicated. The characteristic interaction of power train components during varying driving conditions was presented. A wide variation in the contribution of the fuel cell and the battery to the vehicle’s propulsion was identified. In urban conditions, the share of the fuel cell in the vehicle’s propulsion is more than three times that contributed by the battery, suburban—7 times, highway—28 times. In the entire test, the ratio of FC/BATT use was more than seven, while the energy consumption was more than 22 kWh/100 km. The amounts of battery energy used and recovered were found to be very close to each other under RDE test conditions.

1. Introduction

The use of hydrogen for energy production can be particularly important for industries that are difficult to convert to electric power. This is especially relevant for transportation and industrial production. Currently, most hydrogen is produced from natural gas without CO2 capture during production (CCS—Carbon Capture and Storage). Beyond 2030, hydrogen production from this source with CO2 capture is not expected to increase significantly, as this process will only become cost-competitive when CO2 emission fees are around USD 90 per ton. In contrast, hydrogen from renewable electricity is and will only be cost-effective if low-cost excess electricity is used. Furthermore, it is assumed that in major hydrogen-consuming regions, hydrogen production from biomass will only play a minor role [1].
Depending on the raw materials used in hydrogen production and the amount of CO2 emissions accompanying this process, the produced hydrogen is labeled by colors. Gray hydrogen is produced from fossil fuels, and the associated CO2 is released into the atmosphere. When a process is used to capture CO2 that is infused, for example into a mine shaft, the hydrogen is referred to as blue. If renewable energy and a CO2-free process are used to produce hydrogen, the resulting hydrogen will be referred to as green hydrogen.
For producing hydrogen from fossil fuels, steam reforming and gasification processes are used. The efficiency of these processes, their mass scale of production and the inexpensive price of raw materials result in a low price of hydrogen. On the other hand, however, they require additional hydrogen purification processes. For hydrogen produced from fossil fuels to have a purity above 99%, it must be purified in an enrichment step. This technology is currently used on an industrial scale primarily as a pressure swing adsorption (PSA). The contamination of hydrogen with hydrogen sulfide has a huge impact on the durability of fuel cells, while the carbon monoxide content affects the voltage generated by the cell.
Current hydrogen production is for chemical applications where it is fully consumed. The demand generated by transport using hydrogen will be covered by the newly established production facilities. The processes used there qualify the product as green hydrogen, giving the desired effect of zero-emission transport at the same time.
A dominant process in producing green hydrogen is electrolysis. As a result of water electrolysis, hydrogen and oxygen are extracted with very high purity, above 99.999%. This fact is used in direct hydrogen production on the spot of the hydrogen fueling station for fuel cell vehicles, without the need for further purification. However, to obtain such pure hydrogen, the water must be preconditioned. The current energy efficiency of hydrogen production by electrolysis is about 75%.
According to the International Energy Agency [1], the structure of world hydrogen production consists of about 48% hydrogen produced from natural gas, 30% from oil and 18% from coal. The remaining 4% is produced by the electrolysis of water.
Hydrogen has a significantly higher energy density value than batteries (in terms of mass and volume), which benefits the vehicle storage capacity and affects the driving range of the vehicle. Taking these advantages into account, hydrogen fuel cells or internal combustion engines powered by hydrogen can be used in passenger cars, vans, trucks buses and other means of transport (Figure 1).
The BEV systems can be used in small passenger vehicles where the daily mileage limit is quite low. With respect to trucks, the use of FCEVs starts to be very beneficial. Fuel cells require far fewer raw materials in the production stage than electrochemical batteries. An additional advantage is the lack of the use of cobalt and the limited use of platinum (compared to internal combustion engine vehicles).
The current price of hydrogen for end-user transport in Europe ranges from EUR 5 to EUR 9.5 per kg, depending on the region. The lowest price is due to the fact that it is produced as a waste product in industrial chemical processes, while the highest price is a contractual price intended to equate the cost of operating a fuel cell car with a spark ignition (SI) engine.
According to the Hydrogen Council [3], the price of hydrogen for fuel cells will decrease by about 60% for the end user over the next decade. This will occur in regions with access to cheap natural gas and the ability to store captured CO2. In addition, with an increased demand for hydrogen, the cost of hydrogen supply over the coming decade could decrease by as much as 70%. As a result, the cost of distributed hydrogen in 2030 could be in the range of USD 4.5–6 per kg. A comparative analysis of refueling vehicles with conventional fuels, hydrogen and recharging batteries at the filling station shows (Figure 2) that this time is significantly shorter for conventional fuels and hydrogen than electric vehicles, while hydrogen provides a much greater driving range than in the case of electric vehicles. Additional factors favoring hydrogen as a fuel are the investment costs associated with the construction and size of refueling stations.
According to the Hydrogen Council, the CO2 emission of hydrogen pathways (the well-to-tank stage) from natural gas via SMR (steam methane reforming) was ~75 g/km, accounting for ~60% of the total CO2 emissions of a FCEV from lifecycle perspective [4]. Most hydrogen today is produced from fossil fuels and emits carbon (grey hydrogen). For producing low-carbon hydrogen from natural gas with CCS, the following two technology options exist: steam methane reforming (SMR) and autothermal reforming (ATR) [3]. SMR combines natural gas and pressurized steam to produce syngas, which is a blend of carbon monoxide and hydrogen. ATR combines oxygen and natural gas to produce syngas. This process can easily capture up to 95% of CO2 emissions. ATR technology is typically used for larger plants compared with SMR technology. Based on the data presented in [5], CO2 emission during hydrogen production is (kg CO2−e/kg H2): coal gasification (no CCS)—12.7–16.8; coal gasification and CCS (best case)—0.71; SMR (no CCS)—8.5; SMR and CCS (best case)—0.76.
The data compiled by the International Council on Clean Transportation Europe [6] show that the average real-world fuel (kg) and electricity consumption (kWh/100 km) values for lower medium and SUV segment cars registered in the European Union are, respectively, BEV: 20.6 and 21.9 kWh and FCEV: 1.0 and 1.2 kg.
In a study, the authors of [6] stated that the life cycle for GHG emissions of average gasoline- and diesel-powered ICEVs (internal combustion engine vehicle) are very similar and range from 226–227 g CO2 eq./km for small, 245–246 g CO2 eq./km for lower medium and 266–288 g CO2 eq./km for SUV segment cars. The emissions from FCEV vehicles looks similar to the following: of medium segment, 202 g CO2 eq./km (from natural gas) and 55–60 g CO2 eq./km (from renewable hydrogen). However, the data presented in [7] show that in some European countries, the amounts of the average carbon footprint over a lifetime (segment D) are significantly different: Germany—426 g CO2 eq./km and France—112 g CO2 eq./km. This is mainly due to the way in which hydrogen is produced. When the electrolysis is powered by 100% renewable energy, the gain in emissions from hydrogen production makes it possible to reach the BEV level (80 g CO2 eq./km).
As hydrogen in gaseous form has a very low density (0.089 kg/m3) and is significantly lighter than air, it is usually stored compressed. In vehicle propulsion applications, to increase the energy density, two standards are usually used for hydrogen storage pressure, that is 35 MPa, which corresponds to a density of 23 kg/m3 and 70 MPa, which corresponds to a density of 38 kg/m3. For a pressure of 35 MPa, the volumetric energy density of hydrogen is 2.8 MJ/dm3, while for a pressure of 70 MPa, the energy density is 4.7 MJ/dm3.
Hydrogen fuel cell power cars started to reach the US consumer market already in 2014. Official U.S. sales of Hyundai’s cars began in June 2014, Toyota’s in October 2015 and Honda’s in December 2016 (primarily in the state of California).
“Global Market for Passenger Hydrogen Fuel Cell Vehicles” conducted a study at the beginning of the HFCV sale, which projected that by the end of 2020, global sales would amount to more than 27,500 passenger cars powered by hydrogen fuel cells. In 2020 alone, 8500 units were sold [8]. A barrier to the development of this drive has been identified as the lack of available hydrogen refueling infrastructure. The report also indicated that sales of hydrogen-powered cars and SUVs will increase in the coming years. Last year, more than 8500 of such vehicles were sold, which was the highest annual sales rate ever recorded. It should be noted that such high sales in 2020 were achieved despite the huge economic slowdown experienced by the automotive industry during the SARS-CoV-2 pandemic. Consequently, sales of passenger cars and SUVs, light commercial vehicles and full-size trucks and buses are expected to grow very rapidly in the coming years [8].
In 2020, the global number of hydrogen refueling stations was 553; it is planned that in 2021 this number will increase by another 221 stations. In Europe, there are 200 stations (including 100 in Germany), in Asia—275 and in North America—75. The most dynamic development of this technology is observed in Germany, China, Korea and Japan [9].

2. Analysis of Hydrogen Usage in Internal Combustion Engines and Fuel Cells

The automotive deployment of hydrogen is currently in two application areas (a) as a fuel in internal combustion engines and (b) as a fuel in fuel cells.
Research on hydrogen-powered internal combustion engines began in the 1930s [10]. A broad spectrum of categorization of a hydrogen internal combustion engine (HICE) based on typical injection and ignition strategies was presented by Yip et al. [11]. Typical solutions involve the indirect injection of hydrogen into the intake tract. The second technical solution is the direct injection of hydrogen into the cylinder [12] or the use of both variants [13]. It is realized in spark-ignition [14] and compression-ignition engines as well.
Smirnov and Nikitin [15] conducted studies of hydrogen ignitability in closed chambers. Models of hydrogen combustion were proposed and verified with reference to pre-mixed and non-premixed combustion and detonation models.
One form of using hydrogen in an internal combustion engine is its co-combustion with the following other fuels (dual–fuel systems): gasoline [16], diesel [17], natural gas [18,19], methanol [20,21] or as an additive to other fuels (butanol [22], natural gas [18] or fuel mixtures [23]).
Simulation studies of co-combustion of hydrogen with diesel fuel by Babayev et al. [17] indicate that (a) compressed ignition hydrogen reacting jets are fundamentally different from diesel jets, (b) both the free-jet and the global mixing modes govern the compressed ignition hydrogen combustion cycles and (c) jet-mixing combustion is more effective and should be maximized in compressed ignition H2 engines.
A common solution is to use fuel cells together with internal combustion engines in Range Extender systems. Such a solution presented by Chubbock and Clague [24] involves a package of two fuel cells with a total power of 7.8 kW (the FC power mass index is 0.2 kW/kg) and a tank for storing 1.5 kg of hydrogen. The system uses a three-cylinder internal combustion engine with a displacement of 660 cm3 and a power output of 30 kW (operating as a power generator system).
The fuel cells used in the first prototype vehicles (in 2002) achieved a volumetric power factor of 1.0 kW/dm3 with a mass power factor of 0.75 kW/kg [25]. In the FCHV model (in 2008), these ratios were 1.45 kW/dm3 and 0.9 kW/kg, respectively. The first-generation Toyota Mirai had values of 3.1 kW/dm3 and 2 kW/kg, while the new generation of the Mirai vehicle achieves 5.4 kW/dm3 (4.4 kW/kg excluding end plates) and 5.4 kW/kg, respectively [26].
Honda used 130 kW fuel cells in the Clarity model, for which the volumetric and mass power factors were 3.1 kW/dm3 and 2.0 kW/kg [27,28].
Although the parameters and metrics of fuel cells are known, there is a lack of analysis on energy consumption in typical road tests by fuel cell powered automotive vehicles. There are few publications on different vehicles [29] or other research tests [30]. Therefore, the aim of this paper is to fully analyze the energy flow in the Real Driving Condition test (based on the Real Driving Emissions test) and, additionally, to analyze the use of fuel cells, a high-voltage battery and an electric motor.

3. Materials and Methods

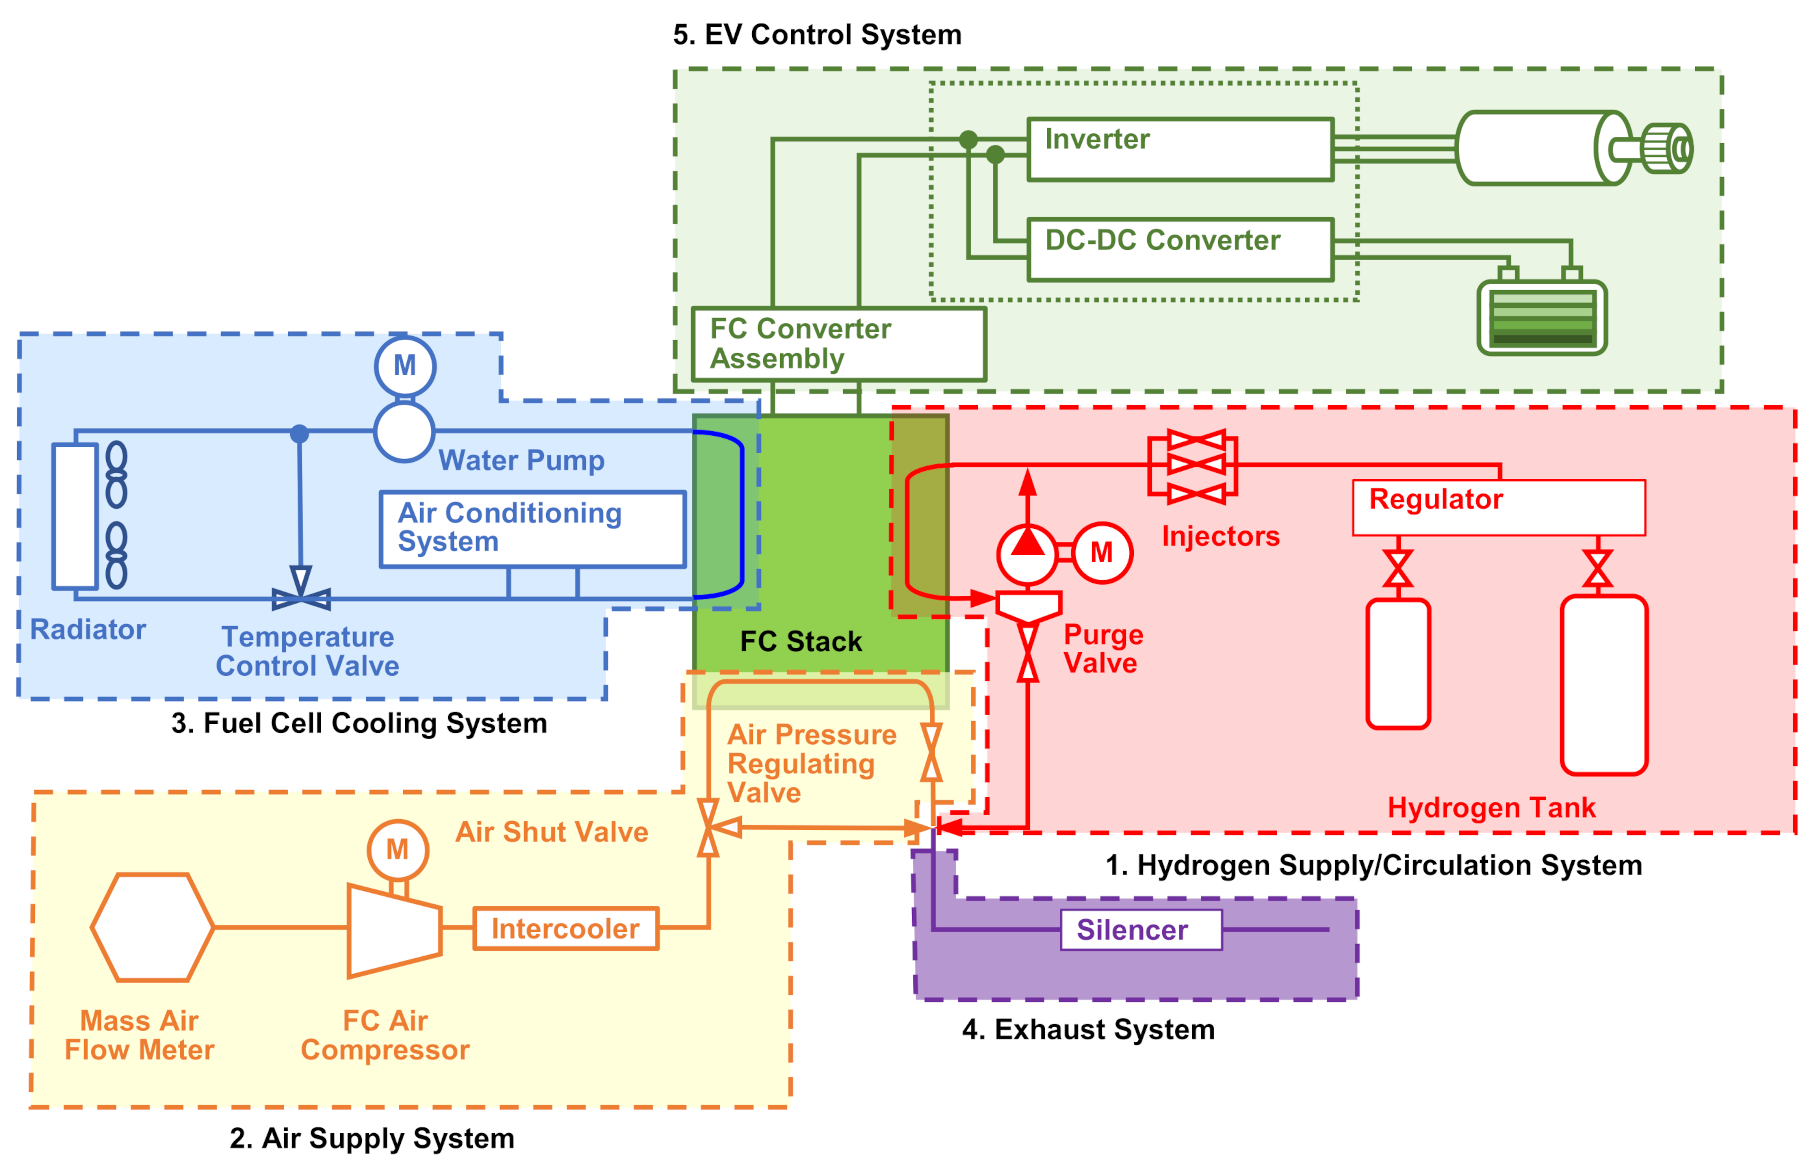
3.1. Research Objects

The research was conducted using a Toyota Mirai first-generation vehicle (Table 1). The vehicle uses components from Toyota’s hybrid vehicle models mass-produced since 1997. These components consisted of the vehicle’s power management unit, known as the power controller and the voltage converter, both used from a third-generation Prius model; the traction electric motor was taken from a Lexus RX 450h hybrid model; and the high-voltage battery was taken from a Toyota Camry model.
The vehicle was equipped with a stack of 370 fuel cells creating a 114-kW power output. Two hydrogen tanks with a pressure of 70 MPa were used in the vehicle (Figure 3). This produced the highest unit mass power density of compressed hydrogen. The voltage from the fuel cell stack is converted to 650 V and powers an AC electric motor.
The generation of the fuel cell used in this model has a volumetric energy density 28 times higher than that of the first generation used by Toyota. The first generation had a volumetric energy density of only 0.11 kW/dm3, while the one used in the tested Mirai model is 3.1 kW/dm3. This was achieved, partly due to the design of the cell stack with a configuration that allows internal self-humidification, using the circulation of water produced in each cell. This feature eliminated the need for a humidifier, significantly reducing the volume of the entire cell stack.
The vehicle has two tanks of 120 and 122 dm3, holding a total of 5 kg of hydrogen (Table 2). The calculated ratio of the mass of hydrogen, at maximum hydrogen filling, to the empty mass of the tanks is 5.7%.
The use of the Fuel Cell Boost Converter (FDC) from the hybrid model in the Mirai enabled the use of an inverter and an electric traction motor, already used in series-produced hybrid vehicles. In addition to these components, an Intelligent Power Module (IPM) was also used [33].
The high-voltage battery used in this model has the same function as in the hybrid-drive models. Its main role is to accumulate the energy regenerated during braking [35]. The energy stored in the battery is used to power the powertrain during vehicle startup and during acceleration [36]. This keeps the instantaneous hydrogen consumption at a very low, or zero, level compared to if the energy was generated by the fuel cell alone. Since the mass of the vehicle is 1850 kg, the designers used a 244.8 V traction battery to ensure adequate performance. Since Toyota uses nickel-metal hydride batteries for a majority of its hybrid models, the same battery was used for the model Mirai. The battery structure contains 34 modules with 6 cells of 1.2 V each.

3.2. Research Equipment and Methodology of Determination of the Energy Flow

The measurements were performed using a specialized, dedicated diagnostic tester utilizing the OBD (on-board diagnostics) connector. The research used data provided by one of the vehicle systems—the hybrid control. This system operates using selected vehicle data, fuel cell stack, parameters of the electric motor and the parameters of the high-voltage battery. The vehicle driving conditions were determined based on the measurements of the vehicle speed and the data sampling time. The resolution was 1 Hz.
The assessment of the energy flow was carried out based on the measurements of the engine speed and load, the speed and torque of the electric motors/generators, the battery voltage and the current (including the boost voltage).
Using the above measurement data, the following quantities were determined:
  • energy flow (urban, rural, motorway):
Δ E i = t = 0 t = t max U BAT · I BAT dt
the instantaneous energy flow values ∆Ei were divided in accordance with the following criteria:
  • discharging (urban, rural, motorway):
Δ E dis = t = 0 t = t max U BAT · I BAT dt   if   Δ E i < 0 ,
  • charging (urban, rural, motorway):
Δ E ch = t = 0 t = t max U BAT · I BAT dt   if   Δ E i > 0   and   T reg 0 ,
  • regenerative braking (urban, rural, motorway):
Δ E reg = t = 0 t = t max U BAT · I BAT dt   if   Δ E i > 0   and   T reg < 0 ,
where UBAT—voltage (V), IBAT—current (A), dt—time interval (h), Treg—braking torque (Nm);
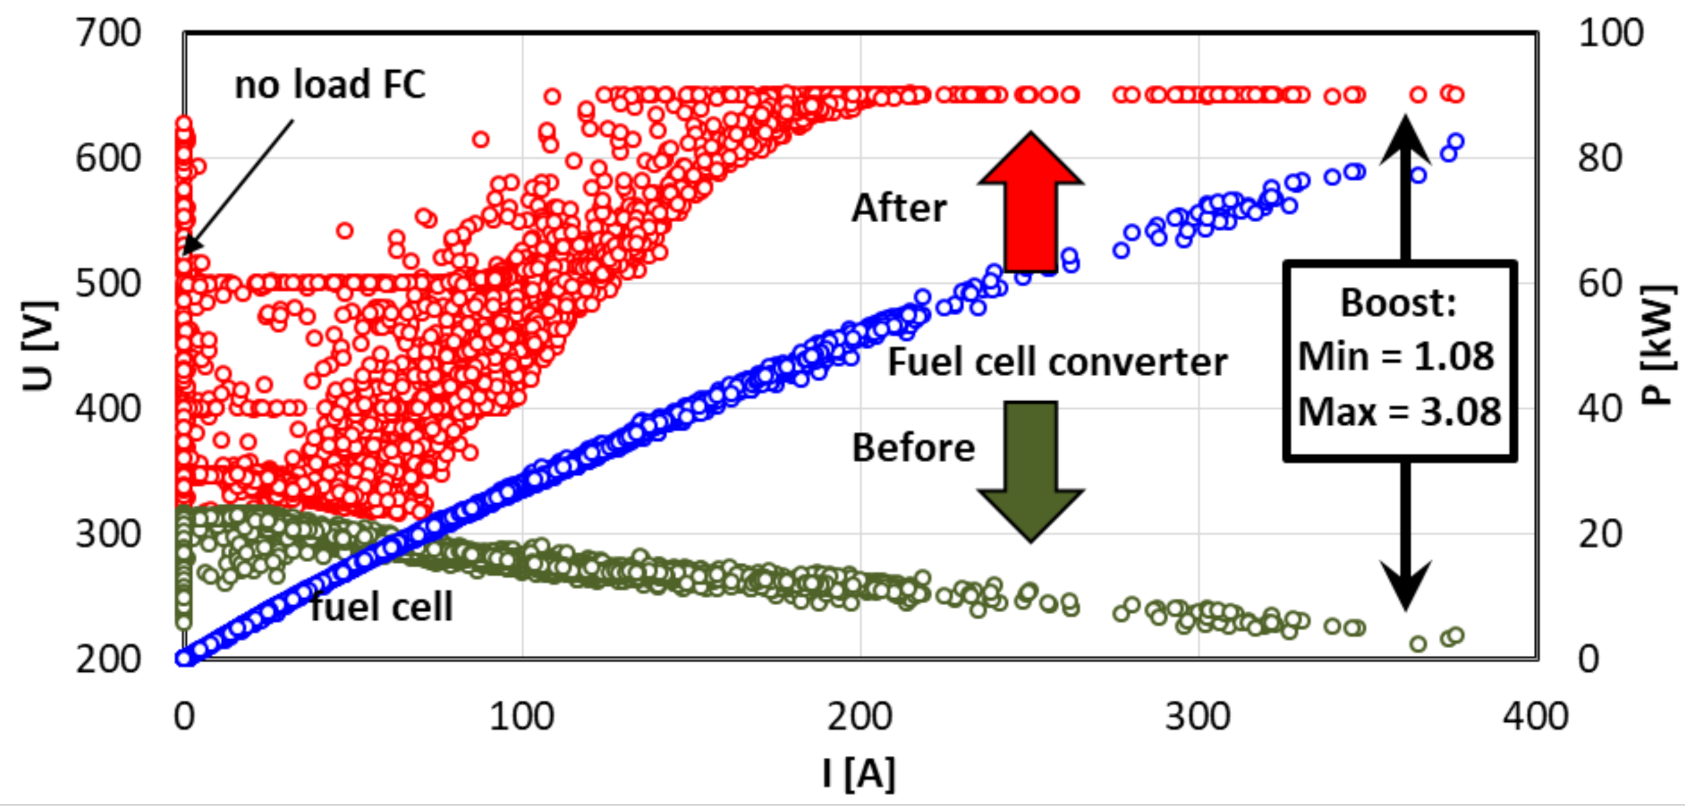
  • boost value (urban, rural, motorway):
boost = U HV U LV
where ULV—low voltage side (V) and UHV—high voltage side (V).

4. Results

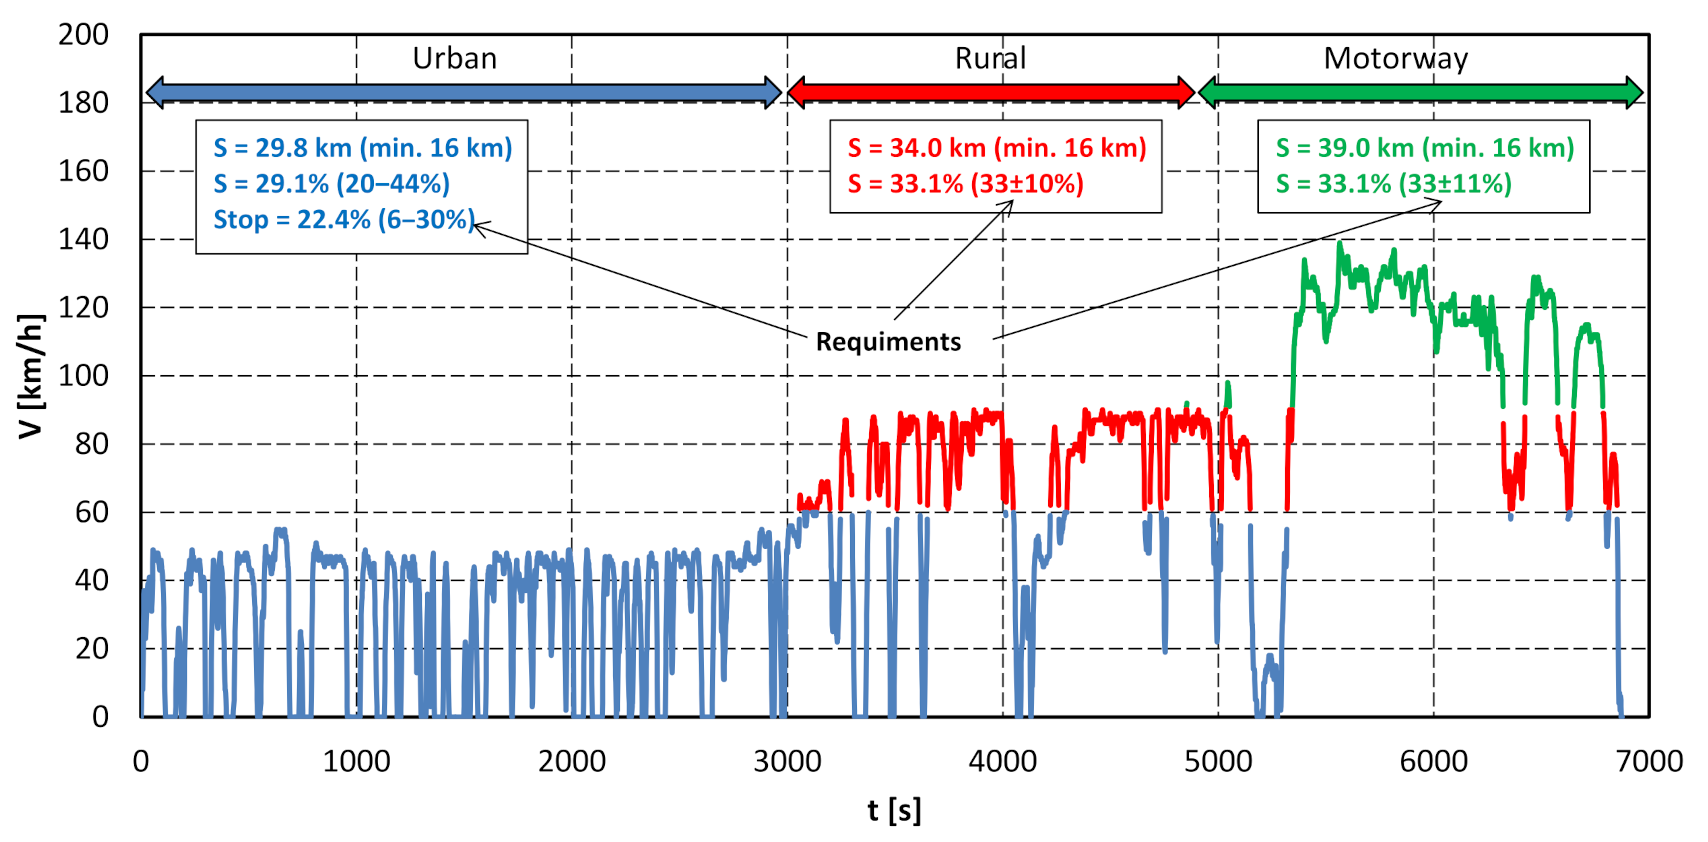
4.1. Driving Test Evaluation

The main problem of a constantly developing industry is its negative impact on the environment. Transportation is one of the most rapidly changing industries, and it significantly affects the concentration of hazardous substances in the air. To reduce the impact of vehicles on the environment, increasingly stringent standards for exhaust emissions are being introduced and solutions are being developed to minimize vehicle emissions. Exhaust emission standards are set to control the pollutants emitted from automotive vehicles around the world. Exhaust emission values are measured under conditions in an established type of the approval test. This part of the vehicle certification process is responsible for the environmental performance of the vehicle and is the same for all passenger cars. The course of the test corresponds to the most likely road conditions, and the tests performed, which are the same for all vehicles, authorize the comparison of emission results between them. Nowadays, the focus is more and more on road testing, i.e., testing under real driving conditions. These tests have now been integrated into European Union regulations under the name RDE (Real Driving Emissions) [37,38]. These are made to best reflect the actual operating conditions of the vehicle in terms of environmental aspects. The research presented in this paper omits the analysis of exhaust emissions (which, in a fuel cell vehicle, is zero), focusing on the analysis of the energy consumption of a modern propulsion system based on RDE test standards. With this in mind, the authors refer to this test by the acronym RDC (Real Driving Conditions) [39,40]. Due to increasing electrification of vehicles, comparative work on the energy consumption of propulsion is extremely important for the development of the transportation field. The RDC (RDE) test procedure is universal within the European Union and can be carried out on selected sections of a road that meet the basic requirements. The route is divided into three sections corresponding to the speed of urban, rural and motorway driving conditions. The test was performed with the FC vehicle in Warsaw (Poland) and met all the requirements, as shown in Figure 4.

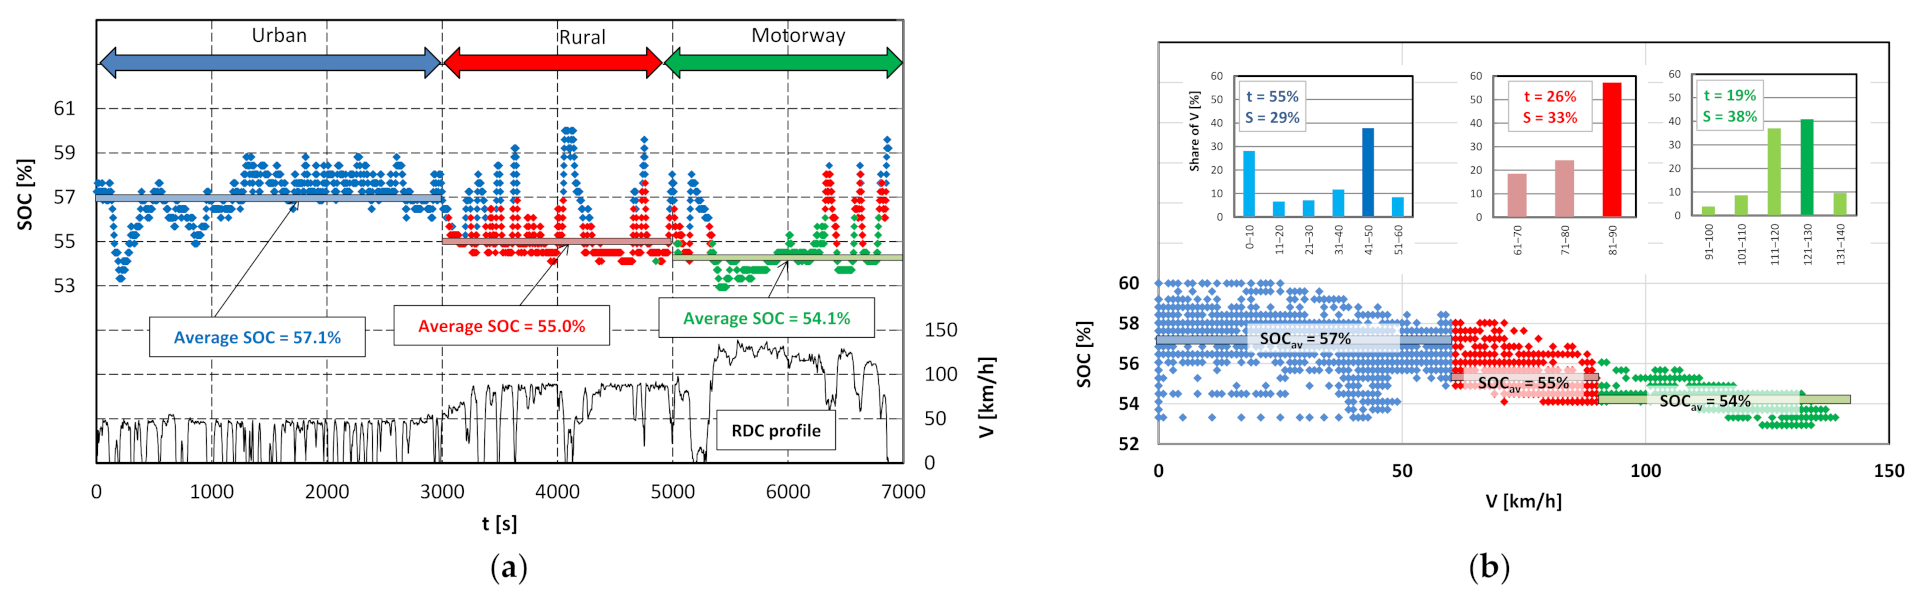
4.2. State of Charge (SOC) Change Analysis

The drive system of the Toyota Mirai is equipped with a high-voltage nickel-metal hydride battery. During driving, the battery is charged and discharged due to the characteristic parameters of the route, such as the amount of acceleration and braking in a given section of the route. The energy recovered during braking can be reused to power the vehicle, as is the case in hybrid and electric vehicles. The study identified the areas with the highest and lowest average battery charge levels (Figure 5a).
As the driving speed increases, resulting in less braking zone, the high-voltage battery reaches lower average charge levels. Of course, this value is dependent on the characteristics of the route, since a single slowing of the vehicle results in a significant increase in recovered energy. Despite the direct response of the level of charge to vehicle driving parameters, the total SOC fluctuation area is in the range of 53–60%, which is a small range of the full battery capacity of 1.6 kWh. Slight variations of the SOC are characteristic of hybrid powertrains, where the engine (in the case of the vehicle under study, a fuel cell) is the main source of propulsion. The battery is supposed to mainly store energy from recovery modes or excess energy production by the powertrain.
The largest changes in battery charge are recorded in the range of driving speeds up to 60 km/h (which corresponds to urban driving speeds), where the highest average charge was recorded at the same time (Figure 5b). The change in battery charge level oscillates in the range of ∆SOC = 7.06% over the entire test interval.

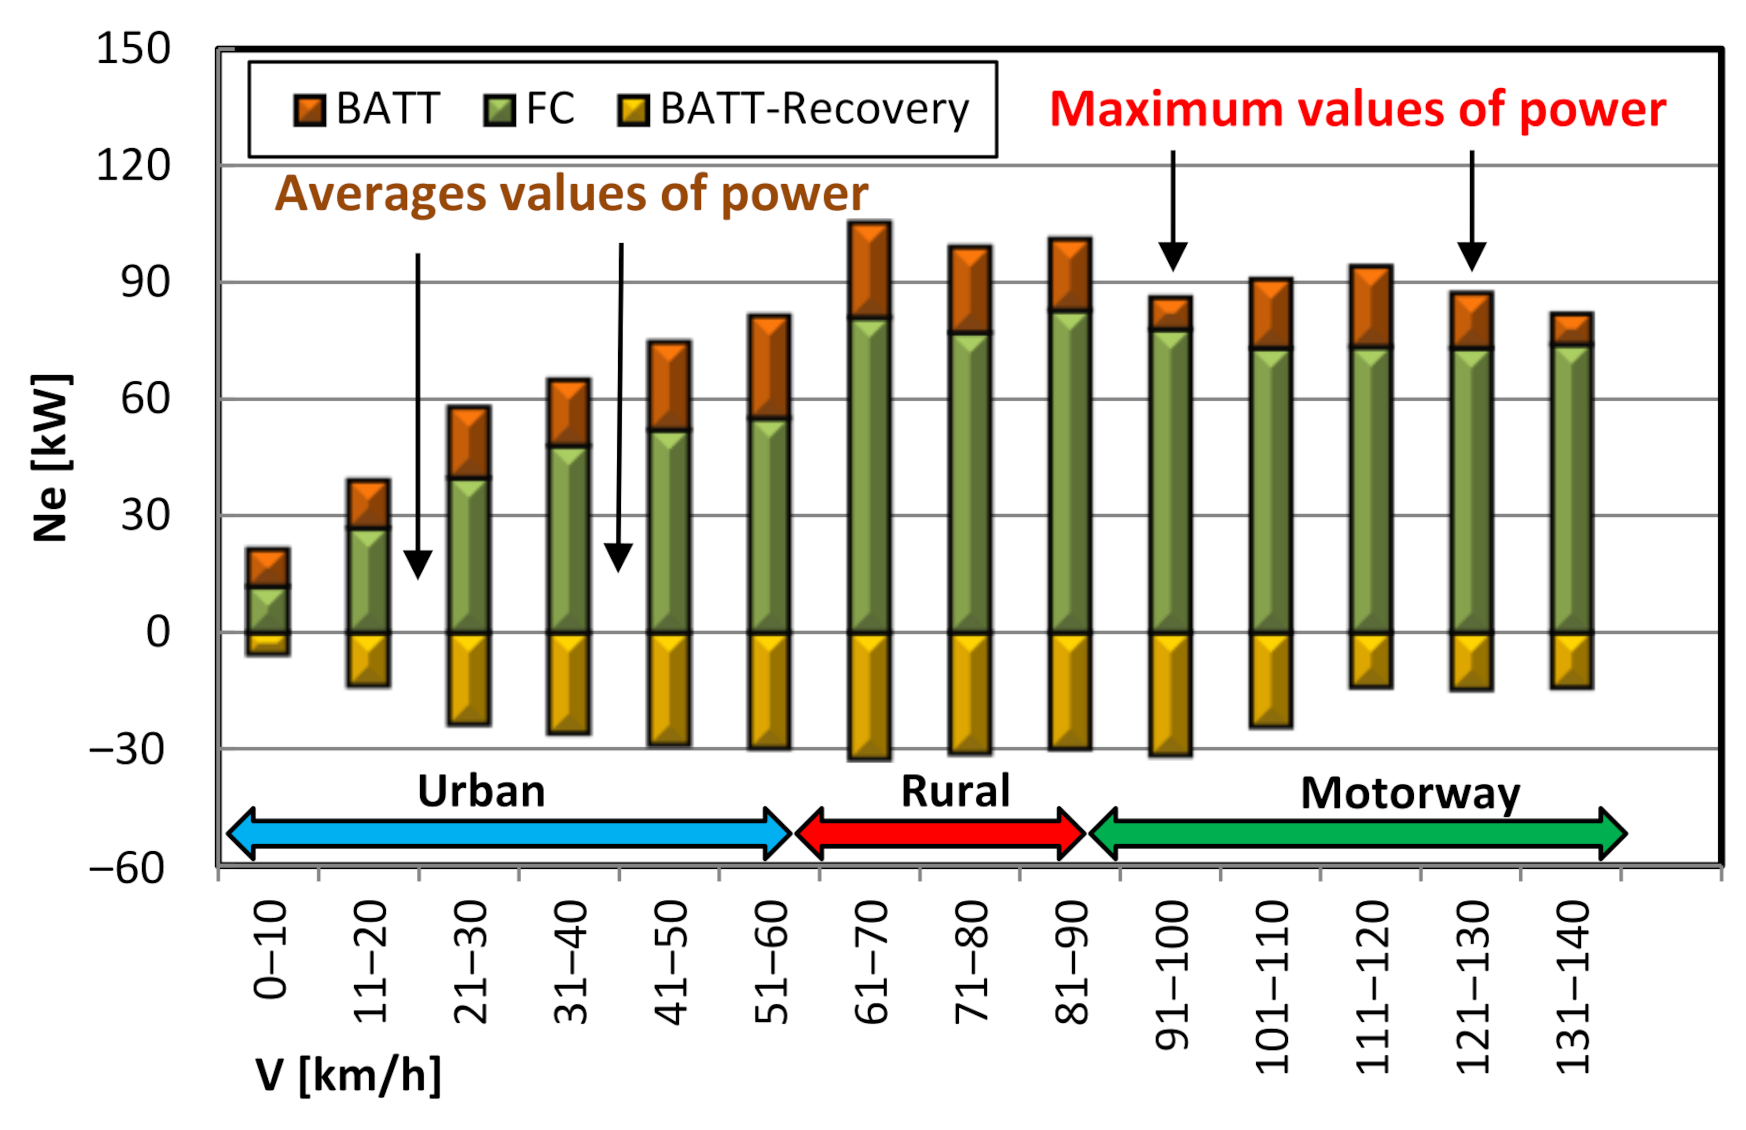
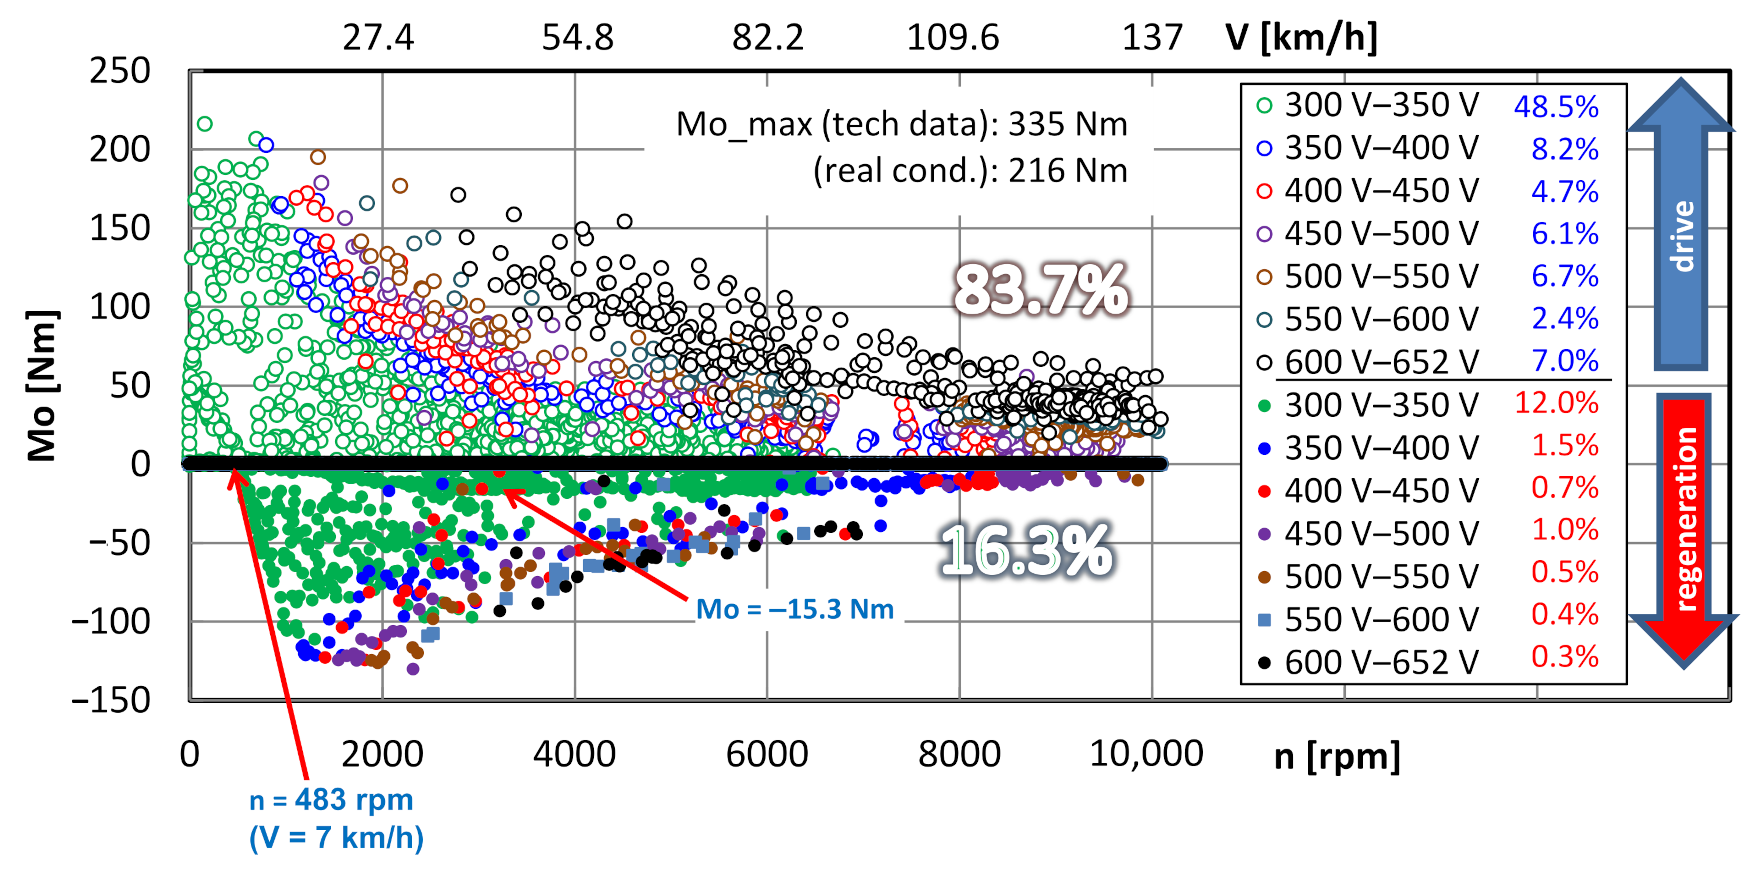
4.3. Powertrain Performance Evaluation

In a hybrid vehicle, the energy for propulsion comes from two sources. The range of the propulsion power source in the intervals of each stage of the RDC test route was determined in the tested vehicle. The battery and fuel cell power consumption conditions shown in Figure 6a,b indicate areas of battery-only operation and areas of dual power source cooperation in the vehicle drive. At low vehicle speeds in the 0–10 km/h range, the propulsion energy comes from the battery. Higher vehicle speeds result in the fuel cell starting to work in the power generation process. An increase in vehicle speed increases both the instantaneous maximum values of the powertrain energy demand and the average values in each speed window with an interval of every 10 km/h (Figure 7).
Due to the individual driving parameters, some speed ranges recorded lower energy consumptions, however, the justification for these results should be found in the temporary driving conditions, for example, the lowest average energy values were obtained in the speed range 41–50 km/h, this speed usually occurs only in transition states between acceleration and deceleration to the maximum speed of the urban speed range. Over a wide range of speed ranges, similar energy recovery values were recorded for both the urban and rural sections, indicating the versatility of energy recovery at varying speeds.

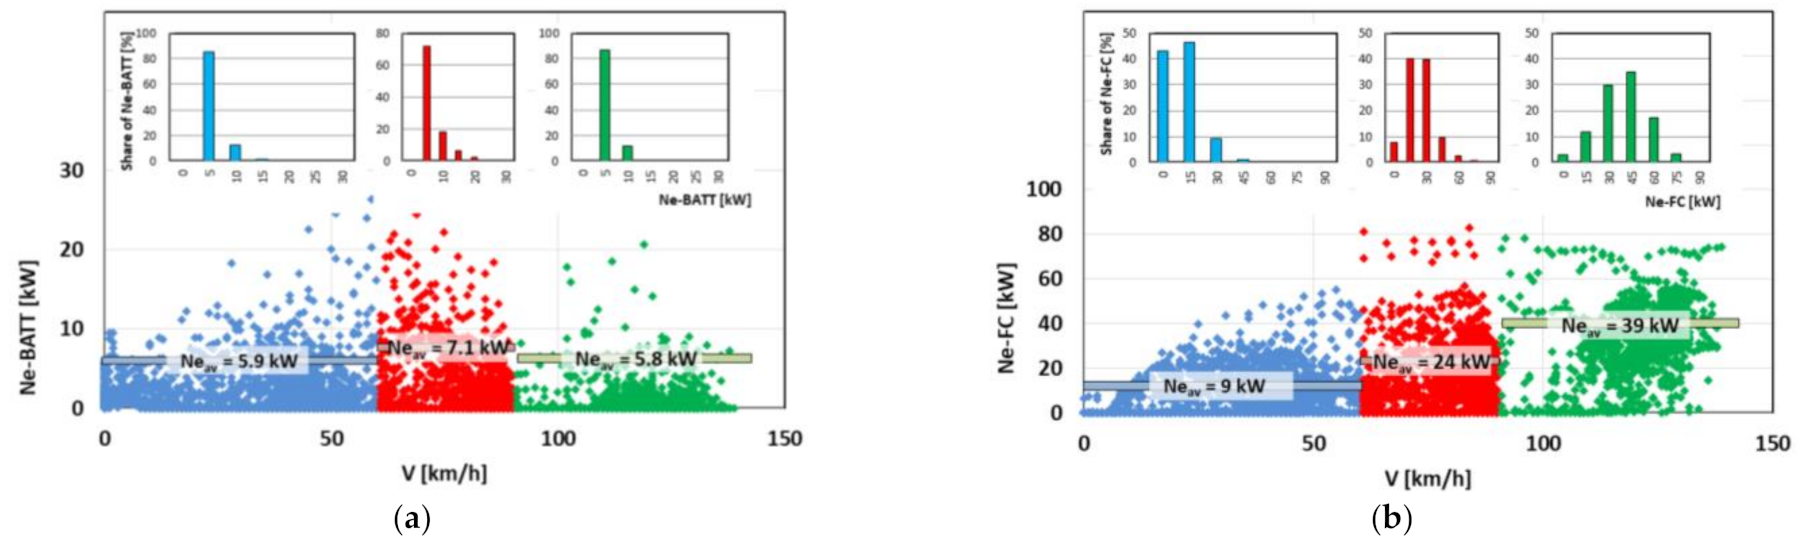
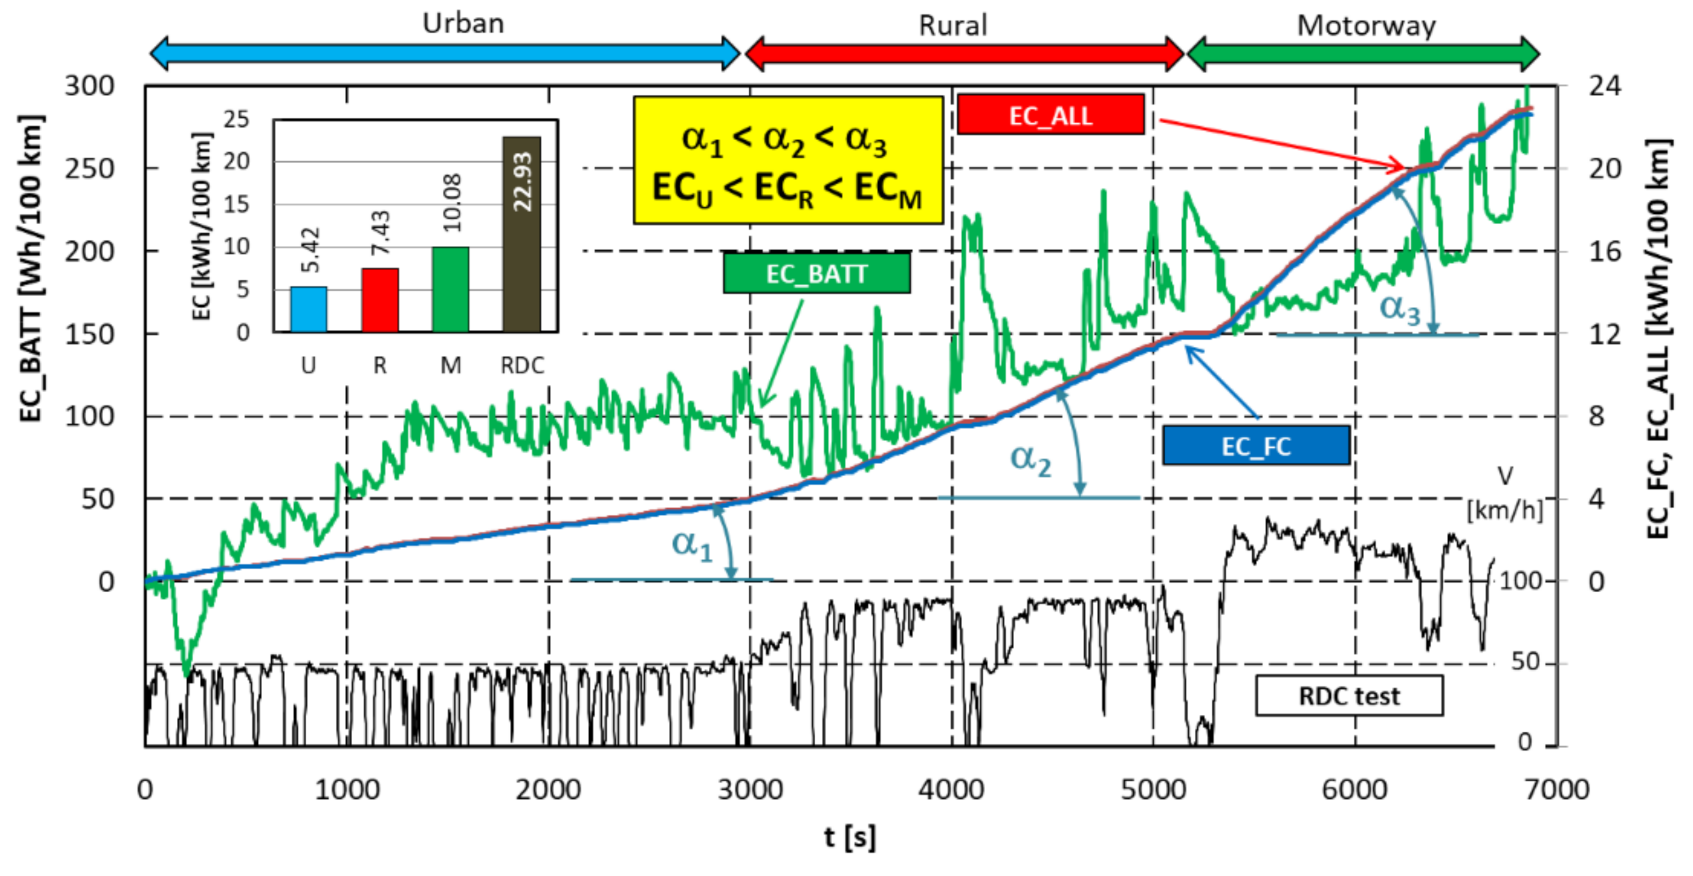
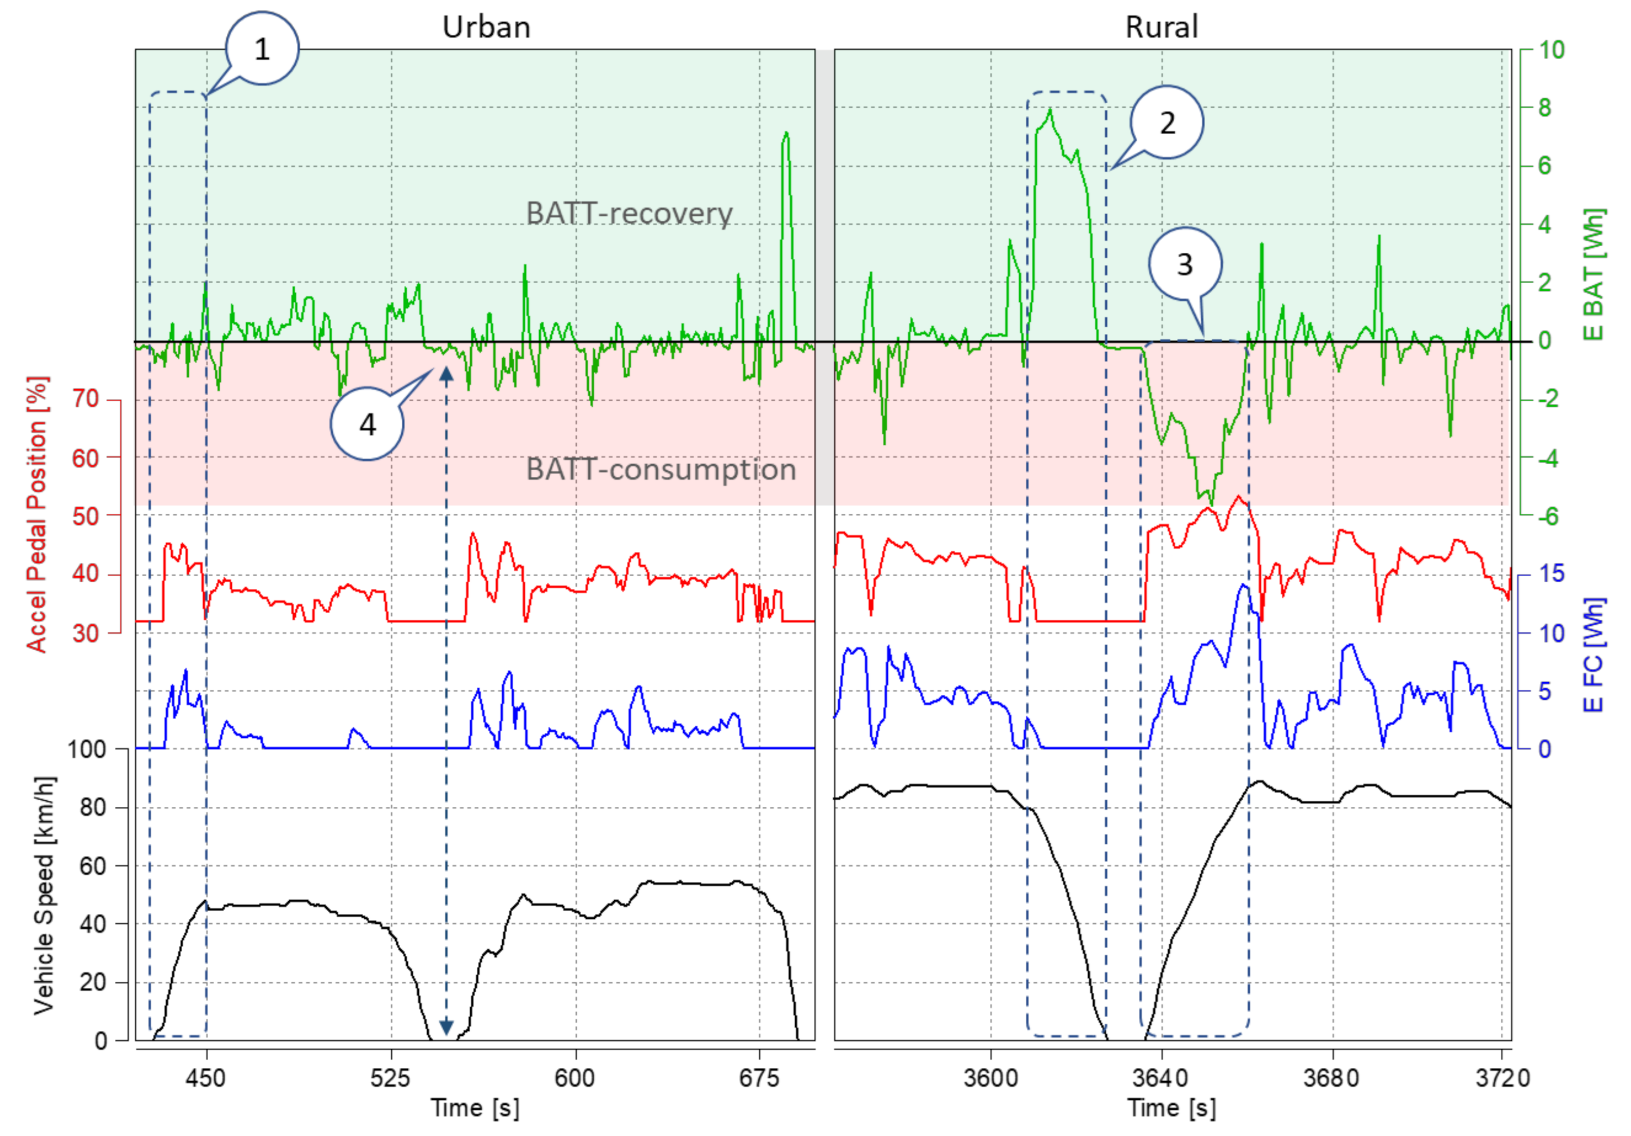
4.4. Evaluation of Electric Drive Operating Conditions and Energy Consumption

The energy to operate the vehicle comes mainly from the fuel cell, transient situations caused by acceleration additionally consume energy from the high-voltage battery, but in total, due to energy recovery to the battery during braking, the energy flow from this source becomes neutral. The small changes between EC_ALL and EC_FC are due to the inclusion of changes in battery discharge (EC_BATT) and battery recharge due to recovery regenerative braking (EC_REC), according to the following equation:
EC _ ALL = EC _ FC EC _ BATT + EC _ REC
In this way, the difference between EC_ALL and EC_FC is not significant because the battery usage and recharge is close to zero. These conditions are illustrated in Figure 8.
Confirmation of the above statement regarding the main use of the fuel cell for vehicle propulsion is provided by an analysis of the energy flow shares (discharge and charge) per vehicle speed for the battery (Figure 9). It can be concluded that in selected speed ranges, the regenerated energy is equal to the energy consumed during driving or acceleration. However, it should be remembered that this graph only shows the energy flow from the battery and the fuel cell is also used for propulsion, which generates much more energy to drive the vehicle. The drive characteristics also indicate that braking energy recuperation only occurs until 8 km/h, below which the vehicle decelerates using the conventional braking system. The highest energy consumption from the battery was recorded for accelerating the vehicle from a standstill when the fuel cell is not yet generating the required propulsion power. In the presented single RDC test, the total energy recovered is 322 Wh more than the energy consumed; therefore, the energy recovery system is highly efficient (the battery does not require an external source of charge to obtain the energy needed to drive the vehicle—part of the energy also comes from the operation of the fuel cell, what is indicated later in this article).
Complementing the presented summary evaluation of the powertrain during the RDC test is a discussion of energy flow on selected instantaneous single vehicle acceleration and deceleration states. Based on Figure 10, it is possible to describe the following characteristic operating points of the drive system:
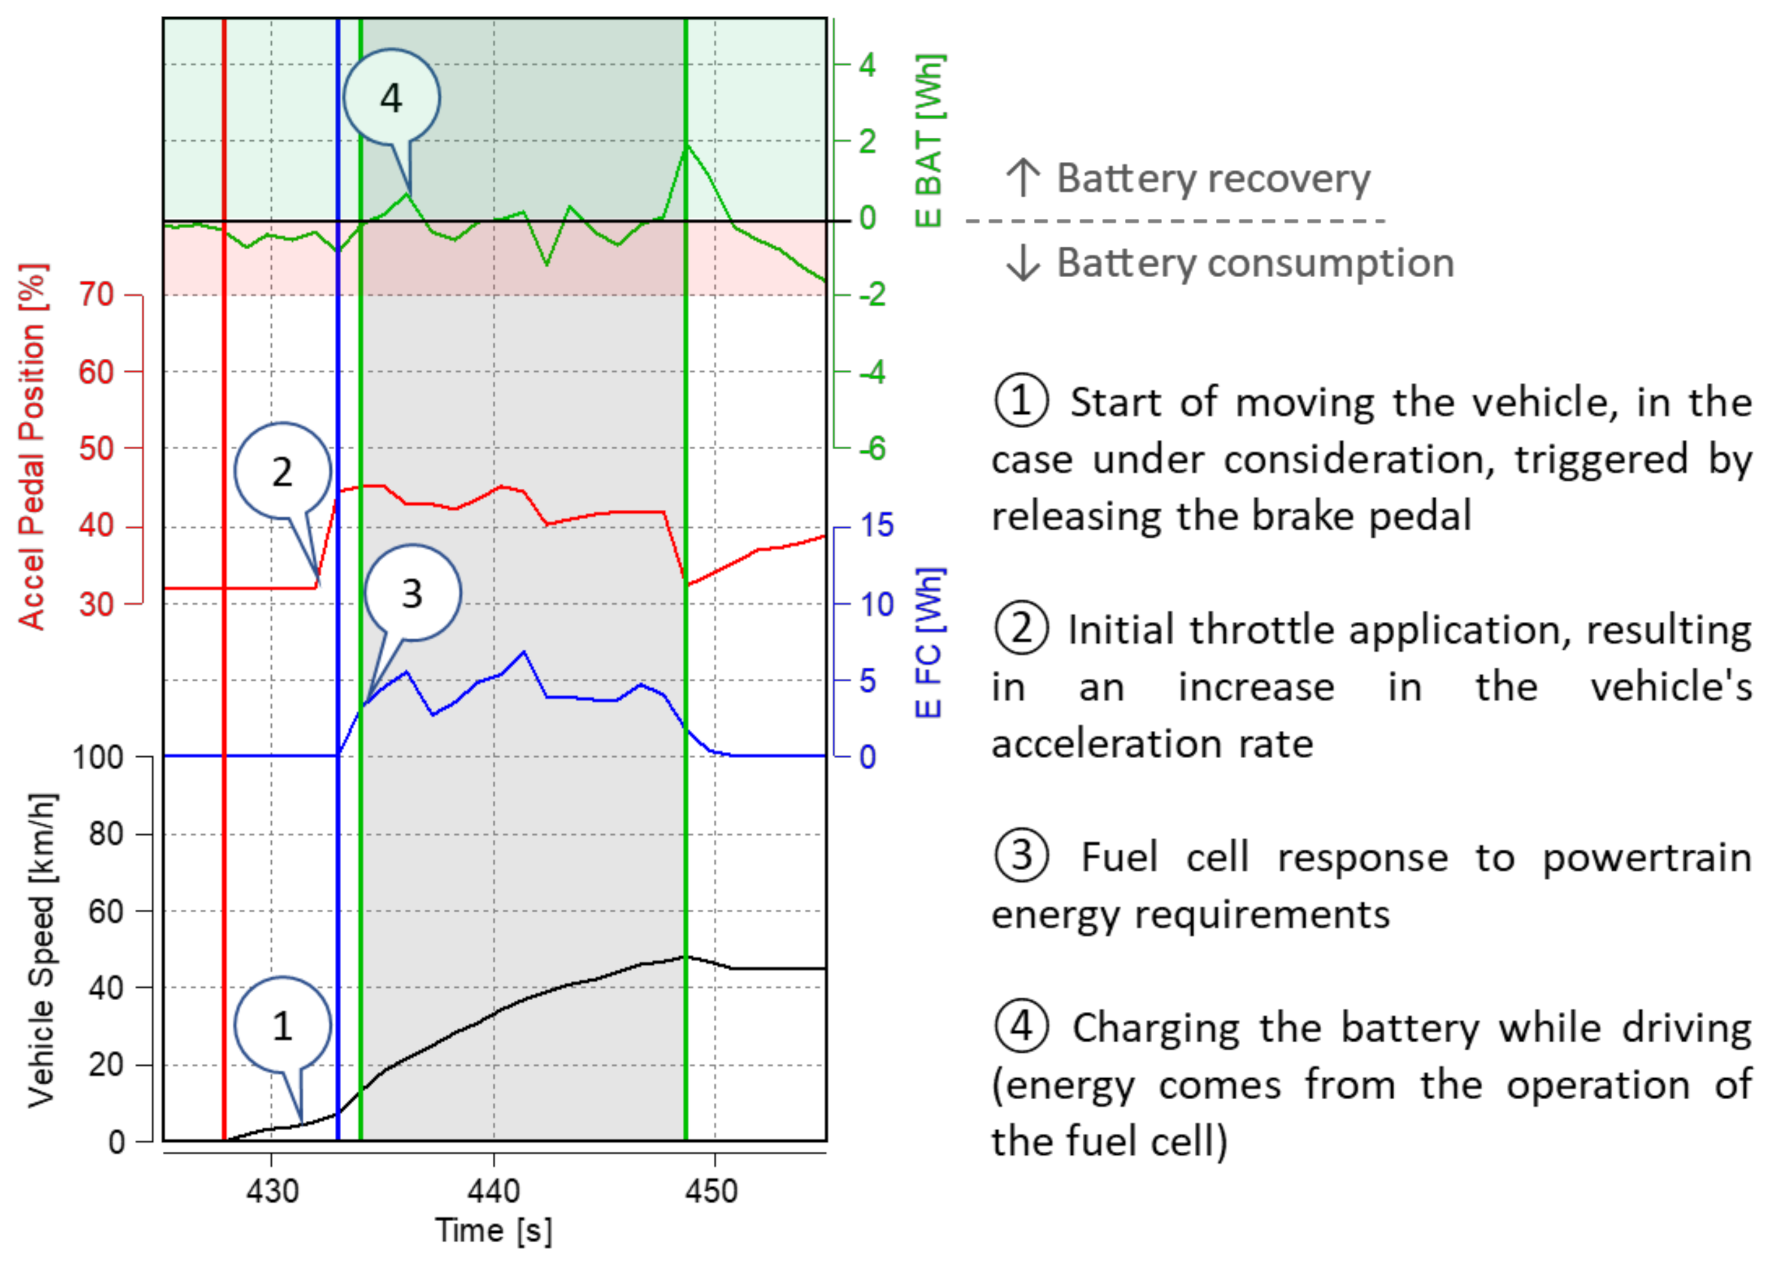
  • during vehicle acceleration, the initial energy input from the battery is visible until the fuel cell starts producing energy (for further analysis see Figure 11);
  • during braking, the fuel cell operation is shut down and the energy is recovered to the high-voltage battery;
  • depending on the vehicle’s acceleration rate, larger amounts of energy are consumed from both the battery and the fuel cell sources;
  • when the vehicle is standing still, the energy requirements of the on-board systems (comfort, entertainment) are fulfilled by the high-voltage battery.
Regardless of the energy source, the wheel propulsion is provided entirely by the electric motor. It is, therefore, important to recognize the operating conditions of the drivetrain (Figure 12). During the entire RDC test, the powertrain generates 83.7% of the vehicle’s propulsion and 16.3% of the energy is recovered during braking. During both propulsion and braking of the vehicle, the powertrain operates within the voltage range of mainly 300–350 V—achieving more than 60% of the total time share. Individual operating points generate higher voltages in the range of 350–652 V; however, the total share of these values is much lower (these are noted at intervals of higher vehicle speeds or higher powertrain loads). The maximum torque achieved during the test was 216 Nm, which is 65% of the max torque claimed by the manufacturer; therefore, the drivetrain in the RDC test does not require maximum torque to complete the run. The regenerative braking characteristics indicate a constant braking torque in the electric motor speed range 1500–9000 rpm at the level of 15 Nm. Regenerative braking is only possible down to a speed of about 7 km/h.
The charging and discharging conditions of the high-voltage battery are shown in Figure 13. Although the nominal voltage is reported as 244.8 V, its operating conditions indicate much larger positive fluctuations around this value. The minimum value fluctuates around 240 V, but the maximum value far exceeds 300 V. The operating conditions of the battery indicate that it is possible to receive about 26 kW of power when discharged. During its charging, much higher power values were obtained (more than 32 kW), indicating slightly different charging and discharging conditions (with similar current values); the voltage variations are around 20 V.
The version of the first-generation Toyota Mirai powertrain presented in this paper includes a Fuel Cell Boost Converter. This is a significant change from the powertrain presented in 2008 (designated as Toyota FCHV adv). This means that the fuel cell using boost can largely self-power the vehicle’s electric motor. The operating conditions in Figure 14 indicate that at a fuel cell current value of about 100 A, the converter maintains a voltage of 650 V. For current values from about 200 A, the converter converts voltage from the cell to the maximum level of 650 V. The voltage–current characteristics of the fuel cell indicate voltage values of 200–300 V at no load to about 200 V at maximum current values of over 350 A. The power characteristics of the fuel cell do not have a typical maximum; therefore, increasing the current increases its power. Thus, applying voltage amplification at a specific current value, in this case at about 100 A, effectively increases the power directed to the electric motor.
An evaluation of the total energy flow in the Toyota Mirai drive system is shown in Figure 15. The contribution of the HV battery in the individual phases of the RDC test is not large—as the driving speed increases, the contribution decreases. For the entire test, the share of battery utilization is about 13%. The share of energy recovery to the battery (regenerative braking and fuel cell charging) is slightly higher. The larger values of energy recovered to the battery apply to each phase of the test—approximately 0.6 percentage points on average. This shows that in the entire driving test, slightly more energy was supplied to the battery than was used. Energy flow analysis shows the vehicle consumed 22.285 kWh in the test. However, the fuel cell “produced” 22.60 kWh, which is indicated in Figure 15—as 101.5% of the total energy consumed. This difference is due to the energy recovery to the battery. Summarizing the energy flow in the RDC test, it should be stated that the contribution of the fuel cell to the vehicle’s propulsion is more than 70%. The rest is half, indicating the battery’s contribution and energy recuperation.

5. Conclusions

Modern hybrid drives that use a fuel cell instead of an internal combustion engine as the main source of propulsion are now a trend in the development of future zero-emission automotive. The advantage of fueling the vehicle quickly is a key advantage over electric vehicles, which take much more time to charge depending on the charging type. Fuel cells are a multipurpose source of electricity that can be converted to electric drive in basically any type of propulsion system; therefore, the research presented above is important because of the recognition of the energy balance of such vehicles. The widespread use of fuel cells in automobile, truck and even maritime transport brings significant benefits. However, the global use of this type of propulsion depends on the development of a hydrogen re-fueling infrastructure. The study determined at what ranges the drive is realized with a fuel cell, and in what ranges a high-voltage battery is engaged. The operating conditions of these systems have been specified.
The above analysis of the operating conditions of the hydrogen vehicle propulsion system under real traffic conditions (according to the RDE test procedure) indicates the following:
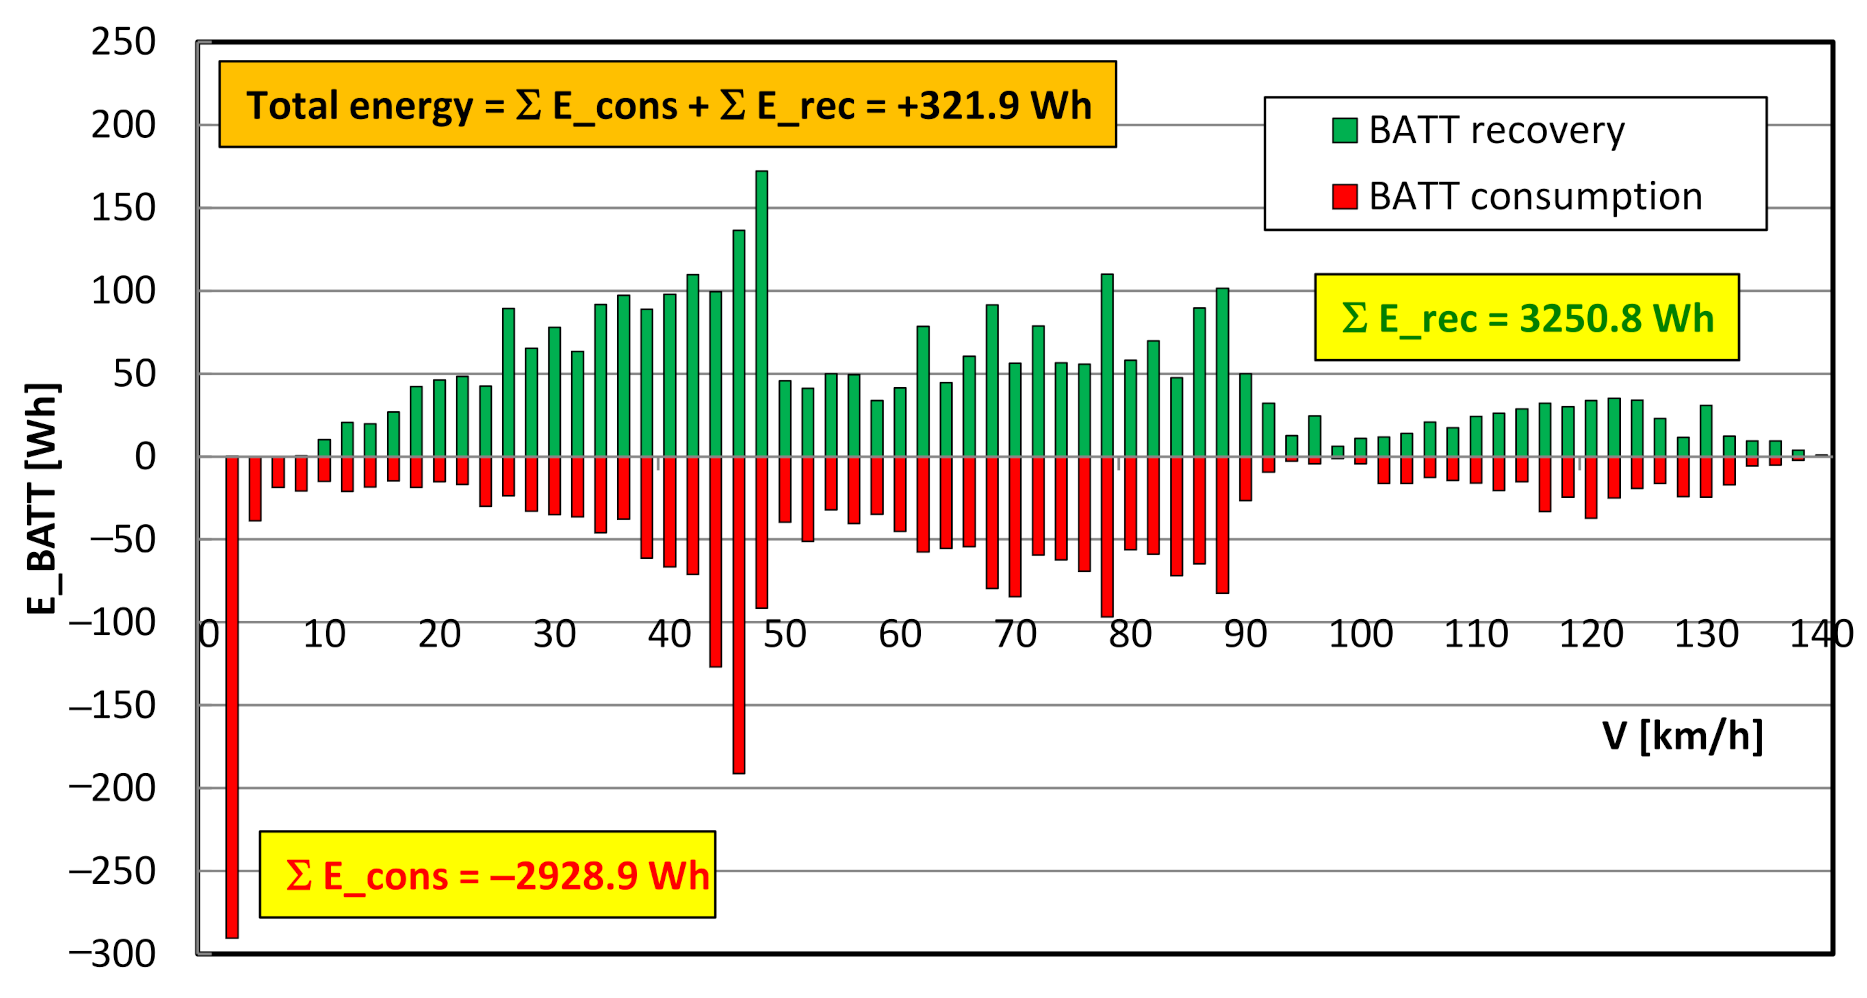
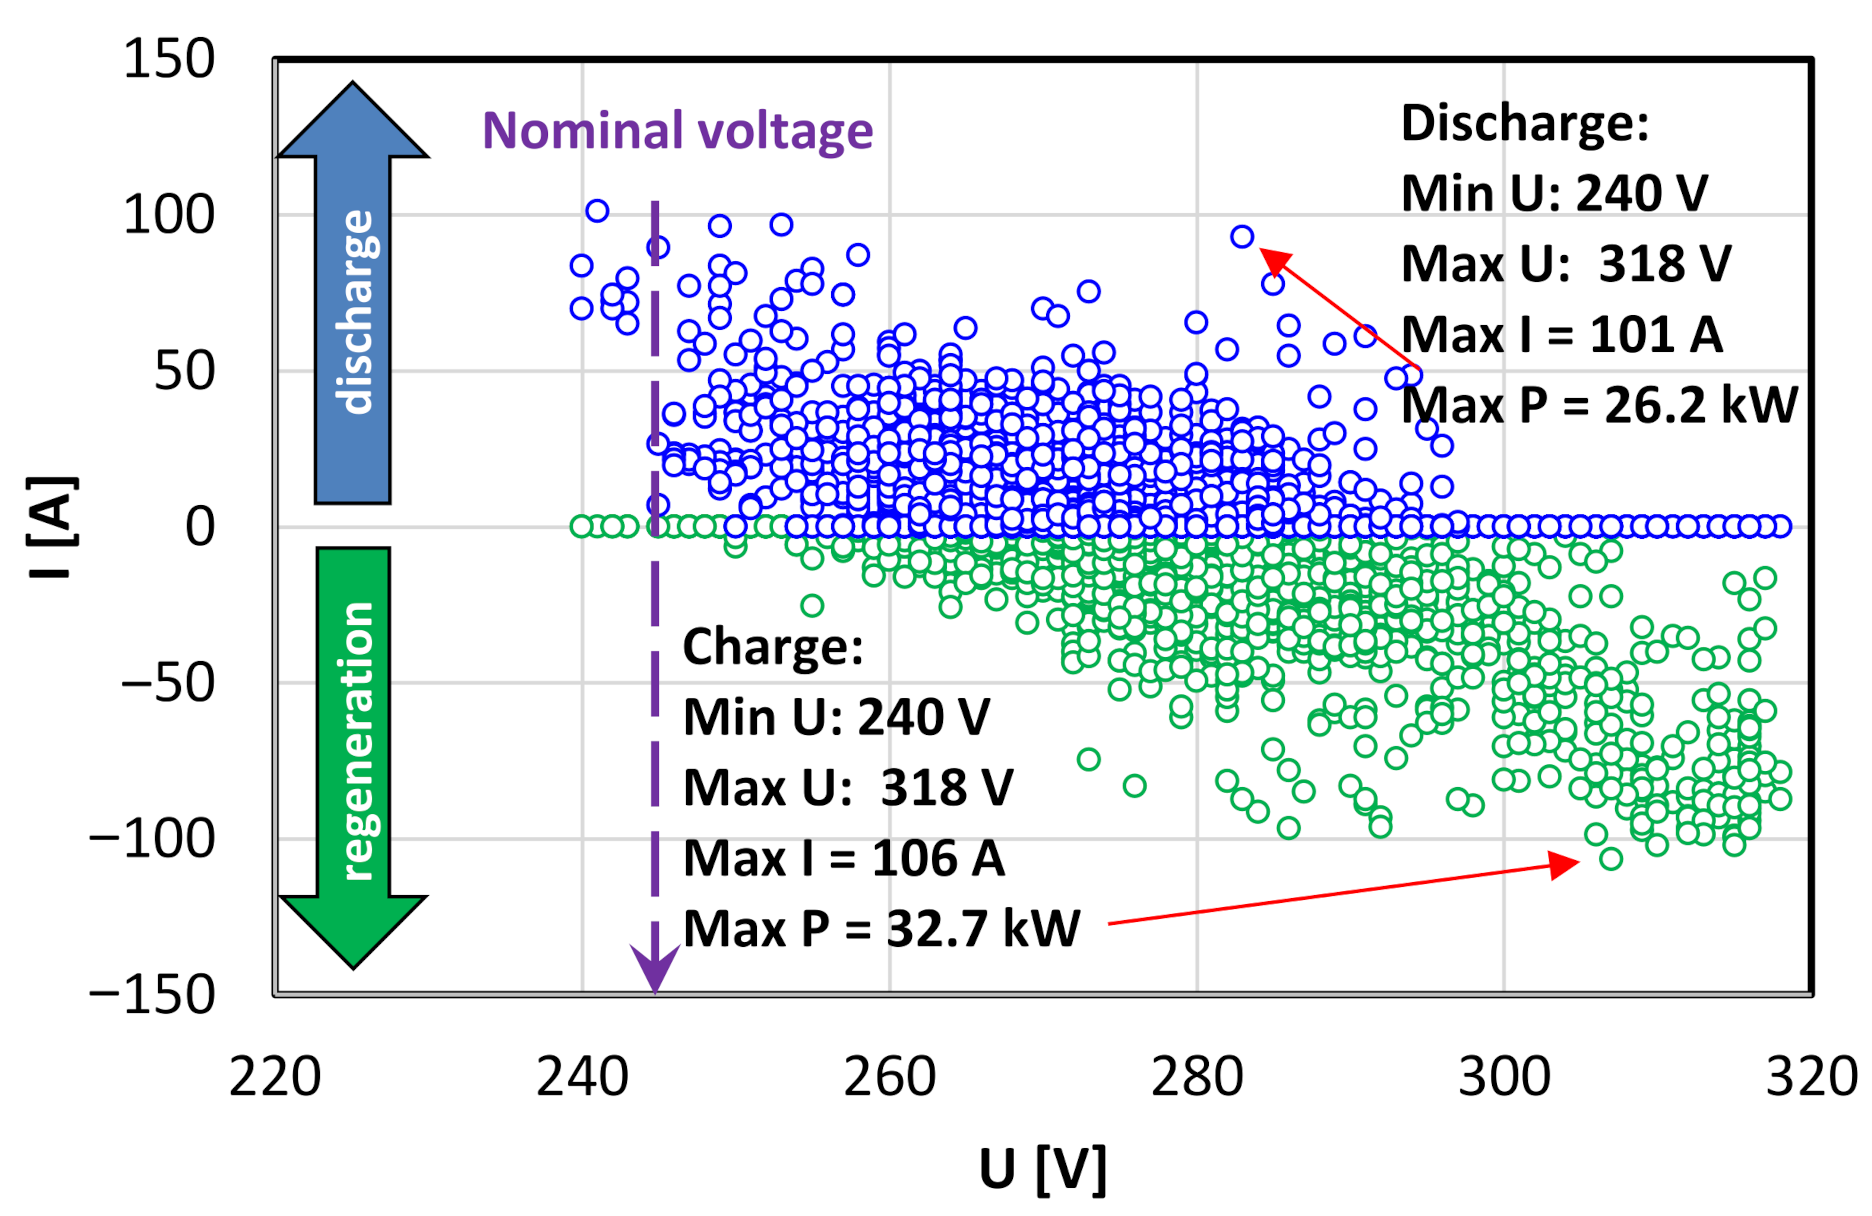
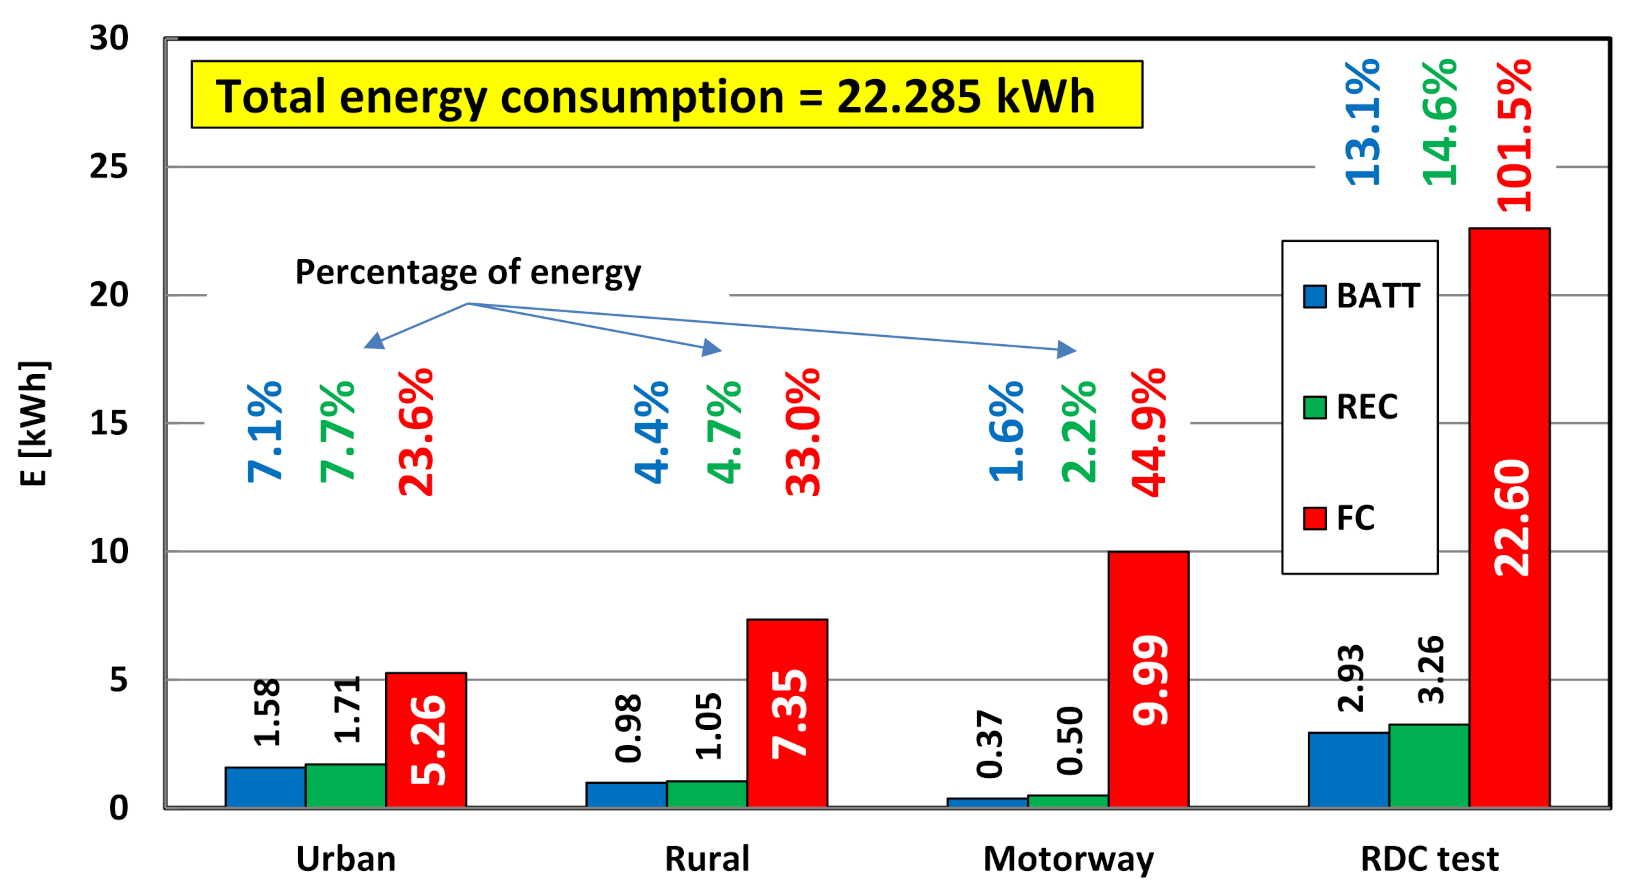
  • in most cases, the high voltage battery is charged only from energy regeneration during braking; however, there are also situations where the battery is charged from the energy generated by the fuel cell (in the test, the battery charge from the fuel cell reached 0.315 kWh—Figure 15);
  • as the vehicle speed increases (in other words as the RDC test interval changes), the battery energy consumption decreases and the fuel cell energy consumption increases (Figure 15);
  • the vehicle is initially started from standstill by using a high-voltage battery, only after a certain time, depending on the load, is the fuel cell activated (Figure 11).

Author Contributions

Conceptualization, I.P. and A.S.; methodology, A.S., I.P. and W.C.; validation, I.P., W.C. and A.S.; formal analysis, I.P., W.C. and A.S.; investigation, I.P.; resources, A.S.; data curation, I.P. and A.S.; writing—original draft preparation, I.P., W.C. and A.S.; visualization, I.P., W.C. and A.S.; supervision, I.P. and A.S.; project administration, I.P. and A.S. All authors have read and agreed to the published version of the manuscript.

Funding

This research received no external funding.

Institutional Review Board Statement

Not applicable.

Informed Consent Statement

Not applicable.

Data Availability Statement

The data presented in this study are available on request from the corresponding author.

Acknowledgments

The authors wish to thank Toyota Motor Poland for providing the vehicles for the road tests.

Conflicts of Interest

The authors declare no conflict of interest.

References

  1. Technology Roadmap. Hydrogen Fuel Cell. International Energy Agency. Paris, 2015. Available online: www.iea.org (accessed on 21 June 2021).
  2. Hydrogen Roadmap Europe: A Sustainable Pathway for the European Energy Transition, Fuel Cells and Hydrogen 2 Joint Undertaking; Publications Office of the European Union: Luxembourg, 2019. [CrossRef]
  3. Path to Hydrogen Competitiveness. A Cost Perspective. Hydrogen Council, 2020. Available online: www.hydrogencouncil.com (accessed on 21 June 2021).
  4. Hydrogen Scaling Up. A Sustainable Pathway for the Global Energy Transition. Hydrogen Council, November 2017. Available online: https://hydrogencouncil.com/wp-content/uploads/2017/11/Hydrogen-scaling-up-Hydrogen-Council.pdf (accessed on 4 August 2021).
  5. Australia’s National Hydrogen Strategy. COAG Energy Council Hydrogen Working Group. Available online: https://www.industry.gov.au/sites/default/files/2019-11/australias-national-hydrogen-strategy.pdf (accessed on 4 August 2021).
  6. Bieker, G. A Global Comparison of the Life-Cycle Greenhouse Gas Emissions of Combustion Engine and Electric Passenger Cars. International Council on Clean Transportation Europe. July 2021. Available online: https://theicct.org/sites/default/files/publications/Global-LCA-passenger-cars-jul2021_0.pdf (accessed on 1 August 2021).
  7. Amant, S.; Meunier, N.; de Cosse Brissac, C. Road Transportation: What Alternative Motorisations are Suitable for the Climate? A Comparison of the Life Cycle Emissions, in France and Europe. Available online: https://www.carbone4.com/wp-content/uploads/2021/02/Road-transportation-what-alternative-motorisations-are-suitable-for-the-climate-Carbone-4.pdf (accessed on 4 August 2021).
  8. Hydrogen Fuel News. Hydrogen News Daily–Alternative Energy Reports. Available online: https://www.hydrogenfuelnews.com/fuel-cell-passenger-vehicles/8546147 (accessed on 20 June 2021).
  9. Ludwig-Bölkow-Systemtechnik GmbH. Available online: www.lbst.de (accessed on 21 June 2021).
  10. Das, L.M. Hydrogen engines: A view of the past and a look into the future. Int. J. Hydrogen Energy 1990, 15, 425–443. [Google Scholar] [CrossRef]
  11. Yip, H.L.; Srna, A.; Yuen, A.C.Y.; Kook, S.; Taylor, R.A.; Yeoh, G.H.; Medwell, P.R.; Chan, Q.N. A review of hydrogen direct injection for internal combustion engines: Towards carbon-free combustion. Appl. Sci. 2019, 9, 4842. [Google Scholar] [CrossRef] [Green Version]
  12. Yu, X.; Li, D.; Yang, S.; Sun, P.; Guo, Z.; Yang, H.; Li, Y.; Wang, T. Effects of hydrogen direct injection on combustion and emission characteristics of a hydrogen/Acetone-Butanol-Ethanol dual-fuel spark ignition engine under lean-burn conditions. Int. J. Hydrogen Energy 2020, 45, 34193–34203. [Google Scholar] [CrossRef]
  13. Zareei, J.; Rohani, A.; Mazari, F.; Mikkhailova, M.V. Numerical investigation of the effect of two-step injection (direct and port injection) of hydrogen blending and natural gas on engine performance and exhaust gas emissions. Energy 2021, 231, 120957. [Google Scholar] [CrossRef]
  14. Younkins, M.; Boyer, B.; Wooldridge, M. Hydrogen DI dual zone combustion system. SAE Int. J. Engines 2013, 6, 45–53. [Google Scholar] [CrossRef]
  15. Smirnov, N.N.; Nikitin, V.F. Modeling and simulation of hydrogen combustion in engines. Int. J. Hydrogen Energy 2014, 39, 1122–1136. [Google Scholar] [CrossRef]
  16. Karthikeyan, S.; Periyasamy, M. Impact on the power and performance of an internal combustion engine using hydrogen. Mater. Today Proc. 2021, in press. [Google Scholar] [CrossRef]
  17. Babayev, R.; Andersson, A.; Dalmau, A.S.; Im, H.G.; Johansson, B. Computational characterization of hydrogen direct injection and nonpremixed combustion in a compression-ignition engine. Int. J. Hydrogen Energy 2021, 46, 18678–18696. [Google Scholar] [CrossRef]
  18. Zareei, J.; Haseeb, M.; Ghadamkheir, K.; Farkhondeh, S.A.; Yazdani, A.; Ershov, K. The effect of hydrogen addition to compressed natural gas on performance and emissions of a DI diesel engine by a numerical study. Int. J. Hydrogen Energy 2020, 45, 34241–34253. [Google Scholar] [CrossRef]
  19. Oni, B.A.; Sanni, S.E.; Ibegbu, A.J.; Aduojo, A.A. Experimental optimization of engine performance of a dual-fuel compression-ignition engine operating on hydrogen-compressed natural gas and Moringa biodiesel. Energy Rep. 2021, 7, 607–619. [Google Scholar] [CrossRef]
  20. Gong, C.; Li, Z.; Sun, J.; Liu, F. Evaluation on combustion and lean-burn limitof a medium compression ratio hydrogen/methanol dual-injection spark-ignition engine under methanol late-injection. Appl. Energy 2020, 277, 115622. [Google Scholar] [CrossRef]
  21. Wang, H.; Ji, C.; Shi, C.; Ge, Y.; Wang, S.; Yang, J. Development of cyclic variation prediction model of the gasoline and n-butanol rotary engines with hydrogen enrichment. Fuel 2021, 299, 120891. [Google Scholar] [CrossRef]
  22. Meng, H.; Ji, C.; Wang, S.; Wang, D.; Yang, J. Optimizing the idle performance of an n-butanol fueled Wankel rotary engine by hydrogen addition. Fuel 2021, 288, 119614. [Google Scholar] [CrossRef]
  23. Zhen, X.; Li, X.; Wang, Y.; Liu, D.; Tian, Z. Comparative study on combustion and emission characteristics of methanol/hydrogen, ethanol/hydrogen and methane/hydrogen blends in high compression ratio SI engine. Fuel 2020, 267, 117193. [Google Scholar] [CrossRef]
  24. Chubbock, S.; Clague, R. Comparative analysis of internal combustion engine and fuel cell range extender. SAE Int. J. Alt. Power 2016, 5, 175–182. [Google Scholar] [CrossRef]
  25. Konno, N.; Mizuno, S.; Nakaji, H.; Ishikawa, Y. Development of compact and high-performance fuel cell stack. SAE Int. J. Alt. Power 2015, 4, 123–129. [Google Scholar] [CrossRef]
  26. Toyota Motor Europe. Toyota Service and Repair Information. Available online: www.toyota-tech.eu (accessed on 24 June 2021).
  27. Yoshizumi, T.; Kubo, H.; Okumura, M. Development of high-performance FC stack for the new MIRAI. In SAE Technical; SAE International: Warrendale, PA, USA, 2021. [Google Scholar] [CrossRef]
  28. Kimura, K.; Kawasaki, T.; Ohmura, T.; Atsumi, Y.; Shimizu, K. Development of new fuel cell vehicle Clarity Fuel Cell. Honda RD Tech. Rev. 2016, 28, 1–7. [Google Scholar]
  29. Matsunaga, M.; Fukushima, T.; Ojima, K. Powertrain system of Honda FCX Clarity fuel cell vehicle. World Electr. Veh. J. 2009, 3, 820–829. [Google Scholar] [CrossRef] [Green Version]
  30. Tazelaar, E.; Bruinsma, J.; Veenhuizen, B.; Van den Bosch, P. Driving cycle characterization and generation, for design and control of fuel cell buses. World Electr. Veh. J. 2009, 3, 812–819. [Google Scholar] [CrossRef] [Green Version]
  31. Lohse-Busch, H.; Stutenberg, K.; Duoba, M.; Iliev, S. Technology Assessment of a Fuel Cell Vehicle: 2017 Toyota Mirai, ANL/ESD-18/12, Argonne National Laboratory. 2018. Available online: https://www.anl.gov/argonne-scientific-publications/pub/144774 (accessed on 20 June 2021).
  32. Outline of the Mirai. Key Specifications, Mirai–Toyota Europe. Available online: www.toyota-europe.com (accessed on 21 June 2021).
  33. Yumiya, H.; Kizaki, M.; Asai, H. Toyota Fuel Cell System (TFCS). World Electr. Veh. J. 2015, 7, 85–92. [Google Scholar] [CrossRef] [Green Version]
  34. Hasegawa, T.; Imanishi, H.; Nada, M.; Ikogi, Y. Development of the fuel cell system in the Mirai FCV. In SAE Technical; SAE International: Warrendale, PA, USA, 2016. [Google Scholar] [CrossRef]
  35. Pielecha, I.; Cieślik, W.; Szałek, A. Energy recovery potential through regenerative braking for a hybrid electric vehicle in a urban conditions. IOP Conf. Ser. Earth Env. 2019, 214, 012013. [Google Scholar] [CrossRef]
  36. Pielecha, I.; Cieślik, W.; Szałek, A. The use of electric drive in urban driving conditions using a hydrogen powered vehicle–Toyota Mirai. Comb. Eng. 2018, 172, 51–58. [Google Scholar] [CrossRef]
  37. The European Parliament and the Council of the European Union. Regulation (EU) 2019/631 of the European Parliament and of the Council of 17 April 2019 setting CO2 emission performance standards for new passenger vehicles and for new light commercial vehicles, and repealing Regulations (EC) No 443/2009 and (EU) No 510. Off. J. Eur. Union 2019, 111, 13–534. [Google Scholar]
  38. Gis, W.; Gis, M.; Pielecha, J.; Skobiej, K. Alternative exhaust emission factors from vehicles in on-road driving tests. Energies 2021, 14, 3487. [Google Scholar] [CrossRef]
  39. Szałek, A.; Pielecha, I. The Influence of engine downsizing in hybrid powertrains on the energy flow indicators under actual traffic conditions. Energies 2021, 14, 2872. [Google Scholar] [CrossRef]
  40. Cieslik, W.; Szwajca, F.; Golimowski, W.; Berger, A. Experimental analysis of residential photovoltaic (PV) and electric vehicle (EV) systems in terms of annual energy utilization. Energies 2021, 14, 1085. [Google Scholar] [CrossRef]
Figure 1. Comparison of range and payload for hydrogen and battery technology in means of transportation [2].
Energies 14 05018 g001
Figure 2. Comparison of refueling performance and investment rates for traditional and near-future fuels [2].
Energies 14 05018 g002
Figure 3. Toyota Mirai hydrogen system component layout (based on [33]).
Energies 14 05018 g003
Figure 4. Course of the RDC test with characteristics phases (S = 102.8 km, t = 114.5 min).
Energies 14 05018 g004
Figure 5. Changes in battery SOC: (a) with averaged values for travel phases; (b) in relation to travel speed.
Energies 14 05018 g005
Figure 6. Powertrain usage conditions: (a) battery, (b) fuel cell; with a specific subdivision of the test phases.
Energies 14 05018 g006
Figure 7. Average and maximum changes in battery (discharge and regeneration) and fuel cell contributions during each phase of the RDC test.
Energies 14 05018 g007
Figure 8. Energy consumption conditions in the RDC test phases (ECU—energy consumption in urban phase, ECR—energy consumption in rural phase, ECM—energy consumption in motorway phase).
Energies 14 05018 g008
Figure 9. Shares of battery energy use during discharge and charge in relation to driving speed.
Energies 14 05018 g009
Figure 10. Interaction of powertrain components during driving of Toyota Mirai (selected events on road).
Energies 14 05018 g010
Figure 11. Analysis of a selected single acceleration process of a FC vehicle.
Energies 14 05018 g011
Figure 12. Characteristics of an electric motor in relation to its operating voltage.
Energies 14 05018 g012
Figure 13. Characteristics of a high voltage battery.
Energies 14 05018 g013
Figure 14. Current–voltage characteristics of a fuel cell and its voltage converter.
Energies 14 05018 g014
Figure 15. Energy consumption conditions for the RDC test phases and the entire RDC test.
Energies 14 05018 g015
Table 1. Toyota Mirai powertrain system [31,32].
ComponentParameterValue
Vehicleweight1850 kg
top speed179 km/h
acceleration 0 to 60 mph9.6 s
range (homologation cycle)approx. 483 km
Fuel celltypePEM (polymer electrolyte)
power114 kW
power density2.0 kW/kg; 3.1 kW/dm3
number of cells370
humidificiation methodinternal circulation system
Electric motortypepermanent magnet synchronous
peak power123 kW at 4500 rpm
maximum torque335 N·m
total speed reduction ratio3.542
BatterytypeNickel Metal Hydride (NiMH)
capacity6.5 Ah
nominal voltage244.8 V (7.2 × 34)
hydrogen storageinternal volume122.4 dm3
nominal/filling pressure70 MPa/87.5 MPa
massapprox. 5.0 kg
refueling time3 min.
Table 2. Parameters of hydrogen tanks used in Toyota Mirai [34].
ComponentParameterValue
Compressed hydrogen tanksNumber of tanks2
storage density5.7 wt%
Front tankCapacity/weight60 dm3/42.8 kg
Rear tankCapacity/weight62.4 dm3/44.7 kg
Publisher’s Note: MDPI stays neutral with regard to jurisdictional claims in published maps and institutional affiliations.

