
Experimental Analysis of Residential Photovoltaic (PV) and Electric Vehicle (EV) Systems in Terms of Annual Energy Utilization


Abstract

1. Introduction
- How much energy does a city electric vehicle consume during its intended operation?
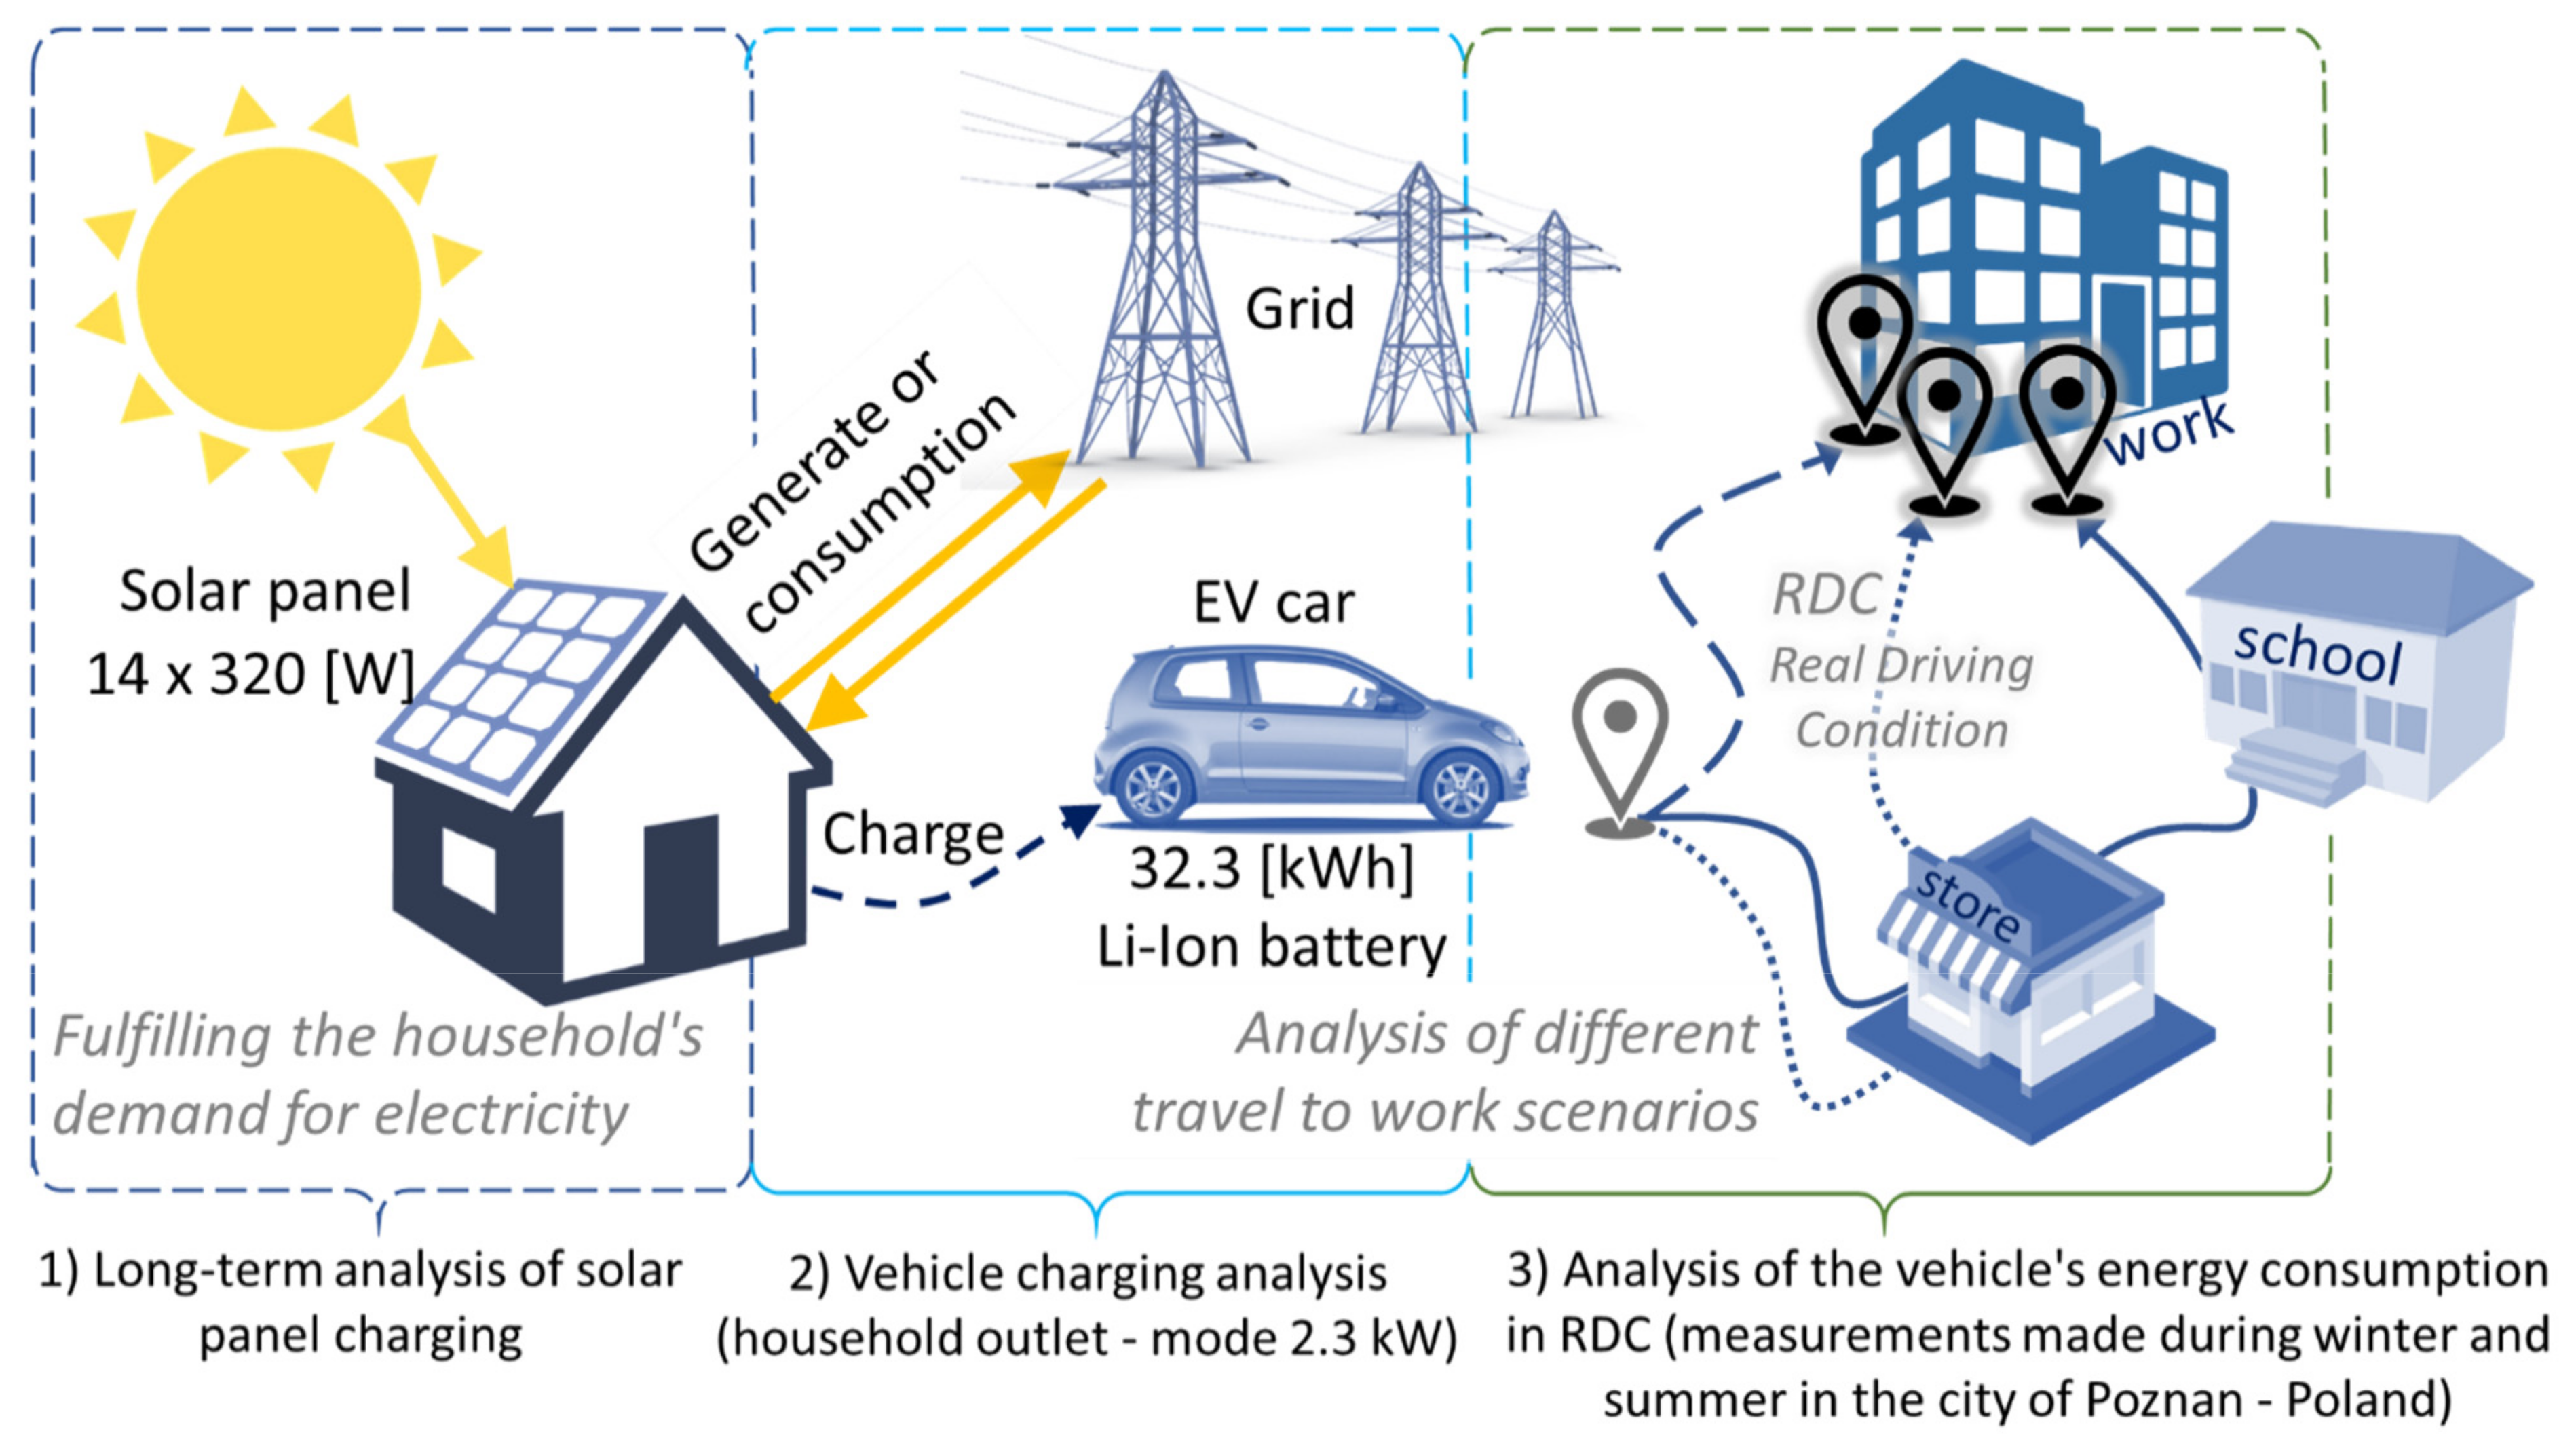
- Is the 4.48 kW photovoltaic installation capable of satisfying the energy demand in the assumed scenarios of driving an electric vehicle?
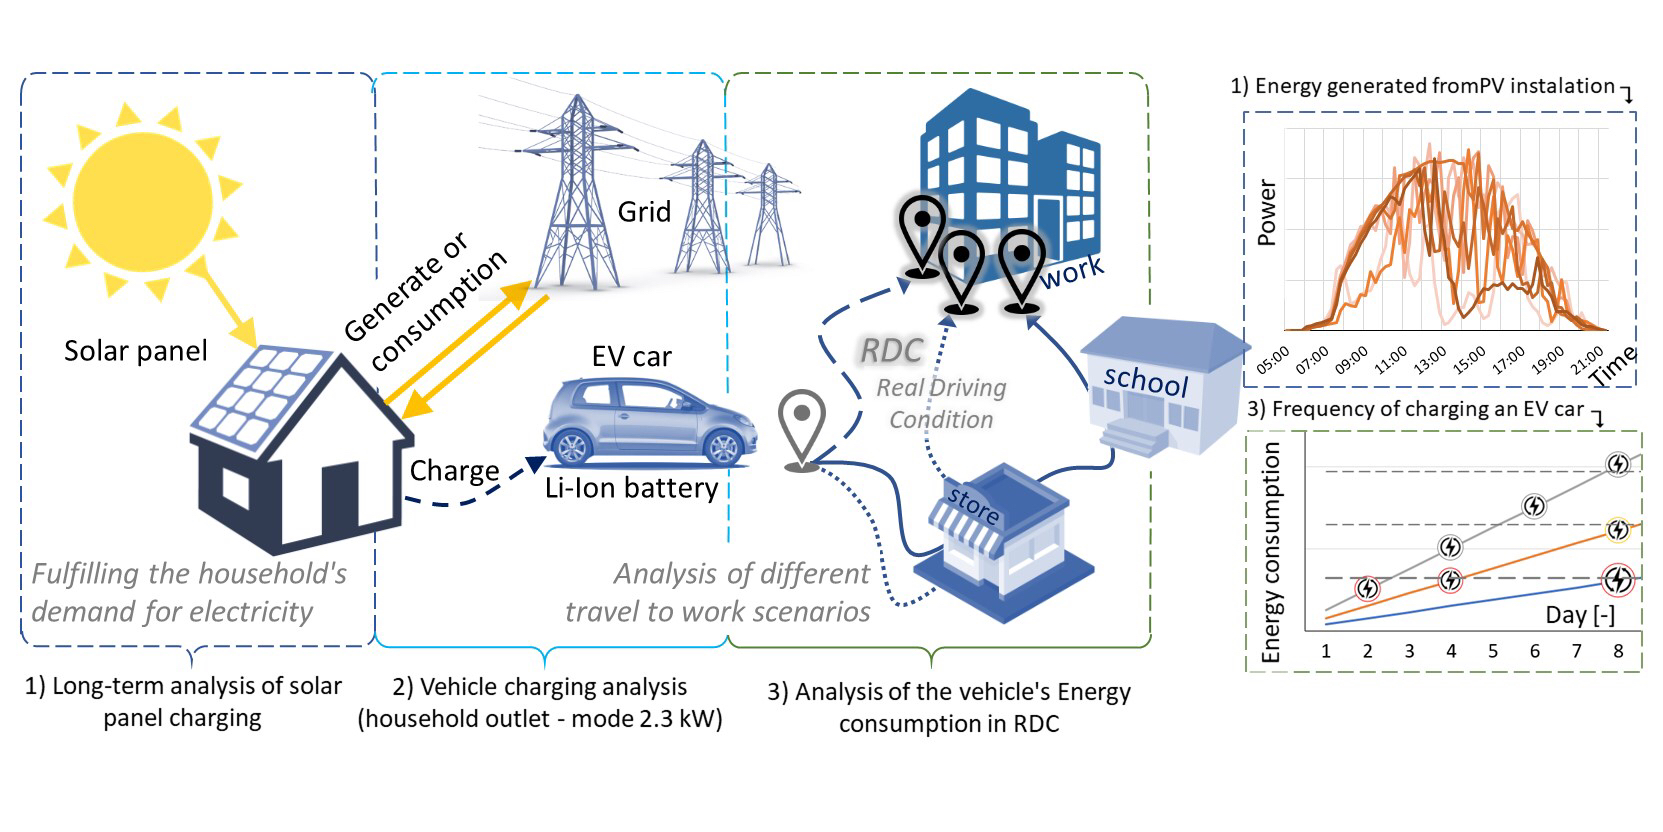
2. Methods of Analysis
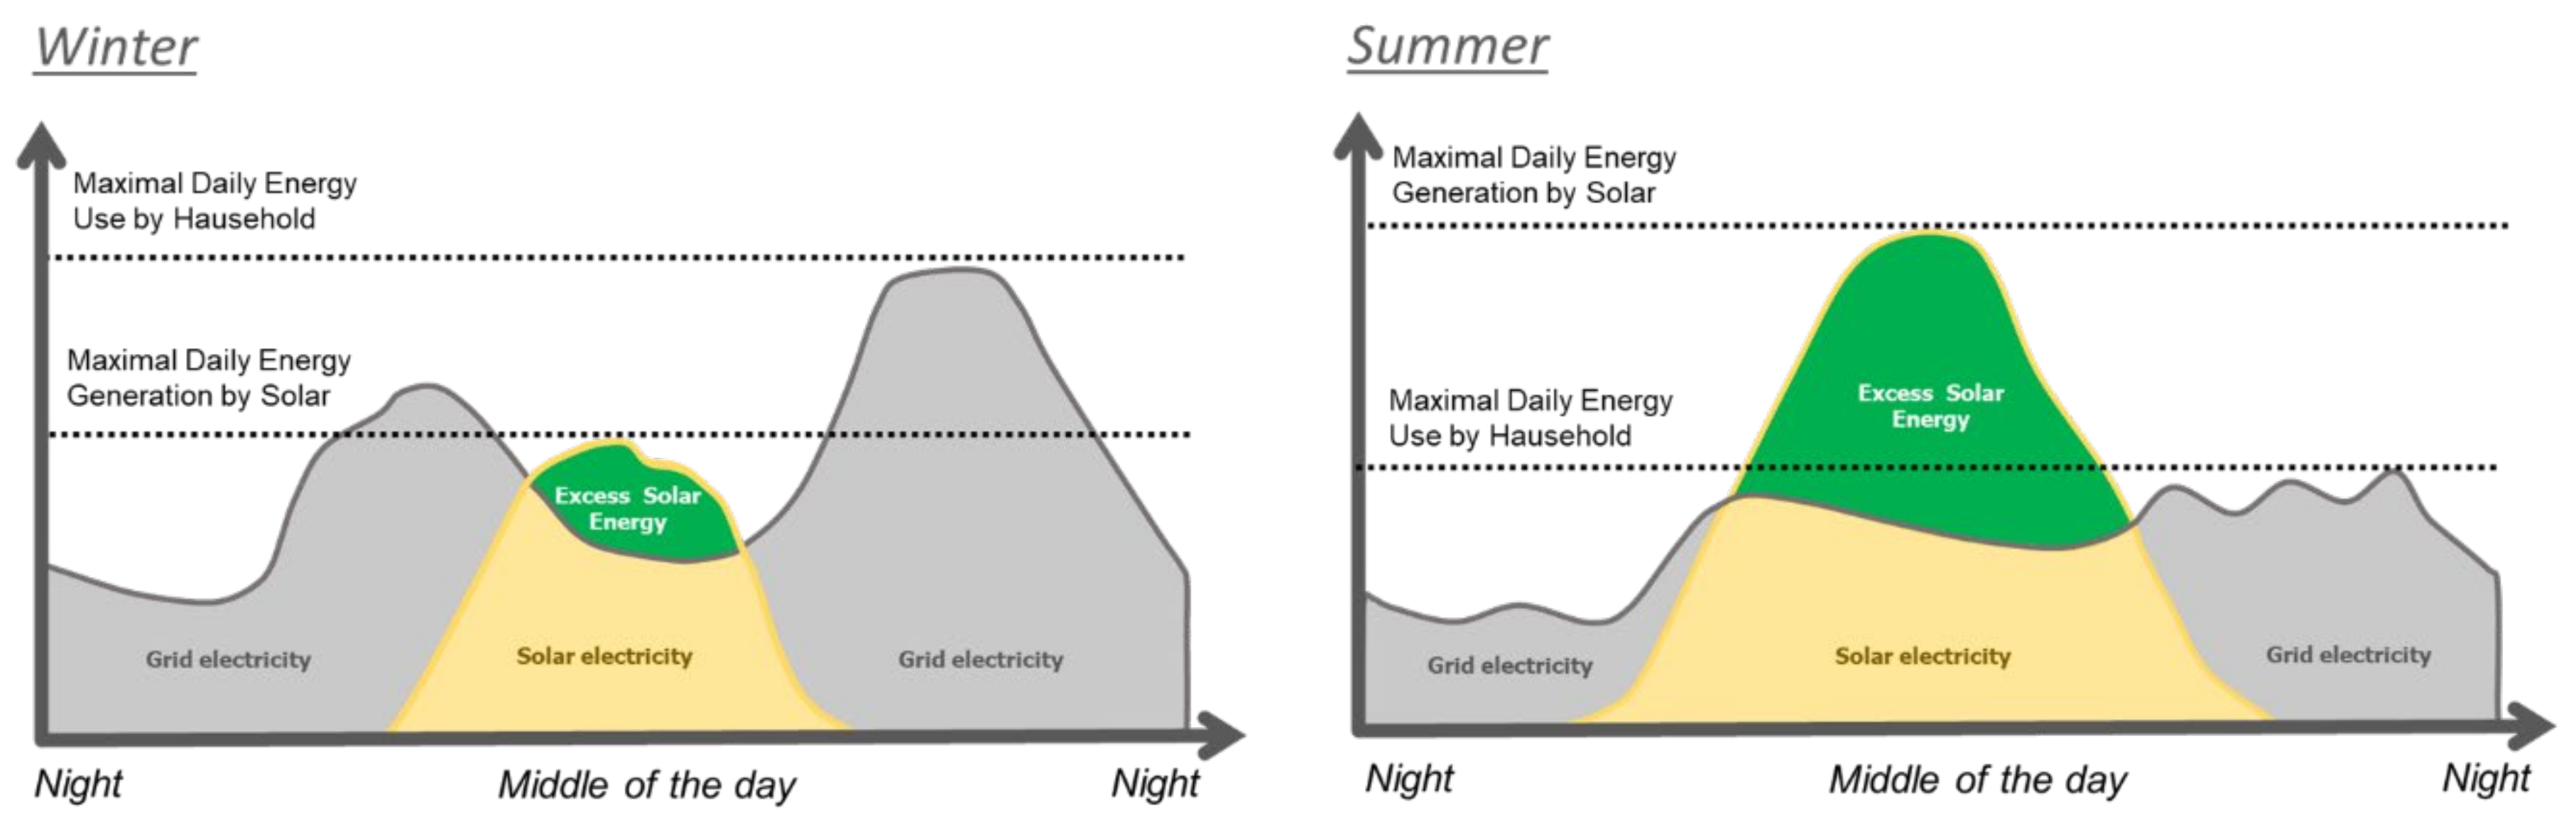
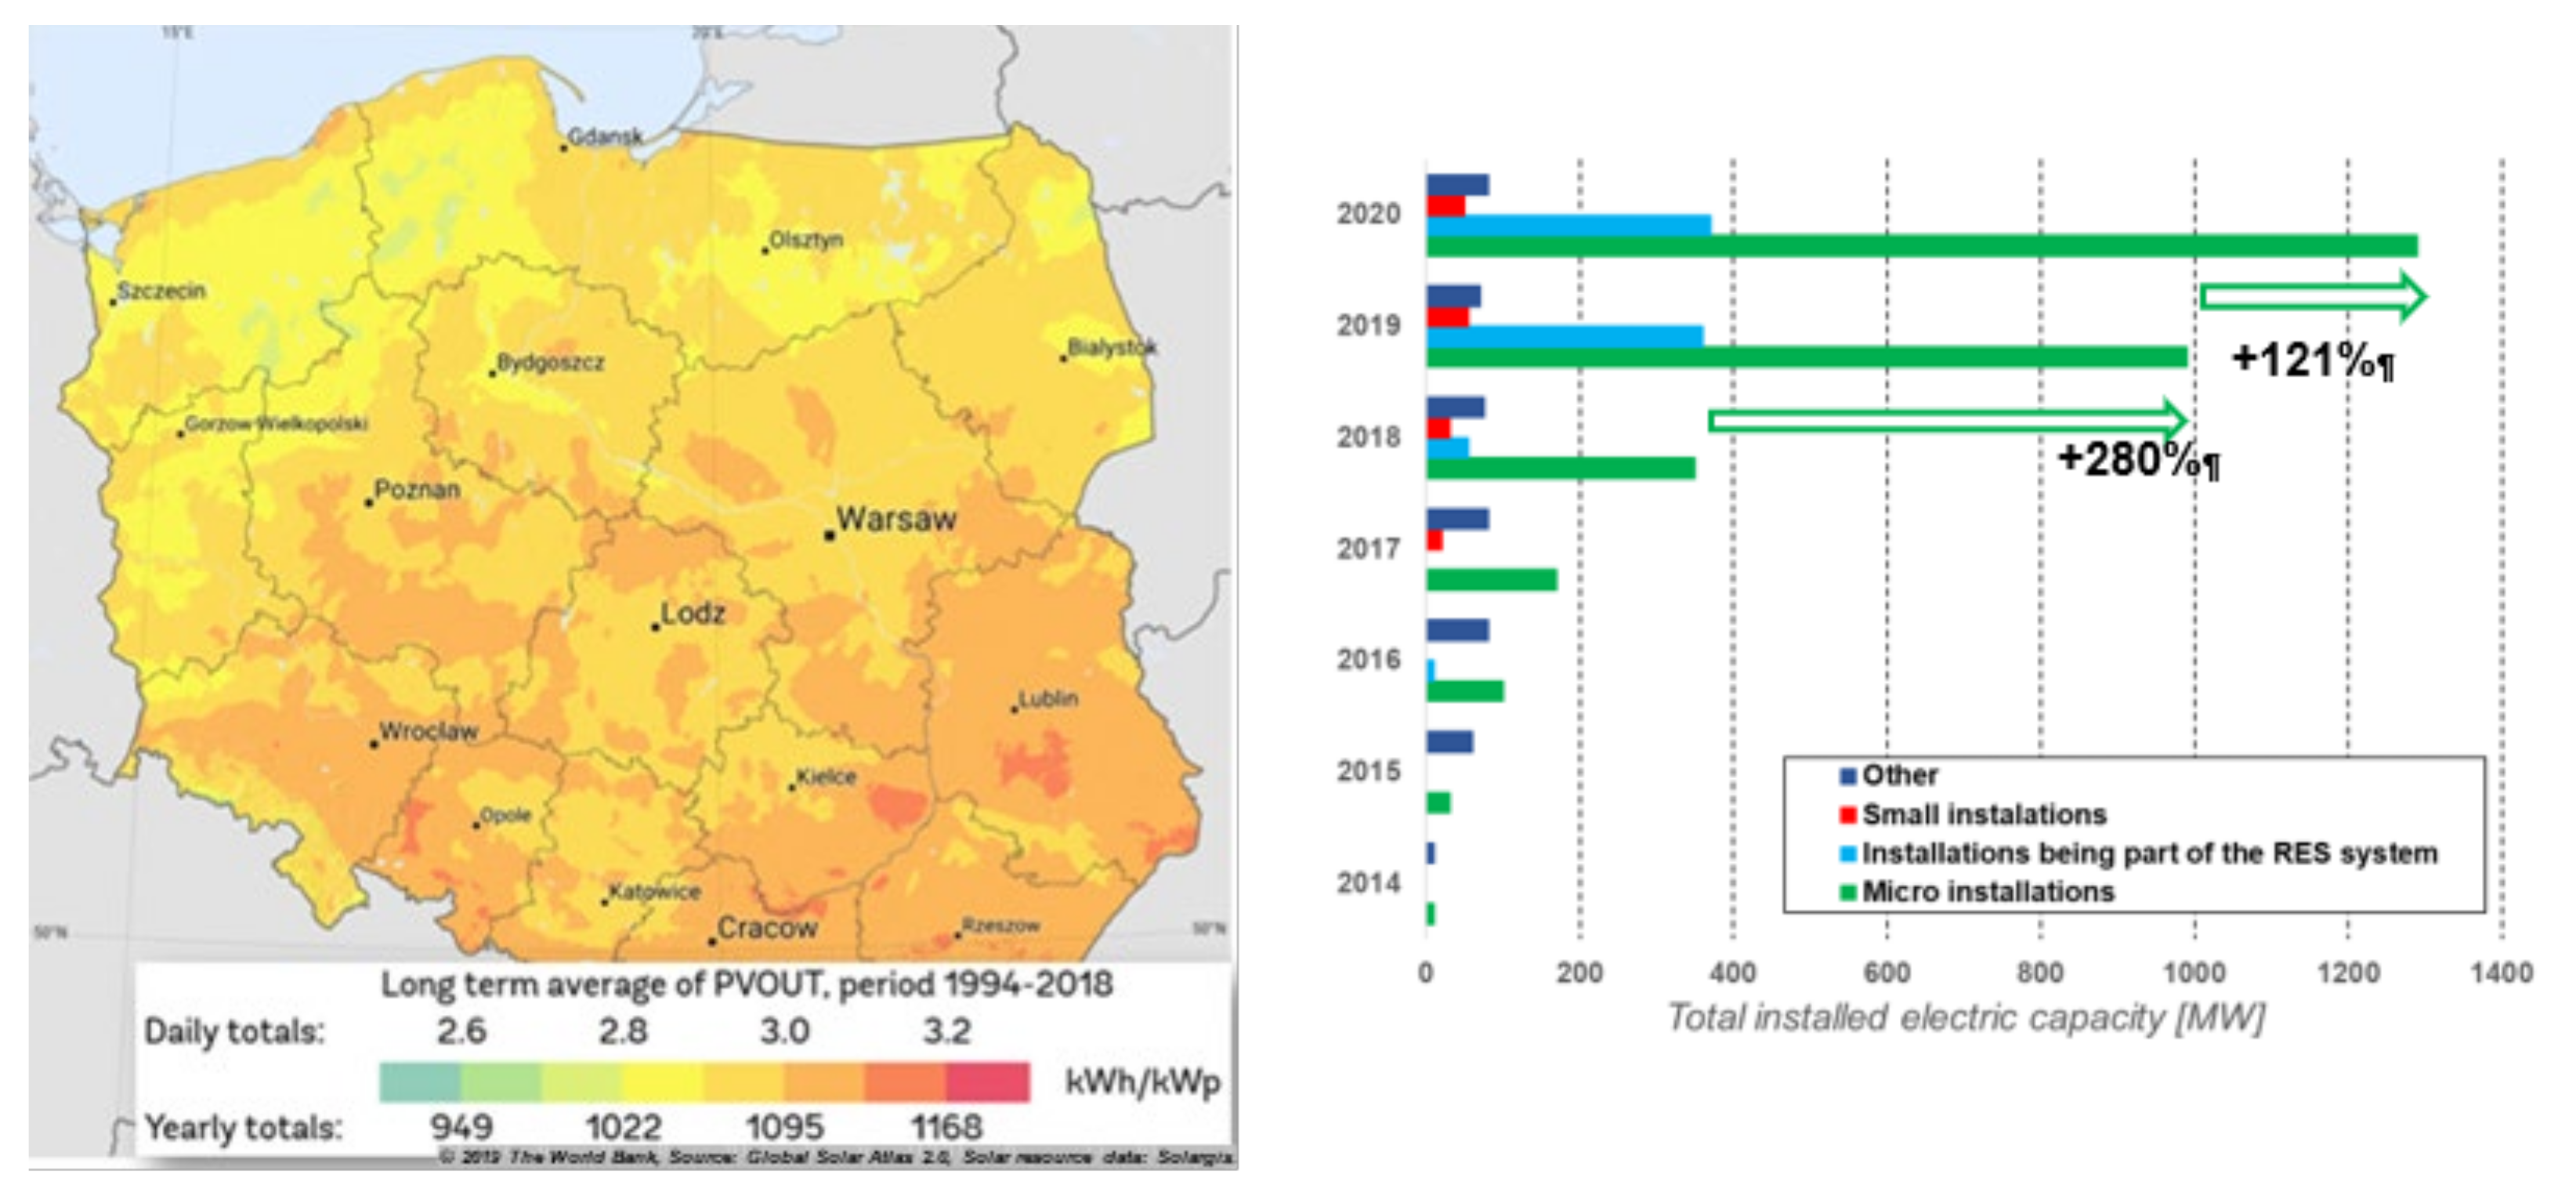
2.1. Long-term Analysis of Solar Panel Household Power Generation
2.2. Electrical Vehicle Charging Modes
- 2.3 kW (AC) Type 2 from the household grid with dedicated converter supplied by the manufacturer,
- 7.2 kW (AC) Type 2 from the wall outlet or a public charging station,
- 40.0 kW (AC/DC) combined charging system (CCS) from the rapid charging station.
2.3. Vehicle Energy Consumption in RDC Test
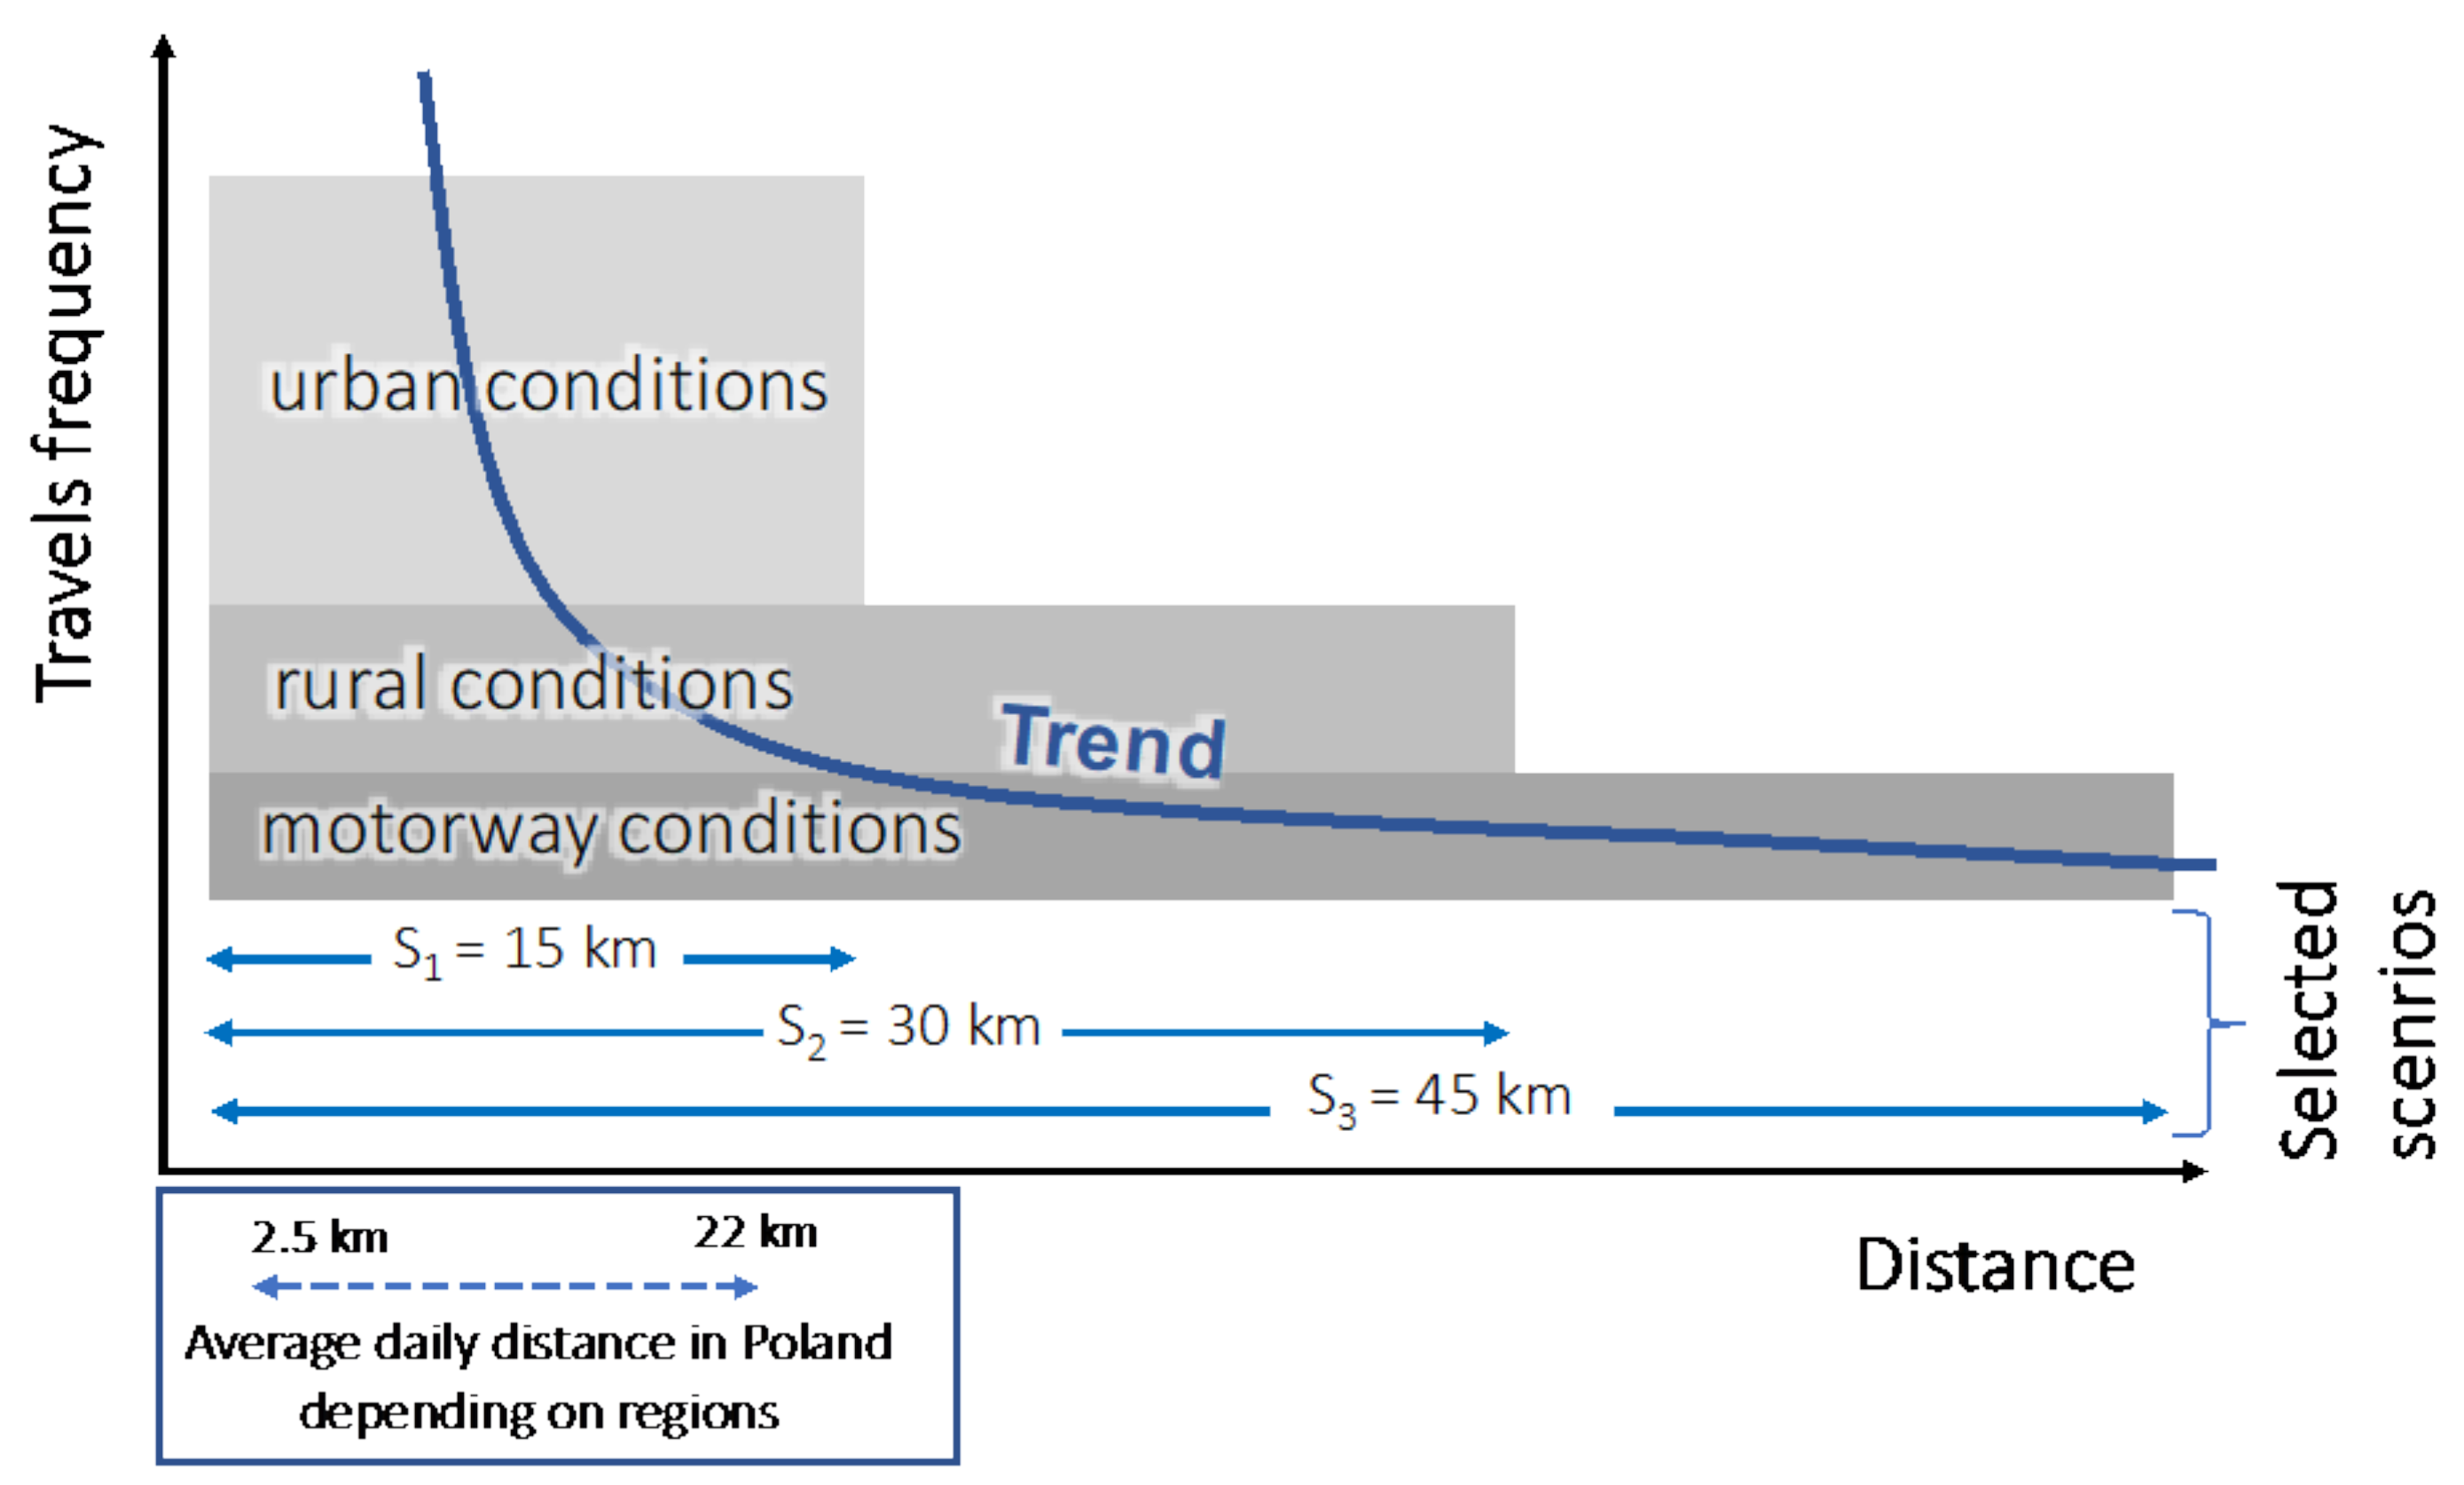
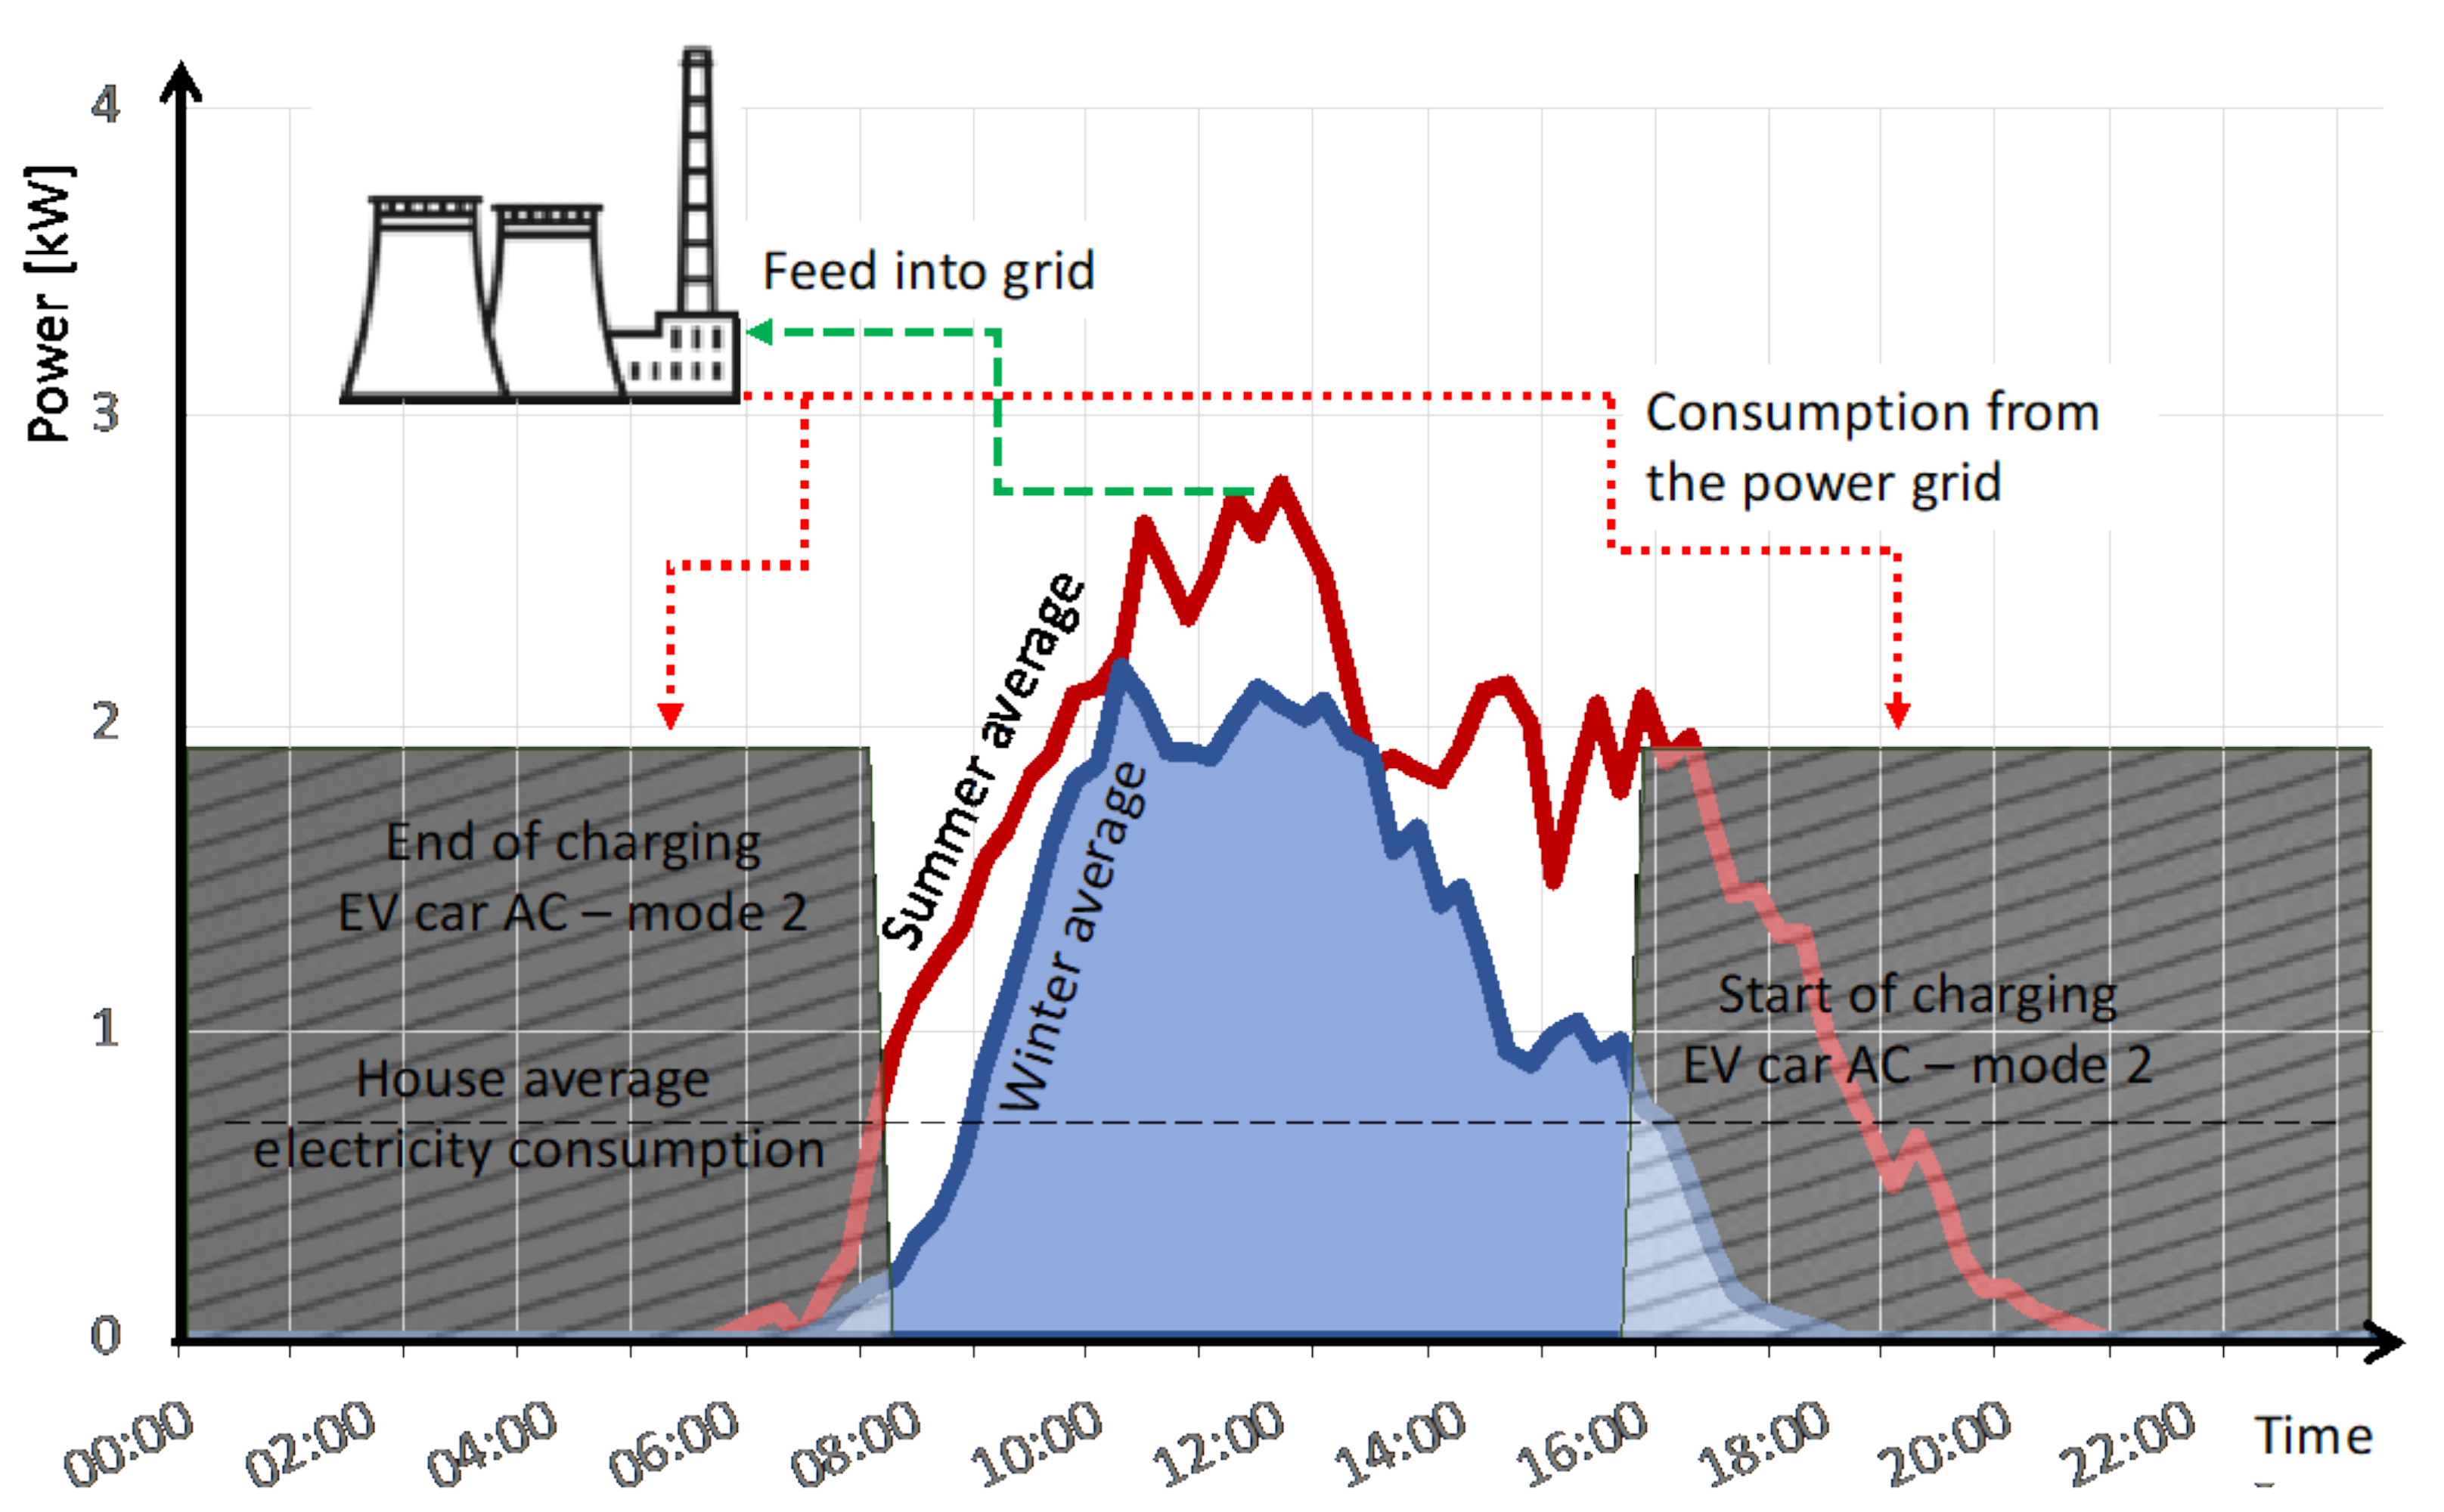
2.4. Energy Supply and Demand for Selected Driving Scenarios
3. Results
3.1. Long Term Analysis of PV Energy Production
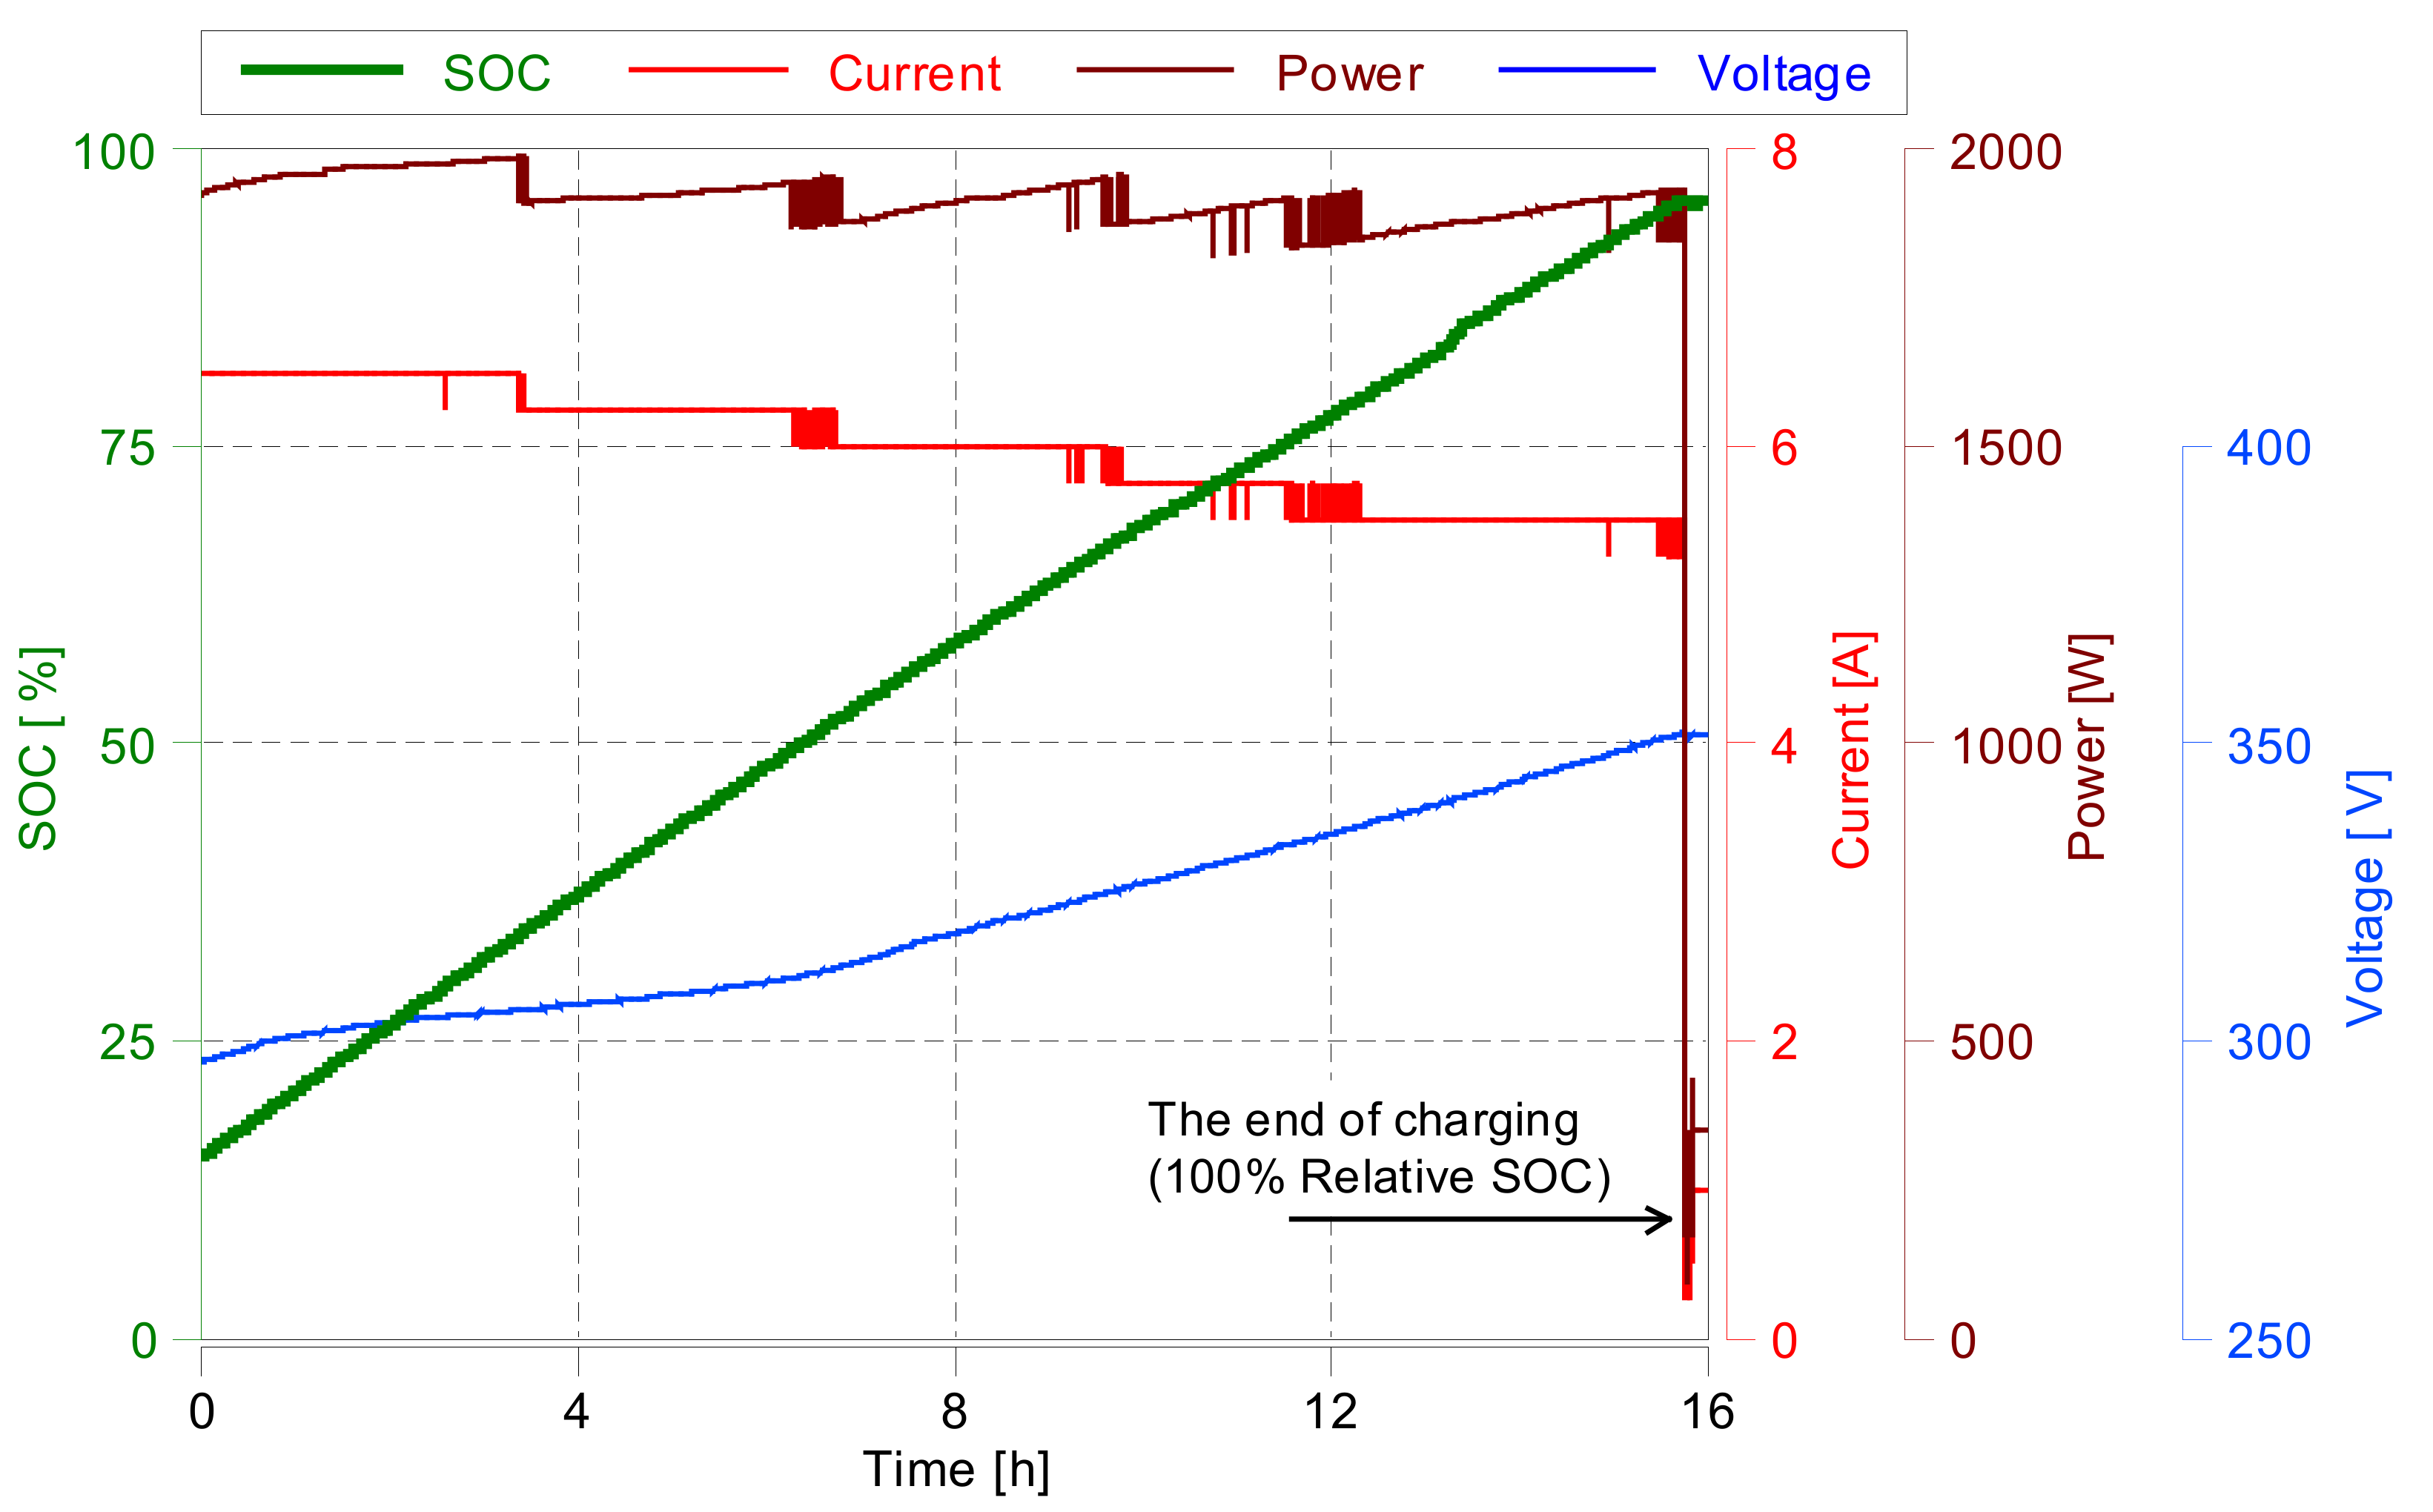
3.2. Vehicle Charging Analysis
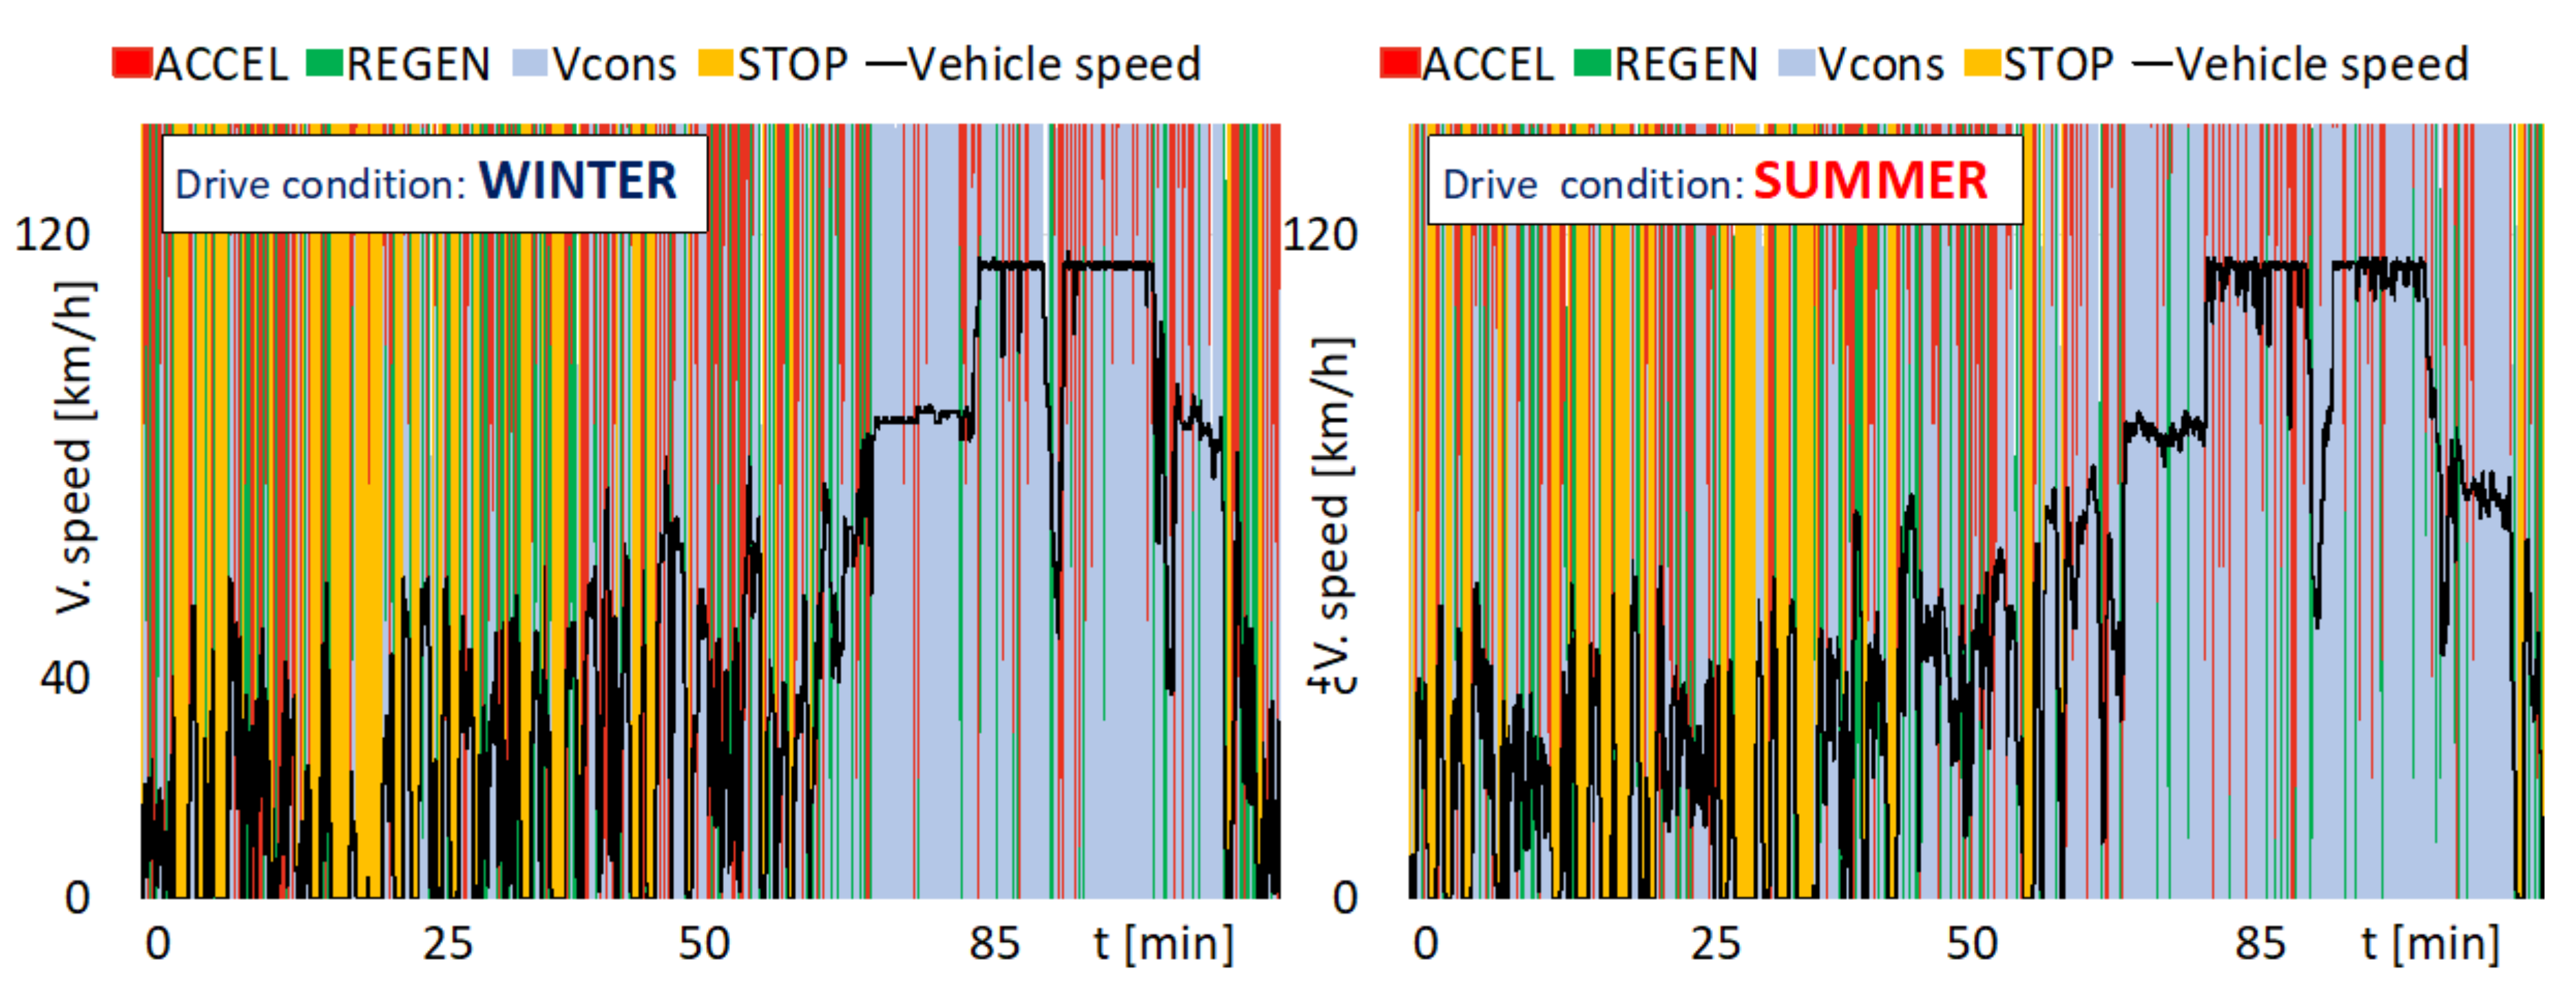
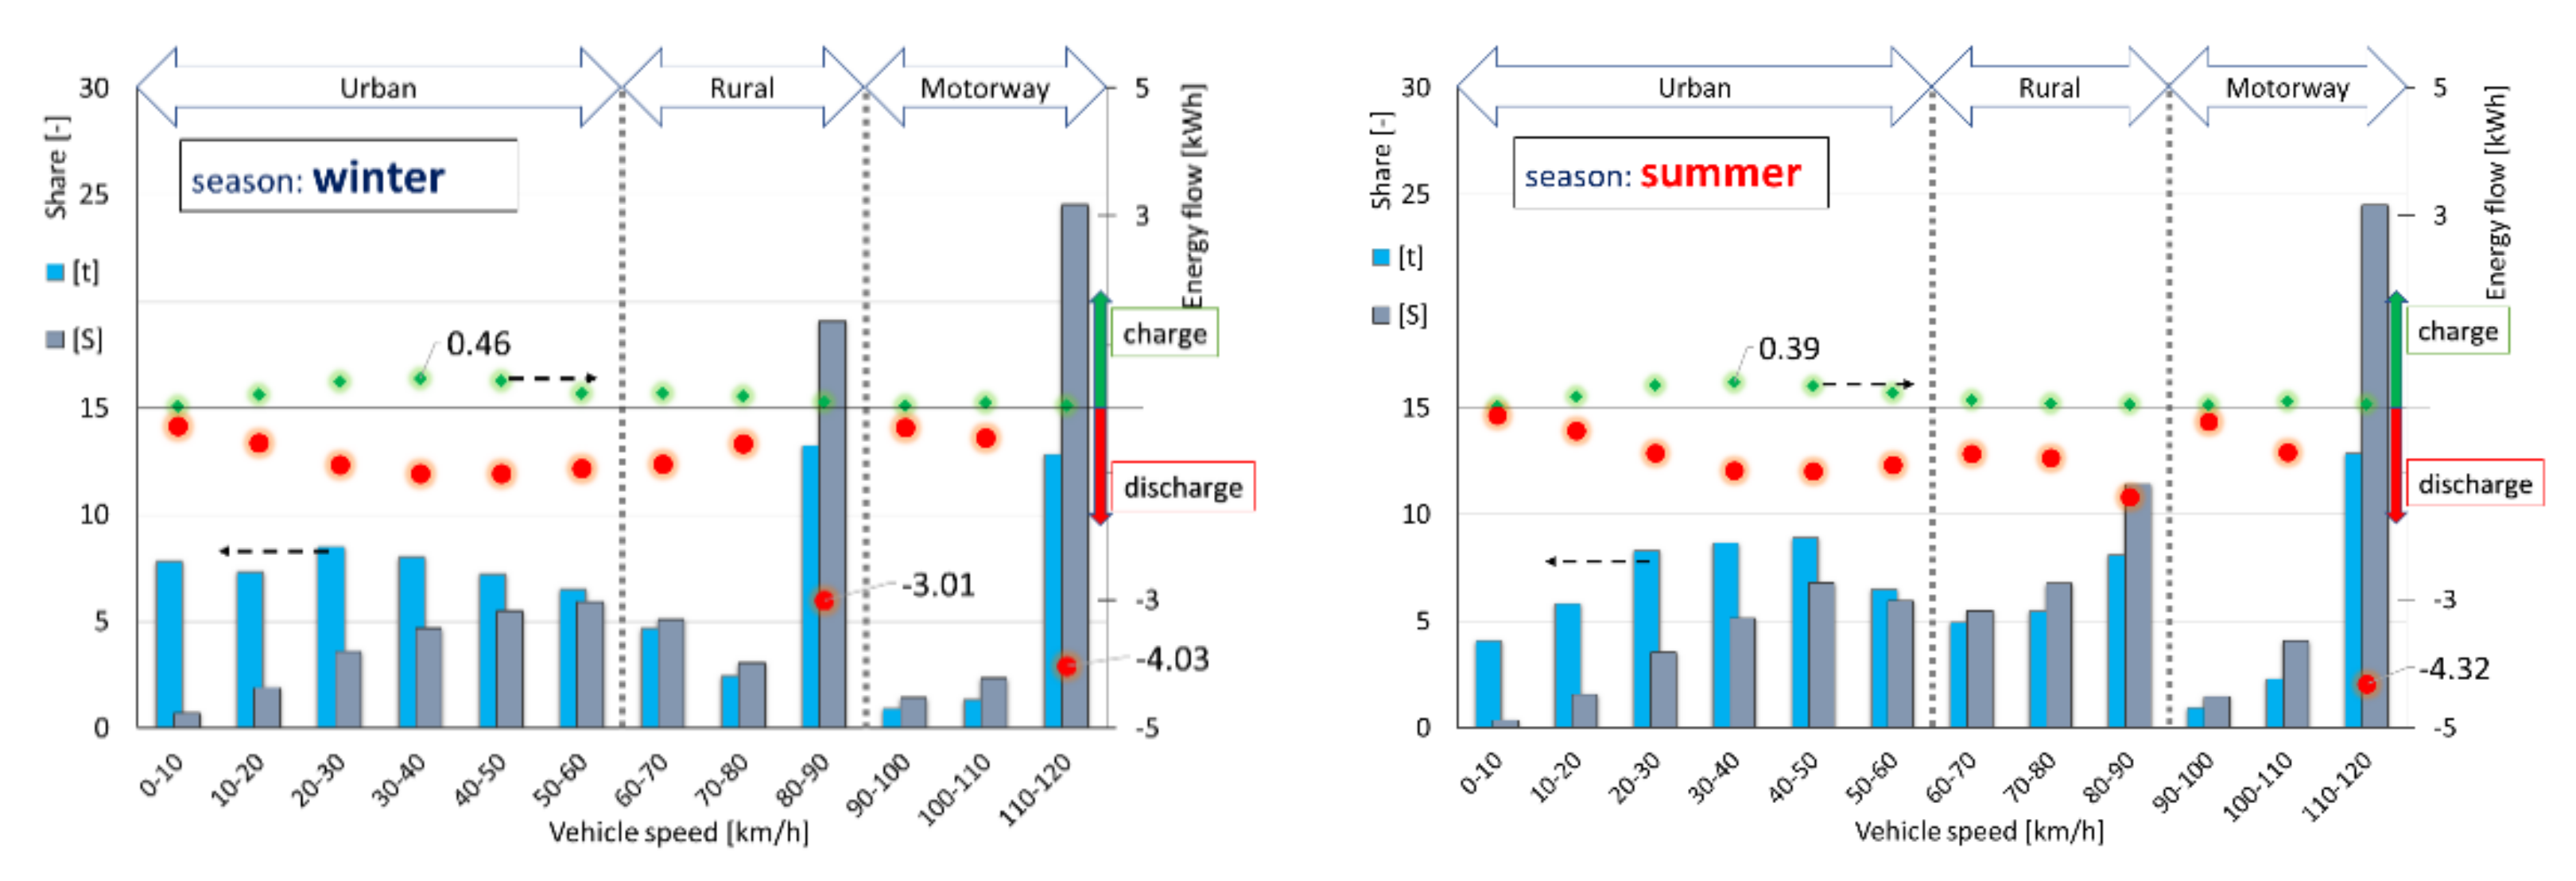
3.3. The Impact of Atmospheric Conditions on the Energy Consumption of an Electric Vehicle
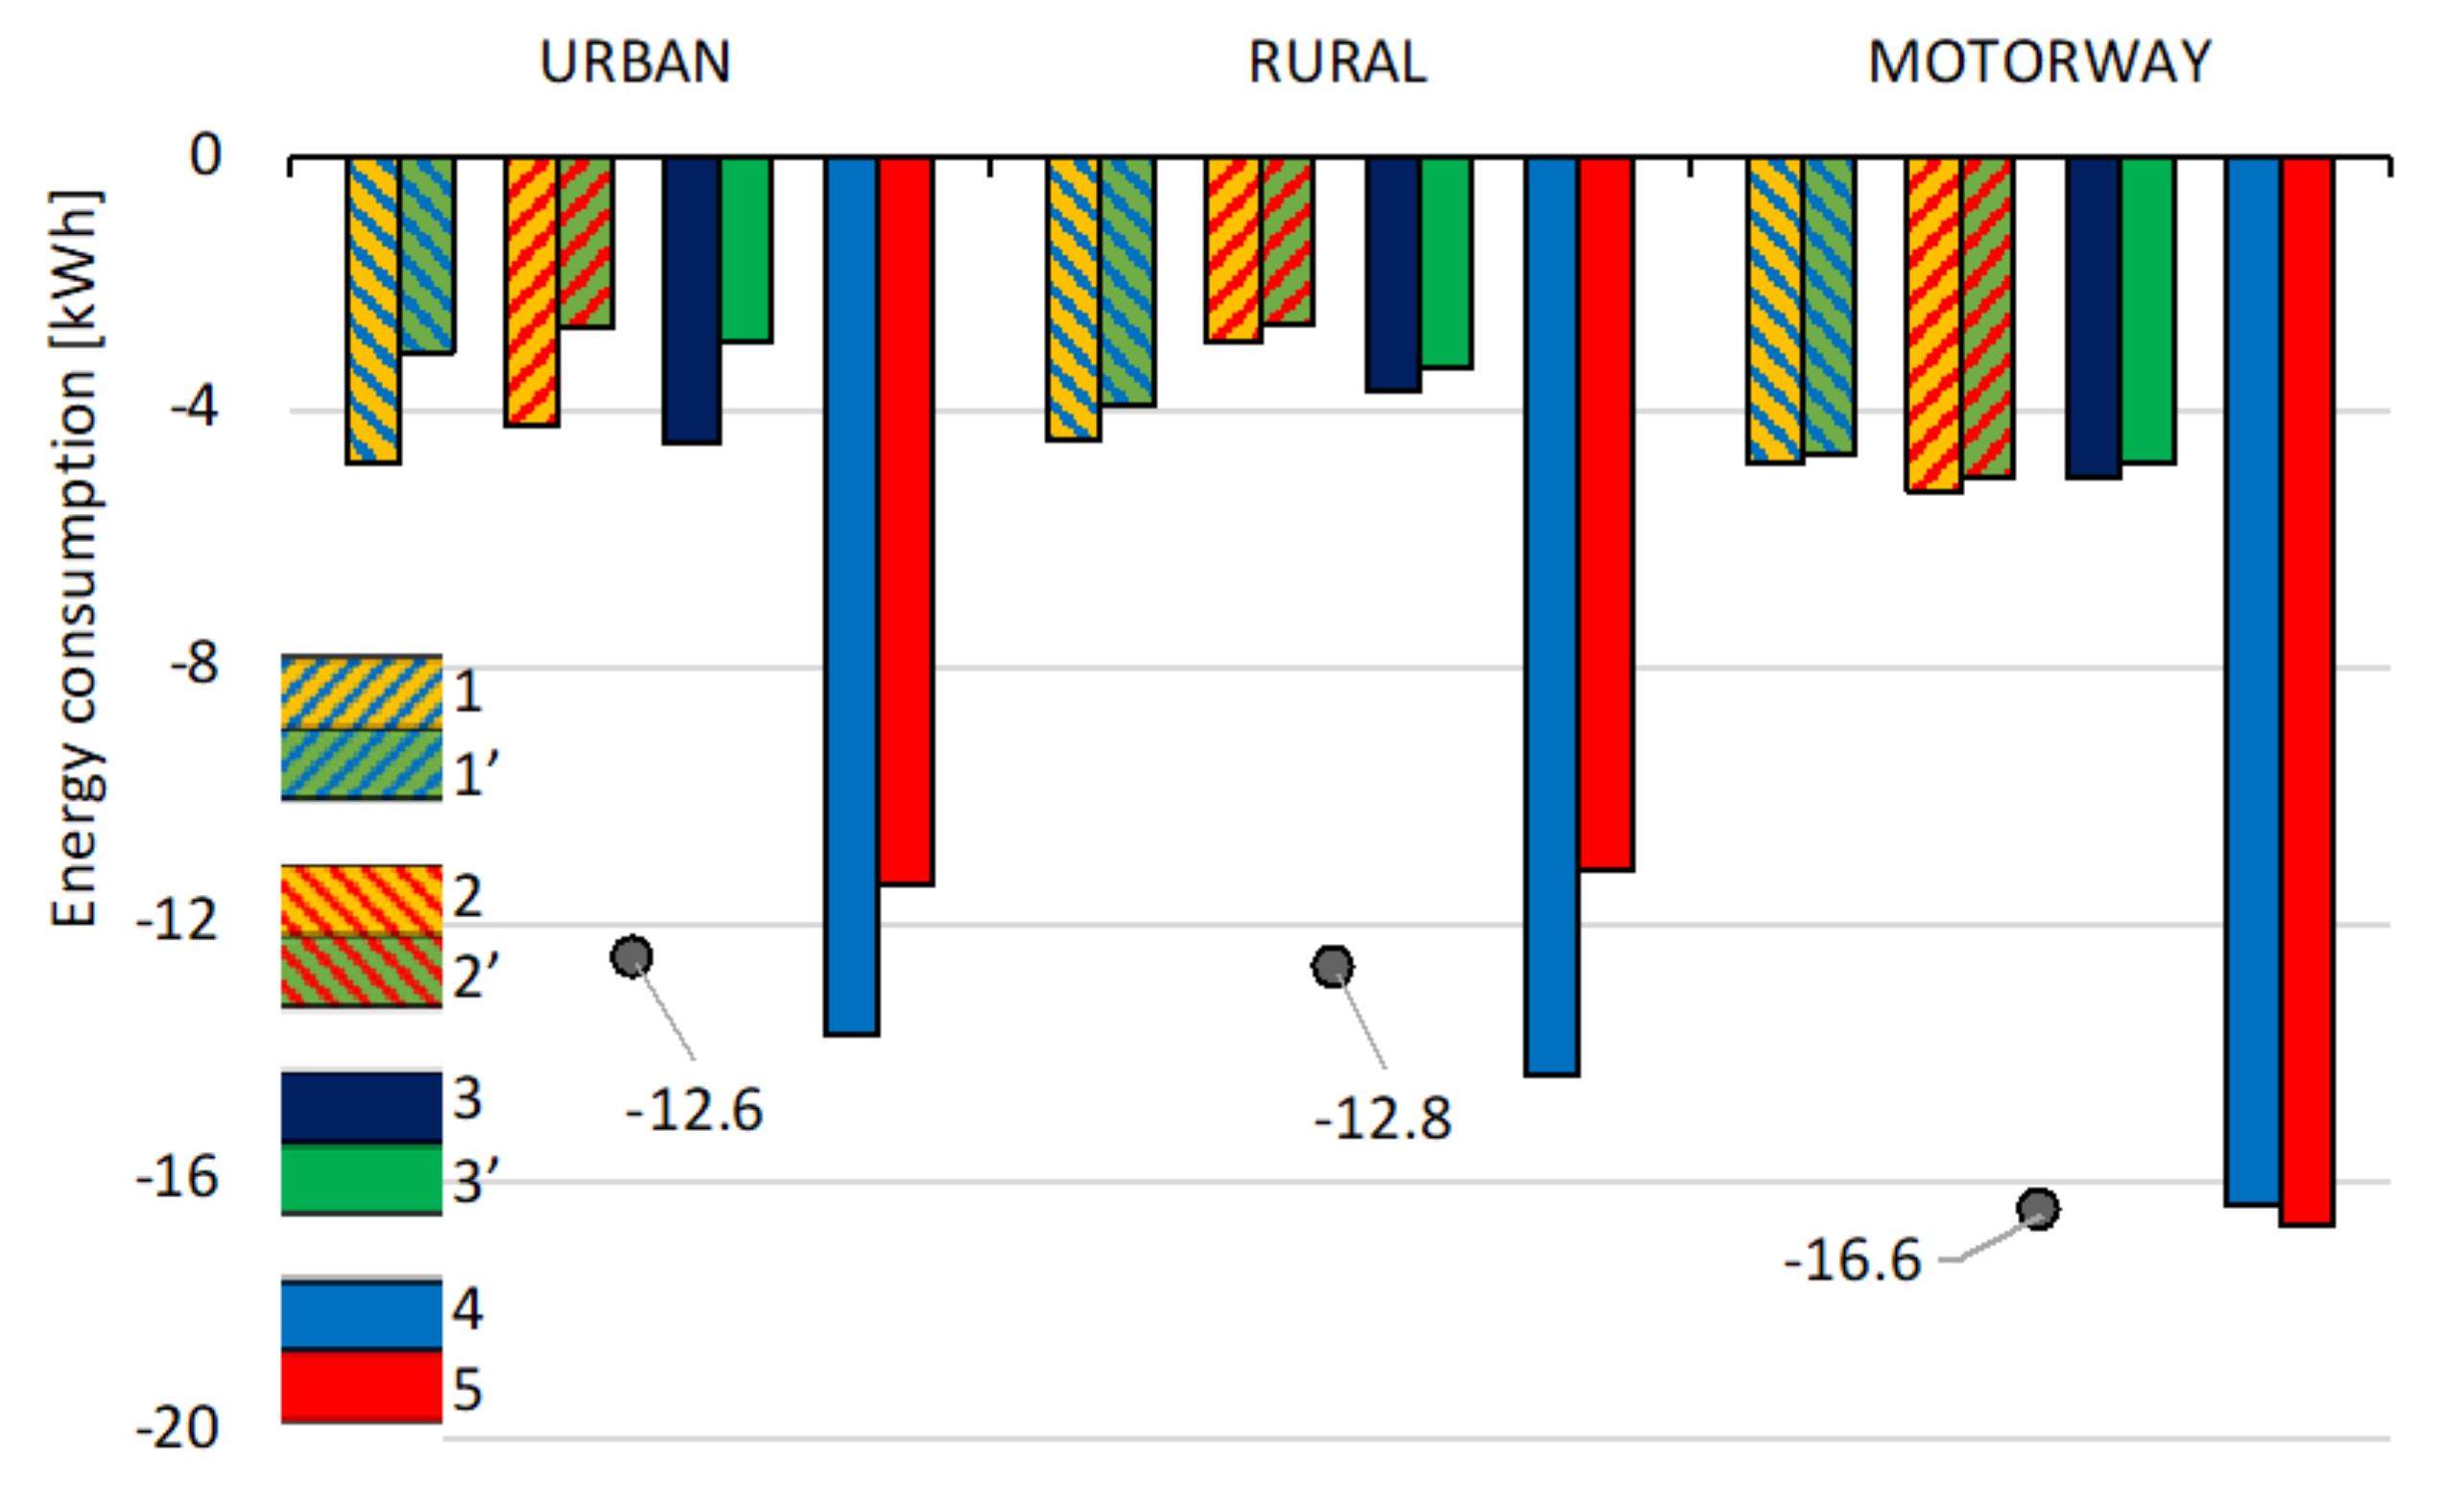
- discharging:
- energy recovery (regenerative braking):
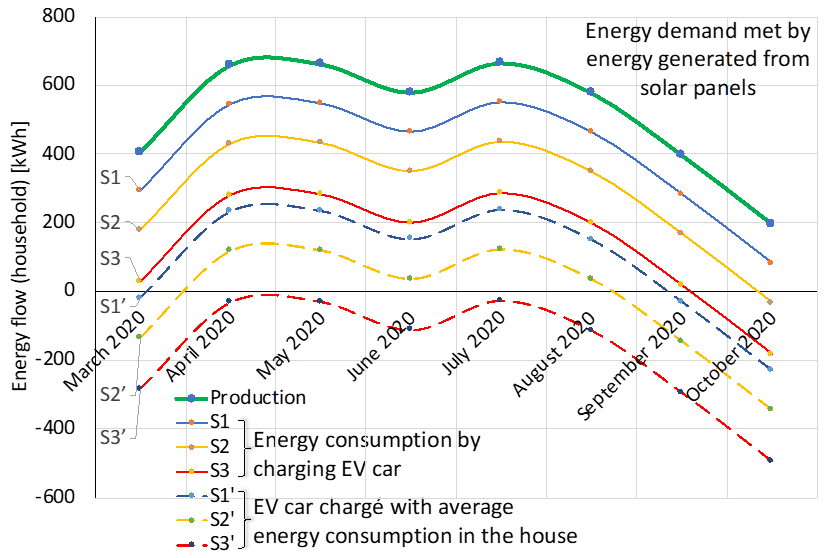
3.4. Energy Supply and Demand for Selected Scenarios of Driving a Vehicle
4. Discussion
5. Conclusions
- The electric vehicle’s (urban type) consumed energy during the RDC test:
- ◦
- In winter conditions: 11.39 kWh/RDC test (estimated at 100 km = 14.9 kWh)
- ◦
- In summer conditions: 10.35 kWh/RDC test (estimated at 100 km = 13.1 kWh)
- The 4.48 kW PV installation can guarantee sufficient EV energy demand:
- ◦
- For all three scenarios in March–September period without energy demand by household appliances
- ◦
- For Scenario 1 and 2 in April–August period with household appliances
- For Scenario 3, the PV installation cannot guarantee the total energy demand while also powering household appliances. This case will be the subject of further research by the authors.
Author Contributions
Funding
Institutional Review Board Statement
Informed Consent Statement
Data Availability Statement
Acknowledgments
Conflicts of Interest
Abbreviations
| EV | Electric Vehicle |
| CAN | Controller Area Network |
| CC | Constant Current |
| CSS | Combined Charging System |
| GHG | Greenhouse Gas |
| GWP | Global Warming Potential |
| HEV | Hybrid Electric Vehicle |
| ICE | Internal Combustion Engines |
| LCA | Life Cycle Assessment |
| OBD | On Board Diagnostics System |
| PV | Photovoltaic |
| RES | Renewable Energy Source |
| RDC | Real Driving Conditions |
| RDE | Real Driving Emissions |
| SOC | State of Charge |
| TTW | Tank to Wheel |
| V2G | Vehicle to Grid |
| WTT | Well to Tank |
References
- Van Mierlo, J.; Maggetto, G.; Lataire, P. Which energy source for road transport in the future? A comparison of battery, hybrid and fuel cell vehicles. Energy Convers. Manag. 2006, 47, 2748–2760. [Google Scholar] [CrossRef]
- Final Energy Consumption by Fuel Type and Sector. Available online: https://www.eea.europa.eu/ (accessed on 1 November 2020).
- Leach, F.; Kalghatgi, G.; Stone, R.; Miles, P. The scope for improving the efficiency and environmental impact of internal combustion engines. Transp. Eng. 2020, 1, 100005. [Google Scholar] [CrossRef]
- González Palencia, J.C.; Nguyen, V.T.; Araki, M.; Shiga, S. The Role of Powertrain Electrification in Achieving Deep Decarbonization in Road Freight Transport. Energies 2020, 13, 2459. [Google Scholar] [CrossRef]
- Moreno, J.C.; Stenlaas, O.; Tunestal, P. Multi-Cylinder Adaptation of In-Cycle Predictive Combustion Models. SAE Int. J. Adv. Curr. Pract. Mobility 2021, 3, 299–311. [Google Scholar]
- Balawender, K.; Ustrzycki, A.; Lejda, K.; Jakubowski, M.; Jaworski, A.; Kuszewski, H.; Siedlecka, S.; Zielińska, E. Modeling of Unburned Hydrocarbon Emission in a Di Diesel Engine Using Neural Networks. In SAE Technical Papers, Proceedings of the SAE 2020 International Powertrains, Fuels and Lubricants Meeting, Krakow, Poland, 22–24 September 2020; Society of Automotive Engineers: Warrendale, PA, USA, 2020. [Google Scholar]
- Sitnik, L.J. Energy Demand Assessment for Long Term Operation of Vehicles. In SAE Technical Papers, Proceedings of the SAE 2020 International Powertrains, Fuels and Lubricants Meeting, Krakow, Poland, 22–24 September 2020; Society of Automotive Engineers: Warrendale, PA, USA, 2020. [Google Scholar]
- Pielecha, J.; Merkisz, J.; Kurtyka, K.; Skobiej, K. Cold start emissions of passenger cars with gasoline and diesel engines in Real Driving Emissions tests. Combust. Engines 2019, 179, 160–168. [Google Scholar]
- Del Pero, F.; Delogu, M.; Pierini, M. Life Cycle Assessment in the automotive sector: A comparative case study of Internal Combustion Engine (ICE) and electric car. Procedia Struct. Integr. 2018, 12, 521–537. [Google Scholar] [CrossRef]
- Messagie, M.; Boureima, F.-S.; Coosemans, T.; Macharis, C.; Mierlo, J.V. A Range-Based Vehicle Life Cycle Assessment Incorporating Variability in the Environmental Assessment of Different Vehicle Technologies and Fuels. Energies 2014, 7, 1467–1482. [Google Scholar] [CrossRef]
- Hawkins, T.R.; Singh, B.; Majeau-Bettez, G.; Strømman, A.H. Comparative Environmental Life Cycle Assessment of Conventional and Electric Vehicles. J. Ind. Ecol. 2012, 17, 53–64. [Google Scholar] [CrossRef]
- Chau, K.; Wong, Y.; Chan, C. An overview of energy sources for electric vehicles. Energy Convers. Manag. 1999, 40, 1021–1039. [Google Scholar] [CrossRef]
- Xu, L.; Yilmaz, H.Ü.; Wang, Z.; Poganietz, W.-R.; Jochem, P. Greenhouse gas emissions of electric vehicles in Europe considering different charging strategies. Transp. Res. Part D Transp. Environ. 2020, 87, 102534. [Google Scholar] [CrossRef]
- Cox, B.; Bauer, C.; Beltran, A.M.; Van Vuuren, D.P.; Mutel, C.L. Life cycle environmental and cost comparison of current and future passenger cars under different energy scenarios. Appl. Energy 2020, 269, 115021. [Google Scholar] [CrossRef]
- Burchart-Korol, D.; Jursova, S.; Folęga, P.; Pustejovska, P. Life cycle impact assessment of electric vehicle battery charging in European Union countries. J. Clean. Prod. 2020, 257, 120476. [Google Scholar] [CrossRef]
- Yang, Y.; Lian, C.; Ma, C.; Zhang, Y. Research on Energy Storage Optimization for Large-Scale PV Power Stations under Given Long-Distance Delivery Mode. Energies 2019, 13, 27. [Google Scholar] [CrossRef]
- Khuong, P.M.; McKenna, R.; Fichtner, W. A Cost-Effective and Transferable Methodology for Rooftop PV Potential Assessment in Developing Countries. Energies 2020, 13, 2501. [Google Scholar] [CrossRef]
- Coffman, M.; Bernstein, P.; Wee, S. Integrating electric vehicles and residential solar PV. Transp. Policy 2017, 53, 30–38. [Google Scholar] [CrossRef]
- Kobashi, T.; Yoshida, T.; Yamagata, Y.; Naito, K.; Pfenninger, S.; Say, K.; Takeda, Y.; Ahl, A.; Yarime, M.; Hara, K. On the potential of “Photovoltaics + Electric vehicles” for deep decarbonization of Kyoto’s power systems: Techno-economic-social considerations. Appl. Energy 2020, 275, 115419. [Google Scholar] [CrossRef]
- Novoa, L.; Brouwer, J. Dynamics of an integrated solar photovoltaic and battery storage nanogrid for electric vehicle charging. J. Power Sources 2018, 399, 166–178. [Google Scholar] [CrossRef]
- Gudmunds, D.; Nyholm, E.; Taljegard, M.; Odenberger, M. Self-consumption and self-sufficiency for household solar producers when introducing an electric vehicle. Renew. Energy 2020, 148, 1200–1215. [Google Scholar] [CrossRef]
- Falvo, M.C.; Graditi, G.; Siano, P. Electric Vehicles integration in demand response programs. In Proceedings of the 2014 International Symposium on Power Electronics, Electrical Drives, Automation and Motion, Ischia, Italy, 18–20 June 2014; pp. 548–553. [Google Scholar]
- Wu, Y.; Zhang, J.; Ravey, A.; Chrenko, D.; Miraoui, A. Real-time energy management of photovoltaic-assisted electric vehicle charging station by markov decision process. J. Power Sources 2020, 476, 228504. [Google Scholar] [CrossRef]
- Raza, W.; Ko, G.S.; Park, Y.C. Induction Heater Based Battery Thermal Management System for Electric Vehicles. Energies 2020, 13, 5711. [Google Scholar] [CrossRef]
- Vaz, W.; Nandi, A.K.; Landers, R.G.; Koylu, U.O. Electric vehicle range prediction for constant speed trip using multi-objective optimization. J. Power Sources 2015, 275, 435–446. [Google Scholar] [CrossRef]
- Rhode, S.; Van Vaerenbergh, S.; Pfriem, M. Power prediction for electric vehicles using online machine learning. Eng. Appl. Artif. Intell. 2020, 87, 103278. [Google Scholar] [CrossRef]
- Liu, X.; Deng, X.; He, Y.; Zheng, X.; Zeng, G. A Dynamic State-of-Charge Estimation Method for Electric Vehicle Lithium-Ion Batteries. Energies 2019, 13, 121. [Google Scholar] [CrossRef]
- Zhang, J.; Wang, Z.; Liu, P.; Zhang, Z. Energy consumption analysis and prediction of electric vehicles based on real-world driving data. Appl. Energy 2020, 275, 115408. [Google Scholar] [CrossRef]
- Gong, J.; He, J.; Cheng, C.; King, M.; Yan, X.; He, Z.; Zhang, H. Road Test-Based Electric Bus Selection: A Case Study of the Nanjing Bus Company. Energies 2020, 13, 1253. [Google Scholar] [CrossRef]
- Donkers, A.; Yang, D.; Viktorović, M. Influence of driving style, infrastructure, weather and traffic on electric vehicle performance. Transp. Res. Part D Transp. Environ. 2020, 88, 102569. [Google Scholar] [CrossRef]
- Xie, Y.; Li, Y.; Zhao, Z.; Dong, H.; Wang, S.; Liu, J.; Guan, J.; Duan, X. Microsimulation of electric vehicle energy consumption and driving range. Appl. Energy 2020, 267, 115081. [Google Scholar] [CrossRef]
- Guo, J.; Jiang, Y.; Yu, Y.; Liu, W. A novel energy consumption prediction model with combination of road information and driving style of BEVs. Sustain. Energy Technol. Assess. 2020, 42, 100826. [Google Scholar] [CrossRef]
- Gis, W.; Merkisz, J. The development status of electric (BEV) and hydrogen (FCEV) passenger cars park in the world and new research possibilities of these cars in real traffic conditions. Combust. Engines 2019, 178, 144–149. [Google Scholar]
- Cieślik, W.; Szwajca, F.; Golimowski, J. The possibility of energy consumption reduction using the ECO driving mode based on the RDC test. Combust. Engines 2020, 182, 59–69. [Google Scholar]
- PV Market in Poland, Institute for Renewable Energy. Available online: https://ieo.pl/en/pv-report (accessed on 24 November 2020).
- PV Market in Poland. 2020. Available online: https://ieo.pl/ (accessed on 24 November 2020).
- Number of Electric Passenger Cars in Poland from 2019 to 2020, by Type of Vehicle. Available online: https://www.statista.com/ (accessed on 24 November 2020).
- Gis, W.; Waśkiewicz, J.; Menes, M. Experts forecasts on the demand for energy carriers in motor vehicle transport in Poland up to year 2035. Combust. Engines 2019, 178, 162–165. [Google Scholar]
- Chłopek, Z.; Lasocki, J.; Wójcik, P.; Badyda, A.J. Experimental investigation and comparison of energy consumption of electric and conventional vehicles due to the driving pattern. Int. J. Green Energy 2018, 15, 773–779. [Google Scholar] [CrossRef]
- Wang, F.; Zhu, Y.; Yan, J. Performance of solar PV micro-grid systems: A comparison study. Energy Procedia 2018, 145, 570–575. [Google Scholar] [CrossRef]
- Monna, S.; Juaidi, A.; Abdallah, R.; Itma, M. A Comparative Assessment for the Potential Energy Production from PV Installation on Residential Buildings. Sustainability 2020, 12, 10344. [Google Scholar] [CrossRef]
- Fachrizal, R.; Shepero, M.; Van Der Meer, D.; Munkhammar, J.; Widén, J. Smart charging of electric vehicles considering photovoltaic power production and electricity consumption: A review. eTransportation 2020, 4, 100056. [Google Scholar] [CrossRef]
- Mohammad, A.; Zamora, R.; Lie, T.T. Integration of Electric Vehicles in the Distribution Network: A Review of PV Based Electric Vehicle Modelling. Energies 2020, 13, 4541. [Google Scholar] [CrossRef]
- Savio, D.A.; Juliet, V.A.; Chokkalingam, B.; Padmanaban, S.; Holm-Nielsen, J.B.; Blaabjerg, F. Photovoltaic Integrated Hybrid Microgrid Structured Electric Vehicle Charging Station and Its Energy Management Approach. Energies 2019, 12, 168. [Google Scholar] [CrossRef]
- UNISON GROUP. Energy Self-Sufficiency. Available online: https://www.unison.co.nz/ (accessed on 1 November 2020).
- Cieslik, W.; Zawartowski, J.; Fuc, P. The Impact of the Drive Mode of a Hybrid Drive System on the Share of Electric Mode in the RDC Test. In SAE Technical Papers, Proceedings of the SAE 2020 International Powertrains, Fuels and Lubricants Meeting, Krakow, Poland, 22–24 September 2020; Society of Automotive Engineers: Warrendale, PA, USA, 2020. [Google Scholar]
- The European Commision Regulation 2017/1154 Amending Regulation (EU) 2017/1151 Supplementing Regulation (EC) No 715/2007 of the European Parliament and of the Council on Type-Approval of Motor Vehicles with Respect to Emissions from Light Passenger and Commercial Vehicles (Euro 5 and Euro 6) and on Access to Vehicle Repair and Maintenance Information, Amending Directive 2007/46/EC of the European Parliament and of the Council, Commission Regulation (EC) No 692/2008 and Commission Regulation (EU) No 1230/2012 and repealing Regulation (EC) No 692/2008 and Directive 2007/46/EC of the European Parliament and of the Council as Regards Real-Driving Emissions from Light Passenger and Commercial Vehicles (Euro 6) (Text with EEA Relevance); Official Journal of the European Union: Brussels, Belgium, 7 June 2017.
- Pielecha, J.; Skobiej, K. Evaluation of ecological extremes of vehicles in road emission tests. Arch. Transp. 2020, 56, 33–46. [Google Scholar] [CrossRef]
- Jacobs-Crisioni, C.; Kompil, M.; Baranzelli, C.; Lavalle, C. Indicators of Urban form and Sustainable Urban Transport. Introducing Simulation-Based Indicators for the LUISA Modelling Platform; JRC Technical Reports; Joint Research Centre: Ispra, Italy, 2015; pp. 1–33. [Google Scholar]
- Chiara, B.D.; Deflorio, F.; Pellicelli, M.; Castello, L.; Eid, M. Perspectives on Electrification for the Automotive Sector: A Critical Review of Average Daily Distances by Light-Duty Vehicles, Required Range, and Economic Outcomes. Sustainability 2019, 11, 5784. [Google Scholar] [CrossRef]
- Solar Resource Map. Available online: https://solargis.com/ (accessed on 20 November 2020).
- SMA Solar Technology. Available online: https://www.sma-solar.pl (accessed on 10 December 2020).
- Karkosiński, D.; Pacholczyk, M.; Sienkiewicz, Ł. Experimental study of the use of electric car powered with stationary solar and electrochemical batteries in Northern Poland. MATEC Web Conf. 2018, 180, 0209. [Google Scholar] [CrossRef]
- Sarniak, M. Analysis of energy efficiency of photovoltaic installation in central Poland. E3S Web Conf. 2018, 46, 00002. [Google Scholar] [CrossRef]
- Pielecha, J.; Skobiej, K.; Kurtyka, K. Exhaust Emissions and Energy Consumption Analysis of Conventional, Hybrid, and Electric Vehicles in Real Driving Cycles. Energies 2020, 13, 6423. [Google Scholar] [CrossRef]
- Iora, P.; Tribioli, L. Effect of Ambient Temperature on Electric Vehicles’ Energy Consumption and Range: Model Definition and Sensitivity Analysis Based on Nissan Leaf Data. World Electr. Veh. J. 2019, 10, 2. [Google Scholar] [CrossRef]
- Doyle, A.; Muneer, T. Energy consumption and modelling of the climate control system in the electric vehicle. Energy Explor. Exploit. 2018, 37, 519–543. [Google Scholar] [CrossRef]


| Electric Motor/Car | Battery | ||
|---|---|---|---|
| Parameter | Value | Parameter | Value |
| Max. voltage | 360 V | Type | Li-ion |
| Max. power output | 61 kW | Capacity total | 36.8 kWh |
| Max. torque | 212 Nm | Capacity usable | 32.3 kWh |
| Maximum speed | 130 km/h | Charge port | AC-Type 2 DC-CCS2 |
| Operating weight | 1235 kg | Charge power | AC-7.2 kW DC-40 kW |
| Route Pattern Followed in Research | Selected RDE/RDC Test Requirements | Urban | Rural | Motorway |
|---|---|---|---|---|
 | Cycle repetition [%] (± 10%) | 29 < ratio ≤ 34 | 33 | ← |
| Speed [km/h] | < 60 | 60 ≤ V ≤ 90 | V > 90 | |
| Max. speed [km/h] (± 15 km/h for less than 3% of driving time) | - | - | 145 | |
| Average speed (stops included) [km/h] | 15 ≤ V ≤ 30 | - | - | |
| Minimum travelled distance [km] | 16 | ← | ← | |
| Altitude difference (beginning/end) [m] | 100 | ← | ← | |
| Maximum slope [m/100km] | 1200 m/100 km | ← | ← |
| Test Specification | Result Winter Conditions | Result Summer Conditions | Requirement | |
|---|---|---|---|---|
| Urban component [km] | 22.3 | 23.4 | >16 | |
| Rural component [km] | 27.2 | 23.6 | >16 | |
| Highway component [km] | 28.3 | 30.0 | >16 | |
| Total route length [km] | 77.8 | 77.0 | >48 | |
| Urban component [%] | 29.7 | 30.3 | 29−44 | |
| Rural component [%] | 34.9 | 30.7 | 33 ± 10 | |
| Highway component [%] | 35.4 | 39.0 | 33 ± 10 | |
| Average speed on urban route [km/h] | 20.9 | 24.0 | 15–40 | |
| Duration of stops on urban route [%] | 28.9 | 28.24 | 6–30 | |
| Trip duration at more than 100 km/h [min] | 14.2 | 15.2 | >5 | |
| Maximum speed [km/h] | 117.0 | 116 | <160 | |
| Trip duration at more than 145 km/h during the highway component [%] | 0.0 | 0.0 | <3 | |
| Maximum single stop duration [s] | 103.0 | 99.9 | <180 | |
| Trip duration [min] | 99.5 | 92.8 | 90–120 | |
| Urban: data set no. ai > 0.1 m/s2 | 1146 | 1024 | >150 | |
| Rural: data set no. ai > 0.1 m/s2 | 263 | 269 | >150 | |
| Highway: data set no. ai > 0.1 m/s3 | 158 | 188 | >150 | |
| Urban: 95. percentile V∙apos [m2 /s3] | 17.0 | 15.0 | <17.2 1 | <17.7 2 |
| Rural: 95. percentile V∙apos [m2 /s3] | 24.7 | 14.8 | <24.9 1 | <24.6 2 |
| Highway: 95. percentile V∙apos [m2 /s3] | 25.9 | 24.7 | <27.3 1 | <27.3 2 |
| Urban: RPA [m/s2] | 0.323 | 0.268 | >0.142 1 | >0.137 2 |
| Rural: RPA [m/s2] | 0.099 | 0.085 | >0.047 1 | >0.053 2 |
| Highway: RPA [m/s2] | 0.065 | 0.078 | >0.025 1 | >0.025 2 |
| Input (DC) | Output (AC) | Efficiency | |||
|---|---|---|---|---|---|
| Parameter | Value | Parameter | Value | Parameter | Value |
| Max. PV array power | 9000 Wp | Rated power (at 230 V, 50 Hz) | 5000 W | Max. efficiency | 98.2% |
| Max. input voltage | 850 V | Max. output current | 3 × 7.7 A | European efficiency | 97.4% |
| Parameter | Key Assumptions | ||
|---|---|---|---|
| Drive | a = 0 | v > 0 | |
| Acceleration | a > 0 | v > 0 | |
| Standstill | - | v = 0 | |
| Regenerative braking | a < 0 | v > 0 | IBAT > 0 |
| General Form of the Equation | Energy Flow | Speed Requirements | ||
|---|---|---|---|---|
| Urban | Rural | Motorway | ||
| Charge PBAT > 0 | v ≤ 60 | 60 > v ≥ 90 | v ≥ 90 | |
| Discharge PBAT < 0 | ||||
| [-] | Period | Explanation | Urban [kWh] | Rural [kWh] | Motorway [kWh] |
|---|---|---|---|---|---|
| 1 | Winter condition | Energy consumption of the vehicle in the selected road section without considering energy recovery | −4.83 | −4.433 | 0.79–4.79 |
| 1′ | Energy consumption of the vehicle in the selected road section with considering energy recovery (energy recovery during vehicle braking) | −3.06 | −3.91 | −4.63 | |
| 2 | Summer condition | Energy consumption of the vehicle in the selected road section without considering energy recovery | −4.16 | −2.88 | −5.23 |
| 2′ | Energy consumption of the vehicle in the selected road section with considering energy recovery (energy recovery during vehicle braking) | −2.67 | −2.64 | −5.03 | |
| 3 | Average from research periods | Energy consumption of the vehicle in the selected road section without considering energy recovery | −4.51 | −3.65 | −5.01 |
| 3′ | Energy consumption of the vehicle in the selected road section with considering energy recovery (energy recovery during vehicle braking) | −2.87 | −3.27 | −4.83 | |
| 4 | Winter condition | Estimated energy consumption for 100 km in a selected section of the tested route (including energy recovery from braking characteristic of the route) | −13.73 | −14.36 | −16.39 |
| 5 | Summer condition | Estimated energy consumption for 100 km in a selected section of the tested route (including energy recovery from braking characteristic of the route) | −11.43 | −11.15 | −16.72 |
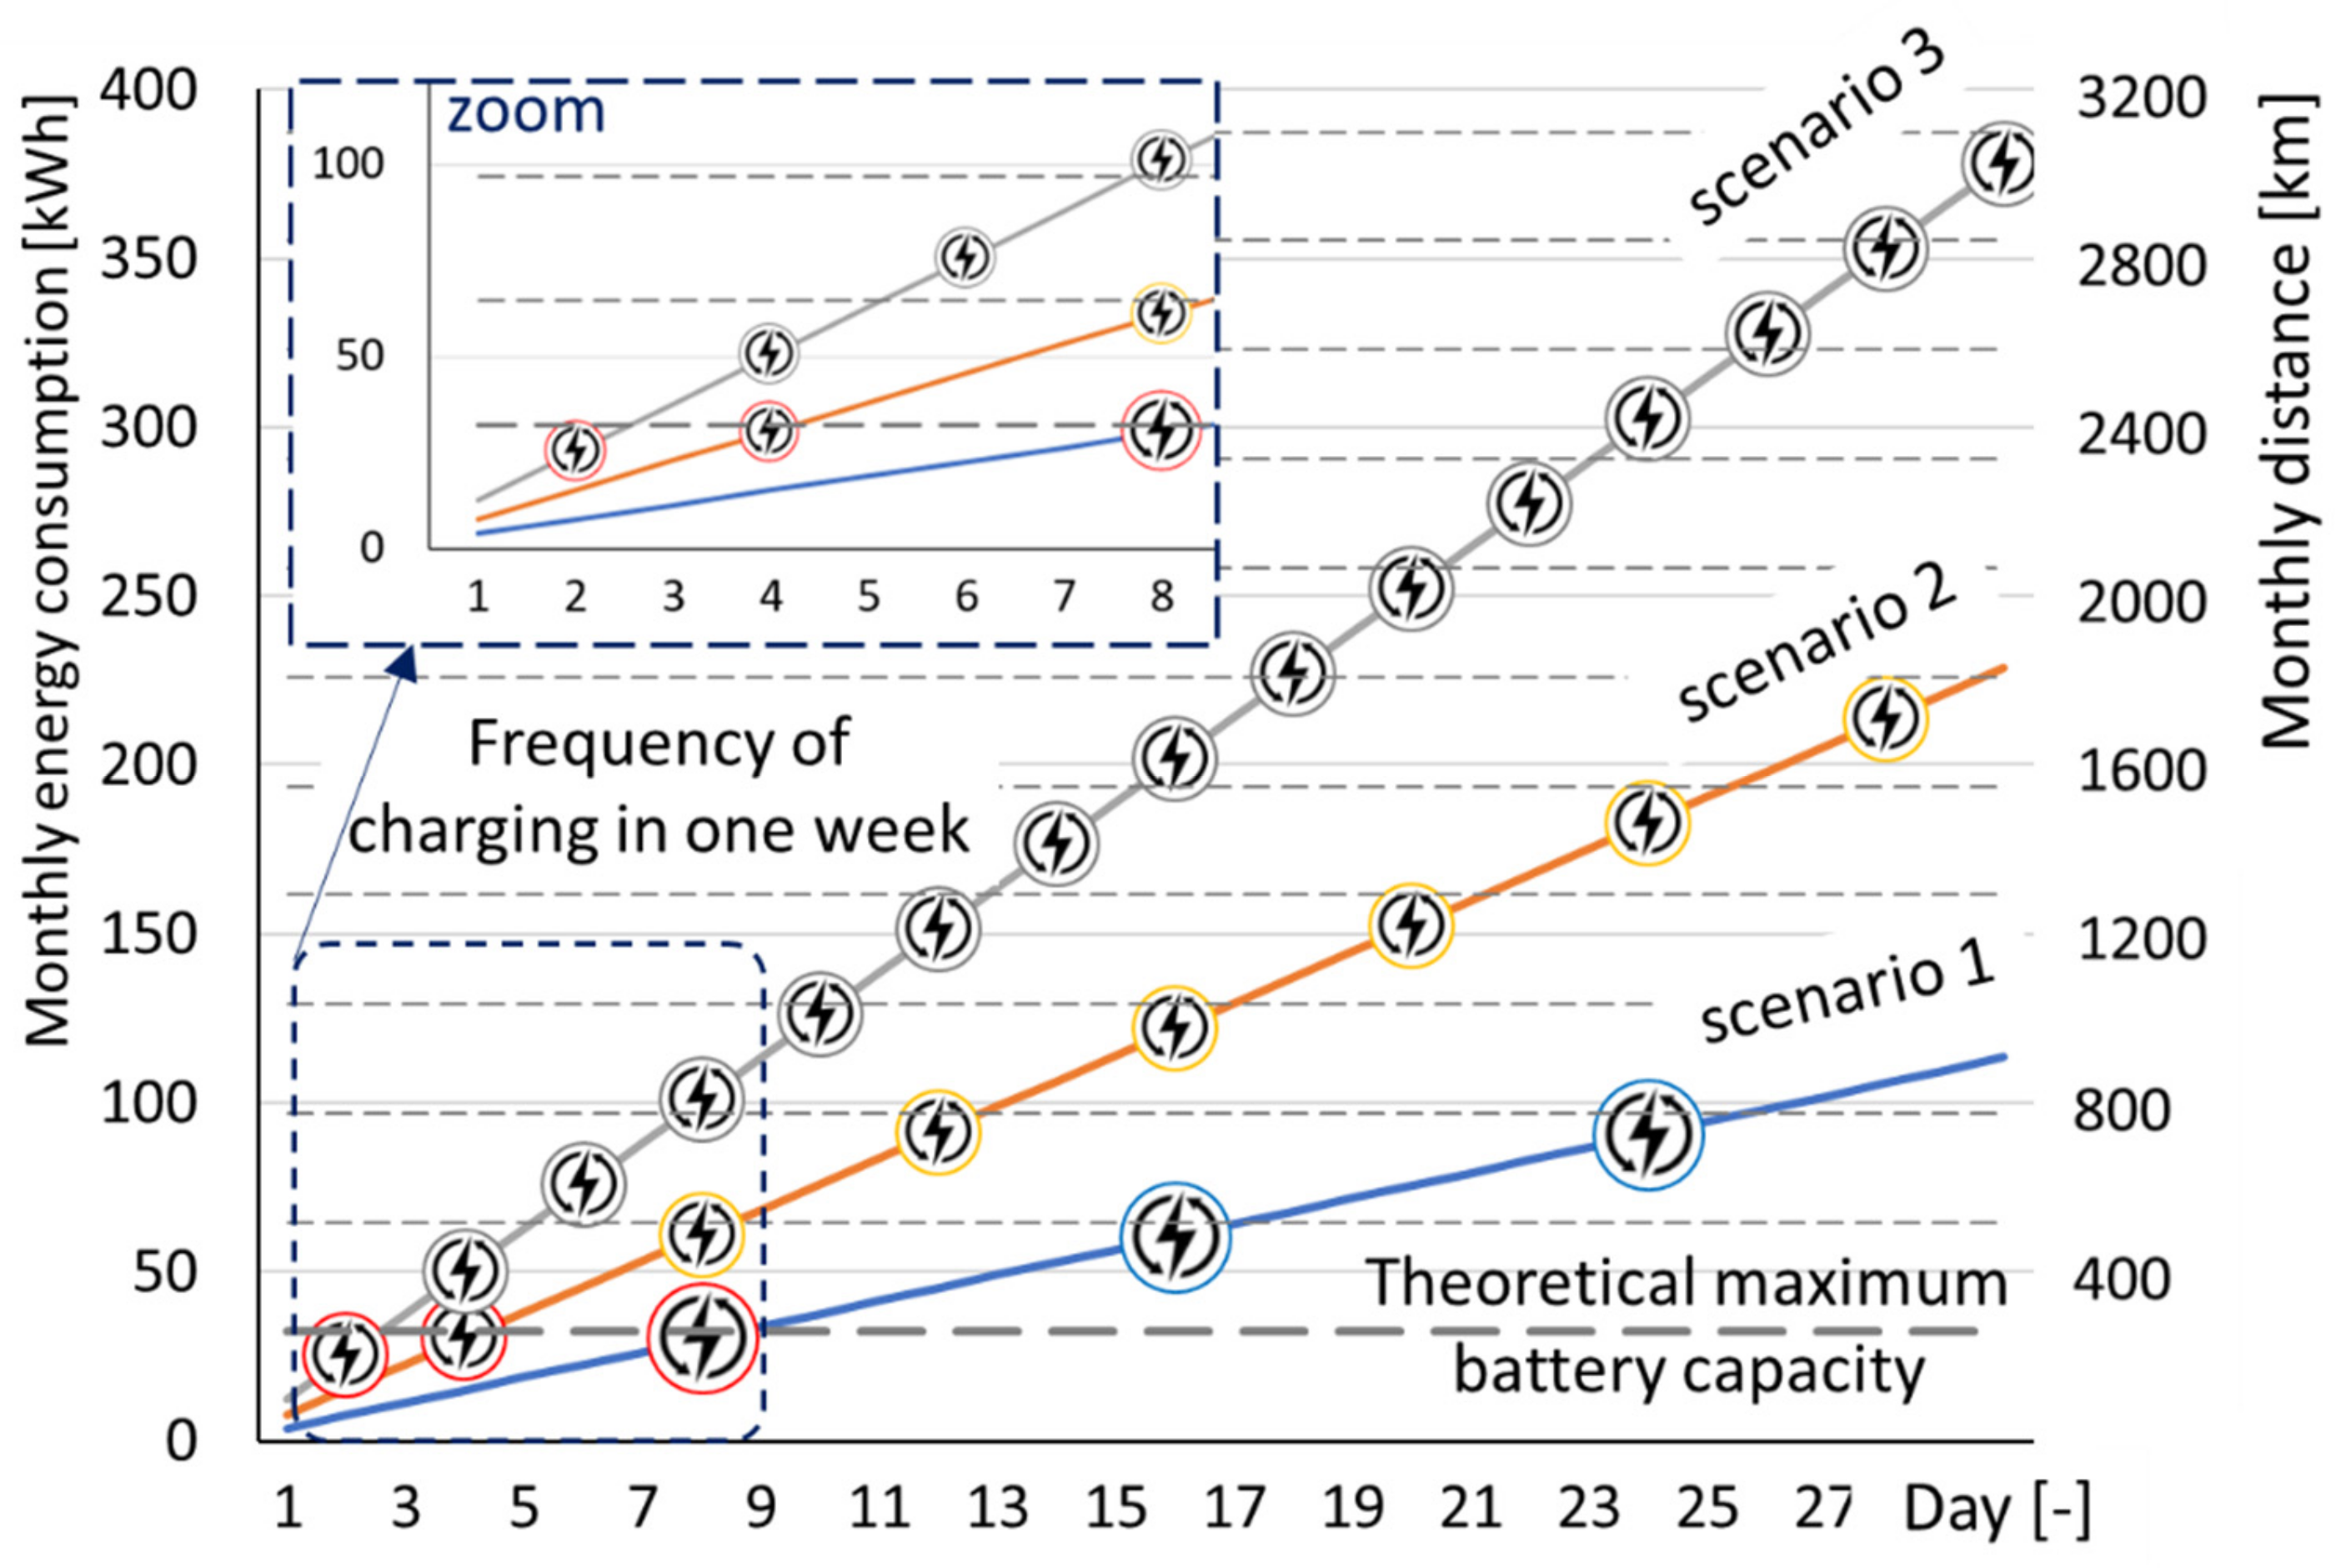
| Scenarios Under Investigation | Daily Distance Work | Travel Conditions | Total Distance in Week | Energy Usage in the Scenario | Frequency of Vehicle Charging | Average Energy Demand Per Month | ||
|---|---|---|---|---|---|---|---|---|
| Urban | Rural | Motorway | ||||||
| [-] | [km] | [km] | [km] | [km] | [km] | [kWh] | [-] | [kWh] |
| S1 | 15 | 15 | - | - | 210 | 3.78 | 8.54→8 | 113.4 |
| S2 | 30 | 15 | 15 | - | 420 | 7.62 | 4.24→4 | 228.6 |
| S3 | 45 | 15 | 15 | 15 | 630 | 12.6 | 2.56→2 | 378 |
Publisher’s Note: MDPI stays neutral with regard to jurisdictional claims in published maps and institutional affiliations. |
© 2021 by the authors. Licensee MDPI, Basel, Switzerland. This article is an open access article distributed under the terms and conditions of the Creative Commons Attribution (CC BY) license (http://creativecommons.org/licenses/by/4.0/).
Share and Cite
Cieslik, W.; Szwajca, F.; Golimowski, W.; Berger, A. Experimental Analysis of Residential Photovoltaic (PV) and Electric Vehicle (EV) Systems in Terms of Annual Energy Utilization. Energies 2021, 14, 1085. https://doi.org/10.3390/en14041085
Cieslik W, Szwajca F, Golimowski W, Berger A. Experimental Analysis of Residential Photovoltaic (PV) and Electric Vehicle (EV) Systems in Terms of Annual Energy Utilization. Energies. 2021; 14(4):1085. https://doi.org/10.3390/en14041085
Chicago/Turabian StyleCieslik, Wojciech, Filip Szwajca, Wojciech Golimowski, and Andrew Berger. 2021. "Experimental Analysis of Residential Photovoltaic (PV) and Electric Vehicle (EV) Systems in Terms of Annual Energy Utilization" Energies 14, no. 4: 1085. https://doi.org/10.3390/en14041085
APA StyleCieslik, W., Szwajca, F., Golimowski, W., & Berger, A. (2021). Experimental Analysis of Residential Photovoltaic (PV) and Electric Vehicle (EV) Systems in Terms of Annual Energy Utilization. Energies, 14(4), 1085. https://doi.org/10.3390/en14041085