Article

Model Predictive Control for Paralleled Uninterruptible Power Supplies with an Additional Inverter Leg for Load-Side Neutral Connection

1
Department of Electrical and Computer Engineering, University of Coimbra—Pole 2, P-3030-290 Coimbra, Portugal
2
Instituto de Telecomunicações, University of Coimbra—Pole 2, P-3030-290 Coimbra, Portugal
*
Author to whom correspondence should be addressed.
Energies 2021, 14(8), 2270; https://doi.org/10.3390/en14082270
Submission received: 8 March 2021 / Revised: 9 April 2021 / Accepted: 13 April 2021 / Published: 18 April 2021
(This article belongs to the Special Issue Advances in Electric Drives and Power Electronics Fields)

Abstract

:
Uninterruptible Power Supplies (UPS) have been demonstrated to be the key technology in feeding either single- and three-phase loads in a wide range of critical applications, such as high-tier datacenters and medical facilities. To increase the overall system power capacity and resilience, UPS systems are usually connected in parallel. When UPS systems are parallel connected, a circulating current can rise, inhibiting correct system operation. Moreover, having a controlled load power distribution is another fundamental requirement in paralleled UPS systems. However, strategies to ensure these two topics have not been explored to date for UPS systems with a load-side neutral connection. This paper proposes an innovative Finite Control Set Model Predictive Control (FCS-MPC) strategy that ensures circulating current elimination and controlled load power distribution for paralleled UPS systems that use an additional inverter leg for load neutral point connection. Additionally, a system topology based on two parallel-connected UPS systems that can simultaneously supply single- and three-phase critical loads is proposed. Experimental results show the effectiveness and robustness of the proposed control techniques even when different types of loads are connected to the UPS systems.

Graphical Abstract

1. Introduction

Nowadays, Uninterruptible Power Supplies (UPS) represent a key technology feeding a wide range of highly sensitive and critical applications, which are increasingly growing in power grids. These systems are used in low-power applications, such as important domestic/business equipment and networks, as well as in high-power applications including industrial processes, high-tier datacenters, hospitals, and other medical facilities. In some of these applications, only Three-Phase Three-Wire (3P3W) loads are required to be supplied. In this case, no neutral wire in the UPS systems is required [1,2,3]. However, there are several applications in which both three-phase and single-phase loads need to be supplied [4,5,6]. Hence, for such applications, the used UPS systems must provide a neutral connection at the load-side terminals to feed all possible types of loads.
In the literature, there are two main solutions generally adopted in DC/AC converters of different applications. One of these solutions is characterized by the direct connection of the neutral point of the load to the mid-point of the DC bus [7,8]. The other possibility consists of using an extra leg in the inverter to which the neutral wire is connected [9,10,11,12]. One can immediately note that in the first solution, practically no additional hardware is required. This can, in some situations, be a significant advantage since, in terms of UPS configuration, only the connection of the neutral wire to the already-existing DC bus capacitors’ mid-point needs to be made, with no complicated changes in the hardware being required (e.g., rearranging a UPS that only supplies 3-phase loads into a UPS that can supply single-phase loads) and a lower cost.
However, with this solution, all load neutral current that comes from the load can flow into the DC bus capacitors. Hence, these capacitors can be subjected to an enormous amount of stress that tends to degrade the capacitors, changing their nominal capacitance and of course reducing their lifetime. Moreover, by connecting the neutral wire to the DC bus mid-point, the balancing of the DC bus capacitor voltage is even more difficult to achieve, which, for some converter configurations, is a very problematic situation. On the other hand, the second solution requires an additional converter leg with a more complicated control scheme design and execution. However, the disadvantages of additional capacitors’ deterioration and DC bus capacitor voltage unbalancing are decreased, which typically leads to higher system performance and reliability compared to the first presented solution [11,13]. Hence, in this study, an additional leg is used in each of the UPS multilevel load-side converters to provide a neutral path for the circulation of the load neutral current.
Multilevel converters present several advantages in comparison with conventional 2-level converters [14]. Since they generate an output voltage with more levels, lower voltage and current Total Harmonic Distortion (THD) are typically achieved, as well as lower switching losses. Moreover, for the same DC bus voltage, the semiconductors are subjected to a lower voltage value. The 3-Level Neutral Point Clamped Converter (3LNPC) corresponds to a multilevel topology that has been largely used in the industry and significantly investigated by the scientific community in a wide range of applications, including UPS systems [2,3]. Thus, in this work, all used UPS converters consist of a 3LNPC topology.
UPS systems are connected in parallel basically due to two reasons: expansion of the installed power capacity (to meet the increase of critical load power in a facility) and increase in the global system resilience (to protect the critical load from possible internal UPS system failures). However, when power converters are parallel-connected an undesirable Zero Sequence Circulating Current (ZSCC) can appear and as shown in [3,15] this current highly distorts UPS systems phase currents, rises their magnitudes to dangerous values, and increases the global active power losses. Given that a fundamental requirement for the correct operation of paralleled UPS systems is the elimination of this current, the main strategies for circulating current elimination in paralleled UPS systems are mainly based on conventional PI control approaches, which typically use a dedicated control loop to eliminate the circulating current [16,17,18]. More recently, strategies for ZSCC suppression in complete three-phase paralleled UPS systems have been proposed using Model Predictive Control (MPC) [3,19]. However, in these works, only UPS systems with a 3-wire configuration at the load-side are studied. Hence, the study of the circulating current dynamics and the development of a strategy for its elimination in paralleled UPS systems with a neutral connection at the load-side are the contributions of this work.
The ability to distribute the load power is another important issue when UPS systems are paralleled-connected. The possibility of having a controlled distribution is considerably important since it can allow the optimization of the overall system efficiency [3]. Furthermore, if a UPS is not able to supply its power target (e.g., due to internal failure), then the other UPS systems can compensate with an increase in their target power. Nevertheless, load-sharing techniques that allow a controlled load power distribution between paralleled UPS systems with load-side neutral wire have not been explored to date.
Finite Control Set Model Predictive Control (FCS-MPC) has been considered a promising control strategy for power electronics applications [20,21]. Compared to more conventional control techniques (e.g., the use of a PI + PWM control scheme), the FCS-MPC theoretical concept is much more intuitive and simple. Moreover, this type of control typically presents a faster dynamic response [2,22,23] and allows an easier inclusion of system non-linearities and constraints in the control strategy design. Another important advantage is that in comparison to what is typically observed in the dynamic response of a PI + PWM control scheme, with FCS-MPC, no overshoots or significant oscillations are observed [2,22].
Hence, despite presenting a higher computational burden, this type of predictive control has demonstrated to be a very promising control strategy for a wide range of power electronics applications, including those that present a multi-converter topology, such as paralleled DC/AC converters [24,25], standalone UPS systems [1,26] and paralleled UPS systems [3,15,27].
Hence, this paper has two main contributions:
  • Proposal of a system topology that consists of two double-conversion paralleled UPS systems based on a multilevel topology, with a load-side neutral wire that allows the connection of multiple single/three-phase balanced/unbalanced loads;
  • Proposal of an innovative control scheme that simultaneously ensures a high-quality load voltage waveform, circulating current suppression, and a controlled load power distribution between UPS systems.
Additionally, an analysis regarding the behavior of load-side converters neutral leg currents is provided, also representing a contribution of the work. This paper is organized as follows: Section 2 presents all converters’ mathematical models and the circulating current dynamics; Section 3 demonstrates the control references calculation as well as the proposed predictive control strategy; experimental results are shown and discussed in Section 4; finally, in Section 5 the main conclusions of the work are presented.

2. UPS System Modelling and ZSCC Dynamics

Figure 1 illustrates the proposed system topology as well as relevant voltage and current signals. For simplicity, taking into account that the DC–DC converters and battery banks of both UPS systems do not affect the ZSCC dynamics, these two components are not considered in the present work. Thus, each UPS has two converters sharing a DC bus with two capacitors: a grid-side converter (GSC) and a load-side converter (LSC). The GSCs are connected to the mains using an inductor, whereas the LSCs are connected to the load using a second-order LC filter. These two converters are based on a 3LNPC topology, solely differing between them in the number of converter legs. Each GSC contains three legs and each of them is associated with a grid-side phase X. On the other hand, each LSC has four legs, and each of these legs is associated with the three load-side phases and the neutral point terminal. Hence, for a GSC, X = { R , S , T } , and for an LSC, X = { A , B , C , N } . All converter legs have four IGBTs with anti-parallel diodes as well as two clamping diodes. Hence, as Table 1 shows that for each leg, there are three possible switching states S X { 1 , 0 , 1 } , which when applied lead to three different pole voltage values v X M { v C 1 , 0 , v C 2 } , respectively. The pole voltage of phase X ( v X M ) corresponds to the voltage between a terminal X and the M point, which is the middle terminal of the UPS DC bus. Given the configuration of each converter, each GSC and LSC has 27 and 81 possible switching states, respectively, which represent the mathematical model of these converters defined in Section 2.1 and Section 2.2, respectively.

2.1. Grid-Side Converter Mathematical Model

The generic mathematical model of the GSCs is presented here. Since the two UPS systems have the same configuration, the presented model is equal for the two GSCs, which is also valid for the LSCs. Regarding a GSC, from Figure 1, the following voltage equation is written:
v s X = L G d i X d t + R G i X + v X M v O M .
In this equation, v s X denotes the grid phase voltage (obtained from the measured line-to-line voltages shown in red) and v O M is the Common Mode Voltage (CMV) generated by the converter.
For simplicity, the GSC variables are transformed to space vector form by using the following transformation:
x ¯ = 2 3 · ( x R + a x S + a 2 x T )
where a = e j 2 π 3 is the space rotation coefficient and x ¯ is the variable x in space vector form. Hence, in vector form, (1) is written as
v ¯ s = L G d i ¯ g d t + R G i ¯ g + v ¯ g .
in which v ¯ s corresponds to the grid voltage vector; the term i ¯ g is the input UPS current vector and v ¯ g the converter voltage vector. This equation allows one to obtain the converter current dynamics, which are given by
d i ¯ g d t = v ¯ s L G R G L G i ¯ g v ¯ g L G ,
The DC bus capacitor voltage dynamics are given by
d v C 1 d t = 1 C D C i C 1 ,
d v C 2 d t = 1 C D C i C 2 .
In these equations, the currents in the capacitors C 1 and C 2 are respectively given by
i C 1 = i P G i P L = i C 2 i M G + i M L ,
i C 2 = i N L i N G = i C 1 + i M G i M L .
In these two equations i P G , i M G , i N G corresponds to the currents supplied by the GSC to the DC bus, while i P L , i M L , i N L denote the currents drawn from the DC bus by the LSC. The currents supplied by the GSC to the DC bus are obtained using the switching state applied to the converter and the converter phase currents:
i P G = i R · K P R + i S · K P S + i T · K P T ,
i M G = i R · K M R + i S · K M S + i T · K M T ,
i N G = i R · K N R + i S · K N S + i T · K N T
In these equations the coefficients K P X , K M X , K N X are equal to 1 if the switching state applied to leg X is 1 , 0 , 1 , respectively; otherwise, these coefficients are 0. The currents drawn from the DC bus by the LSC are obtained similarly and are defined in Section 2.2.

2.2. Load-Side Converter Mathematical Model

The mathematical model of the LSCs is analyzed here. As previously mentioned, the configuration of both UPS systems is exactly the same, meaning that the following equations are applicable for any LSC. Hence, from Figure 1 the following voltage equation is obtained:
v l o a d X = L L d i L X d t R L i L X + v X M v O M ,
with X = { A , B , C } . In this equation v l o a d X corresponds to the measured load phase voltage; the term i L X denotes the LSC phase currents; and the term v X M corresponds to the pole voltage of phase X and v O M to the CMV generated by the converter, O’ in this case being the neutral point of the load. Since the neutral leg of the converter connects the neutral load point to the mid-point of the DC bus, the LSC CMV directly corresponds to the neutral pole voltage v N M , which is directly obtained from the DC bus capacitor voltage and the switching state applied to the neutral leg:
v O M = v N M = v C 1 , S N = 1 0 , S N = 0 v C 2 , S N = 1 .
From Figure 1, the following current equation can also be written;
i L X = i l o a d X + i C L X = i l o a d X + C L d v l o a d X d t ,
with X = { A , B , C } . In this equation, the term i l o a d X corresponds to the phase X current after the UPS LC filter, C L denotes the filter capacitance, and i C L X the current in the phase X filter capacitor. From Equations (12) and (14), the dynamics of the LSC current and load voltage are obtained, which are given by
d i L X d t = 1 L L v l o a d X R L L L i L X + 1 L L v X M 1 L L v O M ,
d v l o a d X d t = 1 C L i L X 1 C L i l o a d X .
The currents drawn by the LSC from the DC bus are obtained using the switching state applied to the converter and the converter phase currents:
i P L = i L A · K P A + i L B · K P B + i L C · K P C + i N · K P N ,
i M L = i L A · K M A + i L B · K M B + i L C · K M C + i N · K M N ,
i N L = i L A · K N A + i L B · K N B + i L C · K N C + i N · K N N .
In these equations the coefficients K P X , K M X , K N X are equal to 1 if the switching state applied to leg X is 1 , 0 , 1 respectively; otherwise, these coefficients are 0. The LSC neutral current i N is obtained (for the LSC1) using the following equation:
i R 1 + i S 1 + i T 1 = i L A 1 + i L B 1 + i L C 1 + i N 1 ,
which can be written for sample k as
i N 1 [ k ] = 3 · i 0 [ k ] ( i L A 1 [ k ] + i L B 1 [ k ] + i L C 1 [ k ] ) .
where the term i 0 [ k ] corresponds to the ZSCC at sample k, which is defined in Section 2.3. The LSC2 neutral current is calculated analogously using the ZSCC and respective LSC2 phase currents.

2.3. Zero-Sequence Circulating Current Modelling

As previously described, when UPS systems are parallel connected, a circulating current (ZSCC) can flow between the UPS systems. This current needs to be eliminated to ensure a correct system operation. In the case of the studied system, the ZSCC can be obtained by measuring the three grid-side phase currents of any UPS:
i 0 = i R 1 + i S 1 + i T 1 3 = i R 2 + i S 2 + i T 2 3 .
This means that the circulating current will have an equal magnitude in both paralleled UPS systems but opposite polarity, considering the measurement conventions presented in Figure 1. In the equation, the subscripts 1 and 2 are used to differentiate between variables of UPS1 and UPS2. This notation is also adopted throughout the paper.
As demonstrated in [3] for two paralleled UPS systems (without load-side neutral wire connection), this current is generated due to the low impedance paths, which, depending on the switching states, can in the worst case be subjected to the two DC buses voltages. In the case of UPS systems without load-side neutral wire connection, this circulating current is limited by the impedance of the grid-side and load-side filters’ inductors. However, in the presented studied system, in which the two DC buses can be directly connected through the neutral legs, only the grid-side filter impedance limits this current, as mathematically proven below. Hence, to obtain the dynamics of the ZSCC in paralleled UPS systems with a load-side neutral connection formed by an additional inverter leg, the following voltage equations are firstly written:
L G 1 d i R 1 d t + R G 1 i R 1 + v R M 1 v O M L 1 = L G 2 d i R 2 d t + R G 2 i R 2 + v R M 2 v O M L 2 L G 1 d i S 1 d t + R G 1 i S 1 + v S M 1 v O M L 1 = L G 2 d i S 2 d t + R G 2 i S 2 + v S M 2 v O M L 2 L G 1 d i T 1 d t + R G 1 i T 1 + v T M 1 v O M L 1 = L G 2 d i T 2 d t + R G 2 i T 2 + v T M 2 v O M L 2
From these equations, by isolating the terms i R 1 , i S 1 and i T 1 (or i R 2 , i S 2 and i T 2 ) and by following substitution of the re-written equations in (22), the following dynamics are obtained for the ZSCC:
d i 0 d t = ( v Z G 2 v O M 2 + v O M L 1 v Z G 1 ) ( L G 1 + L G 2 ) i 0 · ( R G 1 + R G 2 ) ( L G 1 + L G 2 )
In this equation, the terms R G 1 , R G 2 , and L G 1 , L G 2 are the resistance and inductance of each GSC, respectively. As for the terms v O M L 1 and v O M L 2 , they denote the CMVs generated by LSC1 and LSC2, respectively. As previously mentioned, since the neutral leg connects the load neutral point to the middle point of the respective DC bus, the LSC CMVs are directly obtained using the neutral leg switching state and the DC bus capacitor voltages (13). On the other side, the terms v Z G 1 and v Z G 2 are obtained for the GSCs through the respective converter pole voltages, which are also obtained using the converter switching state and DC bus capacitor voltage. Hence, these terms are for a given GSC given by
v Z G = v R M + v S M + v T M 3 .

3. Proposed UPS Systems Controller

The control techniques developed for the paralleled UPS systems are described in this section. The control design is the same for both systems, meaning that the information presented in this section is valid for any UPS, except when indicated. Hence, as each UPS has the same control principle, to avoid redundancy, only the schematic representation of the UPS1 controller is demonstrated with detail in Figure 2.
This figure indicates the equations associated with the main stages of both UPS controllers: current references calculation, system state prediction at samples k + 1 and k + 2 , and converter cost function minimization. As described in Section 3.1, a delay of one sample is considered between signal measurement and control actions. In this schematic, the variables that need to be shared between UPS1 and UPS2 controllers are also indicated.
To improve the overall system performance without a significant increase in the strategy computational burden, a cooperative principle similar to the proposed in [3] is adopted at two levels: within a UPS controller and between controllers of the two UPS systems. Within the controller of a UPS, the switching state to be applied on the respective LSC is the first to be selected. In this way, this selection is made, taking into consideration only its effect on the respective UPS. However, to select the control action for the GSC, the switching state already selected for the LSC is taken into account. As for the cooperation principle between the two UPS systems, it is used to increase the effectiveness of ZSCC elimination as demonstrated during the next sections.
In paralleled UPS systems, each UPS is usually controlled using an independent control platform. This typically poses several difficulties in achieving real-time communication between UPS controllers. Hence, in the proposed control schemes, this is taken into account, and only the required variables are shared between UPS controllers.

3.1. Controller Delay Compensation

As used in [2,3,26] a delay of one control sampling time is considered between measurements and converters switching state update. Hence, at sample k, all relevant signals for UPS controllers are measured. Next, a set of required variables at sample k + 1 is predicted, considering the present switching states that were applied to the converters at sample k. This k + 1 system state prediction is necessary to evaluate the control variables associated with a given converter at k + 2 for all possible converter switching states. The switching state that leads to the minimization of a converter cost function is chosen and applied to the respective converter at sample k + 1 , after which a new control cycle starts.
For k + 1 prediction, the forward Euler approach is applied in the mathematical models previously described. Hence, from (4), (5), (15), (16) and (24), a UPS input-current space vector, DC capacitor voltage unbalance, LSC phase currents, load phase voltage, and ZSCC at k + 1 are, respectively, predicted through the following equations:
i ¯ g p [ k + 1 ] = 1 R G T s L G i ¯ g [ k ] + T s L G v ¯ s [ k ] T s L G v ¯ g [ k ] ,
Δ v C [ k + 1 ] = Δ v C [ k ] + T s C D C ( i M L [ k ] i M G [ k ] ) ,
i L X p [ k + 1 ] = 1 R L T s L L i L X [ k ] T s L L v l o a d X [ k ] + v X M [ k ] v O M [ k ] ,
v l o a d X p [ k + 1 ] = v l o a d X [ k ] + T s C e q ( i L X 1 + i L X 2 i l o a d X ( t o t a l ) ) [ k ] ,
i 0 p [ k + 1 ] = i 0 [ k ] · 1 + T s · R G 1 + R G 2 L G 1 + L G 2 + T s · ( v Z G 2 v O M L 2 + v O M L 1 v Z G 1 ) [ k ] L G 1 + L G 2 .
In these equations, T s denotes the control sampling time. Equations (28) and (29) are calculated for all load-side phases X, with X = { A , B , C } ; the term C e q denotes the equivalent load-side filter capacitance, defined in Section 3.2. For the GSCs controllers, the predicted grid voltage at sample k + 1 is given by
v ¯ s p [ k + 1 ] = v ¯ s [ k ] · e j 2 π f g r i d T s ,
where f g r i d corresponds to the grid voltage frequency.

3.2. LSC Current Reference Generation

The load-side converter references are generated, with the strategy proposed in [3] as the basis. This strategy considers an equivalent load-side filter capacitance, which, in the case of the two paralleled UPS systems, is given by
C e q = C L 1 + C L 2 .
To ensure the load voltage, the current that is injected into this capacitor is controlled. In turn, since in terms of the load voltage only the total current in the capacitor is required to be ensured, distributing this current in a controlled fashion between UPS systems allows one to obtain a controlled load-sharing condition. Hence, from (16) and by using the backward Euler approach, the total current that the UPS systems need to inject into C e q to track the voltage reference v l o a d X * is given by
i L ( t o t a l ) X * [ k + 2 ] = i l o a d ( t o t a l ) X [ k + 2 ] + C e q T s ( v l o a d X * [ k + 2 ] v l o a d X p [ k + 1 ] ) .
where i L ( t o t a l ) X * [ k + 2 ] is the total current reference that needs to be injected in the equivalent capacitor and i l o a d ( t o t a l ) X [ k + 2 ] denotes the load current absorbed by the phase X load. For simplicity, given that the load currents have a small variation during a sampling time, d i l o a d / d t 0 , and the following simplification is made: i l o a d ( t o t a l ) X [ k + 2 ] = i l o a d ( t o t a l ) X [ k ] . The proportion of the total reference current that each UPS needs to supply to the load is defined using the coefficients λ 1 and λ 2 , respectively. Thus, λ 1 is the proportion of the total current reference that UPS1 should track, and λ 2 is the proportion of that current assigned to UPS2 ( λ 2 = 1 λ 1 ). In this way, the converter current references for each LSC ( i L 1 X [ k + 2 ] * and i L 2 X [ k + 2 ] * ) are, respectively, calculated by multiplying λ 1 and λ 2 by i ¯ L ( t o t a l ) X * [ k + 2 ] .

3.3. GSC Current References Generation

To obtain the GSC current references for both UPS systems, the active power balancing within the respective UPS system is firstly calculated. Hence, the power reference, denoted as P g r i d * is obtained by using the following equation:
P g r i d * = ( P g r i d P G ) + P L + P c h a r g e * .
where P g r i d denotes the active power that flows from the grid into the respective GSC; the term P G corresponds to the power that the DC bus absorbs from the GSC, whereas the term P L denotes the power drawn from the DC bus by the LSC. The power losses in the GSC are represented by the difference P g r i d P G . Finally, the term P c h a r g e * is the power that is needed to discharge/charge the DC bus voltage to the given reference value considering a time horizon of Nth samples [26].
After the calculation of P g r i d * , the GSC current references in α β reference frame are obtained through
i ¯ g * [ k + 2 ] = 2 3 · P g r i d * | v ¯ s | · e j ( v ¯ s + 2 π · 2 f g r i d T s ) .
In this equation | v ¯ s | and v ¯ s are, respectively, the amplitude and phase of the grid voltage vector, obtained using a PLL that extracts information from the grid voltage of every control sampling time. Since the converters optimization is made for sample k + 2 , the term v ¯ s needs to be summed to 2 π · 2 f g r i d T s in order to obtain the GSC current references at sample k + 2 .

3.4. Load-Side Converter Controller

In the proposed control strategy, each LSC must fulfill a set of three objectives:
  • Tracking of the LSC current references (ensuring a high-quality load voltage waveform and load power distribution);
  • Elimination of the circulating current;
  • Balancing of the DC bus capacitor voltage.
For the first objective, the output converter current needs to be predicted at sample k + 2 . To achieve that, the following equation is used:
i L X p [ k + 2 ] = 1 R L T s L L i L X [ k + 1 ] T s L L v l o a d X [ k + 1 ] + v X M [ k + 1 ] v O M [ k + 1 ]
where X { A , B , C } . In this equation, v X M [ k + 1 ] and v O M [ k + 1 ] correspond to the pole voltage of phase X and converter CMV at sample k + 1 , which are the variable terms in the equation. These terms directly depend on the switching state being evaluated to be applied to the converter at sample k + 1 .
The proposed control strategy was developed taking into account its implementation in independent control platforms. This means that a UPS controller only knows the switching states to be applied at k + 1 in its UPS converters. Hence, despite the ZSCC dynamics at k + 2 being dependent on the switching states of all UPS converters at sample k + 1 , the ZSCC prediction at k + 2 within each UPS controller only takes into consideration the terms generated by the converters of the respective UPS. Moreover, since the LSC control action within a UPS controller is the first to be calculated, the predicted ZSCC by UPS1 and UPS2 controllers only contains the CMV terms of their LSCs. Thus, the predicted ZSCCs considered to select the switching states for LSC1 and LSC2 are, respectively, given by
i 0 L 1 p [ k + 2 ] = i 0 [ k + 1 ] + T s i 0 [ k + 1 ] ( R G 1 + R G 2 ) + v O M L 1 [ k + 1 ] L G 1 + L G 2
i 0 L 2 p [ k + 2 ] = i 0 [ k + 1 ] + T s i 0 [ k + 1 ] ( R G 1 + R G 2 ) v O M L 2 [ k + 1 ] L G 1 + L G 2
To achieve the third objective, the DC capacitor voltage unbalance at sample k + 2 is predicted as follows:
Δ v C [ k + 2 ] = Δ v C [ k + 1 ] + T s C D C i M L [ k + 1 ] ,
In this equation, it can be seen that since the LSC control action is the first to be computed, only the impact of the LSC is considered through the term i M L [ k + 1 ] .
With the FCS-MPC approach, for each converter objective, a partial cost function is defined. Hence, the objective function associated with LSC current references to tracking, ZSCC elimination, and DC bus capacitors’ balancing are, respectively, given by
g i L = X = A , B , C | i L X * [ k + 2 ] i L X p [ k + 2 ] | ,
g z L = | i 0 L p [ k + 2 ] | ,
g b a l L = | v C 1 p [ k + 2 ] v C 2 p [ k + 2 ] | ,
These three partial objective functions are combined in a global LSC cost function, which is given by
G L S C = g i L · W i L + g z L · W z L + g b a l L · W b a l L .
This equation combines each partial function with their respective weighting factor W x that allows one to define the importance of the objectives and provide magnitude correction between the controlled variables. This global cost function is evaluated for the 81 possible LSC switching states, in each UPS controller.

3.5. Grid-Side Converter Controller

Each GSC must also fulfil three objectives, two of them being common to the LSCs. These objectives are as follows:
  • Tracking of converter current references so that the respective UPS absorbs the required power from the grid with low harmonic distortion and the approximate unit power factor;
  • Suppression of the circulating current;
  • Minimization of the unbalancing of the DC bus capacitor voltage.
To achieve the first objective, the input UPS current vector ( α β components) is predicted at sample k + 2 using the following equation:
i ¯ g p [ k + 2 ] = 1 R G T s L G i ¯ g [ k + 1 ] + T s L G v ¯ s [ k + 1 ] T s L G v ¯ g [ k + 1 ] ,
where v ¯ g [ k + 1 ] corresponds to the GSC voltage vector, which is the unique variable term in the equation and directly dependent on the switching state being evaluated for application in the converter at sample k + 2 .
Regarding the ZSCC elimination objective, the predicted ZSCC by UPS1 and UPS2 controllers when evaluating the switching state to be applied to the respective GSC, are given by
i 0 G 1 p [ k + 2 ] = i 0 [ k + 1 ] + T s i 0 [ k + 1 ] ( R G 1 + R G 2 ) + v O M L 1 [ k + 1 ] v Z M G 1 [ k + 1 ] L G 1 + L G 2
i 0 G 2 p [ k + 2 ] = i 0 [ k + 1 ] + T s i 0 [ k + 1 ] ( R G 1 + R G 2 ) v O M L 2 [ k + 1 ] + v Z M G 2 [ k + 1 ] L G 1 + L G 2
In these two equations, it can be seen that for the GSC control action selection, the respective UPS controller takes into account the respective LSC CMV term that was previously calculated.
For the third objective, the DC bus capacitor voltage unbalance at sample k + 2 is calculated by using
Δ v C [ k + 2 ] = Δ v C [ k + 1 ] + T s C D C ( i M L [ k + 1 ] i M G [ k + 1 ] ) ,
In this case, the effect of both converters on the DC bus capacitor voltage is considered by including the currents i M L [ k + 1 ] and i M G [ k + 1 ] in the prediction.
The partial cost function regarding the first GSCs objective is given by
g i G = | i ¯ g * [ k + 2 ] i ¯ g p [ k + 2 ] |
For the second and third GSCs objectives, the partial cost functions are calculated analogously to (41) and (42), respectively.
The global objective function that combines each GSC partial function with its respective weighting factor W x for a given GSC is given by
G G S C = g i G · W i G + g z G · W z G + g b a l G · W b a l G ,
This equation is valid for both GSCs and is evaluated for the 27 possible switching states.

4. Experimental Results

In this section, the experimental results are shown. An analysis regarding the LSC neutral leg currents is firstly demonstrated in Section 4.1. Then, the effectiveness of the proposed control strategy in eliminating the undesired ZSCC is demonstrated in Section 4.2. The robustness of the control strategy in ensuring a high-quality load voltage waveform and distributing the load between the UPS systems is demonstrated in Section 4.3. A power quality analysis is provided in Section 4.4 in which the main power quality parameters are evaluated. An analysis regarding the system dynamics when the critical load changes is presented in Section 4.5, and, finally, in Section 4.6, the system is simulated when supplying high-power loads.
Figure 3a presents a labeled picture of the main experimental setup components, namely GSCs and LSCs as well as respective filters. Figure 3b presents an electrical block diagram of the proposed UPS systems, which can be seen as a simplified version of Figure 1. This representation also contains the per phase filter parameters and the capacitance of each DC bus capacitor, which are also indicated in Table 2.
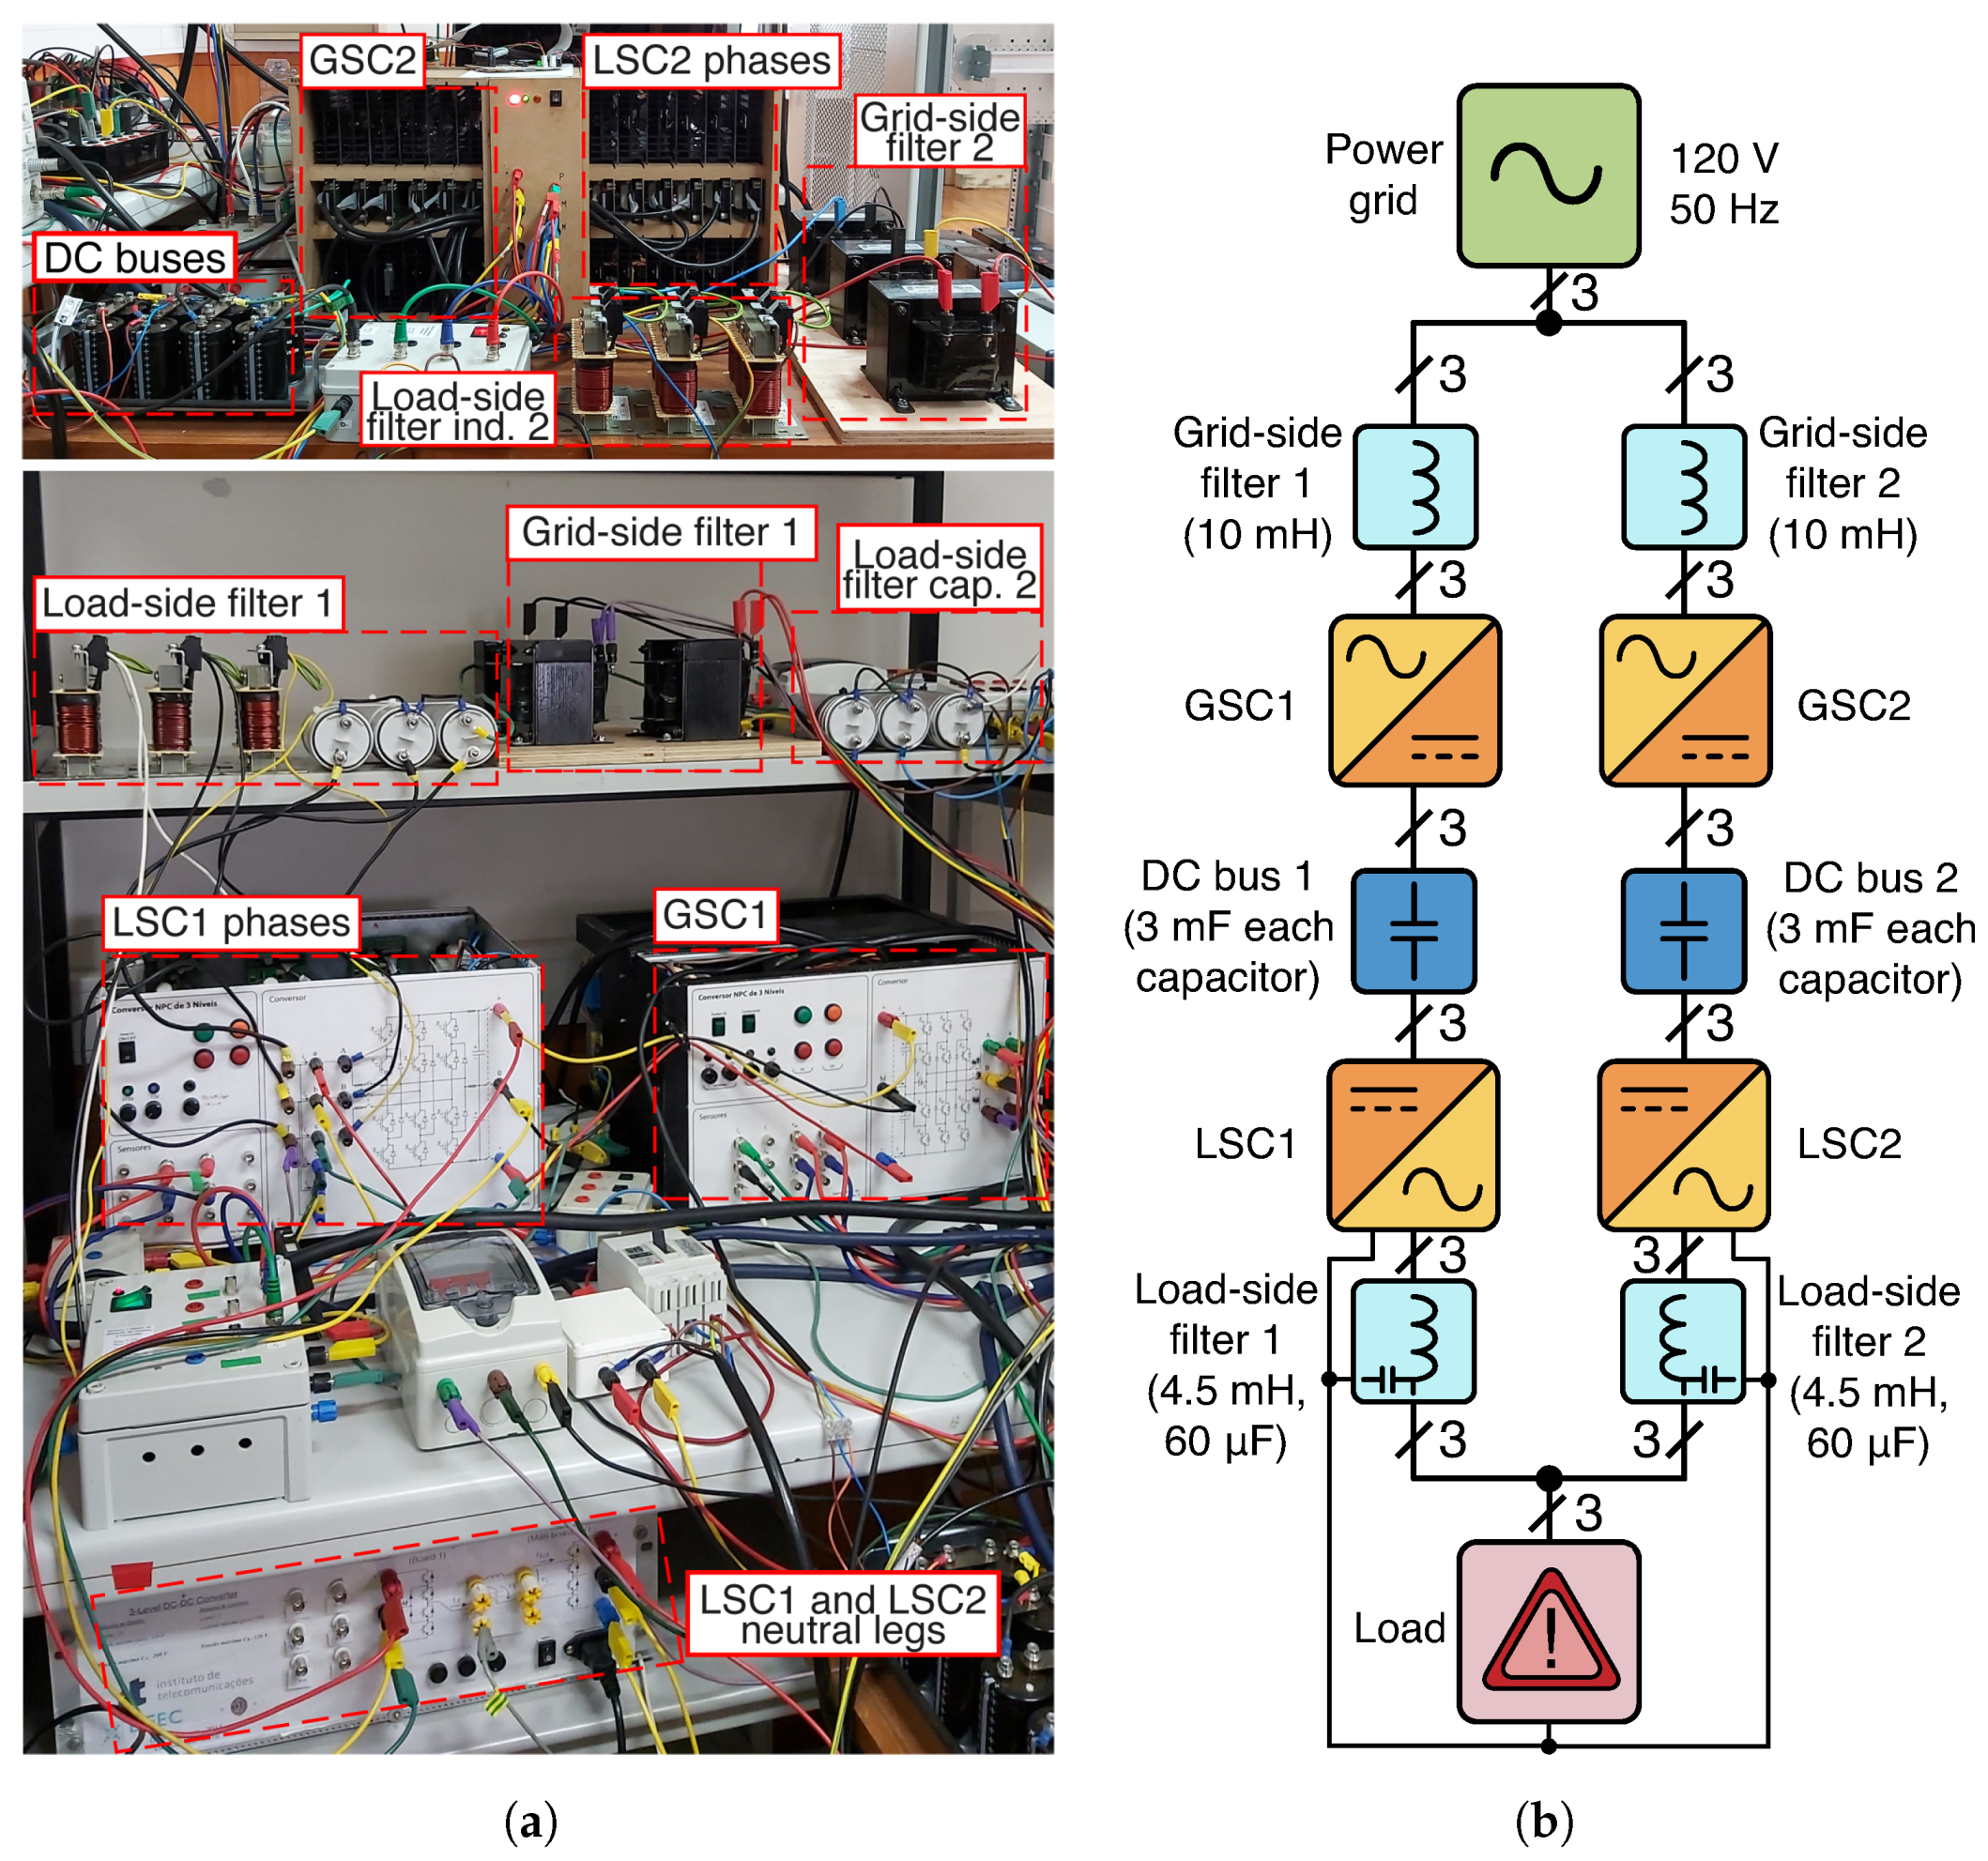
The controllers are developed in Matlab/Simulink environment and executed in a dSpace MicroLabBox control platform, which is also used for data acquisition at the same sampling rate. This platform has a dual-core PPC microprocessor as well as an FPGA. For controller execution, only the dual-core PPC microprocessor is used with the control algorithm of each UPS being assigned to a core.
The electrical parameters of the experimental tests are listed in Table 2. As this table shows, for the inductive grid-side filters, an inductance of 10 mH is considered. Each DC bus has two capacitors with an equal capacitance of 3 mF. The second order LC load-side filters contain an inductance of 4.5 mH and capacitance of 60 μ F.
The control references and weighting factors used in both UPS controllers are listed in Table 3. In order to select the control sampling time, a set of tests was made to select the minimum possible value, with which all algorithms can be executed without microprocessor overrun occurring. Hence, a sampling time of 90 μs was selected for UPS controllers. An RMS line-to-line voltage of 120 V was considered for the load-side reference voltage, whereas for the DC bus voltage, its reference was set to 220 V. All partial objective functions weighting factors were selected from empirical tests. For converter current tracking and ZSCC elimination, these values were set to 1, whereas for DC bus capacitor voltage balancing, they were set to 0.3.
For the experimental tests, different types of loads are used. For the LSC neutral leg current analysis presented in Section 4.1, a balanced linear load is used, which consists of three resistors connected to each phase ( R 33.3   Ω per phase). On the other hand, to test the robustness of the proposed techniques, in Section 4.2 and Section 4.3, a highly unbalanced load consisting of three distinct single-phase loads is used: a full-bridge rectifier feeding an RC parallel circuit ( R = 20   Ω and C = 180   μ F ) is connected to phase A; an RL load is linked to phase B ( R = 10   Ω and L = 15   mH ); and a resistor of R = 25   Ω is connected to phase C. This load configuration was also used for the power quality analysis in Section 4.4. In Section 4.5 and Section 4.6, different types of loads are used, which are explained in the respective sections.

4.1. LSC Neutral Leg Currents Analysis

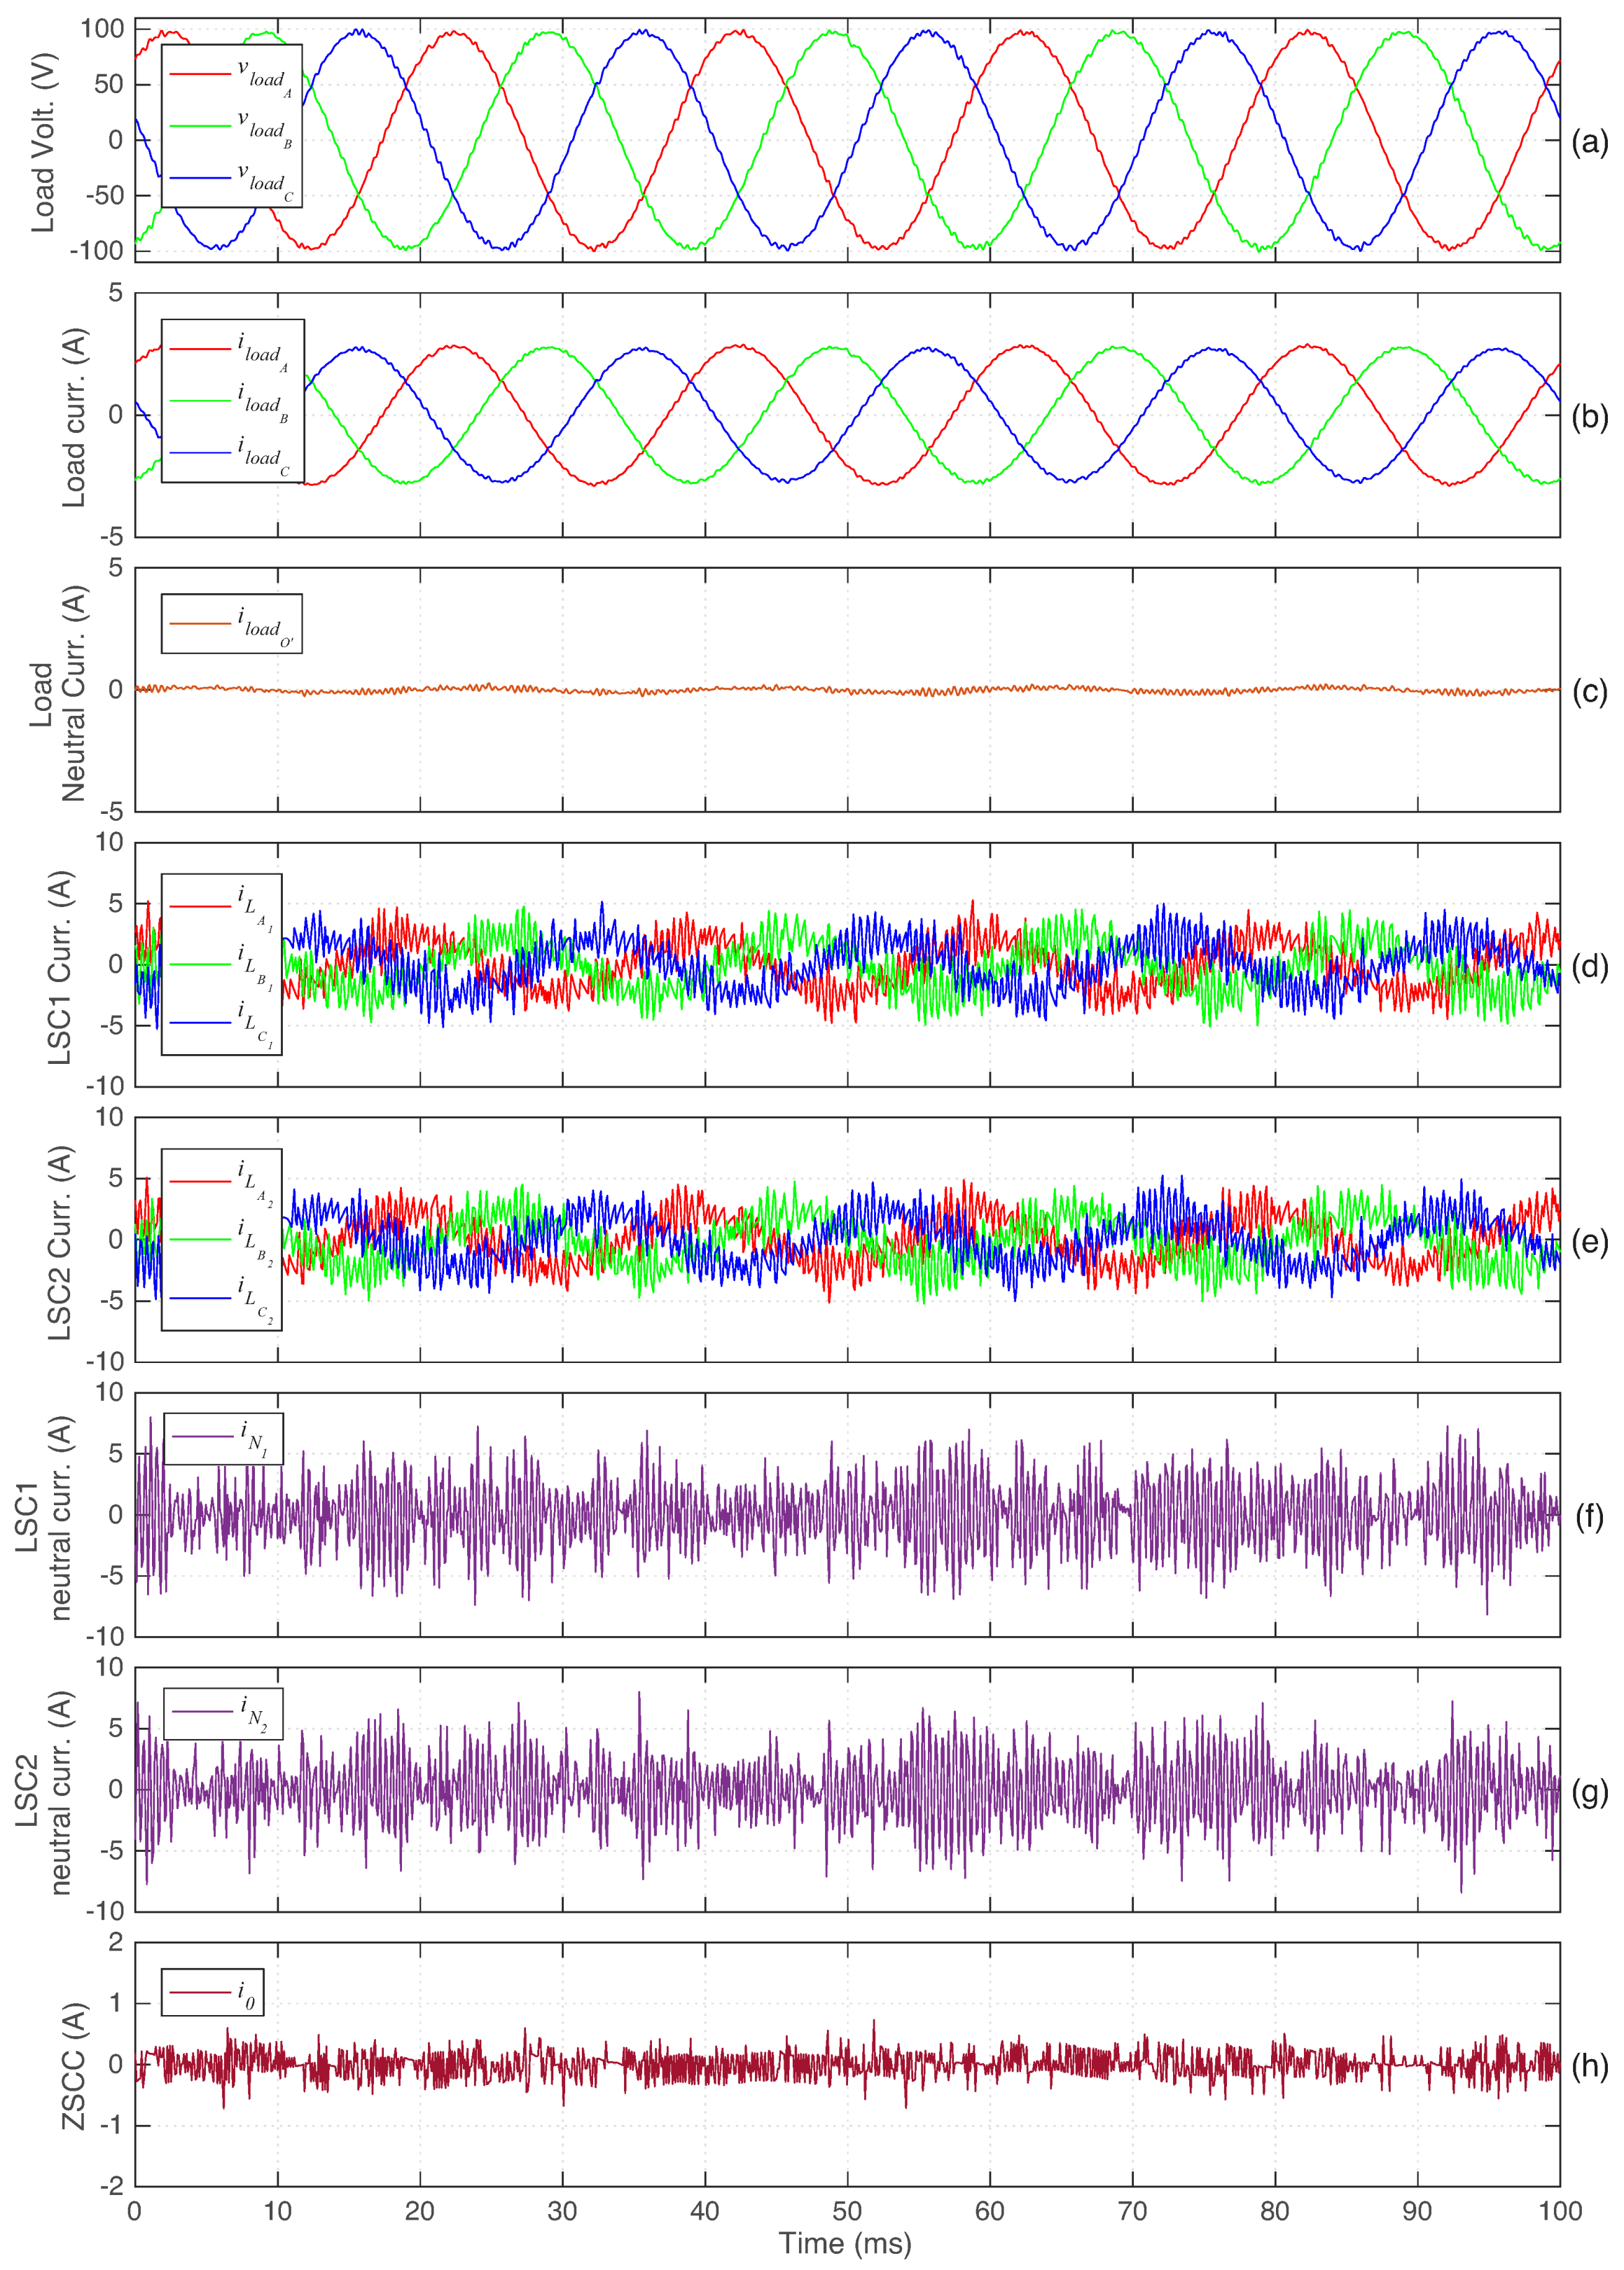
This section provides an analysis of the LSC neutral leg currents in regard to the magnitude difference that can exist between these currents and other load-side currents, namely LSC phase currents and load neutral currents. In this test, a balanced set of three single-phase linear loads is used in order to generate a practically null load neutral current, with both UPS systems supplying half of the load power ( R 33.3   Ω per phase).
Figure 4 illustrates the load voltage, the absorbed load phase currents, the load neutral current, the neutral leg current of each LSC, and the ZSCC.
Firstly, as Figure 4a shows, in these conditions, a high-quality load voltage waveform is obtained, with a THD of approximately 1.2%. With the balanced linear load connected, practically sinusoidal currents are absorbed from the UPS system with a peak value of approximately 2.5 A, as shown in Figure 4b. Hence, the load neutral current presented in Figure 4c is practically null.
Figure 4d,e show the LSC phase currents, which are directly controlled, in order to ensure the respective load phase voltage waveforms, as discussed in Section 3.4. As can be seen in these two subfigures, the LSC phase currents present a peak value of approximately 5 A, which corresponds to twice the load phase currents’ peak.
Regarding the neutral leg current of a given LSC, as demonstrated in (21), it depends on the sum of the respective LSC phase currents as well as on the ZSCC that flows between the paralleled UPS systems. Thus, since each LSC phase current is directly controlled to ensure the respective load phase voltage waveform, there can be situations in which the sum of LSC phase currents results in a higher value than that of the peak of the LSC phase currents, significantly increasing the converter neutral leg current. Moreover, from (21), it can be observed that the ZSCC can also increase the LSC neutral leg currents even more. Hence, Figure 4f,g show that despite the balanced linear load being connected to the UPS systems, with the load neutral current being practically null, the currents that circulate in the neutral legs of both LSCs are significantly different from zero, clearly reaching peak values even higher than those seen in the LSC phase currents. In the tested conditions, as demonstrated in Figure 4h, the ZSCC is controlled, consisting of a ripple current around zero and, hence, having a small effect on the neutral legs’ current values. However, when not controlled, the ZSCC can significantly increase the LSC neutral leg currents, as is demonstrated in Section 4.2.
These results show that even when supplying a balanced linear load that generates a load neutral current that is practically null, due to the required LSC control and ZSCC (21), the currents in the neutral legs of these converters can be significantly different from zero. Even though the RMS value of the neutral leg currents is significantly smaller than that of the LSC phase currents, these can reach significantly higher peak values. This occurs even when the load power is equally divided between the UPS systems.
This analysis allows the conclusion that the semiconductors to be used in the neutral legs of the proposed paralleled UPS system topology must be able to support higher currents than the semiconductors of the LSC phase legs.

4.2. Zero-Sequence Circulating Current Elimination

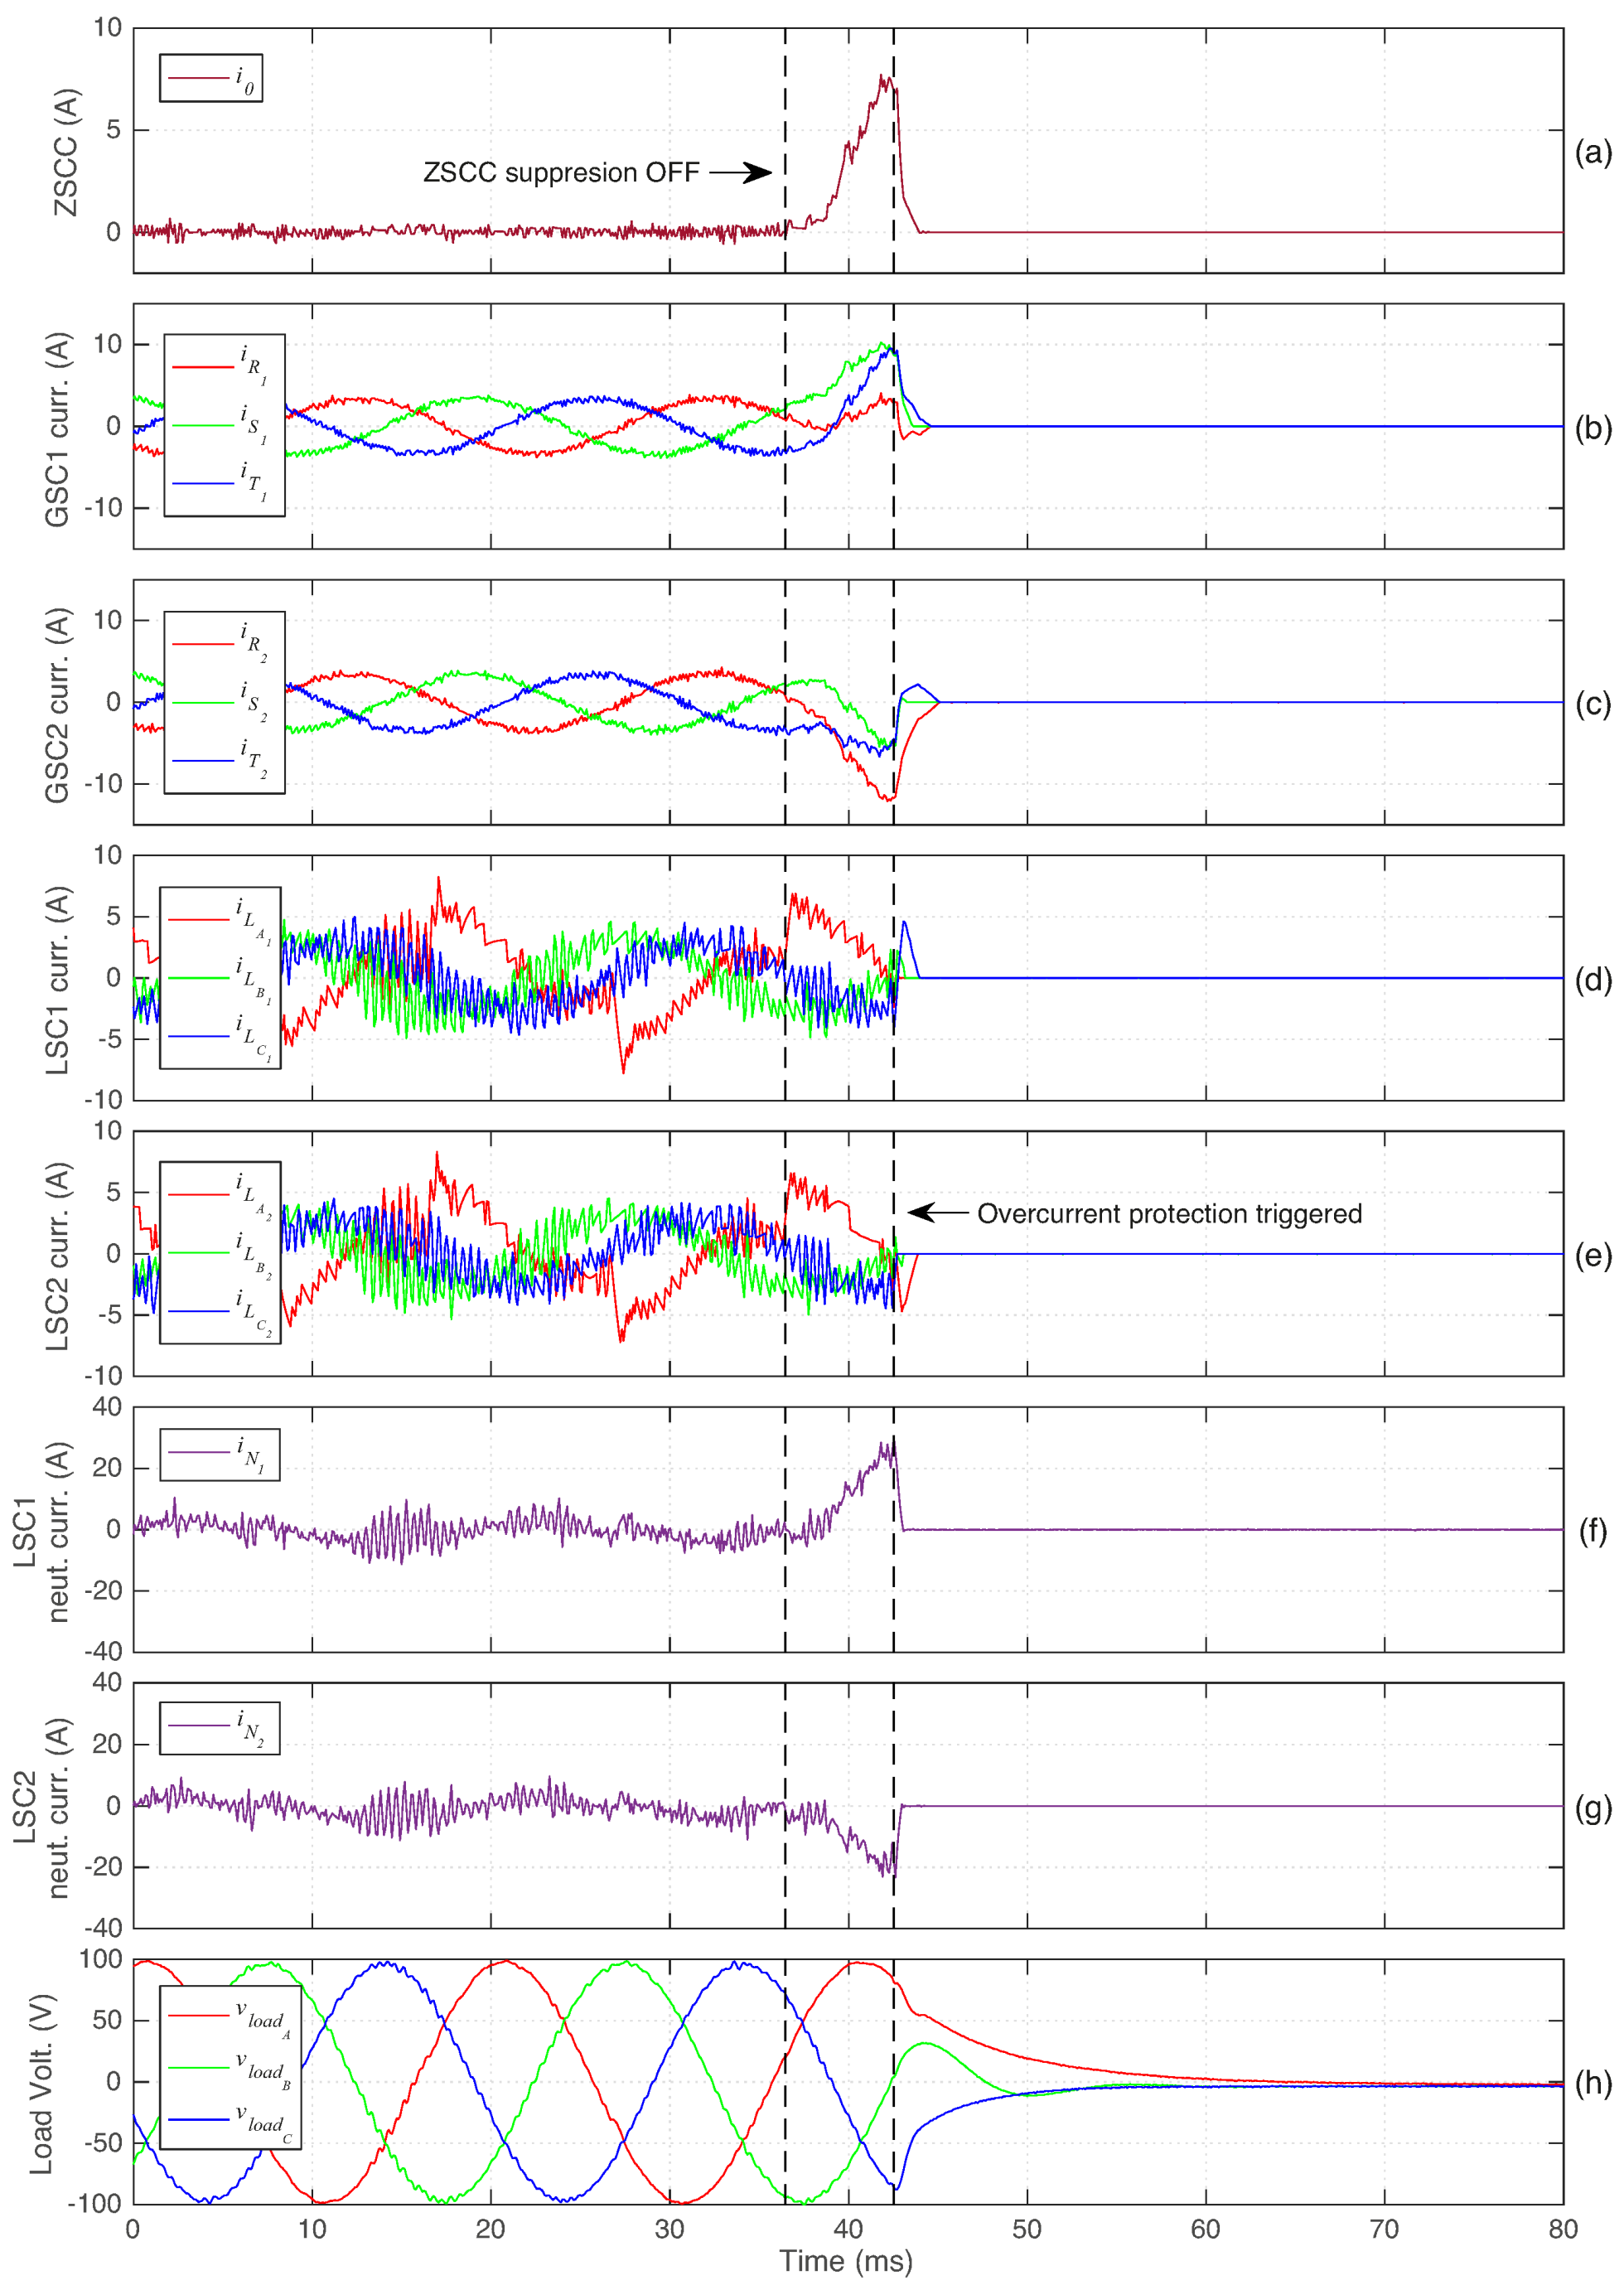
Figure 5 shows the importance of ZSCC elimination as well as the effectiveness of the proposed strategy in suppressing this undesired circulating current. This figure shows the ZSCC, input UPS systems currents, LSC phase currents, LSC neutral leg currents, and the generated load voltage. In this test, the highly unbalanced non-linear load is used, with both UPS systems supplying half of the power to this load. Until t 36 ms, the ZSCC suppression technique is active, and then it is deactivated. This means that the ZSCC is considered as a converter objective only until that instant, and after that, the elimination of this current is no longer a control objective ( W z G = W z L = 0 ). Hence, from Figure 5a, it can be observed that after ZSCC suppression deactivation, the ZSCC starts to rise, reaching a maximum absolute value of roughly 7.5 A. Hence, as presented in Figure 5b,c both UPS input currents are significantly affected, becoming highly distorted and reaching higher values compared to those observed while the ZSCC elimination mechanism is active.
Figure 5d,e demonstrate that the existence of a considerable circulating current has practically no impact on the LSC phase currents. However, by observing the neutral leg currents in both UPS systems, in Figure 5f,g, it can be seen that their magnitude is significantly increased. When the LSC1 neutral leg current reaches 30 A ( t 43 ms), the corresponding overcurrent protection is triggered (30 A is the predefined maximum admissible current at the converter neutral legs). It can be seen that this is a significantly higher value in comparison with the LSC neutral currents that were observed while ZSCC elimination was active.
To fully protect the prototype, when overcurrent protection is triggered, all converters of both UPS systems are switched off.
As Figure 5h shows, at t 43 ms, all power converter IGBTs are deactivated, and as a consequence of this, the load voltage is no longer ensured. In an industrial or medical application, this would lead to a supply interruption of extremely important loads, which could result in negative social and economic consequences.
These results show the importance of ZSCC elimination as well as the effectiveness of the proposed control technique in its suppression.

4.3. System Analysis for Different Load-Sharing Conditions

The capability of the proposed control techniques in simultaneously ensuring a high-quality load voltage and distributing the load power between the two UPS systems, while keeping their overall stability, is shown in Figure 6 and Figure 7.
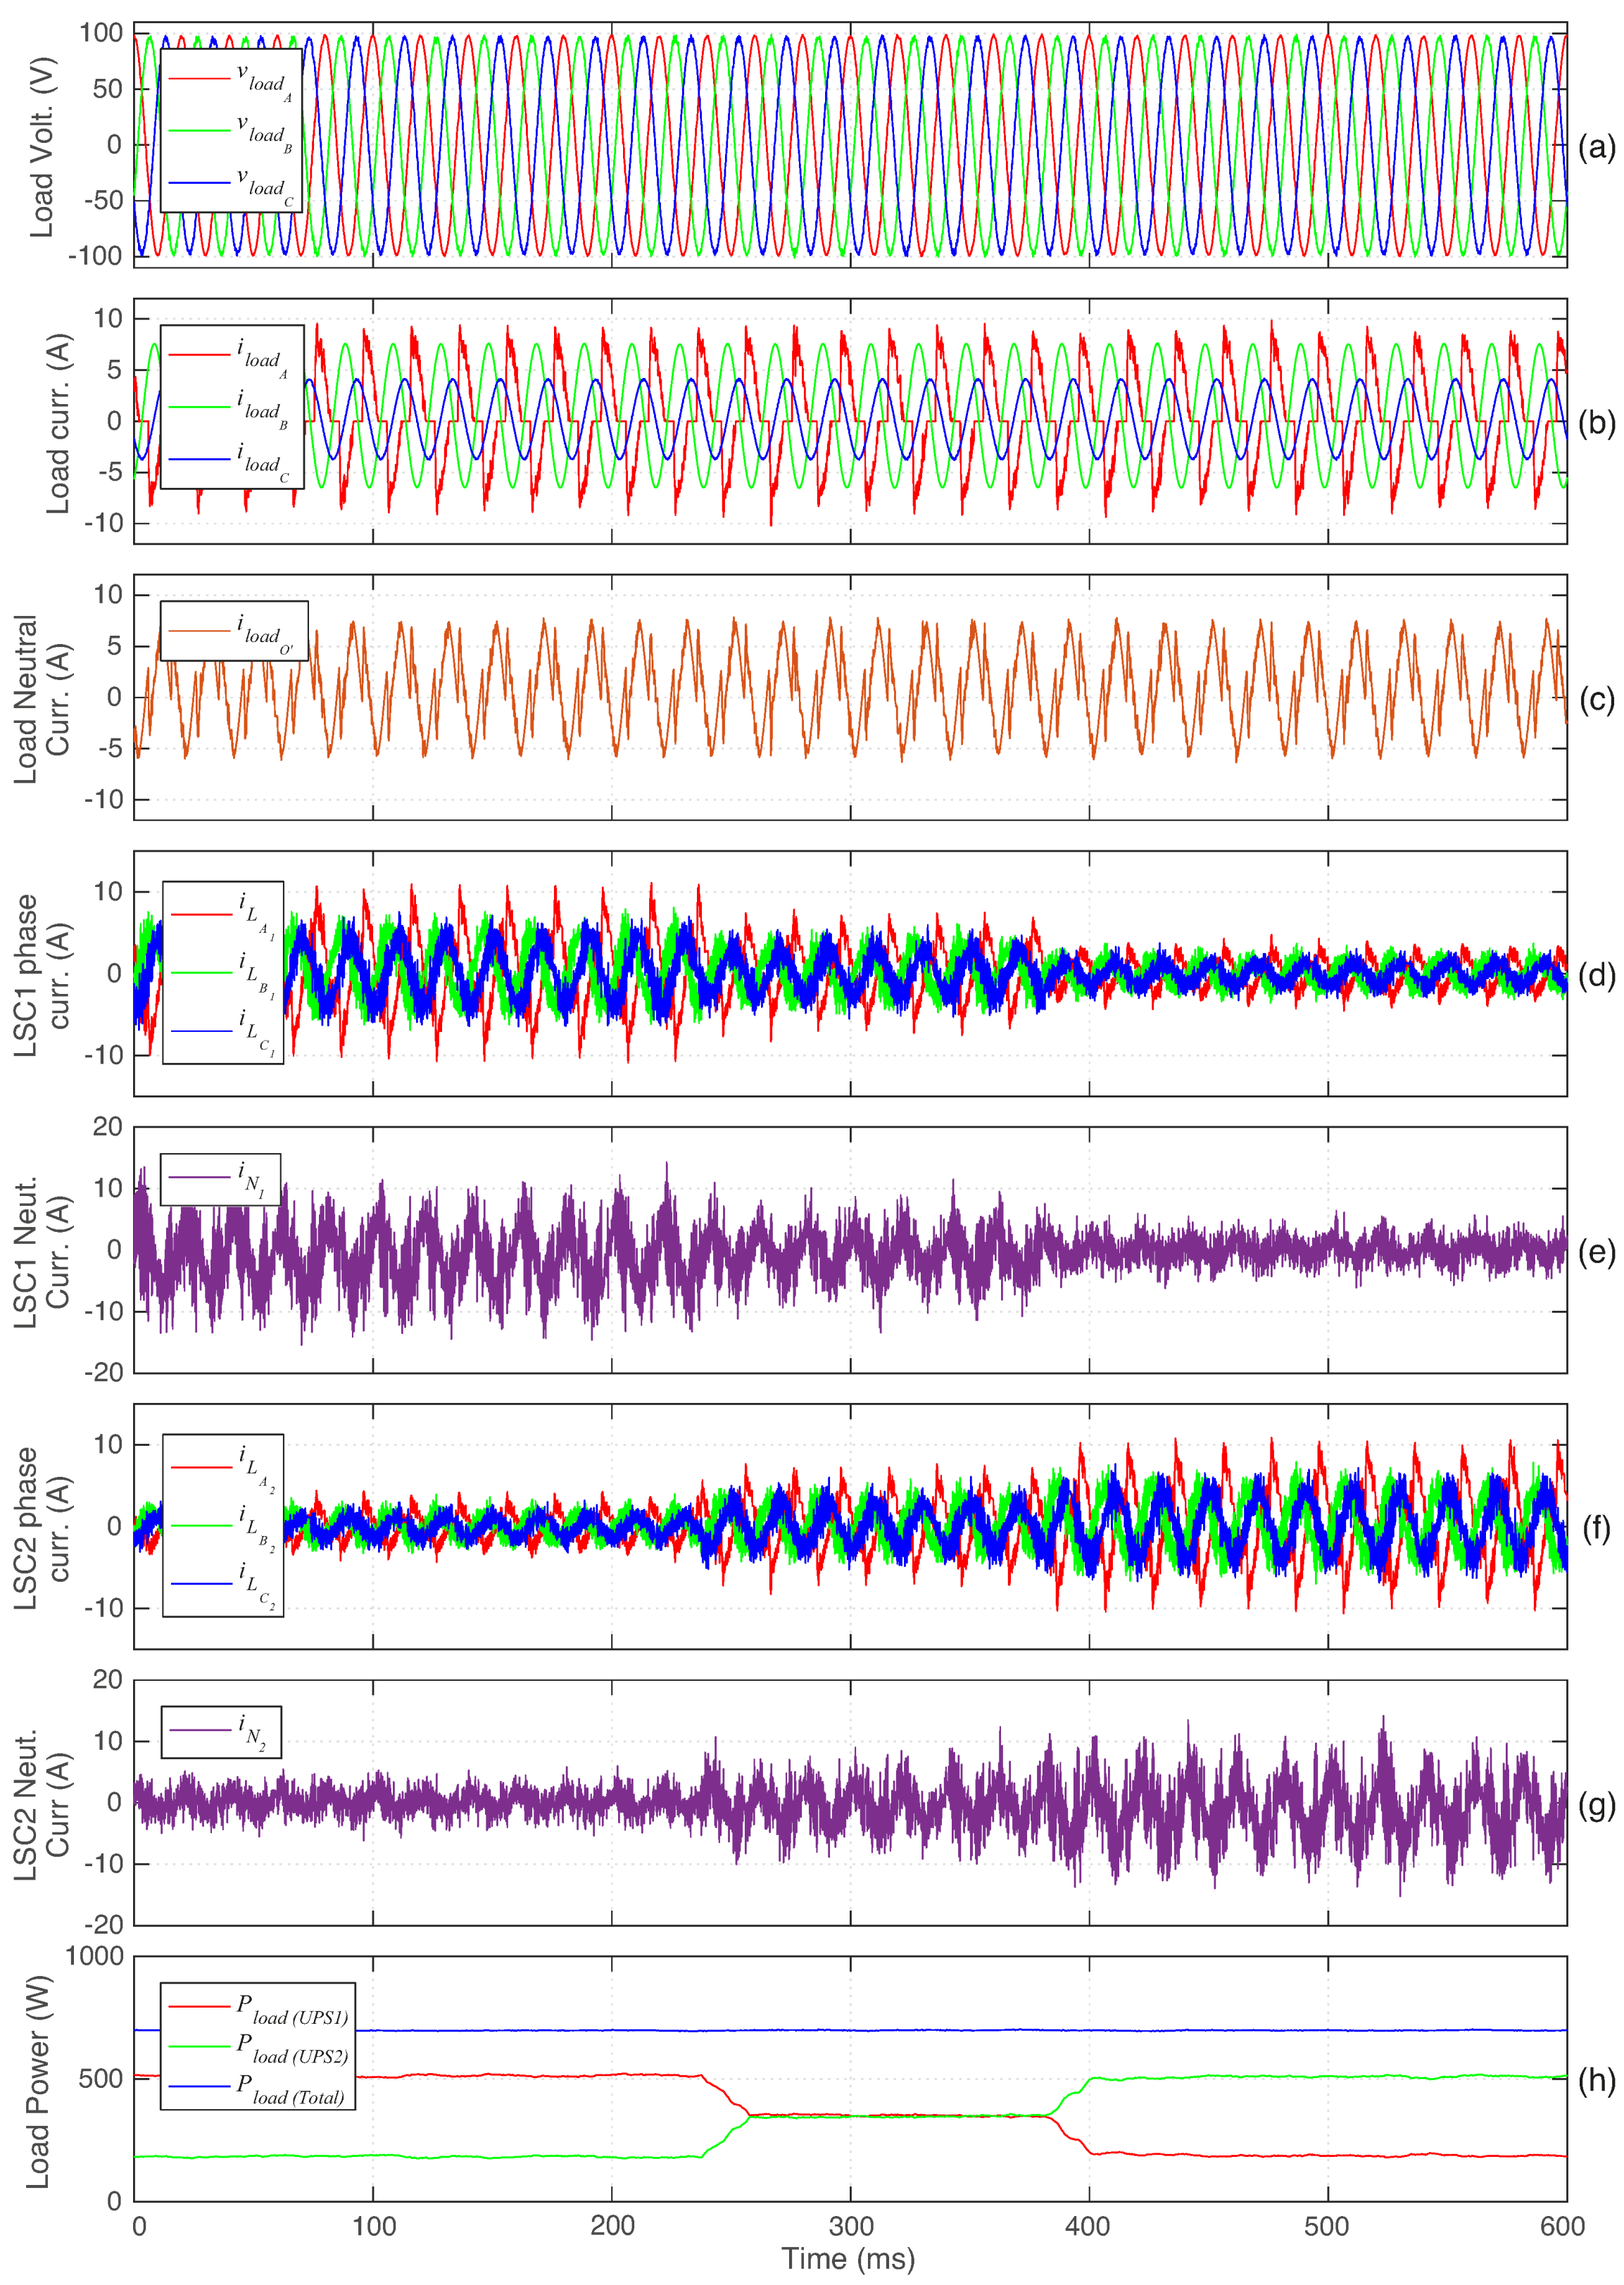
The load used in this section is the same as the load used in the previous section: a full-bridge rectifier feeding an RC parallel circuit ( R = 20   Ω and C = 180   μ F ) is connected to phase A, an RL load is linked to phase B ( R = 10   Ω and L = 15   mH ), and a resistor of R = 25   Ω is connected to phase C.In these results, initially, UPS1 provides 75% of the load power, whereas UPS2 supplies the remaining 25%. Then, the percentage of the load power assigned to each UPS is determined to be 50%, and, finally, the power assigned to UPS1 is decreased to 25% with the UPS2 supplying the remaining 75%.
Figure 6 presents the generated load voltage, load phase currents, load neutral current, LSC phase currents, LSC neutral leg currents, and, finally, the average UPS system output power and total power, respectively.
Firstly, from Figure 6a, it is observed that a high-quality load voltage waveform is permanently ensured by the paralleled UPS systems during all different load-sharing conditions with a THD of approximately 1.2%. It is worth mentioning that this THD value is below the maximum value (8%) recommended by the IEC Standard 62040-3. The currents absorbed by the three-single phase loads connected to the UPS systems (full-bridge rectifier feeding an RC circuit + RL load + R load) are presented in Figure 6b. From this subfigure, it can be observed that for the different load power distributions, even when the load-sharing condition changes, the total current absorbed by the load remains practically unchanged.
The load neutral current, which corresponds to the sum of all load phase currents, is presented in Figure 6c. It can be seen that this current corresponds to a very irregular waveform with a peak value of approximately 7 A.
Figure 6d presents the LSC1 phase currents, whereas Figure 6e demonstrates the current in the neutral leg of this converter. From Figure 6d, it can be seen that the magnitudes of the LSC1 phase currents clearly change for the different tested load-sharing conditions. Similarly, from Figure 6e, it is observed that as the UPS1 supplies a lower value of power to the load, the current that flows in the converter neutral leg also decreases. In Figure 6f,g, a similar behavior is observed for the LSC2 phase and neutral leg currents. In this case, as the power supplied by UPS2 to the load is increased, the LSC2 phase currents become higher. In turn, the neutral leg current of this converter also increases, as demonstrated in Figure 6g.
Once again, from Figure 6e,g, it can be seen that the neutral leg currents reach higher peak values than the LSC phase current values. For example, note that when a given UPS supplies 75% of the load power, the peak value observed in the LSC phases is roughly 10 A. The peak value reached by each LSC neutral current is clearly higher than this value (≈ 15   A ). This is also verified for the other load-sharing conditions, in which the neutral leg currents reach a higher value than the LSC phase current peak. Hence, these results show that the LSC neutral leg current peaks are higher than the LSC phase current peaks, even for asymmetric load power distributions.
From Figure 6d,f it can be observed that the output power of each UPS rapidly changes to the new target value, with slower changes being observed in the calculated average powers presented in Figure 6h, only because a time horizon of one period (20 ms) is required in their calculation. Thus, after roughly only 20 ms, all presented average powers stabilize at the new value.
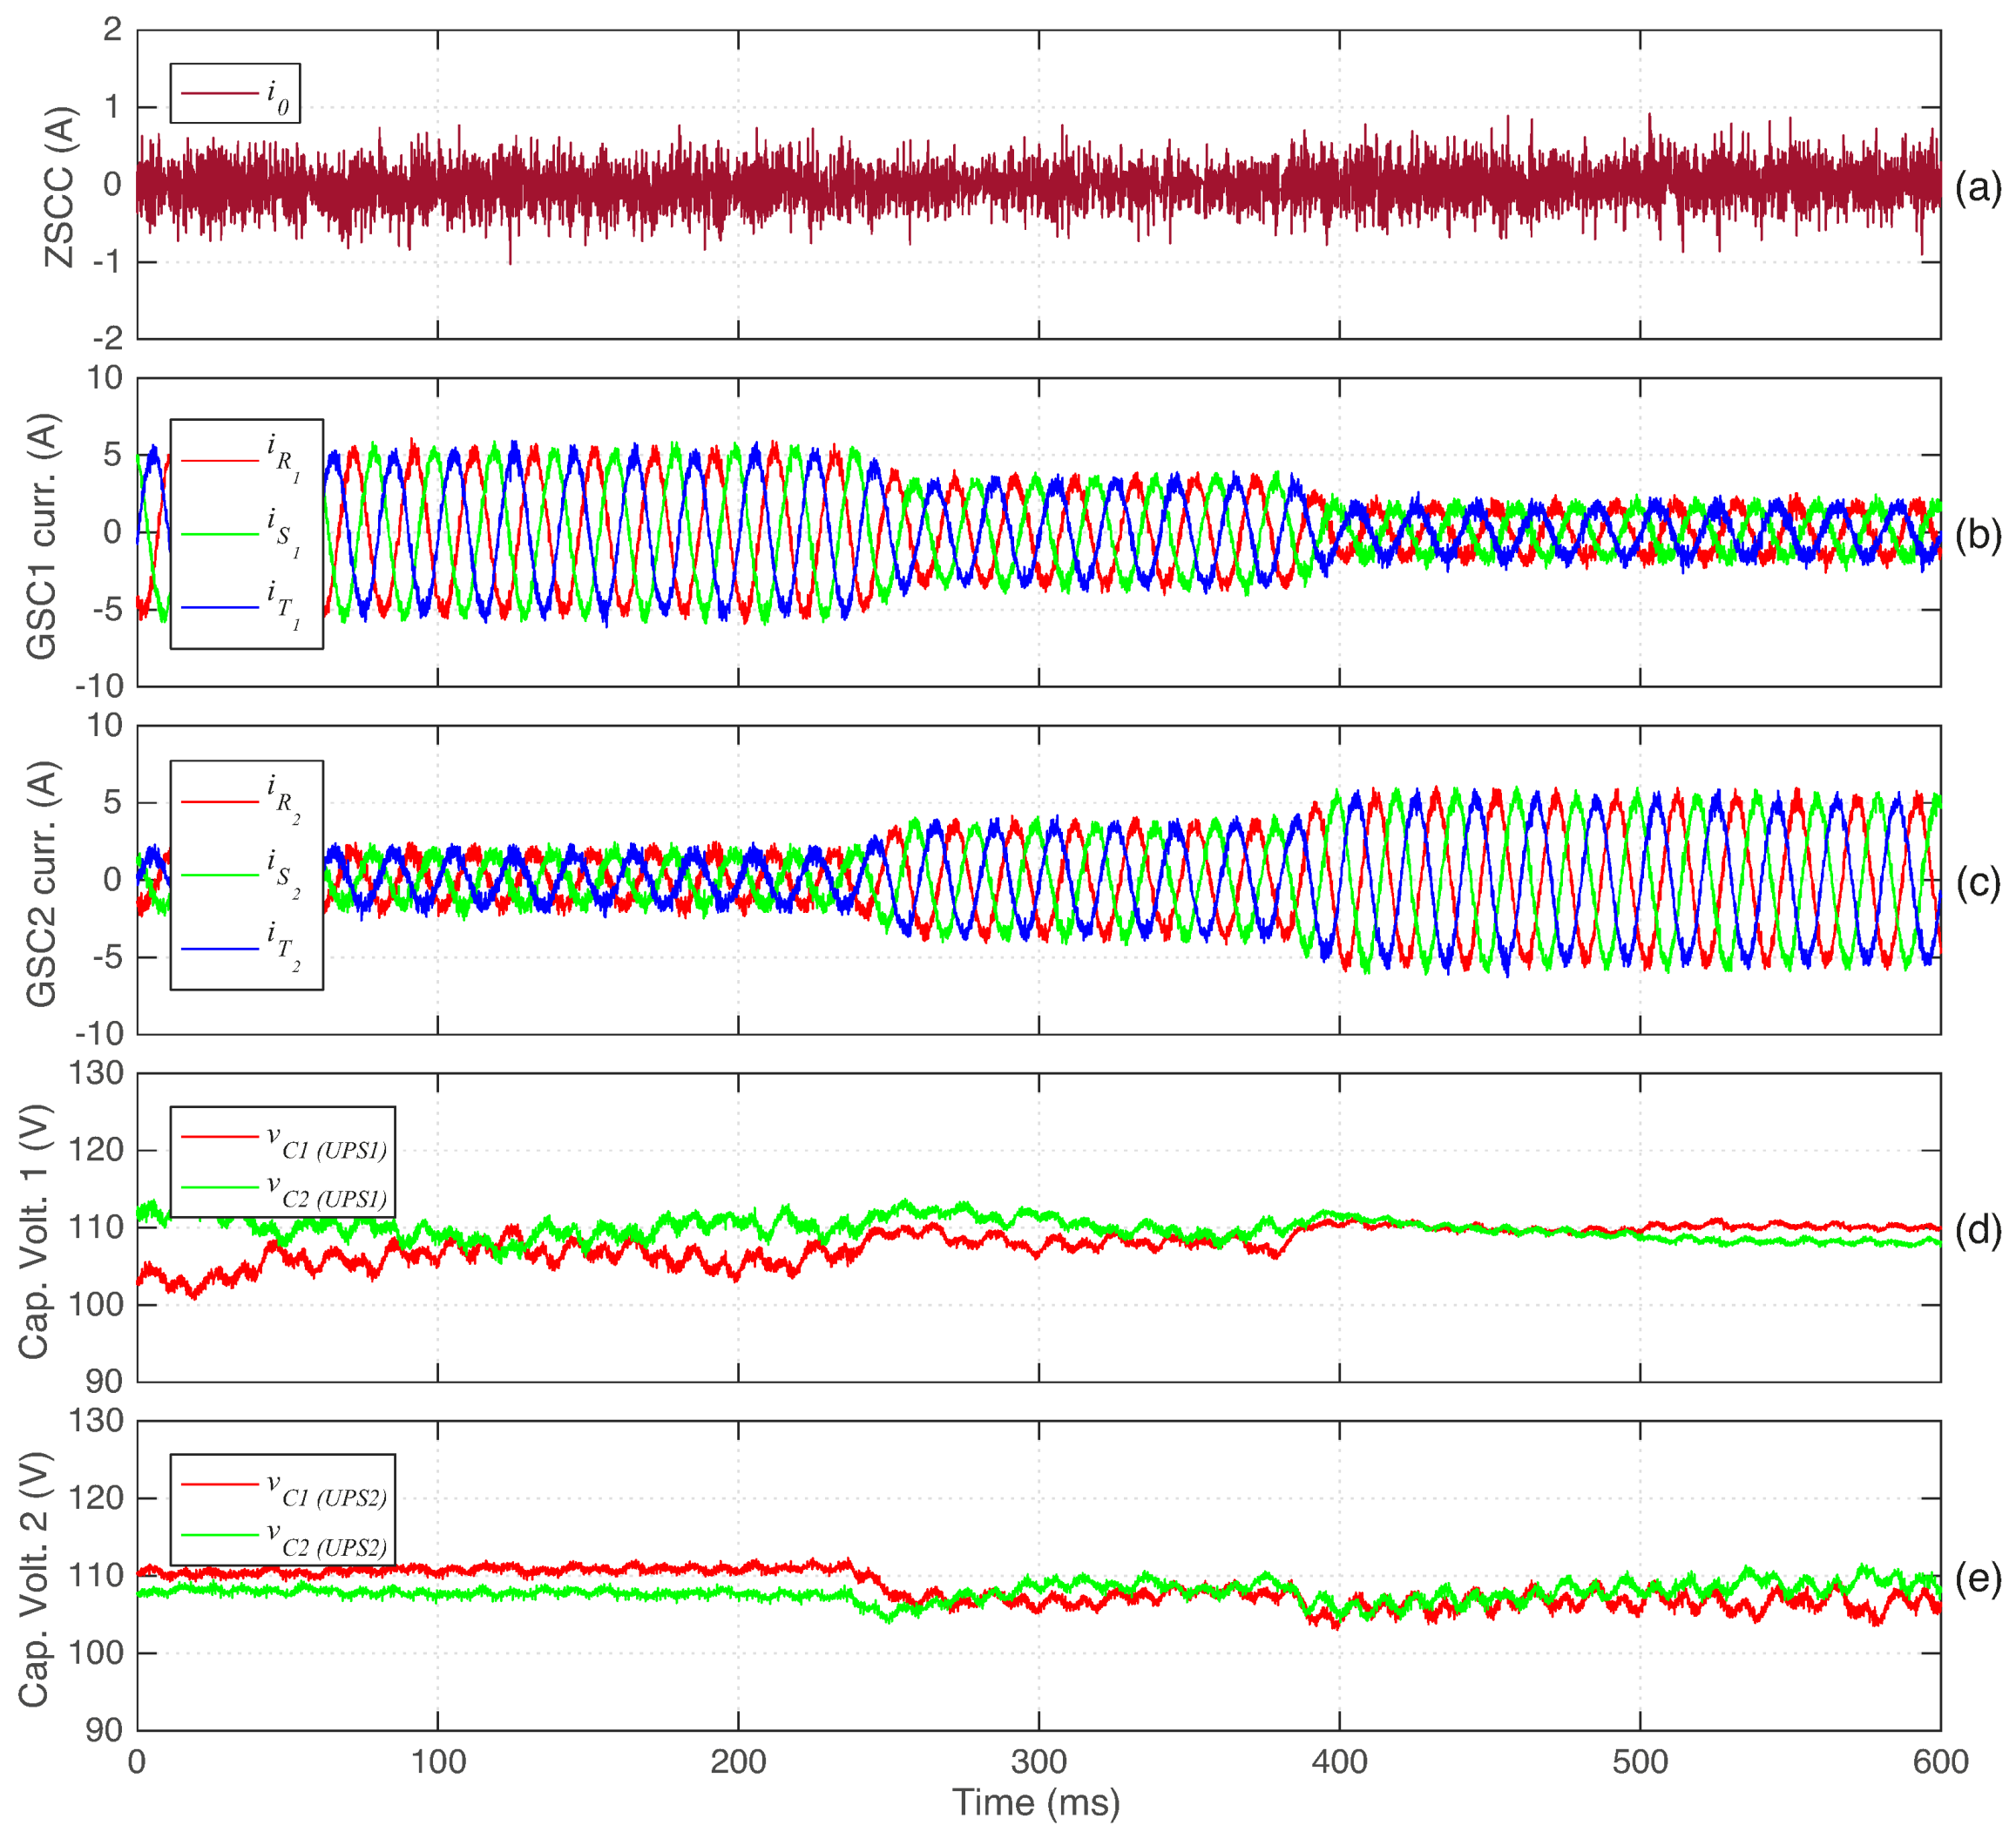
Figure 7 presents the ZSCC, the input currents of both UPS systems, and the DC buses capacitor voltage for the same load-sharing conditions presented in Figure 6.
Firstly, from Figure 7a, it is observed that the ZSCC is effectively suppressed, presenting a ripple near zero for any load-sharing condition. With the ZSCC eliminated, the UPS systems have correct operation. Hence, as shown in Figure 7b,c both UPS systems present near-sinusoidal input currents for the different load-sharing conditions, even supplying a highly unbalanced load.
During all these power distribution changes, as shown in Figure 7d,e, the DC bus capacitor voltage balancing is ensured in both UPS systems, which is also crucial for the correct UPS system operation. Moreover, even for different load-sharing conditions, the UPS controllers are able to maintain the voltage of both DC buses near the defined reference of 220 V.
These results show that the proposed techniques allow the UPS systems to simultaneously supply a highly unbalanced load, with the absorbed load power being distributed between these systems, a high-quality voltage waveform being ensured, and the undesired ZSCC being effectively eliminated.

4.4. Power Quality Analysis

In this section, a power quality analysis is presented for the proposed system. When UPS systems are installed in a given facility, they must respect certain power quality requirements, namely regarding the harmonic distortion of the generated load voltage and current that the UPS absorbs from the power grid. Typically, the load voltage generated by a UPS system must present a maximum THD value lower than 8% as defined in the IEC Standard 62040-3. On the other hand, the absorbed grid current should have low harmonic distortion and therefore low THD value.
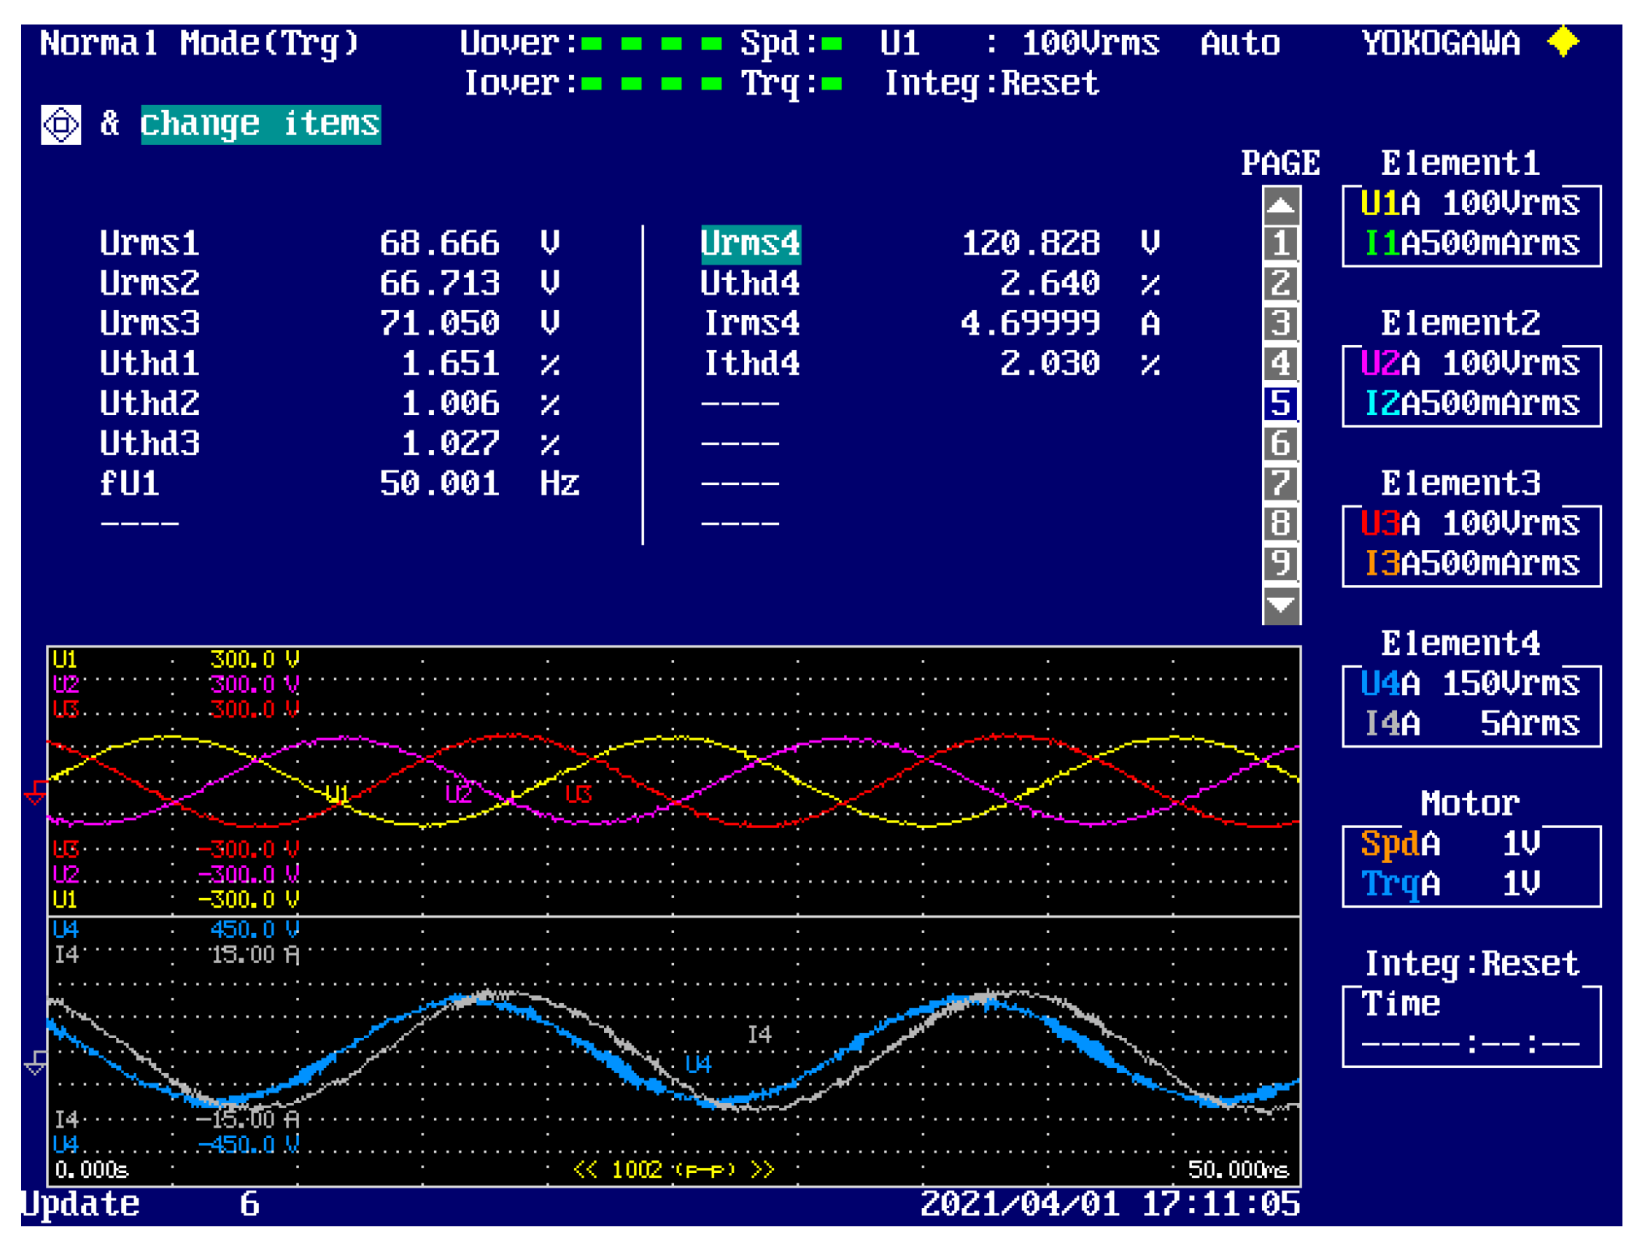
All presented results in this section were obtained using a YOKOGAWA WT3000 power analyzer. Figure 8 shows power analyzer results when both UPS systems supply half of the power to the load used in Section 4.2 and Section 4.3. In the figure, the three generated load phase voltage waveforms (upper three), a grid line-to-line voltage, and a phase current waveform (lower two) are presented. Relevant measurements regarding these voltage and grid waveforms are also shown in this figure, including RMS and THD values.
Regarding the RMS value of the generated voltages, as shown in Table 3, the line-to-line RMS voltage is set to 120 V, and, therefore, the RMS phase voltage reference is 120 / 3 69.28   V . As seen in Figure 8, the RMS of the generated load phase voltages corresponds approximately to this reference, with a value of 68.67 V in phase A, 66.71 V in phase B, and 71.05 V in phase C, corresponding to deviations of −0.88%, −3.70%, and 2.55%, respectively. These small deviations are observed mainly due to the fact that a highly unbalanced load is connected to the UPS systems. As for the load voltage harmonic distortion, it can be seen that in all phases, a very low THD value is observed. The mean THD value is roughly 1.23%, which corresponds to a value well below the maximum limit of 8% recommended by the IEC Standard 62040-3.
As for the total absorbed grid current (phase R, grey waveform), for these test conditions, it has an RMS value of roughly 4.7 A with a low THD of approximately 2.03%. To avoid redundancy in the results, since the other two absorbed grid currents present similar waveform, RMS and THD values, only the phase R grid current is analyzed here.
In the following, an analysis is presented to evaluate if low THD values can be ensured even when wrong filter parameter values are considered in UPS controllers. Typically, this can occur for two main reasons: filter parameter deviation (e.g., due to component aging) or wrong filter parameter characterization. Hence, there can be situations in which filter parameter values above or below the real values are wrongly considered in UPS controllers. These two situations were considered in the analysis.
The load voltage THD behavior was studied with UPS controllers considering a wrong load-side filter inductance or capacitance, while the grid current THD behavior was analyzed with UPS controllers considering wrong grid-side filter values. To evaluate the impact of each filter component, the same error was simultaneously considered in UPS1 and UPS2 controllers.
The influence that considering wrong load-side filter inductance values in UPS controllers has on the load voltage THD is demonstrated in Table 4. As shown in this table, when the actual inductance value ( 4.5 mH) is considered, a load voltage THD of roughly 1.2% is obtained. When an inductance 10% higher than the real parameter value is considered in UPS controllers, the load voltage THD increases to 1.5%. Similarly, by considering the load-side filter inductance 20% higher than its real value ( 5.4 mH), the THD increases even more, to 2.0%. When a value 30% above the real inductance value is considered in the controllers ( 5.85 mH), the load voltage THD corresponds to 2.6%. This THD value is more than twice the original, 1.2%. Nevertheless, this is a significantly lower value than the recommended maximum THD of 8%.
On the other hand, when controllers consider a lower inductance than their actual value, the load voltage THD remains practically unchanged, with a constant value of roughly 1.2%, as seen in Table 4. This THD value is observed even when a value 30% below the real inductance (3.15 mH) is considered in the UPS controllers. Hence, for the tested conditions, it can be seen that when the considered load-side filter inductance value in UPS controllers is below the real parameter value, no tangible impact is observed on the load voltage THD.
These results allow the conclusion that even for a significant error between the load-side filter inductance value considered in UPS controllers and its real value, a load voltage with low THD is generated, which is significantly below 8% for all conditions demonstrated in Table 4.
In Table 5, the impact of considering wrong load-side filter capacitance values on load voltage THD is shown. As demonstrated in this table, when the real capacitance value is considered in UPS controllers, a THD of approximately 1.2% is obtained. When the considered load-side filter capacitance is 10% above the real value (66 μF), the load voltage THD slightly increases to 1.3%. If the considered capacitance value is 20% higher than the real value (72 μF), then the THD increases even more to roughly 1.5%. Finally, with an error of 30%, the load voltage THD reaches 1.9%.
As for the observed load voltage THD behavior when a capacitance below the real parameter value is considered in the UPS controllers, a similar behavior to the previous presented analysis is observed regarding the load-side filter inductance. Thus, as demonstrated in Table 5, even when a capacitance 30% below the real capacitance is considered, the load voltage THD remains at 1.2%. Hence, it can be observed that for the tested conditions, when the considered load-side filter capacitance value is below the real parameter, no impact is observed on the load voltage THD.
These results show that even when a significant error exists between the considered and real capacitance value, a high-quality load voltage waveform is generated with a THD significantly below 8%.
Finally, Table 6 shows the grid current THD behavior when wrong grid-side filter inductance values are considered in UPS controllers. As shown in this table, when the real inductance value (10 mH) is considered in UPS controllers, a grid-current THD of 1.9% is obtained. In this analysis, from Table 6, it can be seen that the grid current harmonic distortion increases when inductance values below the real are considered in the UPS controllers. In fact, for the tested conditions, when the considered grid-side inductance is higher than its actual value, slight decreases are observed in the THD. However, it was observed that in these cases, the overall system efficiency also slightly decreases.
The highest THD value (3.5%) is observed when an inductance value 30% below the real inductance is considered in UPS controllers. This THD value corresponds to almost twice the grid current THD value obtained with the real inductance value being considered; however, this is still an acceptable THD value.
In sum, these results show that even when significant deviations exist between real and considered filter parameters values in UPS controllers, the proposed controllers and UPS systems absorb grid currents and ensure load voltage waveforms with low harmonic distortion.

4.5. System Dynamic Response under Load Changes

In this section, the dynamic response of the proposed controllers when an additional load is connected to the UPS systems in operation is demonstrated.
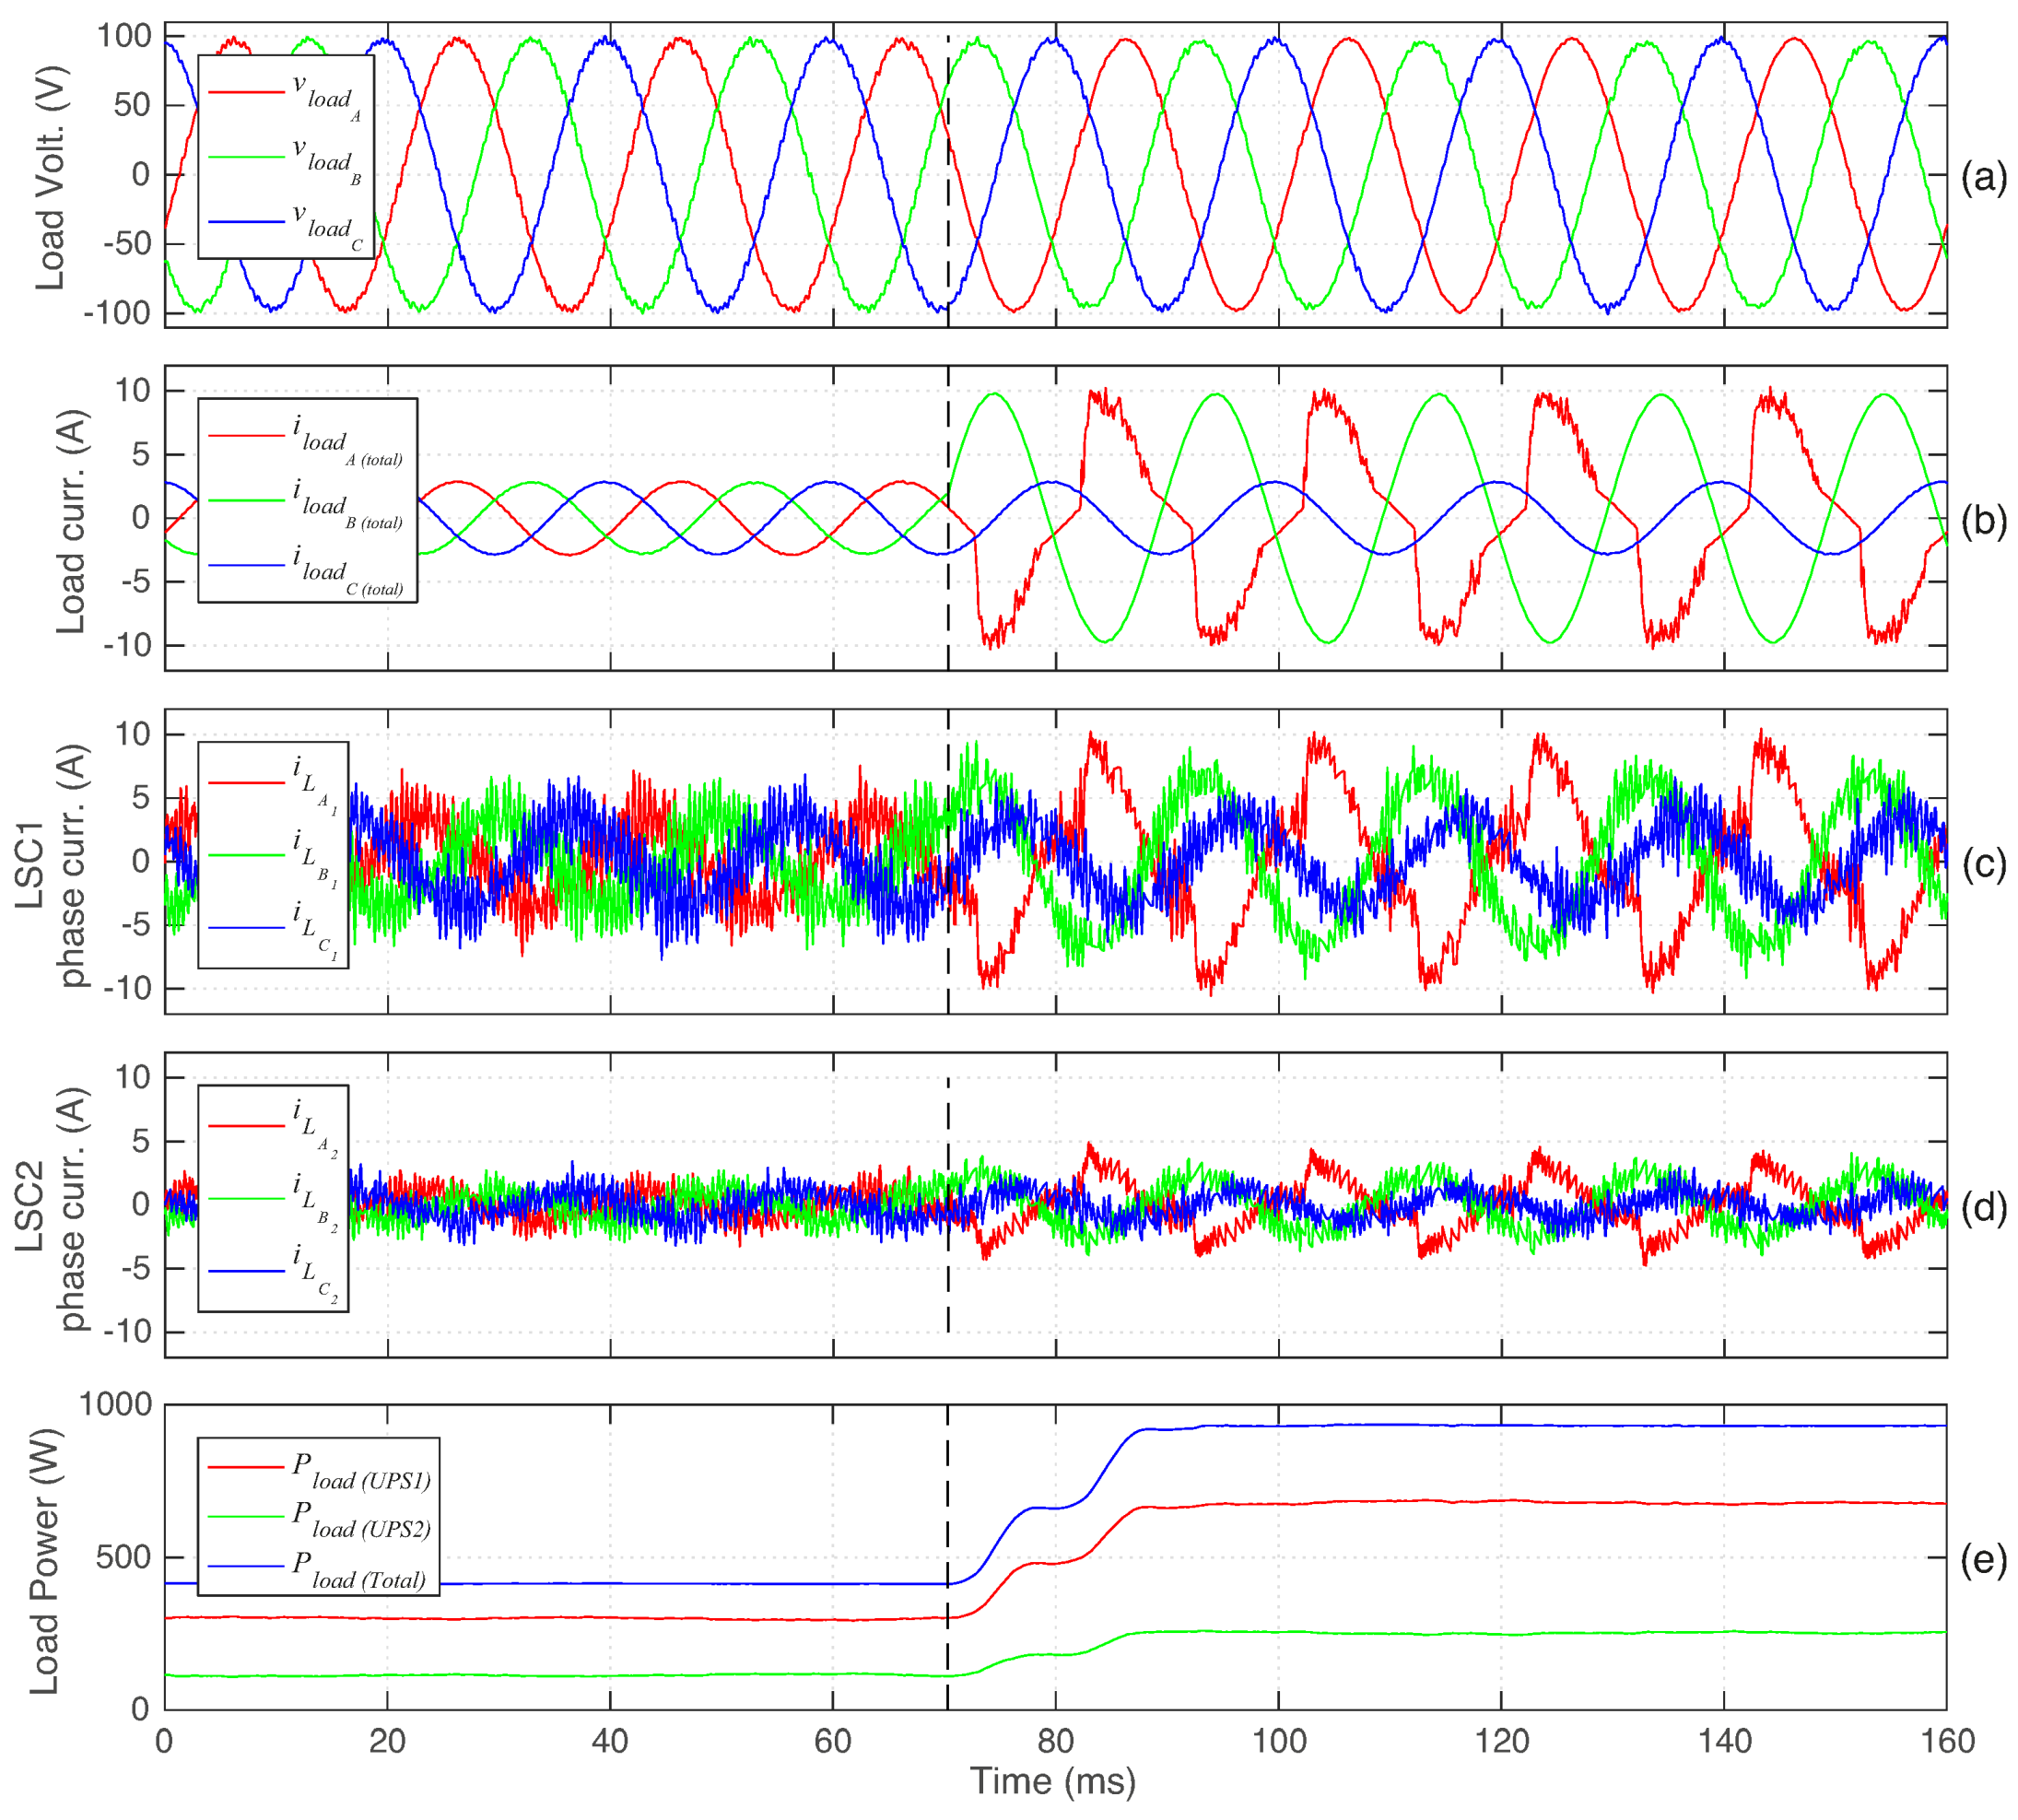
 Figure 9 and Figure 10 present the behavior of the system when both UPSs are initially supplying a three-phase three-wire linear load and at a given instant a non-linear unbalanced load is connected to the UPS systems. In the tested conditions, UPS1 supplies 75% of the power to the load, and UPS2 supplies the remaining 25%. The linear load has a 100 Ω resistance per phase, whereas the second load consists of the rectifier + RC circuit in phase A and RL load in phase B, which is connected to the UPS systems at t 71 ms. Figure 9 shows the generated load phase voltage, load phase currents, LSC phase currents and average UPS system output power, and total load power.
From Figure 9a, it can be seen that even when the unbalanced non-linear load is connected to the UPS systems, a high-quality load voltage is permanently generated by both UPS controllers. Particularly, no disturbance is observed in the load voltage even with the behavior change in the load currents after connection of the second load (Figure 9b).
It can be seen that the LSC phase currents rapidly adapt in order to maintain a high-quality output voltage waveform, as shown in Figure 9c,d.
Figure 9e shows the behavior of UPS system output power and total load power. After the load connection, the UPS systems start to supply a higher power level, and, thus, the presented powers start to rise. As shown in this subfigure, the load-sharing condition is kept even after the connection of the rectifier + RC circuit in phase A and RL load in phase B is made.
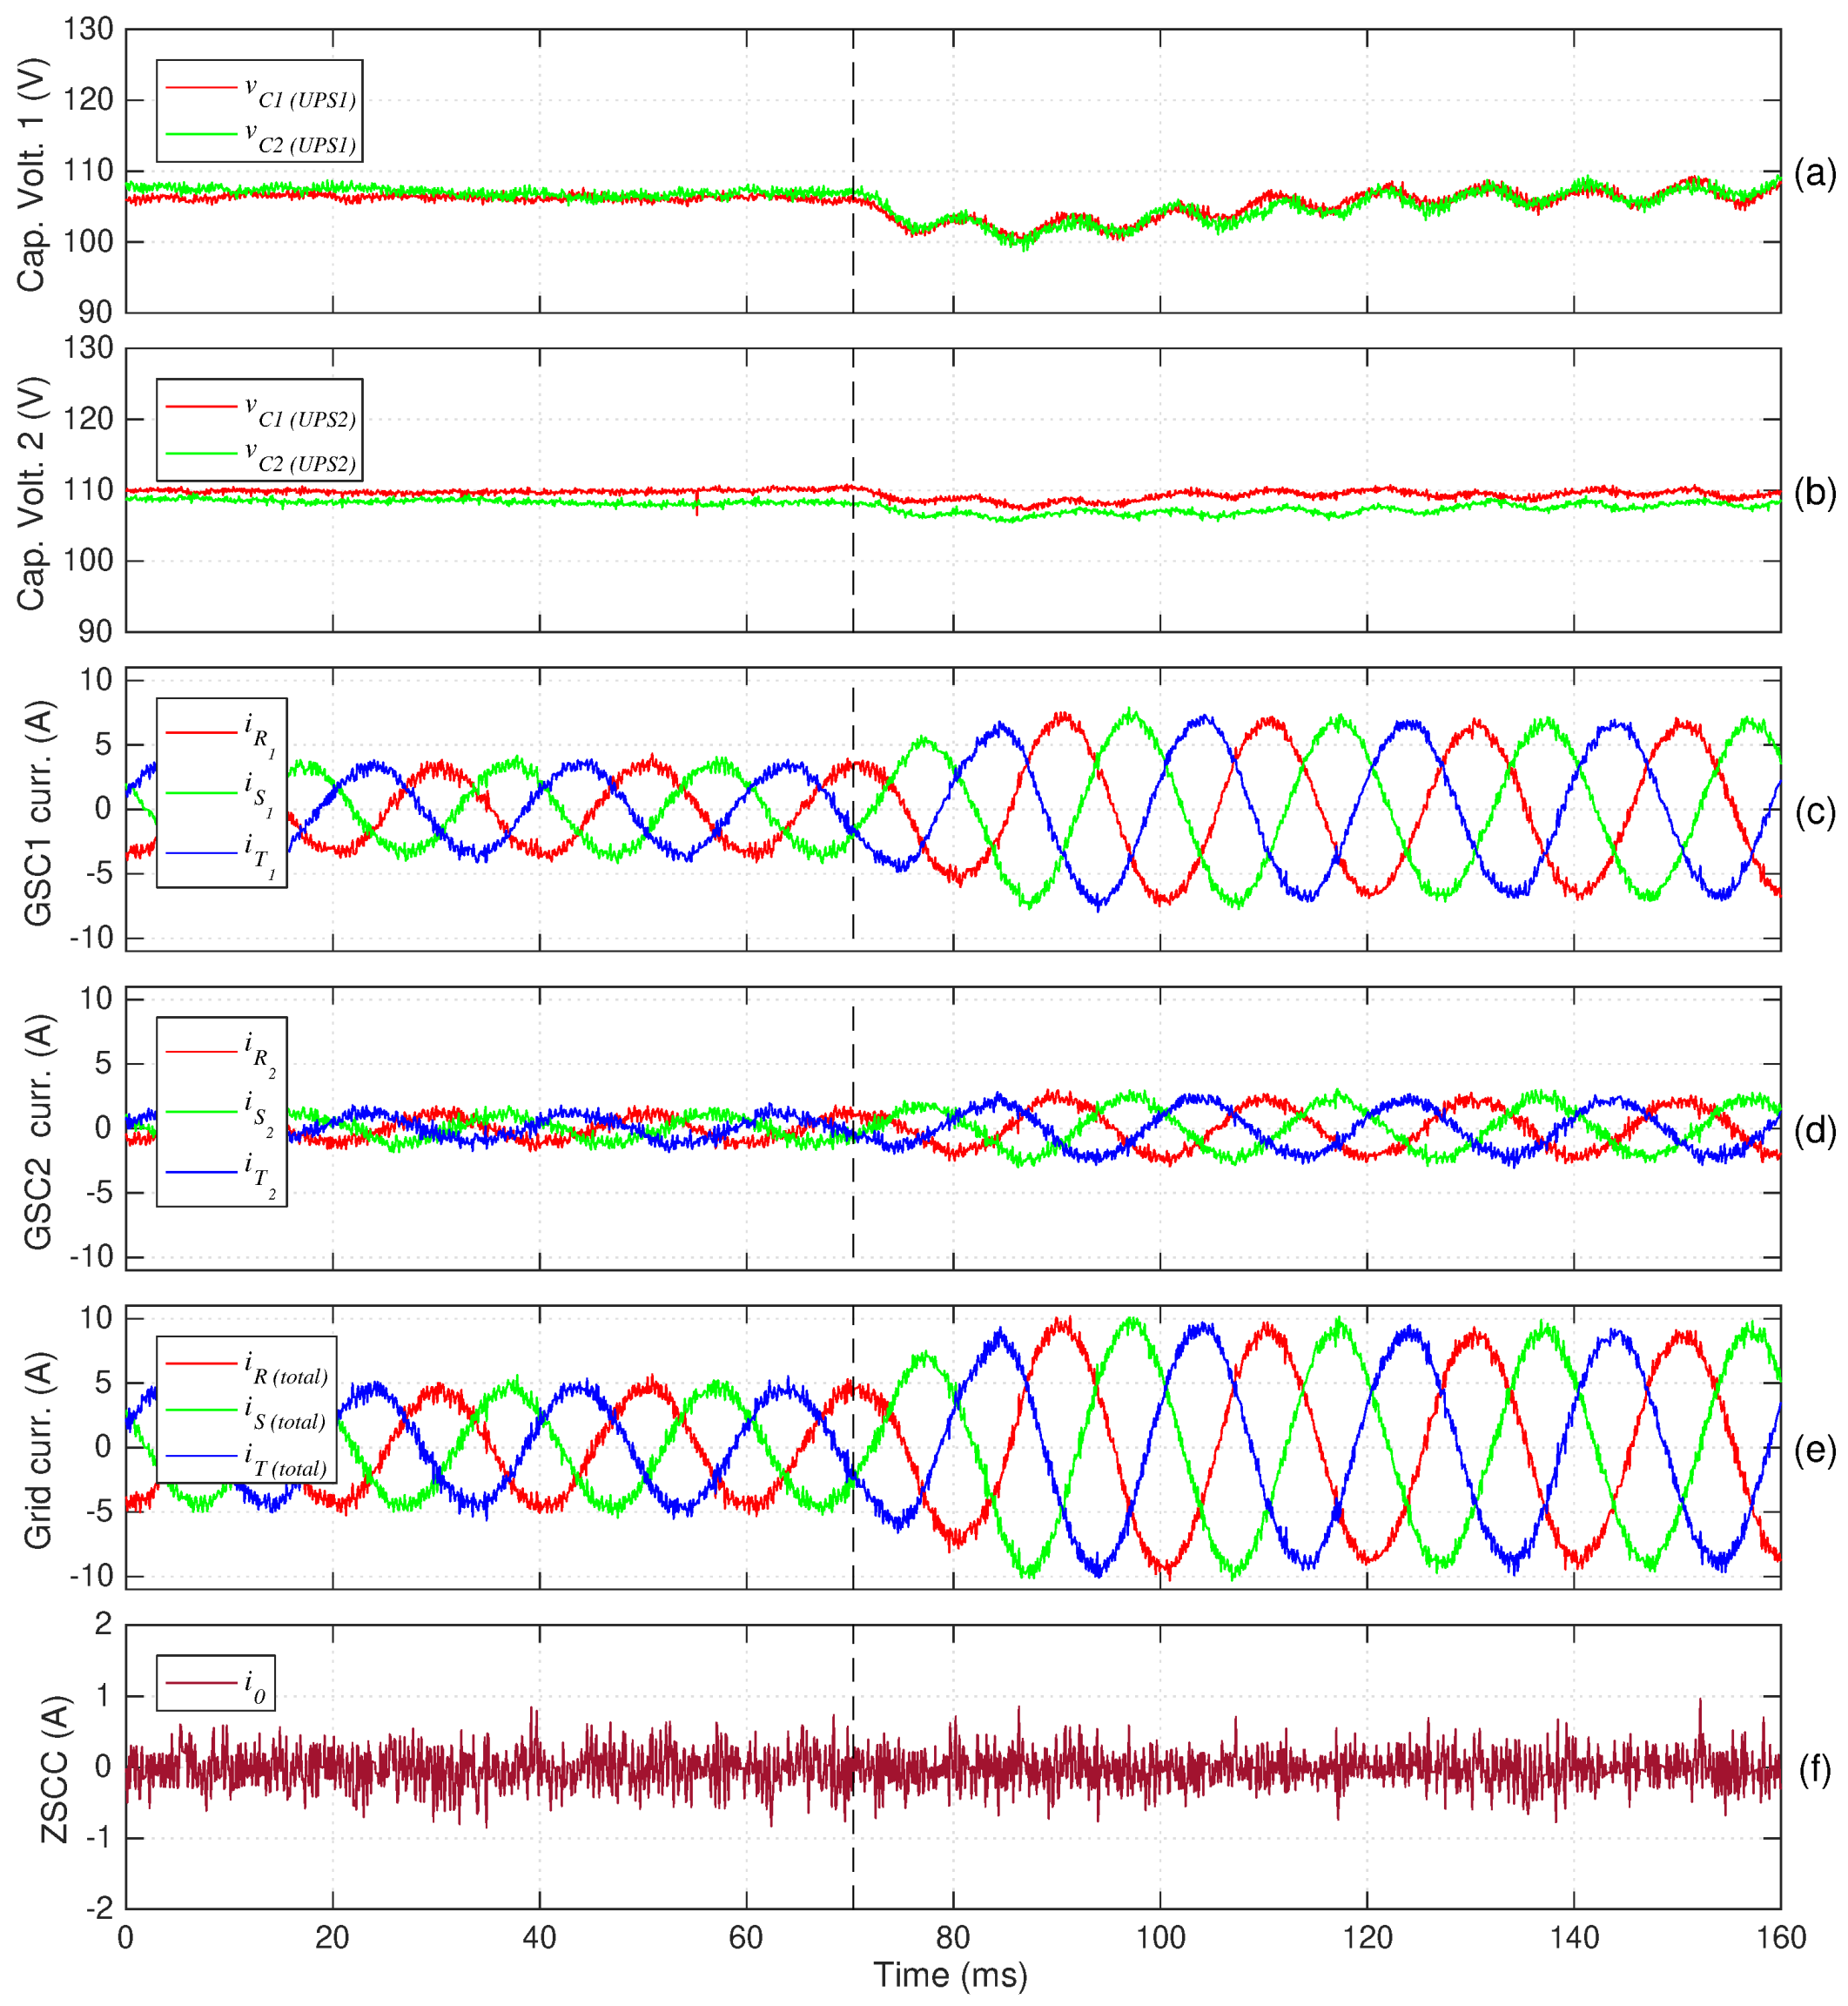
Figure 10 shows the DC bus capacitor voltage, GSC1 and GSC2 phase currents, total currents absorbed from the grid, and the ZSCC during the same test.
Figure 10a,b demonstrate that the connection of the additional load has little impact on the DC bus of both UPS systems with the DC buses’ capacitor voltage balancing being ensured even at the instant in which the second load is connected. On the other hand, the DC buses have a small voltage drop, which is rapidly compensated, with no overshoot. This voltage drop is observed because the GSC current references are not instantaneously updated since they are computed by considering the balancing of average active power in the UPS system instead of instantaneous active power.
The GSC1 and GSC2 currents are presented in Figure 10c,d, respectively. From these two subfigures, it can be seen that after the connection of the second load, the magnitude of both GSC1 and GSC2 clearly increases with the UPS systems absorbing a higher power value from the grid. Hence, as shown in Figure 10e, the total absorbed grid current magnitude also increases after the second load connection.
Finally, from Figure 10e, it is observed that the ZSCC is effectively eliminated. The connection of the additional load does not affect the suppression of this current, which is crucial for the overall stable operation of both UPS systems.
These results show that with the proposed control techniques, the UPS systems show an overall good dynamic response, even when abrupt changes in the behavior of the critical load occur.

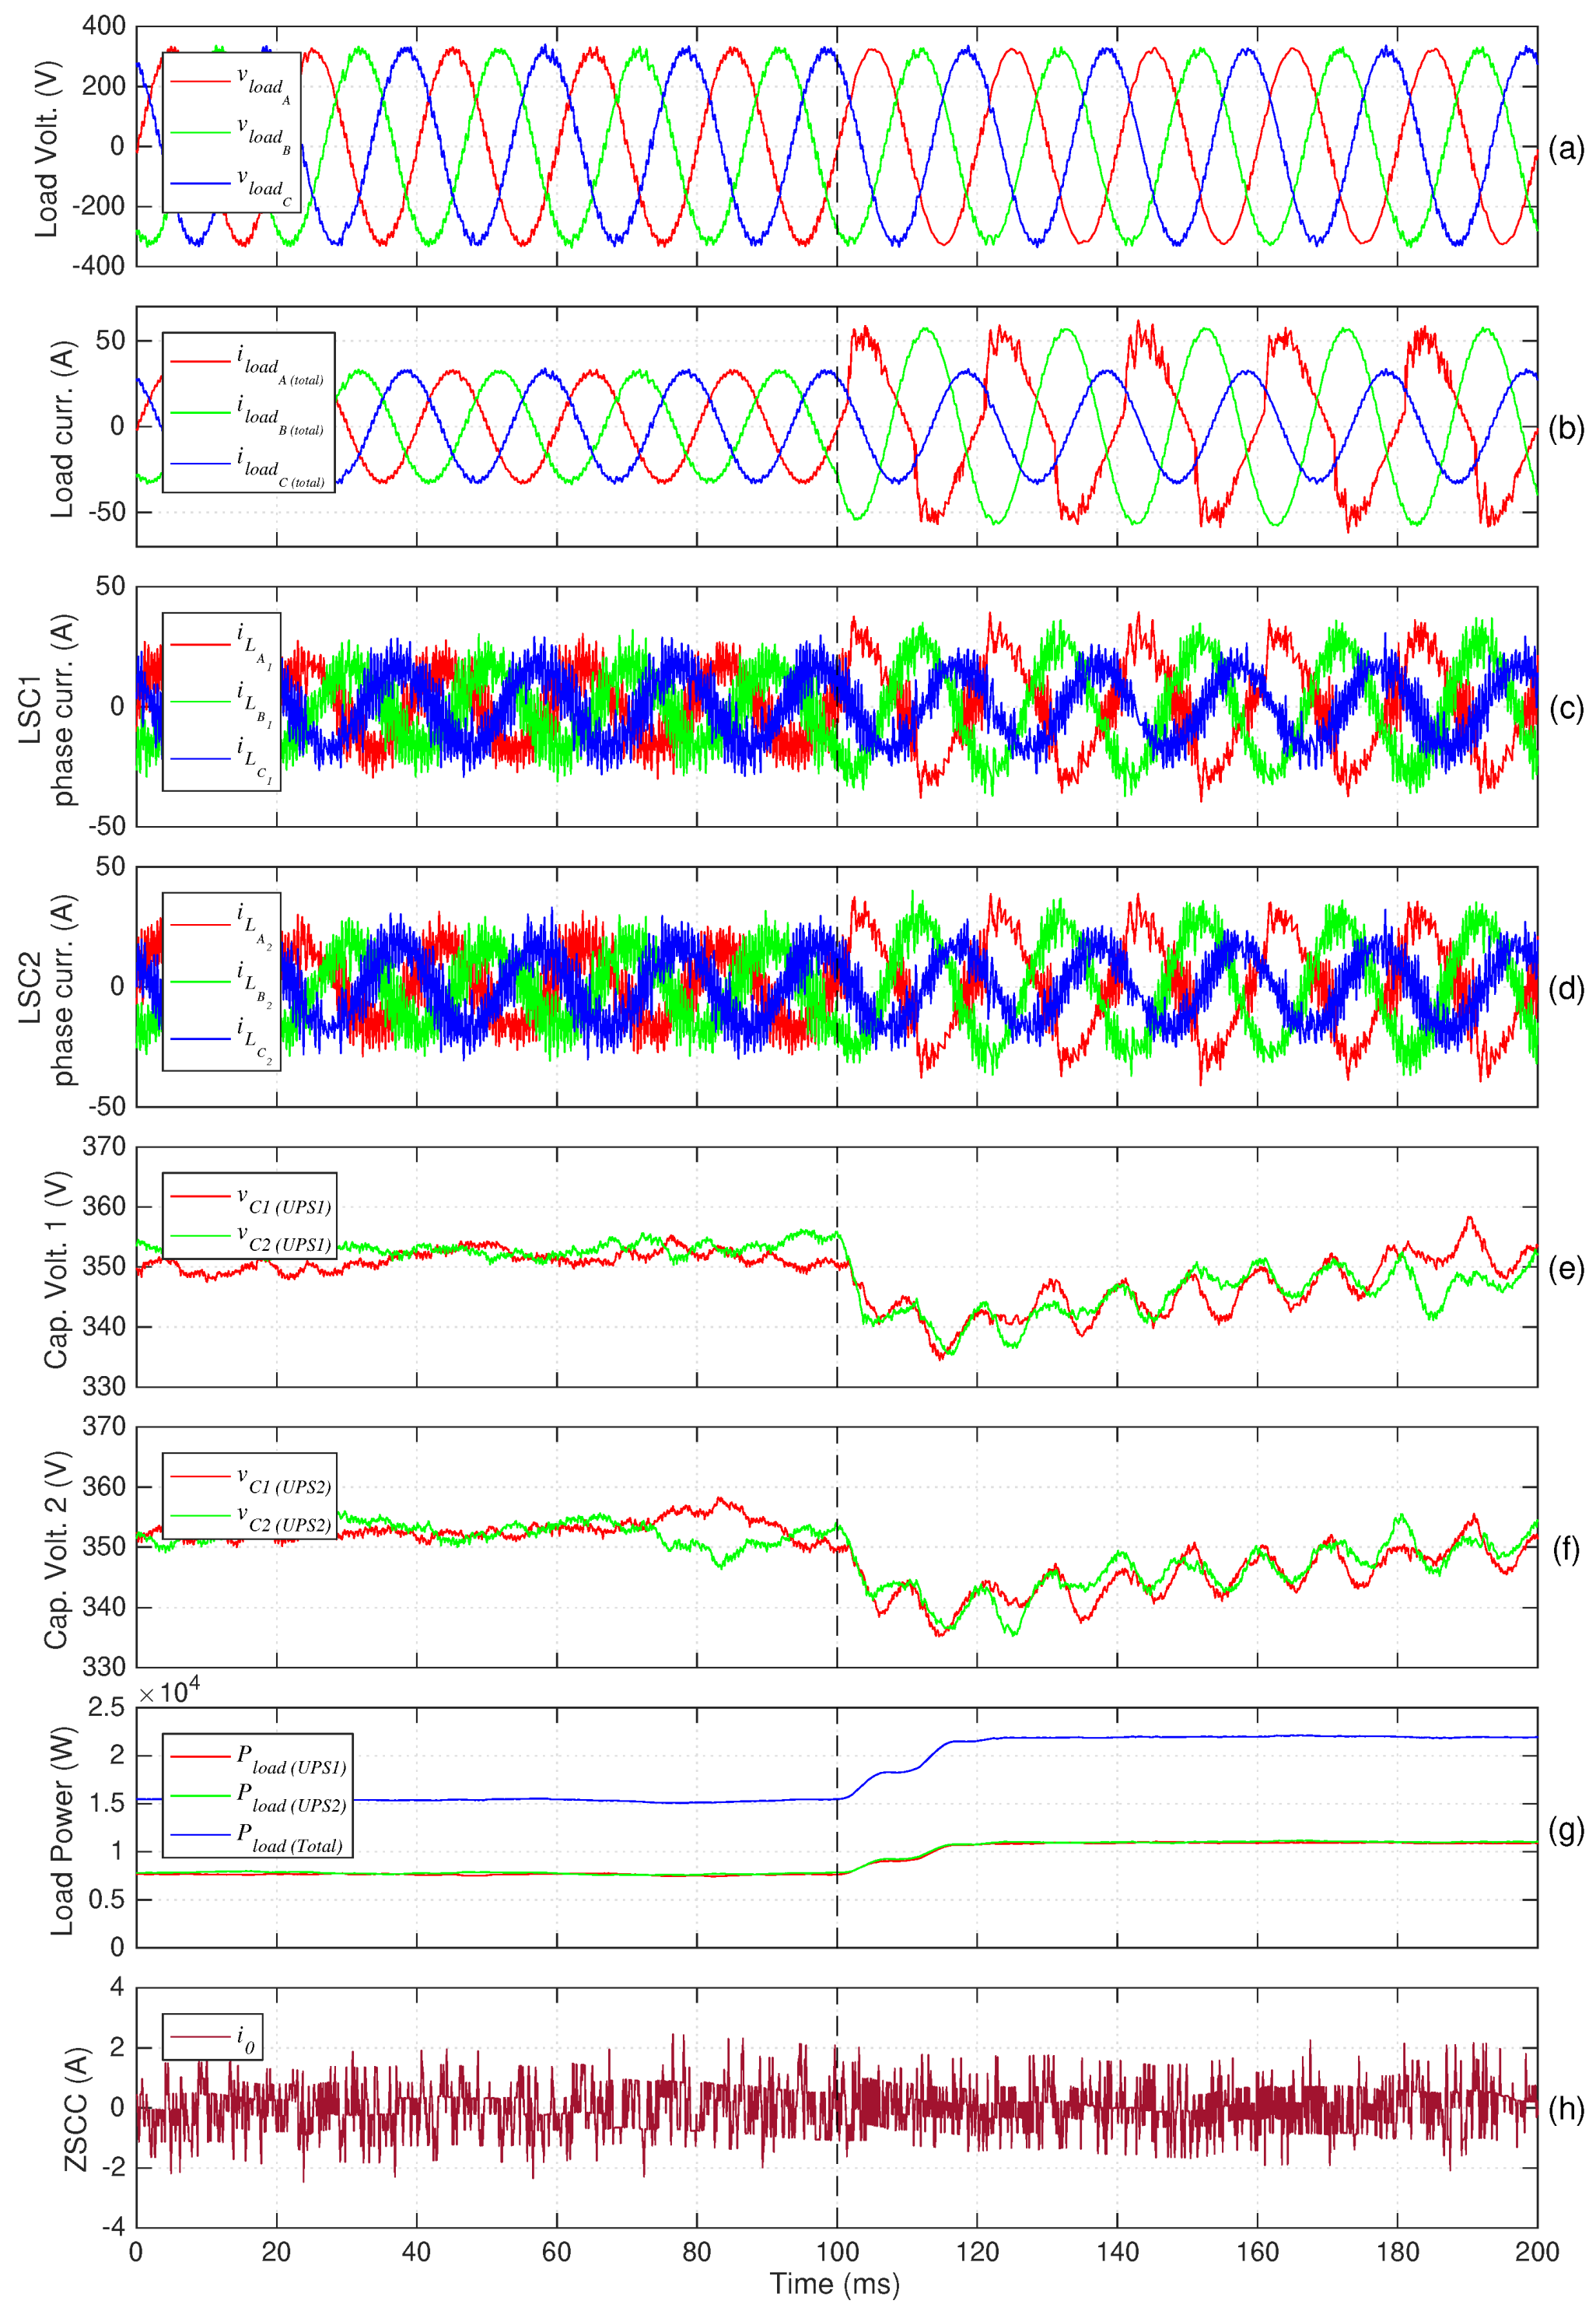
4.6. System Simulation for a High-Power Application

In the previous sections, experimental results were shown considering a low power lab-oriented prototype, which, in turn, is operated at low voltage due to safety and material protection reasons. However, UPS systems usually supply high-power loads with higher voltage and current levels than those previously considered. In this section, the operation of the proposed UPS systems feeding high-power loads at higher voltage and current levels is demonstrated with simulation results. Hence, instead of considering an RMS grid and load voltages of 120 V as used in the previous sections, for the following results, a 400 V RMS value is considered for the line-to-line grid and load voltages. On the other hand, instead of considering a DC bus with 220 V, in this case, the DC bus voltage reference is 700 V. All filter parameters and control weighting factors are equal to the values presented in Table 2 and Table 3.
Figure 11 shows the response of the system when both UPS systems supply half of the power to a three-phase resistor (R = 10 Ω per phase); at a given instant, a second load consisting of a single-phase rectifier + RC (R = 20 Ω and C = 200 μF) circuit is connected to phase A, and an RL (R = 10 Ω and L = 20 mH) load is connected to phase B.
The figure presents the generated load phase voltage, load phase currents, LSC phase currents, DC bus capacitor voltages, average UPS system output power and total load power, and the circulating current.
As previously mentioned, for the presented conditions, the RMS line-to-line voltage reference is set to 400 V. Hence, the load phase voltages, which are presented in Figure 11a, should have an RMS voltage of 400 / 3 and a peak value of 400 × 2 / 3 326.6   V . As seen in this subfigure, the generated load voltage waveform has higher distortion in comparison to all previously presented results. However, as previously mentioned, for these simulation results, considering a high-power level, the filter parameters are the same as those used in the experimental results for lower power/voltage levels. This may suggest that for higher voltage/power levels, filter parameter redesign may have to be considered.Nevertheless, even by using the presented filter parameters, near-sinusoidal load voltages are still observed with a THD value of approximately 4% (well below the maximum limit of 8% defined in IEC Standard 62040-3). Note that this THD value is obtained even when supplying unbalanced and non-linear currents to the load, as demonstrated in Figure 11b.
The LSC phase currents are presented in Figure 11c,d, in which a higher ripple than in the previous sections can be seen. This is observed mainly because UPS systems are operating with high voltages at their output and DC buses, and, consequently, considerably high voltages can be applied in the load-side filter inductor, which leads to this high ripple in LSC currents. However, in comparison to the previous sections, a similar relation between the ripple and fundamental frequency magnitude of these currents is observed.
From Figure 11e,f it can be seen that each DC bus capacitor voltage is roughly 350 V, which indicates that these capacitor voltages are balanced and that the DC bus voltage is roughly 700 V, which corresponds to the defined reference value. These two subfigures also show that even in high-power applications, the connection of the additional load has little impact on the DC bus of both UPS systems, with the voltage drop being compensated with no overshot in DC buses.
Figure 11g shows the behavior of UPS system output power and total load power. The UPS systems supply an average active power slightly over 7.5 kW, which gives a total power supplied to the load of roughly 15 kW. After the connection of the additional load, the load-sharing condition is kept with the total power supplied, reaching roughly 22 kW.
Finally, from Figure 11h, it is observed that even when supplying high-power loads, the circulating current is effectively eliminated.
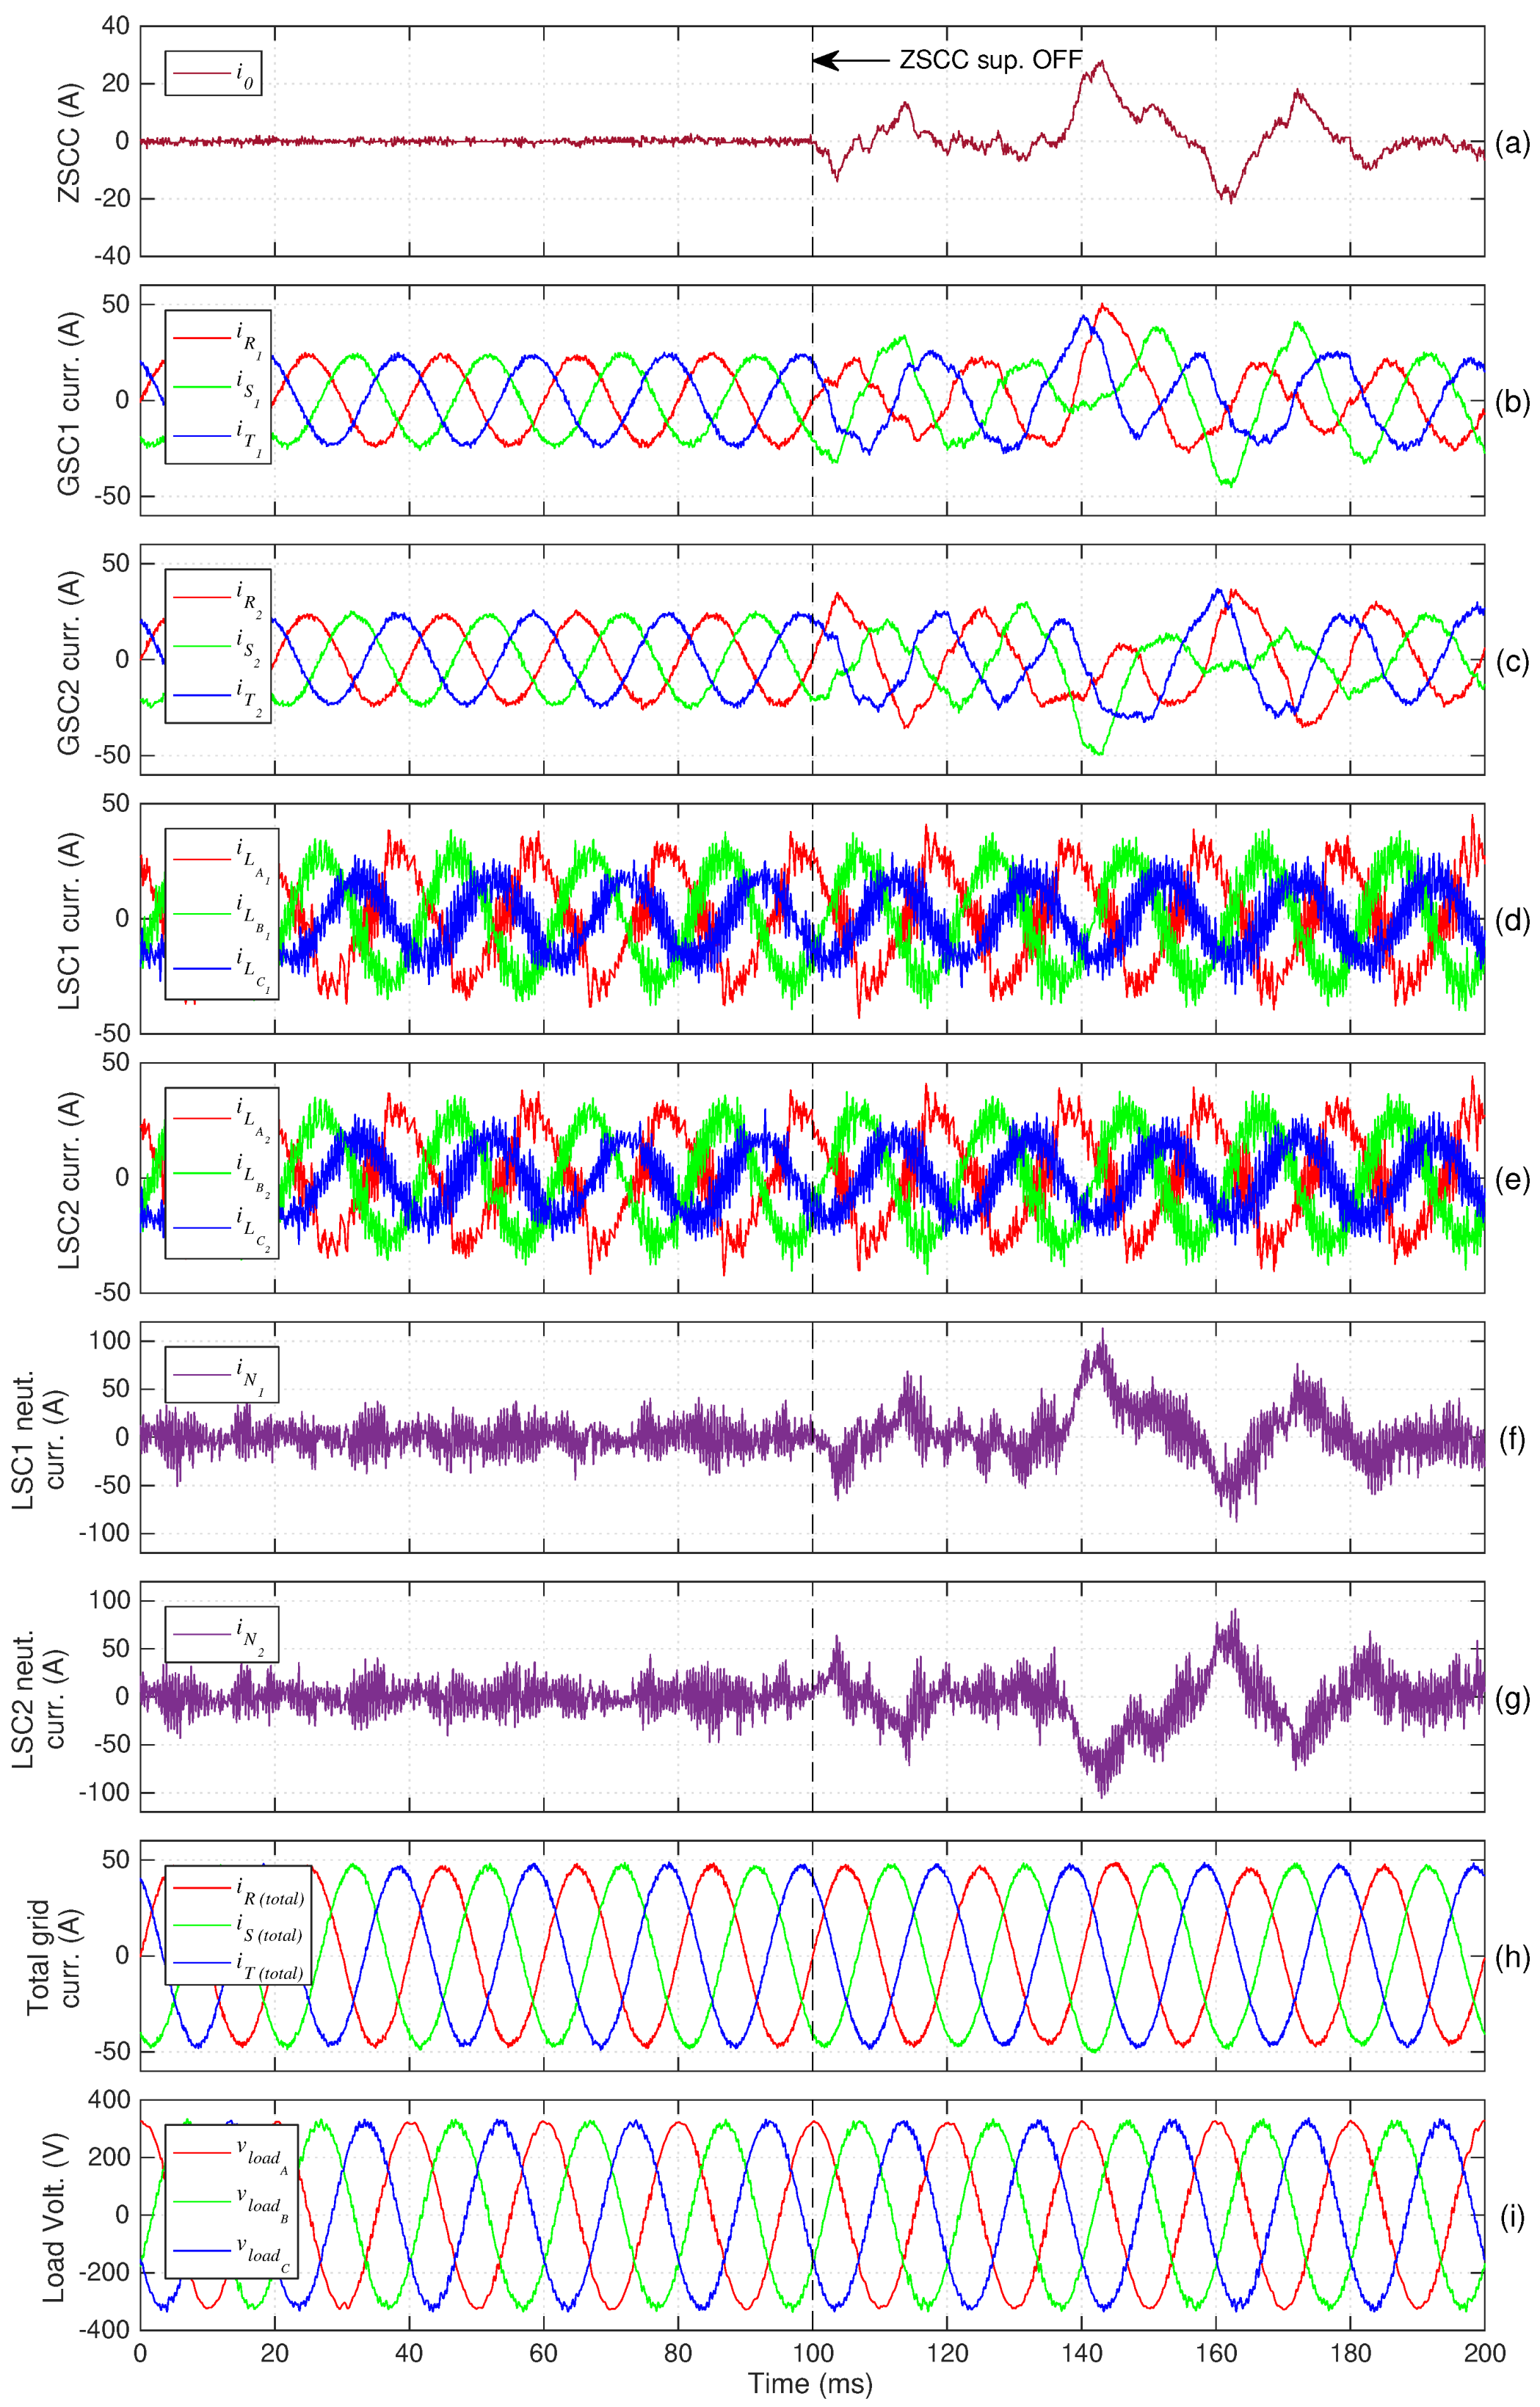
The importance of the elimination of this current is emphasized in Figure 12. This figure also demonstrates the effectiveness of the proposed ZSCC suppression mechanism in a high-power application. The undesired ZSCC effects on UPS systems operation phenomena were previously demonstrated in Section 4.2. Nevertheless, in simulation environment, since no overcurrent protections are considered for UPS systems protection, these undesired effects can be better demonstrated. The figure presents the ZSCC, GSC currents, LSC phase currents, LSC neutral leg currents, and the generated load voltage when the high-power unbalanced load previously described is supplied by the UPS systems. In this test, the ZSCC suppression mechanism is deactivated at t = 100 ms ( W z G = W z L = 0 ).
As Figure 12a shows, after the deactivation, the ZSCC magnitude significantly rises, reaching a maximum absolute value of roughly 25 A. Hence, as presented in Figure 12b,c both UPS input currents are highly distorted and reach peak values that correspond to roughly twice the peak value observed in normal operation (ZSCC suppression ON).
The existence of ZSCC has practically no impact on the LSC phase currents, as seen in Figure 12d,e. However, similarly to the GSCs currents, the neutral leg currents in both LSCs rise to values roughly twice the peak value observed in normal operation, reaching values of 100 A.
Nevertheless, as seen in Figure 12h, the circulating current has no tangible impact on the total current absorbed from the the power grid. Even when a high ZSCC exists, near-sinusoidal currents are absorbed.
Finally, as Figure 12i demonstrates, the load voltage is also ensured by the UPS systems, even with a high circulating current. However, as seen in Section 4.2, in a real-world application, the ZSCC can increase the current values of GSCs and neutral legs to hazardous values. This increases losses in the systems and causes additional stress to the components of the UPS, reducing their lifetime and possibly causing their failure. Additionally, overcurrent protections can be triggered, leading to the deactivation of the UPS system and consequently compromising the critical load.
These simulation results show that with the proposed control techniques, the proposed UPS systems can be used to feed not only low-power critical loads but also high-power critical applications.

5. Conclusions

This paper presents a system topology based on two double-conversion paralleled UPS systems that use an additional leg in their load-side converters (LSC) to provide a connection in each UPS for the load-side neutral wire. The proposed system configuration enables multiple single/three-phase balanced/unbalanced loads to be fed, which given the variety of loads that typically exists in critical applications, such as medical facilities and high-tier datacenters, is a fundamental requirement. A new cooperative Finite Control Set Model Predictive Control (FCS-MPC) technique is also proposed to control all converters of the two paralleled UPS systems.
The dynamics of the undesirable Zero-Sequence Circulating Current (ZSCC) that can flow between both UPS systems, inhibiting a proper overall system operation, are analyzed in this work, and the importance of their suppression is demonstrated.
An analysis regarding the LSC neutral leg currents is also provided, in which it is demonstrated that the currents flowing in these legs can reach considerably higher values in comparison to the LSC phase currents and load currents. This suggests that the semiconductors to be used in the LSC neutral leg must present higher current ratings than those of the semiconductors to be used in the LSC phase legs.
The experimental results demonstrate that with the proposed control technique, the ZSCC is effectively eliminated, allowing correct operation of the parallel-connected UPS systems. A high-quality load voltage waveform is ensured even when the system supplies a highly unbalanced set of single-phase loads under different load-sharing conditions, with each UPS supplying different proportions of the power to the load. Moreover, the presented experimental results show that an overall fast dynamic response and stable steady-state conditions are obtained, even when additional loads are connected with the UPS systems in operation. Finally, the simulation results show that the proposed control techniques and paralleled UPS systems with load-side neutral connection can be used in high-power applications with industrial voltage levels.

Author Contributions

Conceptualization, T.O., L.C., and A.M.; methodology, T.O., L.C., and A.M.; software, T.O.; validation, T.O., L.C., and A.M.; formal analysis, T.O.; investigation, T.O., L.C., A.M., S.C., and M.P.; resources, A.M.; data curation, T.O.; writing—original draft preparation, T.O. and L.C.; writing—review and editing, T.O., L.C., S.C., and M.P.; visualization, T.O. and L.C.; supervision, A.M.; project administration, A.M.; funding acquisition, A.M. All authors have read and agreed to the published version of the manuscript.

Funding

This work was supported by the Project SAICT-45-2017-POCI-01-0145-FEDER-029112— PTDC/EEI-EEE/29112/2017, funded by “Programa Operacional Temático Competitividade e Internacionalização—FEDER and by the Foundation for Science and Technology (FCT)—OE. T.O. also acknowledges the financial support of the Portuguese Foundation for Science and Technology (FCT) under the scholarship 2020.04803.BD.

Institutional Review Board Statement

Not applicable.

Informed Consent Statement

Not applicable.

Conflicts of Interest

The authors declare no conflict of interest. The funders had no role in the design of the study; in the collection, analyses, or interpretation of data; in the writing of the manuscript, or in the decision to publish the results.

References

  1. Cortes, P.; Ortiz, G.; Yuz, J.I.; Rodriguez, J.; Vazquez, S.; Franquelo, L.G. Model Predictive Control of an Inverter With Output LC Filter for UPS Applications. IEEE Trans. Ind. Electron. 2009, 56, 1875–1883. [Google Scholar] [CrossRef]
  2. Caseiro, L.M.A.; Mendes, A.M.S.; Cruz, S.M.A. Dynamically Weighted Optimal Switching Vector Model Predictive Control of Power Converters. IEEE Trans. Ind. Electron. 2019, 66, 1235–1245. [Google Scholar] [CrossRef]
  3. Oliveira, T.; Caseiro, L.; Mendes, A.; Cruz, S. Finite Control Set Model Predictive Control for Paralleled Uninterruptible Power Supplies. Energies 2020, 13, 3453. [Google Scholar] [CrossRef]
  4. Sharifzadeh, M.; Vahedi, H.; Sheikholeslami, A.; Labbé, P.; Al-Haddad, K. Hybrid SHM–SHE Modulation Technique for a Four-Leg NPC Inverter With DC Capacitor Self-Voltage Balancing. IEEE Trans. Ind. Electron. 2015, 62, 4890–4899. [Google Scholar] [CrossRef]
  5. Arbugeri, C.A.; Jappe, T.K.; Lazzarin, T.B.; Mussa, S.A. Implementation of a control strategy for three-phase four-wire VSI parallel connected. In Proceedings of the 2014 International Symposium on Power Electronics, Electrical Drives, Automation and Motion, Ischia, Italy, 18–20 June 2014; pp. 1043–1048. [Google Scholar] [CrossRef]
  6. Rivera, M.; Yaramasu, V.; Llor, A.; Rodriguez, J.; Wu, B.; Fadel, M. Digital Predictive Current Control of a Three-Phase Four-Leg Inverter. IEEE Trans. Ind. Electron. 2013, 60, 4903–4912. [Google Scholar] [CrossRef]
  7. Jappe, T.K.; Lazzarin, T.B.; Arbugeri, C.A.; Mussa, S.A. Control strategy for three-phase four-wire PWM VSI parallel connected in UPS applications. In Proceedings of the 2014 IEEE 23rd International Symposium on Industrial Electronics (ISIE), Istanbul, Turkey, 1–4 June 2014; pp. 443–448. [Google Scholar] [CrossRef]
  8. Xiong, H.; Wu, C. Control Strategy of Three-Phase Four-Wire Three-Leg Inverters. In Proceedings of the 2019 IEEE 10th International Symposium on Power Electronics for Distributed Generation Systems (PEDG), Xi’an, China, 3–6 June 2019; pp. 75–78. [Google Scholar] [CrossRef]
  9. Pichan, M.; Rastegar, H.; Monfared, M. Deadbeat Control of the Stand-Alone Four-Leg Inverter Considering the Effect of the Neutral Line Inductor. IEEE Trans. Ind. Electron. 2017, 64, 2592–2601. [Google Scholar] [CrossRef]
  10. Rodriguez, J.; Wu, B.; Rivera, M.; Wilson, A.; Yaramasu, V.; Rojas, C. Model predictive control of three-phase four-leg neutral-point-clamped inverters. In Proceedings of the 2010 International Power Electronics Conference—ECCE ASIA, Sapporo, Japan, 21–24 June 2010; pp. 3112–3116. [Google Scholar] [CrossRef]
  11. Liu, Z.; Liu, J.; Li, J. Modeling, Analysis, and Mitigation of Load Neutral Point Voltage for Three-Phase Four-Leg Inverter. IEEE Trans. Ind. Electron. 2013, 60, 2010–2021. [Google Scholar] [CrossRef]
  12. Modesto, R.A.; Oliveira da Silva, S.A.; de Oliveira, A.A. Line-interactive UPS system applied to three-phase four-wire systems with universal filtering capabilities. In Proceedings of the 2014 IEEE 23rd International Symposium on Industrial Electronics (ISIE), Istanbul, Turkey, 1–4 June 2014; pp. 1858–1865. [Google Scholar] [CrossRef]
  13. Miveh, M.R.; Rahmat, M.F.; Ghadimi, A.A.; Mustafa, M.W. Control techniques for three-phase four-leg voltage source inverters in autonomous microgrids: A review. Renew. Sustain. Energy Rev. 2016, 54, 1592–1610. [Google Scholar] [CrossRef]
  14. Teichmann, R.; Bernet, S. A comparison of three-level converters versus two-level converters for low-voltage drives, traction, and utility applications. IEEE Trans. Ind. Appl. 2005, 41, 855–865. [Google Scholar] [CrossRef]
  15. Oliveira, T.J.L.; Caseiro, L.M.A.; Mendes, A.M.S.; Cruz, S.M.A.; Perdigão, M.S. Switching frequency reduction for efficiency optimization in two paralleled UPS systems. In Proceedings of the 2020 IEEE 14th International Conference on Compatibility, Power Electronics and Power Engineering (CPE-POWERENG), Setubal, Portugal, 8–10 July 2020; Volume 1, pp. 161–166. [Google Scholar] [CrossRef]
  16. Wei, B.; Vásquez, J.C.; Guerrero, J.M.; Guo, X. Control architecture for paralleled current-source-inverter (CSI) based uninterruptible power systems (UPS). In Proceedings of the 2016 IEEE 8th International Power Electronics and Motion Control Conference (IPEMC-ECCE Asia), Hefei, China, 22–26 May 2016; pp. 151–156. [Google Scholar] [CrossRef] [Green Version]
  17. He, G.; Chen, M.; Yu, W.; He, N.; Xu, D. Design and Analysis of Multiloop Controllers with DC Suppression Loop for Paralleled UPS Inverter System. IEEE Trans. Ind. Electron. 2014, 61, 6494–6506. [Google Scholar] [CrossRef]
  18. Cai, J.; Chen, C.; Liu, P.; Duan, S. Adaptive current-sharing control strategy with virtual circulating impedance for parallel operation of UPS. In Proceedings of the 2015 IEEE Energy Conversion Congress and Exposition (ECCE), Montreal, QC, Canada, 20–24 September 2015; pp. 1243–1247. [Google Scholar] [CrossRef]
  19. Oliveira, T.J.L.; Caseiro, L.M.A.; Mendes, A.M.S. Load-sharing between two paralleled UPS systems using Model Predictive Control. In Proceedings of the IECON 2019—45th Annual Conference of the IEEE Industrial Electronics Society, Lisbon, Portugal, 14–17 October 2019; pp. 3547–3552. [Google Scholar] [CrossRef]
  20. Vazquez, S.; Rodriguez, J.; Rivera, M.; Franquelo, L.G.; Norambuena, M. Model Predictive Control for Power Converters and Drives: Advances and Trends. IEEE Trans. Ind. Electron. 2017, 64, 935–947. [Google Scholar] [CrossRef] [Green Version]
  21. Kim, S.; Choi, D.; Lee, K.; Lee, Y.I. Offset-Free Model Predictive Control for the Power Control of Three-Phase AC/DC Converters. IEEE Trans. Ind. Electron. 2015, 62, 7114–7126. [Google Scholar] [CrossRef]
  22. Lim, C.S.; Lee, S.S.; Wong, Y.C.C.; Nutkani, I.U.; Goh, H.H. Comparison of Current Control Strategies Based on FCS-MPC and D-PI-PWM Control for Actively Damped VSCs with LCL-Filters. IEEE Access 2019, 7, 112410–112423. [Google Scholar] [CrossRef]
  23. Young, H.; Rodríguez, J. Comparison of finite-control-set model predictive control versus a SVM-based linear controller. In Proceedings of the 2013 15th European Conference on Power Electronics and Applications (EPE), Lille, France, 2–6 September 2013; pp. 1–8. [Google Scholar] [CrossRef]
  24. Wang, X.; Zou, J.; Peng, Y.; Xie, C.; Li, K.; Guerrero Zapata, J.M. Elimination of zero sequence circulating currents in paralleled three-level T-type inverters with a model predictive control strategy. IET Power Electron. 2018, 11, 2573–2581. [Google Scholar] [CrossRef]
  25. Xing, X.; Zhang, C.; He, J.; Chen, A.; Zhang, Z. Model predictive control for parallel three-level T-type grid-connected inverters in renewable power generations. IET Renew. Power Gener. 2017, 11, 1353–1363. [Google Scholar] [CrossRef]
  26. Caseiro, L.M.A.; Mendes, A.M.S.; Cruz, S.M.A. Cooperative and Dynamically Weighted Model Predictive Control of a 3-Level Uninterruptible Power Supply with Improved Performance and Dynamic Response. IEEE Trans. Ind. Electron. 2020, 67, 4934–4945. [Google Scholar] [CrossRef]
  27. Khan, H.S.; Aamir, M.; Ali, M.; Waqar, A.; Ali, S.U.; Imtiaz, J. Finite Control Set Model Predictive Control for Parallel Connected Online UPS System under Unbalanced and Nonlinear Loads. Energies 2019, 12, 581. [Google Scholar] [CrossRef] [Green Version]
Figure 1. Circuit and main variable representation of the proposed paralleled UPS systems.
Energies 14 02270 g001
Figure 2. Schematic representation of the proposed UPS controller (UPS1).
Energies 14 02270 g002
Figure 3. Experimental setup: (a) Photograph of the used components; (b) electrical block diagram.
Energies 14 02270 g003
Figure 4. Neutral currents analysis with a balanced linear load connected to the UPS systems: (a) load voltage; (b) load phase currents; (c) load neutral current; (d) LSC1 phase currents; (e) LSC2 phase currents; (f) LSC1 neutral leg current; (g) LSC2 neutral leg current; (h) zero-sequence circulating current.
Energies 14 02270 g004
Figure 5. Effectiveness of the proposed ZSCC suppression technique: (a) Zero-Sequence Circulating Current (ZSCC); (b) UPS1 input current; (c) UPS2 input current; (d) UPS1 LSC current; (e) UPS2 LSC current; (f) LSC1 neutral current; (g) LSC2 neutral current; (h) load voltage.
Energies 14 02270 g005
Figure 6. System response for different load-sharing conditions: (a) load voltage; (b) load phase currents; (c) load neutral current; (d) LSC1 phase currents; (e) LSC1 neutral leg current; (f) LSC2 phase currents; (g) LSC2 phase currents; (h) average UPS system output power and total load power.
Energies 14 02270 g006
Figure 7. System response for different load-sharing conditions: (a) zero-sequence circulating current; (b) UPS1 input current; (c) UPS2 input currents; (d) UPS1 DC bus capacitor voltage; (e) UPS2 DC bus capacitor voltage (same time window shown in Figure 6).
Energies 14 02270 g007
Figure 8. Power analyzer results: three load phase voltages, one line-to-line grid voltage, and one total grid phase current.
Energies 14 02270 g008
Figure 9. System response when different types of loads are connected to the UPS systems: (a) Load voltage; (b) load phase currents; (c) LSC1 phase currents; (d) LSC2 phase currents; (e) average UPS system output power and total load power.
Energies 14 02270 g009
Figure 10. System response when different types of loads are connected to the UPS systems: (a) UPS1 DC bus capacitor voltage. (b) UPS2 DC bus capacitor voltage; (c) UPS1 input current; (d) UPS2 input current; (e) total current absorbed from the grid; (f) zero-sequence circulating current (same time window shown in Figure 9).
Energies 14 02270 g010
Figure 11. System simulation for a high-power application: (a) load voltage; (b) load current; (c) LSC1 phase currents; (d) LSC2 phase currents; (e) UPS1 DC bus capacitor voltage; (f) UPS2 DC bus capacitor voltage; (g) average UPS system output power and total load power; (h) ZSCC.
Energies 14 02270 g011
Figure 12. Effectiveness of the proposed ZSCC suppression technique in a high-power application [Simulation]: (a) Zero-Sequence Circulating Current (ZSCC); (b) UPS1 input current; (c) UPS2 input current; (d) UPS1 LSC current; (e) UPS2 LSC current; (f) LSC1 neutral current; (g) LSC2 neutral current; (h) Total absorbed grid current; (i) load voltage.
Energies 14 02270 g012
Table 1. GSC and LSC switching states in phase X.
GSC/LSC Switching State ( S X )Active SwitchesGenerated Pole Voltage ( v XM )
1Upper two v C 1
0Middle two0
−1Lower two v C 2
Table 2. Electrical parameters of UPS systems.
Electrical ParameterValue
RMS grid line-to-line voltage120 V
GSC voltage frequency50 Hz
GSC filters inductance10 mH
Capacitance of each DC bus capacitor3 mF
LSC filters inductance 4.5 mH
LSC filters capacitance60 μF
Table 3. Control parameters used in both UPS controllers.
Control ParameterValue
Control sampling time90 μs
RMS load line-to-line voltage120 V
Load voltage frequency50 Hz
UPS1 and UPS2 DC bus voltage reference220 V
W i G , W i L , W z G and W z L 1
W b a l G and W b a l L 0.3
Table 4. Load voltage THD behavior when wrong load-side filter inductance values are considered in UPS controllers.
Error (%)Considered Inductance (mH)≈Load Volt. THD (%)
+30 5.85 2.6
+20 5.4 2.0
+10 4.95 1.5
04.51.2
−10 4.05 1.2
−20 3.6 1.2
−30 3.15 1.2
Table 5. Load voltage THD behavior when wrong load-side filter capacitance values are considered in UPS controllers.
Error (%)Considered Capacitance (μF)≈Load Volt. THD (%)
+3078 1.9
+2072 1.5
+1066 1.3
0601.2
−1054 1.2
−2048 1.2
−3042 1.2
Table 6. Grid current THD behavior when wrong grid-side filter inductance values are considered in UPS controllers.
Error (%)Considered Inductance (mH)≈Grid Curr. THD (%)
+3013 1.6
+2012 1.6
+1011 1.7
0101.9
−109 2.1
−208 2.5
−307 3.5
Publisher’s Note: MDPI stays neutral with regard to jurisdictional claims in published maps and institutional affiliations.

