Article

Simulation Verification of Overcurrent Protection Operation in Power Networks Integrating Renewable Energy Sources in Energy Communities

Department of Power System and Control, Silesian University of Technology, 44-100 Gliwice, Poland
*
Author to whom correspondence should be addressed.
Energies 2021, 14(8), 2193; https://doi.org/10.3390/en14082193
Submission received: 10 March 2021 / Revised: 4 April 2021 / Accepted: 12 April 2021 / Published: 14 April 2021
(This article belongs to the Special Issue Protection and Communication Techniques in Modern Power Systems)

Abstract

:
This publication discusses the risks of further use of classical overcurrent protections in modern power systems. The increasing penetration of renewable energy sources has caused a lot of challenges, among other things, the development of energy communities that balance local generation and consumption. Usually the interconnection line between the energy community and power systems are only used to balance the shortage or overflow of energy. As a result, most of the time these connections can be low loaded. Such a state can cause incorrect operation of power system protection approached, because the current level values are smaller than the required activation level for the protections. This article presents the potential incorrect operation of digital power system protection with overcurrent function. The obtained simulation results clearly show that the correctness of protection operation is strongly dependent on the level load of lines and the parameters and structure of the protection decision algorithms. These problems occur during low load line periods because these were not taken into account during the classical digital protection design stage. In the future this can cause problems with the fulfillment of the basic protection requirements of stability, speed, sensitivity. This publication suggests extra problems for power system protection research.

1. Introduction

Many countries want to become energy independent and to build zero-emission power systems (PSs). In order to achieve energy independence they need a lot of renewable energy sources (RESs). However, this leads to increased technical challenges for PS operators [1]. Many of these challenges have already been identified in detail and risk mitigation options have been defined, inter alia, in the Network Codes (NCs) [2]. These challenges apply in power system protection (PSP) as well [3]. Most operators are becoming aware that RESs are changing the conditions of PSP operation. In a state of disturbance, RESs behave differently from typical generating sources—especially during faults. The level of short-circuit current from RESs may not exceed the rated current [4,5,6]. This differs from the situation before, when the level of a short-circuit current was always several times higher than the rated current. Solutions have already been developed in order to ensure correct elimination of the faults in PSs with RESs. Some authors are proposing PSP implementation in distribution networks that are used in transmission networks [7]. Furthermore, many authors are proposing quite new protection functions for PSP [8,9,10,11].
The mentioned publications are mostly focused on the impact of different types of RESs on the level of short-circuit current and also the correct selection of settings for the PSP protection functions. They do not focus on how the grouping of RESs will affect the MV line which connects this group with PSs. In this case, the design aspects of PSP algorithms are also important. This article presents the architecture of digital protection algorithms which can determine the success of the PSP operations used on MV lines. For this purpose, the signal processing path (used inside the PSP) was modeled very precisely. This complex model is a digital twin of algorithms used in real PSPs. In particular, the focus was on those aspects that relate to the activation threshold of the decision algorithm. It allowed us to perform detailed tests of classic digital overcurrent PSPs. These is a key contribution of the development of PSPs for PSs characterized by high penetration of RESs.
Grouping RES, in particular, will occur in energy communities (ECs) that are developing with the idea of energy democracy, i.e., taking into account local social expectations. This will contribute to popularize ECs, including energy cooperatives and energy clusters [12,13,14,15]. In the EC, for stakeholders the first option in order to meet their needs is using locally available resources. In that case ECs expansion may cause a dramatic change of operation in the affected PSPs.
In the typical PS, customers are mainly supplied from large-scale generation sources via transmission networks, i.e., high voltage (HV) distribution networks and medium voltage (MV) and low voltage (LV) networks, whereas, in the future PS, the customers will be mainly suppled through the EC network. This will consequently cause time instances in which connections between the EC and the rest of the PS will be unloaded or loaded only with a small amount, as illustrated in Figure 1b. It is important to underline that EC balancing scenario may soon become reality, as a result of the development of microgrids.
Analyses have shown that a lack of load in the interconnection between EC and PS may cause problems with the PSP operation. The worst-case scenarios are when the PSP is not tripping when required or an extended tripping time of the PSP response. The probability of these happening is very high, because the digital protection functions will not operate properly at low current values. The processing of such a signal level can cause huge errors in determining the criteria values. Blocking the PSP operation during low current values is one of the basic design assumptions of classical digital PSPs. Incorrect operation of the MV line PSP that is connecting EC and PS is dangerous for both electricity users and power facilities. Identifying a scale of this problem is the purpose of the analyses shown in this publication. We did simulations of dynamic states accompanied with faults carried out for the PS model with EC. The conducted analyses allow us to conclude that the problem can be very important and we need a lot of effort to prepare the PSP for these changes.

2. PSP on MV Line Connection of EC with PS

The role of the PSP in the PS is very important. One of the tasks of the PSP is to protect PS objects and users against the effects of abnormal operating conditions [16]. The realization of this task is difficult. We need to know that the disturbance will be immediately identified and the object affected by the fault switched off as soon as possible. This is required in order to reduce risks regarding this object and other objects in the vicinity and to minimize the risk of escalation of the fault to other parts of the PS. The fast response of the PSP is also necessary to ensure the safety of the staff and users. At the same time, the opposing selective requirement of PSP operation should be taken into account. This requirement was established in order to minimize the effects of disconnections in PS caused by the PSP operation. The correct way to take these two opposing requirements into account is to making the selection of PSP functionality and settings very complex.
The functionality and settings of PSP are always selected individually for each power facility, taking into account its roles in the PS. MV power lines, that are connecting PS with EC, the most used overcurrent protection is selected as the basic PSP set. For the purpose of high-current fault detection, these protection functions are usually used [16,17]:
  • short-circuit overcurrent protection (symbol I>>);
  • time-delayed overcurrent protection (symbol I>).
The idea of locating overcurrent protection in the MV line, which is connecting the EC with PS, is presented in Figure 2. This is a significant change compared to the structure of the PSP in typical PSs. In typical PSs, without RESs, PSP is installed only in the PS side line. In such PSs, the short-circuit current in the MV line can only flow from PS to the network. However, in PSs with RESs, it is also possible for short-circuit current to flow from the EC (with RESs) to PS. This requires usage of PSP in the MV line and from the EC side line as well. This is necessary in order to ensure the safety of the PSs with RESs.
MV line short-circuit overcurrent protection is dedicated to protect the line against the effects of phase-to-phase faults. In typical PSs, such faults are usually accompanied by a high current flow, whose value is multiple times higher than the rated current. Therefore, it requires fast tripping of the protection, preferably instantaneous, in order to minimize the risk of the thermal and dynamic effects in a high-current fault. Additionally, fast tripping of the short-circuit overcurrent protection can prevent the tripping of the generators undervoltage protections in the EC. The possible delay of the short-circuit overcurrent protection tripping is 0.05–3 s [17]. Furthermore, the current setting of the protection should meet several conditions, such as contained in [17]. The key of these conditions is described with this formula:
I s e t k p I k m a x ,
where: I s e t —short-circuit overcurrent protection setting; k p —safety factor (usually within the range of 1.2–1.6); I k m a x —the highest expected value of the short-circuit current flow in the protection installation point during the fault at the end of the MV line.
An illustration of the expected operation of the short-circuit overcurrent protection is shown in Figure 3 for instantaneous tripping. The figure shows the time wave of the three-phase short-circuit current in the protection installation point (protection input signal) and the time course of the current fundamental harmonic RMS value (the criterion value of the protection) for the selected phase. The figure also shows significant points in time and important time frames for the protection operation. Figure 3 shows a possible example of the short-circuit overcurrent protection tripping in the typical PS, for the scenario of a three-phase metallic short-circuit in the MV line.
Analyzing MV line short-circuit overcurrent protection showed success in situations where the amount of the short circuit electricity power many times exceeds the I s e t , which in consequence is a multiple of I z . Therefore in the situations when we expected small value of short circuit power in EC, should significantly lower the value of I s e t , approaching to the I z value or even below it. However the sensitivity conditions and PSP selection will not be made. If so, this can create a risk of unnecessary action in this protection, even during a normal work mode, with a big overload on the line connecting EC with PS. That is unacceptable, because it limits the possible energy transfer level between the EC and PS.
MV line delayed overcurrent protection is designed to protect lines and connected objects from the effects of phase-to-phase faults. This protection is a backup for short-circuit overcurrent protection (local reserve) and also for the same type of protection used in other network objects (remote reserve). Required selectivity of PSPs tripping need use in the MV line delay overcurrent protection extra delay than should be 0.3–0.5 s longer than the tripping delay at the next protection point (simplified selection). In practice, the current setting of the protection is usually selected according to the following formula [17]:
I s e t > ( 1.1 1.2 ) I r ,
where: I s e t > —time-delayed overcurrent protection setting; I r —rated secondary current of the CT.
Figure 4 shows an illustration of the MV line delay overcurrent protection expected tripping, similar to Figure 3. The tripping of MV line overcurrent protection shown in Figure 3 and Figure 4 applies to the typical PS with MV lines with a medium or high load level. The proper operation of PSPs installed in this line are indicating the correctness of this approach. However, the connecting of local electricity generators and consumers in ECs presents a new challenge for PSPs. For example, when the EC achieves the balance of the generation and consumption (see Figure 1b), then the load current of the MV line (connecting the EC with the PS) is low. For that reason the elements of protection functions in the digital PSPs may be inactive. It is dictated by possible incorrect operation of measurement algorithms in digital PSPs—in the case of low load current the measurement algorithms can calculate criterion quantities with a significant error. Therefore in practice, the current limit operation for threshold functions protections are defined for digital PSPs. It is determined by the device manufacturer, depending on the design solutions used. Usually, 5–10% of the CT rated secondary current is assumed. However in some solutions, this level may be higher, and it can even reach 50%. This is often given as a current value range for the declared accuracy current of the measurement. Then the minimum value of this range should be treated as the threshold for possible actuation of protection functions–then the decision algorithm can make a decision on tripping or not tripping, depending on the current value in relation to the protection setting. In the publication uses the term “decision algorithm activity threshold”.
For typical PS, the decision algorithm activity threshold for overcurrent protection in PSPs was not a problem, because very rarely there was a situation with a small load on MV power lines. For PSPs with high penetration ECs may soon become common. This may degrade the performance of overcurrent protection. The scale of this threat was identified through simulations. These simulations were performed with the use of an overcurrent digital protection detailed model and a PS dynamic model.

3. MV Line Overcurrent Protection Model and the Network Simulation Model

3.1. Model of the MV Line Overcurrent Protection

The developed model of MV line overcurrent protection is a model of the digital PSP. The block diagram of this model is presented in Figure 5. The model structure complies with the required in [18]. This model includes in detail all the main steps of processing current signals into a criterion quantity. This signal is further processed in order to give an information about the line operating status and make the final decision of PSP. The original model of the digital PSP system was used, which was characterized in detail in [19].
The PSP model was developed in MATLAB Simulink. The special MATLAB functions were used. These functions are designed for modeling and simulating continuous and discrete systems, focusing on functions that are enabling analysis of dynamic states. This allowed a detailed inclusion of the most important elements of the overcurrent protection digital signal processing path, along with measurement and decision-making algorithms.
In the first block of the protection model is the analog anti-aliasing filtering (see Figure 5). The input signals from the network circuit model are filtered with a low-pass filter in order to limit its frequency band. A Butterworth 1st order filter was used. It is modeled in a discrete manner in order to present the analog filter from a real PSP system. The functions implemented in MATLAB were used for this purpose, i.e., the butter function in order to generate filter coefficients and the filter function in order to implement anti-aliasing filtering. For the assumed sampling frequency of the protection model, the cut-off frequency of the filter was set to 250 Hz. A dedicated fragment of the MATLAB script code was implemented in the block of analog anti-aliasing filtration is shown in Figure 6a. Figure 6b shows the characteristics of the modeled filter.
In the second block of the protection model is the reduction frequency of the signal. It is a representation of the analog-to-digital converter in the real PSP device. The purpose of the converter is to convert the signal from continuous to digital. Therefore, the reduction frequency of the signal block allows sampling frequency reduction of the protection model to 1000 Hz. This relates to the sampling frequency of the analog-to-digital converter of the real PSP. The block was realized in MATLAB using the interp1 function.
In the third block of the protection model is the filtration and orthogonalization. In this block are realized two functions:
  • filtering—a function designed to extract the fundamental harmonic from the signal, which is necessary to calculate the protection criterion;
  • orthogonalization—a function designed to determine orthogonal components of the signal, which are facilitating the calculation of the criterion value of the protection.
In the developed model, full-term window cosine and sine filters were used, which is the solution most often implemented in real PSP devices [18]. It allows realization of both simultaneously aforementioned goals, that are, the highband filtration and the basic harmonic orthogonalization of the signal. The following equations describe the components:
  • for the real component:
    I d 1 h L i ( n T i ) = 2 p k = 0 p 1 a ( k ) c o s i L i ( n k ) T i ,
  • for the imaginary component:
I q L i 1 h ( n T i ) = 2 p k = 0 p 1 a ( k ) s i n i L i ( n k ) T i ,
where: I d 1 h L i ( n T i ) , I q 1 h L i ( n T i ) —fundamental harmonic orthogonal components of the phase current L i ( i = 1, 2 lub 3) appointed in a discrete moment of time n T i ; a ( k ) c o s , a ( k ) s i n —stationary orthogonal filters weighting factors (cosine and sine); i L i ( n k ) T i —discrete phase current L i ; p = T w / T i —number of signal samples in orthogonal filter windows; T w —the length of the filter measurement window is equal to the period of the fundamental harmonic; T i —sampling period.
The filter function in MATLAB was used for this. The bandwidth characteristics of the filter are shown in Figure 7. In this block output signals are the cosine component of the I d L i 1 h ( n T i ) current fundamental harmonic and the I q L i 1 h ( n T i ) current fundamental harmonic sine component.
In the fourth block of the protection model is the determining criterion values (see Figure 5). This block is dedicated to the measurement algorithm, which representation the algorithm implemented in the real PSP device. This algorithm allows to determine the amplitude value of the current fundamental harmonic, according to the following formula:
I 1 h ( n T i ) = [ I d 1 h ( n T i ) ] 2 + [ I q 1 h ( n T i ) ] 2 .
In the developed model, the operation of determining the criterion value is performed for each discrete moment i.e., every 1 ms—time resulting from the assumed sampling frequency. For each time instant, the calculated value of the criterion value is compared with the protection setting. This is the basis for the assessment of MV line operating conditions made by the protection, in the block decision of the protection model:
  • if I 1 h I s e t or I s e t > (depending on the protection function), the protection is triggered and an impulse is sent to the circuit breaker in the line (after the set time delay)-such relation of I1h and Iset values is treated as a fault occurs in the line;
  • if I 1 h < I s e t or I s e t > , the protection will not tripping because such a relation between I 1 h and I s e t is treated as a normal state of the line.
Two variants of the protection model have been prepared for the purpose of detailed studies that concerned the operating conditions of overcurrent protection under low line load conditions:
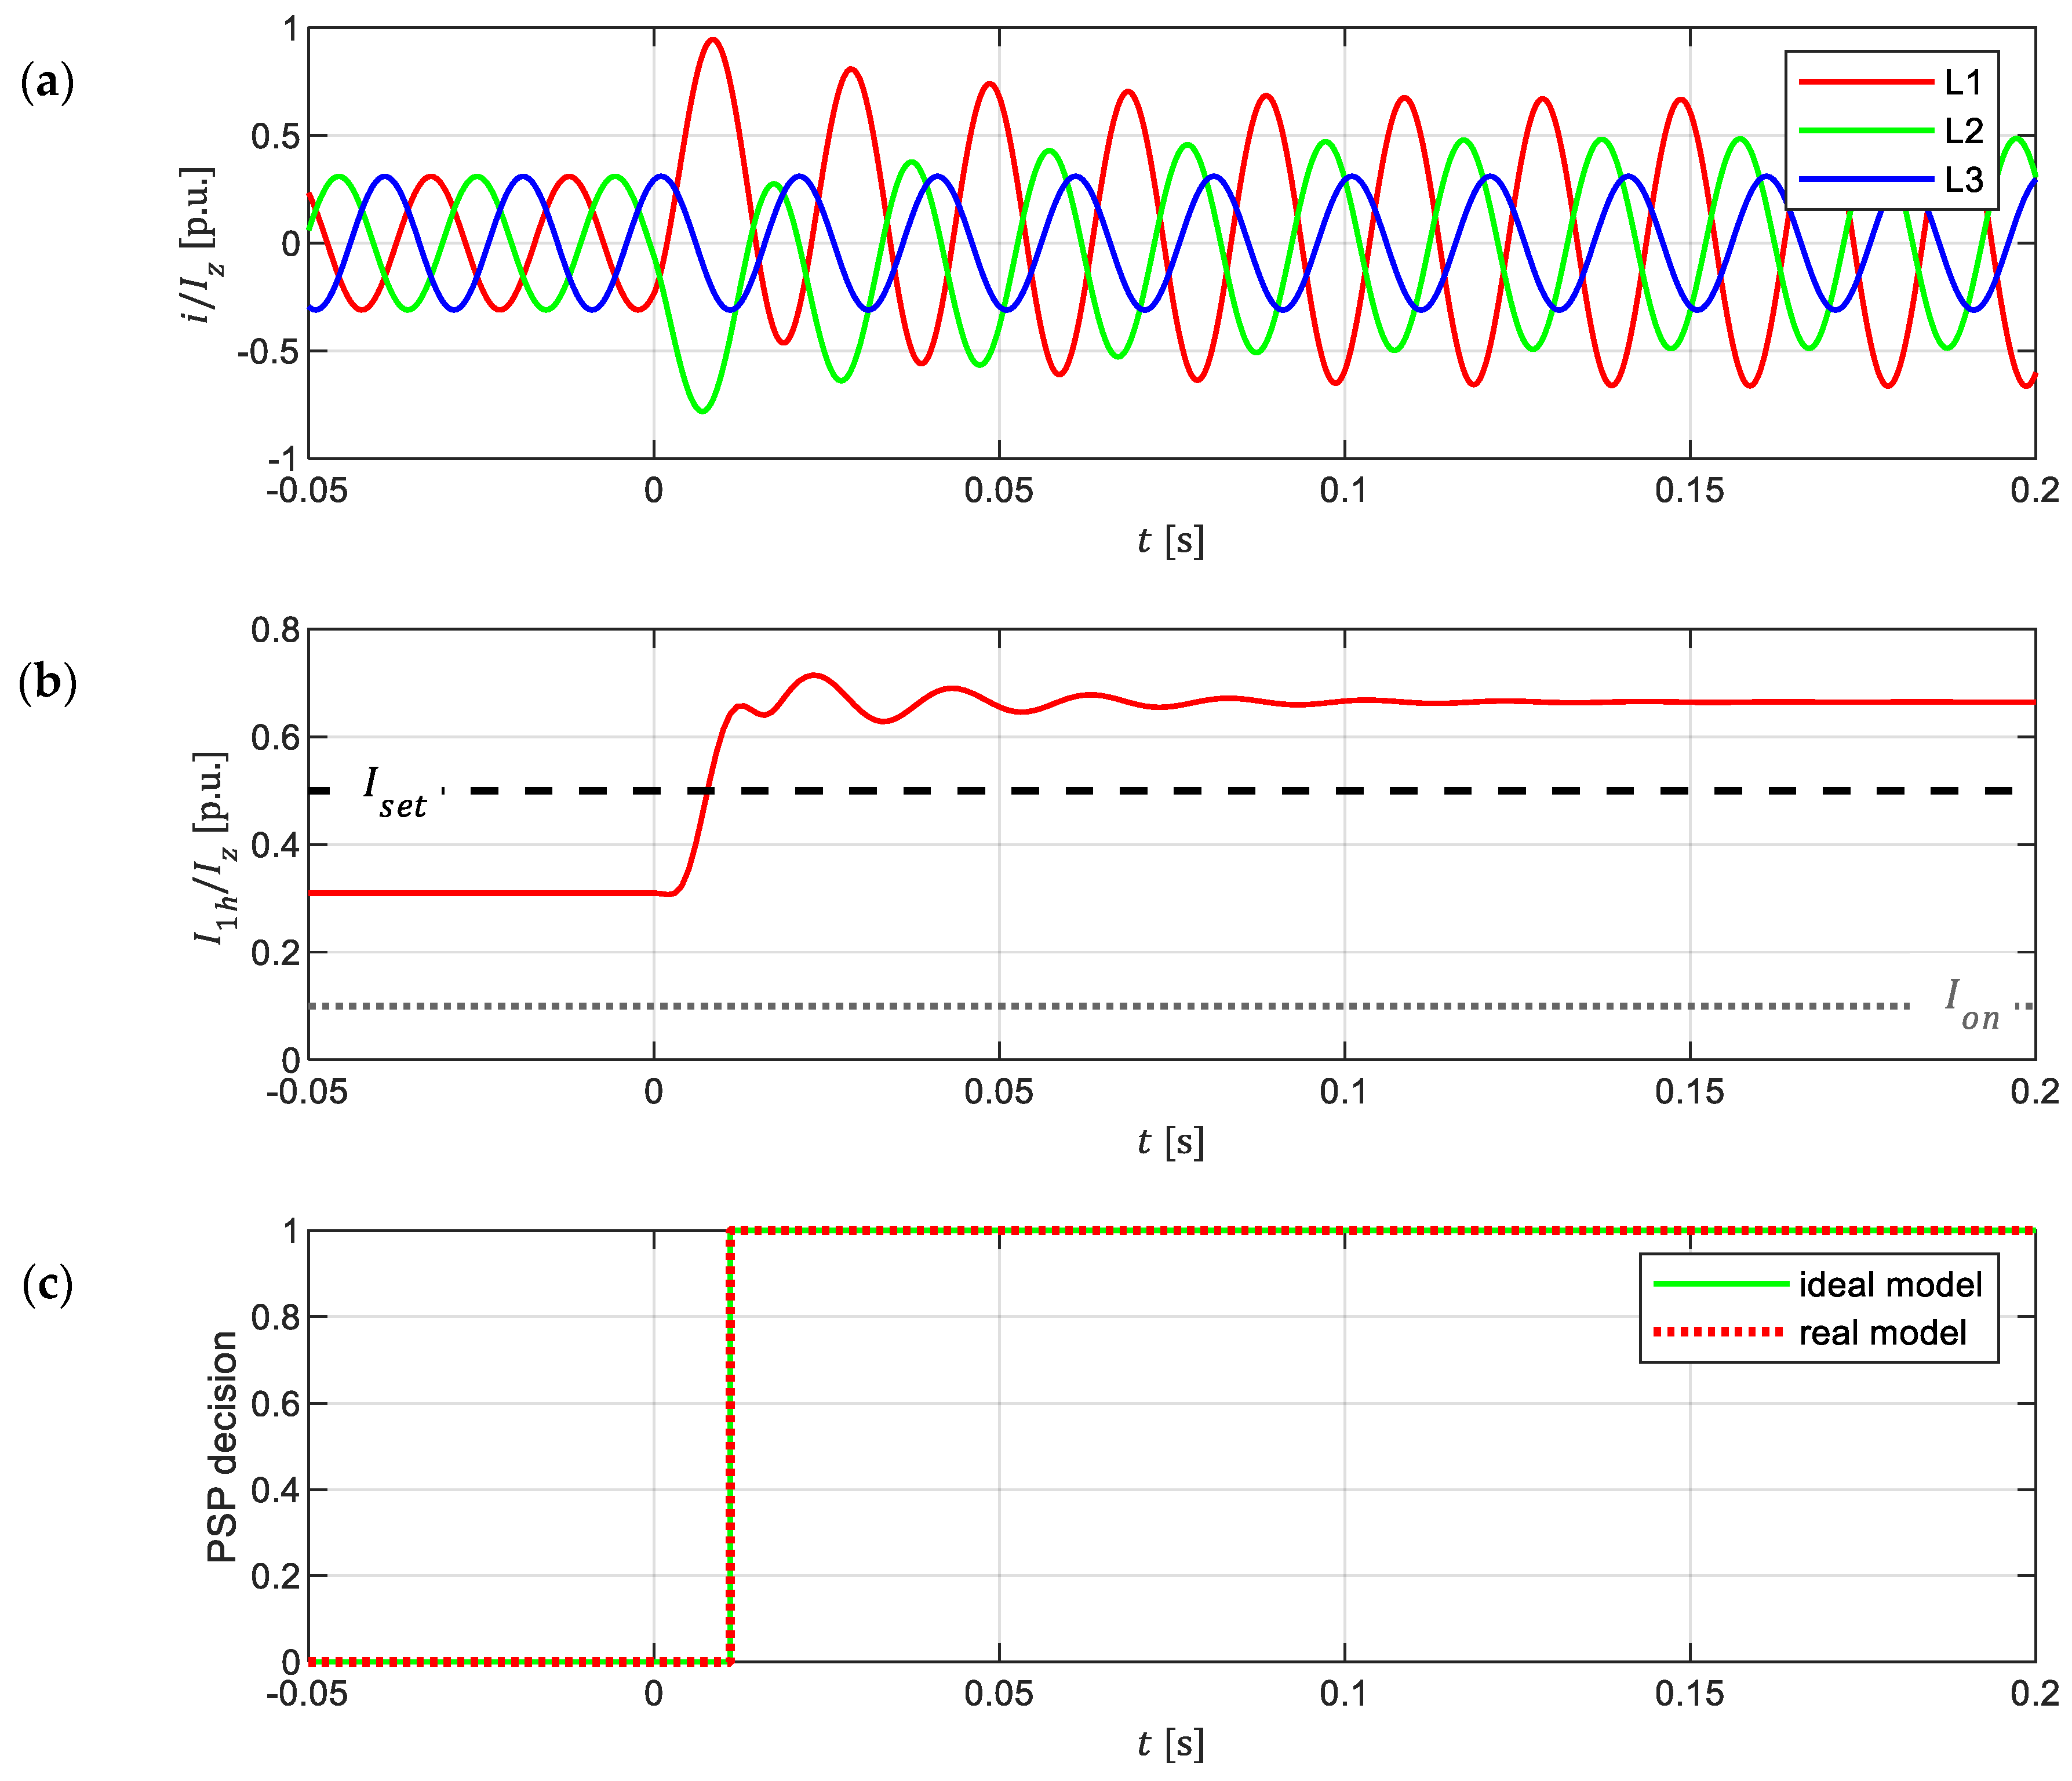
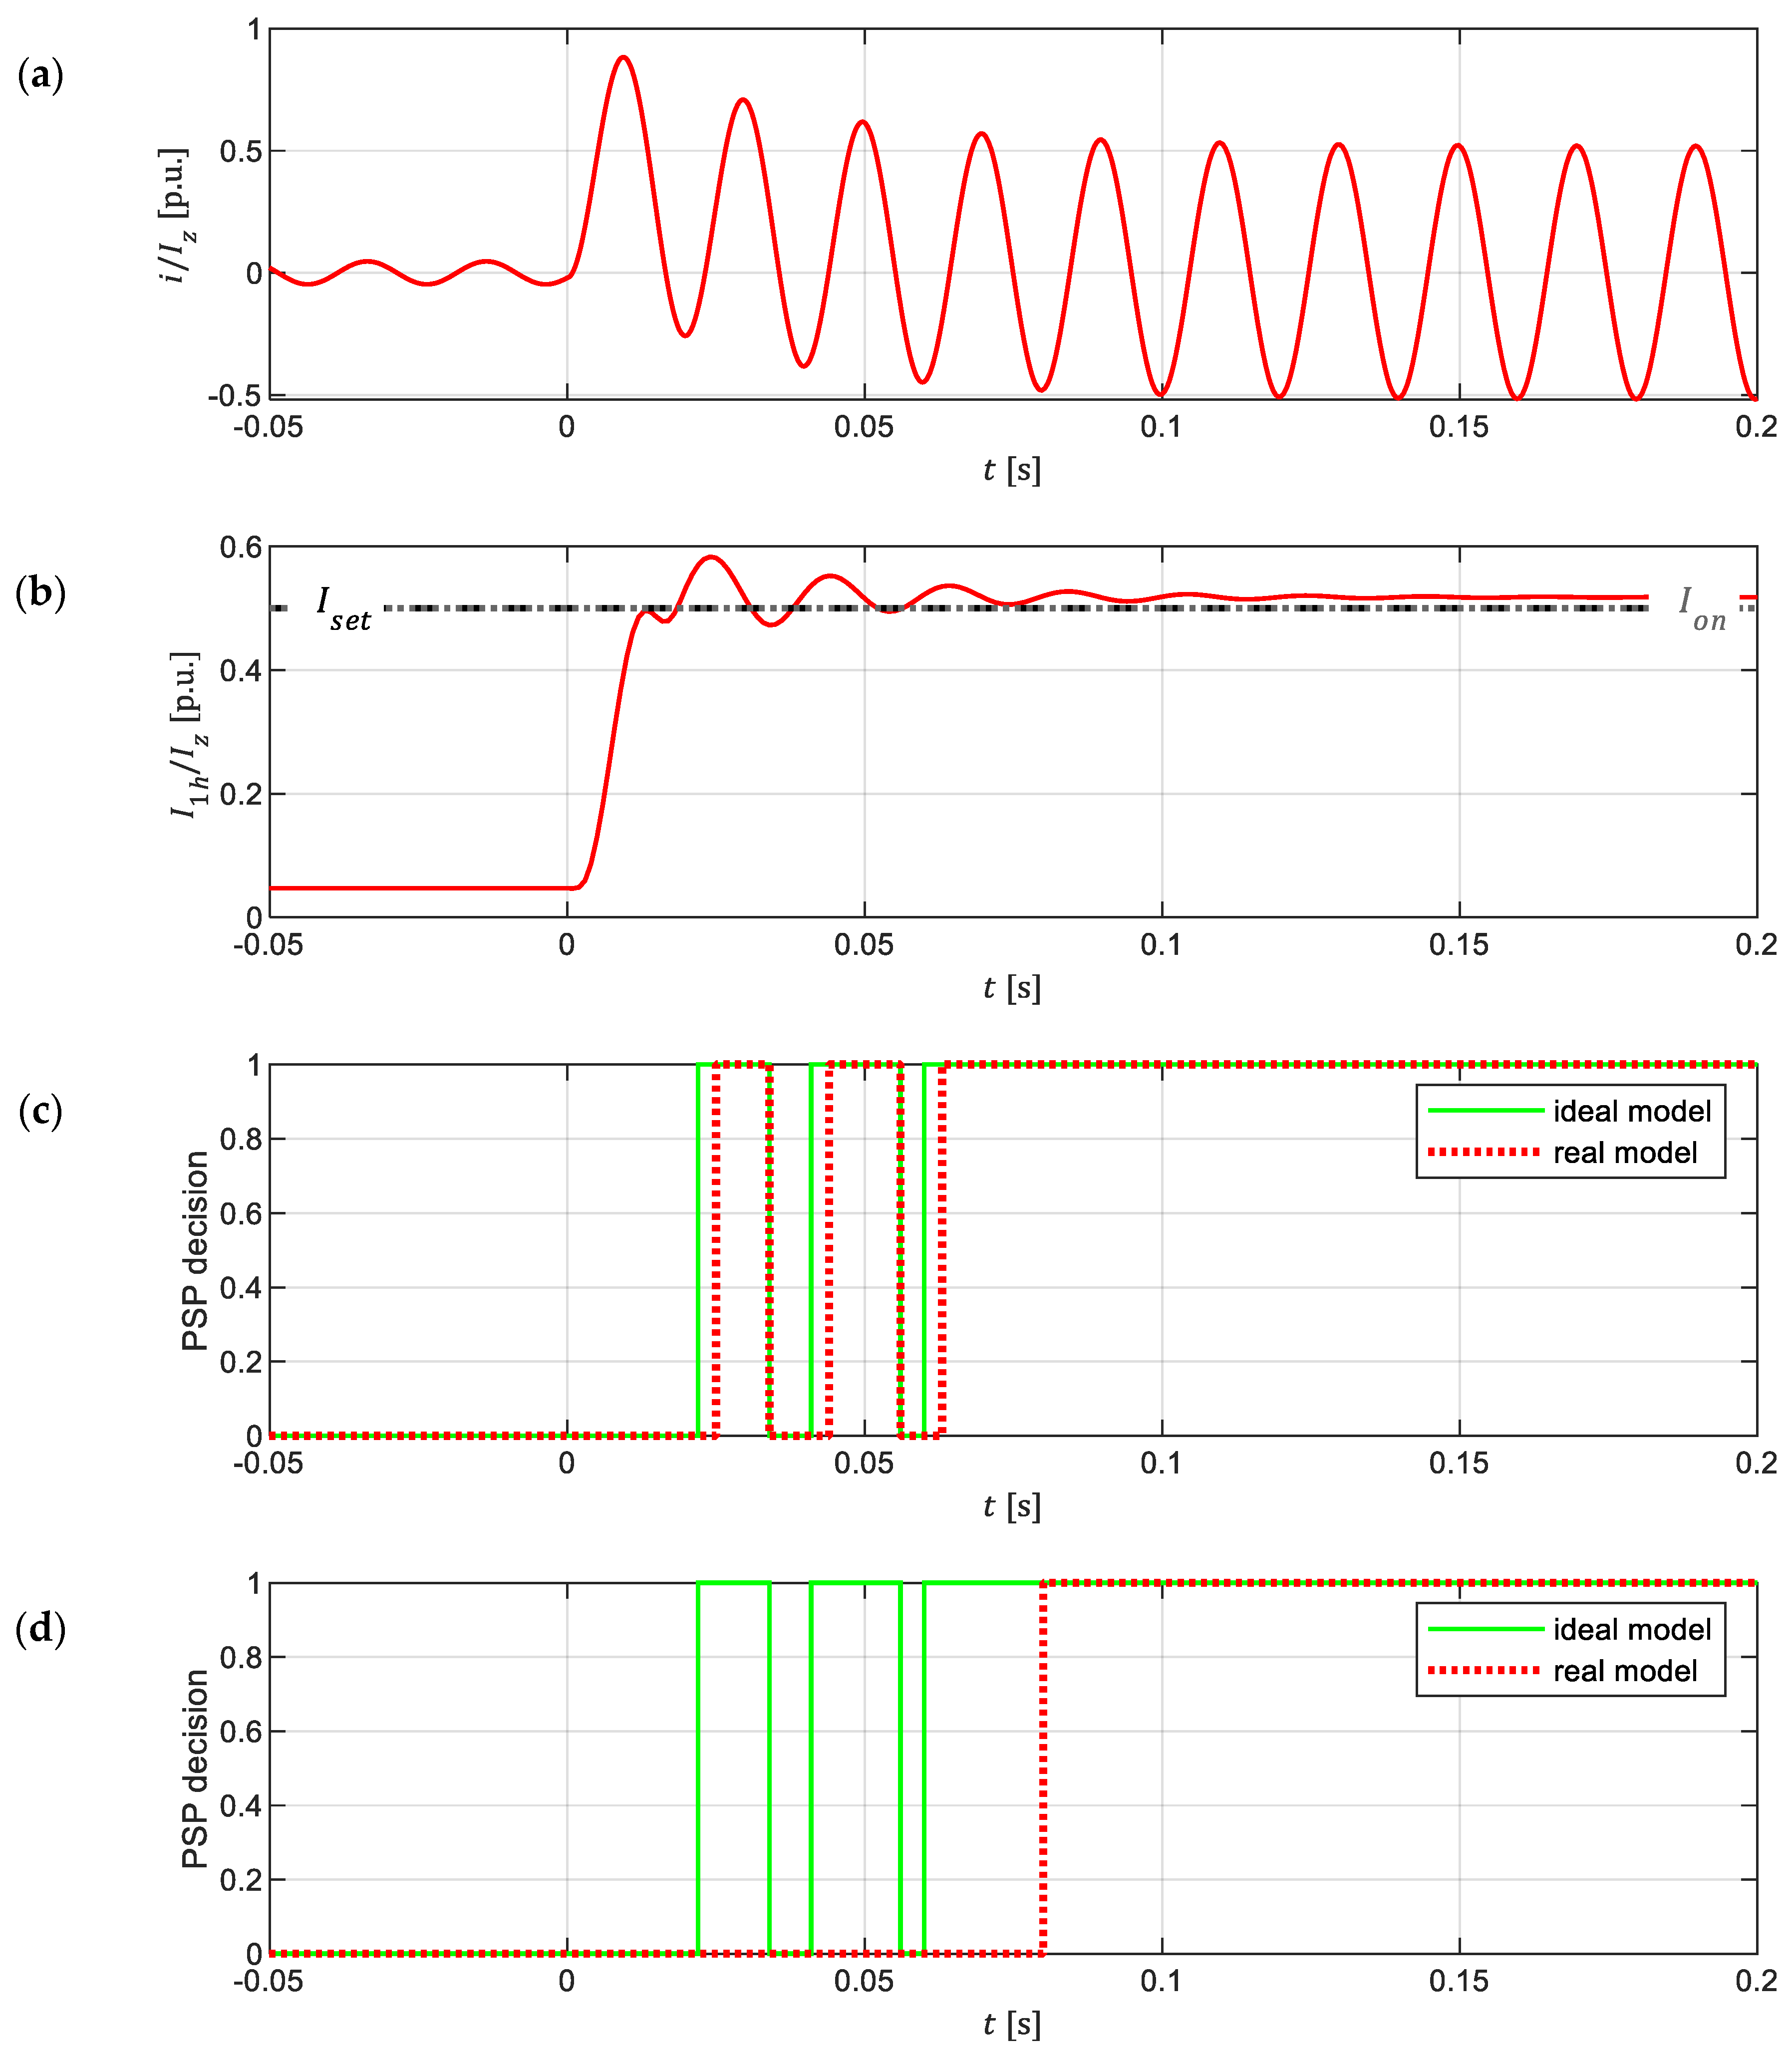
  • an ideal model, in which all elements of the protection function are implemented for each value of the current signal supplied to the PSP;
  • a real model, in which the execution of the block decision is made only for those criterion values that have been determined for the value exceeding the decision algorithm activity threshold.
The ideal variant of the protection model should be taken as a reference. It reflects the expectations for the operation of MV lines overcurrent protection without technical limitations. These limitations are included in the real model, which reflects the operation of real PSPs. The real model additionally states that the protection model decision block will be active only when the value of n consecutive samples (of the current signal) exceeds the set of algorithm activity threshold. It is used in real PSPs devices, because it minimizes the risk of a wrong decision in the event of a single jump in the signal value caused by e.g., an error in the measurement algorithm. It should be highlighted that the value of the decision algorithm activity threshold and the value of n in the n-sample criterion are parametric values of the protection model for the real variant.
In the ideal model and in the real model, a criterion functionally identical to the n-sample criterion (with the number n equal to 3) was used at the decision block output. In real PSPs, this criterion stabilizes the executive decision, which is distributed inter alia for breaker [19].
A direct comparison of the results for both variants of the protection model are allowing identification of incorrect operation risk with overcurrent protection in the event of a small load on the MV line.

3.2. Dynamic Model of a Network System Which Is Represented on PS with EC

The developed digital overcurrent protection model cooperates with the network system model. It is a dynamic model designed to analyze the electromagnetic transient states and in quasi-steady-state faults that are occurring in the operating network system (which is present on PS and EC). This model enables the analysis of PSP operation under faults. The structure of the model includes a chain of π-type line models that are representing an overhead MV line with a length of 10 km with AFL-6-70 mm2 wires. The PS equivalent is using Thevenin’s double, attached to the line. The rated voltage of the system is 15 kV. The PS short-circuit power, at the MV line connection point, can be changed in the range of 4–400 MVA, since it is a parametric value of the grid system model. This allows simulation of the operating conditions of MV line overcurrent protection, expected both: for a “strong” MV network, for typical PSs (maximum values of short-circuit power), and for EC with RESs (minimum values). To illustrate the assumptions made, Table 1 summarizes the effective values of the currents, that are flowing in the place where the protection is installed (at the beginning of the line), at the three-phase metallic short-circuit in a distance of 0.5 km from the PS. The point of installation of the protection should be understood as the point of installation of the CT, which supplies the current signal to the PSP.
The data presented in Table 1 shows that the effective value of the short-circuit current for extremely low short-circuit power may be several times lower than the long-term load current of the MV line connecting the EC with the PS (and thus the expected rated current CT). In such cases, the line overcurrent protection would need to be set below the MV long-term load current (see dependence 2). Usually, this approach is unacceptable because it leads to the risk of unjustified tripping of these protections even during normal operation, with a high load on the line connecting the EC with the PS.
It is important to underline that the change of the PS equivalent short-circuit power also changes the dynamics of the current value in the first moments of the fault. This has significant influence on the increase rate of the criterion value in overcurrent protection which is directly related to the expected identification speed of the fault in PSP. This represents the real operating conditions of the MV line overcurrent protection, depending on the parameters of the short-circuit current source. Figure 8 shows a comparison of the difference in the changes dynamics in the current instantaneous value (protection input signal) and the effective value of the current fundamental harmonic (the criterion value of the protection), for the extreme values of the short-circuit power set in the PS equivalent. These are the results of simulation of a three-phase metallic short-circuit in the MV line at a distance of 0.5 km from the PS, which occurred at the time t = 0 s.
From Figure 8 it follows that for the high amount of current short circuit network layout one needs to expect that the activation of the decision making overcurrent protection algorithm (conditioned by exceeding the activation threshold) will come much sooner (large gradient of increment of instantaneous values), than in network systems with a small value of short-circuit power, in which the slew rate and the achieved level of the criterion value of these protections are small.
In the developed model of the network system, the EC aggregator model was connected to the second end of the MV line. The supply and demand under the EC were selected to obtain 5% I z of the MV line load in the pre-fault condition. This value corresponds to the lowest value of the protection function activity threshold set in real PSP devices. The network system model was developed in MATLAB, with the use of partial models of network elements, which are designed to simulate steady and dynamic states accompanying normal operating conditions and faults in PS.

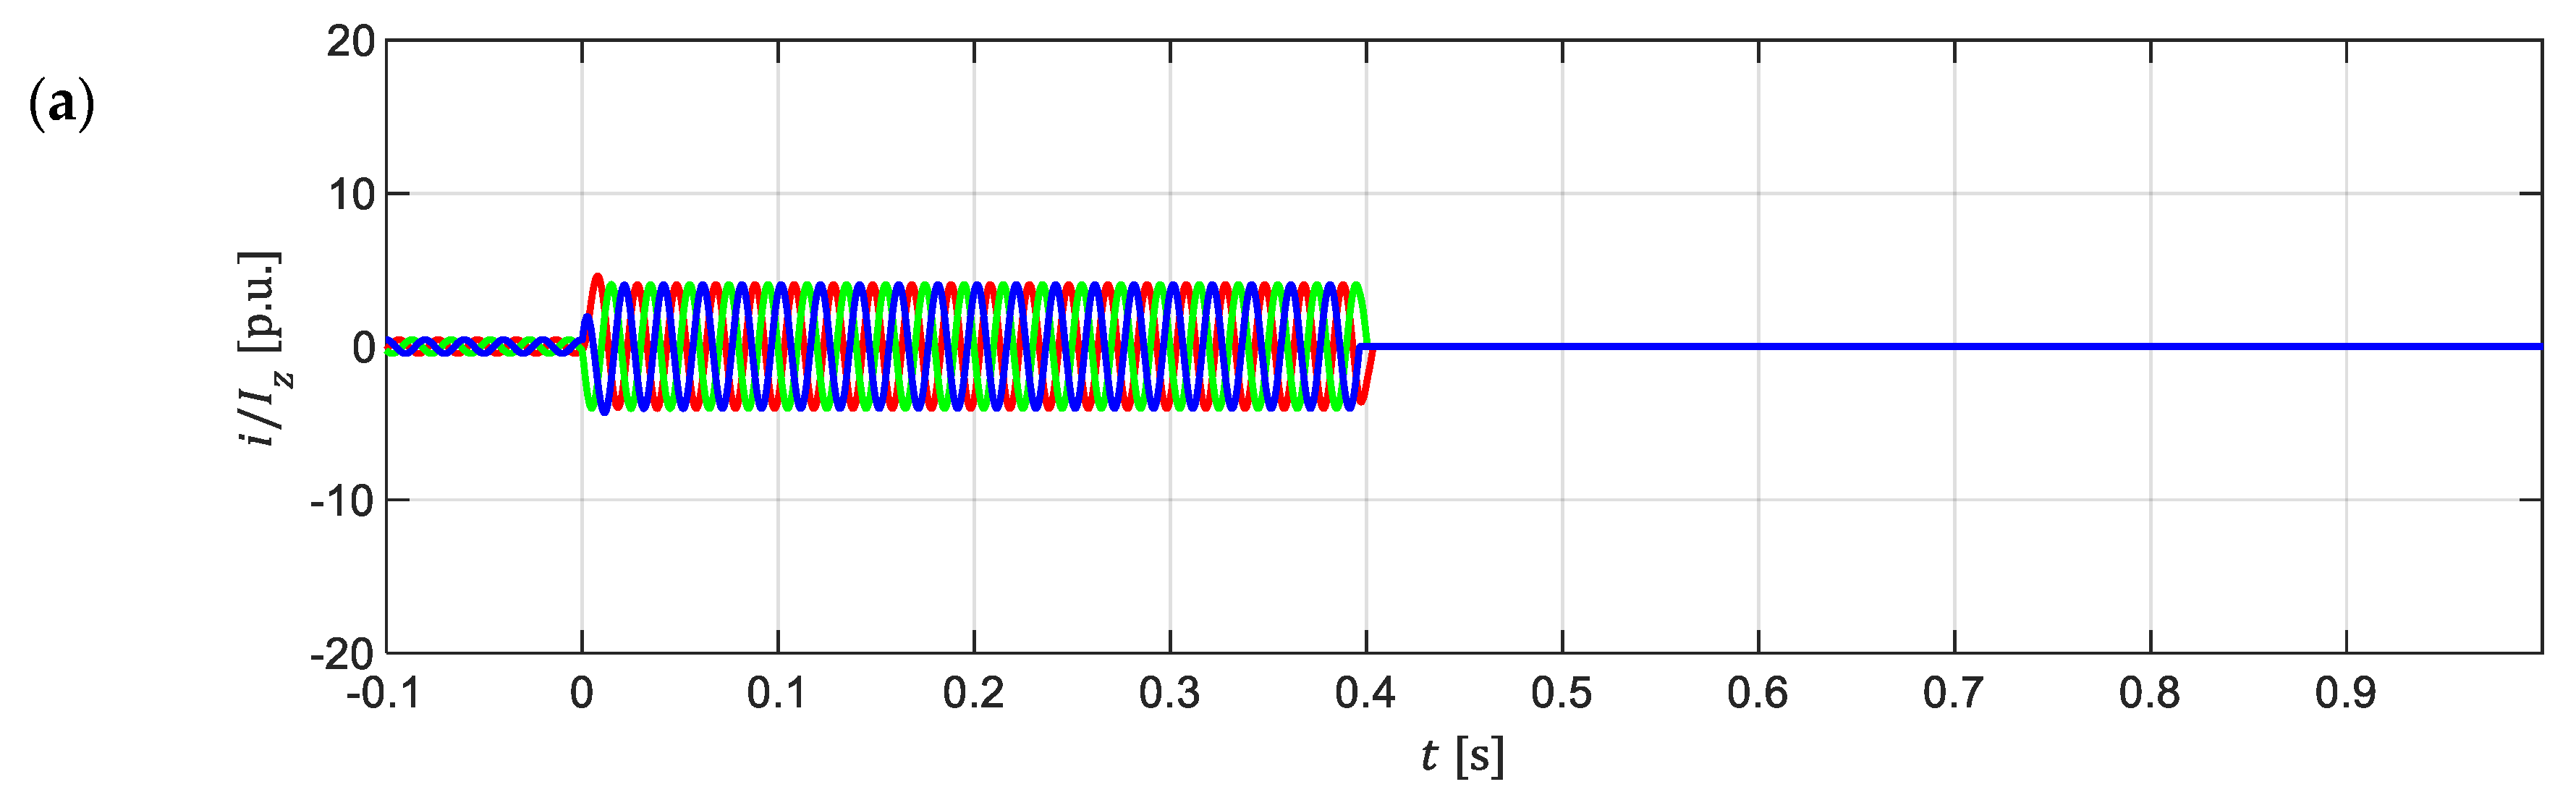
4. Simulation Results of the Operating Conditions of MV Line Overcurrent Protection

The simulations of the overcurrent protection operating conditions were performed in two research groups, with parametric changes of the short-circuit power PS in the network system model:
  • impact of the decision algorithm activity threshold value on the protection operation time;
  • influence of the value of n in the n-sample criterion on the protection tripping time.
These scenarios can give us the scale of the extension of the estimated time tripping of these protections (in the case of a small load on the MV line, depending on the activation parameters of the decision algorithm in the protection). Estimation was made by comparing the results of the ideal model and the real model of overcurrent protection. Thanks to this, it is possible to identify the risk of malfunctioning of these protections due to the technical limitations in the real digital PSPs devices, which are occurring in a small load on the MV line.
The simulation studies were performed for the overcurrent protection, with the set zero time delay. This approach to simulation avoids the influence of the parameter set by the user on the analysis results. For the purposes of the publication, it was assumed that the Iset protection setting is constant during all tests and is 50% of the long-term permissible line current of the grid system model (this corresponds with the highest value of the decision algorithm activity threshold in real PSPs devices). This enables direct comparison between simulation results, regardless of the individual settings. All test scenarios regarding a three- or two-phase metallic short circuit in the MV line connecting the EC with the PS, at a distance of 0.5 km from the end of the line, occurring at different times (to improve the clear of the drawings and the possibility of their direct comparison for various faults scenarios, the timeline in the drawings was set so that the beginning of the faults occurred t = 0 s).

4.1. Influence of the Decision Algorithm Activity Threshold on the Protection Operation Time

The threshold activity of the overcurrent protection decision algorithm is dependent on the technical solution of the protection function used in the PSP. However, its value determines the sample features of criterion quantities, which are used to make decisions in PSP devices. The decision is based solely on samples whose value exceeds the threshold. Thus, in the case of a low load line in the pre-fault condition, during the fault the decision algorithm activation will not be immediate—decision algorithm activation will be immediate when the value of the input signal (value of the criterion quantity) becomes higher than the threshold. This extends the decision-making process and, as a consequence, extends the duration of the fault. In Figure 9 is shown the impact of the decision algorithm activity threshold value (for 10% and 50%) on the protection operation time. The simulation of the three-phase short circuit in the MV line and n equal to 10 in the n-sample criterion was performed. In this case, EC is represented in the model of the network system by the PS equivalent to a 5 MVA short-circuit power.
The high activity threshold of the decision algorithm extends the protection operation time by over 35%. In this case, the change of the threshold from 10% to 50% is producing an actuation delay for 6 ms (from 17 ms for the 10% threshold to 23 ms for the 50% threshold). At the same time, the real protection model needs 77% more time than the ideal model. The ideal model would be activated 13 ms before the real model. This is caused because of the necessity to activate the decision algorithm in the real model, which in the pre-fault state remained inactive due to the too low value of the input signal of the protection (in the ideal model, the decision algorithm is still active). Nevertheless, for a low activity threshold of the decision algorithm, the activation time of the real model is significantly shorter than the activation time of the ideal model. Even a slight increase in the current line during a fault will be sufficient to exceed the threshold and activate the decision algorithm and start the process of developing a decision in the protection. On the other hand, with a high threshold value, in order to run the decision algorithm, it is necessary to increase the current value. It makes the 10% threshold setting PSP operation time significantly shorter than the protection operation time for 50% threshold settings (for the same short circuit case).
The obtained conclusions are indicating the need to take into account the aspects of the dynamics of changes in the value of the fault current. It is related, inter alia, with the value of the short-circuit power in PS. As shown in Figure 8, the higher short-circuit power is the greater expected growth of dynamics short-circuit current value will be. With a higher short-circuit power, the value of the input signal of the protection (value of the criterion value) reaches faster the decision algorithm activity threshold. It allows a quicker start of the decision-making process in the protection. As a result, the protection operation time will be shorter in PS with a high short-circuit power value than in EC with low short-circuit power value. In Figure 10, a threshold of 30% is shown.
Detailed results of the simulation of the overcurrent protection expected operating times are summarized in Table 2.
The different values of the decision algorithm activity threshold and different values of the short-circuit power are taken into account. In the simulation scenarios, for a “strong” MV network (represented by an equivalent with 400 MVA short-circuit power) protection operation time is usually shorter by 1–2 ms from the time of protection operation during a short-circuit in a “weak” network (represented by an equivalent of 40 MVA short-circuit power) and 7–26 ms from the time of protection operation during a short-circuit in the EC (represented by the equivalent of 4 MVA short-circuit power)—for the same activity threshold of the decision algorithm. For the ideal model, an increase of the dynamic value of the short-circuit current has the same impact as it has on the protection tripping time (see Table 2).

4.2. Influence of the n Value of the n-Sample Criterion on the Protection Operation Time

The value of n in the n-sample criterion is a parameter depending on the technical solution of the protection function used in the PSP. The value of this parameter determines the number of the criteria values samples that are necessary to reach a decision in the protection. It means that the protection tripping is only possible when the decision algorithm activity threshold is exceeded by n next samples. It is an important PSP functionality that stabilizes the protection operation, but on the other hand, the presence of the n-sample criterion may limit the protection operation speed.
In real PSPs, the value of n in the n-sample criterion is most often 3–20. Such a wide range of possible values of n results in an unequal influence of this criterion of activation overcurrent protection speed, in the case of a small load on these lines in the pre-fault state. This is shown in Figure 11, for the two extreme values of n. The simulation of the two-phase short circuit in the MV line and the decision algorithm activity threshold equal to 10% was performed. In this case, EC is represented in the model of the network system by the PS equivalent to a 5 MVA short-circuit power.
The obtained simulation results are clearly indicating that the value of n in the n-sample criterion has a direct impact on the protection activation speed. An increase in the value of n from 3 to 20 resulted in an adequate extension of the protection decision process from 13 ms to 27 ms. As a result, the tripping time of the protection was extended by over 100% in relation to the tripping time of the ideal model (13 ms). However, for n equal to 3, the operation time of the real model and the ideal model were identical. It is dictated by the low activity threshold set of the decision algorithm, equal to 10%. In the first moments of the fault, the current line exceeded the activity threshold, and the state of increased current value was the same for at least 3 consecutive samples, which led to the activation of the decision algorithm in the protection. Thanks to this, at the moment when the value of the criterion value exceeded the overcurrent protection setting in the real model, it was possible to immediately make a decision on its operation. It was happening at the same time as it was for the ideal protection model.
The simulation results presented in Figure 11 refer to a fault scenario in a network system with low short-circuit power. However, the influence of a high value of n in the n-sample criterion in the extension of the protection operation time is also visible at a high value of short-circuit power, especially in PSP with a high activity threshold of the decision algorithm. This is shown in Figure 12 for a fault in the MV line in a “strong” MV network (presented in the model of the network system by the equivalent with a 400 MVA short-circuit power PS). The overcurrent protection operation conditions were simulated with two extreme values of n, with the decision algorithm activity threshold equal to 50%. For the considered short-circuit scenario and the adopted parameters of the protection model, increasing the value of n from 3 to 20 made more unfavorable extensions of the protection tripping time, compared to Figure 11. The duration of the decision making process was extended by another 3 ms (in relation to the reference response time for the ideal model).
The presented simulation results are clearly showing that a high value of n in the n-sample criterion may result in an unfavorable and dangerous extension of the MV line overcurrent protection, in the event of a small load on this line in the pre-fault condition. This problem will not occur if the load line in the pre-fault condition is higher than the decision algorithm activity threshold in the protection. Then, all elements of the protection function can be operational when the fault occurs in the network system. This is possible because the current conditions are already in the pre-fault state and they do not require blocking of the protection decision algorithm. This is presented in Figure 13—fault scenario and the parameters of the protection model are identical to those considered in Figure 11 (threshold equal to 10%). The only difference is the level of the MV line load in the pre-fault condition, which in Figure 13 exceeds the threshold, unlike in Figure 11. Then the technical limitations of the real digital PSPs (the real model) are not becoming apparent. As a result, the operation time of the real protection model is identical to the operation time in the ideal model.
The protection operation times for the real model and the ideal model may differ significantly in the fault scenario when the load current value is close to the setting of the overcurrent criterion and the decision algorithm activity threshold in the protection. The decision of the n-sample criterion is not stable then. For high values of n, the risk of a significant extension time of the protection tripping is implied. This is due to the lack of a sufficient number of consecutive current signal samples exceeding the activity threshold of the decision algorithm. An example of such incorrect operation of the MV line overcurrent protection is shown in Figure 14—for fault in the MV line with the EC (represented in the network system model by the equivalent with a 4 MVA short-circuit power PS). Then, for n equal to 20, the required operation of the protection will take place only after 80 ms, with the expected operation of 22 ms (result for an ideal model).
The risk for presented malfunction of the overcurrent protection is particularly high for the lines connecting EC with PS. RESs in EC are usually characterized by a small value of the current generated during short-circuits. The RESs short-circuit current may not exceed the rated current, unlike before in the case of typical PSs, in which the short-circuit current was always several or several times higher than the rated current. For non-modernized network infrastructure, there is a necessity to use “low” settings in MV line overcurrent protection in order to ensure any short-circuit detection such as the network systems for the short-circuit current flowing from the EC. Nevertheless, even with such settings, it can result in a significant extension of the activation time of these protections. For the fault scenario and the adopted parameters of the protection model, shown in Figure 14, the short-circuit elimination time was almost four times longer than expected (see Figure 14d).

5. Discussion

Our detailed analyses of the simulations are clearly indicating that the development of EC is an additional factor that should be taken into account during the research and development of PSPs. It is necessary to ensure correct operation of the PSPs in future PS with a high penetration of RESs. A goal of this publication was to expand PSP research. The analysis of the simulation results had allowed us to identify the risk of incorrect operation of MV line overcurrent protection. This risk is the consequence of the “typical” selection of MV line overcurrent protection settings ( I k m a x > I s e t > I r ) and specific conditions PSPs in the future PSs. When is a low load on these MV lines, the technical limitations of the overcurrent digital PSPs may lead to extended operation time (it can be hazardous). Elements of the protection functions remain inactive, when the current is low, because the processing of such low signals in digital PSPs can lead to a big error within the decision criteria values. This extends the decision-making process, because the activation of the decision algorithm is possible only when the values of several consecutive samples of the current signal are exceeding the algorithm threshold. This is hazardous, because a delay in the protection operation causes an extension of the short-circuit clearance time. This can be a threat to both electricity users and PSs facilities.
It is really important to identify the incorrect risk of MV line overcurrent PSP. This mainly concerns the structures of future power systems with high penetration ECs with RESs. The detailed analysis of our simulation results clearly indicates that the mitigation of the risk can be achieved with special protection functions, with a low decision algorithm activity threshold and a small number of samples verifying the stability of this activation (n-sample criterion). The simulation studies showed that this should ensure the expected minimization of risks dictated by the mentioned technical limitations of digital PSPs. It will make it possible to maintain the current high effectiveness of PSPs.

Author Contributions

Conceptualization, M.S. and P.R.; methodology, M.S.; software, M.S. and P.R.; validation, P.R. and A.H.; formal analysis, M.S.; investigation, M.S.; resources, M.S. and P.R.; data curation, M.S. and P.R.; writing—original draft preparation, M.S.; writing—review and editing, P.R.; visualization, M.S.; supervision, A.H.; project administration, P.R.; funding acquisition, A.H. All authors have read and agreed to the published version of the manuscript.

Funding

This research received no external funding.

Institutional Review Board Statement

Not applicable.

Informed Consent Statement

Not applicable.

Data Availability Statement

Data sharing not applicable.

Conflicts of Interest

The authors declare no conflict of interest.

References

  1. Szablicki, M.; Rzepka, P.; Halinka, A.; Sowa, P. Diagnosis of challenges for power system protection—Selected aspects of transformation of power systems. In Proceedings of the International Conference Modern Electric Power Systems (MEPS), Wroclaw, Poland, 9–12 September 2019. [Google Scholar]
  2. European Union. Regulation (EC) No 714/2009 of the European Parliament and of the Council of 13 July 2009 on Conditions for Access to the Network for Cross-Border Exchanges in Electricity and Repealing Regulation (EC) No 1228/2003; European Union: Brussels, Belgium, 2009. [Google Scholar]
  3. Szablicki, M.; Rzepka, P.; Kielak, R.; Grzelka, M. Connection network code’s requirements for power system protection (Wymagania przyłączeniowych kodeksów sieci dla elektroenergetycznej automatyki zabezpieczeniowej). In Proceedings of the XXI Ogólnopolska Konferencja Zabezpieczenia Przekaźnikowe w Energetyce, Opalenica, Poland, 17–19 October 2018. [Google Scholar]
  4. Lubośny, Z. Wind Farm in Power System (Farmy Wiatrowe w Systemie Elektroenergetycznym); WNT: Warszawa, Poland, 2009. [Google Scholar]
  5. Sumei, L.; Tiansku, B.; Yanlin, L. Theoretical Analysis on the Short-Circuit Current of Inverter-Interfaced Renewable Energy Generators with Fault-Ride-Through Capability. Sustainability 2018, 10, 44. [Google Scholar]
  6. Yan, H.Y.; Feng, W. Short-Circuit Current Analysis for DFIG Wind Farm Considering the Action of a Crowbar. Energies 2018, 11, 425. [Google Scholar] [CrossRef] [Green Version]
  7. Voima, S.; Kauhaniemi, K. Using distance protection in smart grid environment. In Proceedings of the IEEE PES Innovative Smart Grid Technologies, Istanbul, Turkey, 12–15 October 2014. [Google Scholar]
  8. Solak, K.; Herlender, J.; Iżykowski, J. Transmission line impedance-differential protection with improved stabilization for external fault cases. In Proceedings of the 19th International Scientific Conference on Electric Power Engineering (EPE), Brno, Czech Republic, 16–18 May 2018. [Google Scholar]
  9. Brusilowicz, B.; Łukowicz, M.; Michalik, M.; Rebizant, W.; Schiel, L. Sensitivity comparison of admittance and watt-metric criteria for ground fault detection. In Proceedings of the 13th International Conference on Development in Power System Protection (DPSP), Edinburgh, UK, 7–10 March 2016. [Google Scholar]
  10. Halinka, A.; Rzepka, P.; Sowa, P.; Szablicki, M. New area measuring and decision algorithm concepts for power lines’ distance protection. In Proceedings of the 18th International Scientific Conference on Electric Power Engineering (EPE), Brno, Czech Republic, 17–19 May 2017. [Google Scholar]
  11. Halinka, A.; Rzepka, P.; Szablicki, M. Agent model of multi-agent system for area power system protection. In Proceedings of the Modern Electric Power System Conference (MEPS), Wroclaw, Poland, 6–9 July 2015. [Google Scholar]
  12. Strickland, D.; Varnosfederani, M.A.; Scott, J.; Quintela, P.; Duran, A.; Bravery, R.; Corliss, A.; Ashworth, K.; Blois-Brooke, S. A review of community electrical energy systems. In Proceedings of the IEEE International Conference on Renewable Energy Research and Applications (ICRERA), Birmingham, UK, 20–23 November 2016. [Google Scholar]
  13. Rzepka, P.; Sołtysik, M.; Szablicki, M. Models of energy clusters functioning (Modele funkcjonowania klastrów energii). Energetyka 2018, 2, 75–80. [Google Scholar]
  14. Szablicki, M.; Rzepka, P.; Sołtysik, M.; Czapaj, R. The idea of non-restricted use of LV networks by electricity consumers, producers, and prosumers. E3S Web Conf. 2019, 84, 1–8. [Google Scholar] [CrossRef]
  15. Szablicki, M.; Rzepka, P.; Wronka, A.; Dziendziel, A. The potential of energy clusters as the sources of missing power in the Polish Power System in the perspective of conventional units withdrawal (Potencjał klastrów energii jako źródeł brakującej mocy w KSE w perspektywie wycofywania jednostek konwencjonalnych). Rynek Energii 2019, 2, 35–40. [Google Scholar]
  16. Ziegler, G. Numerical Distance Protection: Principles and Applications, Berlin and Munich; John Wiley & Sons: Hoboken, NJ, USA, 1999. [Google Scholar]
  17. Hoppel, W. Protection Settings in MV Lines with Reclosers (Nastawy zabezpieczeń w liniach SN z reklozerami). Automatyka-Elektr. Zakłócenia 2017, 27, 6–21. [Google Scholar] [CrossRef]
  18. Szafran, J.; Wiszniewski, A. Measurement and Decision Algorithms of Digital Power System Protection (Algorytmy Pomiarowe i Decyzyjne Cyfrowej Automatyki Elektroenergetycznej); WNT: Warszawa, Poland, 2001. [Google Scholar]
  19. Szablicki, M. Area Adaptive Protection System on the High Voltage Multi-Ended Power Lines with Connected Wind Generation (Obszarowa Adaptacyjna Automatyka Zabezpieczeniowa Linii Elektroenergetycznych WN z Odczepowo Przyłączonymi Źródłami Wiatrowymi). Ph.D. Thesis, Silesian University of Technology, Gliwice, Poland, 2013. [Google Scholar]
Figure 1. The power exchange between EC and PS for imbalance situation (a) and energy balance (b) within the EC.
Energies 14 02193 g001
Figure 2. Places for installation of protection equipment, cooperating measuring and switching equipment in the MV line connecting the EC with PS (CT—current transformer).
Energies 14 02193 g002
Figure 3. Illustration of MV line short-circuit overcurrent protection expected operation during a three-phase short-circuit in the line, occurring at the time t = 0 s: (a) time wave of the three-phase current i ( t ) ; (b) time course of the current fundamental harmonic RMS value calculated in the protection for the L1 phase I 1 h ( t ) (the criterion value of the protection) ( I z —nominal current on the line).
Energies 14 02193 g003
Figure 4. Illustration of MV line time-delayed overcurrent protection expected operation during a three-phase short-circuit in the line, occurring at the time t = 0 s: (a) time wave of the three-phase current i ( t ) ; (b) time course of the current fundamental harmonic RMS value calculated in the protection for the L1 phase I 1 h ( t ) .
Energies 14 02193 g004aEnergies 14 02193 g004b
Figure 5. The basic elements of the developed digital model of MV line overcurrent protection ( Energies 14 02193 i001 representation of an analog signal; Energies 14 02193 i002 representation of a digital signal).
Energies 14 02193 g005
Figure 6. Model of the analog anti-aliasing filter used in the digital overcurrent protection model: (a) script code prepared in MATLAB; (b) the filter spectral transmittance.
Energies 14 02193 g006
Figure 7. Transmittance spectra of the normalized a pair of orthogonal filters implemented in the digital model of overcurrent protection.
Energies 14 02193 g007
Figure 8. Comparison of the dynamics of changes in the overcurrent protection operating conditions during a three-phase short-circuit, for 400 MVA and 4 MVA level of a short-circuit power PS of ( S k Q ): (a) time wave of i ( t ) (L1 phase current); (b) curse of I 1 h ( t ) (RMS value of the L1 phase current fundamental harmonic determine in the protection model).
Energies 14 02193 g008
Figure 9. The overcurrent protection operation during the three-phase short circuit of the MV line for different threshold values of the protection decision algorithm I o n : (a) time wave of the three-phase current i ( t ) ; (b) the L1 phase time course of the protection criterion value I 1 h ( t ) ; (c) decision for I o n = 10%; (d) decision for I o n = 50%.
Energies 14 02193 g009aEnergies 14 02193 g009b
Figure 10. The overcurrent protection operation during the three-phase short circuit of the MV line for 30% threshold value, for different short circuit powers: (a) time wave of the L1 phase current i ( t ) ; (b) time course of the protection criterion value I 1 h ( t ) ; (c) protection decision for the real model.
Energies 14 02193 g010
Figure 11. The overcurrent protection operation during the two-phase short circuit of the MV line for 10% threshold value, for different values of n of the n-sample criterion: (a) protection decision for n = 3; (b) protection decision for n = 20.
Energies 14 02193 g011
Figure 12. The overcurrent protection operation during the two-phase short circuit of the line in the “strong” MV network, for different values of n of the n-sample criterion: (a) protection decision for n = 3; (b) protection decision for n = 20.
Energies 14 02193 g012
Figure 13. The overcurrent protection operation during the two-phase short circuit of the MV line, for different values of n-sample criterion, for the line load in the pre-fault state exceeding the decision algorithm activity threshold: (a) time wave of the three-phase current i ( t ) ; (b) the L1 phase time course of the protection criterion value I 1 h ( t ) ; (c) protection decision for n = 20.
Energies 14 02193 g013
Figure 14. The overcurrent protection operation during the three-phase short circuit of the MV line, for different values of n-sample criterion, for the for a small line load in the pre-fault condition: (a) time wave of the L1 phase current i ( t ) ; (b) time course of the protection criterion value I 1 h ( t ) ; (c) protection decision for n = 3; (d) protection decision for n = 20.
Energies 14 02193 g014
Table 1. RMS values of the current fundamental harmonic, at the point of installation of the MV line overcurrent protection, for different values of the PS short-circuit power.
PS Short-Circuit Power [MVA]The Maximum Value of the Current in the First Moments of the Short Circuit [kA]The Value of the Current in the Quasi-Steady State of Short-Circuit [kA]
40.160.15
401.611.41
40011.9310.33
Table 2. The MV line overcurrent protection times of operation for different values of the short-circuit power PS.
PS Short-Circuit Power [MVA]Time of Protection Operation for the Real Model [ms]Time of Protection Operation for the Ideal Model [ms]
Threshold 10%
42222
40157
400145
Threshold 20%
42222
40167
400155
Threshold 30%
42222
40167
400155
Threshold 40%
42322
40177
400155
Threshold 50%
44122
40177
400155
Publisher’s Note: MDPI stays neutral with regard to jurisdictional claims in published maps and institutional affiliations.

