Article

100 kW Three-Phase Wireless Charger for EV: Experimental Validation Adopting Opposition Method

Politecnico di Torino, Department of Energy, Corso Duca Degli Abruzzi 24, 10129 Torino, Italy
*
Author to whom correspondence should be addressed.
Energies 2021, 14(8), 2113; https://doi.org/10.3390/en14082113
Submission received: 26 February 2021 / Revised: 23 March 2021 / Accepted: 7 April 2021 / Published: 10 April 2021
(This article belongs to the Special Issue Wide Band Gap Devices in Energy Storage Systems)

Abstract

:
This paper presents the experimental validation, using the opposition method, of a high-power three-phase Wireless-Power-Transfer (WPT) system for automotive applications. The system under test consists of three coils with circular sector shape overlapped to minimize the mutual cross-coupling, a three-phase inverter at primary side and a three-phase rectifier at receiver side. In fact thanks to the delta configuration used to connect the coils of the electromagnetic structure, a three-phase Silicon Carbide (SiC) inverter is driving the transmitter side. The resonance tank capacitors are placed outside of the delta configuration reducing in this way their voltage sizing. This WPT system is used as a 100 kW–85 kHz ultrafast battery charger for light delivery vehicle directly supplied by the power grid of tramways. The adopted test-bench for the WPT charger consists of adding circulating boost converter to the system under test to perform the opposition method technique. The experimental results prove the effectiveness of the proposed structure together with the validation of fully exploited simulation analysis. This is demonstrated by transferring 100 kW with more than 94 % DC-to-DC efficiency over 50 mm air gap in aligned conditions. Furthermore, testing of Zero-Current and Zero-Voltage commutations are performed to test the performance of SiC technology employed.

1. Introduction

Over the past few years, the research and development of Electric Vehicles (EVs) has experienced exponential growth due to the new political and legislative framework on vehicle CO 2 emissions. Nevertheless, EVs are still affected by problems of limited range and, consequently, EVs will need a high number of stops to charge the battery due to the low energy density of the power supply systems. A possible solution to these issues could be the adoption of high-power Wireless-Power-Transfer (WPT) systems. This technology could also simplify the charging operations, compared to the classical plug-in structures [1,2,3] and improve the safety of the users. Moreover, WPT could strongly reduce the overall charging time.
Most WPT systems already studied in the literature present single-phase structure [4,5]. However, if the WPT systems increase power, the possibility to switch to polyphase structures must be taken into consideration thanks to a uniform distribution of electromagnetic field and the lower heating losses at the same working condition of single-phase structures [6,7,8].
Most of the already performed research in the field related to three-phase IPT system has been done to investigate the dynamic EV charging process [9,10,11,12,13,14,15,16]. Some works have already been conducted in the directions of three-phase coupler pads using single-phase windings [7,17,18]. However, the issue of phase-to-phase cross-coupling turned out to be a problem in the power transferred because of the leaking of flux [19,20,21].
This paper presents a WPT ultrafast charger for a light-duty vehicle, directly supplied by the power grid of an urban tramway substation. This system consists of a TriPolar-Pad (TPP) structure that stems from the structure proposed in [8], a three-phase SiC-based inverter, at the transmitter side, and a three-phase Si-based diode bridge at the receiver side. The system with this configuration has the purpose of improving power density and specific power transfer for EVs battery charging applications.
This work shows a test methodology based on the opposition method [22] to avoid the adoption of both proper power supply and load able to manage the rated power of 100 kW. In this configuration, another converter, identical to the WPT inverter one, is used as a boost converter to maintain the output voltage at the reference value of the equivalent emulated battery. Furthermore, this paper presents a detailed description of Zero-Voltage-Switching (ZVS) to reduce over-voltages during commutation and increases the performance of the system without changing the working frequency.
This paper follows the structure presented next. Section 2 presents the WPT charging system under analysis and the test-bench structure used to validate it. Section 3 displays first the electromagnetic description of the TPP and then the system simulation and control analysis. Section 4 describes the manufactured WPT structure and the converter practical design. Section 5, in its first part, introduces the experimental test-bench. The second part, reports for the experimental results in terms of power transferred, efficiency as well as voltage and current waveforms. Finally, Section 6 summarizes all the outcomes and provides final thoughts on the results reached for future developments.

2. Charging Structure

The proposed three-phase WPT system and its final charging application are schematized in Figure 1. The supply of the system is a substation of the DC electric grid of the tramway line, used as power source for the charging hub.
Considering the tramway substation, it must be noticed that voltage swings could occur, at DC supply line, due to the regenerative brake system of the tram [23]. For this reason, it has been decided to use 1700 V power modules for the WPT inverter depicted in Figure 1.
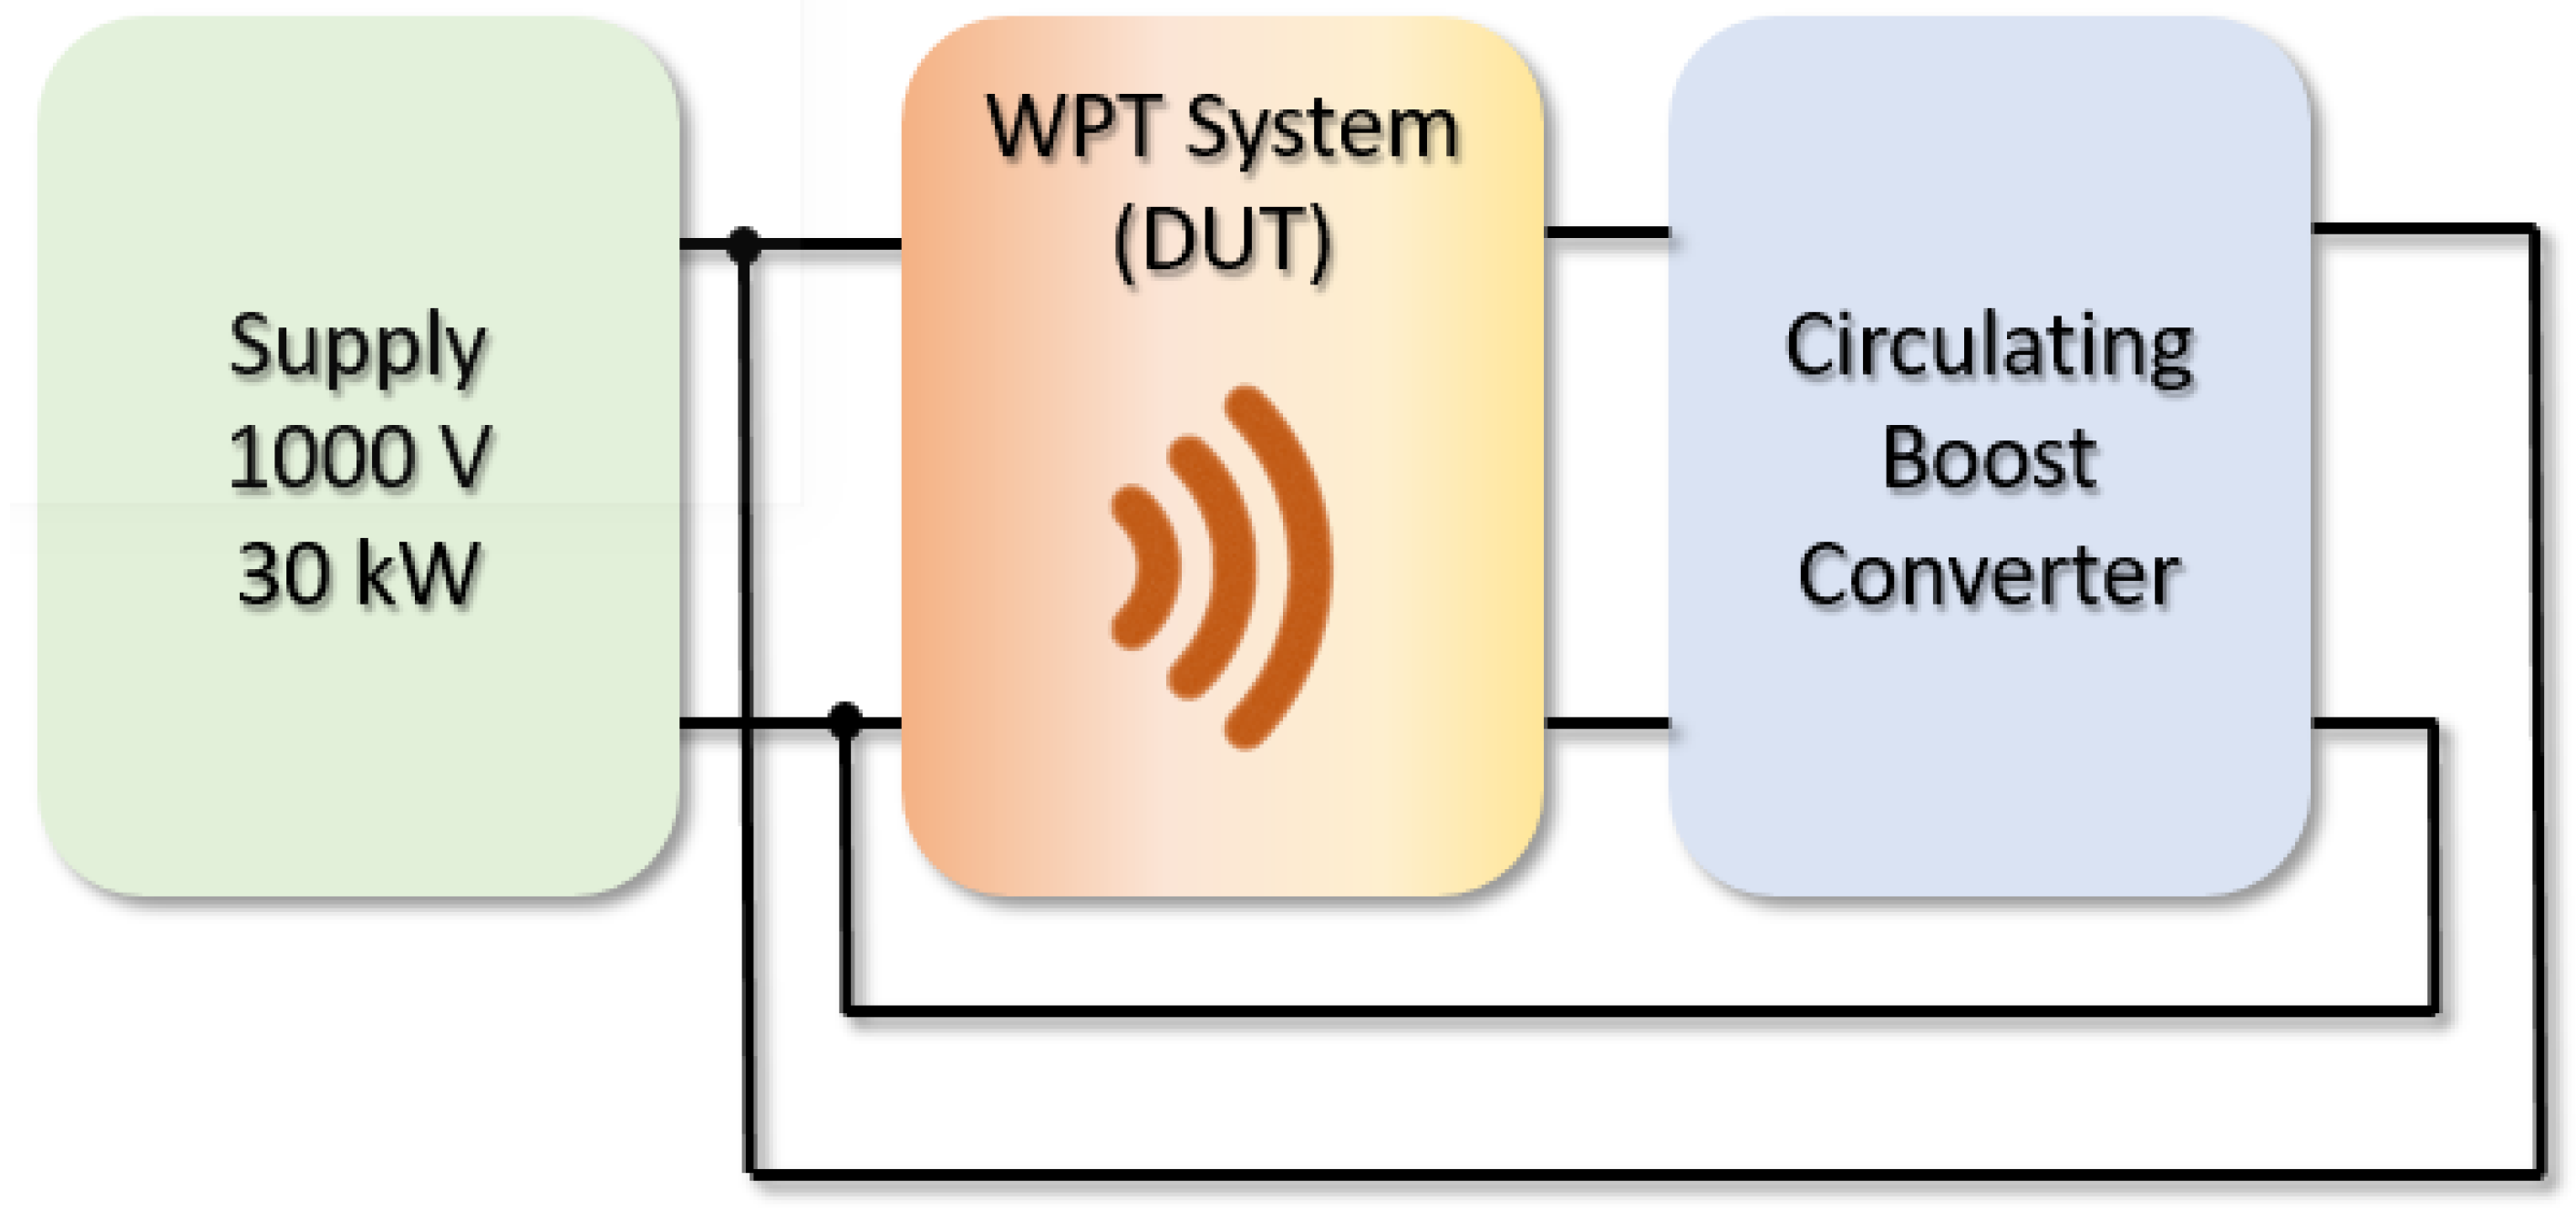
Still referring to Figure 1 a brief consideration must be done regarding the experimental validation of the WPT system. In fact, to avoid the adoption of a proper source and a non-dissipative load capable of working with a rated power of 100 kW [24,25], the structure under analysis has been tested using opposition-method technique [22,26] as shown if Figure 2. Because of this, a 30 kW power supply has been used only to sustain the losses of the entire system. Therefore, to maintain a fixed voltage level on the load side (emulating the battery), a three-phase boost converter, identical to the inverter on the primary side, has been used as depicted in Figure 2.

3. System Modelling

3.1. Electromagnetic Structure Description

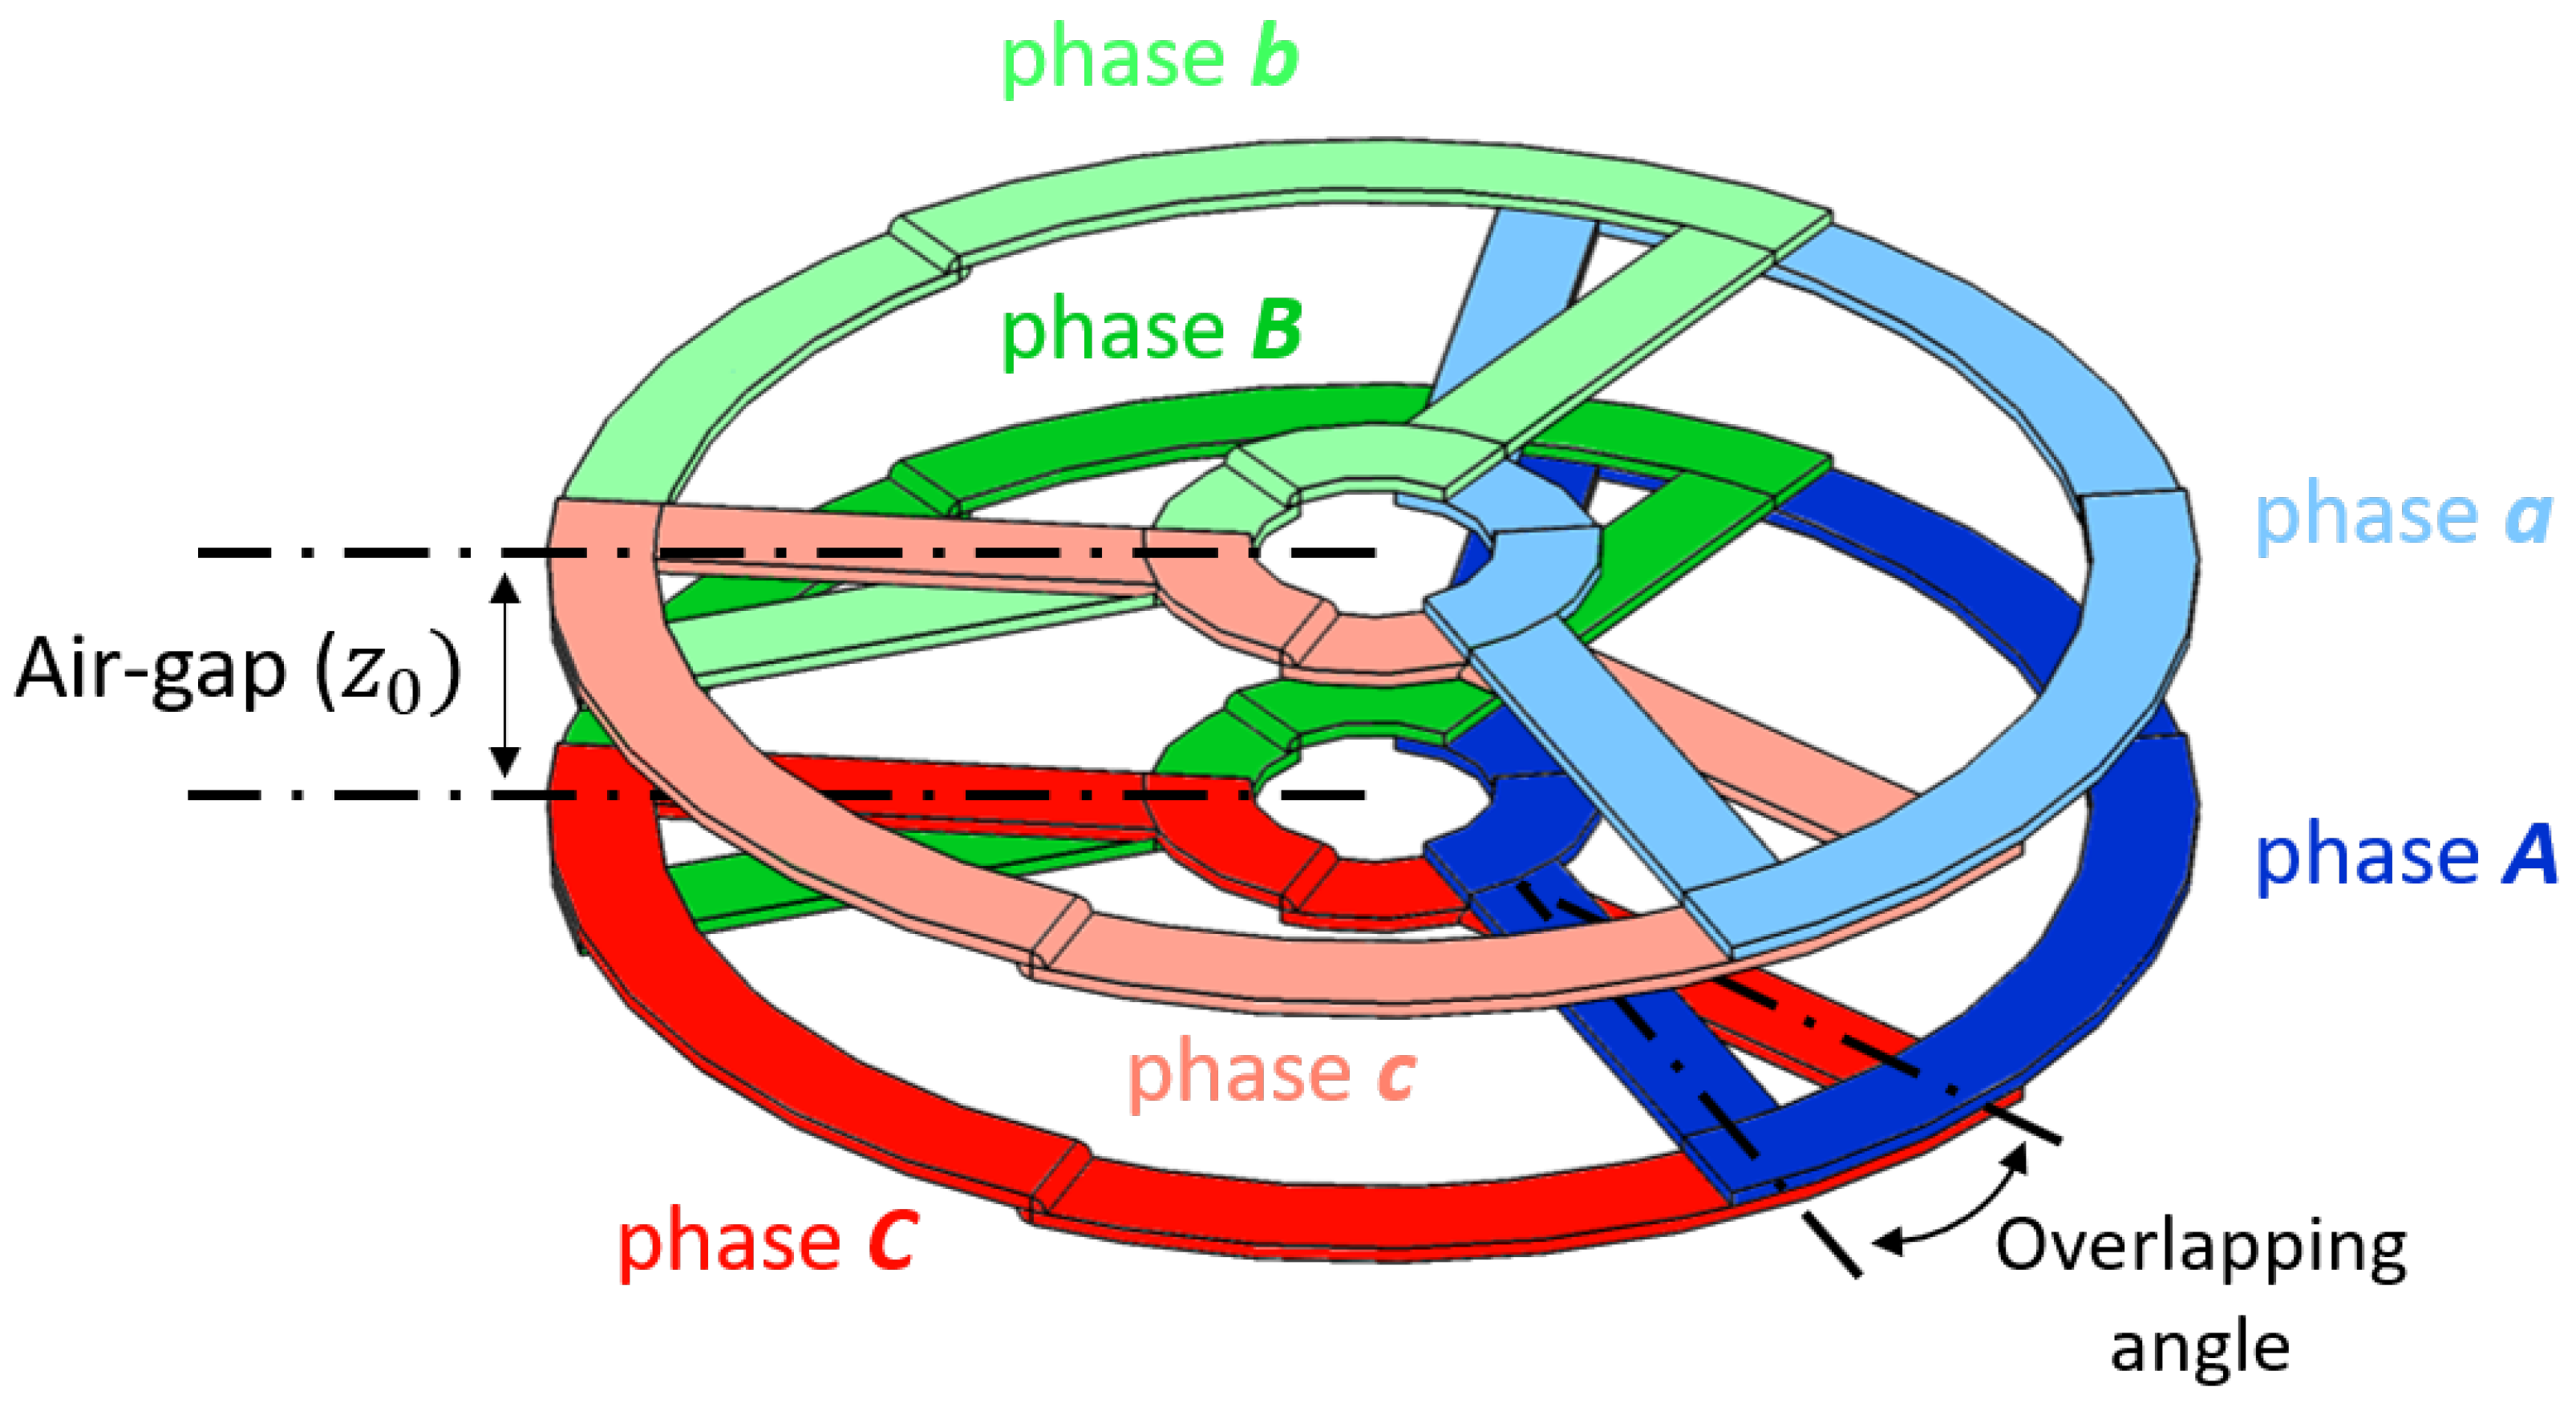
The proposed three-phase 3D model adopted for sizing and simulation is reported in Figure 3. On each side, this topology is based on three coils connected in symmetrical configuration both at the primary and secondary side. The resulting geometry is a circular pad with the aim to minimize the mutual magnetic coupling between two adjacent phases. Hence, compared to already proposed systems [27,28], the structure consists of the overlapping of every single coil with the next one [8].
The TPP coils, briefly described before, are manufactured in litz wire due to the high-frequency currents circulating in the phases. The cross section ( S ) has been chosen with the goal of a current density lower than 4 A/mm2. Hence TPP operates without any cooling considering the short operational time of the application and because of the mechanical constraints for the box, where the coils have been placed. The main parameters of the coils, from the Finite-Element-Analysis (FEA) design validation, are listed in Table 1.
Supposing now the minimization of the phase-to-phase magnetic coupling, it is possible to assume the three-phase system as three single-phase structures shifted by 120 mechanical (and then electrical) degrees between each phase. Therefore, the design of the resonant system has been addressed as a single-phase problem at the resonance frequency ( ω = ω 0 = 2 π f 0 ).
Keeping into consideration the resulting electromagnetic structure, it is possible to approach to a simplified analytical model, used afterwards to implement circuital simulations. This model, starting from the considerations made previously, can be expressed by the matrix (1).
V ^ A V ^ B V ^ C V ^ a V ^ b V ^ c = j ω 0 L A 0 0 M A a 0 0 0 L B 0 0 M B b 0 0 0 L C 0 0 M C c M a A 0 0 L a 0 0 0 M b B 0 0 L b 0 0 0 M c C 0 0 L c I ^ A I ^ B I ^ C I ^ a I ^ b I ^ c
In the characteristic matrix in (1) also the crossing coupling terms, from the transmitter to receiver can be neglected because of the overlapping described above [8] at least in perfect alignment. As a result, the matrix in (1) consists only of the self-inductances of the coils ( L A , L B , L C , L a , L b , L c ) and the mutual coupling terms of the three equivalent single-phase systems ( M A a , M B b , M C c , M a A , M b B , M c C ). Regarding the mutual coupling it must be noticed that thanks to the identical mechanical shape of the transmitter and receiver coils the corresponding terms can be consider whit the same values ( M A a = M a A , M B b = M b B , M C c = M c C ). Hence, considering the equivalent single model for the WPT system [29], the mutual inductance of the single-phase system [30] can be expressed by the relationship:
M = 8 π 2 V i n V o u t D C ω 0 P 2
where V i n is phase-to-phase primary voltage, V o u t D C is the voltage at battery side, P 2 is the power transferred by the WPT unit.
The adopted compensation method is a series-series topology [31,32]. In this way the system can be directly connected to the Voltage Source Inverter (VSI). Thus, the compensation capacitors C p h have been selected in agreement with the equivalence:
C p h = 1 ω 0 2 L p h
where L p h is the self-inductance of a single coil. Furthermore, due to the high voltage on the coils (higher than 1 kV), a delta configuration has been chosen for the coils system, instead of a star one, allowing the capacitors to move externally so to be 70 % less stressed in terms of the peak voltage. Thus, the total system configuration can be expressed by the formulation YC Δ L. Thanks to this, Equation (3) can be rearranged as the following relationship:
C p h , e x t = 3 C p h = 3 ω 0 2 L p h
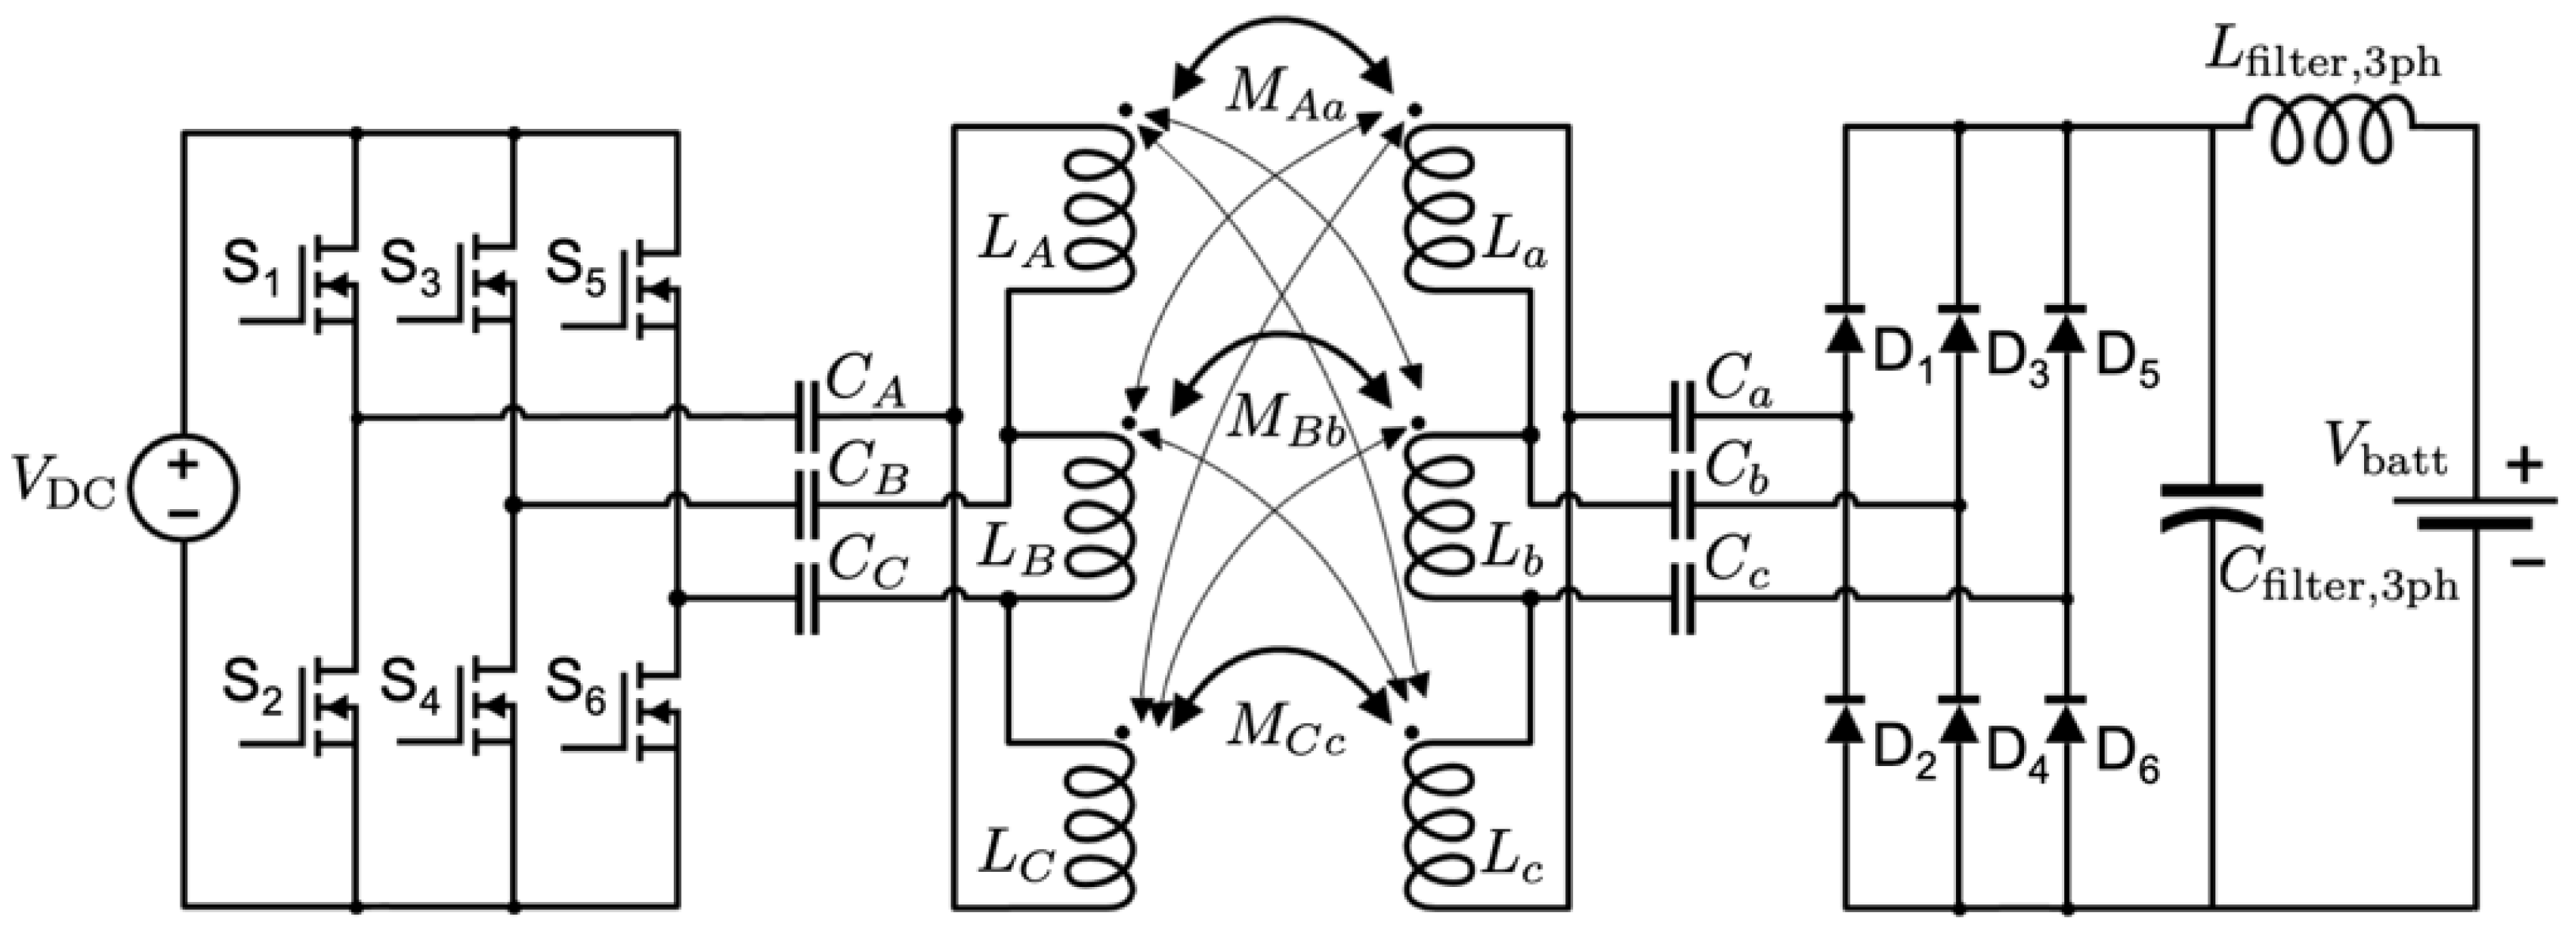
As a result of all the considerations taken before, Figure 4 describes the system using an equivalent electric circuit model. In the Table 1 the principal electrical values of the preliminary design can be seen. Here, the value of the resonant capacitors, as well as the supply voltage and the working frequency are the sketched values for the simulation analysis reported in Table 1.
The operating frequency in Table 1 is the design one given by the actual SAE J2954 and IEC 61980 standards, the real one is given by the value of the self-inductance and by the size of the resonant tank chosen. The real working frequency one for the preliminary simulation analysis in Section 3.2.

3.2. Control and Simulation Analysis

Starting from the values obtained from the FEA study of Section 3.1, the simulation activity is to investigate current and voltage ratings of each component in the system using a circuital simulation tool (PLECS) to proceed then to the physical design. Hence, starting from the high-level schematization of the experimental validation setup depicted in Figure 2, it is possible to obtain the circuital model for the device under test and the test-bench represented in Figure 5.
To perform a feasibility study as close as possible to reality, the simulation analysis has been finalized with the same electrical parameters identified in the experimental setup. With this purpose, the inductance coil values in matrix (1), adopted as a model in the simulation, as well as the values of the resonant capacitors are indicated by the Table 2. Starting from these references the resonance frequency must be determined again and results in a refined value listed in Table 2.
Before showing the simulation results a brief consideration must be done regarding the modulator and the control methodology. Indeed, the modulation technique is six-step one, where the comparison is made between three 120 degree shifted carriers and the modulation indexes m H , m L (6). This because, assuming a symmetrical and balanced three-phase impedance system, the resulting inverter voltages, shown in Figure 5, must be the same. Consequently, the current in each phase results synchronized with the inverter voltages at the resonance frequency, being able to eventually achieve ZCS [33]. For these reasons, a single current loop has been implemented to regulate the power during the system startup. In the literature, the modulation index is already deeply defined by the relationship:
m = A m A t r
where A m and A t r are respectively the modulation and the carrier amplitude. As result, already extensively and well addressed in the literature, the modulation index can be defined from the relationship 1 m 1 .
In the case under analysis the definition given by (5) is slightly modified to avoid recirculation of currents due to unbalanced phase-to-phase voltages during the startup of the system.
m H A m H A t r m L A m L A t r
A m H and A m L in (6) are respectively the modulation amplitudes for the high-side and low-side switches of a single leg of the WPT inverter. In particular, A m L = A m H to guarantee the symmetry in the drive commands of the inverter leg. Thus, the modulation indexes have the sequent range of regulation: 0 m H 1 and 1 m L 0 .
Speaking about the three-phase boost converter it must be specified that, in contrast to the WPT inverter, the command is driven by the modulation depth (8). Obtained from the comparison between the carrier amplitude A t r and the modulation amplitude given by (7)
A m b s t = V o u t V s u p p l y
m b s t A m b s t A t r
where V o u t and V s u p p l y are respectively the voltage at the output of WPT Receiver unit (RX-unit in Figure 5) and the power supply voltage at input terminals of WPT inverter Figure 5. Thus, the index of modulation of the boost can be defined within the limits of the relationship 0 m b s t 1 .
Analyzing now in detail Figure 6, it is possible to split the image into five different states, one for each condition of the control, function of simulation time, to better understand every single portion of the investigation.
  • At time t = t 0 , at the very beginning of the process, the system is at the starting condition. Considering the WPT inverter, it is possible to notice that the modulation depth is m = 1 . In this condition, the TPP primary side can be considered to be an open circuit. At the same time, the boost converter has a modulation index m b s t = 0 or in another way can be considered to be an equivalent short circuit at the output of the WPT system. At the end of this state, all the bus capacitors are pre-charged and at a steady state.
  • For Δ t = Δ t 1 , the modulation index of the WPT inverter increases, following a linear ramp variation, till reaches the value of m = 0 . In this condition the output-phase voltages waveforms starting to be non-null till the end of the ramp, instant in which they reach the 50 % of pulse width. At the same time, the boost converter is forced to maintain the value of m b s t = 0 , still a short circuit see from diode bridge terminals. Within this status, the voltage at the battery side increases slightly due to the death time of the converter switches. However, side some more words are needed regarding the current evolution at the battery. In fact, replacing the AC physical dimensions with the corresponding DC Battery-side aspects in (2) and writing the DC current function of the other dimensions, the following relationship can be obtained:
    I o u t D C = 4 π 2 V i n ω 0 M
    From (9) can be deduced that the current at DC output increases as the voltage at the primary side grows. The maximum is reached within m H = 0 at WPT inverter.
  • For Δ t = Δ t 2 , the modulation depth of WPT inverter reached m = 0 . Thus, the equivalent duty cycle is 50 % and the output-phase voltages become full square wave. In this condition, the boost remains still with m b s t = 0 and as a consequence the voltage at the battery side remains low, while the current reaches the maximum. This state has been introduced to obtain a steady-state at the primary side, where the phase currents and the voltages are in phase thanks to the resonance of the WPT system.
  • For Δ t = Δ t 3 , the WPT inverter can be considered in steady state with modulation index m = 0 . In this portion of the analysis the boost increases its modulation depth from m b s t = 0 , following a linear ramp variation, to reach at the terminals of diode bridge a final DC value of V o u t D C 380 V. Considering now again the inductance model for the equivalent single-phase system [30], it is possible to rearrange the (2) highlighting the relationship between the output DC voltage and the input current of the electromagnetic system as:
    I i n = 2 V o u t D C ω 0 M
    From the (10) it is clear that if the output voltage on the battery side increases, the current at the primary side grows too.
  • For Δ t = Δ t 4 , the boost converter reaches the final value for its modulation index (i.e., m b s t = 0.65 ) which corresponds to the final value of the DC voltage at battery side V o u t D C 380 V. From (9) the DC after the diode bridge remains the same because of the full square wave at the primary side. However, the output current of the WPT inverter, thanks to (10) reaches a steady-state, as can be seen from Figure 7 due to the constant output voltage at the battery side. This is the final steady-state of the analysis. The output DC voltage and current reach the target values equivalent to a State-Of-Charge (SOC 80 % ) of EV battery charge. In the fast-charging process, in fact, the charge will stop after having reached this SoC level.

4. Prototype System

4.1. WPT Unit Realization

Prototype coils based on the topology proposed in Section 3.1 have been realized for experimental validation. The resulting structure can be seen in Figure 8, where both model design and manufactured unit are displayed. The transmitter, not shown, has the same mechanical dimensions.
On the left side of Figure 8a,b, the resonant tank can be seen, with the delta connection of the coil directly on the capacitors’ bar, while on the top of Figure 8a,b the diode bridge and the filter capacitor are shown.
The measured values of the self and mutual inductance of the coils are placed in Table 2, which differs from Table 1 due to mechanical adjustments. Consequently, because the resonant capacitors have already been chosen, the resonance frequency must be refined. However, it can be noticed that the final value of the frequency, pointed out in Table 2, slightly differs from the designed value. This thanks to a low error in terms of inductance of manufactured coils compared to the design inductance and values pointed out in Table 1.

4.2. Converter Design

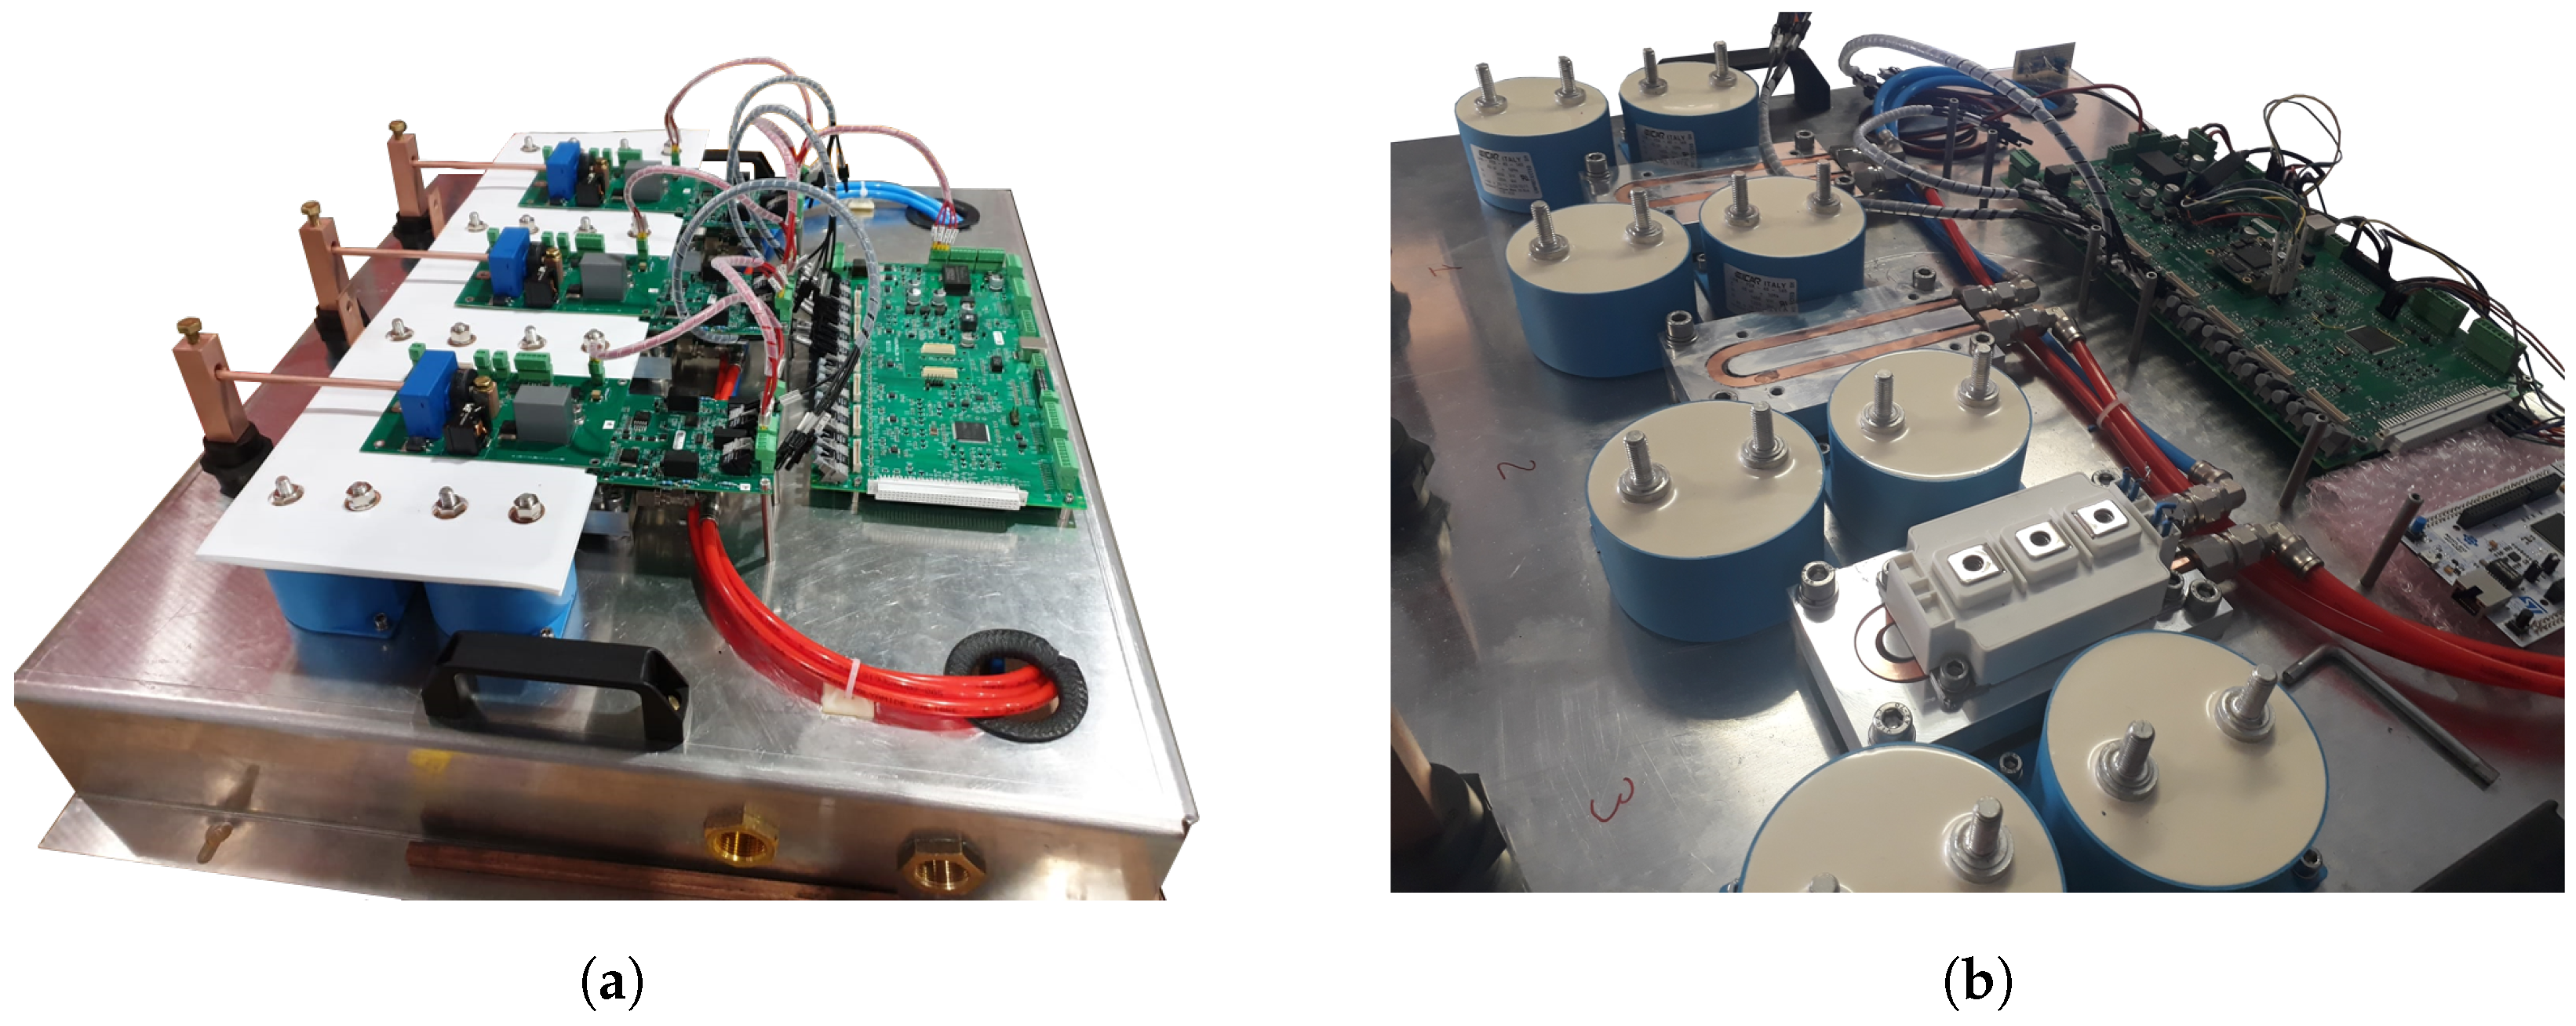
The proposed WPT system is driven by a three-phase converter whose physical realization can be appreciated in Figure 9. The system adopts three 1700 V–325 A SiC Half-Bridges modules (CAS300M17BM2) from Wolfspeed. The choice of such power-module is due to the fact the input DC side of the WPT charging system will be supplied by the power grid of the public transportation which suffers of over-voltages up to 1400 V [23]. An identical converter is used as boost converter, after the diode bridge and filter capacitor, to perform the opposition-method technique for the test. Wide-Band-Gap (WBG) switches are used due to high frequency [34] and voltages [35] involved in the system.
The gate-driver board, as it can be seen in Figure 9, is custom-designed using ADuM4135 manage the PWM signal while the gate-driver supply is provided by insulated DC-DC (MGJ2D242005SC). The dead time has been set to 250 ns maximizing the duty cycle range. Eight 40 μF capacitors (LNK-P2X-40-145) are connected to the DC-link busbars. Moreover, two capacitors, one multilayer SMD and one film (B32656S7185) are placed on the measuring board between the DC-link bars to close the loop as near as possible to the power-module balancing the inductive parasitic effect.
Both converters are controlled by the same custom control board, from a Spartan-6 FPGA (TE0630) for the low and faster level control loops, sampling and modulation. A microcontroller (STM32H743ZI) performs the high-level control management. Communications between the master board and gate-driver boards are implemented using optic fibers.
Figure 9a also presents again custom-designed measurement boards that are separated by the gate-driver boards. The only connection point between the two boards is the pickup point of the positive bar of the DC-link to perform the desaturation protection on the driver board. Two systems of current sensing have been implemented on the measuring board. The first acquire system is LEM-sensor (LA 200-P)-based and operates as an RMS current sensing device for the software current protections. A second acquiring system is implemented to perform the current control on the primary side and is based on TA-sensor (CST206-1T) operating as peak current sensing device.
Taking now into account the rectifier bridge on the receiver side, it can be noticed from Section 3.2 that is expected higher stress of the components due to the elevated current at DC output and the high-frequency voltages. Because of this, ultrafast and parallelized Si diodes (VS-UFL330FA60) have been chosen. As output DC-filter, three 3 μF capacitors (C4BSPBX4300ZANJ) have been selected to fit mechanically inside the receiver box and mounted above the rectifier bridge (Figure 8b on top left of the box).
In Table 3 values of the main reactive aspects of the converter are presented.

5. Experimental Validation

5.1. Experimental Setup

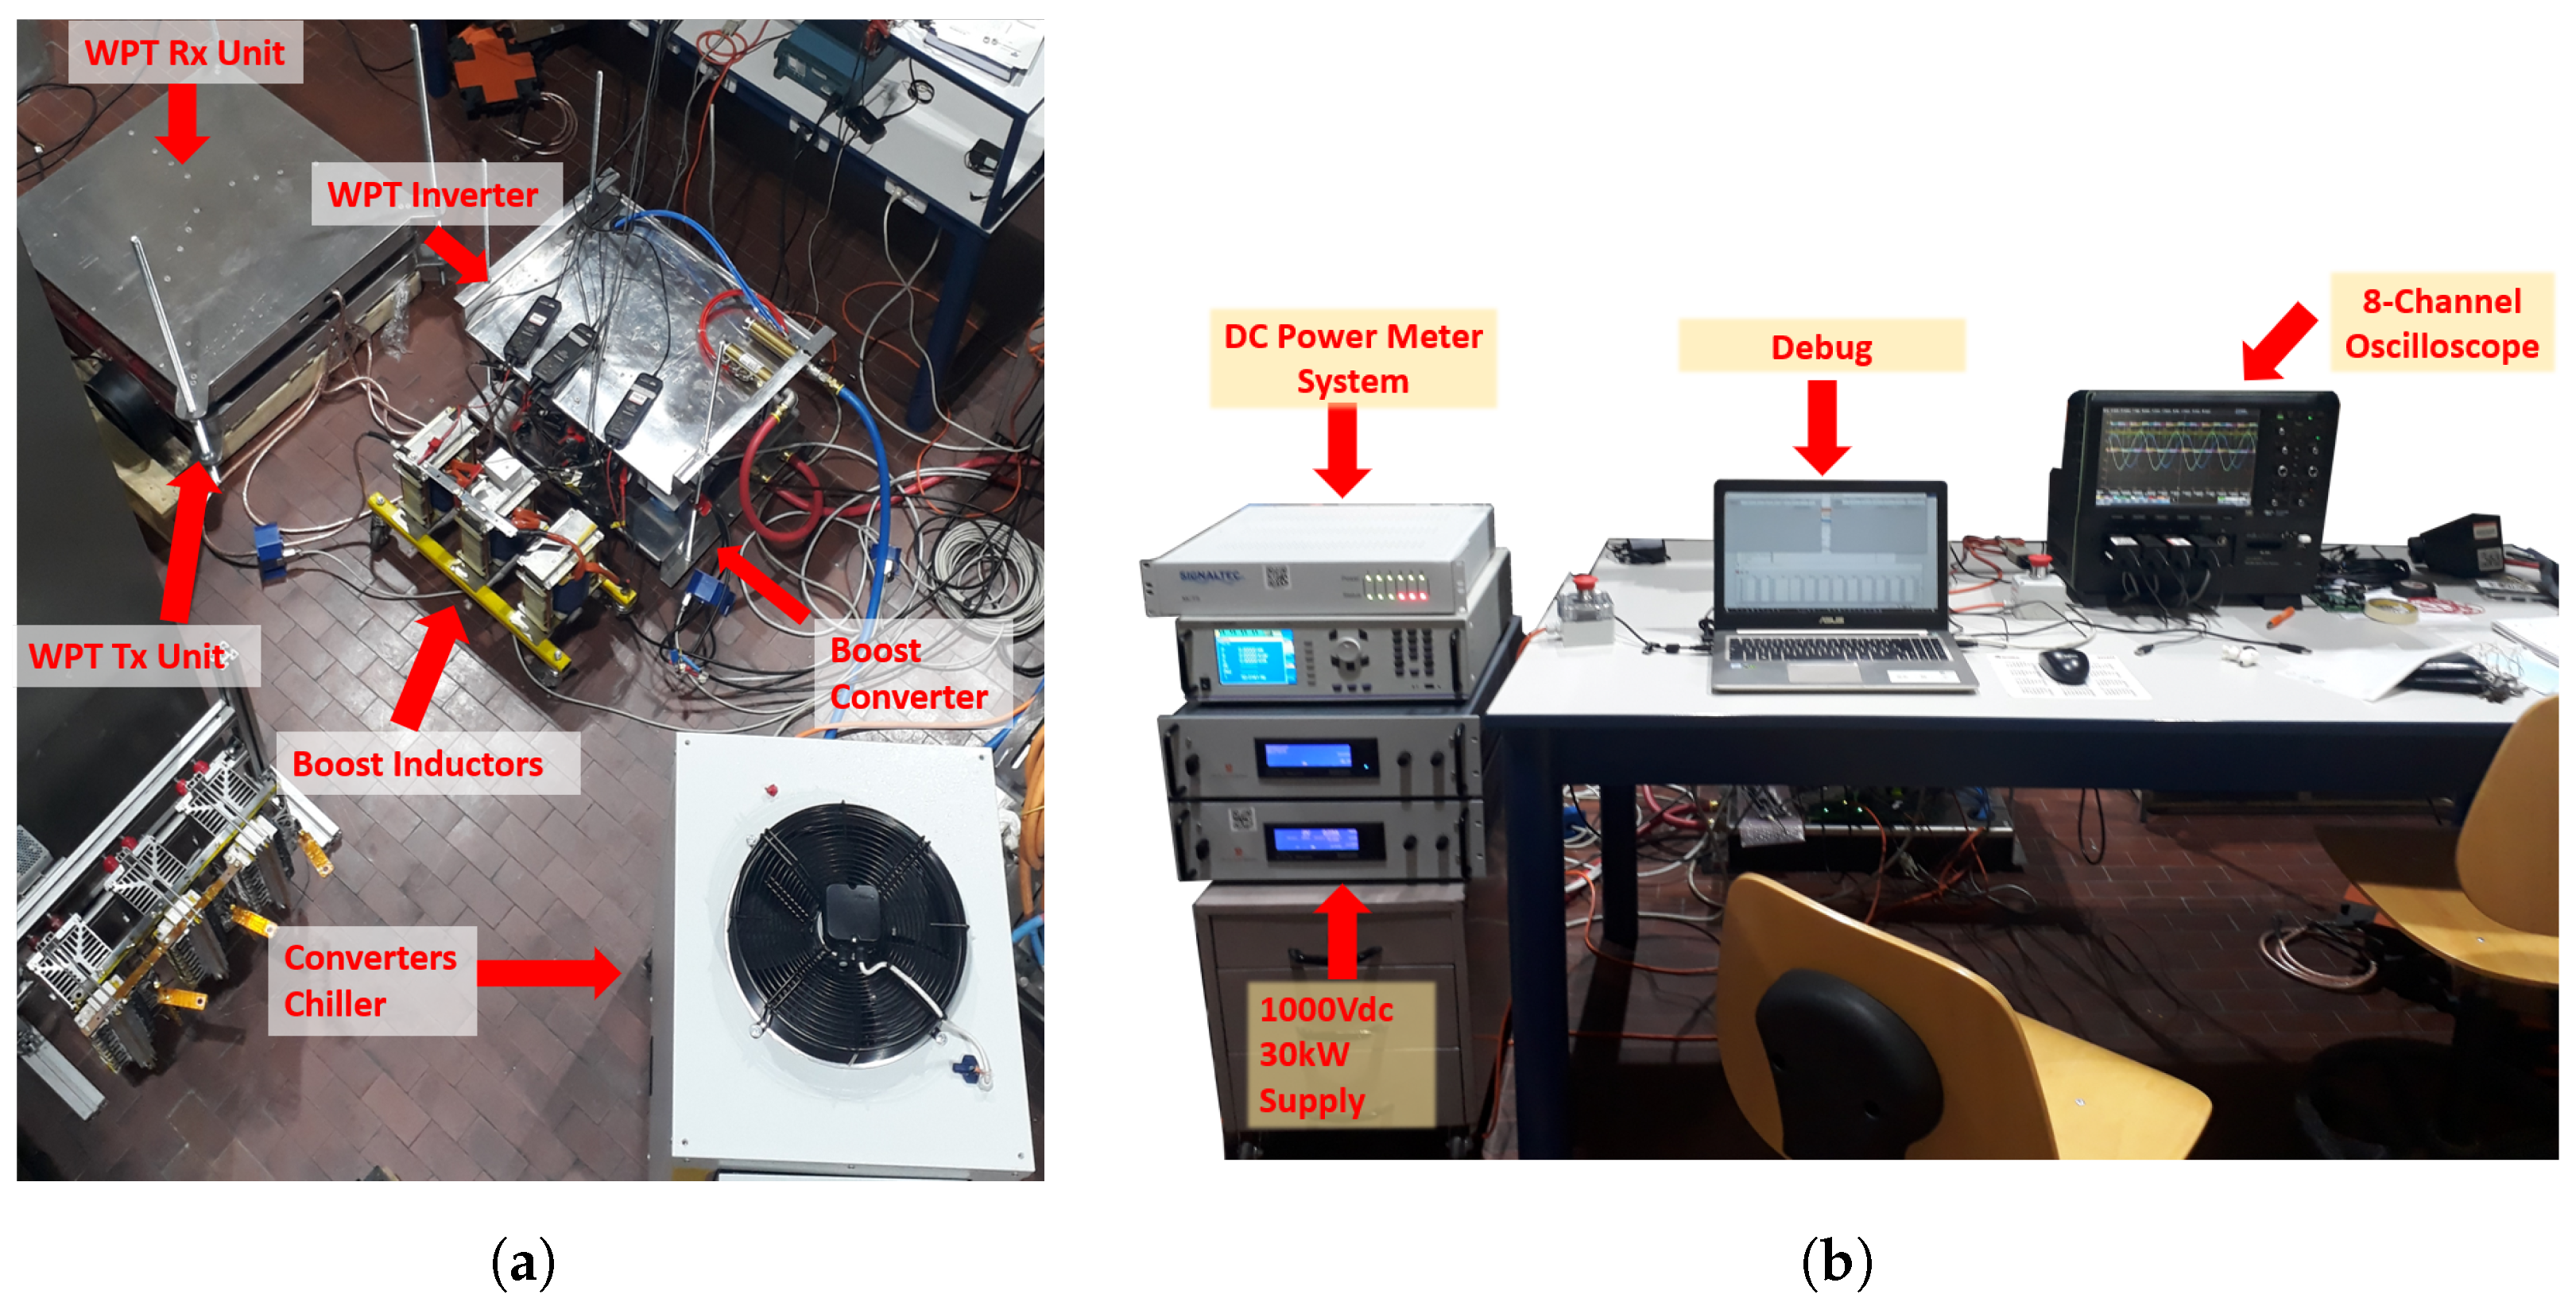
A high-level block diagram of the experimental setup, to test the WPT system, is already depicted in Figure 2. Here the equivalent realized test-bench is presented from two different aspects. First, the power-bench, shown in Figure 10a, where are enlightened all the parts of the WPT system. A chiller is used as a cooling system for the power converters, while both the WPT units work without any cooling system. With this purpose in mind, all the passive components on the WPT structure are oversized in current terms.
The second aspect of the equipped test-bench is the control, measurement and supply solution that can be seen from Figure 10b. Indeed, for debugging purpose, a CAN-communication has been set up between the converters control board and a debugging workstation. The supply is composed of two DC power supplies units (SM15K-SERIES) placed in a series configuration. However, finally, the measurement bench consists of a power-meter analyzer (LMG-500), equipped with three current sensors (PSU600 and PSU200) and an interface, for the DC measures of the system and the efficiency of the WPT structure. For the AC voltages and currents measurements at the primary side of the WPT transmitter unit an 8-channel Oscilloscope (HDO8000) equipped with 4 voltage probes (HVD3220) and four current probes (CP-150) to sense also output DC voltage and current at equivalent battery side.
Taking into account now Figure 7, it can be deduced that the presumed currents on the primary side are comparable with the maximum tolerable values of the probes. Because of this, phase terminal of the power modules has been split into two identical lines, to perform the sensing on the measuring board and with the scope.

5.2. Experimental Results

The system performance are measured in the perfect alignment condition to estimate the maximum efficiency of the structure, focusing on the goal of reaching ZCS and possibility to reach Zero-Voltage-Switching (ZVS). Consequently, imbalances due to misalignment between transmitter and receiver are not examined here.
A summary of experimental results for the WPT system, in YC- Δ L, configuration is pointed out in Table 4. This table also propose the main parameters for the supply system and the boost converter.
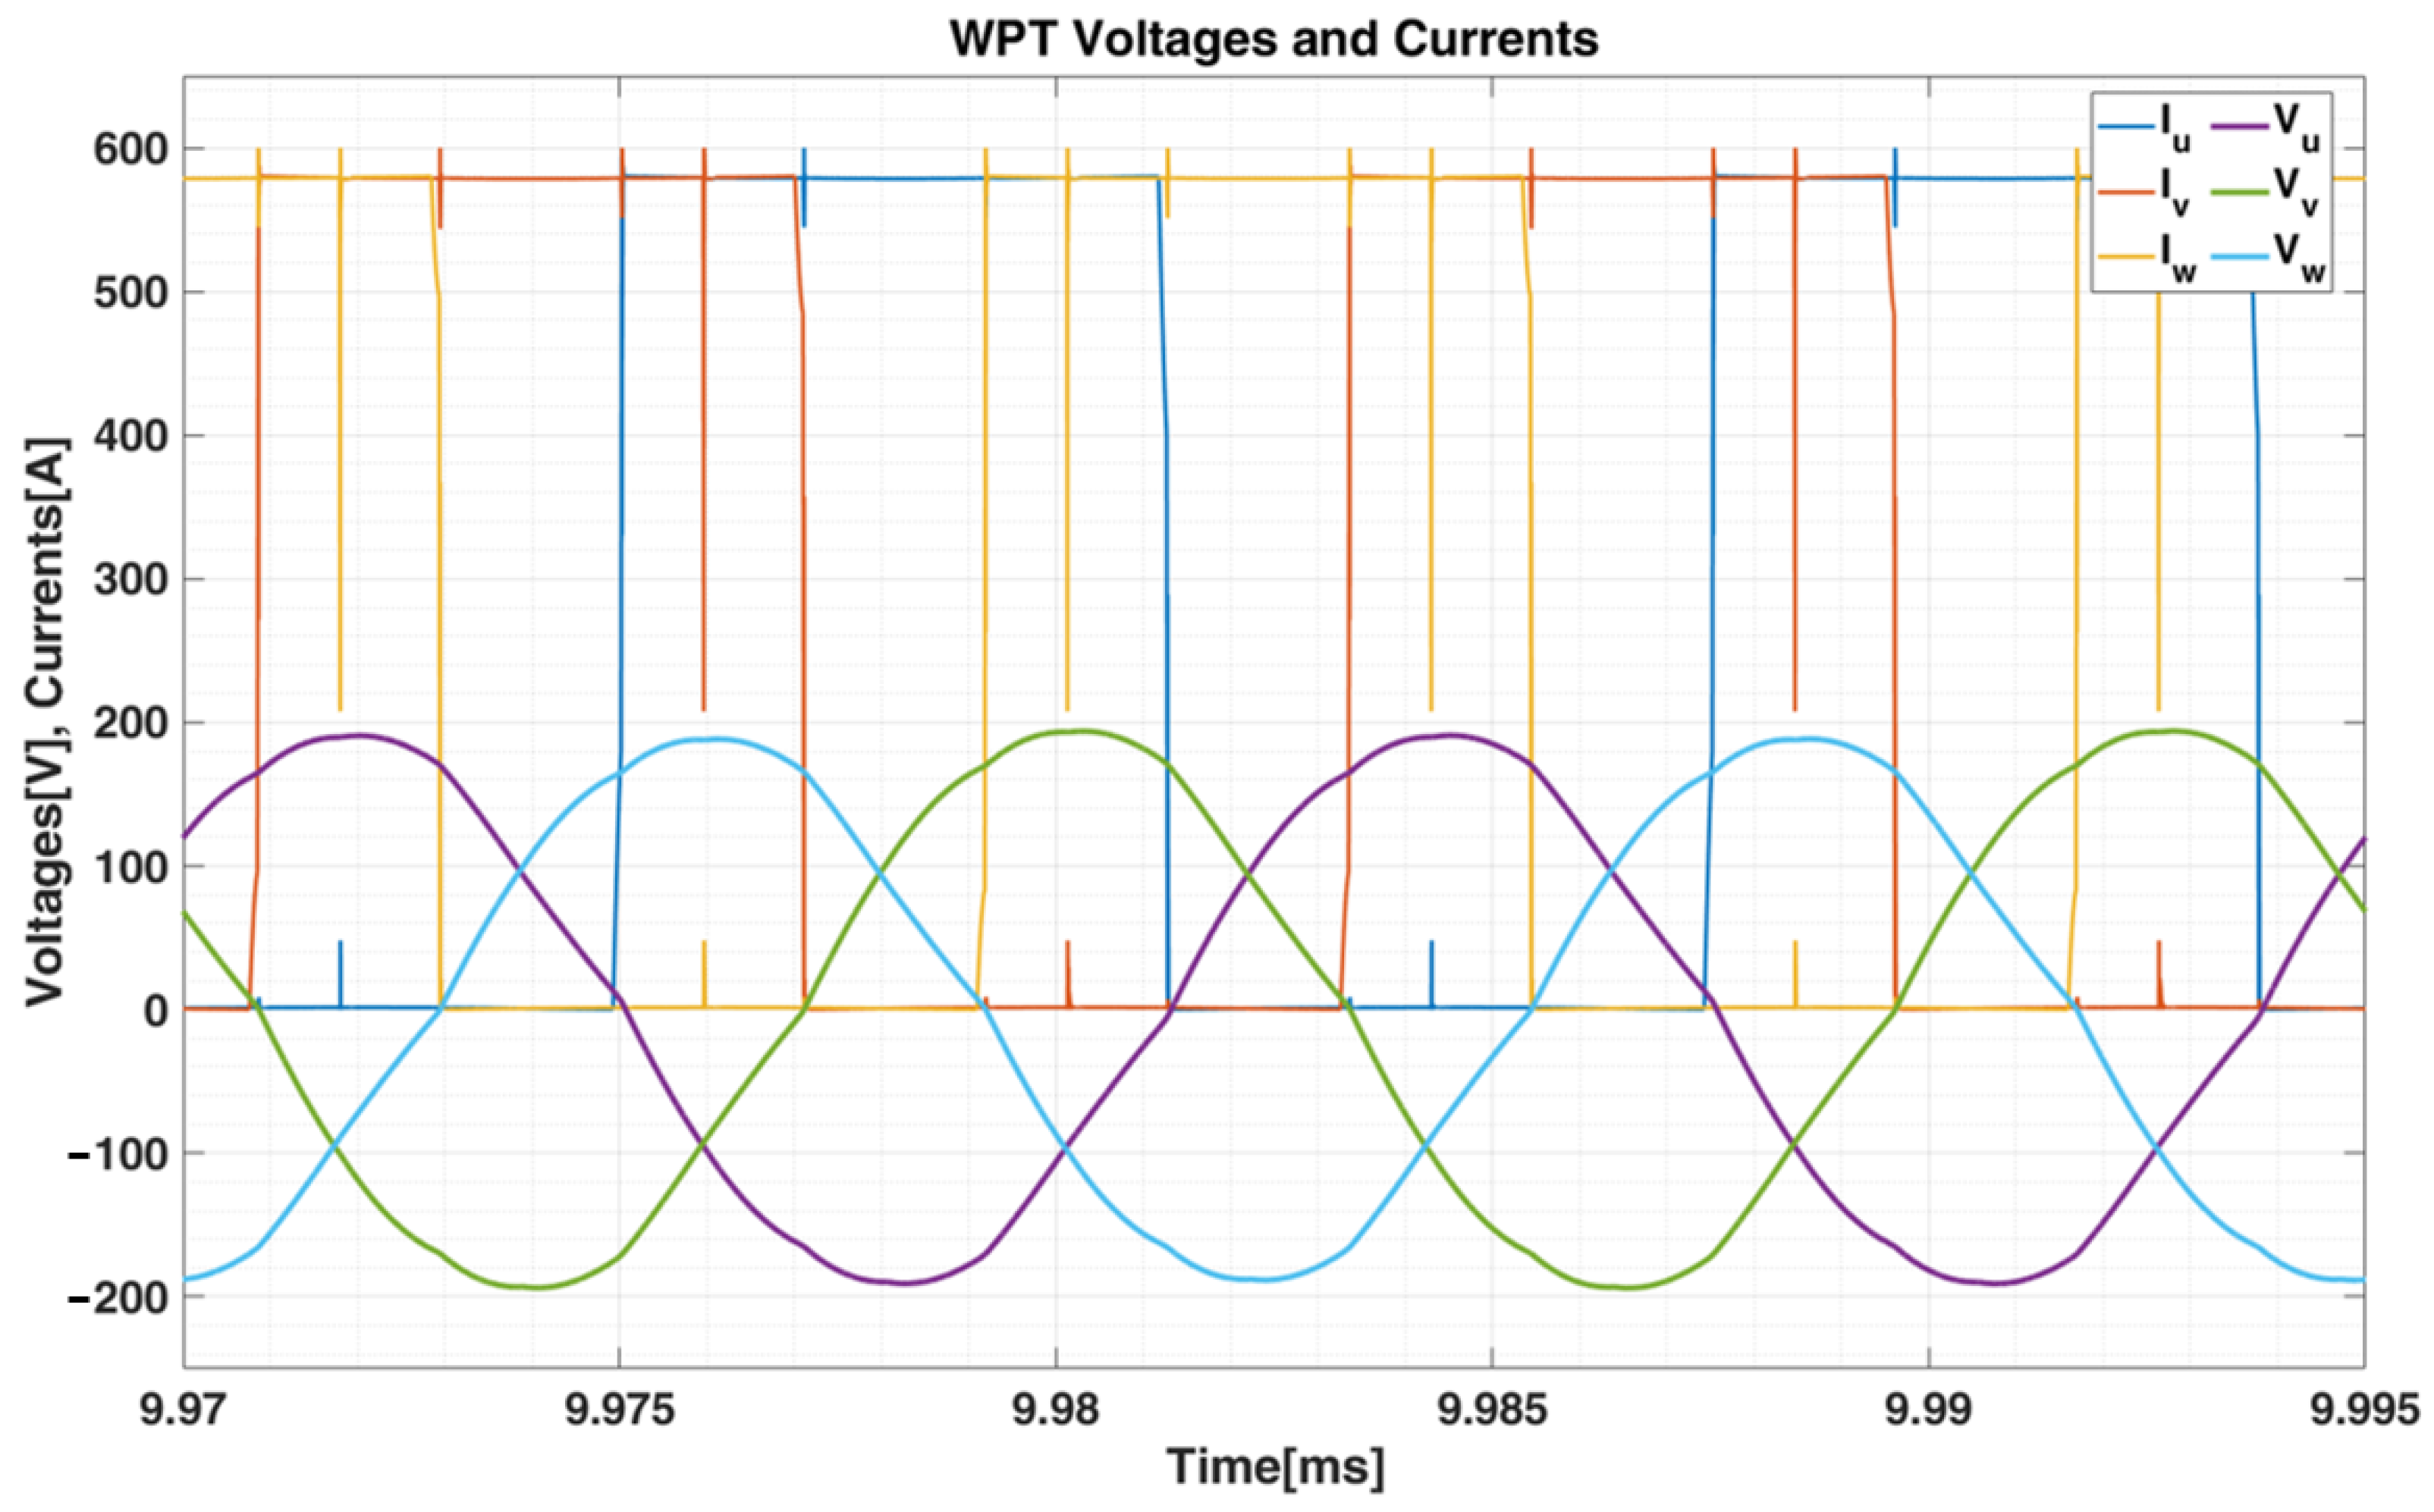
The experimental waveforms, corresponding to the values shown in Table 4, are given in Figure 11. The voltages reported in Figure 11 have been measured between each phase and the negative pole of the DC-link. These voltages present an added ripple because of the commutations of the boost converter, synchronized in terms of PWM with the WPT inverter. However, during commutations, it must be noticed that the peak of measured over-voltage is 624 V which corresponds to 7 % of the commutated voltage. This thanks to the ZCS reached at resonance.
In Figure 11 it can also be seen that the measured phase currents differ, in terms of amplitude, from the simulated ones. This because the output-phase terminal of the WPT inverter has been split into two identical parts to measure with the available current probes. When considering the I D C o u t after the diode bridge filtering side, it has been measured at one of the inductors used as input for the boost converter. Therefore, the overall current at the output of the WPT unit is equal to I D C o u t p u t = 3 I D C o u t as already shown in Table 4.
In Figure 12 are depicted, together with the phase currents, the phase-to-phase voltages. Yet it can be seen that the commutation of boost converter, together with low filtering at the supply side, produces a voltage ringing.
In all the previous results, the goal reached is the commutation during the zero-transition of the current, thanks to the resonant load. In that case, the duty cycle of a single leg of the WPT inverter is 50 % not taking into account for of the dead time.
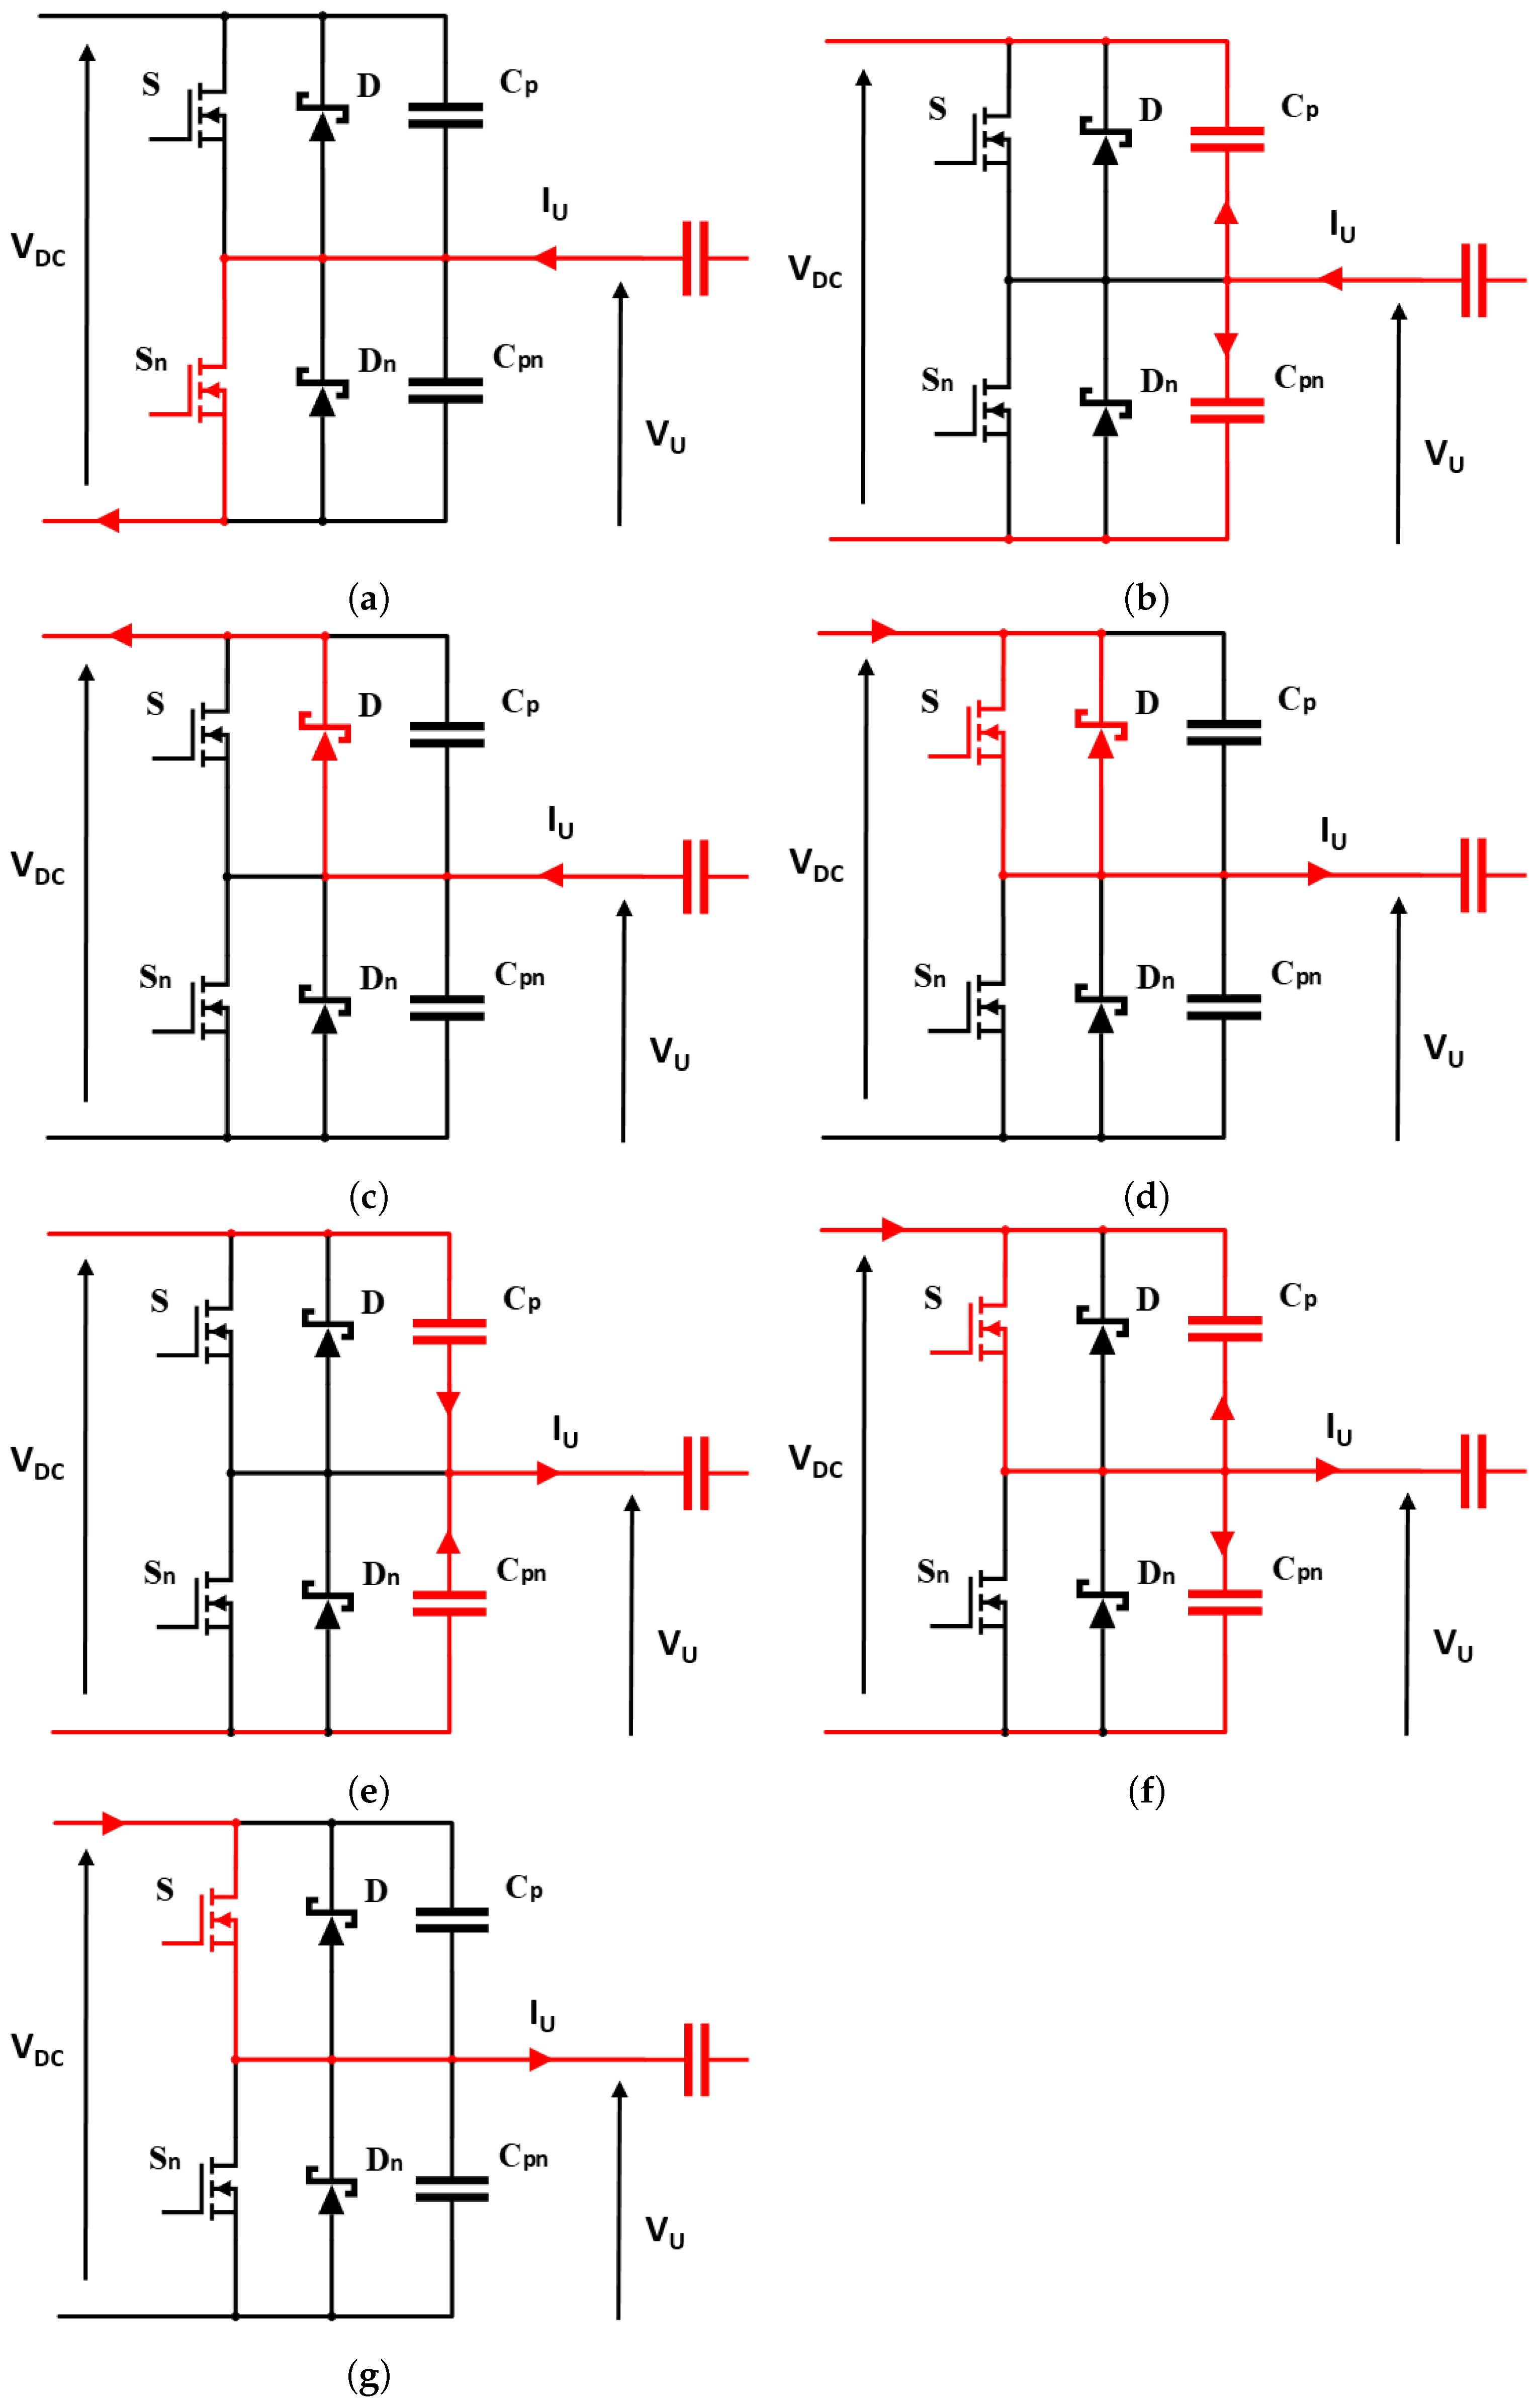
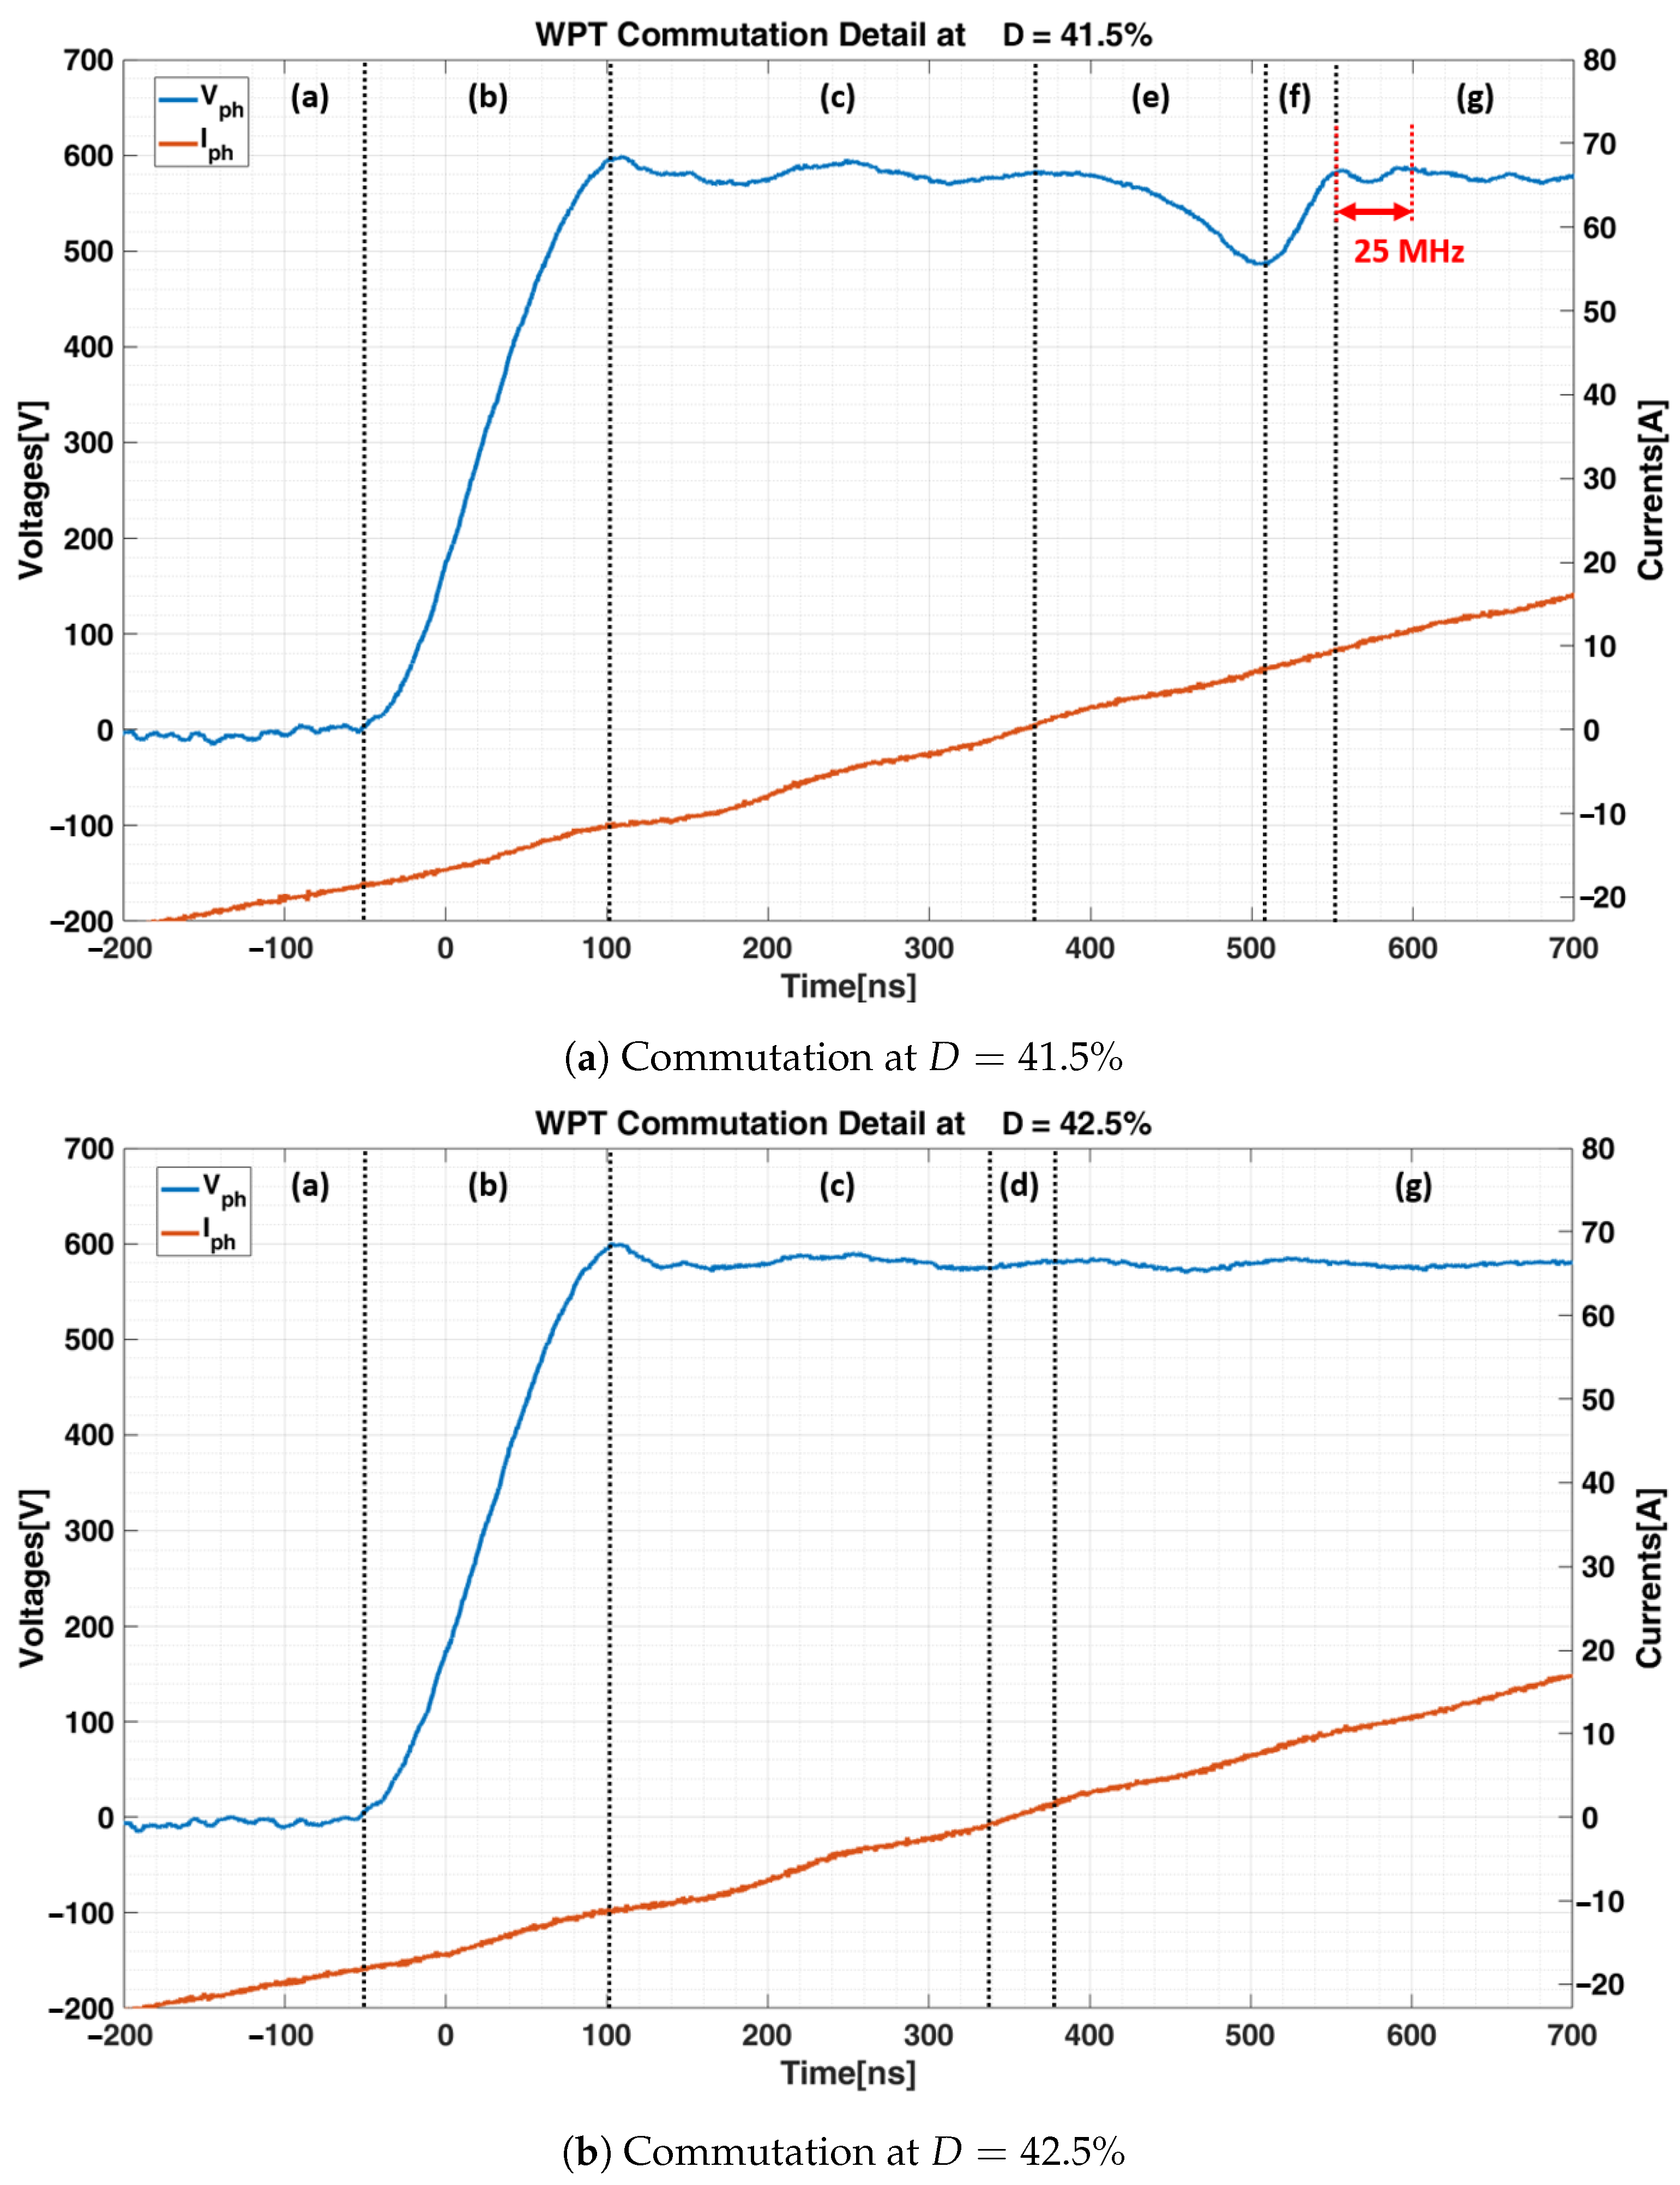
The aim of the work now is studying the commutation reaching the ZVS only changing the duty cycle. To better analyze its operating range a comparison between the switching limit conditions has been performed, studying the current paths during the commutation (Figure 13). The corresponding phase voltages and currents waveforms are reported in Figure 14.
The analysis focuses on the commutation in which the high side switch (S) is turning on while the low side switch ( S n ) is turning off. The dynamic of the commutation depends on the dead time and the single-leg duty cycle.The commutation phases, depicted in Figure 13, follow the next structure:
a. 
Starting from a condition in which the low-side switch is in conduction state (Figure 13a) the phase voltage V U is zero and the phase current I U is negative.
b. 
When S n is off the current flows through the parasitic capacitance C p and C p n . The output voltage V U increase until the DC-link voltage is reached (Figure 13b).
c. 
V U is equal to the DC-link voltage, the current forces the Schottky diode to pass in conduction mode. Then the current path in this period is provided by the diode (Figure 13c).
d. 
The soft switching occurs when the high-side switch (S) is closed (Figure 13d) while the diode is in conduction mode.
e. 
A duty cycle less than 42.5 % allow the V U to freely oscillate (Figure 13e). Due to the direction of the current I U the phase voltage decrease following the charging and discharging process of the parasitic capacitance.
f. 
The high-side switch is turned on during the charging and discharging process of the parasitic capacitance. This led to a hard switching condition. The voltage across (S) differs from zero and the current has a positive value (Figure 13f).
g. 
The high-side switch is on the state, keeping the V U at the DC-link level and the positive direction of the phase current I U (Figure 13g).
Comparing then the current paths of Figure 13 and the waveforms of Figure 14, it is possible to notice that the ZVS is reached when the commutation follows phases: a, b, c, d and g (Figure 14b) with a duty cycle of 42.5 % . If the duty cycle is lower, which corresponds to commutation phases: a, b, c, e, f and g, hard switching condition appear (Figure 14a).
The hard switching leads to a voltage oscillation at 25 MHz related to the resonance between the power-module parasitism ( L s t r a y and C p ).
f r , s w i t c h = 1 2 π L s t r a y C p

6. Conclusions

This paper presented the experimental validation of a three-phase WPT system using the opposition-method technique to avoid the adoption of both proper power supply and load able to manage the rated power of 100 kW. Particular emphasis has given in the analysis and simulation of the structure driven by a three-phase inverter, focusing on the goal of testing the system under full power conditions.
The practical details of the 3-ph WPT system showed a low error in terms of the self-inductance of the coil, changing the resonance frequency by very little values compared to the one proposed in the description of the electromagnetic structure. Thus, resulting in a good matching with the simulation ones.
Furthermore, the experimental results demonstrated the capability of the system to transfer 100 kW with 94.1 % efficiency over 50 mm air gap. The results proved the high power density of the system, considering the mechanical constraints in the design of the WPT structure.
Moreover, the results showed the study of the commutation reaching the ZVS without the needed to change the working frequency usually adopted to make the load a little inductive so to compensate the energy of the Mosfet parasitic capacitance. As a matter of fact, this analysis has been conducted by changing the duty cycle of the WPT inverter instead of varying the operating frequency. To validate this analysis a comparison between the limit conditions of ZVS and the hard switching has been performed.
Future improvements will be more oriented in the direction of studying the system in misalignment condition and disproportion in terms of impedance between the phases. Furthermore, future improvements will cover more an analysis of the control technique to overcome these misalignment issues.

Author Contributions

Validation, Writing & Editing: J.C.; Validation & Review: A.L.G. and R.R.; Supervision & Review: P.G. and E.A. All authors have read and agreed to the published version of the manuscript.

Funding

This research was funded by European Union’s Horizon 2020 research and innovation programme, namely through ASSURED project (grant number 769850).

Institutional Review Board Statement

Not applicable.

Informed Consent Statement

Not applicable.

Data Availability Statement

Not applicable.

Acknowledgments

This research was co-funded by European Union’s Horizon 2020 research and innovation programme, namely through ASSURED project (grant number 769850).

Conflicts of Interest

The authors declare no conflict of interest.

References

  1. Madawala, U.K.; Neath, M.; Thrimawithana, D.J. A Power–Frequency Controller for Bidirectional Inductive Power Transfer Systems. IEEE Trans. Ind. Electron. 2013, 60, 310–317. [Google Scholar] [CrossRef]
  2. Miller, J.M.; Onar, O.C.; Chinthavali, M. Primary-Side Power Flow Control of Wireless Power Transfer for Electric Vehicle Charging. IEEE J. Emerg. Sel. Top. Power Electron. 2015, 3, 147–162. [Google Scholar] [CrossRef]
  3. Li, W.; Zhao, H.; Li, S.; Deng, J.; Kan, T.; Mi, C.C. Integrated LCC Compensation Topology for Wireless Charger in Electric and Plug-in Electric Vehicles. IEEE Trans. Ind. Electron. 2015, 62, 4215–4225. [Google Scholar] [CrossRef]
  4. Covic, G.A.; Boys, J.T. Modern Trends in Inductive Power Transfer for Transportation Applications. IEEE J. Emerg. Sel. Top. Power Electron. 2013, 1, 28–41. [Google Scholar] [CrossRef]
  5. Covic, G.A.; Boys, J.T. Inductive Power Transfer. Proc. IEEE 2013, 101, 1276–1289. [Google Scholar] [CrossRef]
  6. Iruretagoyena, U.; Garcia-Bediaga, A.; Mir, L.; Camblong, H.; Villar, I. Bifurcation Limits and Non-Idealities Effects in a Three-Phase Dynamic IPT System. IEEE Trans. Power Electron. 2020, 35, 208–219. [Google Scholar] [CrossRef]
  7. Kim, S.; Covic, G.A.; Boys, J.T. Comparison of Tripolar and Circular Pads for IPT Charging Systems. IEEE Trans. Power Electron. 2018, 33, 6093–6103. [Google Scholar] [CrossRef]
  8. Cirimele, V.; Colussi, J.; Villa, J.L.; Ganga, A.L.; Guglielmi, P. Modelling of a 100 kW-85 kHz Three-Phase System for Static Wireless Charging and Comparison with a Classical Single-Phase System. In Proceedings of the IEEE International Symposium on Circuits and Systems (ISCAS), Seville, Spain, 10–21 October 2020; pp. 1–5. [Google Scholar] [CrossRef]
  9. Covic, G.A.; Boys, J.T.; Kissin, M.L.G.; Lu, H.G. A Three-Phase Inductive Power Transfer System for Roadway-Powered Vehicles. IEEE Trans. Ind. Electron. 2007, 54, 3370–3378. [Google Scholar] [CrossRef]
  10. Kim, M.; Kim, H.; Kim, D.; Jeong, Y.; Park, H.; Ahn, S. A Three-Phase Wireless-Power-Transfer System for Online Electric Vehicles With Reduction of Leakage Magnetic Fields. IEEE Trans. Microw. Theory Tech. 2015, 63, 3806–3813. [Google Scholar] [CrossRef]
  11. Thrimawithana, D.J.; Madawala, U.K. A three-phase bi-directional IPT system for contactless charging of electric vehicles. In Proceedings of the IEEE International Symposium on Industrial Electronics, Gdansk, Poland, 27–30 June 2011; pp. 1957–1962. [Google Scholar] [CrossRef]
  12. Iruretagoyena, U.; Villar, I.; Garcia-Bediaga, A.; Mir, L.; Camblong, H. Design and Characterization of a Meander-Type Dynamic Inductively Coupled Power Transfer Coil. IEEE Trans. Ind. Appl. 2017, 53, 3950–3959. [Google Scholar] [CrossRef]
  13. Cui, S.; Wang, Z.; Han, S.; Zhu, C.; Chan, C.C. Analysis and Design of Multiphase Receiver With Reduction of Output Fluctuation for EV Dynamic Wireless Charging System. IEEE Trans. Power Electron. 2019, 34, 4112–4124. [Google Scholar] [CrossRef]
  14. Li, H.; Liu, Y.; Zhou, K.; He, Z.; Li, W.; Mai, R. Uniform Power IPT System with Three-Phase Transmitter and Bipolar Receiver for Dynamic Charging. IEEE Trans. Power Electron. 2019, 34, 2013–2017. [Google Scholar] [CrossRef]
  15. Matsumoto, H.; Neba, Y.; Ishizaka, K.; Itoh, R. Model for a Three-Phase Contactless Power Transfer System. IEEE Trans. Power Electron. 2011, 26, 2676–2687. [Google Scholar] [CrossRef]
  16. Matsumoto, H.; Shibako, Y.; Shiihara, Y.; Nagata, R.; Neba, Y. Three-Phase Lines to Single-Phase Coil Planar Contactless Power Transformer. IEEE Trans. Ind. Electron. 2018, 65, 2904–2914. [Google Scholar] [CrossRef]
  17. Kim, S.; Covic, G.A.; Boys, J.T. Tripolar Pad for Inductive Power Transfer Systems for EV Charging. IEEE Trans. Power Electron. 2017, 32, 5045–5057. [Google Scholar] [CrossRef]
  18. Thrimawithana, D.J.; Madawala, U.K.; Francis, A.; Neath, M. Magnetic modeling of a high-power three phase bi-directional IPT system. In Proceedings of the IECON 2011—37th Annual Conference of the IEEE Industrial Electronics Society, Melbourne, Australia, 7–10 November 2011; pp. 1414–1419. [Google Scholar] [CrossRef]
  19. Song, Y.; Madawala, U.K.; Duleepa, J.T.; Hu, A.P. Cross coupling effects of poly-phase bi-directional inductive power transfer systems used for EV charging. In Proceedings of the IEEE 2nd International Future Energy Electronics Conference (IFEEC), Taipei, Taiwan, 1–4 November 2015; pp. 1–7. [Google Scholar] [CrossRef]
  20. Song, C.; Kim, H.; Jung, D.H.; Yoon, K.; Cho, Y.; Kong, S.; Kwack, Y.; Kim, J. Three-phase magnetic field design for low EMI and EMF automated resonant wireless power transfer charger for UAV. In Proceedings of the IEEE Wireless Power Transfer Conference (WPTC), Boulder, CO, USA, 13–15 May 2015; pp. 1–4. [Google Scholar] [CrossRef]
  21. Wang, C.-S.; Covic, G.A.; Stielau, O.H. Power transfer capability and bifurcation phenomena of loosely coupled inductive power transfer systems. IEEE Trans. Ind. Electron. 2004, 51, 148–157. [Google Scholar] [CrossRef]
  22. Cirimele, V.; Rosu, S.G.; Guglielmi, P.; Freschi, F. Performance evaluation of wireless power transfer systems for electric vehicles using the opposition method. In Proceedings of the IEEE 1st International Forum on Research and Technologies for Society and Industry Leveraging a Better Tomorrow (RTSI), Turin, Italy, 16–18 September 2015; pp. 546–550. [Google Scholar] [CrossRef]
  23. Pons, E.; Colella, P.; Rizzoli, R. Overvoltages in DC Urban Light Railway Systems: Statistical Analysis and Possible Causes. In Proceedings of the IEEE International Conference on Environment and Electrical Engineering and 2018 IEEE Industrial and Commercial Power Systems Europe (EEEIC/I CPS Europe), Palermo, Italy, 12–15 June 2018; pp. 1–6. [Google Scholar] [CrossRef]
  24. Zhou, H.; Chen, J.; Deng, Q.; Chen, F.; Zhu, A.; Hu, W.; Gao, X. Input-Series Output-Equivalent-Parallel Multi-Inverter System for High-Voltage and High-Power Wireless Power Transfer. IEEE Trans. Power Electron. 2021, 36, 228–238. [Google Scholar] [CrossRef]
  25. Zhang, B.; Carlson, R.B.; Galigekere, V.P.; Onar, O.C.; Pries, J.L. Electromagnetic Shielding Design for 200 kW Stationary Wireless Charging of Light-Duty EV. In Proceedings of the IEEE Energy Conversion Congress and Exposition (ECCE), Detroit, MI, USA, 11–15 October 2020; pp. 5185–5192. [Google Scholar] [CrossRef]
  26. Forest, F.; Huselstein, J.; Faucher, S.; Elghazouani, M.; Ladoux, P.; Meynard, T.A.; Richardeau, F.; Turpin, C. Use of opposition method in the test of high-power electronic converters. IEEE Trans. Ind. Electron. 2006, 53, 530–541. [Google Scholar] [CrossRef]
  27. Pries, J.; Galigekere, V.P.N.; Onar, O.C.; Su, G. A 50-kW Three-Phase Wireless Power Transfer System Using Bipolar Windings and Series Resonant Networks for Rotating Magnetic Fields. IEEE Trans. Power Electron. 2020, 35, 4500–4517. [Google Scholar] [CrossRef]
  28. Kim, S.; Covic, G.A.; Boys, J.T. Analysis on Tripolar Pad for Inductive Power Transfer systems. In Proceedings of the IEEE PELS Workshop on Emerging Technologies: Wireless Power Transfer (WoW), Knoxville, TN, USA, 4–6 October 2016; pp. 15–20. [Google Scholar] [CrossRef]
  29. Buja, G.; Bertoluzzo, M.; Mude, K.N. Design and Experimentation of WPT Charger for Electric City Car. IEEE Trans. Ind. Electron. 2015, 62, 7436–7447. [Google Scholar] [CrossRef]
  30. Ruffo, R.; Khalilian, M.; Cirimele, V.; Guglielmi, P.; Cesano, M. Theoretical and experimental comparison of two interoperable dynamic wireless power transfer systems for electric vehicles. In Proceedings of the IEEE Southern Power Electronics Conference (SPEC), Puerto Varas, Chile, 4–10 December 2017; pp. 1–6. [Google Scholar] [CrossRef]
  31. Zhang, W.; Mi, C.C. Compensation Topologies of High-Power Wireless Power Transfer Systems. IEEE Trans. Veh. Technol. 2016, 65, 4768–4778. [Google Scholar] [CrossRef]
  32. Sallan, J.; Villa, J.L.; Llombart, A.; Sanz, J.F. Optimal Design of ICPT Systems Applied to Electric Vehicle Battery Charge. IEEE Trans. Ind. Electron. 2009, 56, 2140–2149. [Google Scholar] [CrossRef]
  33. Zhang, Y.; Yan, Z.; Kan, T.; Zeng, X.; Chen, S.; Mi, C.C. Modeling and Analysis of a Strongly Coupled Series–Parallel-Compensated Wireless Power Transfer System. IEEE J. Emerg. Sel. Top. Power Electron. 2019, 7, 1364–1370. [Google Scholar] [CrossRef]
  34. Choi, J.; Tsukiyama, D.; Tsuruda, Y.; Davila, J.M.R. High-Frequency, High-Power Resonant Inverter With eGaN FET for Wireless Power Transfer. IEEE Trans. Power Electron. 2018, 33, 1890–1896. [Google Scholar] [CrossRef]
  35. Miller, J.M.; Daga, A. Elements of Wireless Power Transfer Essential to High Power Charging of Heavy Duty Vehicles. IEEE Trans. Transp. Electrif. 2015, 1, 26–39. [Google Scholar] [CrossRef]
Figure 1. Schematization of the final EV battery charging application for the WPT system under analysis.
Energies 14 02113 g001
Figure 2. Schematization of the test-bench for the experimental validation for the WPT system under analysis.
Energies 14 02113 g002
Figure 3. 3D model of the TPP electromagnetic system.
Energies 14 02113 g003
Figure 4. Equivalent electric scheme of the WPT system and its final application.
Energies 14 02113 g004
Figure 5. Electric scheme of the opposition-method configuration for the WPT Test.
Energies 14 02113 g005
Figure 6. Simulated trends of currents and voltages in the system at start-up.
Energies 14 02113 g006
Figure 7. Simulated trends of currents and voltages at primary side of WPT unit.
Energies 14 02113 g007
Figure 8. (a) WPT 3D-CAD model. (b) WPT manufactured RX-unit.
Energies 14 02113 g008
Figure 9. (a) Three-phase SiC converter prototype. (b) Cooling and power-module converter details.
Energies 14 02113 g009
Figure 10. (a) Power test-bench with WPT structure, WPT inverter and boost converter and chiller. (b) Control bench, supply and measurement system.
Energies 14 02113 g010
Figure 11. Measured phase voltages ( V u , V v , V w ) and phase currents ( V u , V v , V w ) ( I u , I v , I w ) on the primary side of WPT unit and measured voltage ( V D C o u t ) and current ( I D C o u t ) at output DC terminals of the WPT unit.
Energies 14 02113 g011
Figure 12. Measured phase-to-phase voltages ( V u v , V v w , V w u ) and phase currents ( I u , I v , I w ) on the primary side of WPT unit and at output DC side.
Energies 14 02113 g012
Figure 13. Current paths during the commutation reaching ZVS.
Energies 14 02113 g013
Figure 14. (a) Voltage and current waveforms at the limits of hard commutation. (b) Voltage and current waveforms reaching the limit of ZVS.
Energies 14 02113 g014
Table 1. Preliminary design parameters of the three-phase system.
Three-Phase System Preliminary Values
ParameterVariableValue
Working frequency f 0 85 kHz
DC input voltage V D C 580 V
Litz wire cross section S 56 mm2
Coils external diameter D c o i l s 710 mm
Transmitter-Receiver airgap z 0 50 mm
Transmitter self-inductance L P H 23.28 μH
Receiver self-inductance L p h 23.28 μH
Mutual inductance M 3 p h 9.43 μH
Resonant Capacitor C p h 170 nF
Table 2. Measured Parameters of the three-phase WPT unit.
Three-Phase System Measured and Testing Values
ParameterVariableValue
Resonance Frequency f 0 82.37 kHz
Transmitter self-inductance L P H 23.46 μH
Receiver self-inductance L p h 23.46 μH
Error FEA vs manufactured inductance e % 1%
Mutual inductance M 3 p h 8 μH
Table 3. Parameters of converter reactive components.
Converter Reactive Components
ParameterVariableValue
DC-Link Bulk capacitors C D C _ L i n k 40 μF
Fast SMD DC-Link capacitor C D C _ F a s t _ s m d 4.7 nF
Fast Film DC-Link capacitor C D C _ F a s t _ f i l m 1.8 μF
Output Filter capacitor C D C _ o u t 3 μF
Parasitic Mosfet capacitance C p 2.5 nF
Mosfet Stray Inductance L S t r a y 15 nH
Table 4. Experimental Results of the Three-Phase WPT system.
Measured Values of Electrical Quantities of the System
ParameterVariableValue
Supply voltage V D C _ s u p p l y 580.49 V
Supply current I D C _ s u p p l y 14.83 A
Supply Power P D C _ s u p p l y 8.61 kW
WPT Input DC current I D C _ i n p u t 192.12 A
WPT Input Power P D C _ i n p u t 111.52 kW
WPT Output DC voltage V D C _ o u t p u t 378.87 V
WPT Output DC current I D C _ o u t p u t 277.19 A
WPT Output DC Power P D C _ o u t p u t 104.96 kW
Boost Output DC current I B o o s t _ o u t p u t 177.29 A
Boost Output DC Power P B o o s t _ o u t p u t 102.91 kW
WPT efficiency η W P T 94.12%
Boost efficiency η B o o s t 98.05%
Publisher’s Note: MDPI stays neutral with regard to jurisdictional claims in published maps and institutional affiliations.