Article

Effects of Nutrient Content and Nitrogen to Phosphorous Ratio on the Growth, Nutrient Removal and Desalination Properties of the Green Alga Coelastrum morus on a Laboratory Scale

1
Department of Hydrobiology, University of Debrecen, Egyetem Sqr. 1, H-4032 Debrecen, Hungary
2
Pál Juhász-Nagy Doctoral School of Biology and Environmental Sciences, University of Debrecen, Egyetem Sqr. 1, H-4032 Debrecen, Hungary
3
Department of Tisza Research, Institute of Aquatic Ecology, Centre for Ecological Research, Bem Sqr. 1, H-4026 Debrecen, Hungary
*
Author to whom correspondence should be addressed.
Energies 2021, 14(8), 2112; https://doi.org/10.3390/en14082112
Submission received: 26 February 2021 / Revised: 1 April 2021 / Accepted: 6 April 2021 / Published: 9 April 2021
(This article belongs to the Special Issue Microalgae Cultures: Environmental Tool and Bioenergy Source)

Abstract

:
In wastewater, nutrient concentrations and salinity vary substantially, however, the optimal N:P ratio for the treatment using microalgae is not well described. In this study, the effects of higher and lower nitrate and phosphate contents and N:P ratios on growth, nutrient removal ability and halotolerance of the common green alga Coelastrum morus were investigated in model solutions. The results suggest that high nitrate content (above 100 mg L−1) with a similarly high phosphate concentration (resulting low N:P ratio) is not favorable for growth. The studied isolate can be considered as a halotolerant species, showing remarkable growth up to 1000 mg L−1 NaCl and it seems that despite the negative effects on growth, higher nutrient content contributes to higher halotolerance. A significant amount of nitrate removal was observed in media with different nutrient contents and N:P ratios with different salt concentrations. High N:P ratios favor phosphate removal, which is more inhibited by increasing NaCl concentration than nitrate uptake. Overall, with a relatively higher nutrient content and a favorable (5 or higher) N:P ratio, a common green algal species such as C. morus could be a promising candidate next to species from the Chlorellaceae and Scenedesmaceae families.

1. Introduction

Untreated wastewater released to water bodies can result in changes in chemical and physical parameters which finally can affect the vital functions of living organisms living there. Large amounts of nutrients, especially nitrogen and phosphorous are responsible for eutrophication can enter to water resources, leading to changes in trophic status and nutrient supply. These shifts are followed by changes in dominance relationships and succession processes, which ultimately result in changes in the aquatic community [1].
The most common and most frequently used wastewater treatment system is the traditional activated sludge treatment system. Mechanical treatment of inflow wastewater is followed by a biological one, during which organic and inorganic contaminants are removed from the wastewater with the help of microorganisms [2]. However, due to the variety of contaminants, it is not possible to remove all of them with the traditional method, so systems are constantly being developed to effectively remove contaminants other than nutrients. Examples include algae-based purification systems, which have been under development for decades [3,4].
The autotrophic, heterotrophic, and mixotrophic metabolic properties of several algal species can be used in the wastewater biological treatment process [5,6]. Due to their photoautotrophic metabolism, algae are able to produce O2 in the presence of light using CO2, thus providing the amount of oxygen (aerobic conditions) required for the functioning of microorganisms in activated sludge and reducing the amount of CO2 in the atmosphere [7,8]. At the same time, algae have a pivotal role in reducing the amount of inorganic substances in wastewater that serve as nutrients for them (nitrogen, phosphorus), as well as removing other contaminants [3,4,9,10].
Algae-based wastewater treatment systems primarily use eukaryotic green algae and prokaryotic cyanobacteria. The efficiency of Chlorella species is reported in several studies, as nitrogen is removed by 45–97%, phosphorus by 28–96%, chemical oxygen demand (COD) is decreased by 61–86% from different types of wastewater (agricultural, communal, industrial—e.g., textile industry), and they are able to accumulate large amounts of lipids, especially under mixotrophic conditions [11]. Among cyanobacteria, filamentous Arthrospira species are the most studied, removing large amounts of nitrogen and phosphorus under autotrophic and mixotrophic conditions, while producing large amounts of biomass [12].
Due to the diversity of wastewater parameters, it is important to select appropriate microalgae species for algal-based wastewater treatment, as the efficiency of traditionally used algal species may decrease under changing conditions. In this case, the use of extremophilic, i.e., specialist microalgae species, which are viable even under changing or extreme conditions, should be preferred. Metabolic processes in some specialist microalgae species have been shown to be more effective at high temperatures (thermophilic) or lower temperatures (psychophilic) and under strongly acidic (acidophilic) or alkaline conditions (alkalophilic), other microalgae species adapted well to high salt (halophilic) or sugar (osmophilic) concentrations [13]. Among algae, halotolerant species are those ones, which are able to ploriferate in the presence or in the absence of a certain amount of salt, while halophilic algae require the presence of a certain, usually extreme amount of salt for optimal growth. Depending on the required salt content, halophilic species can be divided into three groups: weak halophiles: optimal growth is achieved with 1–3%, i.e., 10,000–30,000 mg L−1—NaCl; moderate halophiles: optimal growth is achieved with 3–15%, i.e., 30,000–150,000 mg L−1—NaCl and extreme halophiles (optimal growth is achieved above 15%, i.e., 150,000 mg L−1—NaCl [13,14].
Several studies report the importance of the N:P ratio from both ecological and biotechnological perspectives. The well-known Redfield’s Ratio (atomic or molar ratios of carbon, nitrogen, and phosphorus in phytoplankton [15]) can be considered a global average with significant variance for different phytoplankton species [16]. It is globally accepted that this ratio could be the optimal nutrient ratio required for growth, obviously with taxon specific differences: the average optimum N:P ratios for eukaryotic algae range from 16 to 23 N to 1 P, while the average optimum ratio for cyanobacteria found to be 10-16N:1P [17]. Some experimental studies proved that the optimal N:P ratio for certain algal species is indeed around the ratio widely accepted in the literature [18,19].
In wastewater, nutrient concentrations vary substantially. However, the optimal N:P ratio for the treatment of municipal wastewater using microalgae is not well described. High nutrient concentrations with unfavorable N:P ratios could lead inadequate growth or nutrient removal: e.g., in our recent study all the tested nine green algae isolates showed poor phosphate removal from Bold’s Basal Medium [20].
Coelastrum species are increasingly studied recently, thanks to their lipid and pigment accumulation ability and applicable capability in wastewater treatment. It was found that N-limitation promoted higher lipid contents in a Coelastrum strain (CORE-1), resulting in the highest lipid content (48% w/w) among five studied green algal strains [21]. Similarly, increasing lipid content occurred as a function of decreasing nitrogen concentration also in the case of another Coelastrum strain (HA-1) [22]. Úbeda et al. [23] reported remarkable growth of Coelastrum cf. pseudomicroporum in wastewater, furthermore they observed carotenoid accumulation in the used isolate under salt stress. A Coelastrum sp. isolated from cattle manure leachate showed high carbon fixation and nutrient removal abilities cultured in wastewater [24]. Coelastrum sp. TISTR 9501RE (closely related to Coelastrum morus strain SAG217-5) seemed to be a potent accumulator of astaxanthin, canthaxanthin, and lutein as major carotenoids under nutrient limited conditions; in addition, the strain was able to tolerate a wide range of salinity (up to 500 mM–29.25 g L−1) [25]. Tharek et al. [26] reported induction of astaxanthin accumulation by 3 g L−1 salinity (set with NaCl) and moderate nitrogen supply (nitrate) in the case of a Malaysian Coelastrum sp. isolate. Certain members of the genera are able to accumulate lipids, i.e., serve as a suitable feedstock for biodiesel production in heterotrophic cultivation using synthetic wastewater with molasses as carbon source [27].
Because of the incontestable importance of the topic and the above mentioned uncertainties about the relations of nutrient removal abilities, salinity tolerance and N:P ratios, we aimed to study the effects of higher and lower nitrate and phosphate content and N:P ratios (ranging within the “nutrient rich” category) on growth, nutrient removal ability and salt tolerance of the common green alga Coelastrum morus. The experiments were carried out in model solutions with slightly different nitrate and phosphate concentrations and N:P ratios to represent how usual, not harsh fluctuations in wastewater composition could effect on biomass production and removal characteristics. On the basis of literature data and our previous findings [20] we hypothesized that:
  • Higher nutrient content with higher N:P ratio is better for growth and salt tolerance than higher nutrient content with lower ratio, or lower nutrient contents.
  • Higher N:P ratios favor more efficient nutrient removal, independently from the initial nutrient contents.
  • More favorable growth conditions favor conductivity reduction (salt removal ability).

2. Materials and Methods

The coenobial green alga Coelastrum morus was isolated from a small aquatic habitat in northeastern Hungary, maintained as an axenic isolate in the Algal Culture Collection of the Department of Hydrobiology, University of Debrecen (ACCDH-UD) as standing culture under 14 h light (40 μmol photons m−2 s−1)—10 h dark photoperiod at 24 °C.
The experiments were carried out within the same circumstances in shaken cultures (SOH-D2 circular shaker, 90 rpm), in 100 mL Erlenmeyer flasks with 50 mL final volume. Duration of the experiments was 14 days. As model solutions, two generally used culturing media were chosen: Bold’s Basal Medium (BBM; Table S1; CCAP media recipes a [28]) and Jaworski’s Medium (JM; Table S1; CCAP media recipes b [29]). Both chosen media can be considered as media with low N:P ratio in relation to Redfield’s Ratio, and both of them can be considered as nutrient rich media, as culturing media are in general. But relative to each other, they represent different types from the point of view of nutrient content and N:P ratio. BBM can be considered as a medium with high nutrient content (182.4 mg L−1 nitrate and 163.2 mg L−1 phosphate) and low N:P ratio (2.93 mM N:1.7 mM P; i.e., N:P = 1.7). It was designated as higher content—lower ratio medium (HC-LR medium; Table 1). The modified version of this medium (with decreased phosphate content; Table S1) was used as a medium with high nutrient content (184.4 mg L−1 nitrate and 47.9 mg L−1 phosphate) and high N:P ratio (2.93 mM N:0.505 mM P; i.e., N:P = 5.8). It was designated as higher content—higher ratio medium (HC-HR medium; Table 1). JM was considered as a medium with lower nutrient content (68.86 mg L−1 nitrate and 18.2 mg L−1 phosphate) and higher N:P ratio (1.1 mM N:0.19 mM P; i.e., N:P = 5.8). It was designated as lower content—higher ratio medium (LC-HR medium; Table 1). The modified version of this medium (with increased phosphate content; Table S1) was used as a medium with lower nutrient content (68.86 mg L−1 nitrate and 60.35 mg L−1 phosphate) and lower N:P ratio (1.1 mM N:0.655 mM P; i.e., N:P = 1.7). It was designated as lower content—lower ratio medium (LC-LR medium; Table 1).
To study the salinity tolerance and desalination abilities of the C. morus strain, cultures supplemented with different amounts of NaCl were assembled for all four media. Control cultures were prepared without additional NaCl. To reach 500, 1000, 5000 and 10,000 mg L−1 (0.05–1%) salt concentrations, NaCl stock solution of 300 g L−1 was used. NaCl supplemented cultures were called as treated cultures. The composition of the different cultures is shown in Table 2. Accurate conductivity values and chloride contents at the beginning of the experiments were measured from so called “negative control” compositions (culturing media + salt, without algae). The results obtained from the algae cultures were corrected with changes in these compositions without algae.

2.1. Measurement of the Growth of the Cultures

For growth measurements, individual numbers (i.e., coenobia numbers in this case) were counted (according to the European Standard EN 15204 [30]. Samples of 1 mL were taken on every 2nd days of the experiments, 143 μL conc. formaldehyde was added to each sample for preservation (5% final concentration). Individual numbers were counted from 10 µL of the preserved samples in Bürker chamber at 400× magnification (BX50F-3 microscope, Olympus Optical Co. Ltd., Tokyo, Japan). To give To present the NaCl concentrations causing 50% growth inhibition (EC50 values), firstly the extent of growth inhibitions were calculated in percentage compared to control. Than the extent of growth inhibition was plotted as functions of NaCl concentrations obtaining growth inhibition—salt concentration curves. Trend lines were fitted showing a second order relationship between growth inhibition and salt concentration. The concentrations causing 50% inhibition were calculated from the quadratic equations of the trend lines.
The cultures were filtered (vacuum filter, Pall Corporation, New York, NY, USA GF/CTM 693 filter paper) at the end of the experiments (on the 14th day), the cell free media were used for the measurements of nitrate and phosphate concentrations, conductivity, and chloride contents.

2.2. Measurement of Nitrate, Phosphate, Conductivity and Chloride

Nutrient (nitrate and phosphate) concentrations, conductivity and chloride content of the cultures were measured at the beginning and at the end of the experiments. Data from negative control compositions on day 0 were used as baseline values, data measured at day 14 were used for the corrections of values measured in the cultures. Dataset of negative compositions proved that no precipitation occurred among the applied circumstances.
Nutrient concentrations were measured from 1 mL of cell-free samples collected at the beginning and at the 14th day of the experiments. Both nitrate and phosphate were measured by spectrophotometric methods: the salicylic acid colorimetric method [31] was applied for nitrate, and the acidic phosphorous molybdate method [32] was applied for phosphate content measurements. Both methods were reduced in volume to be possible to carry out in Eppendorf tubes in order to minimize sample requirements.
Conductivity was measured from the cell free media by a HQ30d portable multimeter (Hach Lange GmbH, Düsseldorf, Germany) equipped with an IntellicalTM CDC401 conductivity measuring electrode.
Chloride concentrations of the cell free media were measured by precipitation titration [33]. Aliquots of 12.5 mL cell free culturing media were used in the case of control, 500 and 1000 mg L−1 NaCl treated cultures and 1 mL was used for 5000 and 10,000 mg L−1 NaCl treated cultures. The titrations were done with silver nitrate measuring solution, the end point of the titration was indicated with potassium chromate indicator. After precipitation of the silver chloride precipitate equivalent to the amount of chloride ion, the excess of the measuring solution gives a reddish-brown silver chromate precipitate with the chromate ion, the yellow to reddish-brown color change indicate the end point of the titration. The amount of chloride was calculated with the formula given in the method and was expressed as mg L−1 chloride.

2.3. Statistical Analysis

Average values and standard deviations of three independent replicates of all experiments are presented. One-way analysis of covariance (ANCOVA [34,35]) was used to analyze differences among growth curve tendencies based on individual (coenobia) numbers in control and in treated cultures. One-way analysis of variance (ANOVA) was used for the comparison of conductivity reduction values (% and µS cm−1) and extents of chloride and nutrient removals (% and mg L−1). Paired T-tests were applied to analyze that nutrient concentrations, conductivity and chloride contents changed significantly from day 0 to day 14, or not. The Past software was used for all the statistical analyses [35].

3. Results

3.1. Growth and Salt Tolerance of the Cultures

In HC-LR medium, only cultures containing 10,000 mg L−1 NaCl showed significantly lower growth compared to control cultures (p < 0.05; Figure 1a). The amount of NaCl required for 50% growth inhibition in the treated cultures decreased from day 4 to day 14 (Table 3), so over time, the cultures showed an increasing sensitivity to the presence of salt.
In HC-HR medium, C. morus showed significantly lower growth compared to control in cultures treated with 1000, 5000 and 10,000 mg L−1 NaCl. Treatments with higher NaCl concentrations resulted in significantly lower individual numbers also compared to each other (p < 0.05; Figure 1b). The amount of NaCl required for 50% growth inhibition decreased from day 4 to day 7 and then increased again to day 14 (Table 3), suggesting growth regeneration after day 7.
In LC-HR medium, the growth of C. morus cultures treated with NaCl was significantly lower compared to control cultures in the cases of all treatments (p < 0.01; Figure 1c). Treatments with higher NaCl concentrations resulted in significantly lower individual numbers also compared to each other, except the 5000 and 10,000 mg L−1 treatment (Figure 1c). During the experiments, the amount of salt concentration required to achieve 50% growth inhibition decreased, so it can be concluded that the salt tolerance of C. morus cultures decreased in time (Table 3).
In LC-LR medium all treated cultures showed a significantly lower growth compared to the control, and in parallel with the increase of NaCl content, the growth of the cultures decreased significantly (p < 0.01; Figure 1d). The amount of NaCl required to achieve 50% growth inhibition decreased from day 4 to day 7 and then increased to day 14 (Table 3), so a slight regeneration of growth was observed also in this case.
Comparing the growth in different media under different treatments, control cultures showed the following order: LC-LR > HC-HR > LC-HR > HC-LR. There were significant differences among all media (p < 0.05). Cultures in 500 and 1000 mg L−1 treatments could be ranked as follows: HC-HR > LC-LR > LC-HR > HC-LR. Growth in all media differed significantly from each other in the presence of 500 mg L−1 NaCl (p < 0.01). It was significantly higher in HC-HR and LC-LR media, than in LC-HR and HC-LR (p < 0.05) in the presence of 1000 mg L−1 NaCl. In 5000 and 10,000 mg L−1 salt treated cultures the growth order was only slightly modified: HC-HR > LC-LR > HC-LR > LC-HR; only the growth in LC-HR was significantly lower than in other media.
The results suggest, that in general, higher N:P ratio is favorable for growth, while higher nutrient content is favorable for higher salt tolerance.

3.2. Nutrient (Nitrate and Phosphate) Removal

3.2.1. Nitrate Removal

Nitrate content decreased significantly (p < 0.05) in all media in control and in NaCl treated cultures (Table S2).
Nitrate content decreases in HC-LR medium ranged from 68.2 (10,000 mg L−1 NaCl treatment) to 97.9% (control). There was a significantly lower decrease of nitrate content compared to control in the 10,000 mg L−1 NaCl treatment (p < 0.05; Figure 2a; Table S3). There were lower decreases of nitrate concentrations with the increasing salt concentration, but the differences were not significant (Figure S1a).
The extent of nitrate content reduction in HC-HR medium ranged from 85.7 (10,000 mg L−1 NaCl treatment) to 93.1% (500 mg L−1 NaCl treatment). There was no significant difference between control and NaCl treated cultures, but compared to the 500 mg L−1 NaCl treated cultures, the 5000 and 10,000 mg L−1 treatments showed significantly lower nitrate removal (p < 0.05; Figure 2b; Table S3). On nitrate concentration basis, the decrease in 10,000 mg L−1 NaCl treated culture was significantly lower than in control and in 500 mg L−1 treatment (Figure S1b).
Nitrate removal was complete in control and treated cultures in LC-HR medium, there were no measurable amounts of nitrate in the culturing media on the 14th day of the exposition (Figure 2c; Table S3).
Nitrate removal in LC-LR medium ranged from 99.2 (10,000 mg L−1 NaCl treatment) to 100% (control, 500 and 1000 mg L−1 NaCl treatment; Figure 2d; Table S3).
Comparing the nitrate removal efficiency in different media, the results show that lower nitrate content favored complete nitrate removal regardless of the N:P ratio. However, significantly less nitrate was removed only from 5000 and 10,000 mg L−1 NaCl treatments cultured in media with high nitrate content (HC-LR and HC-HR). On nitrate concentration basis, nitrate removal obviously was higher from media with higher initial nitrate concentration, suggesting the high nitrate removal efficiency of the studied green algal strain. Overall, nitrate removal was significant in all media both in control and in NaCl treated cultures (Table S3), showing that N:P ratio or salt concentration has no direct effect on nitrate uptake of the applied C. morus strain.

3.2.2. Phosphate Removal

The phosphate content of all media was significantly reduced in all cultures to day 14 compared to the values measured at the beginning of the experiments (p < 0.05), except 10,000 mg L−1 NaCl treatments in LC-HR and LC-LR media (Table S4).
The extent of phosphate removal in HC-LR medium ranged from 25.8 (10,000 mg L−1 NaCl treatment) to 43% (control). As the salt concentration increased, the extent of phosphate removal decreased, but this decrease was not significant (Figure 3a; Table S5). Analysing phosphate removal on phosphate concentration basis, similar results were obtained (Figure S2a).
The decrease of phosphate content in HC-HR medium ranged from 15.8 (10,000 mg L−1 NaCl treatment) to 76.3% (control). In 1000, 5000 and 10,000 mg L−1 NaCl treated cultures phosphate removal was significantly lower compared to the control and to each other (p < 0.01; Figure 3b; Table S5). Analysing phosphate removal on phosphate concentration basis, similar results were obtained (Figure S2b).
The extent of phosphate removal in LC-HR medium ranged from 24.2 (10,000 mg L−1 NaCl treatment) to 98.2% (control). Phosphate removal was significantly lower in the 1000, 5000 and 10,000 mg L−1 treatments compared to the control, but in the presence of 1000 mg L−1 NaCl it was significantly higher than in 5000 and 10,000 mg L−1 treatments (Figure 3c; Table S5). On phosphate concentration basis, phosphate removal was significantly lower only in 5000 and 10,000 mg L−1 NaCl treated cultures compared to control and other treatments (Figure S2c).
The decrease of phosphate content in LC-LR medium ranged from 3.4 (10,000 mg L−1 NaCl treatment) to 39.8% (control). Significantly lower phosphate removal was observed in treated cultures compared to control and compared to each other along the increasing salt concentration (p < 0.05; Figure 3d; Table S5). On phosphate concentration basis, phosphate removal was significantly lower than in control only from 500 mg L−1 NaCl treatment (Figure S2d).
Comparing the different media, it can be said that significantly higher (p < 0.05) phosphate removal occurred in media with high N:P ratio in control, 500 and 1000 mg L−1 NaCl treated cultures, although in parallel with the increase of NaCl concentration, the extent of phosphate removal decreased. Lower phosphate removal was observable in media with low N:P ratio, significantly less (p < 0.05) phosphate was removed from LC-LR medium compared to the others in the case of all treatments (Table S5). On phosphate concentration basis, phosphate removal obviously was higher from media with higher initial phosphate concentration. Overall, these results suggest that higher N:P ratio is favorable to achieve more effective phosphate removal, and increasing salinity affects significantly the process.

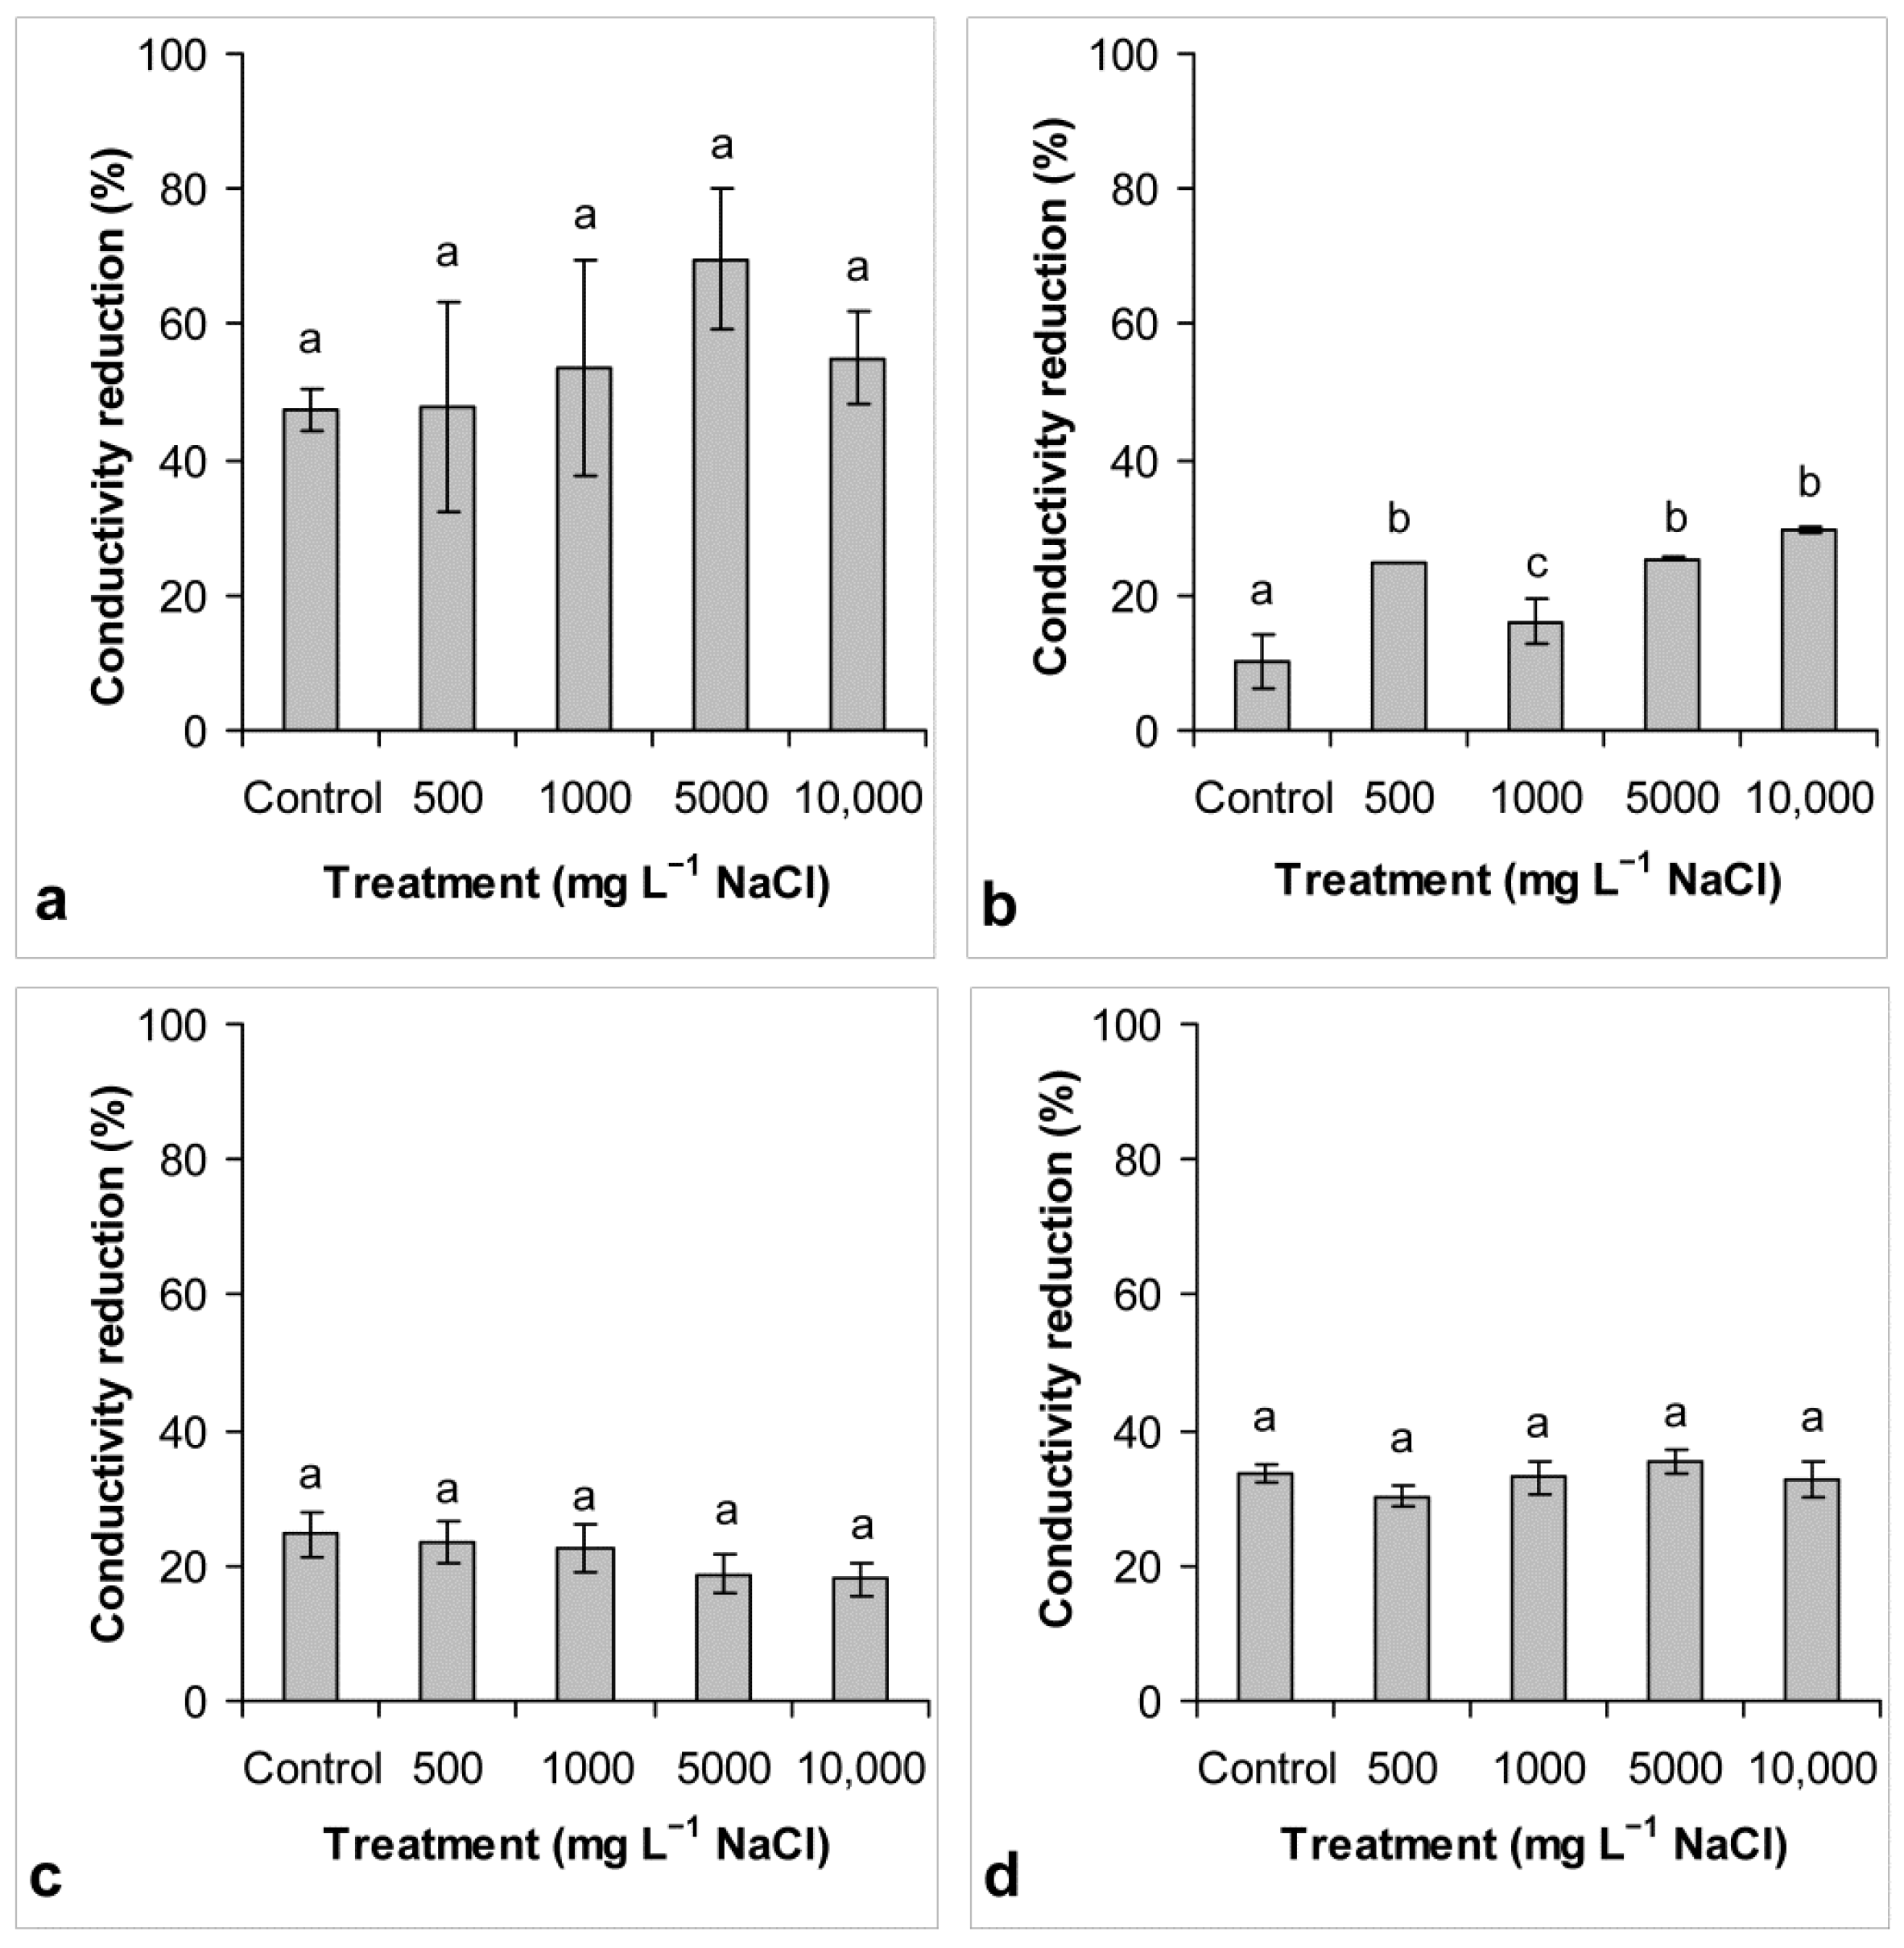
3.3. Conductivity Reduction

Conductivity was significantly reduced to day 14 in all cultures compared to the initial values (p < 0.05; Table S6).
The decreases of conductivity in HC-LR medium ranged from 47.4 (control) to 69.7% (5000 mg L−1 treatment). The conductivity reduction increased with increasing salt concentration (Figure 4a; Table S7). Although percentage values did not differed significantly among different treatments, taking into account the initial concentrations, the amount of removed ionic compounds was significantly higher in 5000 and 10,000 mg L−1 NaCl treated cultures (Figure S3a).
The decrease of conductivity in HC-HR medium ranged from 10.3 (control) to 29.6% (10,000 mg L−1 treatment). Compared to the control, the extent of conductivity decrease was significantly higher in the treated cultures (p < 0.05; Figure 4b; Table S7), this was more remarkable on µS cm−1 basis (Figure S3b).
The decreases of conductivity in LC-HR medium ranged from 18 (10,000 mg L−1 treatment) to 24.7% (control; Figure 4c; Table S7). The decrease in conductivity in the treated cultures decreased with increasing salt concentration, the differences among percentage values were not significant. Taking into account the initial concentrations, the amount of removed ionic compounds was significantly higher in 5000 and 10,000 mg L−1 NaCl treated cultures (Figure S3c).
Conductivity reduction in LC-LR medium ranged from 32.7 (10,000 mg L−1 treatment) to 35.5% (5000 mg/L treatment). There was no significant difference in the percentage values of the treated cultures compared to the control (Figure 4d; Table S7), but on µS cm−1 basis conductivity reduction was significantly higher in 5000 and 10,000 mg L−1 NaCl treated cultures (Figure S3d).
Comparing the extent of the conductivity reduction in the different media, it can be concluded that significantly higher decrease occurred in HC-LR medium in all treatments (p < 0.05) than in the same treatment in other media. The lowest conductivity reduction occurred in LC-HR medium (except in controls, where lowest reduction was observed in HC-HR medium), with significant differences in the case of 5000 and 10,000 mg L−1 treated cultures in other media (p < 0.05; Table S7). Overall, conductivity reduction was higher in media with higher ionic contents and lower N:P ratio favored a more effective conductivity reduction.

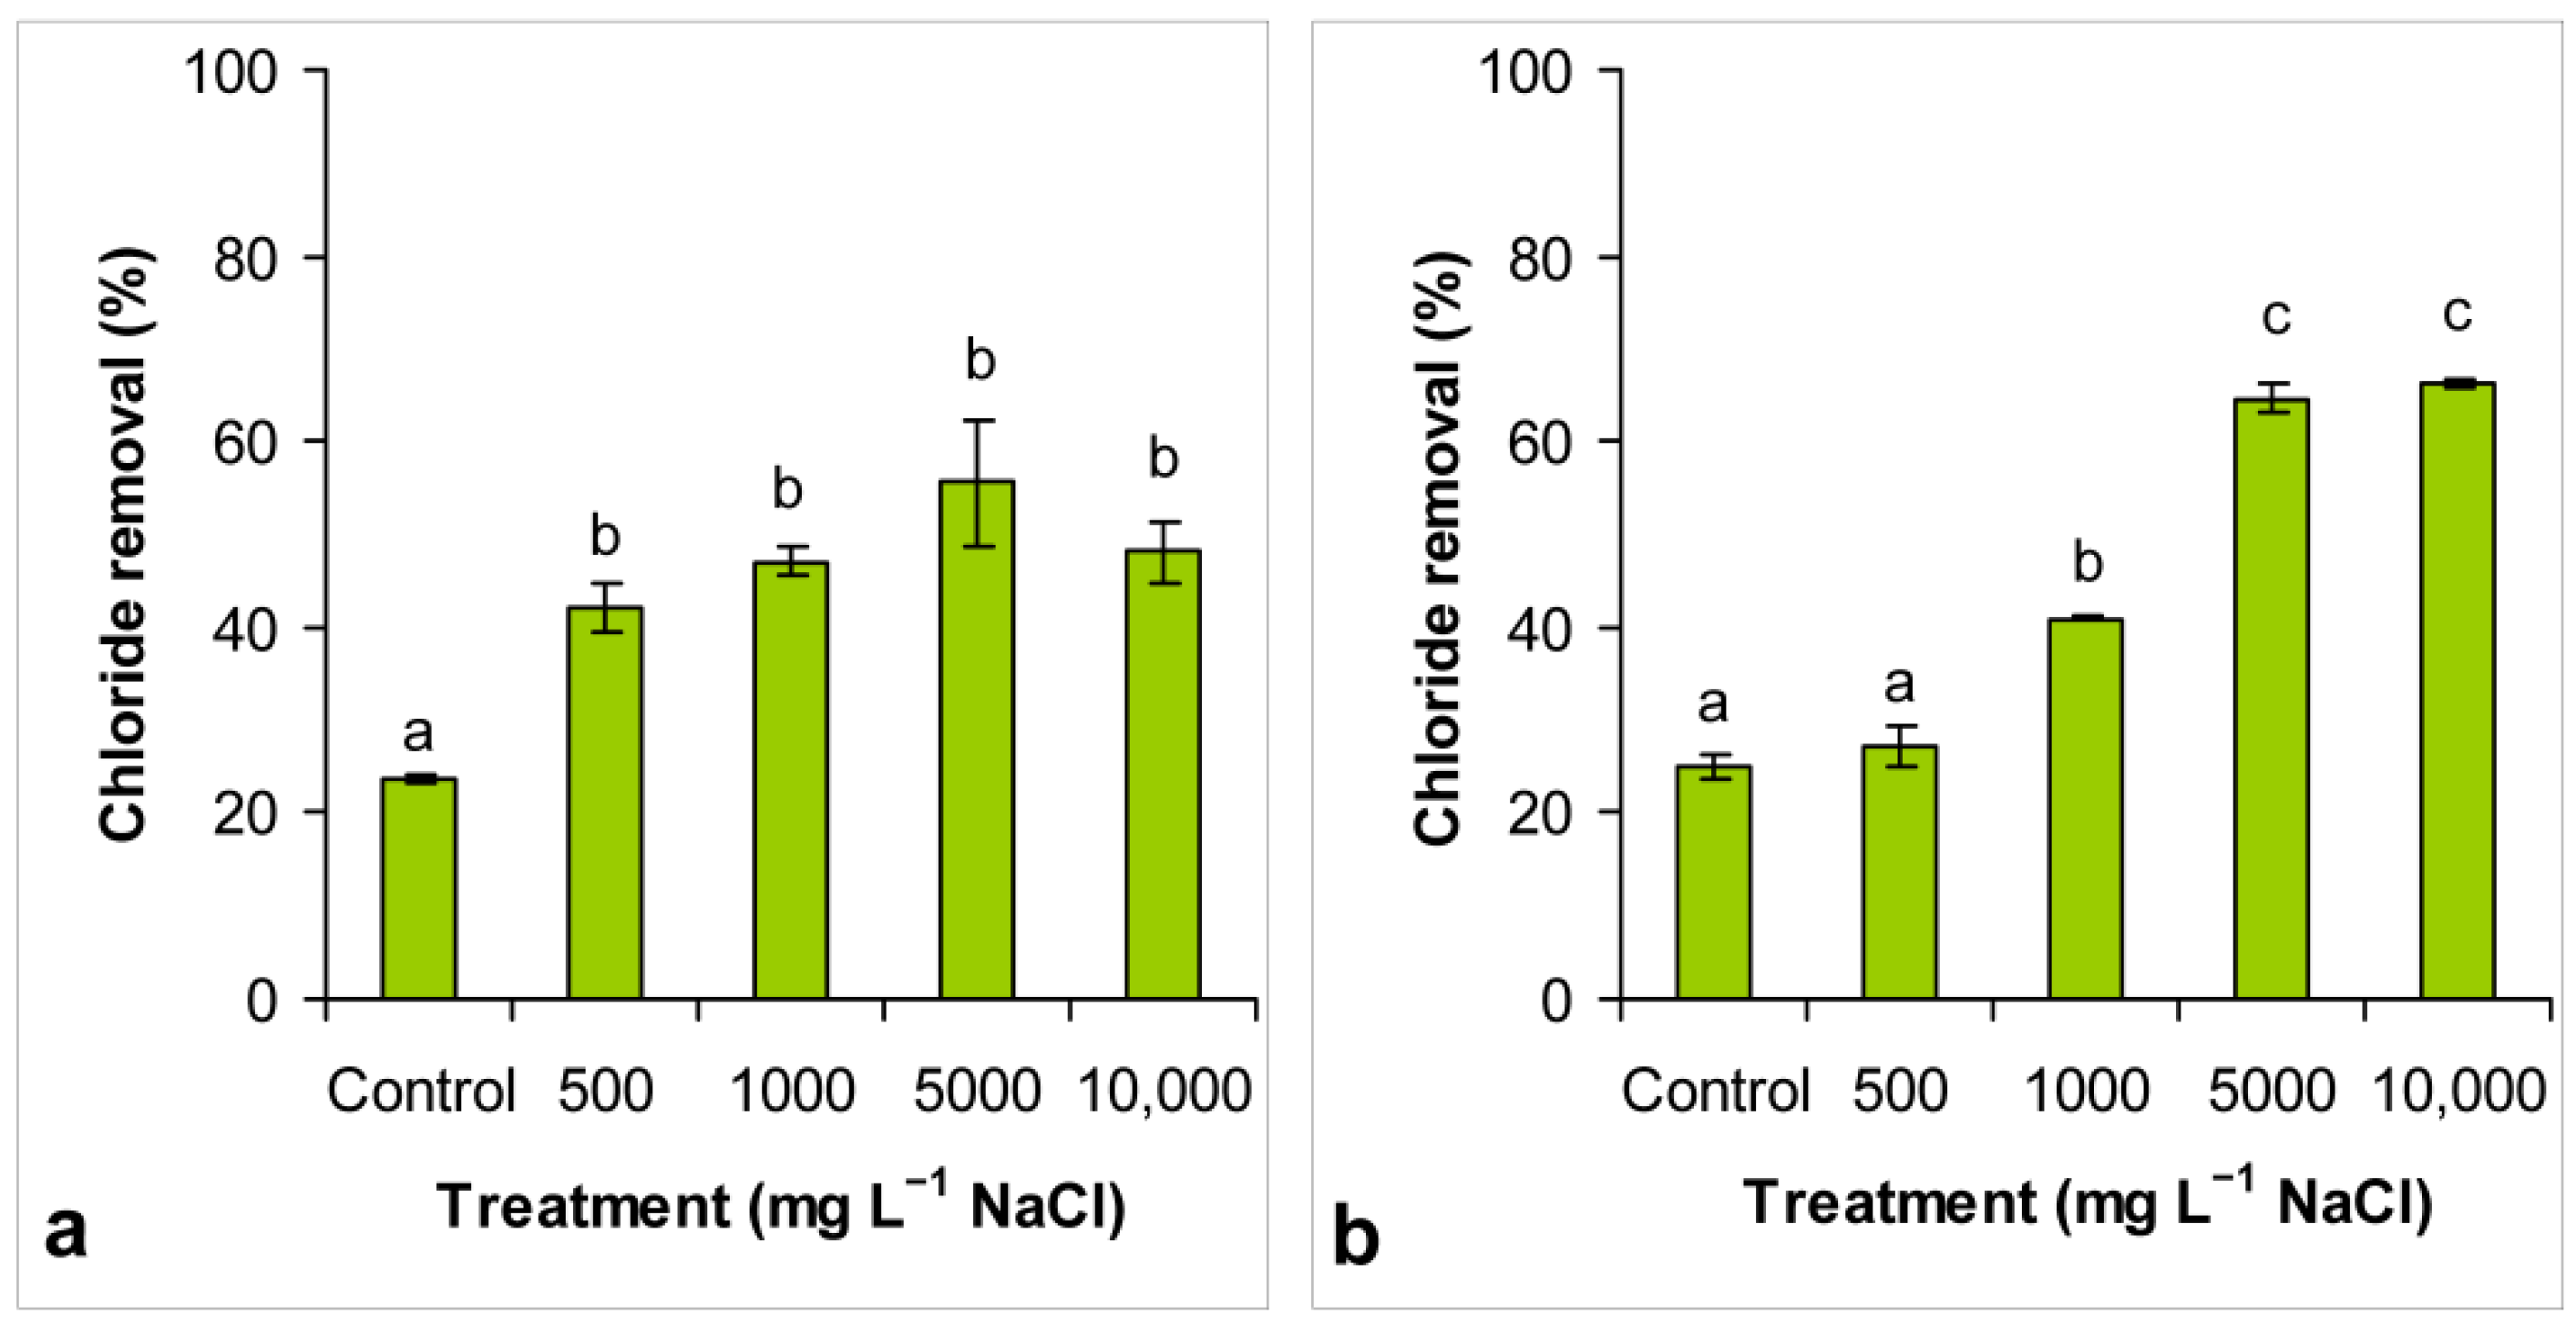
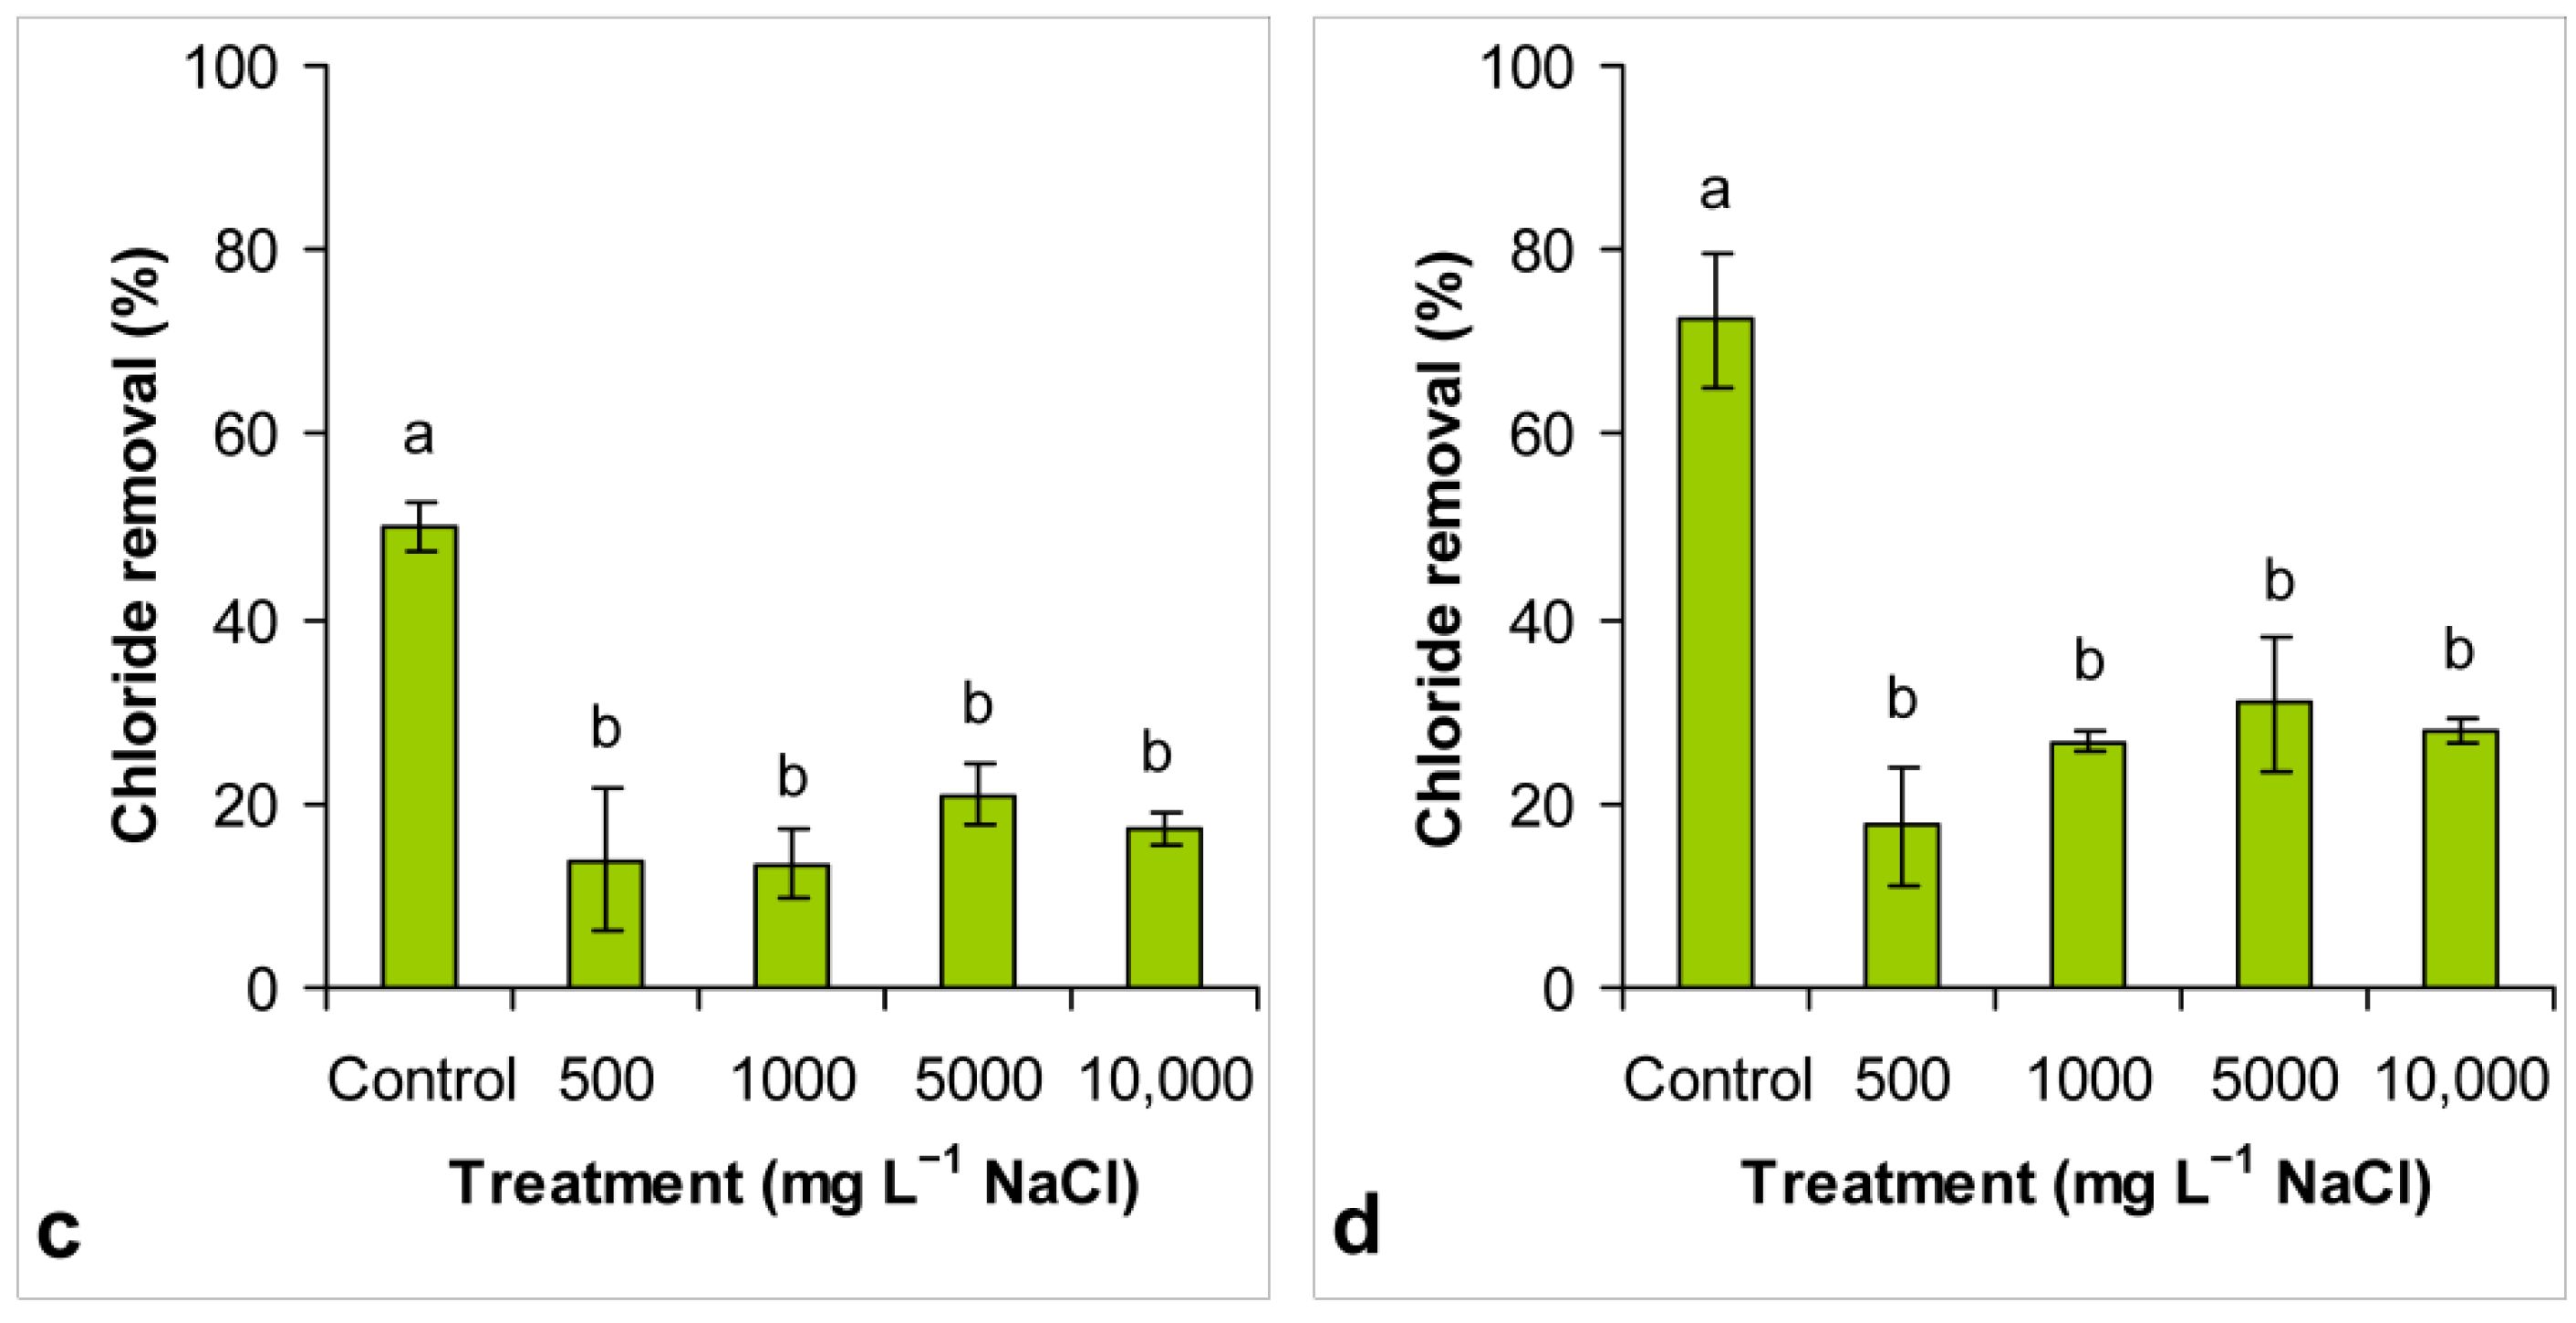
3.4. Chloride Removal

Chloride content decreased significantly (p < 0.05) from the beginning of the experiments to day 14 in every cases (except in 500 mg L−1 NaCl treatment in LC-HR; Table S8).
In HC-LR medium, chloride removal ranged from 23.5 (control) to 55.7% (5000 mg L−1 treatment). Not surprisingly, treated cultures removed significantly higher amount of chloride compared to the control cultures (p < 0.01; Figure 5a; Table S9). The proportion of removed chloride increased with increasing salt content to 5000 mg L−1 treatment, but there were no significant differences between the individual treatments (Figure 5a; Table S9). On concentration basis, chloride removal was significantly higher in the case of cultures treated with 5000 and 10,000 mg L−1 NaCl concentrations (Figure S4a).
Chloride removal ranged in HC-HR medium from 24.9 (control) to 66.3% (10,000 mg L−1 treatment). The extent of chloride removal increased with the increasing NaCl concentration; there was significantly higher chloride removal in the 1000, 5000 and 10,000 mg L−1 treatments compared to the control and to each other in several cases (p < 0.001; Figure 5b; Table S9). Similar results were obtained by analyzing the results on chloride concentration basis (Figure S4b).
Chloride removal in LC-HR medium ranged from 13.5 (1000 mg L−1 treatment) to 50% (control). Compared to the control, the extent of chloride removal was significantly lower in the treated cultures (p < 0.01; Figure 5c; Table S9). There was no clear trend in chloride removal along NaCl concentrations and there were no significant differences between treatments (Figure 5c; Table S9). Analyzing the results on chloride concentration basis, a different picture can be seen: chloride removal was significantly higher in the case of cultures treated with 5000 and 10,000 mg L−1 NaCl concentrations (Figure S4c).
Chloride removal in LC-LR ranged from 17.5 (500 mg L−1 treatment) to 72.4% (control); characteristic of chloride content changes were very similar to that of observed in LC-HR medium. Compared to the control, chloride removal was significantly lower in all treated cultures (p < 0.01; Figure 5d; Table S9). Similarly to LC-HR medium, analyzing the results on chloride concentration basis, a different picture can be seen: chloride removal was significantly higher in the case of cultures treated with 5000 and 10,000 mg L−1 NaCl concentrations (Figure S4d).
Comparing the different media, the chloride removal in NaCl treated cultures was significantly higher (p < 0.05) in the presence of high nutrient content (HC-LR and HC-HR media). Chloride removal was higher in cultures treated with 500 and 1000 mg L−1 NaCl if the N:P ratio was low (HC-LR), but in cultures treated with 5000 and 10,000 mg L−1 NaCl, the higher removal was performed, when N:P ratio was higher (HC-HR). In media with lower nutrient content, chloride removal was low in NaCl treated cultures (Table S9). These result suggest that higher nutrient content favors to more efficient chloride removal, and higher N:P ratio has significant role only in the case of higher nutrient content.

4. Discussion

4.1. Growth and Salt Tolerance

Although literature data generally show that higher N:P ratios are better for phytoplankton growth both in the cases of higher [18,19] or lower nutrient contents [36,37], our results did not reveal that higher nutrient content with higher N:P ratio is better for growth and salt tolerance than higher nutrient content with lower ratio, or lower nutrient contents. In control cultures without salt treatment, the highest individual numbers were observed in LC-LR medium, while it was significantly lower in HC-HR medium and it was the worst in HC-LR medium. Despite the intensive research on the field, there are only few studies comparing the effect of different nutrient concentrations with the same N:P ratio. Liu et al. (2011) observed that the cyanobacterium Microcystis aeruginosa showed better growth in media with higher nutrient content than in lower ones at similar low (1) N:P ratio [38]. Although the used media were designated as higher and lower nutrient content, neither HC-LR nor LC-LR media used in our study can be considered as limiting from nutrient concentration point of view studying wastewaters. Growth tendencies in our experiments suggest that there could be an upper limit of nitrate and phosphate concentrations, at which growth is inhibited. Terry showed in the case of a marine prymnesiophyte that phosphate interacts with nitrate at certain concentrations [39]. Our results clearly show that only ~40% of phosphate is removed from control cultures at N:P = 1.7, independently of the initial concentrations. According to our knowledge, the underlying mechanism is still not clear. The supposed negative interaction between phosphate and nitrate, when their concentrations are close to each other could explain the observed growth characteristics, but simple physical-chemical features do not support the observations [40]. Exact explanation of the phenomenon requires further, more detailed nutrient uptake studies.
Although there were no clear correlations of salt tolerance, nutrient content and N:P ratio (rejecting our first hypothesis), cultures with the best growth without salt treamtments (controls in LC-LR and HC-HR media) showed the best growth also in all cases of NaCl treatments. However, EC50 values showed a different picture: they were not calculable within the first week and it was the highest on day 14 in HC-LR medium, in which the weakest growth was observed. Our results also revealed that higher nutrient content favors to withstand against the negative effects of high chloride concentrations, especially in the case of longer exposure times. These observations are in accordance with the results of Park et al. about another coenobial green alga, Scenedesmus quadricauda [41]. It seems that similarly to S. quadricauda and other coenobial green algae (e.g., Scenedesmus bijugatus [42]), the studied Coelastrum morus requires different N:P ratios for its survival under different salinity levels. It was reported in the case of a cyanobacterium that nitrate as nitrogen source has a protecting role against dissolved salts toxicity [43]. This also could be part of the background of higher salt tolerance of cultures in HC-LR medium, although salt tolerance of cultures in HC-HR medium with similar nitrate content was significantly higher only at the end of the exposition.
Comparing simply the salt tolerance of the studied strain with other Coelastrum isolates, it can be said, that there are more tolerant ones: Úbeda et al. [23] and Rauytanaparti et al. [25] both reported growth of Coelastrum species under higher salinity conditions than the ones presented here.

4.2. Nutrient Removal

4.2.1. Nitrate

Our results clearly proved that independently the NaCl concentration, the initial amount of nitrate in media was rather important in nitrate removal than N:P ratio: lower nitrate content favored complete nitrate removal (partly rejecting our second hypothesis). However, nitrate removal was impressive also in the cases of high initial nitrate content. Shriwastav et al. observed similar phenomena in the case of Chlorella sorokiniana cultured in media with different N:P ratio: they reported efficient nitrate removal in all types of media they used [36]. Nitrate removal also did not changed in the case of a Chlorella vulgaris strain cultured in media with different N:P ratio [37].
The extent of nitrate removal is important for wastewater treatment, because high nitrogen content can be a major cause of eutrophication in the aquatic environment [44]. Our results clearly highlighted that despite the different amount of nutrients and N:P ratio, a large amount of nitrate was removed by the green alga C. morus, regardless of the used salt concentrations (500–10,000 mg L−1 NaCl). Similarly large extent of nitrate removal were observed in cultures of freshwater green algae grown in HC-LR medium at different salt concentrations (500–20,000 mg L−1 NaCl) in our previous experiments [20]. It can be concluded that nitrate removal is not significantly affected by the salt content in a wide concentration range in the case of common green algae, only indirectly, through growth inhibition.

4.2.2. Phosphate

Our results pointed a strong and clear relationship between N:P ratio and phosphate removal (proving the second hypothesis from the point of view of phosphate): higher N:P ratio indeed favored phosphate removal independently from the initial phosphate concentration. Although there were higher removed amounts of phosphate from HC-LR and LC-LR medium than from HC-HR and LC-HR medium on phosphate concentration basis (Figure S2), the reason is simply because of the higher initial phosphate concentrations of the formers. The remaining amount of phosphate was also higher in media with higher initial phosphate concentration (HC-LR and LC-LR media, Table S4), so taking the phosphate content of the “effluent” into account, lover initial concentrations and higher N:P ratios are the most favorable conditions. Better phosphorous removal from media with higher N:P ratios also were observed in the case of some other isolates (Pseudanabaena, Cladophora and Klebsormidium isolates [45]; Chlorella sorokiniana [36]; C. vulgaris [37,46]; Scenedesmus sp. [47]). Our results also indicated that salt content does not affect directly the phosphate uptake, only indirectly via growth inhibition, similarly to nitrate removal. Media with different initial nutrient contents and N:P ratios can be ranked almost in the same order in the presence of a certain NaCl concentration. Lagus et al. studied phosphate removal in mesocosms with salinity above 6‰ (6 g L−1) along different nutrient concentrations and N:P ratios [48]. They also observed that salt content barely affected phosphate accumulation, which extent was the best in the presence at higher N:P ratio (5.77). Although there are several chemical methods for phosphate removal [49], the more environmentally friendly biological methods seem to be more difficult to perform than nitrate removal, because of the probable sensitivity of the process on N:P ratio. Results of the present study and literature data suggest that satisfactory phosphorous removal could be achieved even in a wide range of salinity setting lower phosphate concentration (below 50 mg L−1) and higher (at least 5) N:P ratio.

4.3. Conductivity Reduction and Chloride Removal

The results show that conductivity reduction and salt removal ability were not in connection with favorable growth conditions (rejecting our third hypothesis). Conductivity reduction and chloride removal were significantly higher in HC-LR medium, in which lower growth was observed compared to the other media, especially at lower (500 and 1000 mg/L) NaCl concentrations. It suggests that individuals inhibited in cell division, are able to accumulate high amounts of ions, which is a well-known phenomenon: both freshwater and marine algae are able to accumulate chloride and sodium ions in vacuoles [50]. It is also known that nitrogen source influences the accumulation of chloride [51], although the understanding of the context of initial nitrate concentration, chloride accumulation and the above mentioned possible protecting effect of higher nitrate content against high salt concentrations [47] definitely requires further investigations.
Comparing the conductivity reducing and chloride removal ability of the studied C. morus to other green algae, it seems that the isolate can be characterized more remarkable abilities regarding these processes, than other green algae previously studied in our laboratory [20] or by other authors [52].

5. Conclusions

Our results pointed out that slight differences in nitrate and phosphate content of the culturing media (ranging within the “nutrient rich” category) result in differences in the N:P ratio could lead significantly different algal growth characteristics. The results suggest that high nitrate content (above 100 mg L−1) with a similarly high phosphate concentration (resulting low N:P ratio) is not the most favorable situation for the growth of the green alga C. morus. The studied isolate can be considered as a halotolerant species, showing remarkable growth up to 1000 mg L−1 NaCl. It seems that higher nutrient content contribute to higher halotolerance. In the case of nitrate and phosphate uptake, it can be concluded that these physiological processes are not directly affected by NaCl content in the studied range, as a further approval of the halotolerance of the species. Significant amount of nitrate was removed in media with different nutrient contents and N:P ratios along different salt concentrations. High N:P ratios favor phosphate removal, which is more inhibited by increasing NaCl concentration than nitrate uptake. Conductivity reduction and chloride removal were not in strong connection with favorable growth conditions, similarly to salt tolerance. C. morus is able to remove chloride ions regardless of nutrient content and N:P ratio. However, higher nutrient content seemed to be more favorable for the process. Overall, with a relatively higher nutrient content and a favorable (5 or higher) N:P ratio, a common green algae species such as C. morus could be able to significantly improve wastewater quality. Examining the composition of the biomass produced in the process can also shed light on the advantages of the species’s further uses.

Supplementary Materials

The following are available online at https://www.mdpi.com/article/10.3390/en14082112/s1, Table S1: Composition of the used culturing media. Table S2: Nitrate content values (mg L−1) measured at the start (day 0) and at the end (day 14) of the experiments, Table S3: Extent of nitrate removal (%) from the different media with different NaCl contents, Table S4: Phosphate content values (mg L−1) measured at the start (day 0) and at the end (day 14) of the experiments, Table S5: Extent of phosphate removal (%) from the different media with different NaCl contents, Table S6: Conductivity values (mg L−1) measured at the start (day 0) and at the end (day 14) of the experiments, Table S7: Extent of conductivity reduction (%) from the different media with different NaCl contents, Table S8: Chloride content values (mg L−1) measured at the start (day 0) and at the end (day 14) of the experiments, Table S9: Extent of chloride removal (%) from the different media with different NaCl contents. Figure S1: Nitrate removal (mg L−1) from the different media with different NaCl contents; Figure S2: Phosphate removal (mg L−1) from the different media with different NaCl contents; Figure S3: Conductivity reduction (µS cm−1) in the different media with different NaCl contents; Figure S4: Chloride removal (mg L−1) from the different media with different NaCl contents.

Author Contributions

Conceptualization, I.B.; methodology, A.F., I.B.; formal analysis, A.F., K.M. investigation, A.F., K.M.; resources, I.B.; data curation, A.F., K.M. and I.B.; writing—original draft, A.F. and K.M.; writing—review and editing, I.B., V.B.-B.; visualization, A.F., K.M., I.B., V.B.-B.; project administration, I.B.; supervision, I.B.; funding acquisition, I.B. All authors have read and agreed to the published version of the manuscript.

Funding

This research was funded by the National Research Development and Innovation Office NKFIH FK 131 917 Grant (István Bácsi). Project no. TKP2020-IKA-04 has been implemented with the support provided from the National Research Development and Innovation Fund of Hungary, financed under the 2020-4.1.1-TKP2020 funding scheme.

Institutional Review Board Statement

Not applicable.

Informed Consent Statement

Not applicable.

Data Availability Statement

The data that support the findings of this study are available from the corresponding author upon reasonable request.

Conflicts of Interest

Authors declare no conflict of interest. The funders had no role in the design of the study; in the collection, analyses, or interpretation of data; in the writing of the manuscript, or in the decision to publish the results.

References

  1. Edwards, A.C.; Withers, P.J.A. Linking phosphorus sources to impacts in different types of water body. Soil Use Manag. 2007, 23, 133–143. [Google Scholar] [CrossRef]
  2. Abdel-Raouf, N.; Al-Homaidan, A.A.; Ibraheem, I.B.M. Microalgae and wastewater treatment. Saudi. J. Biol. Sci. 2012, 19, 257–275. [Google Scholar] [CrossRef] [Green Version]
  3. Fernandes, T.V.; Suárez-Muñoz, M.; Trebuch, L.M.; Verbraak, P.J.; Van de Waal, D.B. Toward an ecologically optimized N:P recovery from wastewater by microalgae. Front. Microbiol. 2017, 8, 1742. [Google Scholar] [CrossRef] [PubMed] [Green Version]
  4. Rani, S.; Gunjyal, N.; Ojha, C.S.P.; Asce, F.; Singh, R.P. Review of challenges for algae-based wastewater treatment: Strain selection, wastewater characteristics, abiotic, and biotic factors. J. Hazard. Toxic Radioact. Waste 2021, 25, 03120004. [Google Scholar] [CrossRef]
  5. Ebrahimian, A.; Kariminia, H.R.; Vosoughi, M. Lipid production in mixotrophic cultivation of Chlorella vulgaris in a mixture of primary and secondary municipal wastewater. Renew. Energy 2014, 71, 502–508. [Google Scholar] [CrossRef]
  6. Zhou, W.; Li, Y.; Min, M.; Hu, B.; Chen, P.; Ruan, R. Local bioprospecting for high-lipid producing microalgal strains to be grown on concentrated municipal wastewater for biofuel production. Bioresour. Technol. 2011, 102, 6909–6919. [Google Scholar] [CrossRef] [PubMed]
  7. Oswald, W.J. Micro-algae and waste-water treatment. In Micro-Algal Biotechnology; Borowitzka, M.A., Borowitzka, L.J., Eds.; Cambridge University Press: New York, NY, USA, 1988; pp. 305–328. [Google Scholar]
  8. Muñoz, R.; Jacinto, M.; Guieysse, B.; Mattiasson, B. Combined carbon and nitrogen removal from acetonitrile using algal–bacterial bioreactors. Appl. Microbiol. Biotechnol. 2005, 67, 699–707. [Google Scholar] [CrossRef]
  9. Perales-Vela, H.V.; Peña-Castro, J.M.; Cañizares-Villanueva, R.O. Heavy metal detoxification in eukaryotic microalgae. Chemosphere 2006, 64, 1–10. [Google Scholar] [CrossRef] [PubMed]
  10. Wang, Y.; Liu, J.; Kang, D.; Wu, C.; Wu, Y. Removal of pharmaceuticals and personal care products from wastewater using algae-based technologies: A review. Rev. Environ. Sci. Biotechnol. 2017, 16, 717–735. [Google Scholar] [CrossRef]
  11. Safi, C.; Zebib, B.; Merah, O.; Pontalier, P.Y.; Vaca-Garcia, C. Morphology, composition, production, processing and applications of Chlorella vulgaris: A review. Renew. Sustain. Energy Rev. 2014, 35, 265–278. [Google Scholar] [CrossRef] [Green Version]
  12. Zhai, J.; Li, X.; Li, W.; Rahaman, M.H.; Zhao, Y.; Wei, B.; Wei, H. Optimization of biomass production and nutrients removal by Spirulina platensis from municipal wastewater. Ecol. Eng. 2017, 108, 83–92. [Google Scholar] [CrossRef]
  13. Singh, P.; Jain, K.; Desai, C.; Tiwari, O.; Madamwar, D. Microbial community dynamics of extremophiles/extreme environment. In Microbial Diversity in the Genomic Era; Das, S., Dash, H.R., Eds.; Academic Press: Cambridge, MA, USA, 2019; pp. 323–332. [Google Scholar]
  14. Ventosa, A.; de la Haba, R.R.; Sánchez-Porro, C.; Papke, R.T. Microbial diversity of hypersaline environments: A metagenomic approach. Curr. Opin. Microbiol. 2015, 25, 80–87. [Google Scholar] [CrossRef] [PubMed]
  15. Redfield, A.C.; Ketchum, B.H.; Richards, F.A. The influence of organisms on the composition of seawater. In The Sea, 2nd ed.; Hill, M.H., Ed.; Wiley: Hoboken, NJ, USA, 1963. [Google Scholar]
  16. Martiny, A.C.; Vrugt, J.A.; Lomas, M.W. Concentrations and ratios of particulate organic carbon, nitrogen, and phosphorus in the global ocean. Sci. Data 2014, 1, 140048. [Google Scholar] [CrossRef] [Green Version]
  17. Schreurs, H. Cyanobacterial Dominance, Relation to Eutrophication and Lake Morphology. Ph.D. Thesis, University of Amsterdam, Amsterdam, The Netherlands, 1992. [Google Scholar]
  18. Mayers, J.J.; Flynn, K.J.; Shields, R.J. Influence of the N:P supply ratioon biomass productivity and time-resolved changes in elemental and bulk biochemical composition of Nannochloropsis sp. Bioresour. Technol. 2014, 169, 588–595. [Google Scholar] [CrossRef] [PubMed] [Green Version]
  19. Rasdi, N.W.; Qin, J. Effect of N:P ratio on growth and chemical composition of Nannochloropsis oculata and Tisochrysis lutea. J. Appl. Psychol. 2015, 27, 2221–2230. [Google Scholar] [CrossRef]
  20. Figler, A.; B-Béres, V.; Dobronoki, D.; Márton, K.; Nagy, S.A.; Bácsi, I. Salt tolerance and desalination abilities of nine common green microalgae isolates. Water 2019, 11, 2527. [Google Scholar] [CrossRef] [Green Version]
  21. Valdez-Ojeda, R.; Gonzalez-Munoz, M.; Us-Vazquez, R.; Narvaez-Zapata, J.; Chavarria-Hernandez, J.C.; Lopez-Adrian, S.; Barahona-Perez, F.; Toledano-Thompson, T.; Garduno-Solorzano, G.; Medrano, R.M.E.G. Characterization of five fresh water microalgae with potential for biodiesel production. Algal Res. 2014, 7, 33–44. [Google Scholar] [CrossRef]
  22. Yang, Z.H.; Zhao, Y.; Liu, Z.Y.; Liu, C.F.; Hu, Z.P.; Hou, Y.Y. A Mathematical Model of Neutral Lipid Content in terms of Initial Nitrogen Concentration and Validation in Coelastrum sp. HA-1 and Application in Chlorella sorokiniana. BioMed Res. Int. 2017, 9253020. Available online: https://www.hindawi.com/journals/bmri/2017/9253020/ (accessed on 8 April 2021). [CrossRef] [Green Version]
  23. Úbeda, B.; Galvez, J.A.; Michel, M.; Bartual, A. Microalgae cultivation in urban wastewater: Coelastrum cf. pseudomicroporum as a novel carotenoid source and a potential microalgae harvesting tool. Bioresour. Technol. 2016, 228, 210–217. [Google Scholar] [CrossRef]
  24. Mousavi, S.; Najafpour, G.D.; Mohammadi, M.; Seifi, M.H. Cultivation of newly isolated microalgae Coelastrum sp. in wastewater for simultaneous CO2 fixation, lipid production and wastewater treatment. Bioprocess Biosyst. Eng. 2018, 41, 519–530. [Google Scholar] [CrossRef]
  25. Rauytanapanit, M.; Janchot, K.; Kusolkumbot, P.; Sirisattha, S.; Waditee-Sirisattha, R.; Praneenararat, T. Nutrient Deprivation-Associated Changes in Green Microalga Coelastrum sp. TISTR 9501RE Enhanced Potent Antioxidant Carotenoids. Mar. Drugs 2019, 17, 328. [Google Scholar] [CrossRef] [Green Version]
  26. Valdez-Ojeda, R.A.; Serrano-Vazquez, M.G.D.; Toledano-Thompson, T.; Chavarria-Hernandez, J.C.; Barahona-Perez, L.F. Effect of media composition and culture time on the lipid profile of the green microalga Coelastrum sp. and its suitability for Biofuel Production. Bioenergy Res. 2021, 14, 241–253. [Google Scholar] [CrossRef]
  27. Tharek, A.; Yahya, A.; Salleh, M.M.; Jamaluddin, H.; Yoshizaki, S.; Dolah, R.; Hara, H.; Iwamoto, K.; Mohamad, S.E. Improvement of Astaxanthin Production in Coelastrum sp. by Optimization Using Taguchi Method. Appl. Food. Biotechnol. 2020, 7, 205–214. [Google Scholar]
  28. CCAP Media Recipes a. Available online: https://www.ccap.ac.uk/media/documents/BB.pdf (accessed on 5 February 2021).
  29. CCAP Media Recipes b. Available online: https://www.ccap.ac.uk/media/documents/JM.pdf (accessed on 5 February 2021).
  30. European Standard EN 15204: Water Quality—Guidance Sandard on the Enumeration of Phytoplankton Using Inverted Microscopy (Utermöhl Technique). Available online: https://standards.iteh.ai/catalog/standards/cen/d9020a71-2bd3-478f-867f-46ea3a0c0620/en-15204-2006 (accessed on 24 May 2019).
  31. Hungarian Standard MSZ 1484-13: 2009. Water Quality. Part 13: Determination of Nitrate and Nitrite Content by Spectrophotometric Method. Available online: http://www.mszt.hu/web/guest/webaruhaz (accessed on 24 May 2019).
  32. Hungarian Standard MSZ EN ISO 6878: 2004. Water Quality. Determination of Phosphorus. Ammonium Molybdate Spectrometric Method (ISO 6878:2004). Available online: https://www.iso.org/standard/36917.html (accessed on 24 May 2019).
  33. Németh, J. Methods of Biological Water Qualification; Institute of Environmental Management, Environmental Protection Information Service: Budapest, Hungary, 1998. [Google Scholar]
  34. Zar, H. Biostatistical Analysis, 3rd ed.; Prentice-Hall International: Hoboken, NJ, USA, 1996. [Google Scholar]
  35. Hammer, O.; Harper, D.A.T.; Ryan, P.D. PAST: Paleontological statistics software package for education and data analysis. Palaeontol. Electron. 2001, 2001, 9. [Google Scholar]
  36. Shriwastav, A.; Gupta, S.K.; Ansari, F.A.; Rawat, I.; Bux, B. Adaptability of growth and nutrient uptake potential of Chlorella sorokiniana with variable nutrient loading. Bioresour. Technol. 2014, 174, 60–66. [Google Scholar] [CrossRef]
  37. Choi, H.J.; Lee, S.M. Effect of the N/P ratio on biomass productivity and nutrient removal from municipal wastewater. Bioprocess Biosyst. Eng. 2015, 38, 761–766. [Google Scholar] [CrossRef]
  38. Liu, Y.; Li, L.; Jia, R. The Optimum Resource Ratio (N:P) for the Growth of Microcystis aeruginosa with Abundant Nutrients. Procedia Environ. Sci. 2011, 10, 2134–2140. [Google Scholar] [CrossRef] [Green Version]
  39. Terry, K.L. Nitrate and phosphate uptake interactions in a marine prymnesiophyte. J. Phycol. 1982, 18, 79–86. [Google Scholar] [CrossRef]
  40. Berkessa, Y.W.; Mereta, S.T.; Feyisa, F.F. Simultaneous removal of nitrate and phosphate from wastewater using solid waste from factory. Appl. Water Sci. 2019, 9, 28. [Google Scholar] [CrossRef] [Green Version]
  41. Park, M.H.; Park, C.H.; Sim, Y.B.; Hwang, S.J. Response of Scenedesmus quadricauda (Chlorophyceae) to Salt Stress Considering Nutrient Enrichment and Intracellular Proline Accumulation. Int. J. Environ. Res. Public Health 2020, 17, 3624. [Google Scholar] [CrossRef] [PubMed]
  42. Mohapatra, P.K.; Dash, R.C.; Panda, S.S.; Mishra, R.K.; Mohanty, R.C. Effects of nutrients at different salinities on growth of the freshwater green alga Scenedesmus bijugatus in water of Narendra Pond, Puri, Orissa. Int. Rev. Hvdrobiol. 1998, 83, 297–304. [Google Scholar] [CrossRef]
  43. Rai, A.K.; Abraham, G. Relationship of combined nitrogen sources to salt tolerance in freshwater cyanobacterium Anabaena doliolum. J. Appl. Microbiol. 1995, 78, 501–506. [Google Scholar]
  44. Collos, Y.; Vaquer, A.; Souchu, P. Acclimation of nitrate uptake by phytoplankton to high substrate levels. J. Phycol. 2005, 41, 466–478. [Google Scholar] [CrossRef]
  45. Liu, J.; Vyverman, W. Differences in nutrient uptake capacity of the benthic filamentous algae Cladophora sp., Klebsormidium sp. and Pseudanabaena sp. under varying N/P conditions. Bioresour. Technol. 2015, 179, 234–242. [Google Scholar] [CrossRef] [PubMed]
  46. Alketife, A.M.; Judd, S.; Znad, H. Synergistic effects and optimization of nitrogen and phosphorus concentrations on the growth and nutrient uptake of a freshwater Chlorella vulgaris. Environ. Technol. 2017, 38, 94–102. [Google Scholar] [CrossRef] [PubMed]
  47. Arora, N.; Laurens, L.M.L.; Sweeney, N.; Pruthi, V.; Poluri, K.M.; Pienkos, P.T. Elucidating the unique physiological responses of halotolerant Scenedesmus sp. cultivated in sea water for biofuel production. Algal Res. 2019, 37, 260–268. [Google Scholar] [CrossRef]
  48. Lagus, A.; Suomela, J.; Weithoff, G.; Heikkila, K.; Helminen, H.; Sipura, J. Species-specific differences in phytoplankton responses to N and P enrichments and the N:P ratio in the Archipelago Sea, northern Baltic Sea. J. Plankton Res. 2004, 26, 779–798. [Google Scholar] [CrossRef] [Green Version]
  49. Ruzhitskaya, O.; Gogina, E. Methods for Removing of Phosphates from Wastewater. MATEC Web Conf. 2017, 106, 07006. [Google Scholar] [CrossRef]
  50. Kirst, G.O. Salinity tolerance of eukaryotic marine algae. Annu. Rev. Plant Physiol. 1989, 41, 21–53. [Google Scholar] [CrossRef]
  51. Raven, J.A. Chloride: Essential micronutrient and multifunctional beneficial ion. J. Exp. Bot. 2017, 68, 359–367. [Google Scholar] [CrossRef] [PubMed]
  52. Sahle-Demessie, E.; Aly Hassan, A.; El Badawy, A. Bio-desalination of brackish and seawater using halophytic algae. Desalination 2019, 465, 104–113. [Google Scholar] [CrossRef] [PubMed]
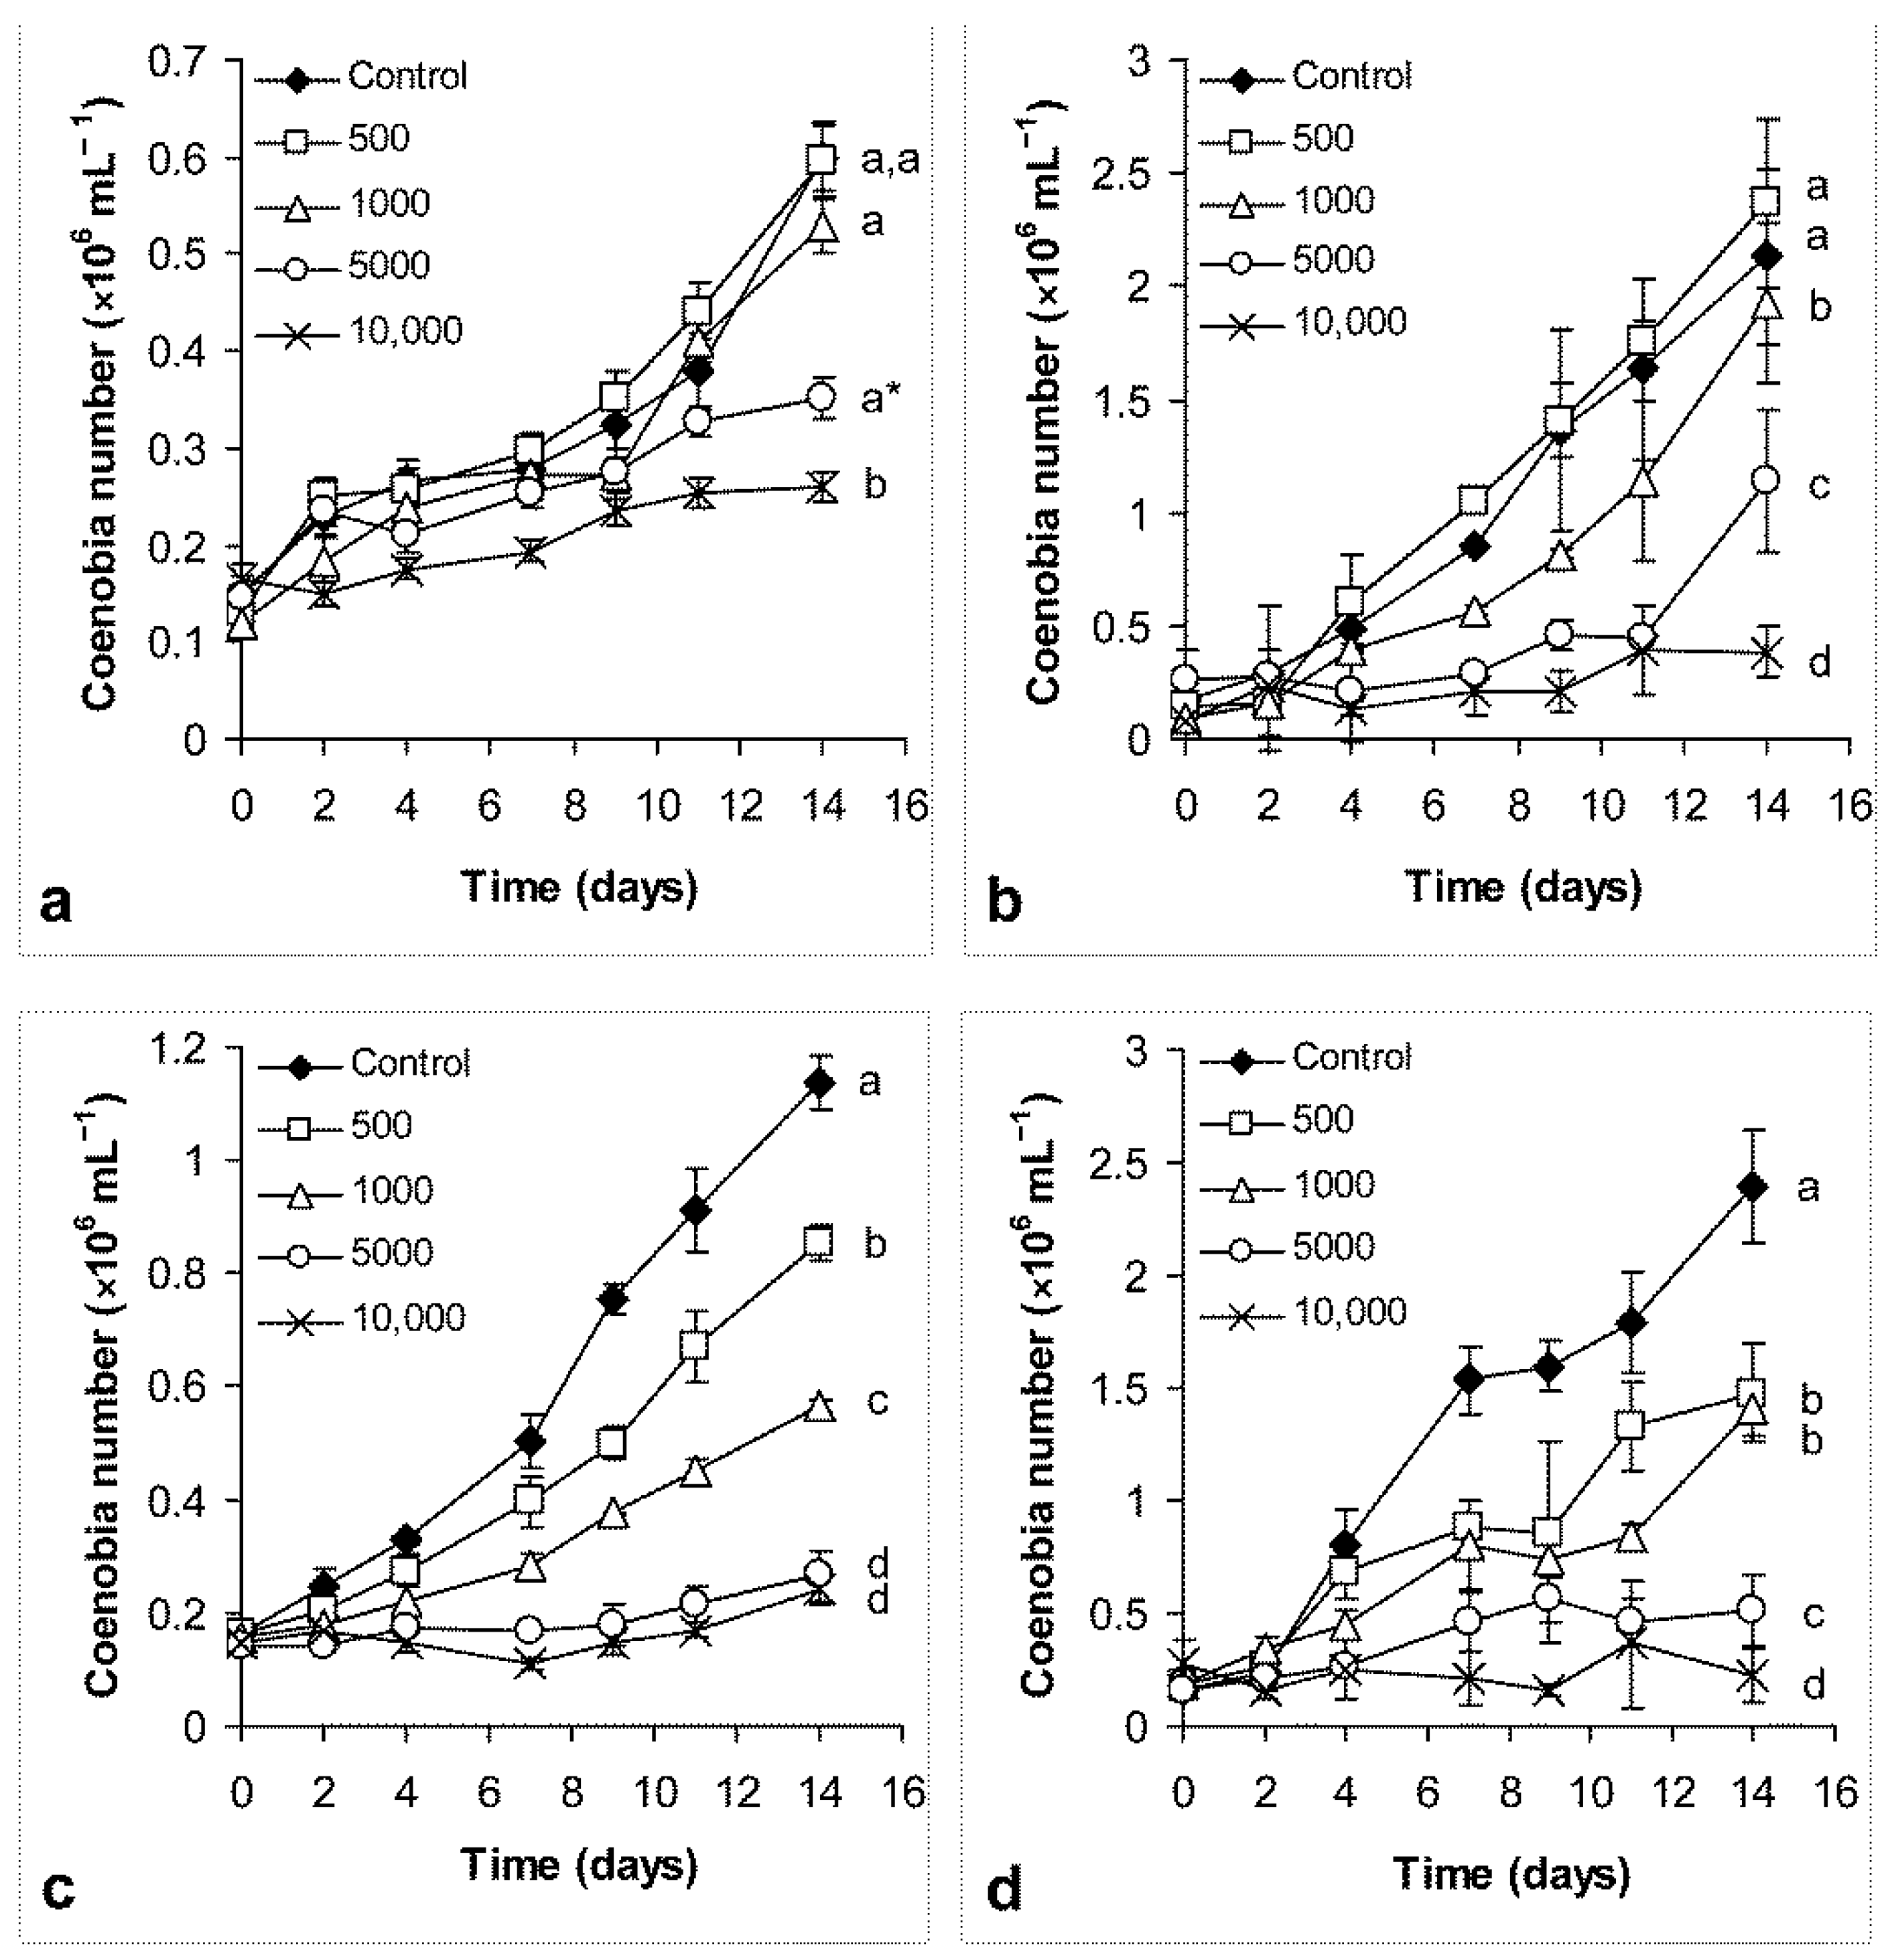
Figure 1. Growth of control and NaCl-treated Coelastrum morus cultures in: (a) HC-LR; (b) HC-HR; (c) LC-HR and (d) LC-LR media based on coenobia numbers. HC: higher content; LC: lower content; HR: higher ratio; LR: lower ratio. Mean values (n = 3) and standard deviations are plotted. 500; 1000; 5000 and 10,000: NaCl concentrations in mg L−1. Significant differences (p < 0.05) among growth curve tendencies are indicated by different lowercase letters. Lowercase letters with asterisks show partial significant difference when it cannot be marked by a different letter.
Energies 14 02112 g001
Figure 2. Nitrate removal (%) of control and NaCl-treated Coelastrum morus cultures in: (a) HC-LR; (b) HC-HR; (c) LC-HR and (d) LC-LR media. HC: higher content; LC: lower content; HR: higher ratio; LR: lower ratio. Mean values (n = 3) and standard deviations are plotted. Significant differences (p < 0.05) are indicated by different lowercase letters. Lowercase letters with asterisks show partial significant difference when it cannot be marked by a different letter.
Energies 14 02112 g002
Figure 3. Phosphate removal (%) of control and NaCl-treated Coelastrum morus cultures in: (a) HC-LR; (b) HC-HR; (c) LC-HR and (d) LC-LR media. HC: higher content; LC: lower content; HR: higher ratio; LR: lower ratio. Mean values (n = 3) and standard deviations are plotted. Significant differences (p < 0.05) are indicated by different lowercase letters. Lowercase letters with asterisks show partial significant difference when it cannot be marked by a different letter.
Energies 14 02112 g003
Figure 4. Conductivity reduction (%) of control and NaCl-treated Coelastrum morus cultures in: (a) HC-LR; (b) HC-HR; (c) LC-HR and (d) LC-LR media. HC: higher content; LC: lower content; HR: higher ratio; LR: lower ratio. Mean values (n = 3) and standard deviations are plotted. Significant differences (p < 0.05) are indicated by different lowercase letters.
Energies 14 02112 g004
Figure 5. Chloride removal (%) of control and NaCl-treated Coelastrum morus cultures in: (a) HC-LR; (b) HC-HR; (c) LC-HR and (d) LC-LR media. HC: higher content; LC: lower content; HR: higher ratio; LR: lower ratio. Mean values (n = 3) and standard deviations are plotted. Significant differences (p < 0.05) are indicated by different lowercase letters.
Energies 14 02112 g005aEnergies 14 02112 g005b
Table 1. Nitrogen and phosphorous contents and N:P ratios of the applied culturing media.
MediumNitrogenPhosphorousN:P Ratio (Molar)
mg L−1mmolmg L−1mmol
HC-LR (BBM)41.062.93531.71.7
HC-HR (modified BBM)41.062.9315.50.55.8
LC-HR (JM)15.641.15.940.195.8
LC-LR (modified JM)15.641.119.70.6351.7
HC: higher content; LC: lower content; HR: higher ratio; LR: lower ratio; BBM: Bold’s basal medium (CCAP Media Recipes a); JM: Jaworski’s Medium (CCAP Media Recipes b).
Table 2. Salt treatment of Coelastrum morus cultured in media with different nutrient content and N:P ratios.
NaCl TreatmentMedium
(mL)
Alga Inoculum
(mL)
dH2O
(μL)
300 g L−1 NaCl
Stock Solution (μL)
Control41.7533000
500 mg L−141.75321585
1000 mg L−141.753135165
5000 mg L−141.752475825
10,000 mg L−141.7516501650
Table 3. NaCl concentrations causing 50% growth inhibition in media with different nutrient concentrations and N:P ratios.
MediumEC50 (mg L−1 NaCl)
Day 4Day 7Day 14
HC-LRn.c.n.c.6720
HC-HR387027905430
LC-HR530029701000
LC-LR201016201860
HC: higher content; LC: lower content; HR: higher ratio; LR: lower ratio; n.c.: not calculable.
Publisher’s Note: MDPI stays neutral with regard to jurisdictional claims in published maps and institutional affiliations.