1. Introduction
Flexible wearable electronic devices have been widely studied due to their excellent sensitivity, ductility, durability, and compatibility with human skin. In particular, self-powered, intelligent wearable devices can effectively convert the mechanical energy generated by various mechanical actions into electric energy, thus solving the disadvantage of the inconvenient power supply of wearable electronic devices [
1,
2,
3,
4,
5,
6,
7]. As a self-powered sensing system, a piezoelectric sensor has great application potential in the field of wearable sensing. In the era of intelligent sensing, the demand for self-powered pressure and bending sensing systems is increasing. Currently, pressure and bending angle sensors mainly work through force change signals. However, the piezoelectric sensor made of piezoelectric ceramics is faced with the problem of bending detection. There have been recent studies on two-dimensional monolayer transition-metal dichalcogenide (TMDC) for its development for lightweight, high-performance, multifunctional applications that do not exist in bulk [
8,
9,
10]. In particular, TMDC materials (such as MoS
2, MoSe
2, WS
2, and WSe
2) with non-center-symmetric structures have great potential for nanoscale electromechanical systems and electronic device applications [
11,
12]. Piezoelectric and ferroelectric TMDC materials have been increasing in number in recent years. The piezoelectric responses of TMDC materials are subjected to external forces due to the disturbance of their reversed symmetry [
13]. The piezoelectric properties of TMDC materials are strong in a single-layer structure, but when there are more than two layers, the piezoelectric effects decrease significantly or disappear. Compared with the traditional bulk wurtzite structure, these TMDC materials have a stronger piezoelectric coupling. The piezoelectric energy harvesting of TMDC materials is accordingly becoming greater in order to effectively power various nanosystems [
14,
15]. Kim et al. reported an MoS
2 nanogenerator with a generated voltage and output performance of 20 mV and 30 pA, respectively, as well as a bending strain of 0.48% at a frequency of 0.5 Hz [
16]. Han et al. reported an S-treated monolayer MoS
2 nanosheet with the output peak current and voltage of 100 pA and 22 mV, respectively [
17]. Lee, J.H. et al. reported a monolayer WSe
2 piezoelectric nanogenerator that generated a peak output voltage of 45 mV under a strain of 0.39%. A WSe
2 bilayer exhibited a good mechanical stability at a strain of up to 0.95%, and it generated an output voltage of 85 mV [
18]. E. Nasr Esfahani et al. reported the effective piezoelectric coefficient of WSe
2 to be 5.2 pm/V [
19]. Until now, there has been no energy harvesting research using monolayer WS
2; therefore, a study on a flexible WS
2 piezoelectric generator (FWPG) that could be applied in real life using electrical energy generated by human motion was needed.
In this paper, the piezoelectric energy harvesting characteristics of an FWPG were realized by using WS2. To achieve self-generation, the experiment was evaluated by a push test that applied constant mechanical compressive stress to the FWPG. Under a compression strain of 0.2% (mass: 13 kg), a high output voltage of 2.26 V and an energy of 55.45 μJ were successfully obtained. In the case of the mechanical deformation generated by the runner’s movement as the energy source, the electrical signal repeatedly produced an average voltage of 7.74 V (knee), 8.7 V (sole), and 4.58 V (elbow).
The paper is organized as follows: The experimental section provides the information of experimental materials, experimental equipment, and the sample preparation process. The corresponding simulation results are provided in the Numerical Section. The Results and Discussion sections describe the measurement process and the results of the whole system.
2. Experimental Section
Characterization of WS2: Focused ion beam-field emission scanning electron microscope (FIB-FESEM, Scios, FEI) imaging and EDS (OCTANE PLUS) mapping analysis were performed. Using XPS (K-Alpha+, Thermo Fisher Scientific (Waltham, MA, USA) Messtechnik, GmbH), the crystalline phase and orientation were analyzed using high-resolution XRD (HR-XRD, ATX-G, Rigaku Co., Tokyo, Japan), TEM (JEM 2100F, JEOL), and EDS (OCTANE PLUS).
Fabrication of the FWPG: Monolayer tungsten disulfide powder (WS2; monolayer ratio ≥ 90%; diameter: 20–500 nm; thickness: 1 nm) was purchased from ACS MATERIAL, LLC (Pasadena, CA, USA). Varying amounts of monolayer WS2 powder (0, 1, 2, and 3 wt%) were added to a mixture solution of epoxy (KUKDO CHEMICAL, Seoul, Korea, YD-128) and hardener (KUKDO, Seoul, Korea, KH-818B), which was then stirred for 15 min at room temperature. Then, it was placed in a circular 46 mm-diameter container. This was placed in an airtight container and dried at room temperature for 24 h. After drying, we cut out samples (24 × 24 × 0.65 mm3). Finally, the FWPG was poled by applying an electric field of 0.6 kV/mm for 90 min.
Measurement of the energy harvesting property: The FWPG was characterized using a digital oscilloscope (Tektronix DPO4054B). The FWPG was driven by a push tester (JIPT-120-1004, Junil Tech), and it provided periodic electrical output signal through a steel rod. The power generation characteristics of the FWPG under different weights were measured with this equipment, and the devices measured the average voltage generated at the knee, on the sole of the foot, and at the elbow under the condition of human movement.
4. Results and Discussion
The monolayer WS
2 was used in the flexible piezoelectric sensor (FPS) as an active piezoelectric material. An HR-TEM image of the monolayer WS
2 is shown in
Figure 1a. The monolayer WS
2 material had a width of 475 nm and a length of 325 nm. The crystalline structure and phase composition of the sample were confirmed by XRD. A typical XRD pattern of monolayer WS
2 is shown in
Figure 1b. All peaks were consistent with the standard JCPDS card number (08-0237) and were perfectly consistent with hexagonal WS
2 with a cell constant of a = 3.154 A and c = 12.362 A. No other impurity phase peaks were detected from this pattern. We analyzed the WS
2 atomic species and their binding characteristics using high resolution XPS measurements, as indicated in
Figure 1c. The O1s peak was made up of several components. A component with a binding energy of 530.6 eV was assigned to an oxygen atom in a strong W=O bond [
20]. The constituents of 531.4 eV were attributed to the C–O bonds of 532.2 eV, whereas the OH group was possibly due to the bonds of C=O groups [
21,
22]. The C1s spectrum showed a peak centered at 284.56 eV. The S
2p spectrum showed two peaks at 161.86 and 163.35 eV (S
2p
1/2 and S
2p
3/2). The W
4f core level spectrum showed four strong peaks at 32, 34, 35.7, and 37.88 eV, which were identified as W
4f
7/2 (metal), W
4f
5/2 (metal), W
4f
7/2 (WO
2), and W
4f
5/2 (WO
2) respectively. The EDS spectra are shown in
Figure 1e and indicate that the sample consisted of elemental W and S, as in the mapping measurements in
Figure 1d, and no other materials were observed. Furthermore, the quantification of the peaks showed an atomic ratio (W to S) of about 37.99 to 62.04, respectively.
Table 1 summarizes the piezoelectric properties for a typical piezoelectric 2D material reported in the literature. In general, the characteristic of non-centrosymmetry was sufficient to indicate piezoelectric materials. Various 2D materials are theoretically predicted to be piezoelectric, but most of them still have to be further investigated or confirmed through experimentation.
The piezoelectric coefficient
was converted to
through the elastic modulus
according to the following relation [
24,
25].
where
P is the polarization, σ is the stress, and
ε is the strain. Though the piezoelectric coefficient
is more appropriate for evaluating energy harvesting efficiency, the linear piezoelectric effect in a flat and 2D material can be viewed as a first-order coupling.
The elastic modulus tensor
was calculated using density functional perturbation theory, which is defined as the energetic response with respect to the strain perturbation including ionic relaxation [
26]. Here,
was directly calculated using the following relation:
where
is the strain and
is the ground state energy of the strained unit cell with
k,
j ∈ {1, 2}.
All in-plane elastic and piezoelectric properties of monolayers are fully determined by only three coefficients because
and
are related as follows:
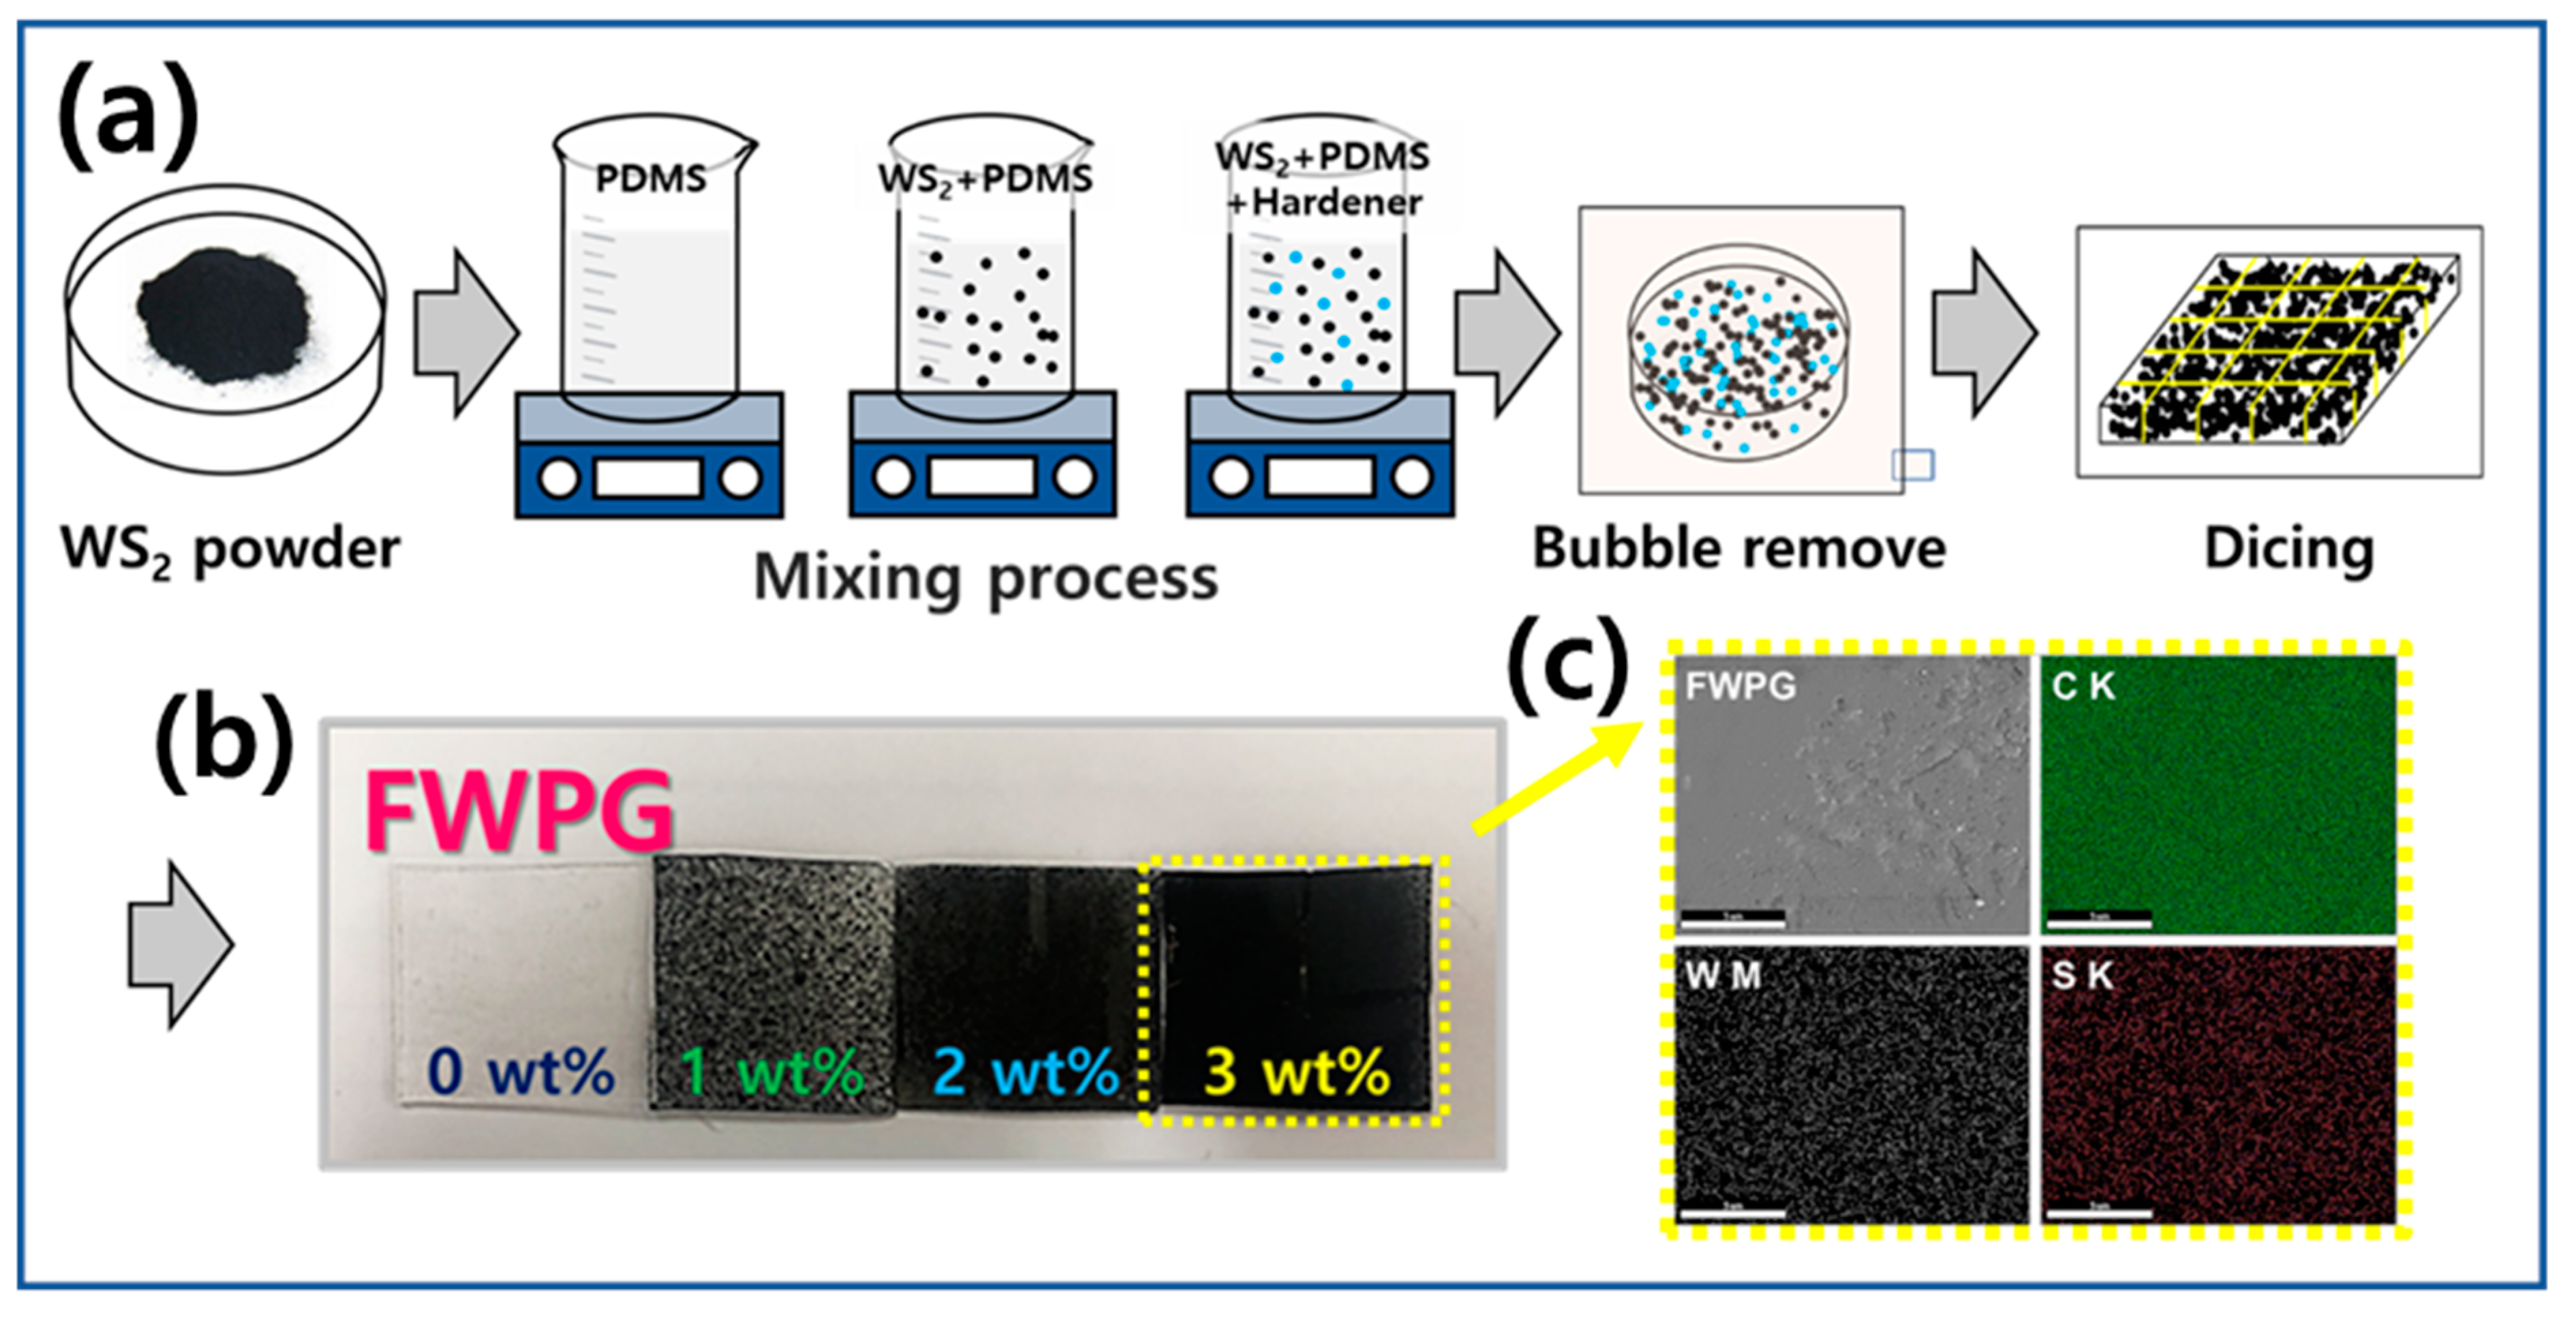
The fabrication process of a WS
2 flexible sensor is shown in
Figure 2. After mixing the WS
2 powder in PDMS, bubbles were removed in a vacuum condition. A hardener powder was adjusted to produce an FWPG with the desired conditions (see
Figure 2a). To observe the energy harvesting characteristics of the FWPG, samples (24 × 24 × 0.65 mm
3) were fabricated by mixing a polymer with various proportions of WS
2 (wt%), as indicated in
Figure 2b. The surface analysis for the EDS mapping of the FWPG with a WS
2 content of 3 wt% did not analyze other components except for the elements C, W, and S (see
Figure 2c).
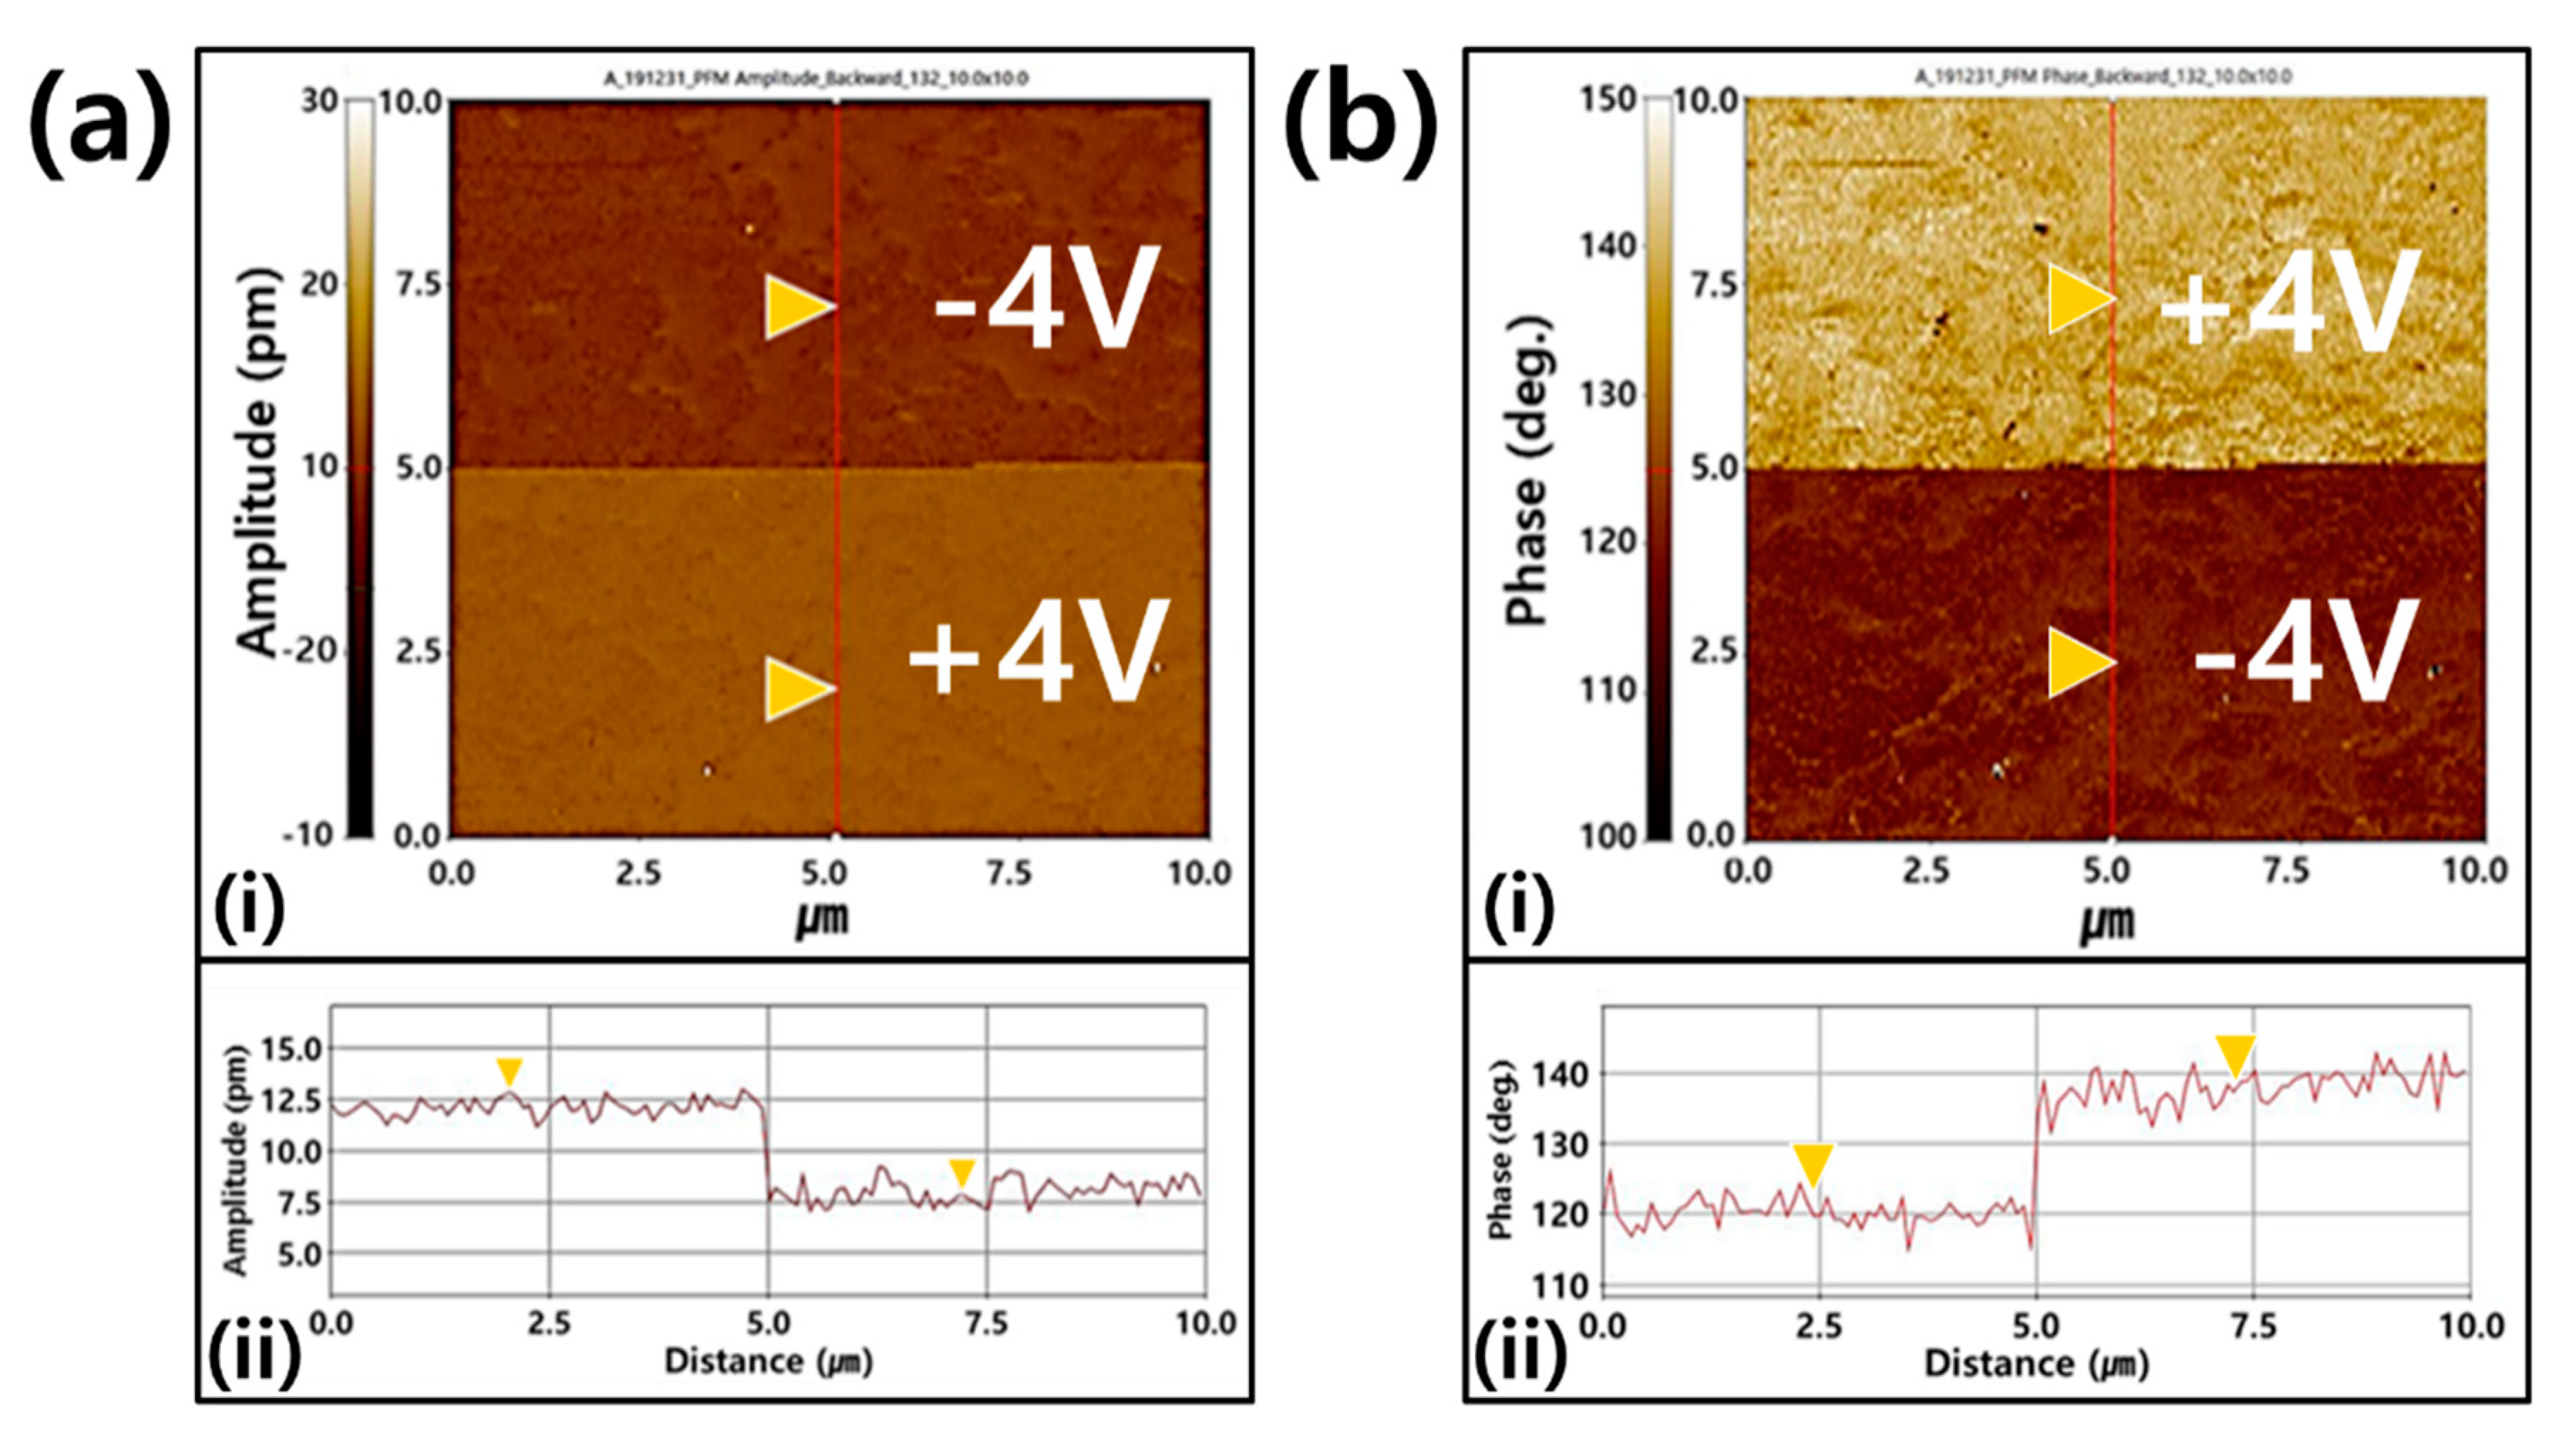
To show the polarization process, the FWPG was first polarized through an external high-voltage scanning electric field (see
Figure 3ai,bi). Then, the amplitude and the phase measurements were performed immediately after the polarization. The clear contrasts demonstrated the complete polarization reversal upon the electrical polarization process (see
Figure 3aii,bii). The polarization retention performance was also good.
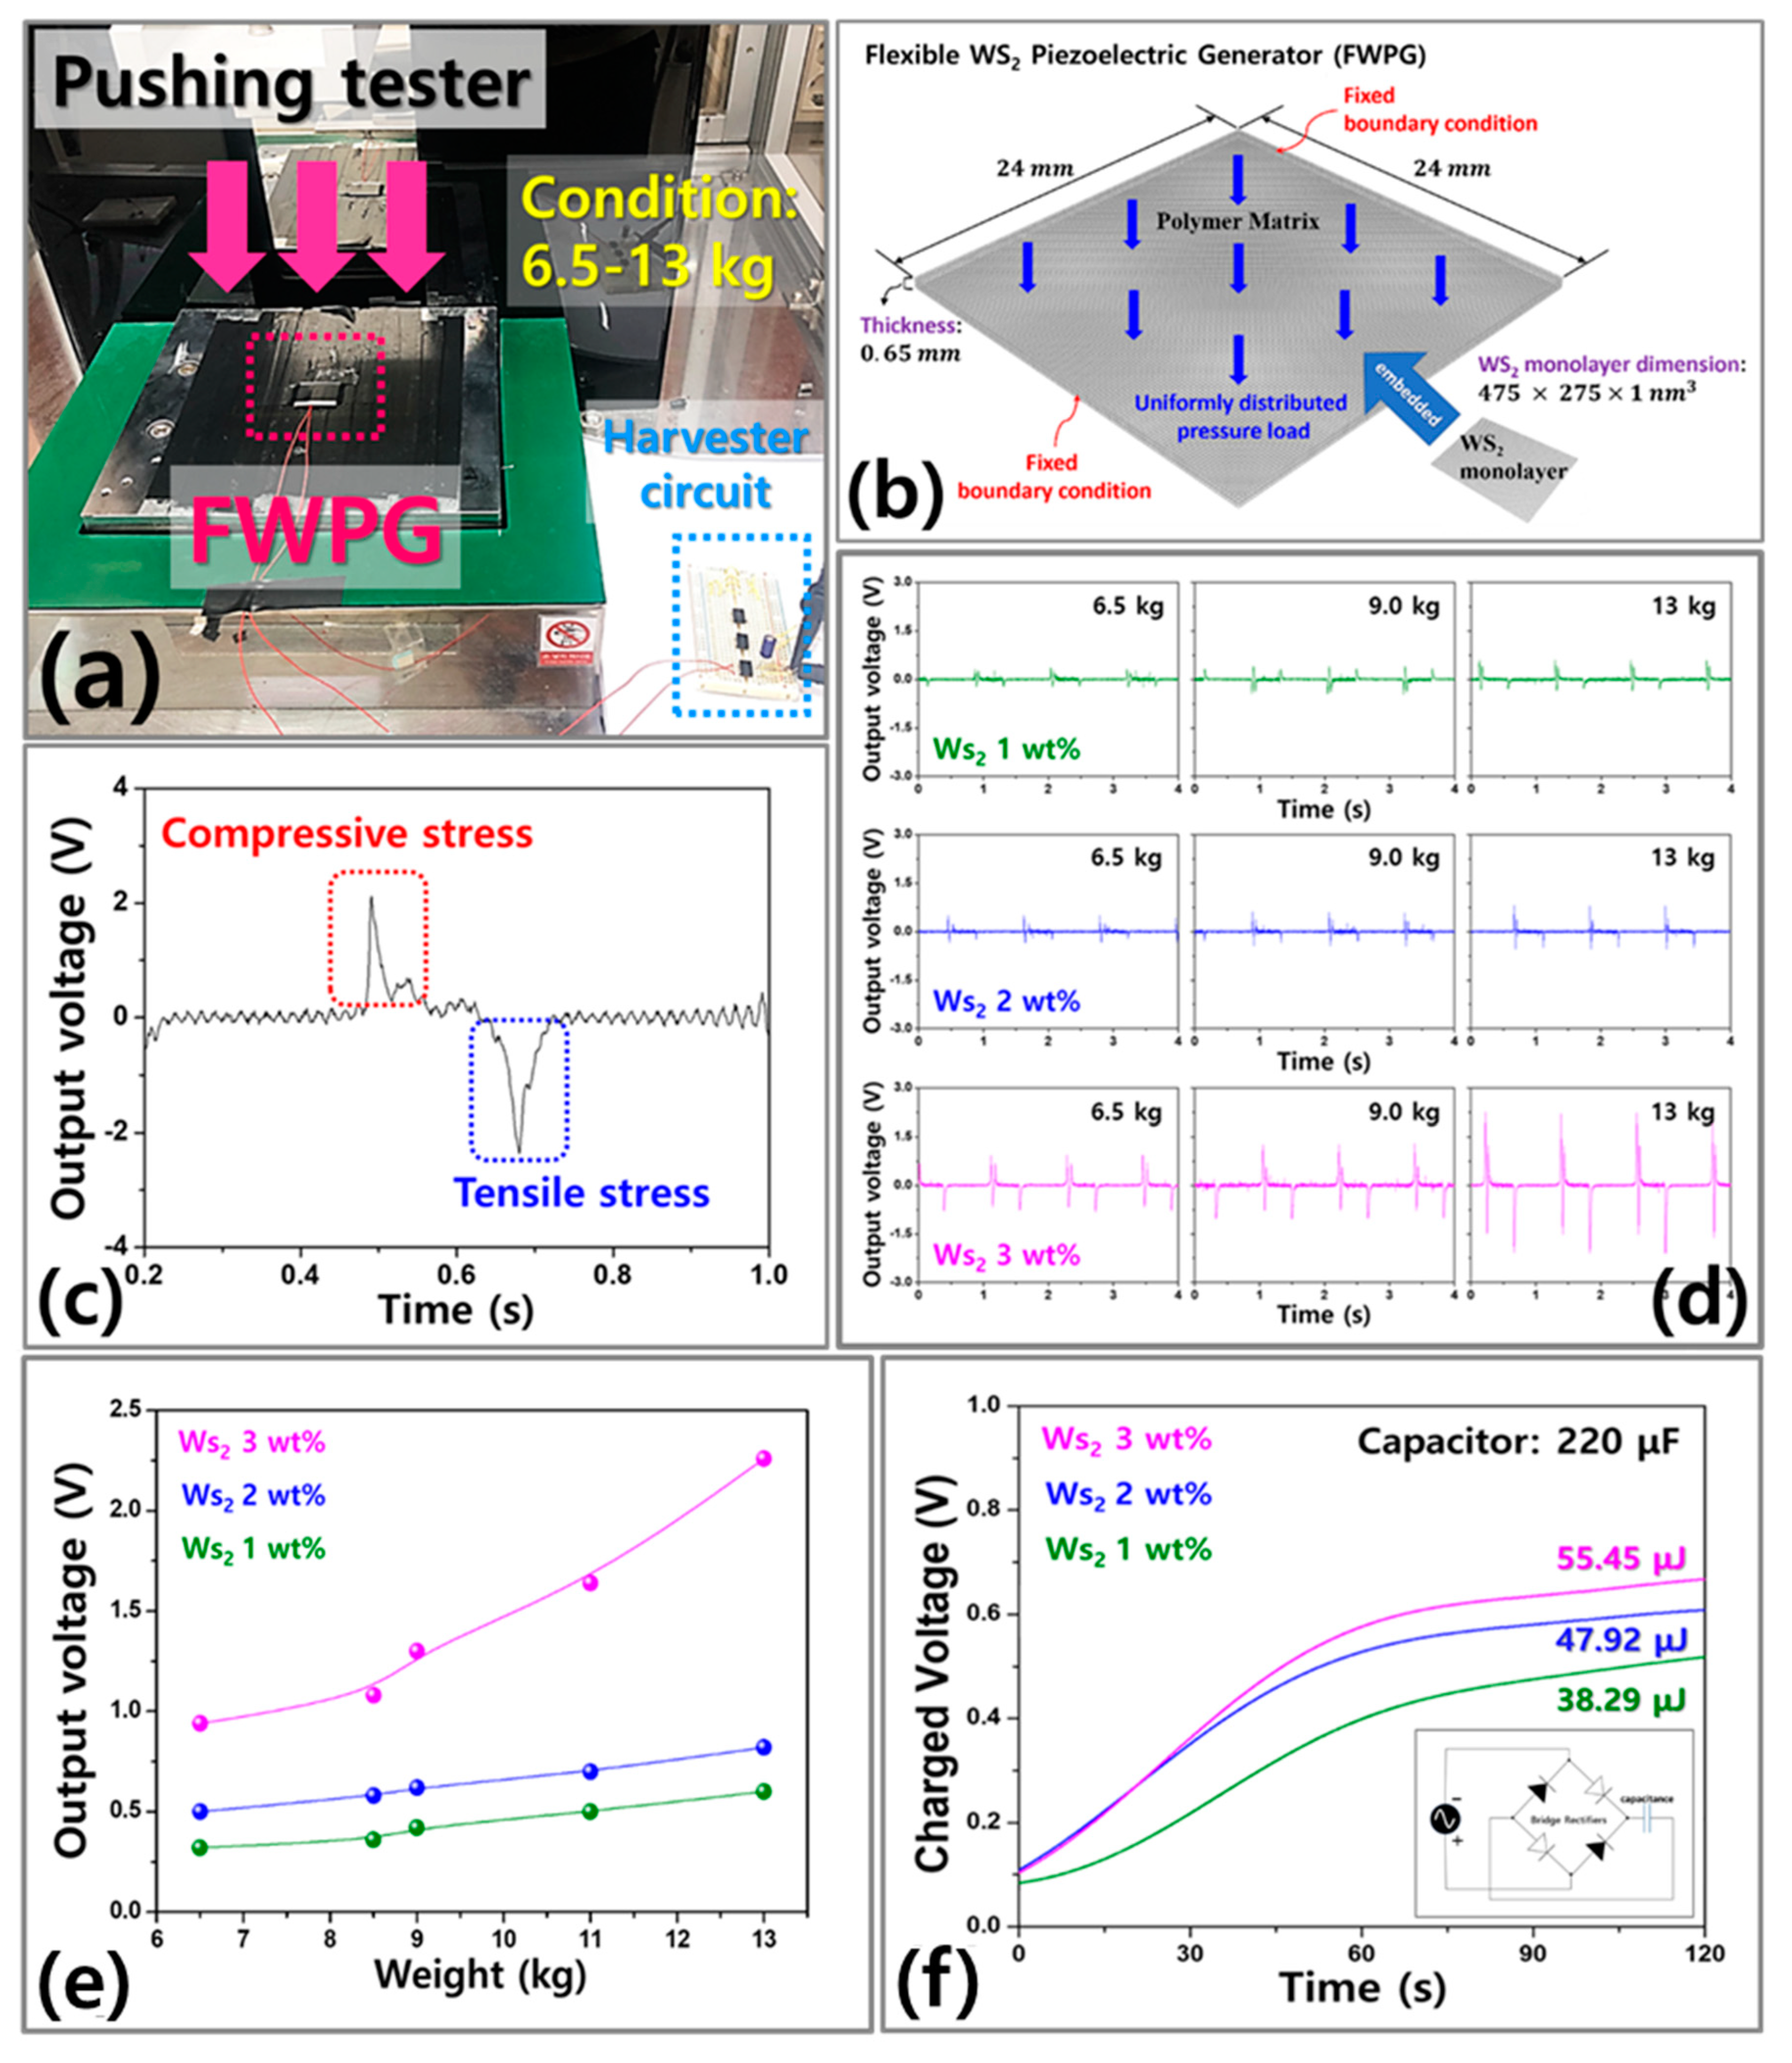
The performance of the FWPG was tested using a periodical push tester that used mechanical energy to apply a deformation and generate an electrical signal that was measured with an oscilloscope. A photograph of FWPGs with various proportions of WS
2 (0, 1, 2, and 3 wt%) is shown in
Figure 4a. The devices used in the experiment were 24 × 24 × 0.65 mm
3, and the WS
2 monolayer dimension was 475 × 325 × 1 nm
3 (see
Figure 4b).
Figure 4c shows that the FWPG in the experimental setup was deformed due to pressing of the pushing tester under various pressing conditions (6.5–13 kg). When pressing was applied, tensile stress occurred and the density of the minus charge increased on the upper surface. When compressive stress occurred due to the restoring force, the density of the plus charge increased and AC voltage was generated.
Devices were measured under various periodical pressing conditions. To analyze the difference of output characteristics, we tested those samples using pressing conditions under varying mass (6.5, 9.0, and 13 kg). The power generation results of the FWPG with 1 wt% WS
2 were an output voltage of 0.32 V
max under periodical pressing by 6.5 kg and an output voltage of 0.6 V
max under pressing by 13 kg. The electric power generation results of the device with a WS
2 proportion of 3 wt% were an output voltage of 0.94 V
max under periodical pressing by 6.5 kg and an output voltage of 2.26 V
max under periodical pressing by 13 kg. The output voltage increased as the mass applied to the device increased. The value increased 1.87 times as the mass increased from 6.5 to 13 kg for the device with 1 wt% WS
2. For the device with 3 wt% WS
2, the output voltage increased 2.4 times as the mass increased from 6.5 to 13 kg. The samples were tested to analyze the differences in output characteristics with various increases of WS
2. Under the same pressing mass of 6.5 kg, the output performance of the FWPGs with 1 wt% WS
2 was 0.32 V
max, and with 3 wt% WS
2, it was 0.94 V
max. Under the pressing mass of 13 kg, the output voltage of the device with 1 wt% WS
2 was 0.6 V
max, and with 3 wt% WS
2, it was 2.26 V
max. As the amount of WS
2 added to the device increased from 1 to 3 wt%, the output voltage increased by 2.93 times at 6.5 kg of crimping mass and 3.7 times when the crimping mass was 13 kg, as shown in
Figure 4d,e. The experimental results showed that increasing the amount of WS
2 improved the output more than increasing the pressing mass applied to the device. To investigate the charging performance of the FWPG with various proportions of WS
2, as shown in
Figure 4f, a bridge circuit and a capacitor with 220 μF of capacity were connected to drive the device (see inset photo). When 13 kg of mechanical energy was applied to the device, the generated energy increased with the amount of WS
2 added. The sample with a 3 wt% WS
2 addition was 55.45 μJ at 60 s (see
Table 2) and an energy conversion efficiency (
) of 0.02%, as shown in
File S1 (see Support Information).
Figure 5 shows the energy conversion mechanism of stress of the FWPG. In their original state, each of the piezoelectric domains in the nanomaterial, including the electric dipole, was randomly oriented. During the next polling process, the polarization direction of each domain was aligned along the direction of the electric field as it moved through the domain walls. Some domains were parallel to the direction of the electric field, but some domains were tilted when the external bias was removed, resulting in strong residual polarization. Therefore, both the surface of the upper electrode and the surface of the lower electrode could capture a certain amount of combined charges with opposite symbols to block the embedded piezoelectric field. Under normal conditions, no piezoelectric potential is generated because the electric dipole is zero. However, when vertical compression stress is applied to an FWPG, the dipoles within the domain will be more firmly aligned in a single direction due to the stress-induced polling effect, which is thought to be strengthened by an increase in applied stress. The result is an immediate piezoelectric potential between the upper and lower electrodes. Therefore, the output in
Figure 5b was closely related to the applied force (kg). This allowed the magnitude of the generated piezoelectric potential to remain constant under a given stress, which proves the reality of power generation and makes the FWPG promising in pressure sensor applications. In addition, the electron flow will be driven to correspond to the piezoelectric potential variation along the stress direction. When the external compressive stress is released, the piezoelectric potential disappears and the accumulated electrons on the bottom electrode are immediately returned in the opposite direction. Therefore, output voltage can be generated by repeated vertical compression and decompression.
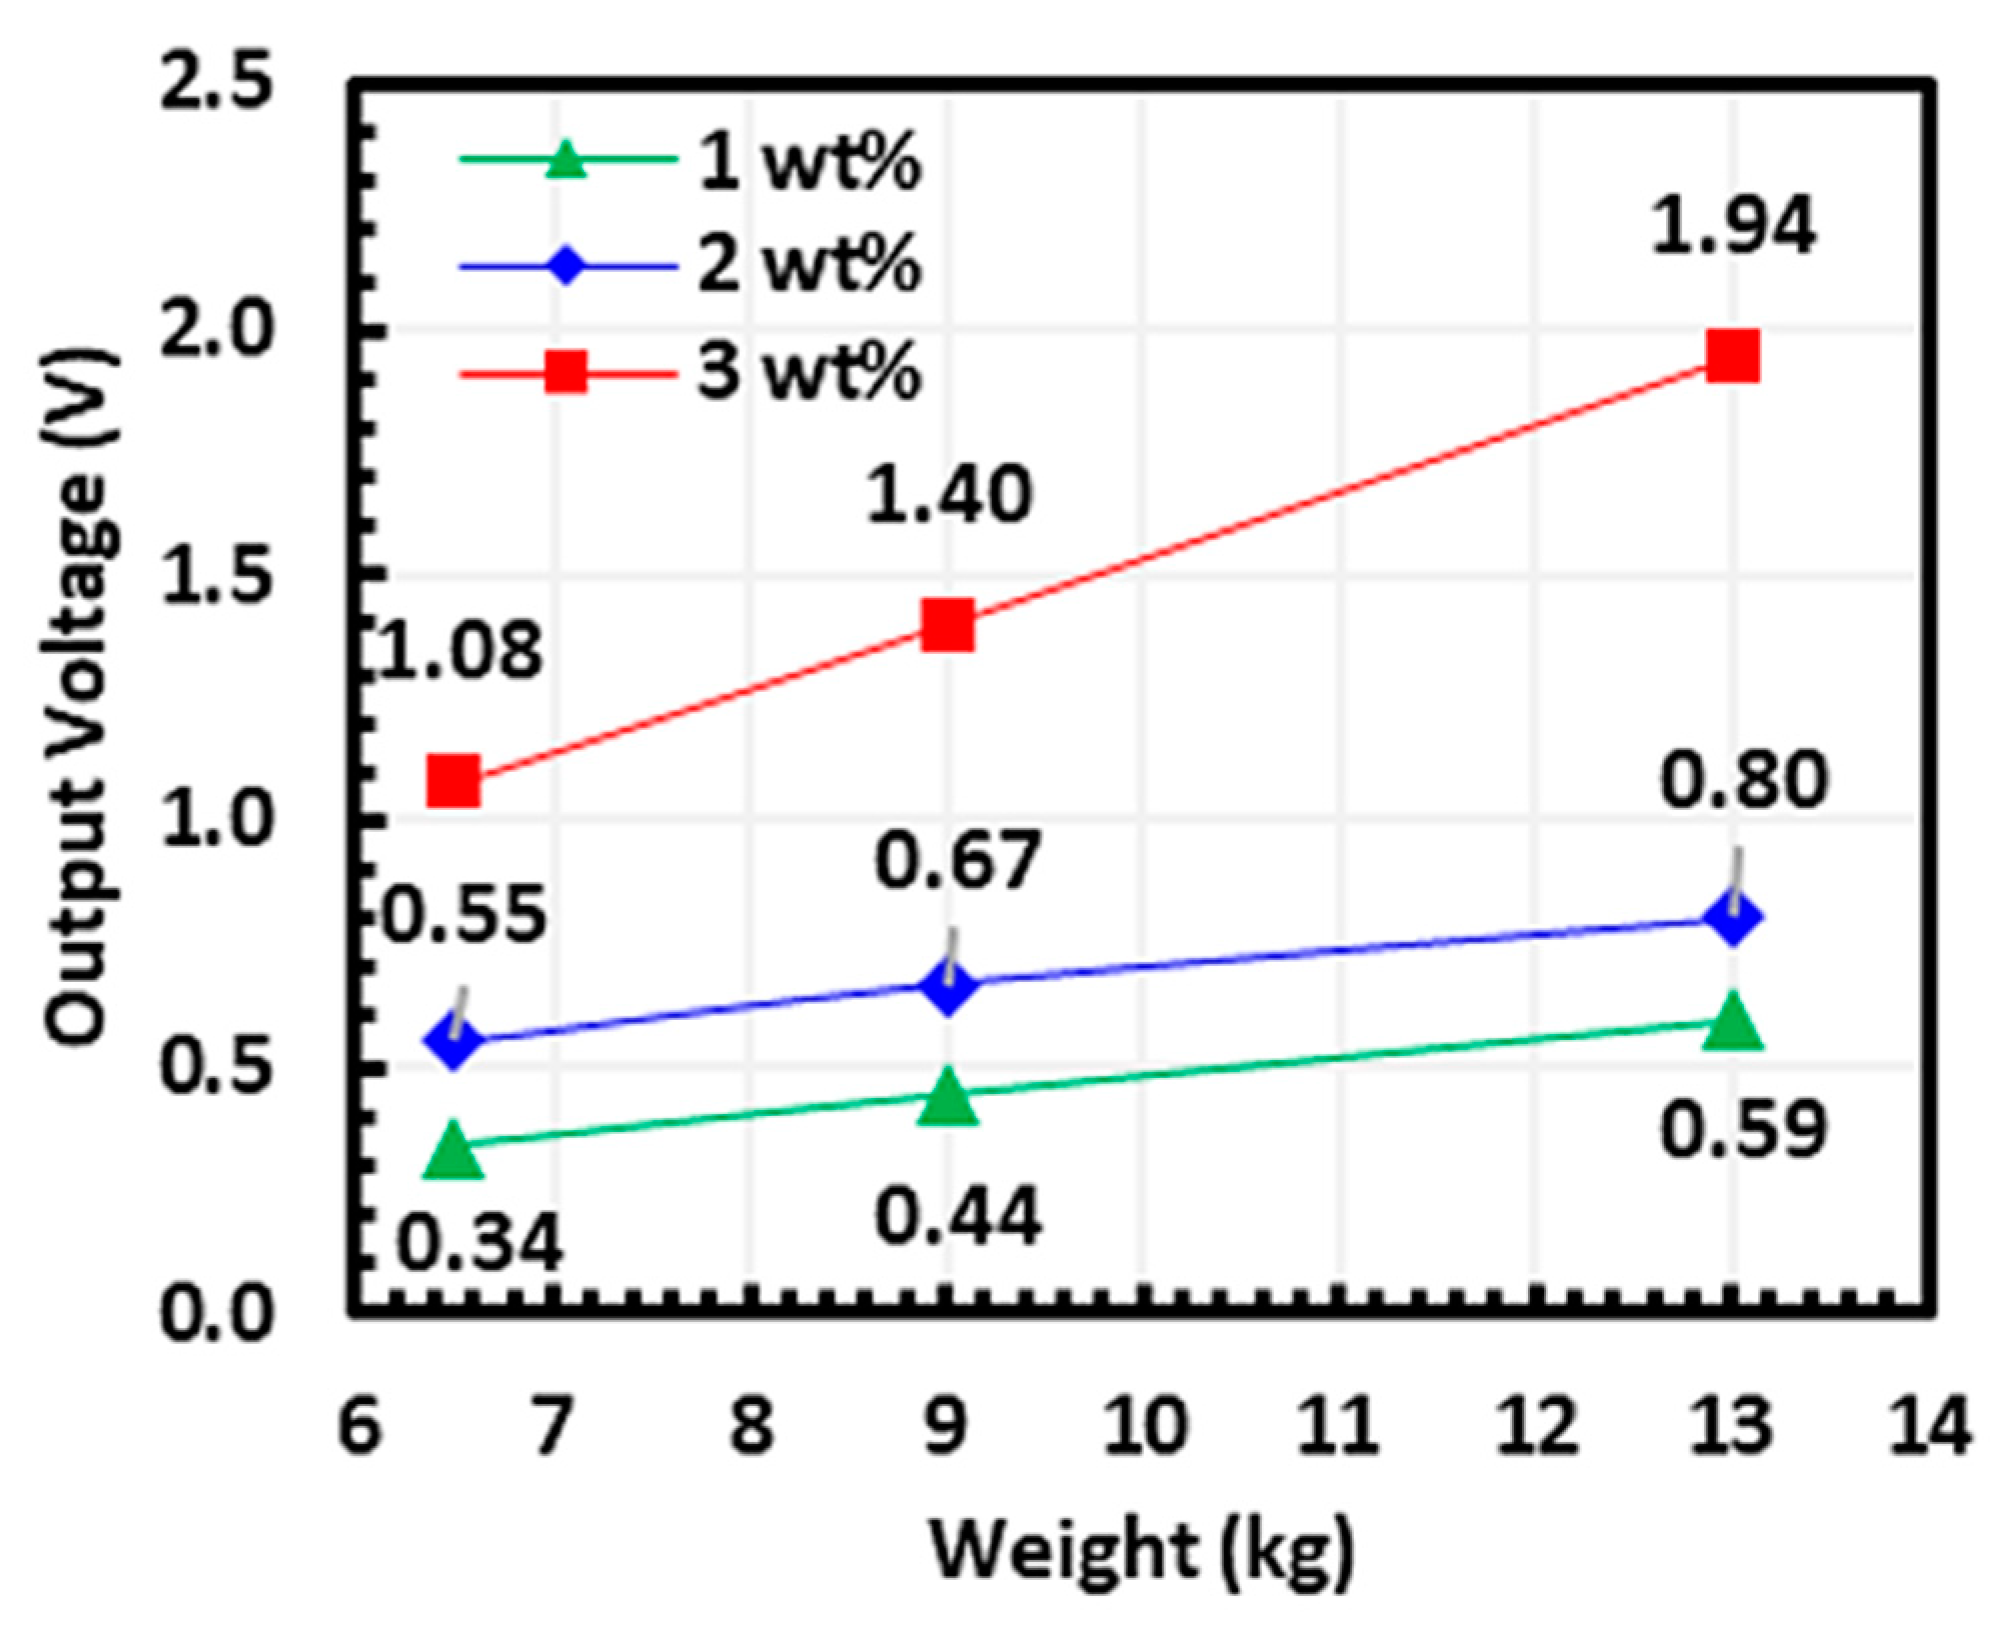
Figure 6 shows the finite element results that correspond to the experimental measurements in
Figure 4. The output voltages of the FWPG according to the amount of WS
2 and pressing weight are plotted in
Figure 6 and summarized in
Figure 7. From the numerical simulations, it was confirmed that the output voltage increased as the amount of WS
2 added to the device increased from 1 to 3 wt%, which was in line with the experimental observations. Finite element simulations were further used to estimate compressive strains. With the three applied masses (6.5, 9, and 13 kg), compressive strains of 0.0998%, 0.149%, and 0.201%, respectively, were computed. These obtained values were reasonable since a compressive strain of 0.2% was obtained through experiments when 13 kg of mass was applied to the harvester.
By applying the FWPG with 3 wt% WS
2 in a wearable energy harvesting device, electricity can be continuously generated by utilizing human movements (angle change according to walking and running, as shown in
Table 3). The generation mechanism is the force applied to the device so that tensile stress is applied to the active layer, which generates a positive piezoelectric potential between the upper electrode and the lower electrode by its deformation. Therefore, a piezoelectric output signal is obtained within the tensile and compressive stress cycles. As can be seen in
Figure 8,
Figure 9,
Figure 10 and
Figure 11, electricity can be generated from human movements (at the elbow, knee, and sole) when walking and running.
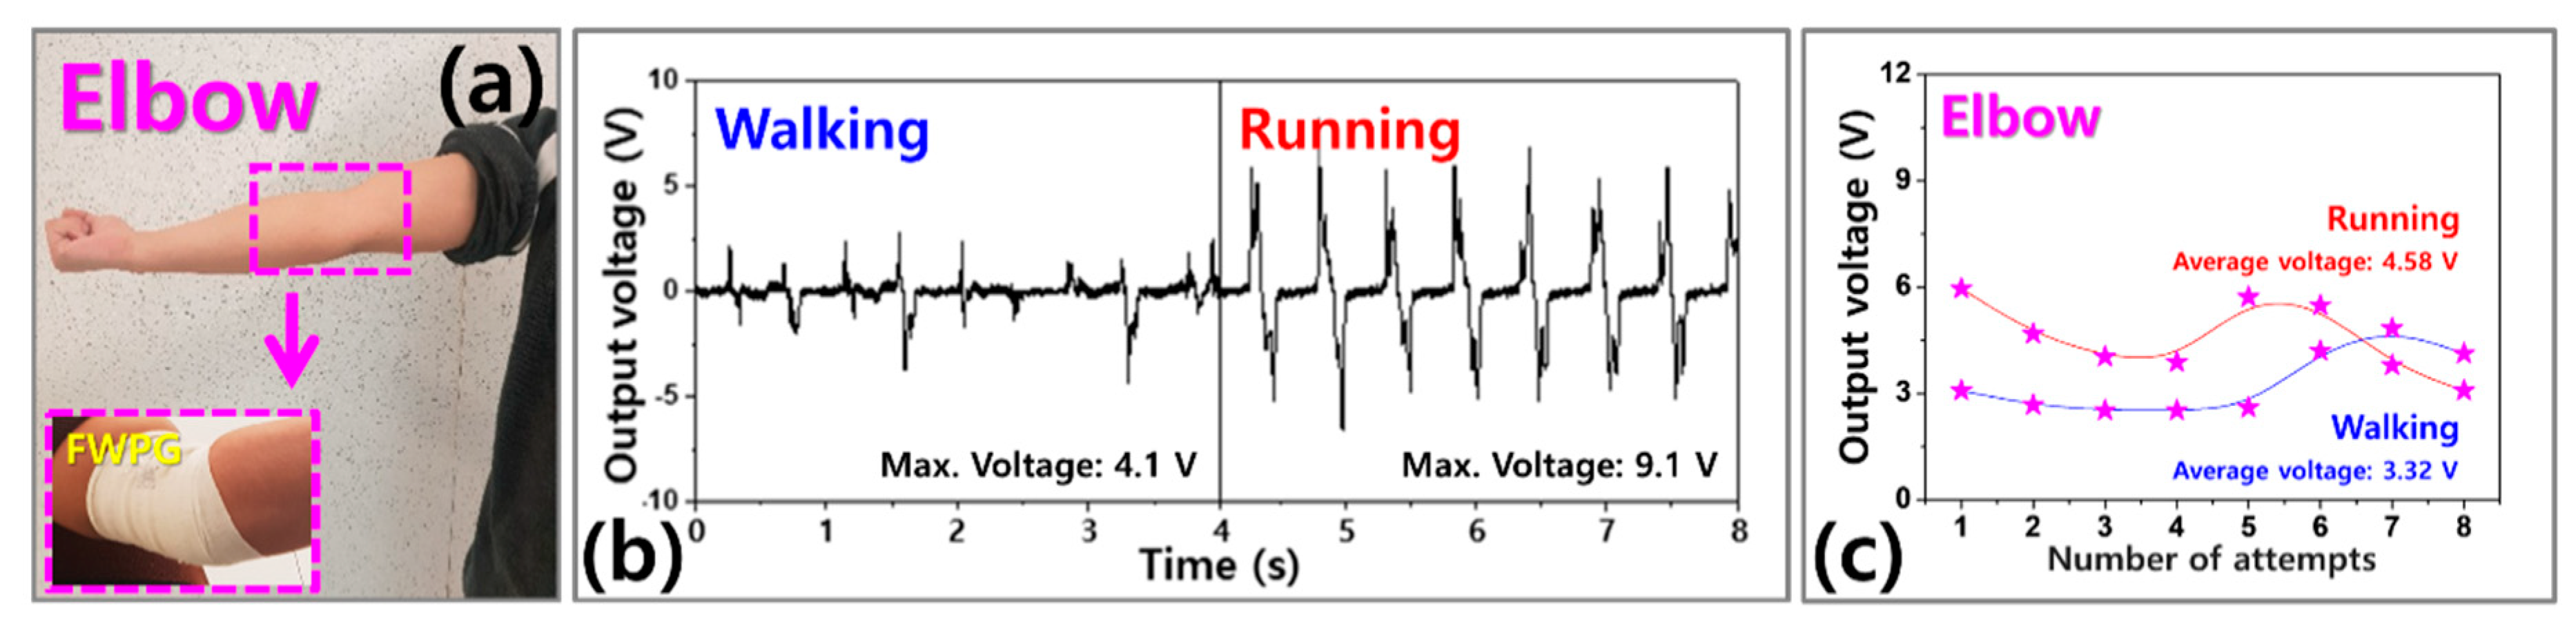
Figure 8a shows photograph of the device fixed to elbow for application to a smart sensor. The voltages generated by the device fixed to the elbow were found to be 4.1 V (walking) and 9.1 V (running), as shown in
Figure 8b. Considering the results from repeated experiments, the average voltages were 4.58 V (walking), and 7.74 V (running), as indicated in
Figure 8c.
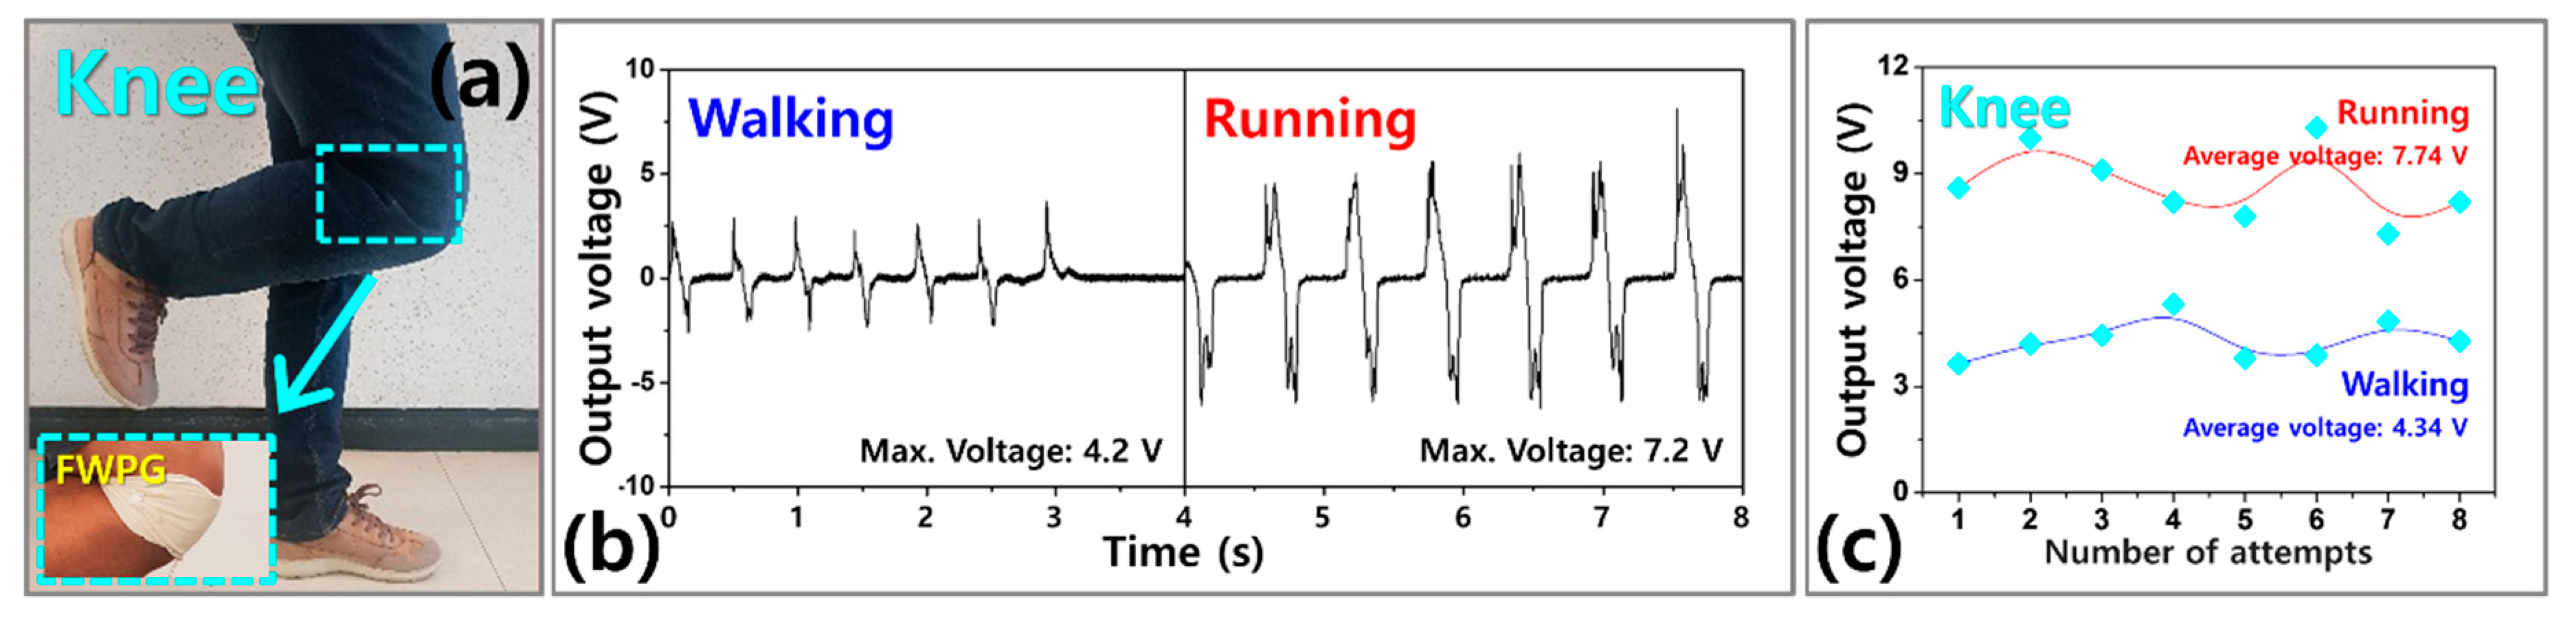
Figure 9a shows picture of the FWPG fixed to knee for application to a smart sensor. The output voltages were 4.2 V (walking) and 7.2 V (running), as shown in
Figure 9b. Considering the results from repeated experiments, the average voltages of the device were 4.34 V (walking), and 7.74 V (running), as indicated in
Figure 9c.
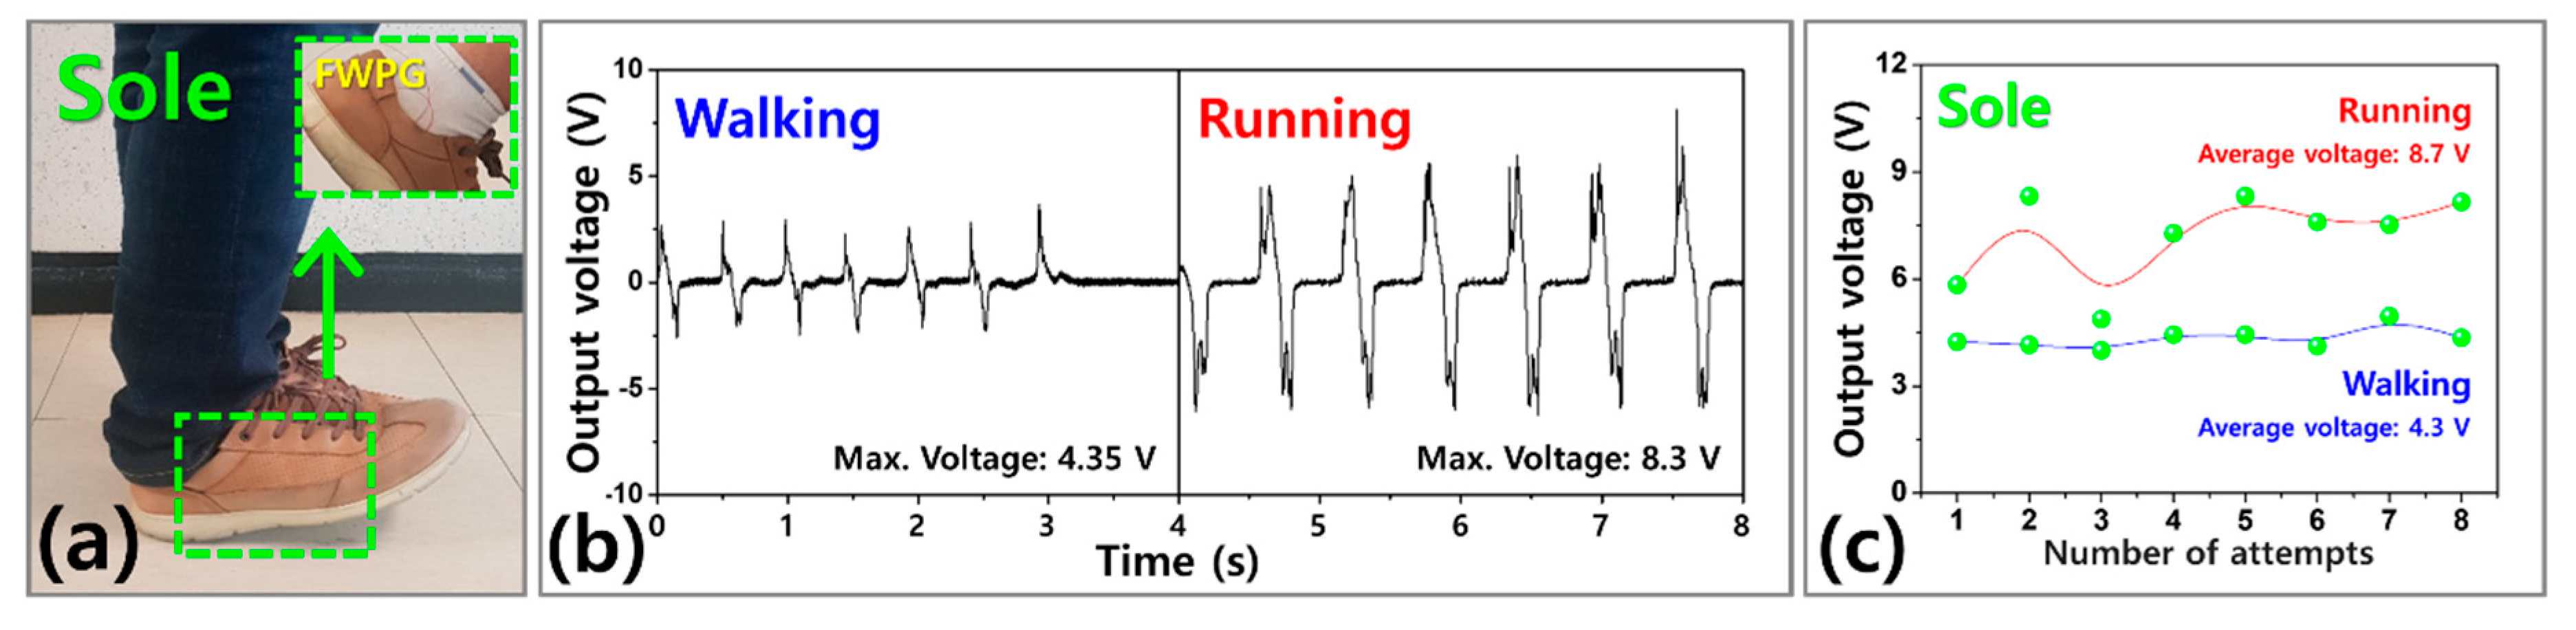
A photograph of the device fixed to the sole for application to a smart sensor is shown in
Figure 10a. The maximum voltages were 4.35 V (walking) and 8.3 V (running) (see
Figure 10b). Considering the results from repeated experiments, the average voltages of the device were 4.3 V (walking), and 8.7 V (running), as indicated in
Figure 10c. The output voltage generated after fixing the FWPG to the sole was measured seven times in total. The output voltages from the knee and sole were higher than from the elbow: the average voltage from the sole was 1.9 times higher than that from the elbow when running. As a result, a WS
2-based energy harvester could be used to harvest energy from human dynamics without an external energy source.
By applying the FWPG with 3 wt% WS
2 to the wearable energy harvesting device, it was possible to observe different electricity efficiencies depending on the angle by utilizing human movement (following walking and running according to various angle changes, as shown in
Table 4). In the case of the highest electricity efficiency value during human body movement, a high value of 0.57 V/° was measured when walking with a device mounted on the sole, and the lowest electricity efficiency was measured when running while mounted on an elbow. As a result of the experiment, when a high voltage was measured, it was mainly during running, but due to the high angle value, it was found that the electricity efficiency decreased compared to the high kinetic energy.
Our FWPG integrated module could accurately detect human movement (elbows, knees, and shoe soles). The system-level design of the integrated FWPG module includes a sensor module, a signal processing module, a wireless transmission module, and a man-machine interface module, as shown in
Figure 11a,b. The FWPG on the skin converts the electrical signal and then collects and processes it through an analog circuit with an amplifier and a filter module (
Figure 11c). The analog output signal is converted into a digital signal by an analog-to-digital converter. Subsequently, these digital signals are transmitted to the mobile phone through a Bluetooth transceiver. The signal is analyzed and processed on the mobile phone to control an avatar’s hand in a virtual environment. The component recognition module consists of three parts (monitoring elbows, knees and shoe soles), which facilitates multi-channel signal conditioning, acquisition, and wireless transmission. As shown in
Figure 11d, the output voltage reflects the different patterns of different parts of the human body and the movement recognition capabilities of the mobile phone application. In addition, in order to further develop the potential of FWPG-based smart sensors in human–computer interaction, we can put FWPG on humans and use the sensor information obtained from the elbows, knees, and soles to identify and process objects through mobile applications.


