Abstract
Road transportation is one of the largest emitters of greenhouse gas emissions. The EU set the target to reduce overall transport emissions by 60% by 2050 compared to 1990. Electric mobility is considered a proper means to achieve this goal. Battery electric vehicles (BEVs) are a mature technology. The high investment costs, limited driving range and a charging infrastructure that is not extensive yet are currently the main challenges. This work analyses how policies affect the dissemination of BEVs in selected countries with remarkable market shares of BEVs. The core objective is to investigate how policies affect BEV economics compared to conventional car economics. Financial policies and their effects on BEVs for the major markets of China, the USA and Europe were analysed. To do so, the total cost of ownership (TCO) was calculated for each country. The major conclusions were: (i) The investment cost of a car had the most significant impact on the TCO; (ii) Low TCO as an incentive was not enough to ensure successful BEV dissemination; (iii) Non-monetary incentives such as access to certain zones and the usage of bus lanes for BEVs combined with registration taxes, low electricity prices and high fuel prices were very favourable conditions.
1. Introduction
The transport sector causes around 30% of the greenhouse gas (GHG) emissions in the EU; thereof, 72% is road transport. In contrast to other sectors (energy, industry, residential, agriculture, forestry and fishing), traffic emissions have been increasing rapidly since 1990 [1].
Figure 1 shows the development of CO2 emissions in the transport sector (road, railway, aviation, other) for selected EU countries, over the period of 1990–2018, in relation to 1990. In most of the countries, emissions had been continuously increasing until 2007. After a financial crisis, emissions decreased in most of the countries. However, this decrease was followed by an emission-increasing trend starting from about 2013. Significant differences among countries could also be seen due to country-specific circumstances such as gross domestic product (GDP) and national policy framework.
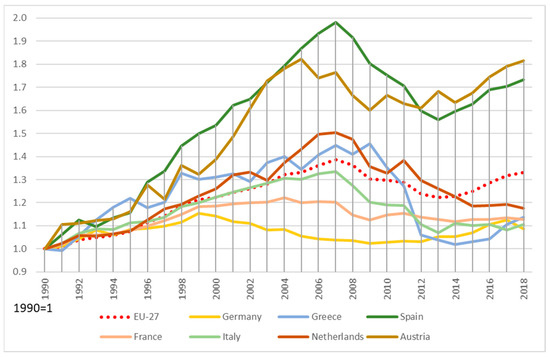
Figure 1.
Development of CO2 emissions from transport in selected EU countries [4].
If the number of conventional vehicles with internal combustion engines (ICEs) could be sharply reduced, the emissions from the transport sector would decrease. In contrast to ICEs, electric vehicles (EVs), especially battery electric vehicles (BEVs) and fuel cell vehicles (FCVs), have zero emissions at the point of use and could significantly contribute to the reduction of GHG emissions in combination with electricity produced from renewable energy sources (RES). In the best case, EVs could cause 75% to 90% lower GHG emissions than ICEs [2]. Furthermore, in combination with electricity from RES, battery electric vehicles (BEVs) could save about 65% to 70% in GHG emissions compared to plug-in hybrid electric vehicles (PHEVs) [3].
Far-reaching arguments against switching to EVs are high investment costs compared to ICEs and technical limitations (e.g., limited driving range and charging infrastructure availability) [5]. The investment costs of an EV are about one-third higher in comparison to an ICE. Furthermore, the driving range of an EV is quite low, mostly about 130–250 km, compared to the 700 km range of an average ICE [6]. A requirement for the successful distribution of EVs is the availability of charging infrastructure. If this is not the case, range anxiety occurs [7].
Politicians have at least two options to address these problems. On the one hand, BEVs can be promoted directly by implementing monetary policies such as subsidies or with non-monetary ones such as the use of bus lanes for BEVs and free parking. On the other hand, BEVs can be pushed indirectly, e.g., through a CO2 tax on all fuels and higher registration taxes on conventional vehicles than on BEVs. Another legal option is driving bans for diesel and gasoline cars in cities or emission-free zones.
The core objectives of this paper are to analyse the current economic state of BEVs in comparison to conventional cars and to identify proper policies to overcome the major current barrier of high investment costs. Regarding economics, we investigated the total cost of ownership (TCO), including existing national policy instruments such as fuel and registration taxes as well as subsidies. The TCO was calculated for selected major countries worldwide. The selection of countries was based on their relevance so far regarding market penetration of BEVs such as the major BEV markets of China, California in the USA and the most important European countries (Austria, Germany, The Netherlands and Norway). For these countries, detailed economic analyses were conducted for two cases of cars, small and large ones.
Regarding proper policies to overcome major current barriers, measures in different dimensions (subsidies, standards, taxes and legal frameworks) and applicable monetary and non-monetary incentives to promote BEVs (and reduce the number of ICEs) are elaborated upon. Furthermore, fuel and electricity prices as well as BEV distribution in selected countries (China, Japan, the USA, UK and some European countries (Austria, France, Germany, Sweden and Norway)) are examined. Moreover, amounts of subsidies, exemptions from taxes and non-monetary measures for the selected countries are elaborated upon.
The major new contribution of this paper is that a comprehensive and up-to-date survey, discussion and assessment on all policies existing in major countries regarding market deployment of BEVs—direct and indirect measures, monetary and non-monetary policies, technical and behavioural—is conducted and completed by a sound and detailed economic analysis. Hence, it also closes the existing research gap regarding state-of-the-art economics and the impact of promotion policies regarding BEVs. To the best of our knowledge, no such comprehensive analysis exists. Of course, policies to support E-Mobility have been investigated in several previous studies.
Rietman et al. [8] dealt with political measures and how they promoted E-Mobility. The study investigated the effectiveness of measures in 20 countries. The authors stated that cooperation between public and private sectors was essential to promote EVs. Moreover, monetary measures, in combination with measures for the charging infrastructure, were highly effective. Government measures suggested that government policies reflected the preferences of consumers. Furthermore, countries with higher purchasing power also had higher EV penetration. Cansino et al. [9] provided an overview of the most important measures to promote E-Mobility in the EU-28. The authors concluded that in addition to financial incentives for purchasing and supporting R&D projects, tax and infrastructure measures were the most effective ways to promote EVs. In addition, they found that in countries where CO2-based taxation had been introduced, penetration rates were higher. Dijk et al. [10] examined the socio-technical development of E-Mobility. They summarised that E-Mobility was suffering from high oil prices, carbon limits, car-sharing and intermodality. Moreover, the EV market was mainly dependent on the progress of batteries, measures to reduce CO2 emissions, new value propositions by companies and the image of EVs. Held et al. [11] analysed mobility policies to increase adoption rates of e-vehicles in 15 EU cities. They found that policies that had a more substantial impact on the TCO of EVs, combined with incentives for installing charging infrastructure and a public power grid combined with push factors that make the use of conventional cars unattractive, led to beneficial effects. Incentives should always have been linked to de-incentives; isolated measures were less effective. Gass et al. [12] analysed alternative policy instruments to promote EVs in Austria in their 2011 study. They concluded that up-front price support worked better than taxation systems. Moreover, significant learning effects should reduce the cost of EVs in the future, which can be achieved primarily by promoting research. Wang et al. [13] investigated incentive measures and their influence on the market share of EVs. They examined which measures, other than highly effective subsidies, could drive EV penetration. Charging infrastructure, fuel price, and access to bus lanes for EVs were key factors in driving EV penetration. In summary, the most important factor was not direct subsidies but road priority (access to high-occupancy vehicle lanes (HOVs) and bus lanes). The study by Vilchez et al. [14] identified factors that influenced the EV market in Europe. They concluded that the purchase price of EVs was still a barrier. Consumers preferred government incentives. In addition, socio-cultural characteristics of consumers also influenced purchase intentions. The impact of energy policies on scenarios regarding GHG emission reduction in passenger car mobility in the EU-15 was analysed by Ajanovic/Haas. The core message was that policymakers must set clear and rigorous priorities to reduce CO2 emissions. The most important goals were to improve energy efficiency and reduce energy consumption [5,15]. Cherchi [6] provided a work about the measurement of the effect of informational and normative conformity for EVs compared to ICEs. She summarised that social conformity effects such as advice from non-experts to potential buyers were highly effective for the dissemination of EVs. Such effects could compensate for low driving ranges of EVs or differences in the purchase price. Furthermore, a combination of free/reduced parking fees with reserved parking spots was highly effective in spreading EVs. Palmer et al. [16] showed the impact of ownership costs on market share by calculating a TCO over a 16-year period. Among other findings, they found that long-term government support was essential to promote the dissemination of EVs.
In this article, an examination of how policies affect the distribution of BEVs and ICEs in selected countries is provided. The methods of approach are given in Section 2. A general overview of energy policy instruments in transport that affect the promotion of BEVs is given in Section 3. Recent developments of BEVs are stated in Section 4. Incentives for BEVs in selected countries and a comparison of these is provided in Section 5. To see how current policies affect ICEs’ and BEVs’ costs from an individual perspective, a TCO is calculated for each of the selected countries; the results can be found in Section 6. Finally, the conclusions and future perspectives for further developing BEVs are given in Section 7.
2. Method of Approach
One of the arguments against switching to BEVs is high investment costs [6]. To compare the economic performance of an ICE with a BEV, a TCO was calculated. With the calculation of a TCO, direct and indirect mobility costs could be shown from an individual perspective. In this way, the effects of monetary measures and sales could be identified [17]. The aim was to identify the difference between ICEs’ and BEVs’ costs, considering the capital costs, operating and maintenance costs and electricity/fuel costs.
To analyse the economics of the BEVs, the TCO was calculated in € per year. For the calculation, 12,500 km per year was assumed [18]. The TCO in € per year was calculated as follows:
CCap is the cost of capital for the vehicle including purchase subsidies, either ICE or BEV [€/year]; CO&M is the cost of operation and maintenance [€/year], which includes the insurance, maintenance and repair costs; parking tolls and road charges are not considered; and CE is the cost of energy, either fuel or electricity [€/year].
The capital cost per year depending on the initial investment cost IC0 (including subsidies τsub) and the capital recovery factor (CRF) α is:
α describes the ratio of a constant annuity to the present value of this annuity’s receipt for a given time. It is calculated using an interest rate z and a depreciation period n. With the annuity method, the depreciation costs and annual capital costs are determined with the same recovery factor. The depreciation period is assumed to be eight years, the same as the lifetime of vehicles. This period also covers the warranty period for a battery for driving distances between 80,000 and 24,000 km. An interest rate of 5% is assumed, as this is a standard interest rate from a bank loan [19].
The cost of energy depends on the price for the fuel or electricity pf [€/kWh or €/l], the km driven per year vkm and the fuel intensity FI [kWh/km].
The fuel price is the sum of the net price pnet; the value-added tax (VAT) τVAT, which, in the EU, was in the range from 17% to 27% in 2020 [20]; CO2 based tax τCO2 and an excise tax on fuels τExcise.
In the following, we apply this method to calculate TCO for two specific cases (small and large cars), wherein we compare the TCO for selected countries with some relevance of BEVs as described in Section 4. This comparison was made to identify the current level of the economics of BEVs compared to conventional vehicles. Note that all currently applied policy instruments in our state of knowledge—taxes and subsidies—were considered and included in this investigation.
The first case included a comparison of TCO for small cars, the Volkswagen (VW) Golf and the VW E-Golf. We chose approximately the same type of vehicle to guarantee a valid comparison. Comparability was given due to similar engine power (VW Golf–110 kW, VW E-Golf–100 kW) and similar weight (VW Golf—1211 kg, VW E-Golf—585 kg) of the compared cars; see Table 1. In the second case, the TCO was calculated for bigger cars, an Audi A5 and a Tesla Model 3. The comparability was also mad through similar engine power (Audi A5—195 kW, Tesla Model 3—211 kW) and similar weight (Audi A5—1600 kg, Tesla Model 3—1684 kg).

Table 1.
Technical specifications for vehicles analysed.
In addition to the technical components, which show the comparability of the models, the price difference between the models should also be discussed at this point. The price difference between the two models in the first case (VW Golf: €18,640; E-Golf: €16,540) was approximately €2100. In the second case (Audi A5: 34,220 €; Tesla Model 3: 29,870 €) the difference was about 4350 €. Apart from that, the Tesla Model 3 was a more exclusive model than the Audi A5. These factors should be taken into account.
Furthermore, a sensitivity analysis was performed to determine the impact of a change in the interest rate or the depreciation time on the annual costs of a vehicle.
3. A Survey on Energy Policies in Transport
In this chapter, an overview of possible policies and measures to promote E-Mobility, focusing on BEVs, is provided. First of all, it is shown which policies exist and on which segment of the transport sector, e.g., mobility, they act. Figure 2 shows how mobility and policy measures in different dimensions interact. It depicts the complexity and the connections between policies and the service mobility itself. In the following examples, policies related to energy, infrastructure and vehicles are given.
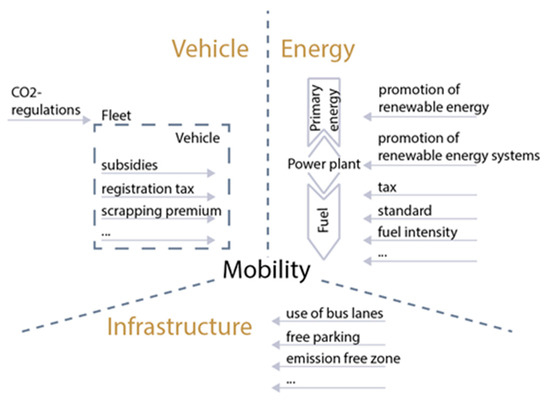
Figure 2.
Mobility and policy measures in different dimensions.
- 1.
- Energy
To reduce emissions from the transport sector, it is essential that energy used in vehicles comes from low-carbon and renewable energy sources (such as sun, wind, biomass). If this is not ensured, then the vehicles, both ICEs and EVs, are powered by fossil fuels. With the promotion of renewable energy and renewable energy systems (RES), the vehicle fleet could become more sustainable. With, for example, taxes on fuel, mobility with conventional cars becomes more expensive. With standards and, for instance, a minimum of fuel intensity, mobility becomes again more environmentally friendly.
- 2.
- Infrastructure
The infrastructure can be directly influenced by allowing the use of bus lanes for BEVs. Other examples are free and/or reserved parking spaces for BEVs or emission-free zones where BEVs are permitted to access. However, most important is to develop the necessary charging infrastructure.
- 3.
- Vehicle
For example, BEVs can be promoted directly with subsidies on the purchase price, on the insurance or indirectly with a scrapping premium on ICEs. Exemptions from various taxes like the registration tax, the import tax or the VAT are further promotion options to push down vehicle prices. Furthermore, the total fleet can be promoted through CO2 regulations, for example, by setting a limit value in gCO2/km for fleet consumption.
Figure 3 shows four dimensions, which are fundamental for energy policy interventions in general. In principle, the promotion of BEVs can be affected in four different ways, either financial through subsidies and taxes or regulatory through standards or legal frameworks. Figure 3 also includes specific measures for BEVs in the four dimensions.
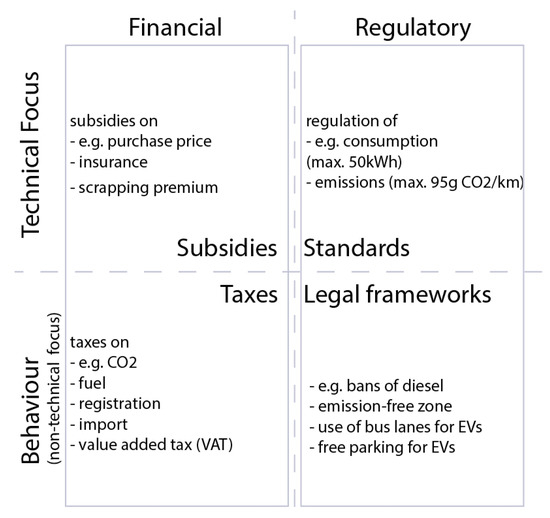
Figure 3.
The four major dimensions of energy policies with a special focus on transport.
As shown in Table 2, policy instruments that can be implemented can be divided into monetary incentives and non-monetary incentives. Furthermore, the columns with the terms “direct policies” and “indirect policies” describe whether the incentives affect the BEVs directly or indirectly from an individual drivers’ perspective. These possible incentives, in addition to specific measures implemented in countries, can be found in Section 5.
Table 2.
Policy instruments to promote E-Mobility [19,22,23,24,25,26,27,28,29,30,31,32,33,34,35].
- 1.
- Monetary Incentives
Subsidies: Often, the government grants money off the purchase list price of BEVs. Other possibilities are discounts on car insurance or a so-called scrapping premium if the old ICE car is scrapped and in the best case, a BEV is purchased instead. Furthermore, the state can subsidise electricity prices, which affect the charging prices via the public loading infrastructure or mainly for the infrastructure at home.
Tax payments: In almost all countries, there are exemptions from taxes for BEVs (tax benefits). The proportion of tax to vehicle price/operation varies widely between countries. The exemption from car purchase taxes and registration taxes such as the value-added tax for BEVs is usual. Registration taxes are often based on the CO2 emissions of a vehicle. Mostly, customers must pay a motor vehicle tax for car ownership; exemptions are also common.
In comparison, ICEs are exempt from taxes if they fall below a specific CO2 or kW limit. In addition, there are electricity taxes to pay. Indirect policy instruments that affect BEVs monetarily are CO2 taxes on petrol and diesel or high registration taxes on ICEs.
Other: BEVs can often park free of charge. Furthermore, often exemptions/reductions for tolls, congestion charging or low emission zone charging are given.
- 2.
- Non-monetary Incentives
Standards: Mandatory standards that affect BEVs’ spread are stipulating minimum energy levels (energy efficiency standards) or maximum energy use levels (maximum energy consumption) on vehicles [21]. On the other side, indirect standards are CO2 regulations (e.g., 95 gCO2/km within the EU) or standards on diesel concerning the fuel intensity.
Legal: Furthermore, some laws/regulations allow EVs to use low/free-emission zones or bus lanes. These permits also have an indirect effect, as they exclude ICEs from using low/free-emission zones.
Other: Other non-monetary incentives are national EV sales targets. Because of the objectives, governments need to offer incentives for EV dissemination. Reserved parking spaces for EVs are common. Free parking for EVs is also indirect, as it excludes ICEs from using them. In Scandinavia, EVs are sometimes allowed to travel free of charge by ferry, and in some places, there are also free electric charging stations. Exemptions from road charges can also be given.
Which of the policies will be applied is very dependent on regional differences and country specific circumstances, such as GDP and national policy targets. Countries with higher GDP are able to provide higher subsidies and tax reductions. For countries with lower GDP, indirect monetary measures could be more attractive.
4. Recent Developments of BEVs
In this chapter, the BEV market share in selected countries—the USA, China, Japan and some European countries—is highlighted. For the selected countries and the rest of the world, global electric car sales are also stated. Furthermore, a comparison between fuel and electricity prices is provided.
Figure 4 shows that Norway had the worldwide highest market share of BEVs. There had been a rapid share increase in Norway since 2013. In 2010, the market share was only 0.3%, but it was already 45.6% in 2020. The rate increased by a factor of 152 in 10 years. It is illustrated that The Netherlands, in second place, also had a rapid increase in BEV market share rates in recent years. While in 2014, the market share in The Netherlands amounted to only 0.7%, in 2019, it had increased to 15.2%. However, in 2020, the market share fell to 10.2%. As shown in Figure 5, Sweden also had a high market share, with only 0.8% in 2015, but the market share increased rapidly to 7.9% in 2020. Throughout the EU, the market share of BEVs was relatively low, at 4.2% in 2020. Similarly, China (3.9% in 2019), Japan (0.5% in 2019) and the USA (1.5% in 2019) in 2019 had very low BEV shares. The decline in BEV market share in Japan from 0.6% in 2018 to 0.5% was mainly due to the high purchase prices of BEVs. In addition, there were very few fast chargers that were publicly available in 2019. Furthermore, there were very limited tax incentives for the purchase of BEVs in Japan. [36]. Figure 5 was added to illustrate the developments in the markets in countries with market shares below 6%.
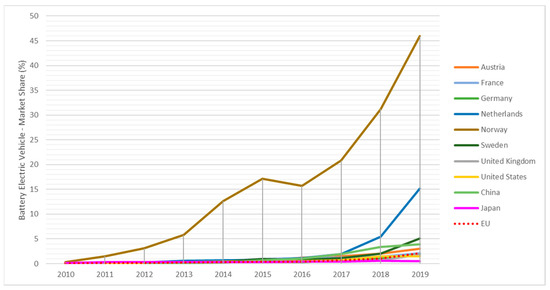
Figure 4.
Battery electric vehicle market share in new registrations in major countries [36,37].
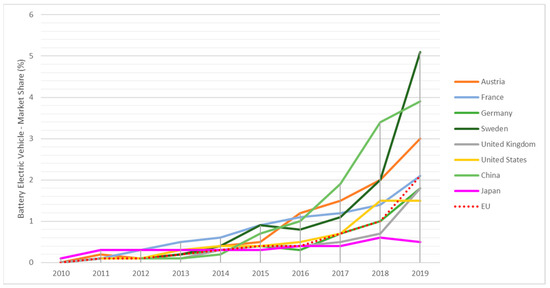
Figure 5.
Battery electric vehicle market share in new registrations in major countries with a market share below 6% [36,37].
Figure 6 illustrates global electric car sales in major countries. As is shown in Figure 6, China had the highest amount of BEV sales. In 2011, the sales amounted to 0.01 million. Since then, the rate of EVs increased in 2018 to 1.18 million. In 2019, it was 1.10 million. The EU followed China with an amount of 0.01 million EV sales in 2011, 0.40 million sales in 2018 and 0.59 million in 2020. The third key market was the USA, with 0.36 million EV sales in 2018 and 0.22 million in 2019. Throughout the world, the EV sales amounted to 2.3 million with a market share of 3.2% in 2019. Preliminary numbers for global BEV sale in 2020 are also depicted in Figure 6.
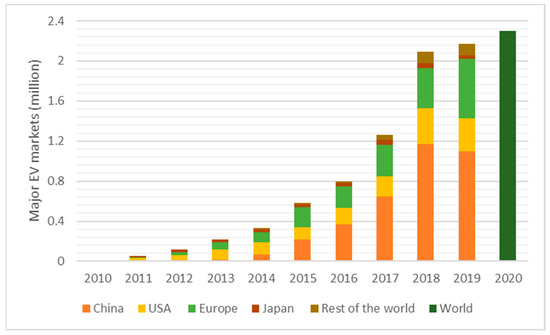
Figure 6.
Global electric car sales in major countries [38].
In general, petrol prices are strongly related to the overall economic situation of a country. Prices vary from country to country, sometimes considerably. The higher the GDP, the higher the petrol and diesel prices. The USA is an exception to this with a high GDP but very low taxes on mineral oil products. The average gasoline price worldwide was 1.05 USD per litre in 2020 [39]. The attractiveness of BEVs depends strongly on fossil fuel prices and electricity prices. A good example is Norway, where electricity prices are very low in relation to fuel prices.
Figure 7 illustrates electricity prices in comparison to fossil fuel costs in passenger car transport in 2020. It can be said that regarding efficiency, one litre of gasoline was comparable with 8.94 kWh and one litre of diesel with 9.97 kWh. The lowest electricity price could be found in China, with 0.07 € per kWh, and in Norway, with 0.08 € per kWh. The largest difference between the electricity price and the gasoline price was in Norway. Germany had the highest electricity price, with 0.30 € per kWh, while the average price in the EU was 0.21 € per kWh. The fuel prices were only lower in a few countries than the electricity prices, e.g., in China and some European countries (both in Norway and diesel in The Netherlands). The lowest fuel prices were in the USA, where one kWh of gasoline cost 0.06 €. The highest costs for fuel could be found in the EU. In The Netherlands, a kWh of gasoline cost 0.18 € and in Norway, 0.17 €. The average gasoline price within the EU amounted to 1.14 € per kWh and the average diesel price to 1.12 € per litre. Usually, gasoline prices were higher than diesel prices due to higher taxes on gasoline.
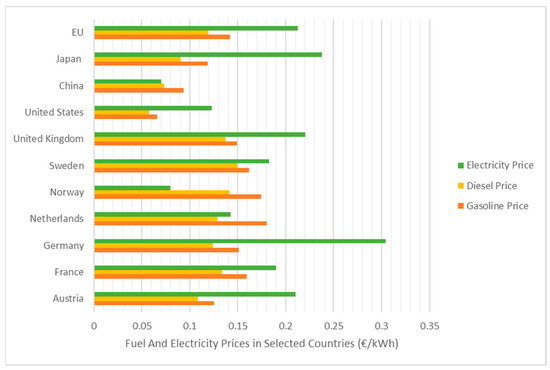
Figure 7.
Fuel and electricity prices in €/kWh in the USA, China and selected European countries in 2020 [39,40].
5. Comparison of Incentives for BEVs in Selected Countries—EU, USA, China, Japan
In this chapter, a comparison of incentives for BEVs in selected countries—the USA, China, Japan and some European countries—for the year 2020 is provided. It is shown how different BEVs were promoted in selected countries. Note that especially all of the non-monetary measures were quite generic. Just because one country offered free parking for BEVs did not mean that BEVs could park for free at all parking spaces. Furthermore, incentives are changing all the time. Incentives that were valid for 2020 can be replaced by new ones or completely abolished in 2021.
As can be seen in Table 3, in all countries considered, except Norway, the customer got a purchase subsidy on a new BEV list price. Furthermore, the exemption of different taxes, like the VAT, registration tax (based on CO2 emissions, bonus/malus), consumption tax and annual taxes (road and circulation taxes) was very common. Companies often received company tax benefits when purchasing BEVs. There were non-monetary incentives in all countries to make the purchase and the use of a BEV more attractive. Free parking and the usage of bus lanes were the most popular measures.
Table 3.
Incentives in selected countries in the year 2020 [12,21,22,23,24,25,26,27,28,29,30,43,44,45,50,51,52].
In Austria, a purchase subsidy of 5000 € on the list price of BEVs and an exemption from all car-related taxes was given [41]. Moreover, the promotion of 600 € for a home-installed wallbox was granted. [31]. In France, there was a very high subsidy, up to 7000 €, on a BEV purchase price. Moreover, the exemption from VAT and registration tax was guaranteed. The customer got tax credits for installing charging spots, and for changing from an ICE to a BEV, a scrapping premium was given [42]. In Germany, the purchase subsidy for a BEV amounted up to 6000 €, and there were the usual car-related tax exemptions [43]. In The Netherlands, a 4000 € subsidy on the list price of a BEV was guaranteed. The usual EU exemptions for BEVs were given [41]. Norway was unusual because there was no purchase subsidy on BEVs. However, BEVs were exempted from all car-related taxes. Furthermore, more non-monetary measures existed than in other countries: for example, no charges on toll roads or ferries, a maximum of 50% of the total amount on ferries and the usual measures like free parking and bus lane use [44]. Moreover, the customer got 815 € support for home charging infrastructure [45]. Sweden guaranteed up to 5700 € for a BEV. In addition to the usual exemptions from the taxes, a climate bonus of 5961 € on Zero-CO2 emission cars was given [41].
In China, the purchase subsidy was between 2400 € and 3300 €. Furthermore, exemption from VAT and the vehicle and vessel tax were given. In China, BEVs were excluded from registration restrictions and driving bans and license plate quotas [46,47]. Japan granted a subsidy with up to 3154 € on the BEV’s purchase price. However, BEVs were exempted from all car-related taxes such as the automobile tax, acquisition and road taxes [48]. In the United Kingdom, the subsidy on the purchase price amounted up to 3322 €. There were various tax benefits, and in London, BEVs got discounts/exemptions by entering the Congestion Zone and Ultra Low Emission Zone [49]. In the USA, there were federal subsidies of 2041 €; the local subsidies granted in the USA differed from state to state. For example, in California, there were additional rebates of 2450 €. The VAT of 8.25% was low; furthermore, the EV customer could get a federal tax credit between 2041 € and 6124 € [22].
6. Results: Economic Assessment
In this chapter, the focus is on the interpretation of the results from the TCO. It is of particular interest to analyse the differences in the mobility costs between the selected countries (China, the USA (California), and some European countries (Austria, Germany, The Netherlands, Norway) for the year 2020. A look at the composition of an individual’s expenses is given in detail. An examination of the differences between the cost composition of ICEs and BEVs is stated, and a general look at the contrast of the chosen cars is provided. In addition, a calculation of TCO of BEVs without subsidies on investment costs was done. Furthermore, a sensitivity analysis was performed to determine the impact of a change in the interest rate or the depreciation time on the annual costs of a vehicle.
First of all, the differences in the purchase price between ICEs and BEVs must be mentioned. In Case 1, the acquisition costs for a VW Golf, exclusive taxes, amounted to 18,640 € in the selected countries. The purchase price for a comparable E-Golf was slightly lower, at 16,540 €. Case 2 showed a larger difference between the purchase price for the Audi A5 (34,220 €) and the Tesla Model 3 (29,870 €). As already discussed in Section 2, the vehicles were comparable despite the price difference due to similar size and engine power.
Figure 8 (Case 1—Volkswagen Golf vs. Volkswagen E-Golf) and Figure 9 (Case 2—Audi A5 vs. Tesla Model 3) shows the TCO per year of an ICE and a BEV in selected countries. The costs include subsidies and taxes. A depreciation period of eight years and an interest rate of 5% were assumed.
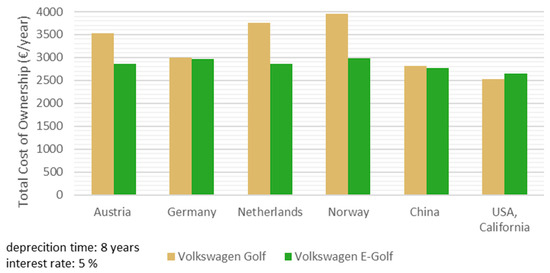
Figure 8.
Total cost of ownership (TCO) (Case 1)—VW Golf vs. E-Golf.
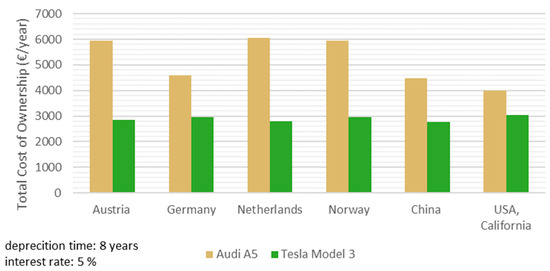
Figure 9.
TCO (Case 2)—Audi A5 vs. Tesla Model 3.
In Case 1 (see Figure 8), total costs per year for a VW Golf ranged from 2520 € in the USA to 3960 € in Norway. For a VW E-Golf, the TCO per year ranged from 2650 € in the USA to 2980 € in Norway.
In Case 2 (see Figure 9), TCO per year for an Audi A5 ranged from 3990 € in the USA to 5960 € in Norway and Austria. For a Tesla Model 3, the costs were between 2760 € in China and 4460 € in Norway.
In both cases, the lowest prices for the ICE were in the USA and the highest in Norway (Case 1) and The Netherlands (Case 2). The lowest costs for BEVs were in the USA (Case 1) and China (Case 2). The highest costs could be found in Norway, Germany and the USA. Case 2 shows the lowest price in the USA for the Tesla Model 3. However, the low costs of the Tesla Model 3 in the USA was only because Tesla was exempted from subsidies.
The differences in the costs were due to the divergencies in the costs of capital (CCap), operating & maintenance (CO&M) and energy (CE).
Figure 10 (Case 1) and Figure 11 (Case 2) illustrate the composition of costs in detail. It also shows how high the costs would be without subsidies. Overall, the most significant price factor was the CCap, followed by the CE. The CO&M had the lowest impact on the total costs. In the following. detailed results for selected countries are presented.
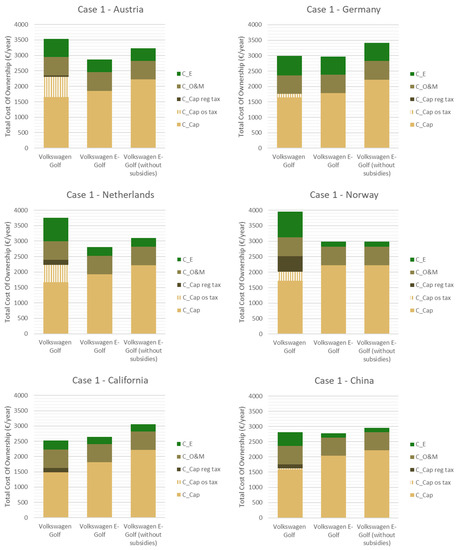
Figure 10.
TCO: Case 1—Composition of the TCO in Case 1 for 2020.
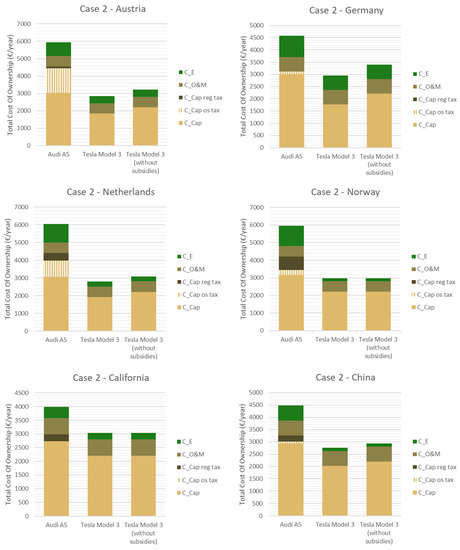
Figure 11.
TCO: Case 2—Composition of the TCO in Case 2 for 2020.
The Netherlands, Austria
As shown in Figure 10 and Figure 11, The Netherlands and Austria had very similar TCO. In The Netherlands, BEVs, per year, were slightly more expensive, and an ICE slightly less expensive than in Austria. The Netherlands had a VAT of 21%, and Austria, a VAT of 20%. A significant difference could be found in the amount of registration taxes. In The Netherlands, registration taxes were almost four times higher than in Austria. Among the countries considered, registration taxes were only higher in Norway. However, the ownership tax in Austria was higher than in any of the other countries considered. Gasoline prices in The Netherlands were the highest within the selected countries, but electricity prices were in the midfield and lower than in Austria. Austria granted a 5000 € subsidy, The Netherlands, a 6000 € subsidy for a BEV. The annual costs for the vehicles considered were very similar. The costs of a BEV in The Netherlands had more impact on the BEV market share than in Austria (in The Netherlands 10.2%, Austria 6% in 2020). The Netherlands showed that the high cost for a BEV could be compensated for through high registration taxes combined with subsidies and high gasoline prices.
Germany, China
In Germany and China, the annual costs of an ICE and BEV were approximately the same. Germany granted the highest subsidies, with 6000 € for a BEV, among the countries considered. In comparison, China granted 3000 € for a BEV. In China, the VAT, at 16%, is rather low; in Germany, the VAT is 19%. In Germany, there are no registration taxes on ICEs; the ownership tax is also very low. In addition, in China, the registration tax for an ICE is very low. However, there was a lottery procedure there, so whether an ICE could be registered at all was a random decision. In China, electricity prices were the lowest within the selected countries (0.07 €/kWh); fuel prices were also low. Only in the USA was the fuel price even lower than in China. In Germany, electricity prices were the highest within the compared countries (0.31 €/kWh). The BEV market share in China was 3.9% in 2019; in Germany, it was 1.8%. An average level of subsidies and low registration taxes in combination with low electricity prices thus seemed to have a higher impact than high subsidies in combination with low taxes. China also strongly promoted BEVs with the lottery process.
Norway
Norway is considered separately at this point. Norway had the largest BEV market share worldwide, with 45.6% in 2020. Nevertheless, the annual costs for a BEV were very high. On the other hand, ICEs were much more expensive than in the other countries considered. This was due to very high registration taxes and high gasoline prices. Only in The Netherlands was gasoline price higher. The costs of electricity, on the contrary, were very low (0.08 €/kWh). Lower electricity prices in the selected countries existed only in China (0.07 €/kWh). In Norway, there were no subsidies for BEVs granted. However, it balanced itself out again. Nowhere else were so many monetary measures granted to BEVs as in Norway. The VAT (25%) was, for the EU-average (21%), rather high. Norway showed that monetary measures, combined with high registration taxes on ICEs, had a high impact on disseminating BEVs.
USA (California)
The USA (California) had a unique position in terms of the cost of ICEs. The prices were much lower than in the other selected countries due to the very low VAT of 8.25%. Additionally, there were no ownership taxes on ICEs. Furthermore, the gasoline price (0.07 €/kWh) was the lowest within the selected countries, and the electricity price was in the midfield. For a BEV, there was a 5500 € subsidy granted; this was the second-highest value within the compared countries. However, Tesla and General Motors were exempted from the federal tax credit. In the USA, very few non-monetary measures were provided for BEVs.
Apart from the individual situation in selected countries, there were differences between the two cases that needed to be considered. As described briefly in the introduction to this Chapter, this was due to the cars’ different purchase prices. The differences can be explained as follows:
In Case 1, the TCO for an ICE and BEV was approximately equal. The purchase price for a VW Golf in, for example, Austria amounted to 18,670 €, and for an E-Golf, 30,090 €. However, there were subsidies for the E-Golf in the amount of 5000 €. In addition, the VW Golf price got higher because of the VAT (20%), registration tax and ownership tax on ICEs. Nevertheless, the slightly lower electricity costs could not compensate for the higher fuel costs. As a result, the E-Golf cost more than the VW Golf in Austria.
Case 2 showed large differences in the TCO of a BEV and an ICE. The net price of the Audi A5 in Austria for example, amounted to 34,280 €, and of the Tesla Model 3, to 29,920 €. The price difference between the cars was not as high as in Case 1. The Audi A5 cost more than the Tesla Model 3. Austria guaranteed the same amount of subsidies (5000 €) for the Tesla Model 3. On the other hand, the Tesla Model 3 consumed 0.16 kWh/km, which was similar to the VW E-Golf.
The price margins between ICEs and BEVs were reflected in the final results. This explained the large differences between costs of ICEs and BEVs when comparing the two cases.
In the following, we would like to show cost composition, without taking subsidies on the purchase price into account, using the examples of Austria, Norway and California. Cost allocations without subsidies for all countries considered are implemented in Figure 10 (Case 1) and Figure 11 (Case 2).
In Austria, in Case 1, the annual costs of 2860 € for a VW E-Golf would amount to 3230 € per year without subsidies. The E-Golf would be cheaper than the comparable VW Golf at 3530 € per year. Taking Case 2 into consideration, the annual cost of 2850 € for a Tesla Model 3 would be 3220 € without subsidies. A comparable Audi A5 would cost 5950 € per year. Therefore, in this case, the EV without subsidies would still be even much cheaper than ICE.
Norway was the only country considered where no subsidies were granted. Nevertheless, BEVs were much cheaper than comparable conventional cars. In no other country considered was the difference between ICEs and comparable BEVs higher than in Norway.
In California, in Case 1, the annual costs for a VW E-Golf without subsidies would amount to 3050 €. The VW E-Golf would be more expensive than the comparable VW Golf with yearly costs of 2520 €. Case 2 showed a different situation. Without subsidies, the Tesla Model 3 would cost 3040 € per year. Therefore, it was cheaper than the Audi A5, with an annual cost of 3990 €.
This demonstrated that subsidies had a significant impact on TCO.
Sensitivity analyses were done to see how depreciation time and the interest rate affected the costs. In the first step, the parameter for the depreciation time was changed. Thus, a period of 6 years and a period of 10 years were used for the calculation. The interest rate of 5% was not changed. In the second step, the interest rate parameters were changed to 4% and 6%. The depreciation time of 8 years was not changed.
The following effects of the interest rate were found: If the interest rate was set to 4%, the costs changed positively (the annual costs become lower). Conversely, an interest rate of 6% had a negative effect on costs (annual costs become higher).
A change in the depreciation time had the following effects: If a depreciation time of 6 years was assumed, the costs changed slightly positively (the annual costs became lower). Conversely, a depreciation time of 10 years had a slightly negative effect on costs (annual costs became higher).
A change in the interest rate parameter had a stronger effect on the annual costs than a change in the depreciation time.
In summary, the annual cost of an ICE was the highest in Norway, The Netherlands and Austria. In the USA (California), China and Germany, the annual costs for an ICE were the lowest. The high costs of conventional cars in Norway and The Netherlands were mainly due to the very high fossil fuel prices and registration taxes. In contrast, fuel prices in the USA (California) and China were very low.
In Norway, the high costs of BEVs were due to the lack of subsidies; in Germany, it was due to very high electricity prices. The very high BEV market share (52% in 2020) in Norway was explained by the fact that there were additional rebates for home charging infrastructure and more non-monetary measures than anywhere else as well as the high registration taxes on ICE.
In the USA (California), the annual cost of a BEV was the lowest. In Case 2, the high cost of the Tesla 3 was an exception because Tesla, in particular, was exempt from subsidies. Electricity prices were in the lower middle range; subsidies were quite high. Nevertheless, the market share of BEVs was only 1.5%. Low annual costs for a BEV were also found in China (market share 3.9% in 2019), which was due to very low electricity prices. This demonstrated that low TCO was not enough to ensure successful BEV dissemination.
7. Conclusions
Current policy strategies have a much higher impact on the dissemination of BEVs than pure private decisions [53]. It is essential to identify the most effective policies and provide recommendations for policymakers.
Today, almost no electric passenger cars purchased without policy interventions can be seen. The TCO analysis showed that investment costs of the vehicle itself had the most significant impact on the TCO and hence, on the unfavourable economics of BEVs. As demonstrated by the examples of Norway and The Netherlands, the number of BEVs deployed was highest in countries where proper policy measures are installed.
Norway had the highest BEV market share worldwide. Nevertheless, the annual costs for a BEV in Norway were very high. ICEs were also much more expensive than in the other selected countries considered. It was shown that measures such as the increase of prices for ICEs through high registration taxes and high fuel prices and non-monetary incentives such as access to certain zones and the usage of bus lanes for BEVs were highly effective. Furthermore, Norway’s electricity prices were very low. The Netherlands also showed that the high cost of a BEV could be compensated for through high registration taxes and high gasoline prices. In addition, high subsidies were granted on BEVs in The Netherlands.
Low costs for BEVs alone did not ensure high EV dissemination. Nevertheless, the high price of BEVs was still a barrier [14]. Non-monetary incentives, combined with indirect policies such as high registration taxes and high fuel prices, are highly effective. In addition, it could be identified that incentives such as low electricity costs should always be linked to de-incentives such as high fuel prices [11]. All of these incentives are highly dependent on policy intervention (but also on spatial conditions).
The analysis of the TCO also demonstrated that a change in the interest parameter had a stronger effect on the annual costs of a vehicle than the depreciation time. It follows that a reduction in the depreciation time will probably not lead to a remarkable reduction in costs.
Other factors for the successful diffusion of BEVs that were not considered in this paper are the high impact of charging infrastructure, the GDP and CO2-based taxes [8,9,11]. It is recommended that up-front price support works better than taxation systems [53]. In addition, essential are the technological progress of batteries and the image of BEVs [6,10].
Finally, the following recommendations for policy makers to reduce CO2-emissions are summarised. These must be clearly and rigorously prioritized [15]. Forcing electric mobility in private passenger car transport requires policy interferences at least in the following dimensions:
- (i)
- Pushing the purchases of BEVs by providing remarkable purchase subsidies at least for the next years to reduce the investment costs over time due to technological learning effects;
- (ii)
- Implementation of high registration taxes to push up the prices of ICEs even more;
- (iii)
- Legislative measures for the introduction of emission-free transport zones and free parking for BEVs would be helpful to disseminate BEVs, especially in urban areas;
- (iv)
- Introducing CO2 taxes would support the economic performance of BEVs indirectly by increasing the prices of petrol and diesel.
Further recommendations based on other studies:
- (v)
- Setting up the proper charging infrastructure: Along with all types of E-Mobility goes infrastructure development such as constructing charging infrastructure for BEVs [8,9,11]. Because this is a problem again concerning regulation, it means the involvement of policymakers.
- (vi)
- The relevance of the energy source for electricity generation: Regarding the environmental performance of any type of E-Mobility, the most crucial question is from which source the electricity used is generated and how this mix will develop in the future [19]. With the promotion of renewable energy and RES, electricity becomes as environmentally clean as possible, but again, this is largely a political decision.
Summing up, policy measures in different dimensions will be the major driving force for increasing BEVs’ deployment in the future.
Author Contributions
Conceptualisation, M.S. and R.H.; methodology, M.S. and A.A.; formal analysis, M.S.; investigation, M.S. and A.A.; resources, M.S. and A.A.; data curation, M.S. and A.A.; writing—original draft preparation, M.S.; writing—review and editing, M.S., A.A. and R.H.; visualisation, M.S..; project administration, A.A.; funding acquisition, A.A. All authors have read and agreed to the published version of the manuscript.
Funding
This research was funded by the Vienna Science and Technology Fund (WWTF) through project ESR17-067.
Institutional Review Board Statement
Not applicable.
Informed Consent Statement
Not applicable.
Data Availability Statement
MDPI Research Data Policies.
Conflicts of Interest
The authors declare no conflict of interest.
References
- Europäisches Parlament. CO2-Emissionen von Autos: Zahlen und Fakten. Available online: www.europarl.europa.eu/news/de/headlines/society/20190313STO31218/co2-emissionen-von-autos-zahlen-und-fakten-infografik (accessed on 15 August 2020).
- Ajanovic, A. The future of electric vehicles: Prospects and impediments. WIRE Energy Environ. 2015, 4, 521–536. [Google Scholar] [CrossRef]
- Fritz, D.; Heinfellner, H.; Lichtblau, G.; Pölz, W.; Schodl, B. Ökobilanz Alternativer Antriebe: Fokus Elektrofahrzeuge; Umweltbundesamt GmbH: Wien, Austria, 2016; ISBN 9783990043851. [Google Scholar]
- European Environment Agency. European Environment Agency’s Home Page. Available online: https://www.eea.europa.eu/ (accessed on 20 January 2021).
- Ajanovic, A.; Haas, R. Electric vehicles: Solution or new problem? Environ. Dev. Sustain. 2018, 20, 7–22. [Google Scholar] [CrossRef]
- Cherchi, E. A stated choice experiment to measure the effect of informational and normative conformity in the preference for electric vehicles. Transp. Res. Part A Policy Pract. 2017, 100, 88–104. [Google Scholar] [CrossRef]
- Illmann, U.; Kluge, J. Public charging infrastructure and the market diffusion of electric vehicles. Transp. Res. Part D Transp. Environ. 2020, 86, 102413. [Google Scholar] [CrossRef]
- Rietmann, N.; Lieven, T. How policy measures succeeded to promote electric mobility–Worldwide review and outlook. J. Clean. Prod. 2019, 206, 66–75. [Google Scholar] [CrossRef]
- Cansino, J.; Sánchez-Braza, A.; Sanz-Díaz, T. Policy instruments to promote electro-mobility in the EU28: A comprehensive review. Sustainability 2018, 10, 2507. [Google Scholar] [CrossRef]
- Dijk, M.; Orsato, R.J.; Kemp, R. The emergence of an electric mobility trajectory. Energy Policy 2013, 52, 135–145. [Google Scholar] [CrossRef]
- Held, T.; Gerrits, L. On the road to electrification–A qualitative comparative analysis of urban e-mobility policies in 15 European cities. Transp. Policy 2019, 81, 12–23. [Google Scholar] [CrossRef]
- Hauff, K.; Pfahl, S.; Degenkolb, R. Taxation of electric vehicles in Europe: A methodology for comparison. WEVJ 2018, 9, 30. [Google Scholar] [CrossRef]
- Wang, N.; Tang, L.; Pan, H. A global comparison and assessment of incentive policy on electric vehicle promotion. Sustain. Cities Soc. 2019, 44, 597–603. [Google Scholar] [CrossRef]
- Vilchez, J.J.G.; Smyth, A.; Kelleher, L.; Lu, H.; Rohr, C.; Harrison, G.; Thiel, C. Electric car purchase price as a factor determining consumers’ choice and their views on incentives in Europe. Sustainability 2019, 11, 6357. [Google Scholar] [CrossRef]
- Alter Motive. Deriving Effective Least-Cost Policy Strategies for Alternative Automotive Concepts and Alternative Fuels; Vienna University of Technology: Wien, Austria, 2011. [Google Scholar]
- Palmer, K.; Tate, J.E.; Wadud, Z.; Nellthorp, J. Total cost of ownership and market share for hybrid and electric vehicles in the UK, US and Japan. Appl. Energy 2018, 209, 108–119. [Google Scholar] [CrossRef]
- Lévay, P.Z.; Drossinos, Y.; Thiel, C. The effect of fiscal incentives on market penetration of electric vehicles: A pairwise comparison of total cost of ownership. Energy Policy 2017, 105, 524–533. [Google Scholar] [CrossRef]
- Change in Distance Travelled by Car. Available online: https://www.odyssee-mure.eu/publications/efficiency-by-sector/transport/distance-travelled-by-car.html (accessed on 5 March 2021).
- Ajanovic, A.; Haas, R. On the economics and the future prospects of battery electric vehicles. Greenh. Gas Sci. Technol. 2020, 10, 1151–1164. [Google Scholar] [CrossRef]
- Asen, E. 2020 VAT Rates in Europe. Available online: https://taxfoundation.org/european-union-value-added-tax-2020/ (accessed on 3 March 2021).
- Wiel, S.; McMahon, J.E. Governments should implement energy-efficiency standards and labels—cautiously. Energy Policy 2003, 31, 1403–1415. [Google Scholar] [CrossRef]
- Electric Car Tax Credits: What’s Available? Available online: https://www.energysage.com/electric-vehicles/costs-and-benefits-evs/ev-tax-credits/ (accessed on 26 November 2020).
- Federal Tax Credits for Electric and Plug-in Hybrid Cars. Available online: https://www.fueleconomy.gov/feg/taxevb.shtml (accessed on 26 November 2020).
- EAFO. Available online: https://www.eafo.eu/ (accessed on 26 November 2020).
- How China’s Electric Vehicle (EV) Policies Have Shaped the EV Market. Available online: https://www.sustainalytics.com/esg-blog/how-chinas-electric-vehicle-policies-have-shaped-the-ev-market/ (accessed on 26 November 2020).
- Norwegian EV Policy. Available online: https://elbil.no/english/norwegian-ev-policy/ (accessed on 26 November 2020).
- National Conference of State Legislatures. State Policies Promoting Hybrid and Electric Vehicles. Available online: https://www.ncsl.org/research/energy/state-electric-vehicle-incentives-state-chart.aspx (accessed on 26 November 2020).
- The Netherlands Goes for EV Purchase Subsidies. Available online: https://www.electrive.com/2020/03/05/the-netherlands-goes-for-ev-purchase-subsidies/ (accessed on 26 November 2020).
- Environmental and Energy Study Institute. Comparing U.S. and Chinese Electric Vehicle Policies. Available online: https://www.eesi.org/articles/view/comparing-u.s.-and-chinese-electric-vehicle-policies (accessed on 26 November 2020).
- Steinbacher, K.; Goes, M.; Jörling, K. Incentives for Electric Vehicles in Norway. Available online: https://www.euki.de/wp-content/uploads/2018/09/fact-sheet-incentives-for-electric-vehicles-no.pdf (accessed on 8 April 2021).
- Elektroautos und E-Mobilität–Förderungen und weiterführende Links. Available online: https://www.oesterreich.gv.at/themen/bauen_wohnen_und_umwelt/elektroautos_und_e_mobilitaet/Seite.4320020.html (accessed on 26 November 2020).
- Richardson, J. The Incentives Stimulating Norway’s Electric Vehicle Success. Available online: https://cleantechnica.com/2020/01/28/the-incentives-stimulating-norways-electric-vehicle-success/ (accessed on 26 November 2020).
- Ajanovic, A.; Haas, R. Economic and environmental prospects for battery electric- and fuel cell vehicles: A review. Fuel Cells 2019, 19, 515–529. [Google Scholar] [CrossRef]
- Ajanovic, A.; Haas, R. Driving with the sun: Why environmentally benign electric vehicles must plug in at renewables. Sol. Energy 2015, 121, 169–180. [Google Scholar] [CrossRef]
- Ajanovic, A.; Haas, R. The impact of energy policies in scenarios on GHG emission reduction in passenger car mobility in the EU-15. Renew. Sustain. Energy Rev. 2017, 68, 1088–1096. [Google Scholar] [CrossRef]
- International Energy Agency. Global EV Outlook 2020; IEA: Paris, France, 2020. [Google Scholar]
- European Automobile Manufacturers’ Association. Passenger Cars. Available online: https://www.eafo.eu/vehicles-and-fleet/m1 (accessed on 17 January 2021).
- IEA. Global Electric Car Sales by Key Markets, 2010–2020. Available online: https://www.iea.org/data-and-statistics/charts/global-electric-car-sales-by-key-markets-2015–2020 (accessed on 20 January 2021).
- Benzinpreise auf der Ganzen Welt, 11-Jan-2021. Available online: https://de.globalpetrolprices.com/gasoline_prices/ (accessed on 16 January 2021).
- Eurostat. Electricity Prices for Household Consumers–Bi-Annual Data (from 2007 Onwards). Available online: https://ec.europa.eu/eurostat/databrowser/product/page/NRG_PC_204 (accessed on 20 January 2021).
- European Automobile Manufacturers’ Association. ACEA Tax Guide 2020; ACEA: Brussels, Belgium, 2020. [Google Scholar]
- Mock, P.; Yang, Z. Driving Electrification: A Global Comparison of Fiscal Incentive Policy for Electric Vehicles; International Council on Clean Transportation: Washington, DC, USA, 2014. [Google Scholar]
- Presse- und Informationsamt der Bundesregierung. So Funktioniert der Neue Umweltbonus. Available online: https://www.bundesregierung.de/breg-de/themen/klimaschutz/umweltbonus-1692646 (accessed on 7 January 2021).
- Bardal, K.G.; Gjertsen, A.; Reinar, M.B. Sustainable mobility: Policy design and implementation in three Norwegian cities. Transp. Res. Part D Transp. Environ. 2020, 82, 102330. [Google Scholar] [CrossRef]
- Team, T.W. Discover Norway’s Unique EV and EV Chargers Perks. Available online: https://blog.wallbox.com/en/norway-ev-incentives/#index_1 (accessed on 8 January 2021).
- Lambert, F. China Boosts Electric Car Sales by Removing License Plate Quotas. Available online: https://electrek.co/2019/06/06/china-boost-ev-sales-license-plate-quotas/ (accessed on 7 January 2021).
- He, H.; Jin, L.; Cui, H.; Zhou, H. Assessment of Electric Car Promotion Policies in Chinese Cities; International Council on Clean Transportation: Washington, DC, USA, 2018. [Google Scholar]
- Western Automation. Government Incentives Encourage Adoption of Electric Vehicles. Available online: https://www.westernautomation.com/technology-innovations/government-incentives-encourage-adoption-of-electric-vehicles/?doing_wp_cron=1610048496.4899899959564208984375 (accessed on 7 January 2021).
- Navarro, M. A Complete Guide to EV & EV Charging Incentives in the UK. Available online: https://wallbox.com/en_us/ev-incentives-uk (accessed on 8 January 2021).
- Foley & Lardner LLP. Japan Continues to Offer Electric Vehicle Incentives. Available online: https://www.foley.com/en/insights/publications/2013/09/japan-continues-to-offer-electric-vehicle-incentiv (accessed on 6 January 2021).
- Berger, R. E-Mobility Index 2019; Roland Berger: Munich, Germany, 2019. [Google Scholar]
- Statista Mobility Market Outlook. InDepth: eMobility 2020; Statista: Hamburg, Germany, 2020. [Google Scholar]
- Petrauskiene, K.; Dvarioniene, J.; Kaveckis, G.; Kliaugaite, D.; Chenadec, J.; Hehn, L.; Pérez, B.; Bordi, C.; Scavino, G.; Vignoli, A.; et al. Situation analysis of policies for electric mobility development: Experience from five European regions. Sustainability 2020, 12, 2935. [Google Scholar] [CrossRef]
Publisher’s Note: MDPI stays neutral with regard to jurisdictional claims in published maps and institutional affiliations. |
© 2021 by the authors. Licensee MDPI, Basel, Switzerland. This article is an open access article distributed under the terms and conditions of the Creative Commons Attribution (CC BY) license (https://creativecommons.org/licenses/by/4.0/).