Abstract
Nonlinear optical properties of aqueous dispersions of single-wall carbon nanohorns (SWCNH) are investigated by a simple and original technique, relating nonlinear transmittance measurements with semi-empirical model fitting and allowing to identify the dominant nonlinear mechanism. The nanofluids shown a particularly strong optical limiting under irradiation by nanosecond laser pulses at 355, 532 and 1064 nm, much stronger than that previously reported in SWCNHs with smaller aggregate size. The effect is more relevant at 355 nm, where a nearly ideal optical limiting behavior with output energy practically independent on the input one is obtained, and it is attributed to the massive production of bubbles under the effect of light irradiation. This result opens interesting perspectives for the use of SWNCH-based suspensions for smart materials applications and green energy.
1. Introduction
Systems showing optical limiting (OL) properties, a peculiar kind of nonlinear response to electromagnetic radiation, are of interest for all applications requiring to protect human eyes or instrumentation from high power laser beams. In particular, a material is said to show OL properties when its optical response depends on the input light intensity: with low impinging radiation energy, the transmitted light depends linearly on the energy of incident radiation. In other words, the optical transmittance is a constant value, independent on the intensity of incident light. For higher intensity of the incident radiation, the relation is no more constant, and transmittance becomes dependent on the input energy according a non-linear behavior: The transmitted light is lower than expected, and the material tends to become opaque or nearly-opaque to the electromagnetic radiation. The threshold beyond which the optical limiting behavior manifests itself is a characteristic of the material. The literature describes many optical limiting materials: organic molecules like for instance porphyrins and phtalocyanines, whose nonlinear optical properties can be tuned by modifying the molecular structure [1], and other systems, where the nonlinear effect is observed also inserting the organic molecules as dopants in solid matrices like glass or resin [2], bulk solids, e.g., semiconductors like zinc selenide and zinc sulphide [3], liquid crystals [4], and an extremely large number of nanoparticles (metal-, semiconductor- and insulating materials-based) showing various morphologies and both suspended in liquids and inserted in solid matrices; see for instance References [5,6,7,8] and references therein. If systems based on nanoparticles are concerned, the numerous family of carbon allotropes has been object of a great interest [9,10,11], from early works on fullerenes in Nineties [12,13,14], where optical nonlinearity of these nanoparticles was firstly assessed. In most cases, nanoparticles were dispersed in fluids (producing the so-called nanofluids [15], i.e., fluids where nanometer-sized particles are suspended to change the functional properties of base fluid). The interest in these systems is rising every day and for an increasingly wider range of applications, thanks to the impetuous development of nanotechnology making available ever new nanoparticles and developing techniques to disperse them in fluids with improved stability.
Single Walled Carbon NanoHorns (SWCNHs) are a peculiar type of carbon nanoparticles discovered in 1999 by S. Ijima [16]. Their typical structure consists of a single graphene sheet wrapped in a horn shape, with 30–50 nm length and 2–5 nm diameter. The appealing characteristics of SWCNHs lies in their non-toxic or non-carcinogenic characteristics [17], unlike other carbon nanoparticles like, e.g., nanotubes, opening many possible applications for these nanomaterials, such as biosensing, drug delivering, gas storage and direct sunlight absorbers in thermal solar collectors [18,19,20]. Very recently, we studied optical limiting in SWCNHS as a function of the sample morphology, surfactant use and concentration [21], identifying correlations among OL characteristics, dominant OL mechanisms (reverse saturable absorption and nonlinear refraction) and parameters of the samples. The present work reports on the optical limiting obtained in SWCNH aqueous suspensions prepared by simple sonication. The obtained effect is particularly strong at 355 nm wavelength, thanks to the massive bubble production in the irradiated nanofluid. This opens a further, promising future application of aqueous nanofluids containing SWCNHs in direct solar steam generation and solar desalination.
2. Experimental
The suspension was prepared by Ultrasonic Innovation S.r.l., Italy, sonicating dahlia-type SWCNHs (provided by Carbonium S.r.l., Italy; see References [19,22] for TEM and SEM images of dry powders) in distilled water, at the concentration of 0.13 g/L (150 W sonication power, 90 s processing time). Then, the concentrations of 0.025 g/L and 0.05 g/L studied in the present work were obtained by proper dilution with distilled water. For diagnostic purposes, both particle size and spectral optical transmittance in the linearity regime were measured, using a Malvern Zetasizer Nano ZS based on the DLS (dynamic light scattering) and a double-beam ultraviolet-visible (UV–VIS) spectrophotometer (Lambda900 by PerkinElmer) with a variable length cell, respectively. Cell length was adjusted via calibrated spacers starting from an optical path of 50 µm to 1 mm, and transmittance was calculated taking into account the Lambert-Beer law [23,24]. The high intensity light irradiation experiments have been performed with a pulsed nanosecond Nd:YAG laser as light source (Quantel Q-smart 850, which emits 6 ns pulses on the fundamental, second and third harmonics, i.e., at 1064, 532 and 355 nm wavelength) see Supplementary Materials. The three laser emission wavelengths, once spatially separated by beam splitters and filters, were then focused on the sample, which was contained in a 10-mm path quartz cuvette. The beam, once passed through the sample, was focused on a pyroelectric detector (Ophir PE25C). The energy incident on the sample was adjusted via proper motorized polarizer beam splitters controlled by software. The power impinging on the sample is measured using a pyroelectric detector (Ophir PE50BF) located after a beam splitter on the reference beam and using a calibration file in order to take into account the reflection/transmission of the beam splitter itself. Picture and scheme of the experimental apparatus are reported in a previous report [25].
3. Results and Discussion
Diagnostic measurements were firstly carried out on the samples. Transmittance measurements did not evidence anomalous intensity and shape of the plasmonic peak of SWCNHs. From transmittance spectra, we obtained the spectral extinction coefficient (Figure 1), referred to low input light intensity, as in the definition which is usual in the literature. Mean dimensions of aggregates, measured by DLS, were 336 ± 10 nm; see Figure 2 for the size distribution.
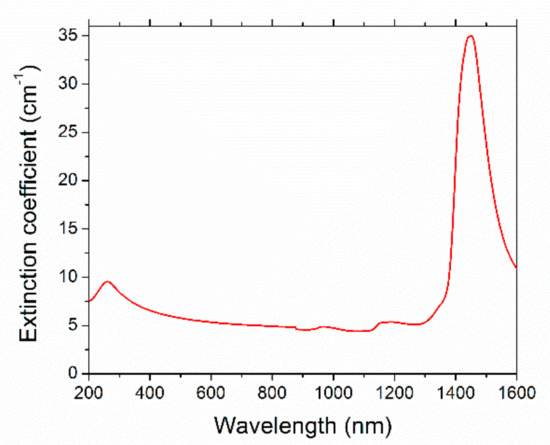
Figure 1.
Spectral extinction coefficient of the sample with 0.13 g/L concentration. The experimental uncertainty on the extinction coefficient is 2%.
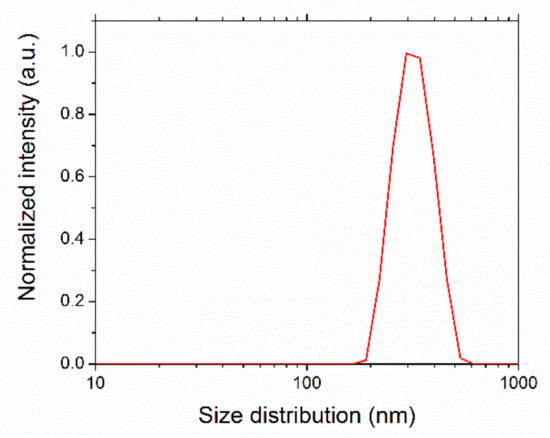
Figure 2.
Size distribution measured on the sample with 0.13 g/L concentration.
A useful way for evaluating the optical limiting properties is in terms of the normalized transmittance Tn, defined as the output/input energy ratio, normalized at its maximum value, i.e., to the linear value. If such Tn is plotted as a function of the input energy, the linearity regime is visually represented by a constant line around unity and parallel to abscissa axis, while the occurring of optical limiting is marked by a trend deviating from this line, towards Tn values smaller than unity. Normalized transmittance for the 0.025 g/L concentration sample, as a function of the input energy, is shown in Figure 3 for the three investigated wavelengths. From the Figure, it is possible to identify the linearity region, below 1 mJ incident energy, where Tn value is about unity, the optical limiting regime, where Tn is lower than unity and monotonically decreases with increasing input energy, and finally, for the 1064 nm wavelength and input energies larger than 6 mJ, also a region of optical damage where the normalized transmittance starts to increase again with increasing input energy, due to the nanoparticle settling.
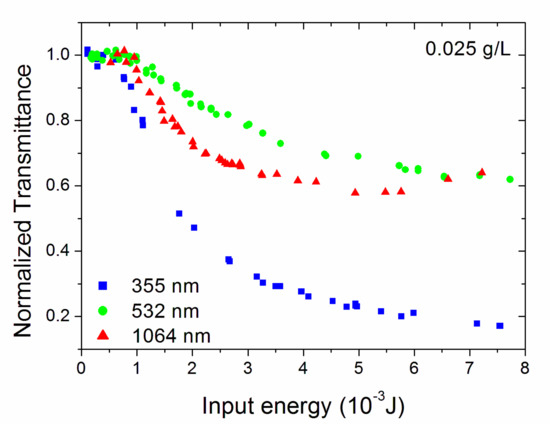
Figure 3.
Normalized transmittance Tn for the 0.025 g/L-concentrated sample. The experimental uncertainty on the measured input and output energies is 2.5%, 5% on the normalized transmittance Tn.
Similar experiments were carried out at a higher concentration, 0.05 g/L. However, in this case, the light at 355 nm transmitted in the 10-mm path cell was not detectable by our setup, due to the high optical absorption at this wavelength located nearer to the typical plasmonic peak of SWCNHs at 260 nm. Therefore, the nonlinear characterization of the sample with 0.05 g/L concentration was possible only at 532 nm and 1064 nm. Optical limiting was found at both wavelengths. Table 1 shows the minimum obtained relative transmittance. Data show that optical limiting is more powerful (i.e., a lower relative transmittance is obtained) at lower wavelengths, due to the larger value of the linear extinction coefficient.

Table 1.
Obtained minimum transmittances at different wavelengths.
The basic mechanisms producing optical limiting in colloidal suspensions are nonlinear absorption and nonlinear scattering [26] and depend on the nature of both the components of the nanofluid (nanoparticles and fluid) [12]. Semi-empirical models can help in the identification of the effect actually occurring. Different effects can produce the nonlinear absorption (NA), e.g., reverse saturable absorption, two-photon absorption, etc. [12]. NA can be semi-empirically modelled adding a quadratic term in the Lambert-Beer’s law [14]:
being F(z) the energy fluence at the z position in the sample, the linear extinction coefficient, the Excited State Absorption (ESA) cross section. This equation can be solved as described in [27,28], obtaining a relationship which gives the energy exiting the nanofluid Eout as a function of the incident energy Ein,
With the following meaning of symbols: : a coefficient connected with the reflection of the cuvette walls; L: thickness of sample; : the optical extinction according to Lambert-Beer’s law; : threshold energy (here defined as the energy where the transmittance falls to the 90% of its original value [14]). The described model will be labelled as NL-LB in the remaining of this work.
If nonlinear refraction is concerned, Reference [29] shows a suitable modelling approach, which will be identified with the MMJ label in the following. The cited paper attributes the nonlinear behavior to nonlinear scattering of photons by the vapor bubbles which are formed as a consequence of vaporization of the base fluid surrounding the nanoparticle and/or of nanoparticles ionization and sublimation:
The meaning of symbols in Equation (3) is the following: αe: nonlinear extinction coefficient; Et: threshold energy for the formation of bubbles. These parameters are both obtained from a fit of experimental data.
As reported (see Figure 4 showing the behavior of the sample with 0.0025 g/L concentration, probed by the at 532 nm wavelength), when optical limiting is not strong, both models equally fit the experimental data. The obtained energy threshold values are (1.1 ± 0.1) ×10−3 J for NL-LB and (4.0 ± 0.2) ×10−4 J for MMJ. On the contrary, in case of a stronger optical limiting, typically the NL-LB model reproduces the first experimental points deviating from linearity, and the MMJ approach reconstructs the data points at higher energies, as reported in Figure 5, showing the sample at 0.005 g/L concentration, for the same 532 nm incident wavelength. Figure 5b enlarges the view on the first experimental points. Thus, from Figure 5b, it is possible to see that the NL-LB model reproduces the experimental trend at lower input energy values more precisely, while the MMJ model would be more appropriate at higher input ranges (see Figure 5a). For this particular case, the MMJ model turns out to be not statistically acceptable due to the poor data reconstruction at low input energies.
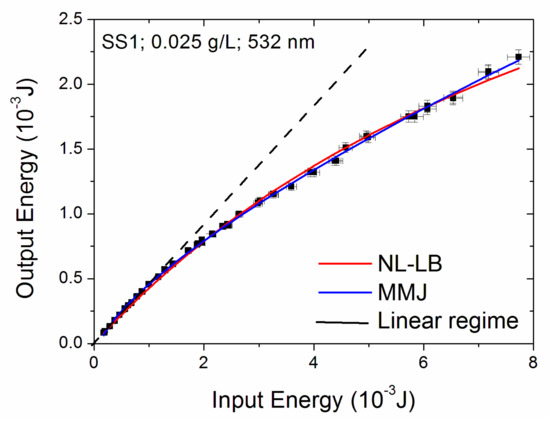
Figure 4.
Fit of NL-LB and MMJ models on optical limiting curve of the lowest concentration sample at 532 nm laser wavelength. The dashed black line is only a visual reference for linearity. The experimental uncertainties on the measured energies is also shown in the plots.
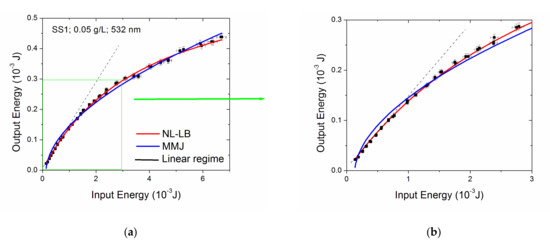
Figure 5.
Data fitting for the most concentrated sample and 532 nm wavelength. The first points in (a) are depicted larger in the plot (b). In both plots, the dashed black line represents the linearity reference.
The values of the obtained parameters for the investigated cases, fixed to 5% the statistical confidence level of fitting, are listed in Table 2, showing the threshold energy values Et (Equations (2) and (3)) and αe/α ratio (Equation (3)), respectively. For the lowest concentration sample at 532 nm and for the highest concentration suspension at 1064 nm wavelength, the fitting with both models was possible. In this case, the NL-LB threshold is higher than the MMJ one at 532 nm, while at 1064 nm the reverse is true, suggesting that the dynamic interplay of electronic and interaction effects is strongly wavelength dependent, in agreement with previous findings [21]. When the sample is subjected to irradiation by 355 nm light, no models fit. In this case, the optical limiting is particularly strong (Figure 6), and the output energy remains nearly constant, irrespective on the input energy, for input energy values above a certain threshold. The observed phenomenon is similar to that previously reported for graphite/nanodiamond mixtures dispersed in ethylene glycol [25]. This behavior is likely due to a heavy nonlinear scattering due to a significant bubble production in the sample, stronger than the case described by the MMJ equation.
Table 2.
Energy Threshold values obtained from fitting with both models and αe/α ratio obtained from the MMJ model.
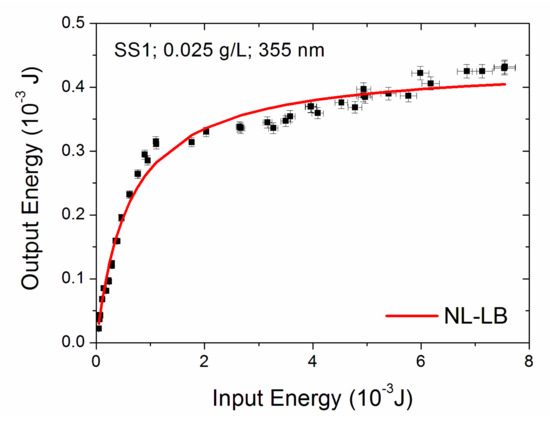
Figure 6.
Strong OL obtained in the 0.025 g/L concentration sample and with 355 nm laser wavelength. The NL-LB equation (continuous curve) is not able to reproduce the experimental data. Neither the MMJ model can be applied due to lack of convergence with this dataset.
Bubbles production in nanofluids containing carbon nanoadditives has been often theorized in literature but not documented except very recent cases, investigated by our group [21,25]. A video recording of the remarkable bubble formation in the 0.025 g/L sample under 355 nm incident radiation can be found in the additional material which accompanies the present work. Bubbles were seen mainly at 355 nm and, secondly, at 532 nm, while no bubble production was recorded at 1064 nm, despite that, for both samples, the fitting of experimental data at this wavelength by the MMJ model was possible. This definitely points out the high sensitivity of the fitting method to capture the phenomena occurring. In fact, as noticed above, under 1064 nm radiation, the samples were quickly damaged. Therefore, it is reasonable to hypothesize that the amount and sizes of produced bubbles, at the accessible input powers below the sample damage threshold, remained well below the visibility at the naked eye.
Comparing the samples described in the present work to the SWCNH suspensions previously investigated [21], we obtained in the present case a stronger optical limiting and a higher bubble production. In agreement with the optical limiting trend previously evidenced as a function of the size of nanoparticle clusters, we could attribute the stronger OL properties of the present samples to the larger dimensions of their aggregates (336 nm versus the 202 nm, which was the largest size investigated in Reference [21]), thus confirming the dominant role of aggregates size in comparison to other sample parameters.
The characterization of the described SWCNH suspensions points out two main fields of application for the tested nanofluids. In general, as previously mentioned, the primary application of an OL material is the protection of optical sensors, eyes and every device which could be damaged if hit by high intensity electromagnetic radiation. The bespoke nonlinear behavior is useful in all cases where a threshold of energy exists, which is dangerous to exceed, while, at the same time, at lower intensities the radiation must be transmitted through the material. Optical limiting phenomena allow to separately and independently manage these two regimes, while providing, at the same time, a real-time reaction.
Another application where the knowledge of nonlinear optical transmittance of colloidal suspensions is required is when these suspensions are required to interact with high-intensity concentrated sunlight, like in direct solar steam production and solar desalination. These systems exploit the high optical absorption of nanoparticles dispersed in water, which is much higher than that of the pure fluid and makes them to act as localized heat sources within the fluid volume. The efficient and localized nanoparticle heating by light absorption is able to bring to vaporization the surrounding layers of liquid with negligible heat exchange towards the bulk fluid volume. These systems can be designed to work efficiently only if the nonlinear optical transmittance of involved nanofluids is known, which is the goal of the present work.
Several technological fields can take advantage from this application, being steam one of the most used industrial fluids both for electricity or work production and for cleaning or sterilization purposes (medical waste and surgical parts, food and beverage industry, etc.) In order to maintain low production costs, most of the industrial steam is produced in large boilers. The high efficiency of solar-powered steam generators could allow economically favorable processes to be carried out even on a much smaller scale. In addition, solar-enabled steam generation can be highly advantageous in developing countries, e.g., to sterilize medical instruments in remote and off-grid areas.
Other potential uses of a solar steam generator could be identified in the powering of hybrid systems of air conditioning and heating or for desalination and water purification. The latter is based on the membrane distillation method, where heated salted water passes through a porous membrane: the water vapor passes through the membrane and collects in form of purified water. In order to improve the efficiency of the system, nanoparticles can be used to harvest solar radiation more efficiently, thus making the water evaporate faster while reducing the external power needed by the whole system.
4. Conclusions
In this work, industrial dahlia-type Single Walled Carbon Nano Horns, were sonicated in order to obtain a dark nanofluid with distilled water as base fluid, at the concentrations of 0.025 g/L and 0.05 g/L. The optical properties of the nanofluid were characterized in terms of transmittance and optical limiting behavior. We demonstrated broadband optical limiting properties of both concentrations of ultrasonicated suspensions of SWCNH at three different wavelengths (355, 532 and 1064 nm), with bubble production being the dominant nonlinearity mechanism involved, in particular at 355 and 1064 nm wavelengths, in agreement with previous findings [21]. The lack of wavelength selectivity of the evidenced nonlinear behavior (at least from UV-355 nm- to near-infrared-1064 nm-, in the whole range experimentally available in the present work) is a major force point of these investigated materials, proving a flexibility able to increase their possible applications both in the field of laser safety for science and defense and in the field of energy.
The obtained optical limiting was particularly strong at 355 nm wavelength, due to a massive bubble production under laser irradiation. The observed strong effect, correlated with the size of nanohorn aggregates, allows confirming the dominant role the aggregates size parameter in the light-induced generation of bubbles and opening further challenges for the development of more performing nanofluids characterized by an optimized tradeoff between bubble production efficiency and thus larger size of dispersed nanoadditive and overall nanofluid stability.
In this regard, it should be noticed that an efficient bubble production is a key factor for a possible future application of this type of systems in renewable energy, in particular, as direct solar-absorbing medium for direct steam production and solar desalination. In fact, the present work also shows that the energy densities needed to initiate and sustain the light-induced bubble production are compatible with existing solar concentrating collectors, e.g., parabolic-mirror types.
Supplementary Materials
The following are available online at https://www.mdpi.com/article/10.3390/en14082074/s1. Video S1: Video recording of bubble generation by the sample with 0.025 g/L concentration under 355 nm light irradiation.
Author Contributions
Conceptualization and methodology, E.S.; optical property measurements, N.P., L.M., E.S.; numerical analysis and modelling, A.D.; writing, E.S. All authors have read and agreed to the published version of the manuscript.
Funding
This research has been partially funded by the Italian bank foundation “Fondazione Cassa di Risparmio di Firenze” in the framework of the I-SOLAR project (Pratica n. 2020.1728).
Institutional Review Board Statement
Not applicable.
Informed Consent Statement
Not applicable.
Data Availability Statement
Data will be made available upon reasonable request to the corresponding author.
Acknowledgments
Thanks are due to Cesare Pagura (CNR-ICMATE) for providing the samples, Stefano Rossi (CNR-ITC) for some of the DLS measurements and to M. D’Uva and M. Pucci (CNR-INO) for technical support.
Conflicts of Interest
The authors declare no conflict of interest.
References
- Calvete, M.; Yang, G.Y.; Hanack, M. Porphyrins and phthalocyanines as materials for optical limiting. Synth. Met. 2004, 141, 231–243. [Google Scholar] [CrossRef]
- He, G.S.; Gvishi, R.; Prasad, P.N.; Reinhardt, B.A. Two-photon absorption based optical limiting and stabilization in organic molecule-doped solid materials. Opt. Commun. 1995, 117, 133–136. [Google Scholar] [CrossRef]
- Van Stryland, E.W.; Wu, Y.Y.; Hagan, D.J.; Soileau, M.J.; Mansour, K. Optical limiting with semiconductors. J. Opt. Soc. Am. B 1988, 5, 1980–1988. [Google Scholar] [CrossRef]
- Khoo, I.C.; Michael, R.R.; Finn, G.M. Self-phase modulation and optical limiting of a low-power CO2 laser with a nematic liquid-crystal film. Appl. Phys. Lett. 1988, 52, 2108–2110. [Google Scholar] [CrossRef]
- Sun, Y.P.; Riggs, J.E.; Rollins, H.W.; Guduru, R. Strong optical limiting of silver-containing nanocrystalline particles in stable suspensions. J. Phys. Chem. B 1999, 103, 77–82. [Google Scholar] [CrossRef]
- Venkatram, N.; Rao, D.N.; Akundi, M.A. Nonlinear absorption, scattering and optical limiting studies of CdS nanoparticles. Opt. Express 2005, 13, 867–872. [Google Scholar] [CrossRef]
- Yu, X.L.; Cao, C.B.; Zhu, H.S.; Li, Q.S.; Liu, C.L.; Gong, Q.H. Nanometer-Sized Copper Sulfide Hollow Spheres with Strong Optical-Limiting Properties. Adv. Funct. Mater. 2007, 17, 1397–1401. [Google Scholar] [CrossRef]
- Porel, S.; Singh, S.; Harsha, S.S.; Rao, D.N.; Radhakrishnan, T.P. Nanoparticle-embedded polymer: In situ synthesis, free-standing films with highly monodisperse silver nanoparticles and optical limiting. Chem. Mater. 2005, 17, 9–12. [Google Scholar] [CrossRef]
- Sun, X.; Yu, R.Q.; Xu, G.Q.; Hor, T.S.A.; Ji, W. Broadband optical limiting with multiwalled carbon nanotubes. Appl. Phys. Lett. 1998, 73, 3632. [Google Scholar] [CrossRef]
- Riggs, J.E.; Walker, D.B.; Carroll, D.L.; Sun, Y.P. Optical limiting properties of suspended and solubilized carbon nanotubes. J. Phys. Chem. B 2000, 104, 7071. [Google Scholar] [CrossRef]
- Nashold, K.M.; Walter, D.P. Investigations of optical limiting mechanisms in carbon particles suspensions and fullerene solutions. J. Opt. Soc. Am. B 1995, 12, 1228. [Google Scholar] [CrossRef]
- Tutt, W.L.; Kost, A. Optical limiting performance of C60 and C70 solutions. Nature 1992, 356, 225–226. [Google Scholar] [CrossRef]
- Kost, A.; Dougherty, T.K.; Elias, W.E.; Tutt, L.; Klein, M.B. Optical limiting with C 60 in polymethyl methacrylate. Opt. Lett. 1993, 18, 334–336. [Google Scholar] [CrossRef]
- Vincent, D.; Cruickshank, J. Optical limiting with C 60 and other fullerenes. Appl. Opt. 1997, 36, 7794–7798. [Google Scholar] [CrossRef]
- Choi, S.U.; Eastman, J.A. Enhancing Thermal Conductivity of Fluids with Nanoparticles (No. ANL/MSD/CP-84938; CONF-951135-29); Argonne National Laboratory: Lemont, IL, USA, 1995. [Google Scholar]
- Iijima, S. Helical microtubules of graphitic carbon. Nature 1991, 354, 56–58. [Google Scholar] [CrossRef]
- Miyawaki, J.; Yudasaka, M.; Azami, T.; Kubo, Y.; Iijima, S. Toxicity of Single-Walled Carbon Nanohorns. ACS Nano 2008, 2, 213–226. [Google Scholar] [CrossRef]
- Zhu, S.; Xu, G. Single-Walled carbon nanohorns and their application. Nanoscale 2010, 2, 2538–2549. [Google Scholar] [CrossRef] [PubMed]
- Sani, E.; Barison, S.; Pagura, C.; Mercatelli, L.; Sansoni, P.; Fontani, D.; Jafrancesco, D.; Francini, F. Carbon nanohorns-based nanofluids as direct sunlight absorbers. Opt. Express 2010, 18, 5179–5187. [Google Scholar] [CrossRef]
- Bortolato, M.; Dugaria, S.; Agresti, F.; Barison, S.; Fedele, L.; Sani, E.; Del Col, D. Investigation of a single wall carbon nanohorn-based nanofluid in a full-scale direct absorption parabolic trough solar collector. Energy Convers. Manag. 2017, 150, 693–703. [Google Scholar] [CrossRef]
- Sani, E.; Papi, N.; Mercatelli, L.; Barison, S.; Agresti, F.; Rossi, S.; Dell’Oro, A. Optical limiting of carbon nanohorn-based aqueous nanofluids: A systematic study. Nanomaterials 2020, 10, 2160. [Google Scholar] [CrossRef]
- Sani, E.; Mercatelli, L.; Barison, S.; Pagura, C.; Agresti, F.; Colla, L.; Sansoni, P. Potential of carbon nanohorn-based suspensions for solar thermal collectors. Sol. Energy Mater. Solar Cells 2011, 95, 2994–3000. [Google Scholar] [CrossRef]
- Sani, E.; Dell’Oro, A. Optical constants of ethylene glycol over an extremely wide spectral range. Opt. Mater. 2014, 37, 36–41. [Google Scholar] [CrossRef]
- Sani, E.; Dell’Oro, A. Spectral optical constants of ethanol and isopropanol from ultraviolet to far infrared. Opt. Mater. 2016, 60, 137–141. [Google Scholar] [CrossRef]
- Sani, E.; Papi, N.; Mercatelli, L.; Żyła, G. Graphite/diamond ethylene glycol-nanofluids for solar energy applications. Renew. Energy 2018, 126, 692–698. [Google Scholar] [CrossRef]
- Hagam, D.J.; Xia, T.; Said, A.A.; van Stryland, E.W. Tandem Limiter Optimization. SPIE Proc. 1994, 2229, 179–190. [Google Scholar]
- Pritchett, T. Models for Saturable and Reverse Saturable Absorption in Materials for Optical Limiting; Army Research Laboratory: Adelphi, MD, USA, 2002; Volume 2567. [Google Scholar]
- Vincent, D. Optical limiting threshold in carbon suspension and reverse saturable absorber materials. Appl. Opt. 2001, 40, 6646–6653. [Google Scholar] [CrossRef]
- McEwan, K.J.; Milsom, P.K.; James, D.B. Nonlinear optical effects in carbon suspension. SPIE Proc. 1998, 3472, 42–52. [Google Scholar]
Publisher’s Note: MDPI stays neutral with regard to jurisdictional claims in published maps and institutional affiliations. |
© 2021 by the authors. Licensee MDPI, Basel, Switzerland. This article is an open access article distributed under the terms and conditions of the Creative Commons Attribution (CC BY) license (https://creativecommons.org/licenses/by/4.0/).