Article

The Effects of Hydropower Plants on the Physicochemical Parameters of the Bystrzyca River in Poland

by
Paweł Tomczyk
* and
Mirosław Wiatkowski
Institute of Environmental Engineering, Wroclaw University of Environmental and Life Sciences, pl. Grunwaldzki 24, 50-363 Wrocław, Poland
*
Author to whom correspondence should be addressed.
Energies 2021, 14(8), 2075; https://doi.org/10.3390/en14082075
Submission received: 12 February 2021 / Revised: 31 March 2021 / Accepted: 5 April 2021 / Published: 8 April 2021
(This article belongs to the Special Issue A New Water-Energy Nexus: The Transition to Sustainable Energy)

Abstract

:
Currently, the literature lacks comprehensive studies on the impact of hydropower plants (HPs) on the environment, including studies focused on the physicochemical parameters of water. The aim of the article is to verify the current state of knowledge on the impact of run-of-river HPs on 17 physicochemical parameters of water. The article is in line with the recommendations of the European Union that the member states, under the common energy policy, should increase the share of renewable energy sources in the energy and perform environmental impact assessments of such facilities. As a result of the analysis carried out on three HPs (Sadowice, Skałka and Marszowice) located on the Bystrzyca River (a tributary of the Odra River in Poland), it was found that HPs affect the selected physicochemical parameters of the water, i.e., (p < 0.05): electrolytic conductivity (EC; Skałka, Marszowice HPs), pH (Skałka, Marszowice HPs); nitrate nitrogen (NO3-N; Marszowice HP), dissolved oxygen (DO; Marszowice HP) and ammonium nitrogen (NH4-N; Marszowice HP). The largest (>5%), statistically significant mean cumulative effect below Marszowice HP concerned NH4-N (−27.83%), DO (+14.04%) and NO3-N (+5.50%). In addition, it was observed that the effect of HPs increases in direct proportion to the damming height, and that run-of-river HPs have a lesser impact on the physicochemical parameters’ values than in storage HPs. Our results were in accordance with those of other scientists in terms of the increase in DO, the decrease in EC, and the decrease in total phosphorus concentrations below HPs.

1. Introduction

The demand for hydropower will increase due to the search for renewable energy sources. It is estimated that, within 40 years, the share of hydropower will increase to 50% (currently being 15.6% of installed capacity) [1]. The current hydropower potential is 51.677 TWh per year, 48% of which is in Asia (South America—19%, Africa—15%, North America—13%, Europe—4%, Australia and Oceania—1%) [2]. In 2019, the most electricity from hydropower plants (HPs) per person was used by Iceland (40.087 kWh), Norway (24.411 kWh), Canada (10.088 kWh), Bhutan (9.991 kWh), and Paraguay (8.482 kWh), respectively [3]. In addition, there was an increase in installed capacity of HPs by 1.2% compared to the previous year, with the newest installed capacity corresponding to Brazil (4919 MW), China (4170 MW), and Laos (1892 MW) [4]. The development of hydropower is influenced by natural, social, and economic factors, as well as the hydropower potential of various regions (economic profitability and technical feasibility) and climate change [5,6,7].
Research on the influence of HPs on individual elements of the environment has been carried out by several scientists. The main focus was on impacts on aquatic organisms (mainly ichthyofauna and invertebrates) and the functioning of water-related ecosystems [8,9,10,11,12,13], hydrological conditions below damming structures [14,15,16,17], transport and composition of bottom sediments, accumulation and erosion processes [18,19,20,21], hydromorphological conditions [22,23,24,25,26], water quality [27,28,29,30], and social and economic issues [31,32,33,34,35,36].
When locating new projects in the field of hydropower, it is important to remember to minimize potential impacts [37]. Such methods are, for example, fish ladders to keep rivers open for aquatic organisms [38,39], but also to take into account environmental flows related to the quality, quantity and timing of freshwater flows necessary to maintain the balance of aquatic ecosystems, which in turn provide important ecosystem services [16,40,41,42]. Including such solutions is important both in documents regulating the operation of HPs, as well as in international environmental policies [5,43,44]. This is for the rational use of environmental resources, in accordance with the principles of sustainable development [11,45,46].
The main emphasis in this article is on the study of physicochemical elements that make up water quality. Previous analyses by scientists in this area, however, usually concerned HPs established on water reservoirs, and not run-of-the-river power plants (e.g., [47,48,49,50]) or dams only, without HPs (e.g., [51,52,53,54,55]). The influence of run-of-river HPs on the physicochemical parameters of water was investigated, for example, in Spain [56,57] and Brazil [58]. Therefore, it is a still undiscovered topic that allows for the performance of a series of new analyses and the determination of trends in changes in these parameters.
So far, in terms of changes in the physicochemical parameters of water within HPs, regardless of their type, the following phenomena have been distinguished: supersaturation, changes in thermal conditions, oxygenation and turbidity, phosphorus remobilization, reductions in some minerals, and trophic changes [30,59].
As a result of research conducted so far on the operation of HPs, below the structure, the phenomenon of hydraulic recoil is noticeable, i.e., the formation of rotary motion as a result of a significant increase in the flow velocity (caused by the difference in the damming height) [60]. This phenomenon causes the mixing of water masses and changes in water stratification, which is intensified especially in the case of the location of HPs in front of water reservoirs or in water reservoirs located in a cascade [61,62]. The phenomenon of hydraulic jump, combined with the discharge of water from turbines, is responsible for changes in thermal conditions, oxygenation, phosphorus remobilization, and reductions in mineral compounds [59]. Changes in thermal conditions concern reductions in temperature amplitudes in rivers below the HP and in reservoirs, where there is usually a lower temperature and disturbance of thermal stratification (especially in tropical zones) [63,64,65]. In stratified reservoirs, anaerobic, lower layers of water are activated, which deteriorates the aerobic conditions; such a phenomenon is not noted in rivers, where, due to the vortex movement, oxygenation may be even higher than above HPs [66]. Additionally, in reservoirs, there is the release of phosphorus from the lower layers of waters, responsible for the phenomenon of eutrophication, as well as the release of toxic hydrogen sulphide [67]. The combination of lower temperature, lower oxygen content, and the activation of phosphorus and hydrogen sulphide causes deterioration of habitat conditions for organisms found in reservoirs below HPs [68,69]. It can be concluded that, so far, in the case of rivers, this impact is ambiguous.
The second phenomenon influencing the changes in the physicochemical parameters of water is the accumulation of bottom sediments on dams and above HPs [70]. This is due to the slowing down of the water flow velocity and, consequently, a reduction in the rivers’ ability to transport sediment. As a result of this phenomenon, there are changes in water turbidity and trophic changes within hydropower structures. For example, it is estimated that about 15% of the river phosphorus load is above dams [71], which causes large changes in the conditions for aquatic life and the functioning of water-related ecosystems, as well as the processes of accumulation and erosion of the river below hydropower [72,73].
A separate issue is the phenomenon of supersaturation, occurring mainly in HPs located in a cascade of water reservoirs. This happens when flood waters circulate and large amounts of water are discharged between reservoirs, which causes a rapid increase in thehydrodynamic pressure (higher than atmospheric) and the saturation of water with oxygen up to the limit of solubility [74]. As a result of these changes, caused by the pursuit of pressure equilibrium between the centres, air bubbles appear. This has a major impact on aquatic organisms, which can die off massively due to the rapid change in blood pressure caused by escaping bubbles, blocking blood vessels (bubble disease, barotrauma) [75]. With regard to the physical chemistry of water, the phenomenon of supersaturation may be accompanied by an increase in the concentration of dissolved elements, mainly aluminium, iron, cobalt, and titanium [76].
The aim of this article is to verify the current state of knowledge on the impact of run-of-river HPs located on the Bystrzyca River (a tributary of the Odra River located in southwestern Poland) on the physicochemical parameters (oxygen conditions, nutrients and minerals, physical parameters) of the waters. The relationships between individual water quality parameters, types, and specificity of HPs (depending on their damming height and whether they are run-of-river or storage) were also analysed in detail. Another variable which took into account in this case is the location of hydropower structures in natural or human-transformed areas. So far, no comprehensive research has been conducted on the impact of run-of-river HPs on the physicochemical conditions of water. In addition, such analyzes did not take into account other factors that may have a potential impact on the variability of physicochemical parameters (e.g., socio-economic issues or other environmental impacts).

2. Materials and Methods

2.1. Field Studies

The research was carried out on the Bystrzyca River, located in Central Europe, in south-western Poland (Dolnośląskie Voivodeship). The Bystrzyca River is a tributary of the Odra River; it is 101.5 km long, and its catchment area is 1768 km2. It has a lowland character. The field studies took into account the lower course of the river from the town of Kamionna to the mouth of the river in the city of Wrocław (the total length of the research section is over 32 kilometres), diversified in terms of land use (forests, meadows, fields, and urbanized areas). In part of the studied area, there are areas of nature protection, i.e., from point 1 to 10 the research area is located in the Bystrzyca Valley (“Dolina Bystrzycy”) Landscape Park, from point 2 to 10 in the Natura 2000 area “Łęgi nad Bystrzycą” (PLH020103), and in point 1 in the Natura 2000 area “Przeplatki nad Bystrzycą” (PLH020055) [11,26,77,78]. The locations of the measurement and control points are shown in Figure 1, and a detailed summary is given in Table 1.
Laboratory field tests of water quality were carried out over a three-year period, with a monthly frequency, at 12 measuring points within three barrages with HPs. The criterion for selecting the points was the location in relation to the tested HPs—about 50 m above and 50 m below hydropower facilities, as well as in areas remote from the power plant, treated as reference points (the frequency and placement of points was based on the subject literature and various legal acts, e.g., the Water Framework Directive) [28,38,79,80]. The analyses also used five research points at which analyses were performed as part of the national water quality monitoring (1970–2018; the frequency of tests differed at various points; data obtained from the Provincial Inspectorate for Environmental Protection in Wrocław and the State Archives in Wrocław from the archives of the Environmental Research and Control in Wrocław) [81]. Technical data on HPs come from documents obtained from the State Water Management Polish Waters Regional Water Management Authority in Wrocław [82].
Three research objects were selected for the analyses, i.e., the Marszowice, Skałka, and Sadowice HPs on the Bystrzyca River. All of them are located in the riverbed (run-of-river HPs), including two in the created artificial derivative canals (Marszowice and Skałka HPs). All of them are low power (less than 5 MW), low damming (less than 5 m) hydroelectric plants with no fish passes. All of them were built about 100 years ago. Technical details of the described hydropower facilities are presented in Table 2, and photos of the facilities are shown in Figure 2.

2.2. Laboratory Tests

Water samples for field water quality tests were collected with scoops, which were then transferred to plastic bottles and transported in refrigerators to the Environmental Research Laboratory of the University of Life Sciences in Wrocław (Poland). Laboratory analyses were performed up to 24 h after water sampling, using the standard methods listed in Table 3. In the authors’ own research, 10 physicochemical parameters determining the state of chemical, physical, biogenic, and oxygen conditions were determined, and we performed 16 monitoring tests. The methods used are in accordance with ISO standards and documents and legal acts adopted for the monitoring of surface water quality (in the European Union, water quality consists of the ecological state/potential—biological, hydromorphological, and physicochemical elements—and the chemical status of surface waters in surface water bodies) [79,83,84]. Depending on the method used, the measurement error ranged from 0.5% to 5% (DO and EC determinations—0.5%, pH, temperature, turbidity—2.0%, other physicochemical parameters—5%).

2.3. Statistical Analysis

Statistica 13 (Dell, Round Rock, TX, USA), Origin Pro 2021 (OriginLab Corporation, Northampton, MA, USA), SPSS Statistics 26 (IBM, Armonk, NY, USA) were used to compile the results and statistical analyses. We also used Office 2013 (Excel 2013 and Word 2013; Microsoft, Richmond, WA, USA), and, for map creation, QGIS 2.8.4 (QGIS Development Team, Open Source Geospatial Foundation Project).
The article presents statistical analyses (for the significance level p < 0.05):
  • related to basic statistics (Statistica software);
  • boxplots with minimum, maximum, mean, median, 25th and 75th percentiles and outliers (Origin software);
  • Hierarchical cluster analysis (HCA) and principal component analysis (PCA) in the following variants: relationships between research points within the tested physicochemical parameters, physicochemical parameters at each research point, observations within each parameter (Origin software);
  • general linear model (nonparametric): intragroup analysis of variance (ANOVA) for repeated measurements in the following variants: analysis for each parameter separately between eigenvalues on the Bystrzyca river, without point 8 (points 2–7, 9, and 12–15; joint research performed for 24 months; omission of point 8 results from the location in the canal parallel to the main tested watercourse—points 6 and 7; taking this point into account would cause erroneous analysis results), analysis of each HP separately above and below each hydropower facility (points 2 and 3, 6 and 7, 13 and 14; for the Marszowice HP a 36-month period) and taking into account the reference points (points 2, 3 and 4; 6, 7; 12–15—2 years and 13–15—3 years); such a model was chosen due to the number of repeated measurements less than 100, and the fact that in such an analysis the results can be compared in the most reliable way, taking into account their temporal and spatial variability, as well as the impact of each parameter on the results; within the model, the significance for the Mauchly sphericity test was checked and in the case of significance p < 0.05 (sphericity was found), the significance for the Greenhouse‒Geisser test (selected due to its conservativeness) was checked, and then, if the result was significant, a comparison in pairs between points above and below HPs (2 and 3, 6 and 7, and 13 and 14); if the test was found to be aspherical (p > 0.05), the significance for the assumed sphericity was checked, and the subsequent steps were analogous to the above (SPSS software).

2.4. Interpretation and Discussion of the Results

The analysis of the size effects of HPs within the parameters was also analysed. The results from the points above and below hydropower facilities were taken into account (for Skałka and Sadowice HPs, two years; and for Marszowice HP, three years) and the percentage change of a given parameter below HPs for each month was designated by calculating the difference between the points above and below HPs, and then dividing that difference by the result above hydropower. Then a variability plot was plotted, with the minimum, average, and highest values plotted on it. The final result was a table illustrating this variability; it took into account the statistical significance determined from the ANOVA test and the changes were considered significant results if higher than the assumed statistical error, i.e., p = 0.05.
In order to check whether HPs have a positive or negative impact on the state of physicochemical elements, an analysis of water quality was carried out at our own sampling points and points obtained from an institution dealing with environmental monitoring in Poland [81]. In accordance with the classification in force, the parameters were assessed on a three-point scale, i.e., class I (very good condition), class II (good condition), and the condition not corresponding to the standards (NMS) for the 95th percentile of results (including a 5% measurement error). The assessment was carried out for the abiotic type 20 (gravel lowland river), to which the Bystrzyca River belongs in the studied section. The overall assessment of the physicochemical elements takes into account the weakest result achieved. The legal basis is the regulation appropriate in Poland, implementing the assumptions of the Water Framework Directive [79,83].
Within the Sadowice, Skałka, and Marszowice HPs, an analysis was also made of whether the conditions for the life of salmonids and cyprinids were met, based on the relevant legal act specifying the acceptable levels of selected physicochemical parameters [85], and also on the basis of the literature [86,87,88,89,90,91,92,93,94,95,96,97].
An additional analysis, verifying possible factors influencing the physicochemical condition of the Bystrzyca River waters, was taking into account the results of multiyear monitoring studies for selected physicochemical parameters. In this way, the variability of parameter sizes over time was obtained, thanks to which it was possible to draw more detailed conclusions from the analyses performed.
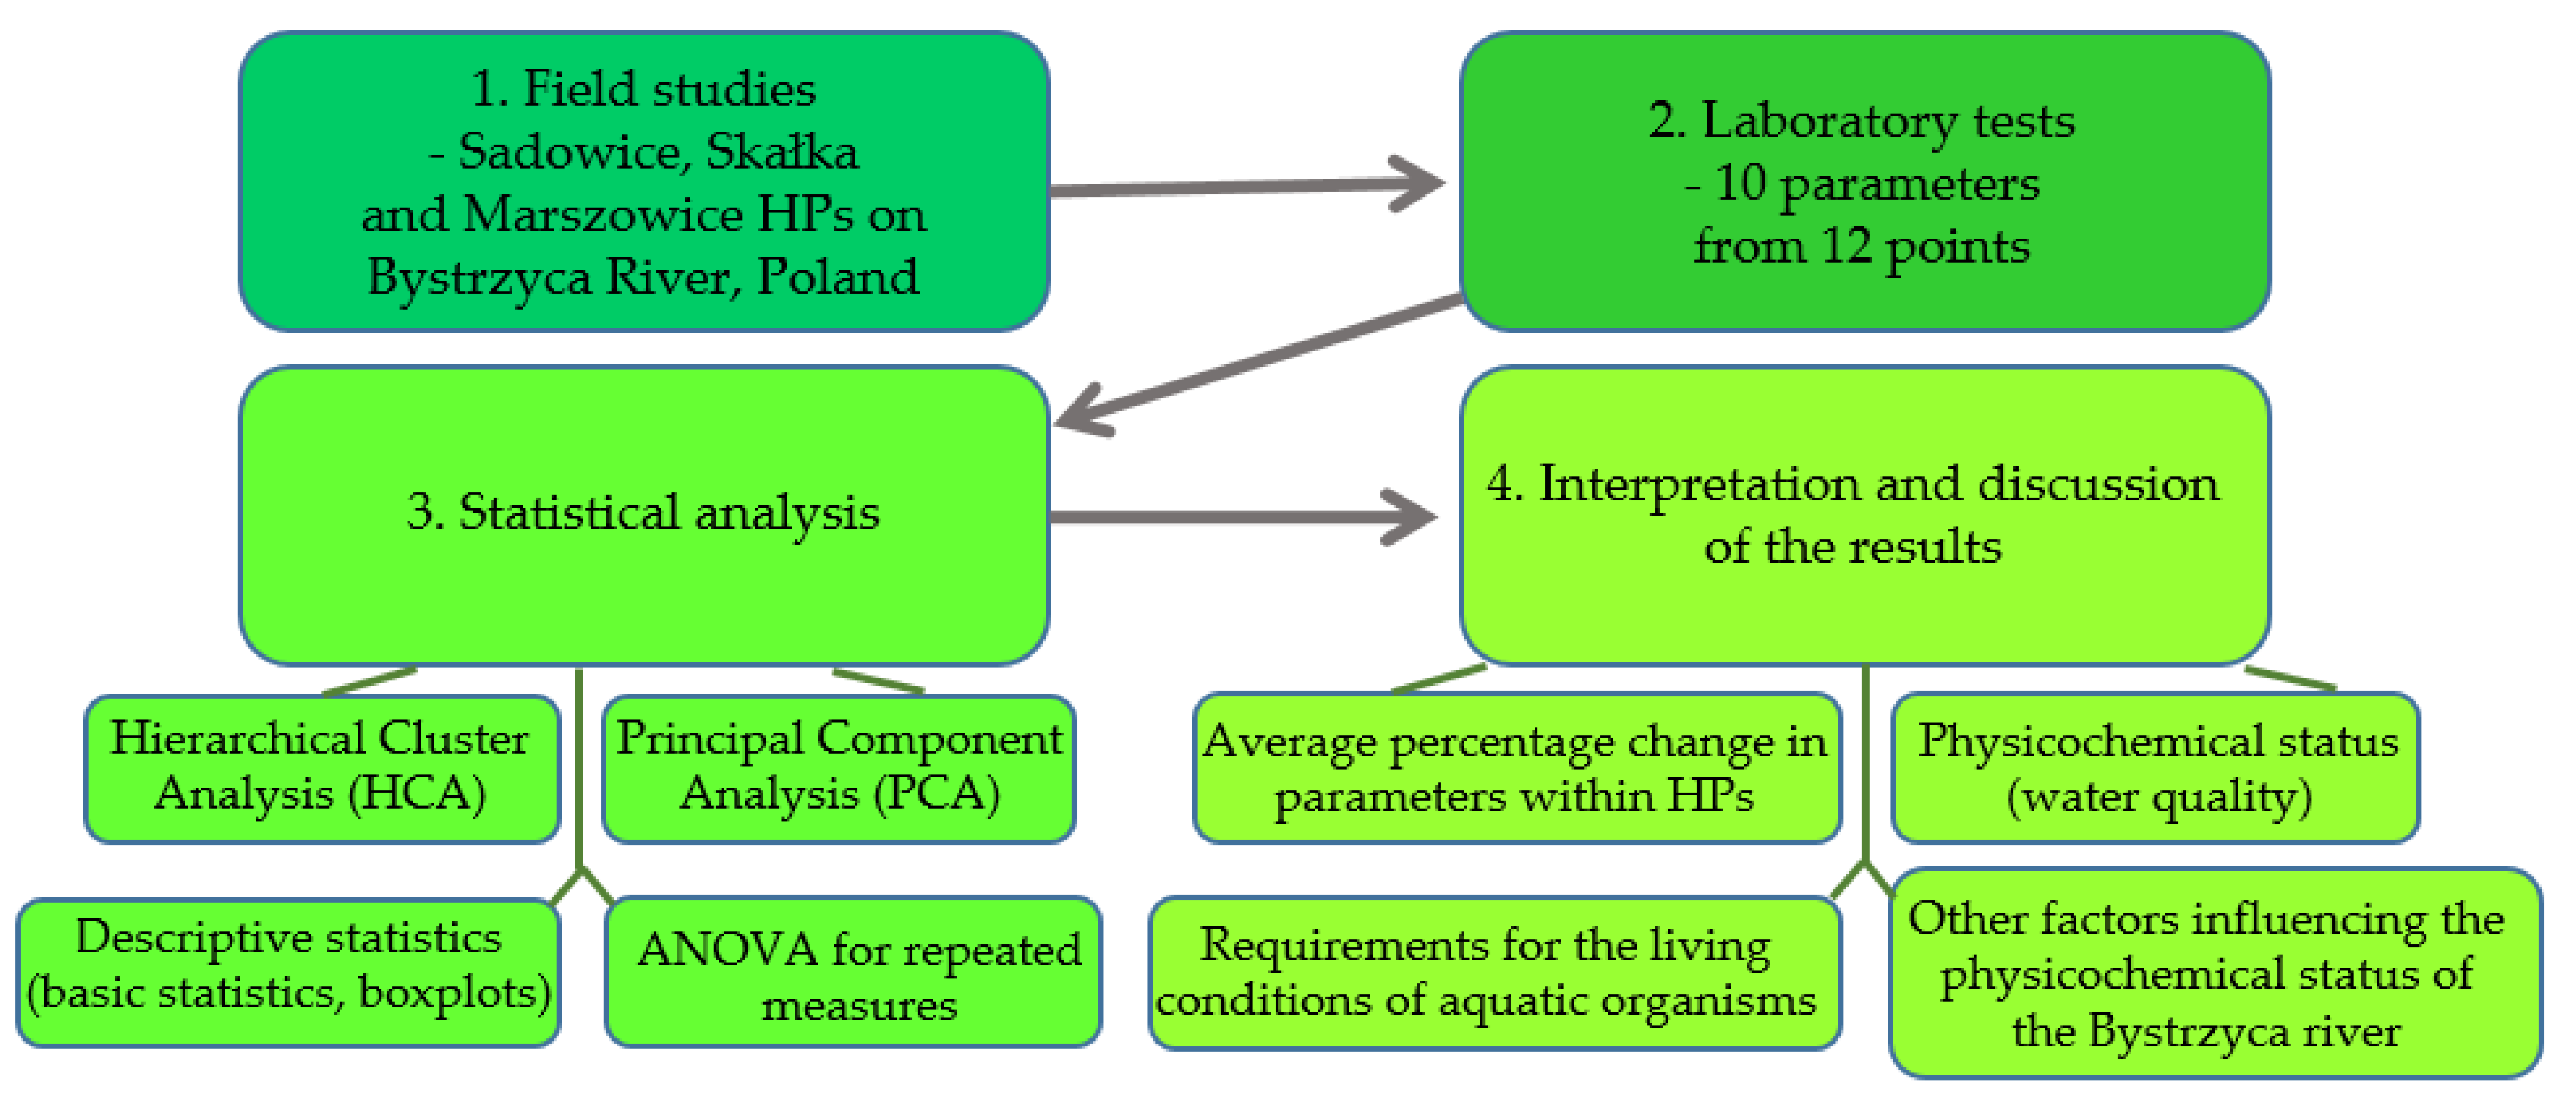
Figure 3 summarizes the research procedure followed in the article.

3. Results and Discussion

3.1. Cumulative Results for Points above HPs, below HPs, and Reference Points

Table 4 presents the results of our research. The points were divided into groups according to their location within hydropower facilities, i.e., above HPs (2, 6, and 13), below HPs (3, 7, and 14), and other points/reference points (4, 5, 8, 9, 12, and 15).
As can be seen in Table 4, the overall results of the individual parameters, divided into the above groups, achieve similar values. The greatest differences, taking into account the median, were recorded for dissolved oxygen (the lowest values above HPs, the highest—below 8.4 and 9.3 mg/L, respectively), NO3-N (the highest value at reference points, the lowest above HPs—1.430 and 1.323 mg/L), NH4-N, turbidity (maximum values above HPs for both parameters), and BOD5 (minimum values above HPs). For pH, conductivity, water temperature, NO2-N, and TP, the median value did not differ or the difference was small between the groups of points.

3.2. Within-Group Analysis of Variance for Repeated Measures—ANOVA

Due to the fact that the baseline analyses do not clearly indicate specific relationships between points, a within-group analysis of variance for repeated measures (ANOVA) was performed. We checked whether the results obtained for individual parameters were statistically significant at the scale of the river under consideration. Table 5 summarizes the results of the conducted analysis. They show that the greatest impact force, and thus spatial variability, was recorded for electrolytic conductivity (0.924 on a scale from 0 to 1), NO3-N (0.541), dissolved oxygen (0.322), pH (0.310), and TP (0.178). For BOD5, NO2-N, ammonium nitrogen, turbidity, and temperature, no statistically significant variability was noted, which means that they do not change along the river course and will not be subject to further analysis.
In the context of HPs (on the catchment scale, taking into account all eigenvalues except 8), statistical significance was noted for the conductivity and pH in the Skałka HP (points 6 and 7 in the pairwise comparison analysis), as well as for NO3-N, dissolved oxygen, and pH for the Marszowice HP (points 13 and 14). No dependencies were found for the Sadowice HP (points 2 and 3). Detailed ANOVA results are summarized in Table 5.
An ANOVA was also performed within the HPs on a local scale, comparing only the points above and above the hydropower facilities. For the Marszowice HP, the significance was noted for: NH4-N (effect strength 0.442), dissolved oxygen (0.408), pH (0.405), and NO3-N (0.408). Conductivity (0.623) and pH (0.338) were statistically significant for the Skałka HP. In the case of the Sadowice HP, no statistically significant variation was noted.

3.3. Analysis of the Variability of Results for Statistically Significant Parameters

The section presents the results of the following analyzes: boxplots, hierarchical cluster analysis (HCA) and principal component analysis (PCA). Additionally, Annex 1 contains graphs of spatial and temporal variability of the parameters under consideration (EC, NO3-N, DO, pH, and TP), taking into account the state of physicochemical elements (water quality) and the statistical significance of the results on the Bystrzyca river scale.

3.3.1. Electrolytic Conductivity (EC)

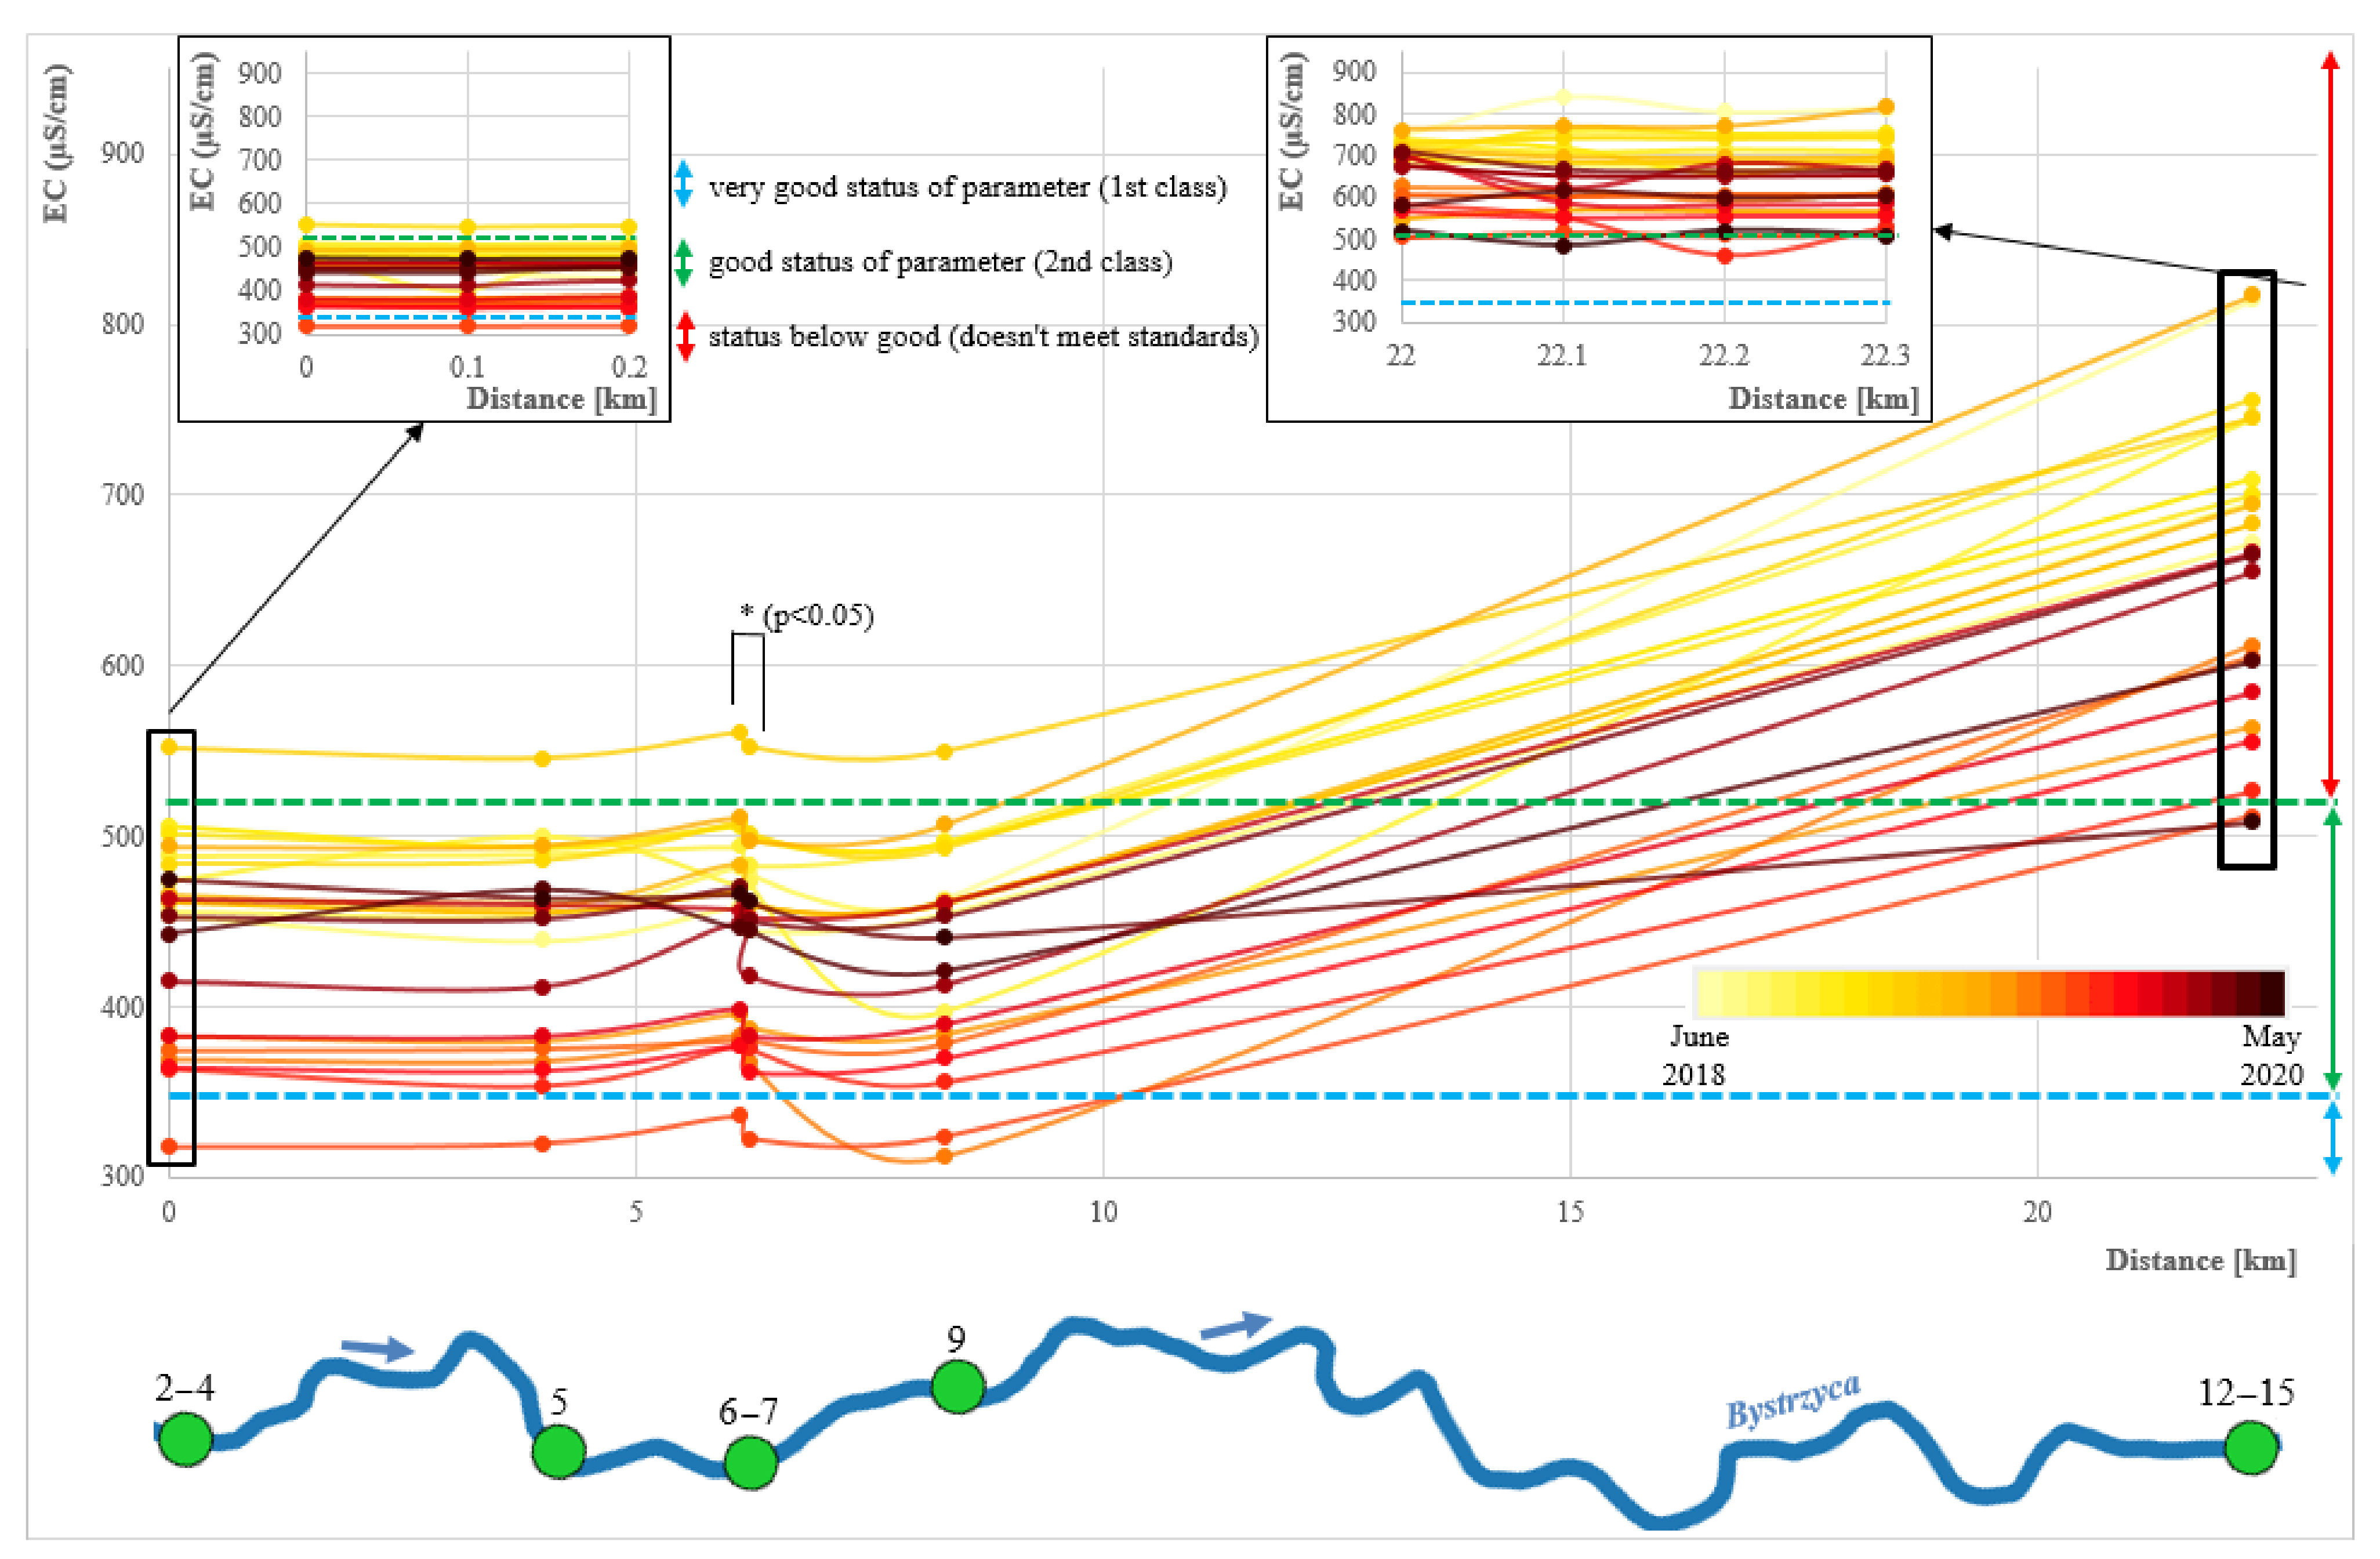
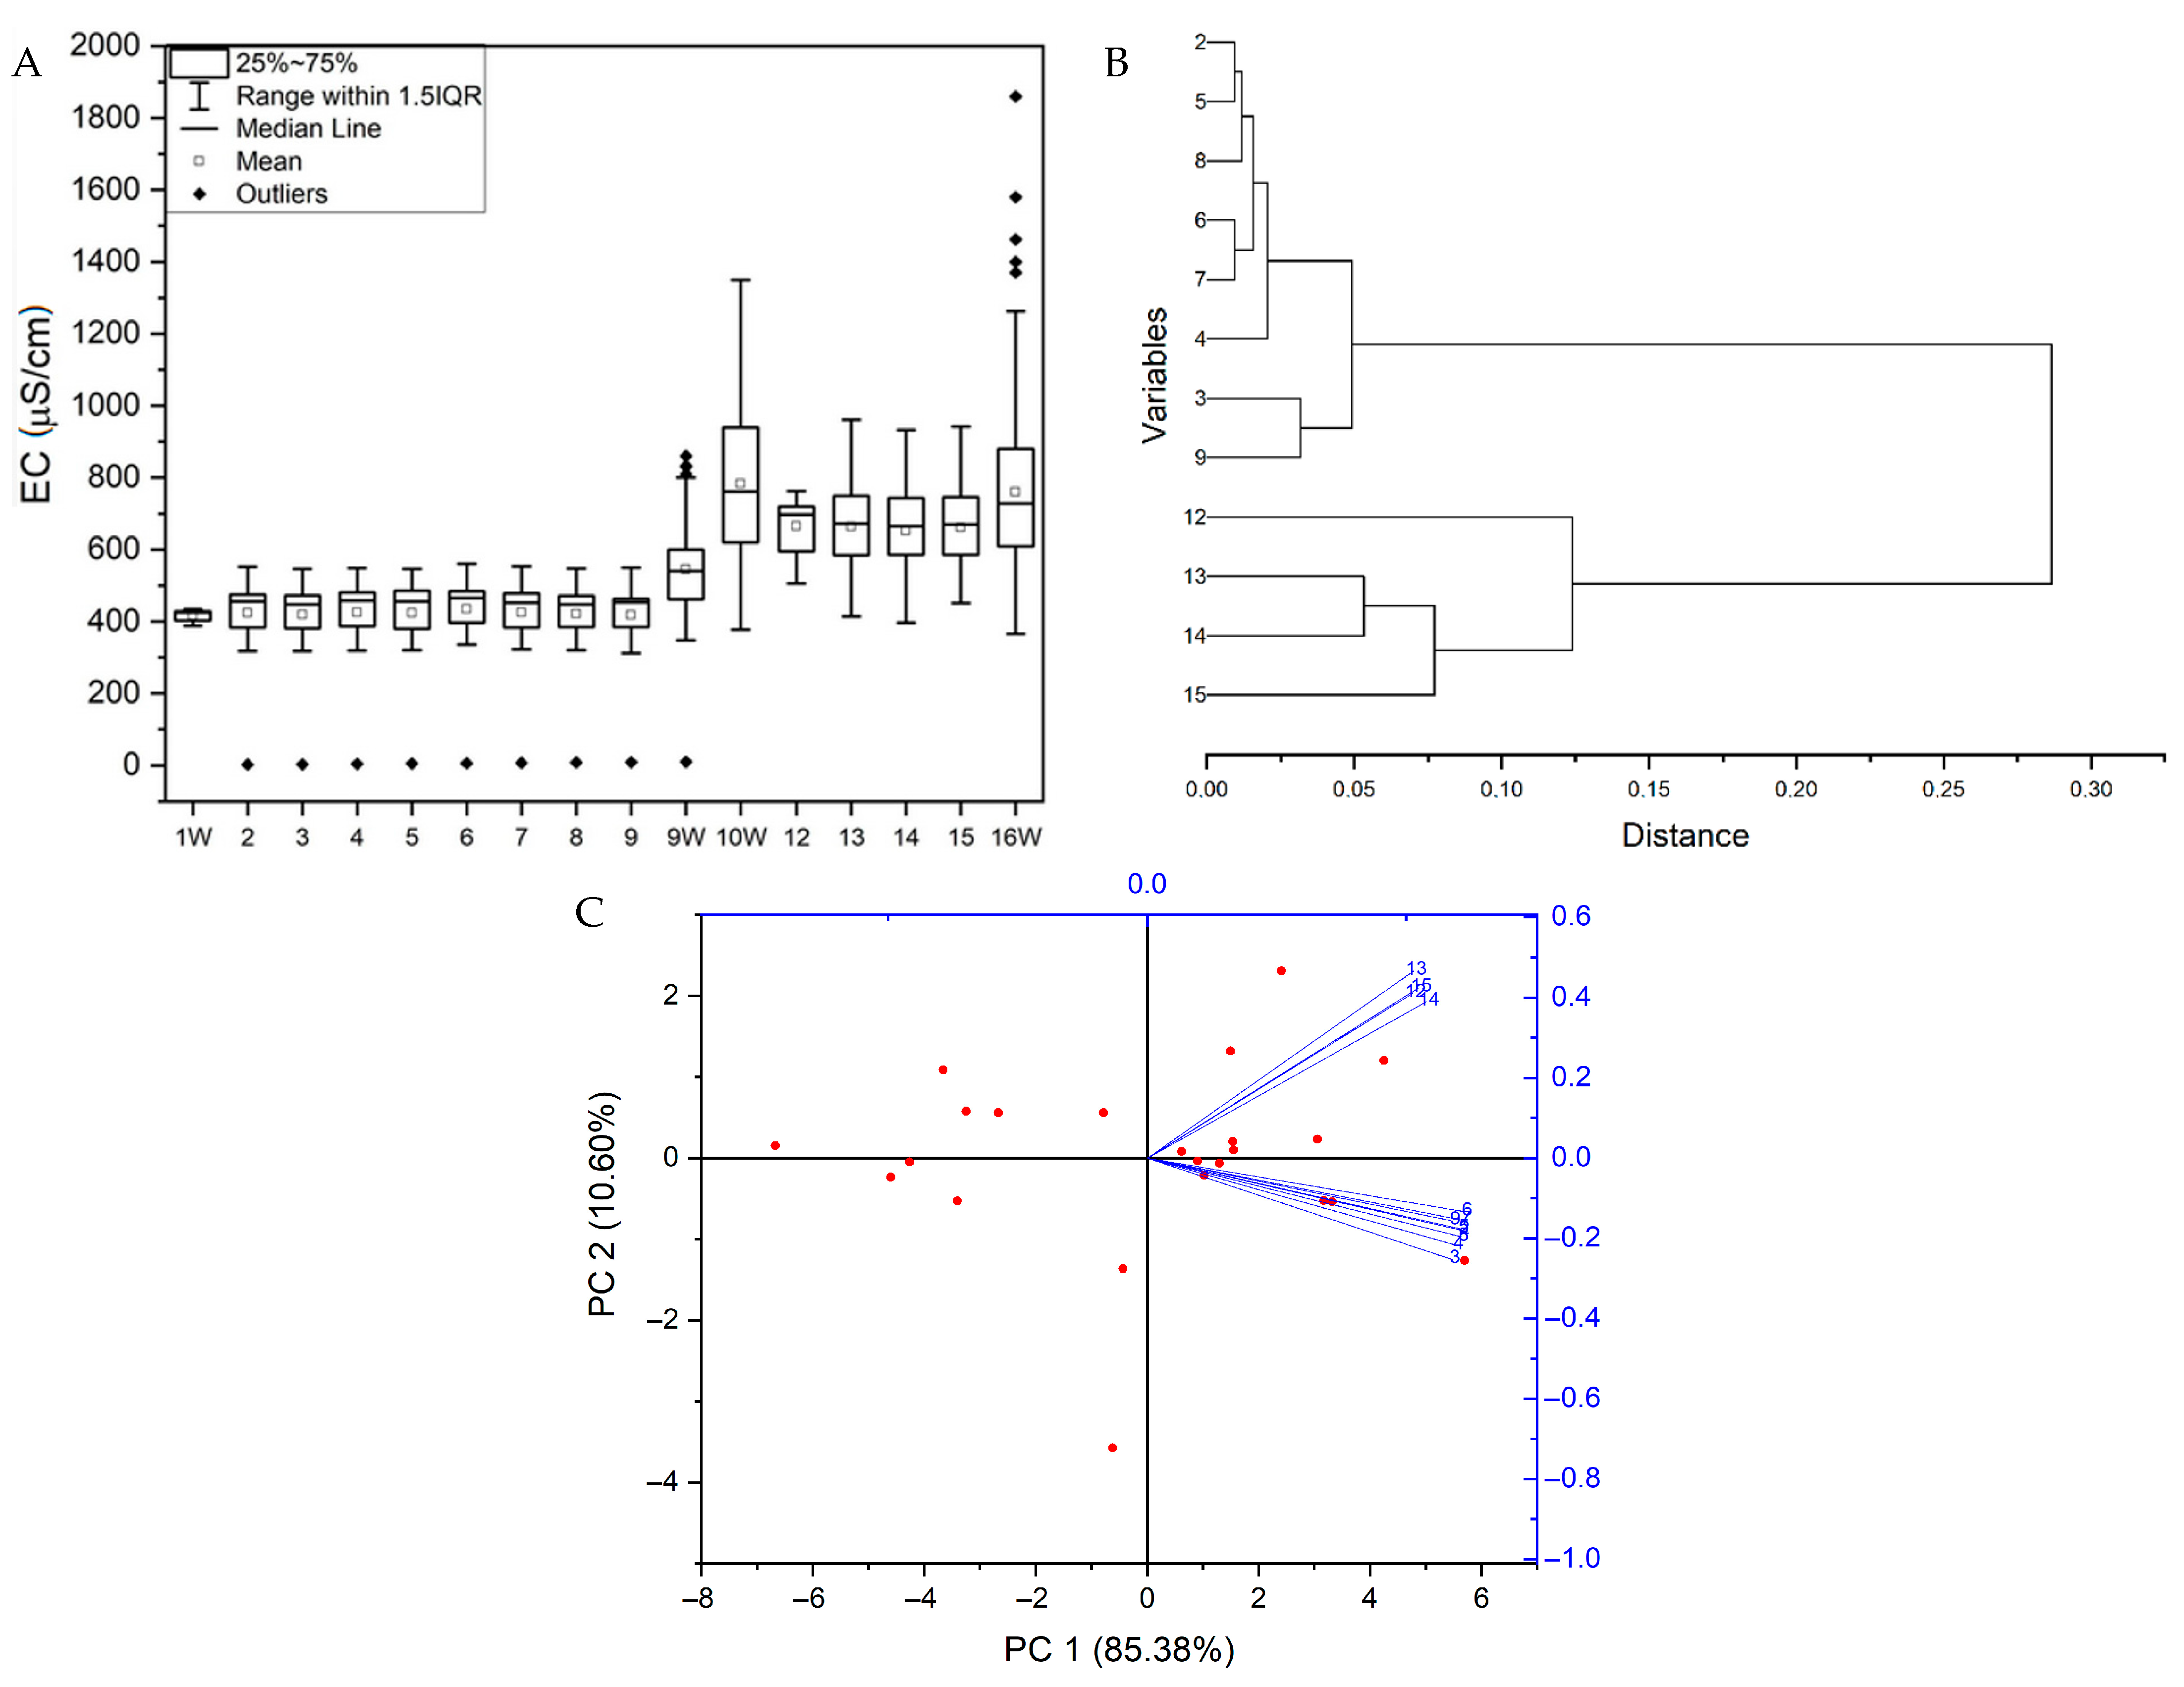
As can be seen in Figure 4A, between points 9 and 12, the conductivity values vary significantly. Taking into account the 1 W, 9 W, 10 W, and 16 W points from multiyear measurements, it can be seen that at the 10 W point the conductivity median increases significantly compared to the previous points (761 µS/cm; in the previous: 416–540 µS/cm) and remains at a similar horizontal up to the 16 W point (665–728 µS/cm). Point 10W is the first one located in the city of Wrocław, as well as further points on the Bystrzyca River. Therefore, it can be said that the HPs themselves do not have as much of an impact on the conductivity values as the urbanization process and the related impacts (e.g., sewage discharge, leakage of septic tanks, waste disposal or storage, etc.) [26,84,98]. Our HCA and PCA analyses (Figure 4B,C) confirm these relationships: the points at the Marszowice HP clearly differ from the rest (these are two different groups of points). As for the time variability of our analyses (June 2018‒May 2020), it can be seen that in the initial series of measurements the conductivity values were the highest; they decreased over time and in the last months of the research they began to return to the values from the beginning of the research period (at the beginning of the period of conductivity they exceeded the quality standards, and in half and at the end of the study they usually belonged to class II, i.e., good condition, especially at points 2–9). Additionally, between points 6 and 7 (above and below Skałka HP), statistical significance was found—absolute values are higher above the HP. The spatial and temporal variability, including statistical significance for ECs, is included in Figure A1.

3.3.2. Nitrate Nitrogen (NO3-N)

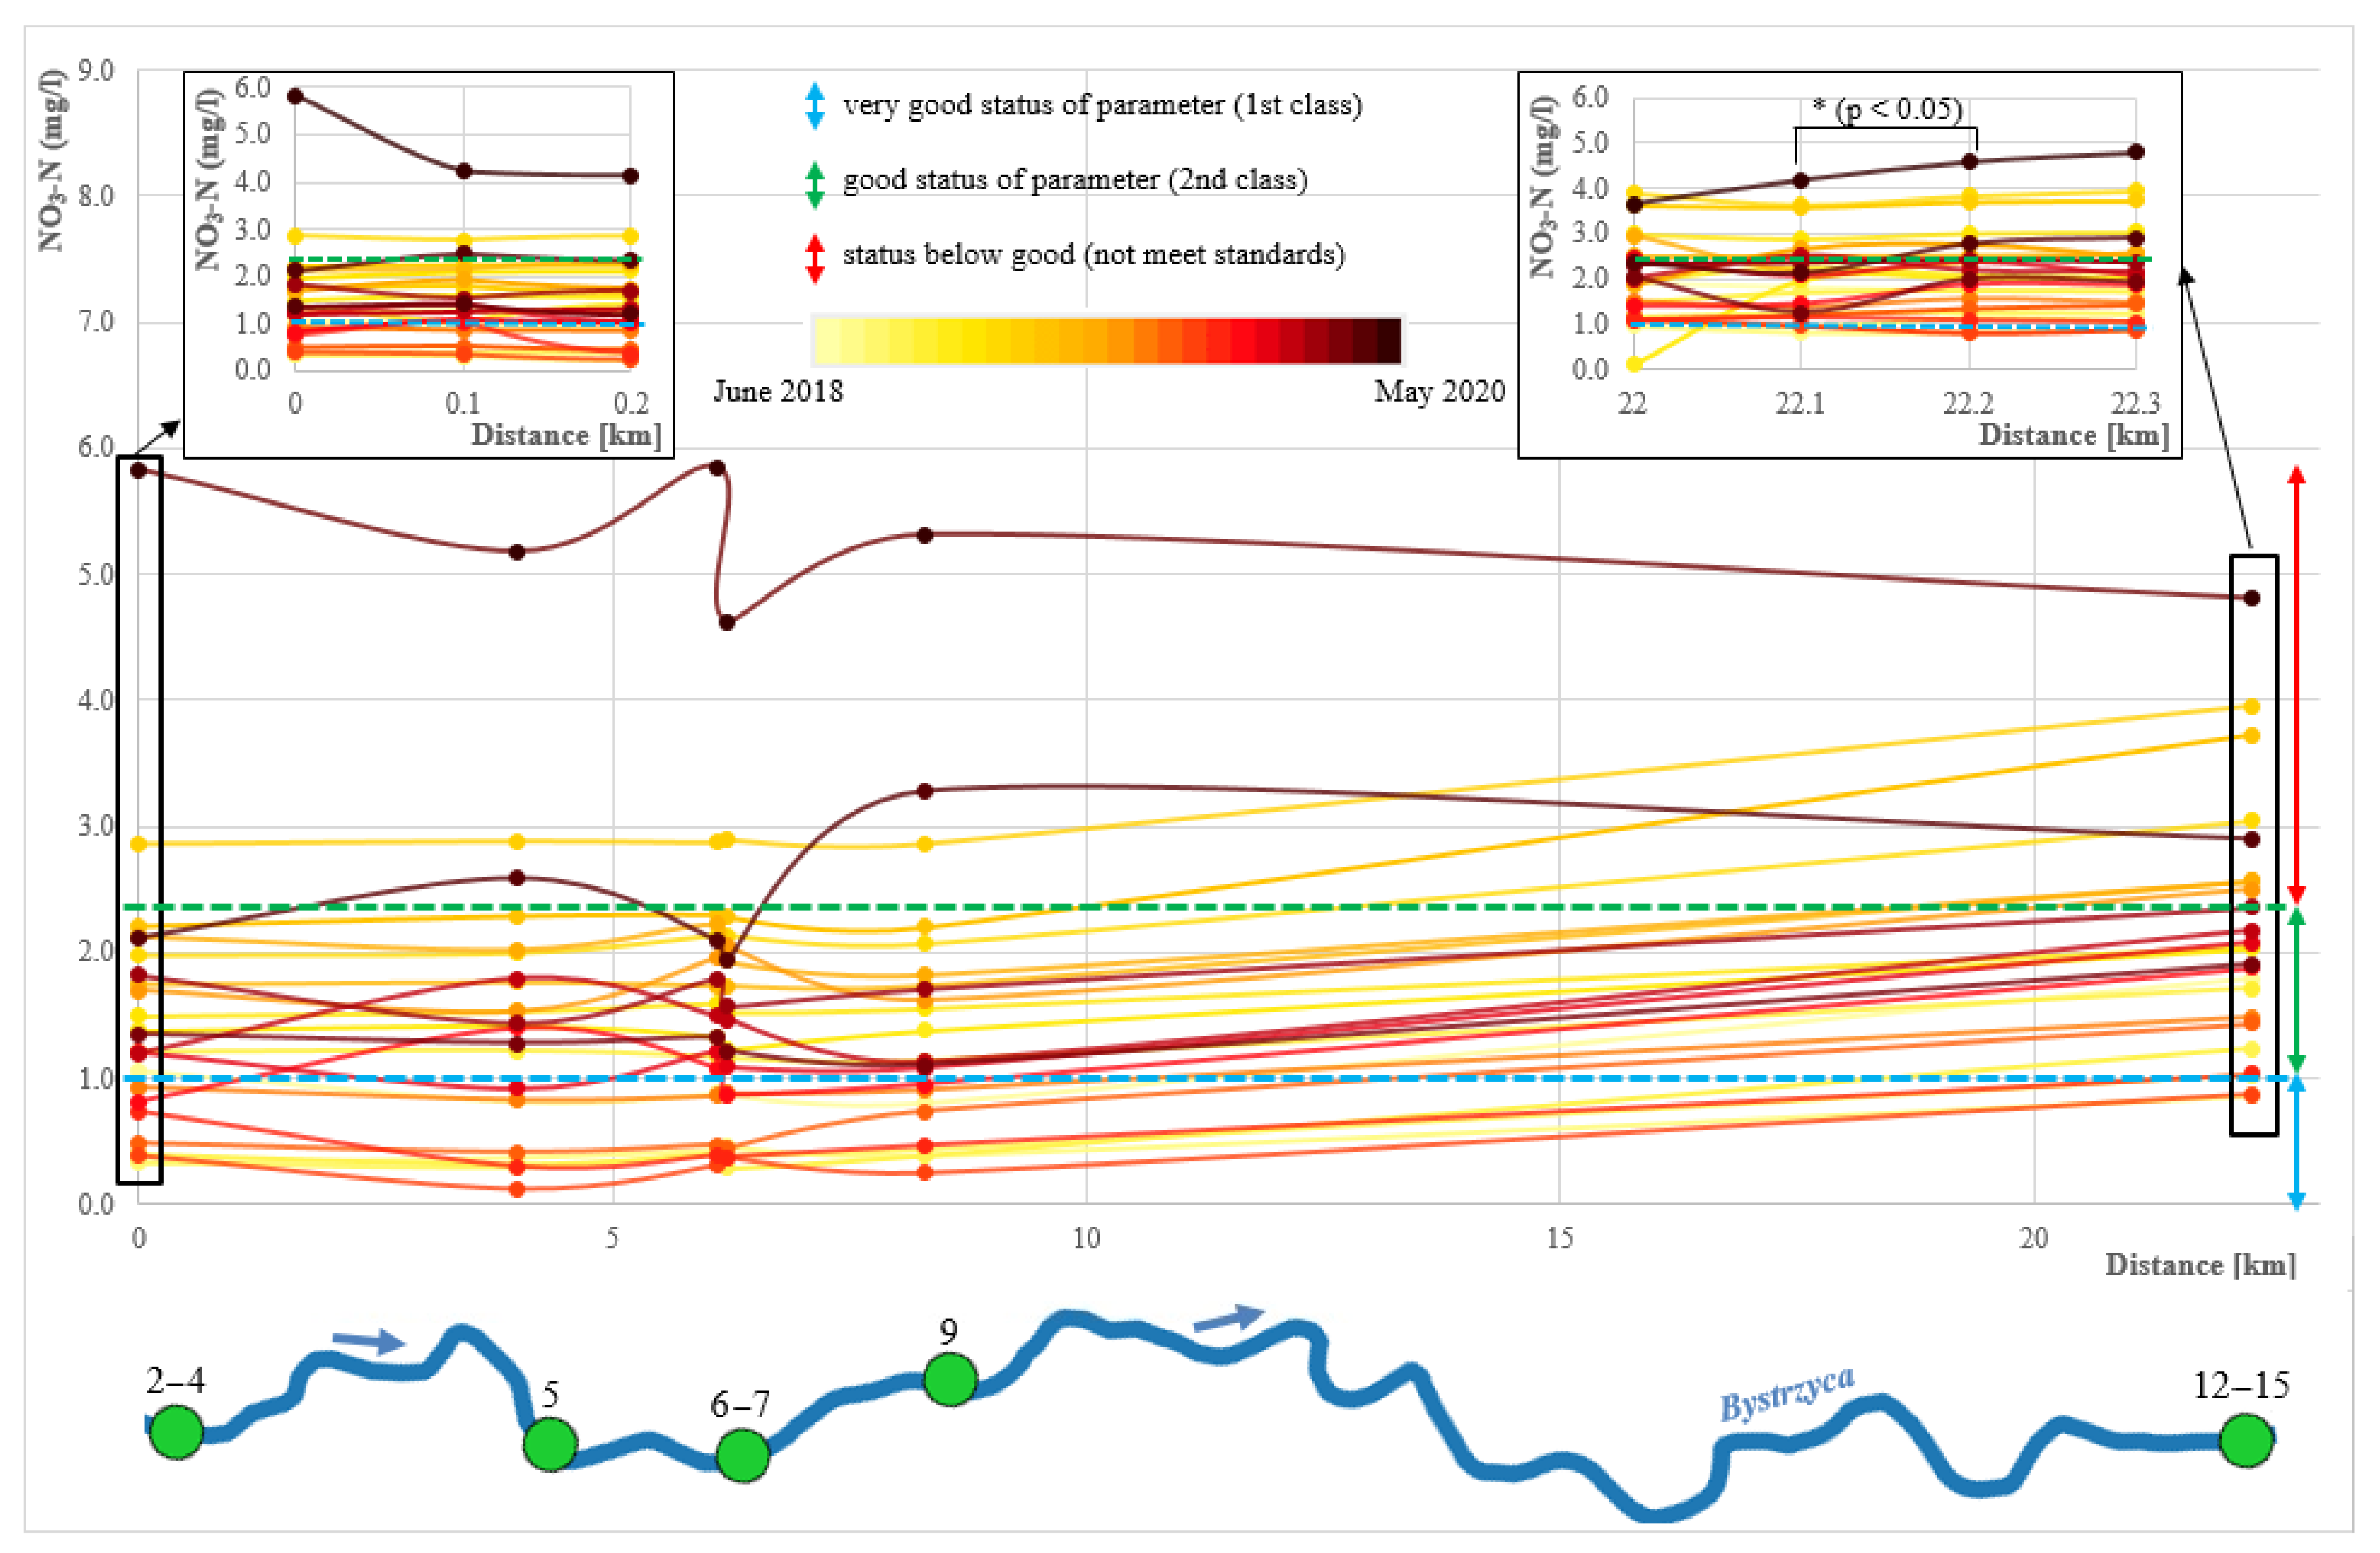
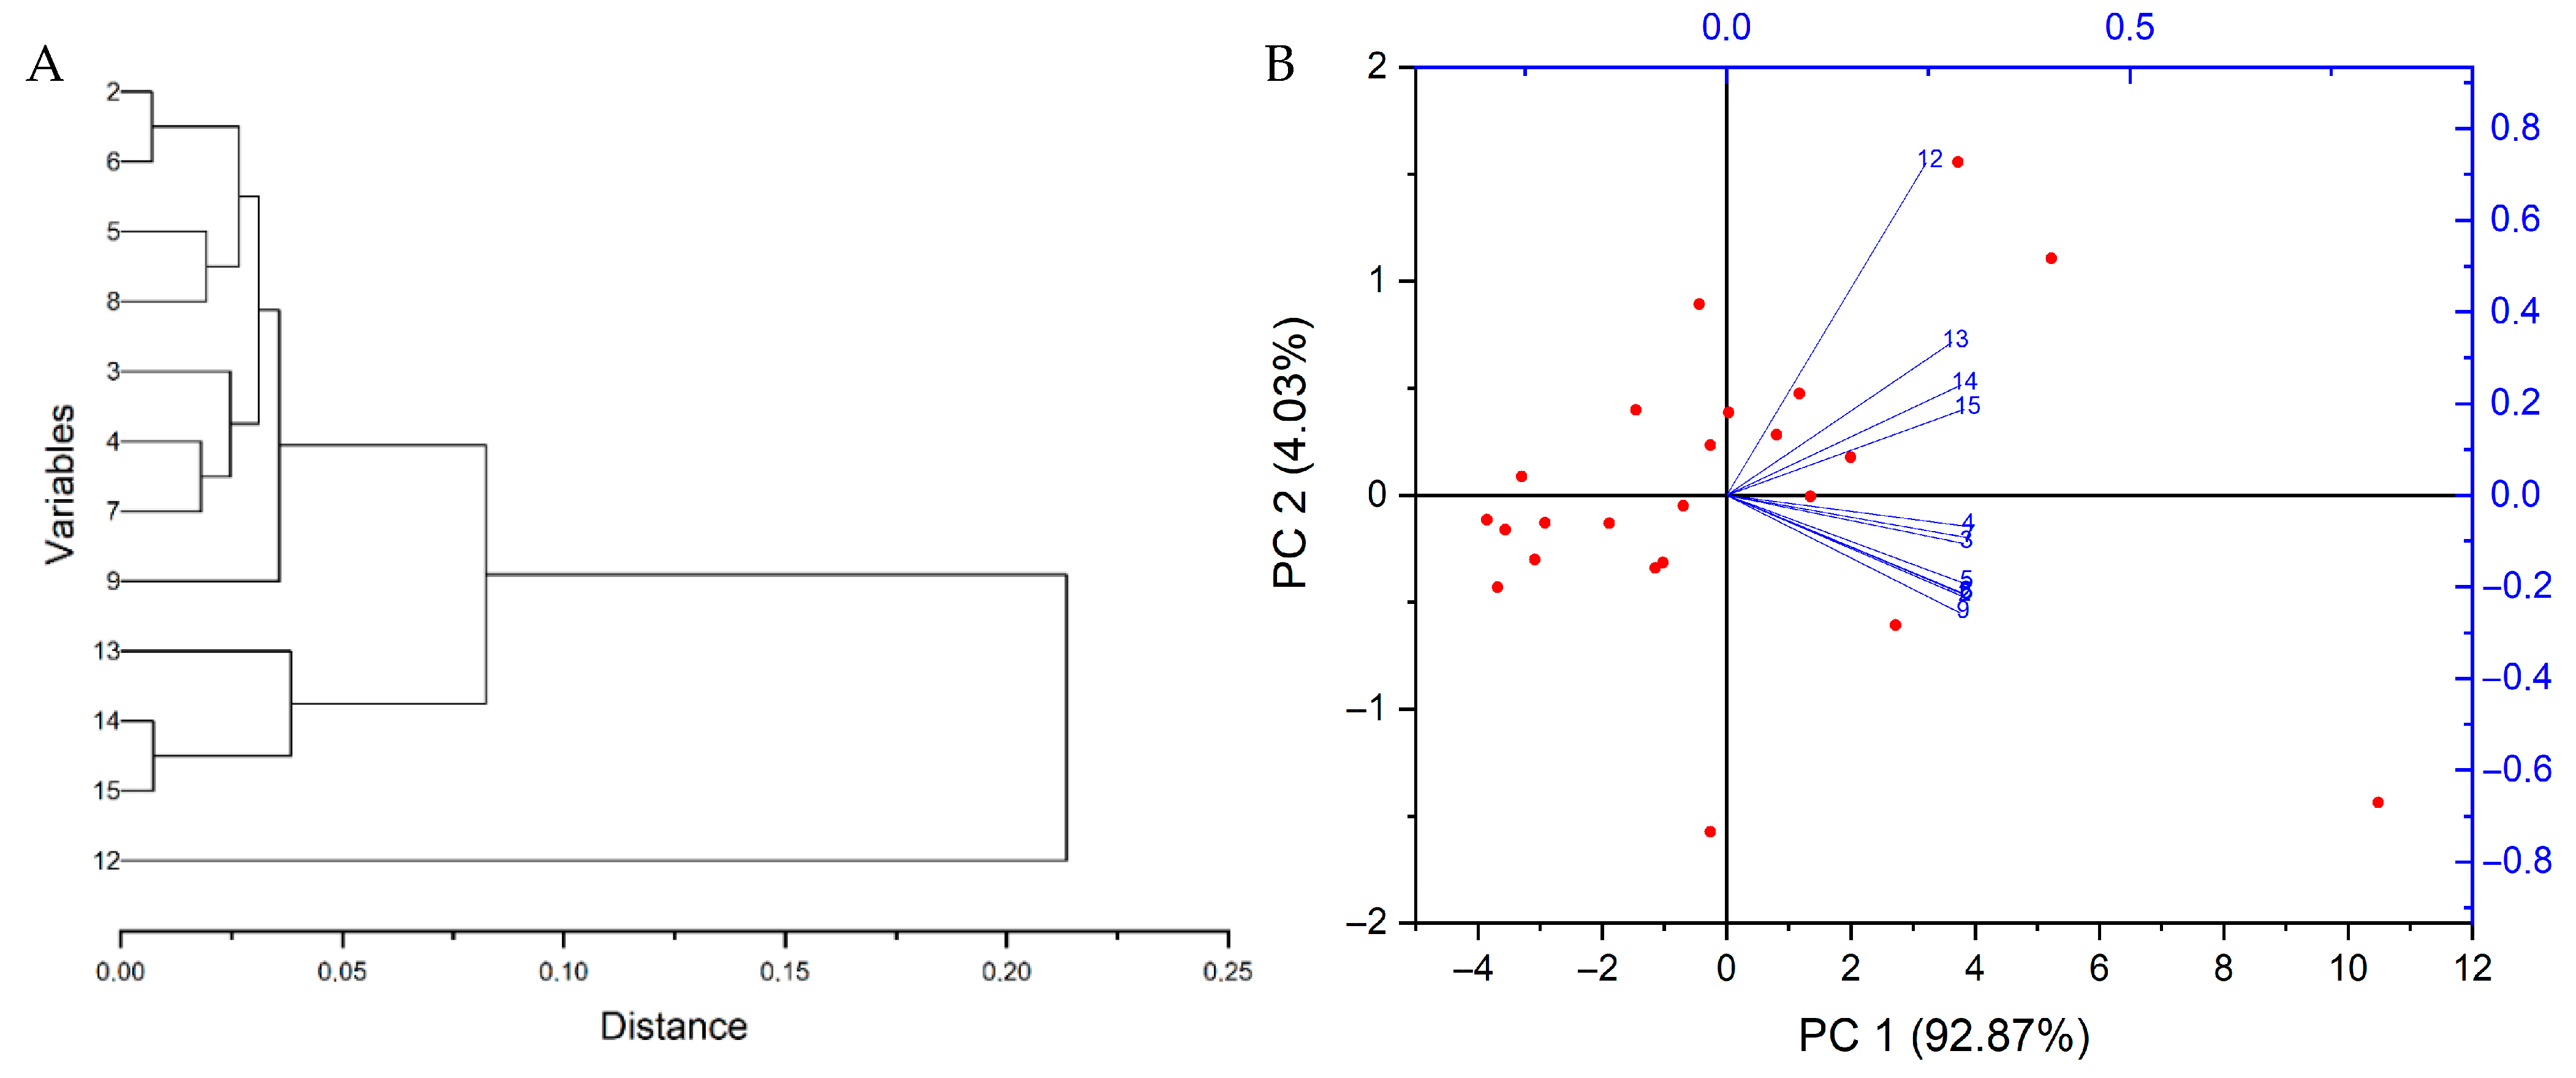
In the case of NO3-N, the greatest differences in the course of the river are between points 2 to 9 and points 12 to 15. This is visible for both HCA and PCA (Figure 5): points at the Marszowice HP (12–15) differ significantly away from other points, especially above the derivative canal (point 12). The median values range from 1.135 to 1.410 mg/L for points 2–9 and from 1.924 to 2.056 mg/L for points 12–15. Taking into account the data from many years, the highest values are recorded, respectively, in points 16 W, 10 W, and 11 W (median 2.97, 2.94, and 2.40 mg/L). Analysing Figure A2, it can also be seen that the physicochemical state of NO3-N changed over time: the highest values were recorded in the first months of the study, then they decreased and at the end of the study period the results tended to return to those from the first measurements. In the classification of the physicochemical condition of this element, the good condition (class II) was recorded for most months, but there were also months with a very good condition (class I) exceeding the accepted standards. Additionally, for points 13 and 14 (above and below the Marszowice HP), the results were statistically significant. The reason for the increase in NO3-N content is pollution in urbanized areas, mainly from fertilizer runoff from intensively used arable land (for example, grazing and plantations of industrial plants near the Marszowice HP) [26]; this suggests a separate point 12 compared to the others in the HCA analysis and the greatest distance from the other points in the PCA analysis. However, the HP also influences the NO3-N concentration levels in this case.

3.3.3. Dissolved Oxygen (DO)

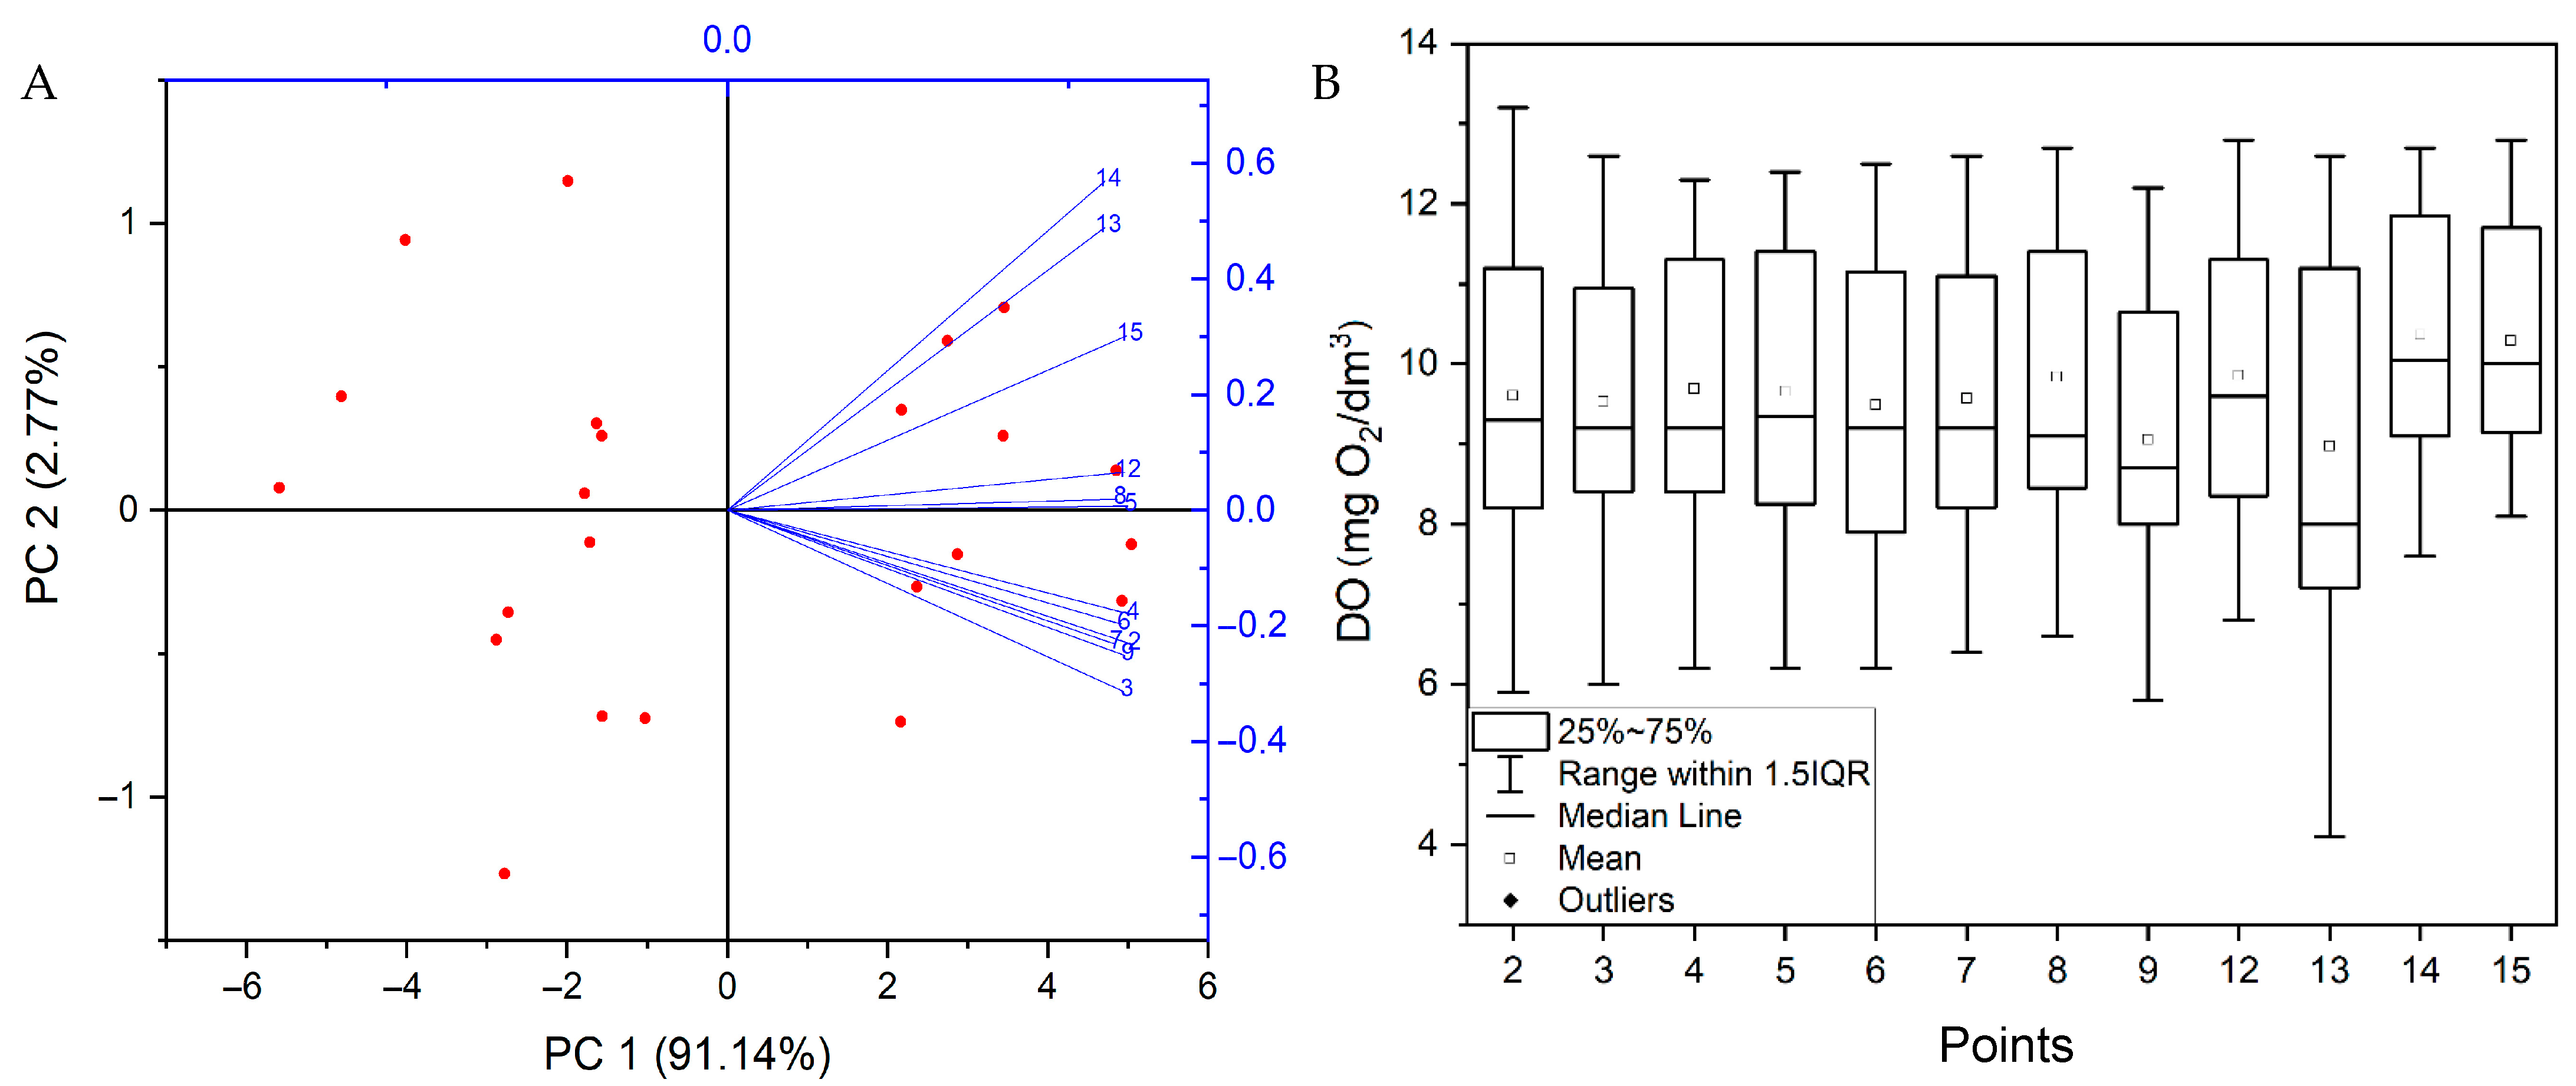
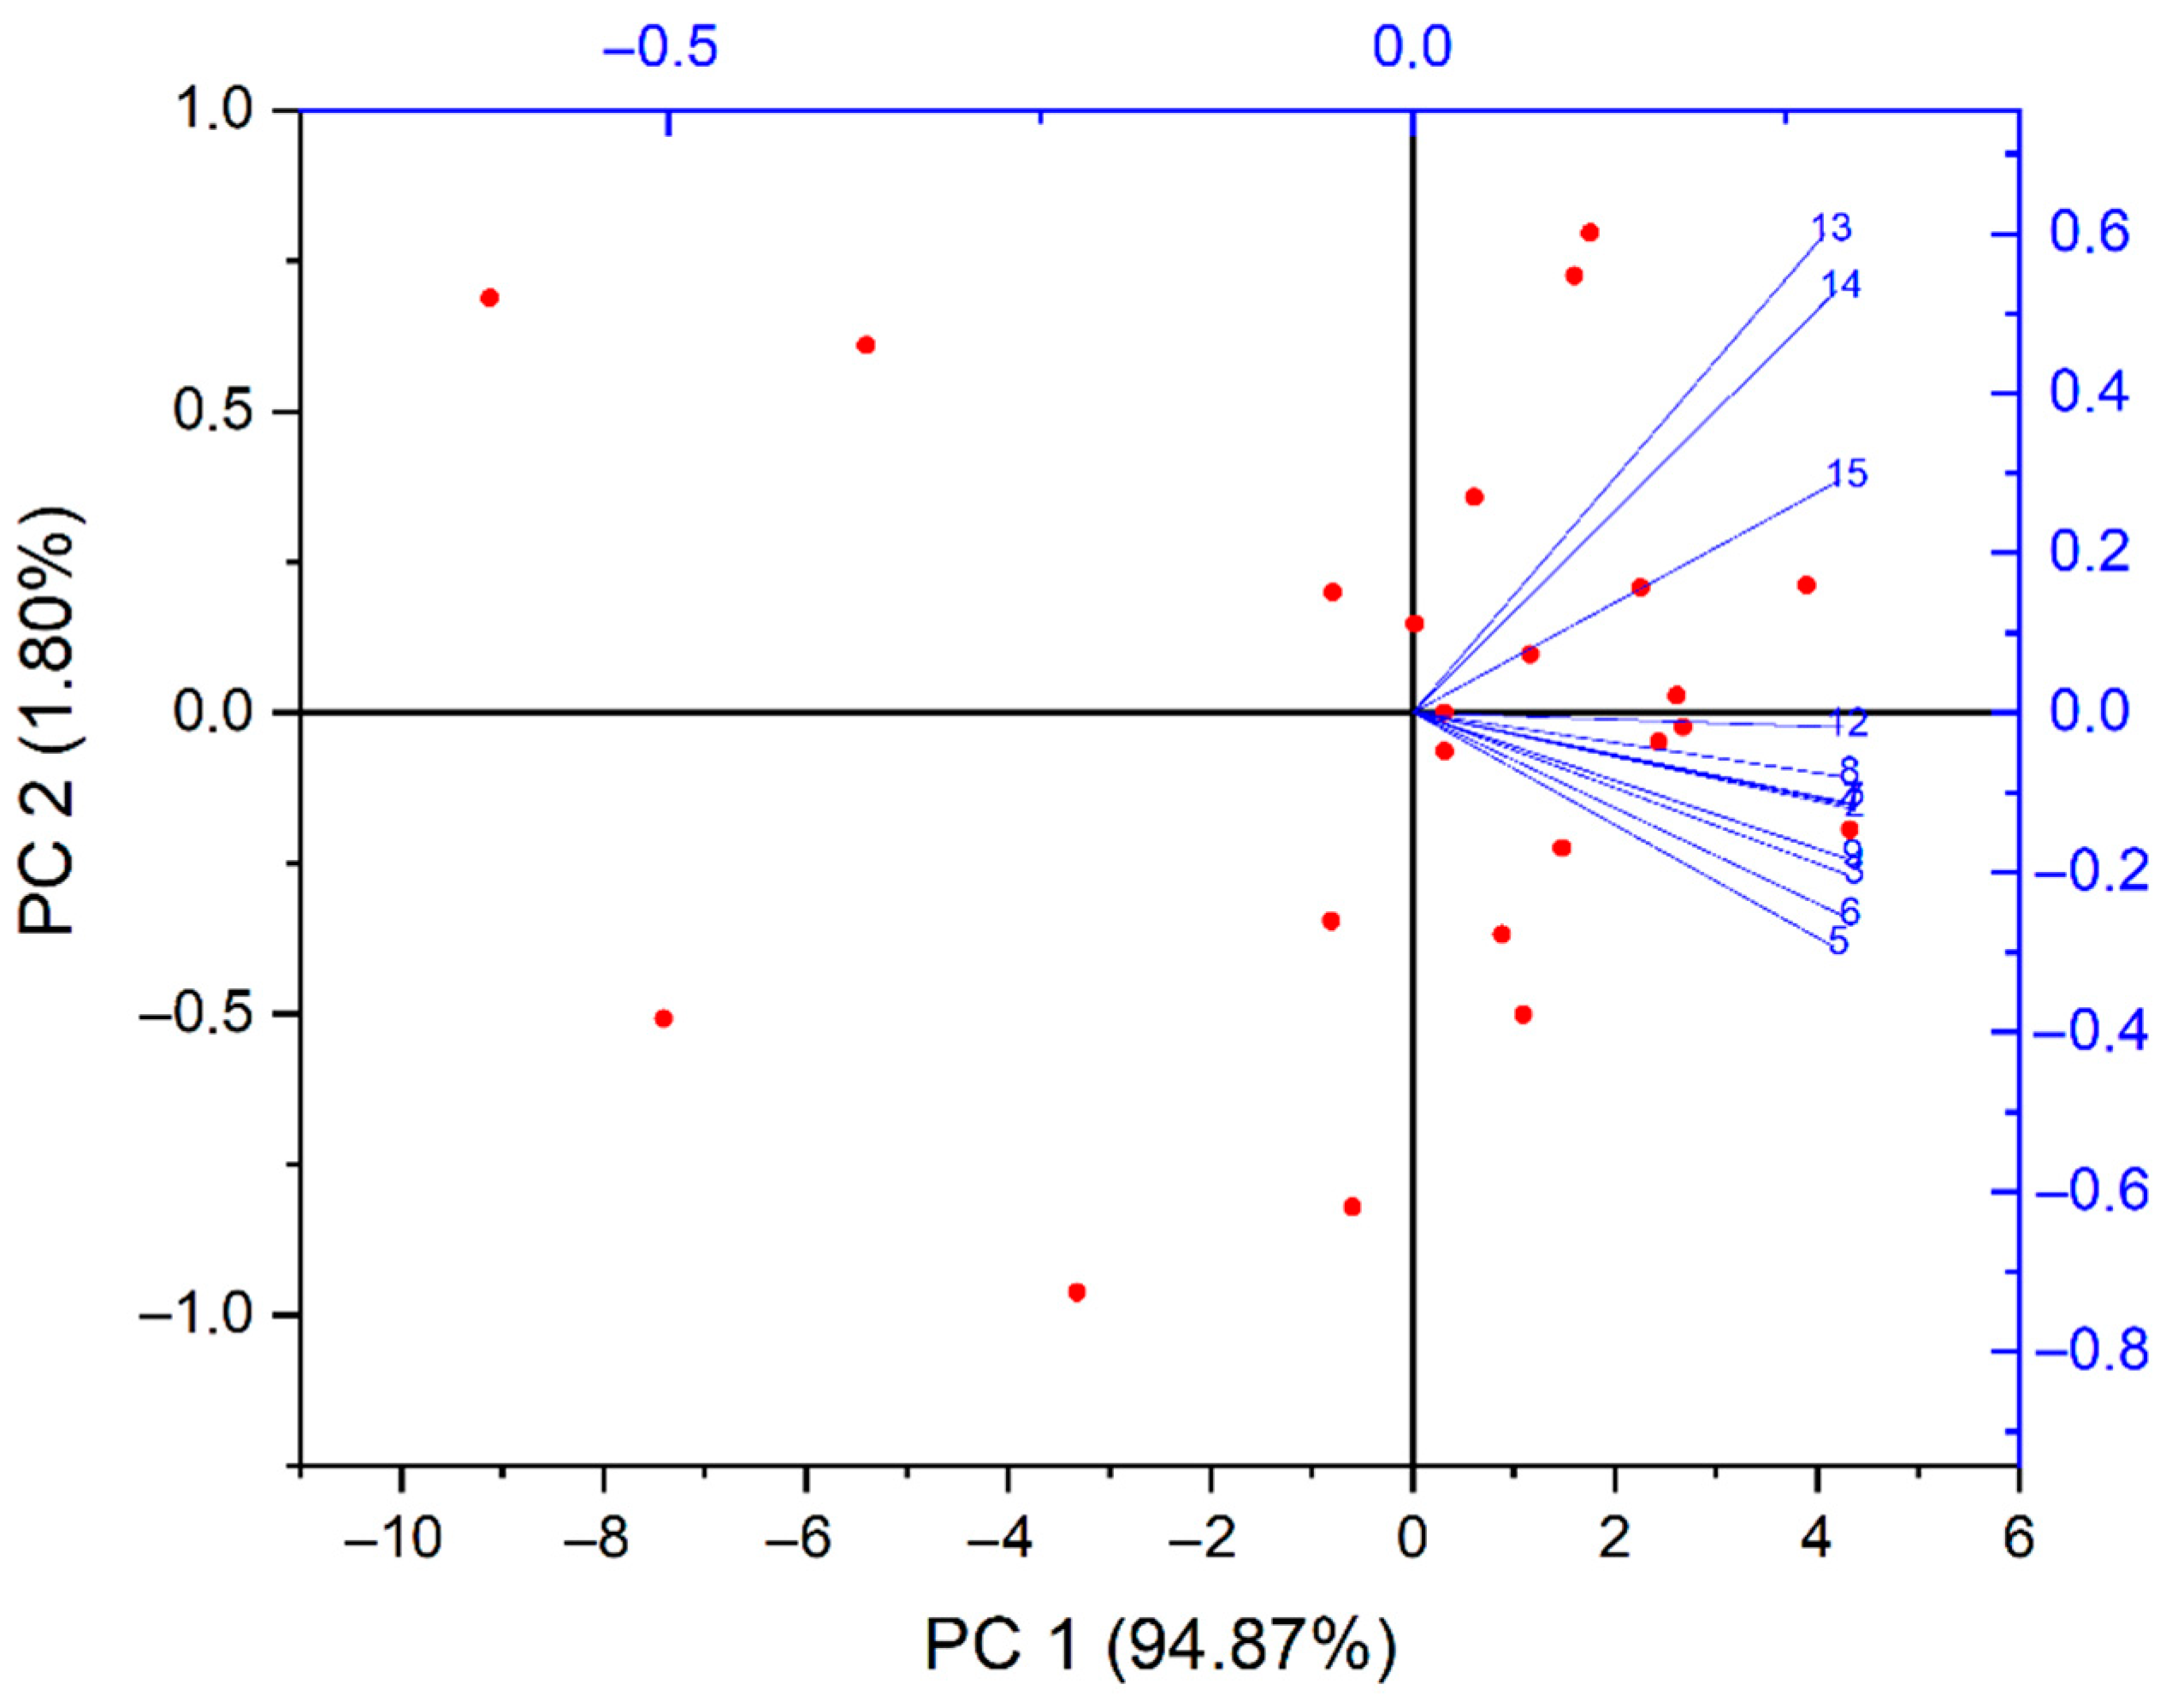
In the case of dissolved oxygen, the difference can be seen in point 13, in front of the Marszowice HP, where the concentrations are much lower than at the other points. This is reflected both in the PCA analysis, where points 13 and 14 are furthest from the other points, and the closest to them is point 15 (reference, below the Marszowice HP); as well as in box graphs, where you can see a greater range of values for point 13 (minimum 4.1, maximum 12.6 mg/L; for other points usually 6.2–12.8 mg/L). It should be mentioned that, for the PCA analysis, these are not large differences—the vertical axis is responsible for 2.77% of the translation factors, and the horizontal axis for 91.14%, for which the distances between the points are negligible. Additionally, a statistical significance was noted between points 13 and 14 (Marszowice HP); usually the oxygenation below the HP increases. In most months, the standards for this parameter were not exceeded or were class II (good condition). The results are shown in Figure 6A,B and Figure A3.

3.3.4. pH

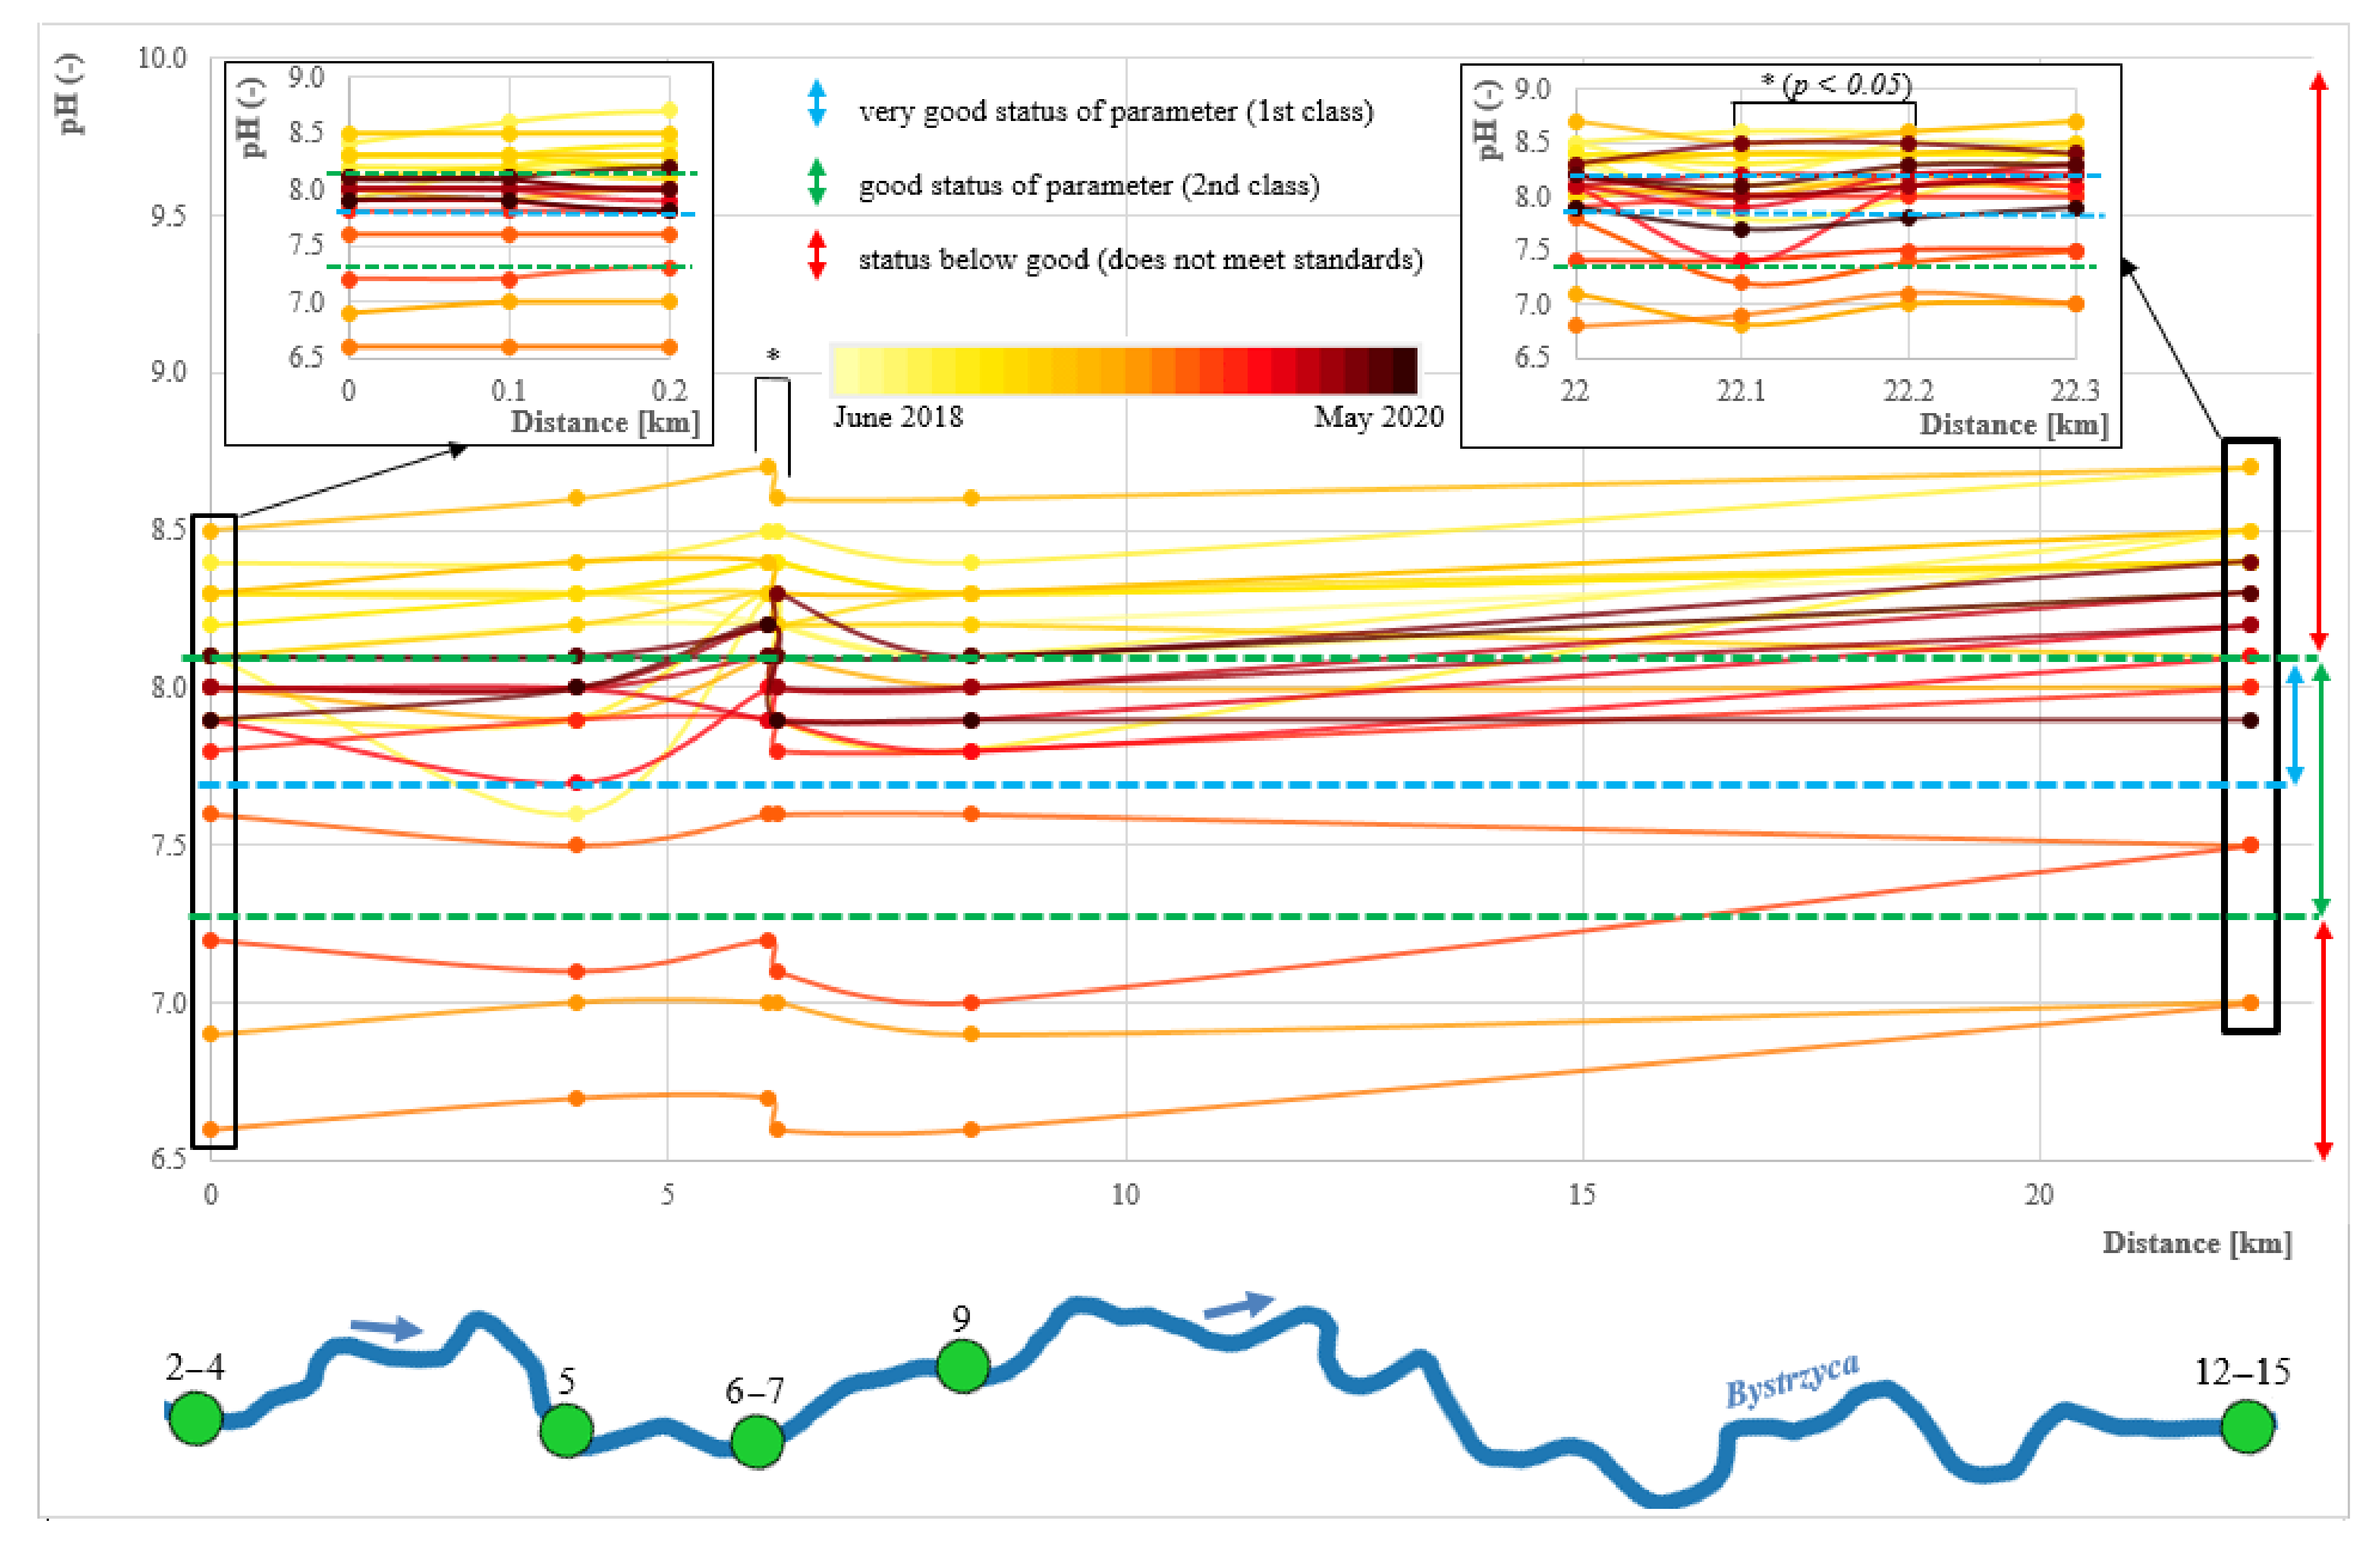
Fluctuations in the pH on the scale of the Bystrzyca River during the research period were quite large, but they did not differ between most points. The exceptions are points 13–15 near the Marszowice HP, which can be seen in the PCA (Figure 7). In addition, for the Marszowice and Skałka HPs, statistical significance was noted in terms of the difference in the results (Figure A4). The physicochemical state of the pH deviated from the norms in about two out of three months; it reached the second class in only one month, and the first in six months. The pH was slightly higher at the test endpoints, but usually these differences were small (median pH 7.95–8.3; pH ranged from 6.5 to 8.7). Due to the different use of the catchment area and different types of pollutants, the pH fluctuations sometimes amounted to 1 pH unit (agricultural, forest, residential, industrial, etc.) [26]. The impact of HPs is local in nature.

3.3.5. Total Phosphorus (TP)

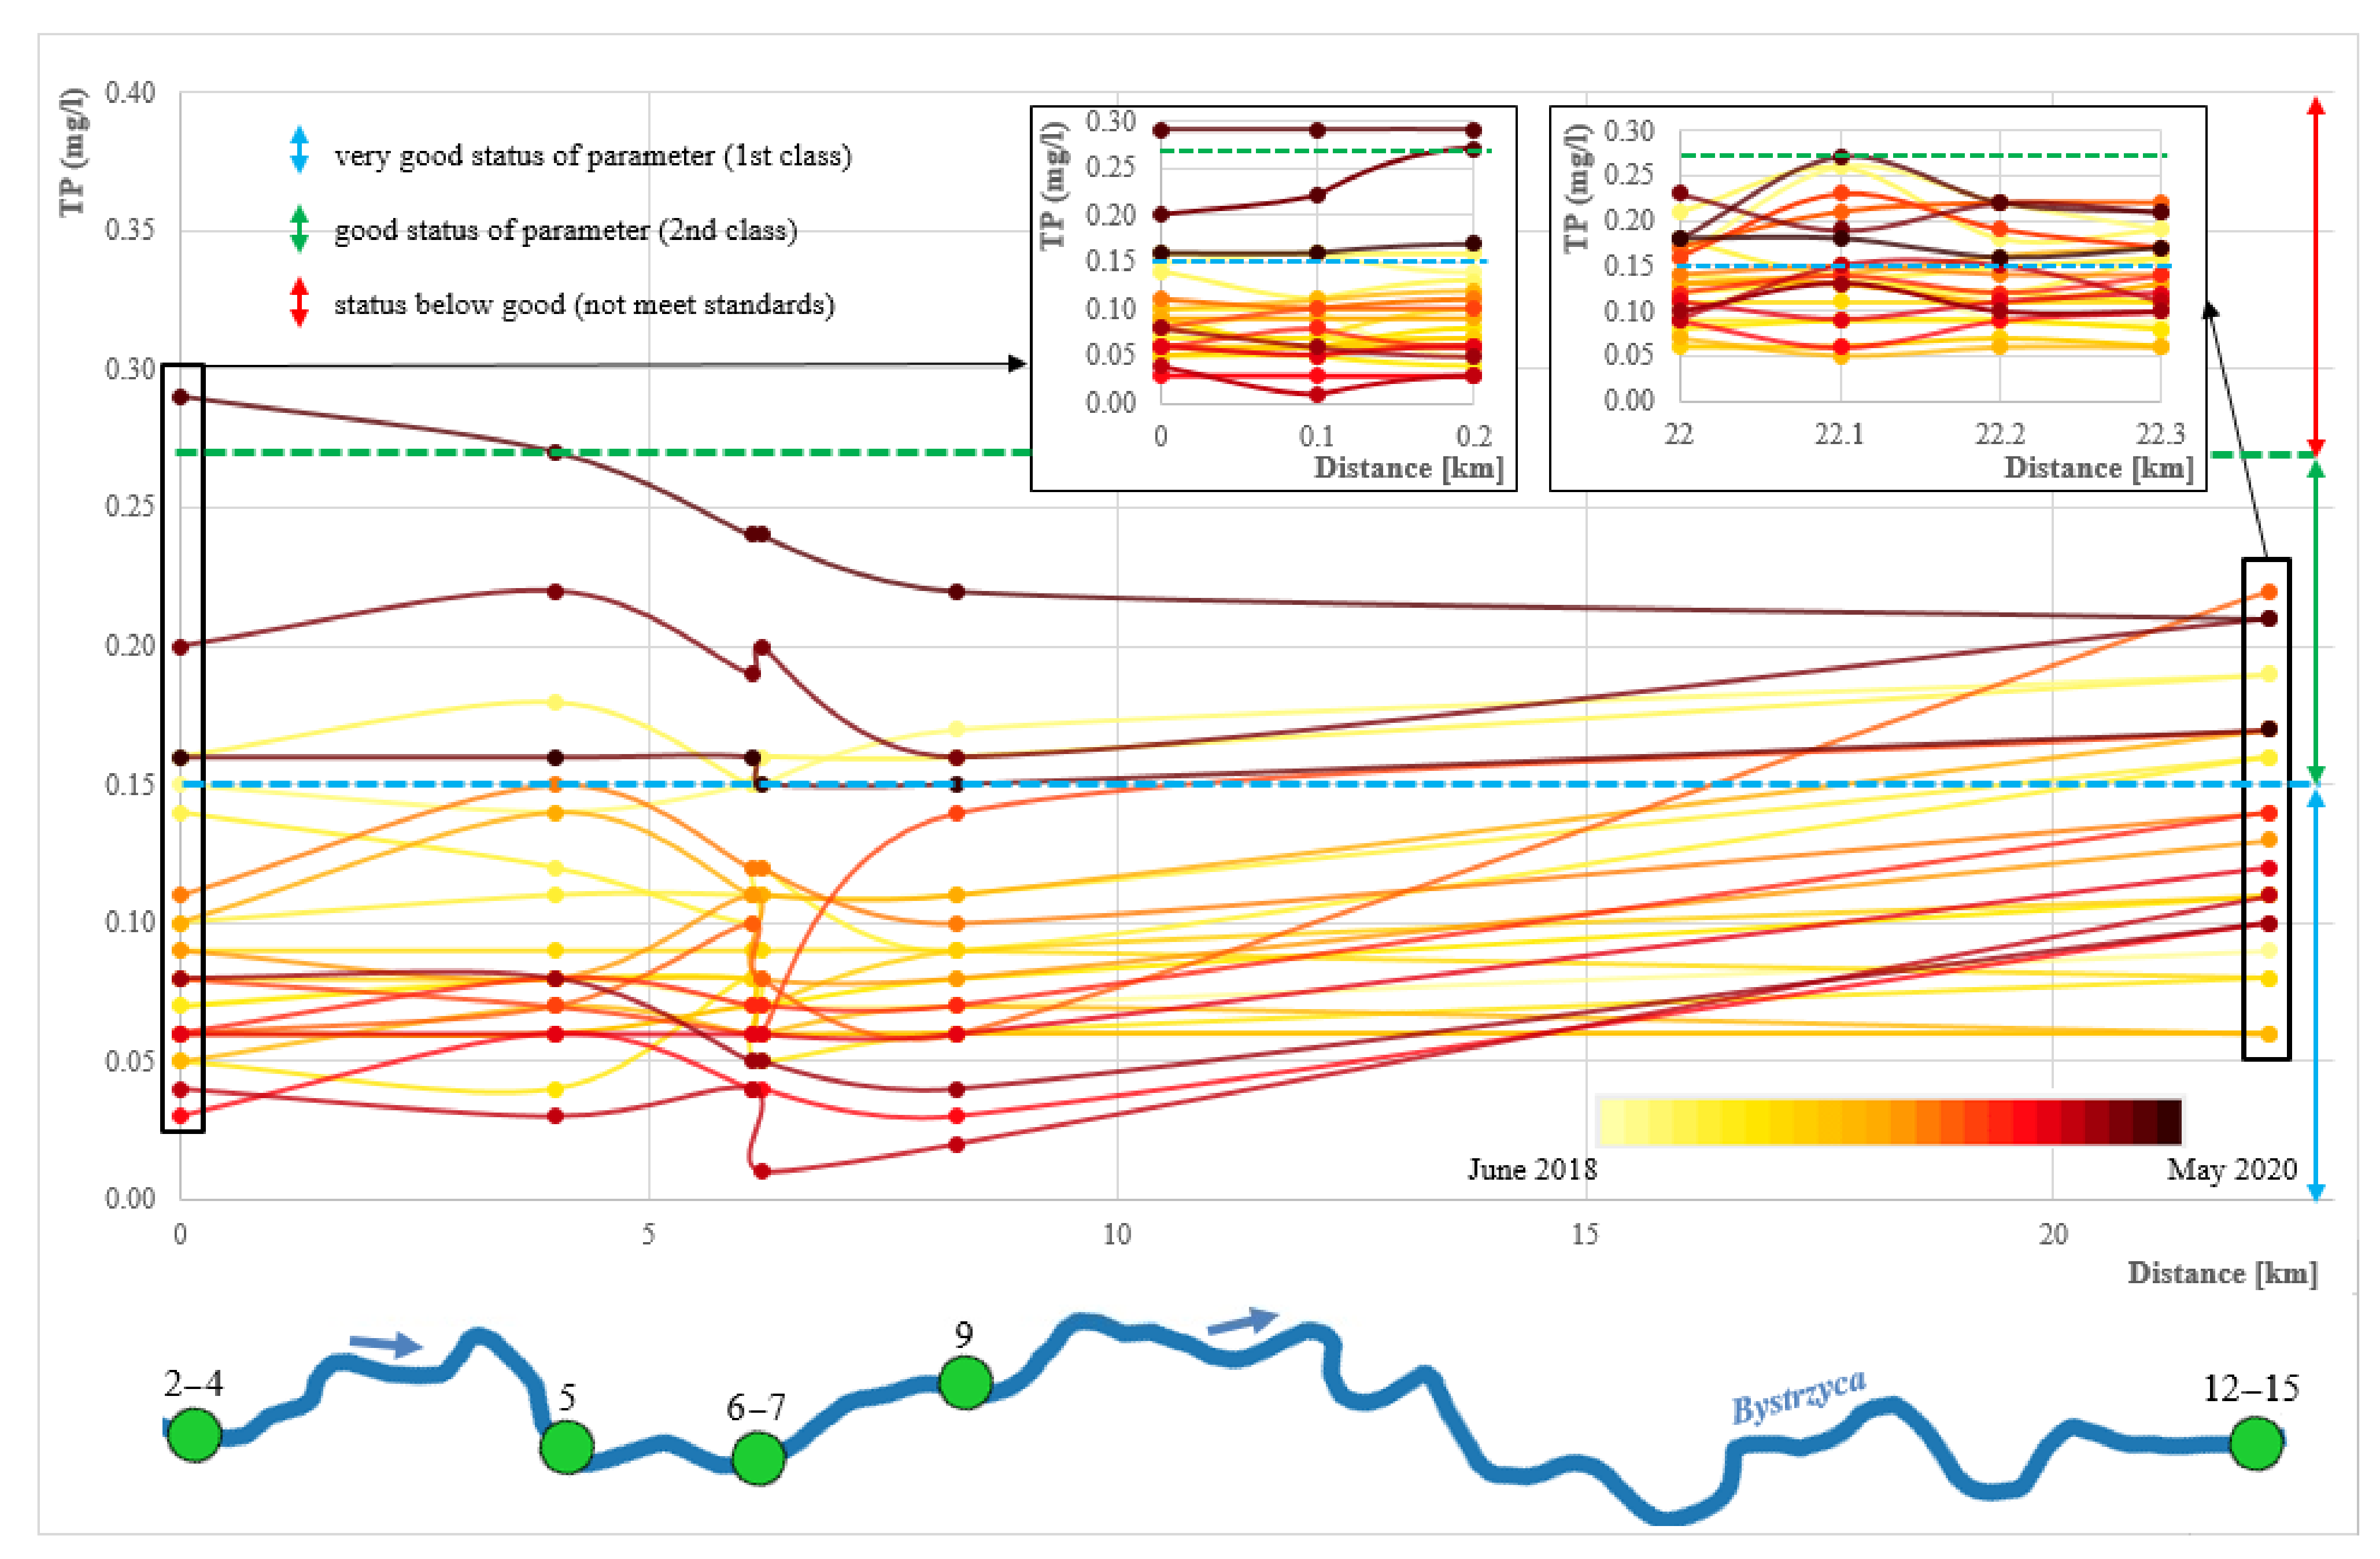
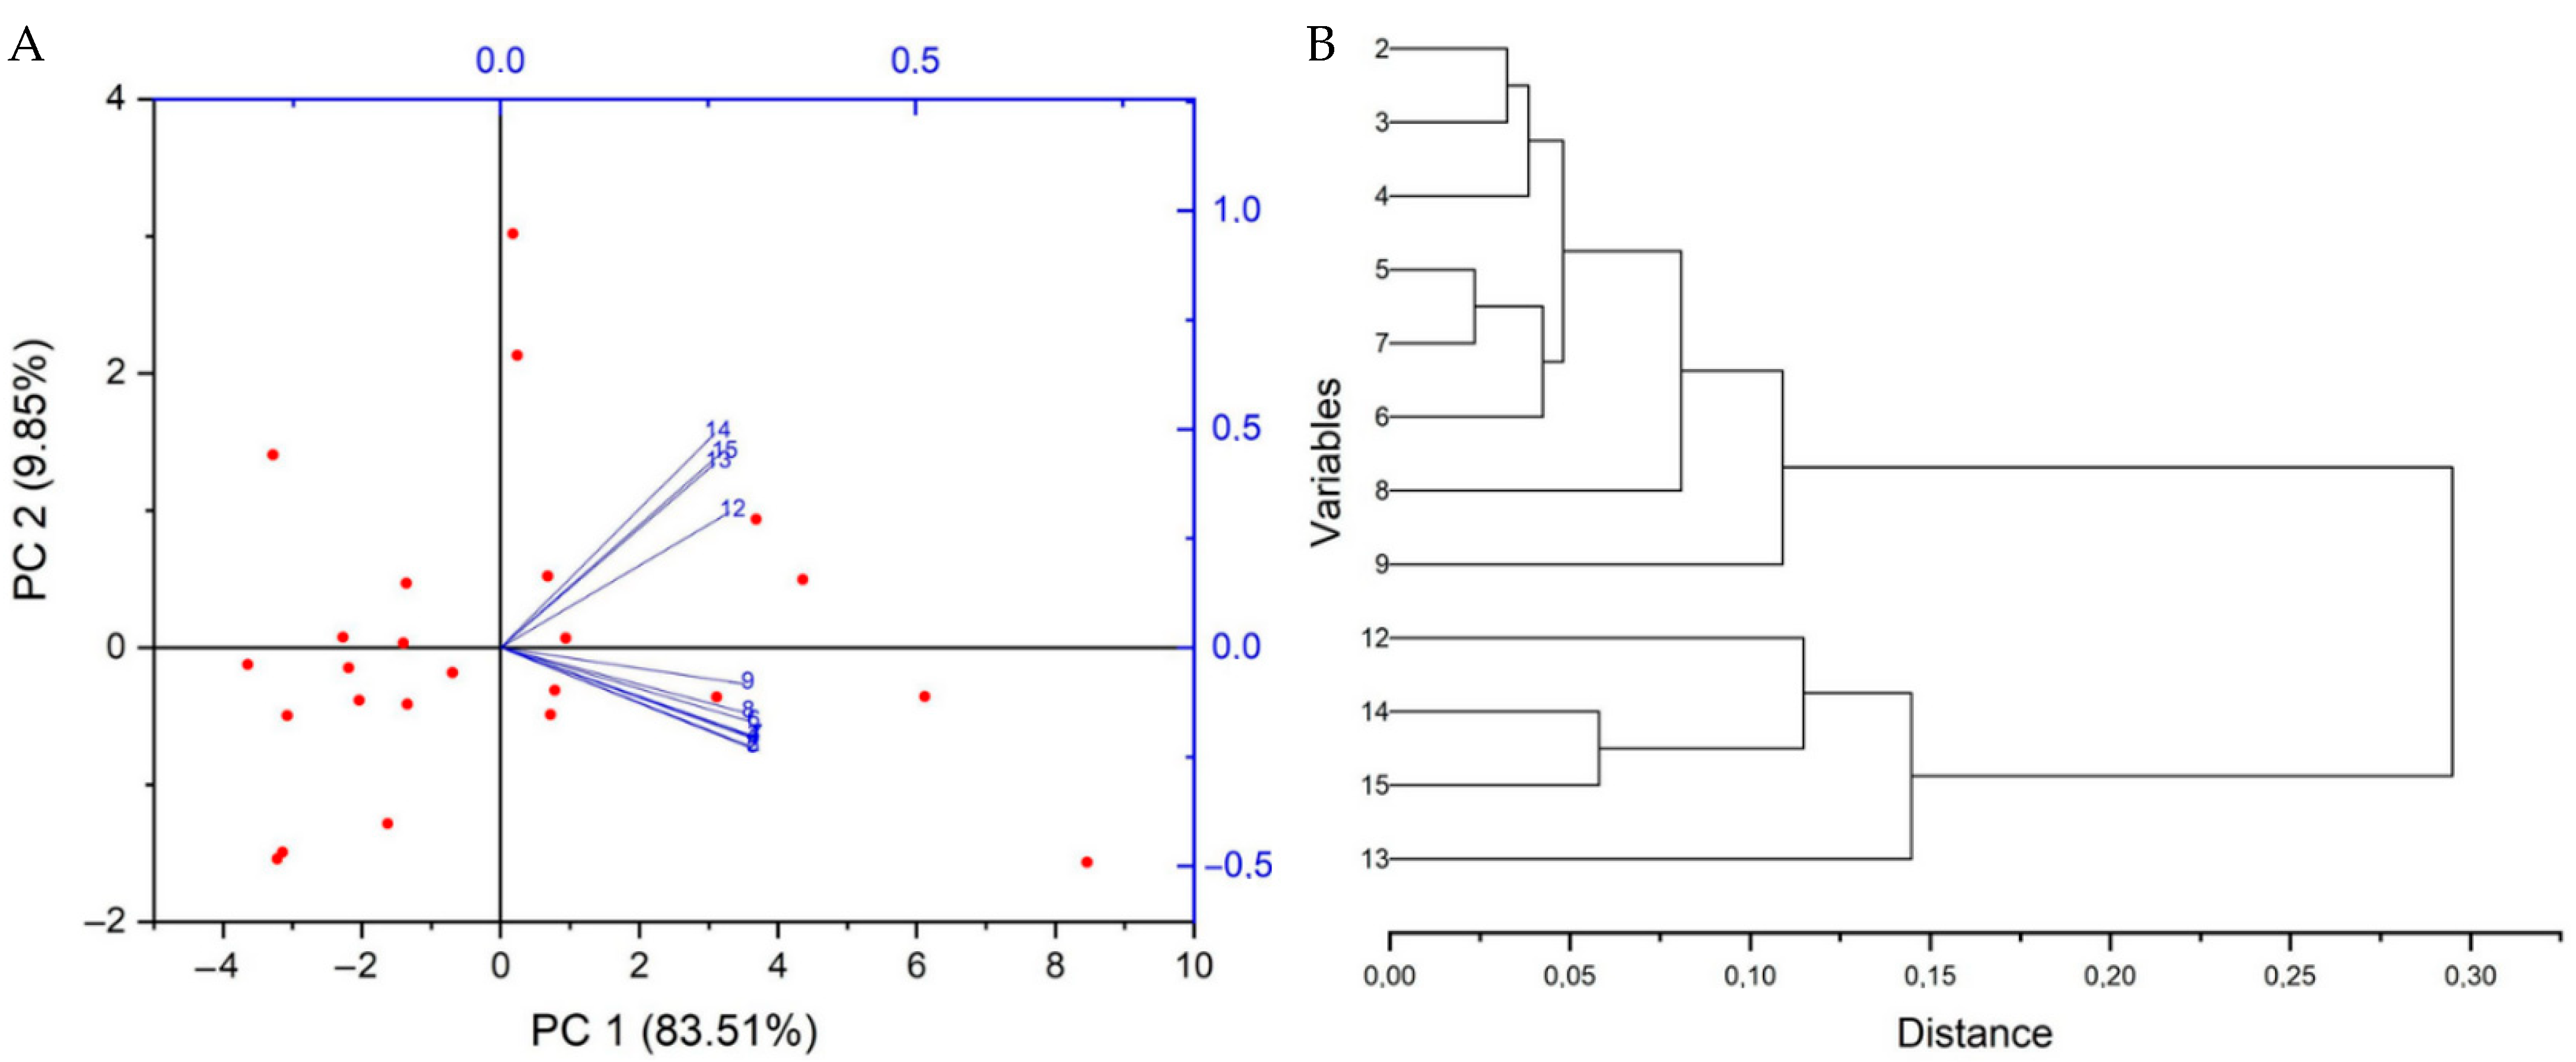
TP has the lowest interaction force among the considered parameters, so its values on the Bystrzyca River scale do not differ significantly. The biggest differences can be seen in points near the Marszowice HP (12–15) compared to the other points (median 0.12–0.14 mg/L and 0.08–0.09 mg/L, respectively), but it is not related to the operation of the HPs (no statistical significance). This distinctness of the points can be seen in both the HCA and PCA (Figure 8). In most cases (about 18 out of 24 months), the norms of TP were not exceeded, and in only one month, these norms were exceeded by marginal values in only one month (Figure A5). Low values of TP indicate a low probability of eutrophication on the scale of the Bystrzyca River (phosphorus compounds have the greatest potential to cause water blooms) and low pollution with sewage (industrial and domestic) and phosphorus fertilizers from agriculture [26,99].

3.4. Cumulative Effect of Hydropower Plants on the Tested Physicochemical Parameters

Statistically significant changes between the points above and below the HPs were recorded for the following parameters: conductivity (Skałka HP), NO3-N (Marszowice HP), dissolved oxygen (Marszowice HP), pH (Skałka and Marszowice HPs). and ammonium nitrogen (Marszowice HP).
However, taking into account the absolute values of the percentage effect of changes below the analysed hydropower facilities, the following parameters should be taken into account (with an effect higher than 5%): NO3-N (Marszowice HP = 5.50%), DO (Marszowice HP = 14.04%), TP (Skałka HP = −7.22%), BOD5 (Sadowice HP = 20.16%, Skałka HP = 14.78%, Marszowice HP = 7.80%), NO2-N (Marszowice HP = −9.77%), NH4N (Marszowice HP = −27.83%), turbidity (Sadowice HP = 5.75%, Skałka HP = 5.95%, Marszowice HP = −7.14%). The described effects for all parameters within each HP are presented in Table 6.
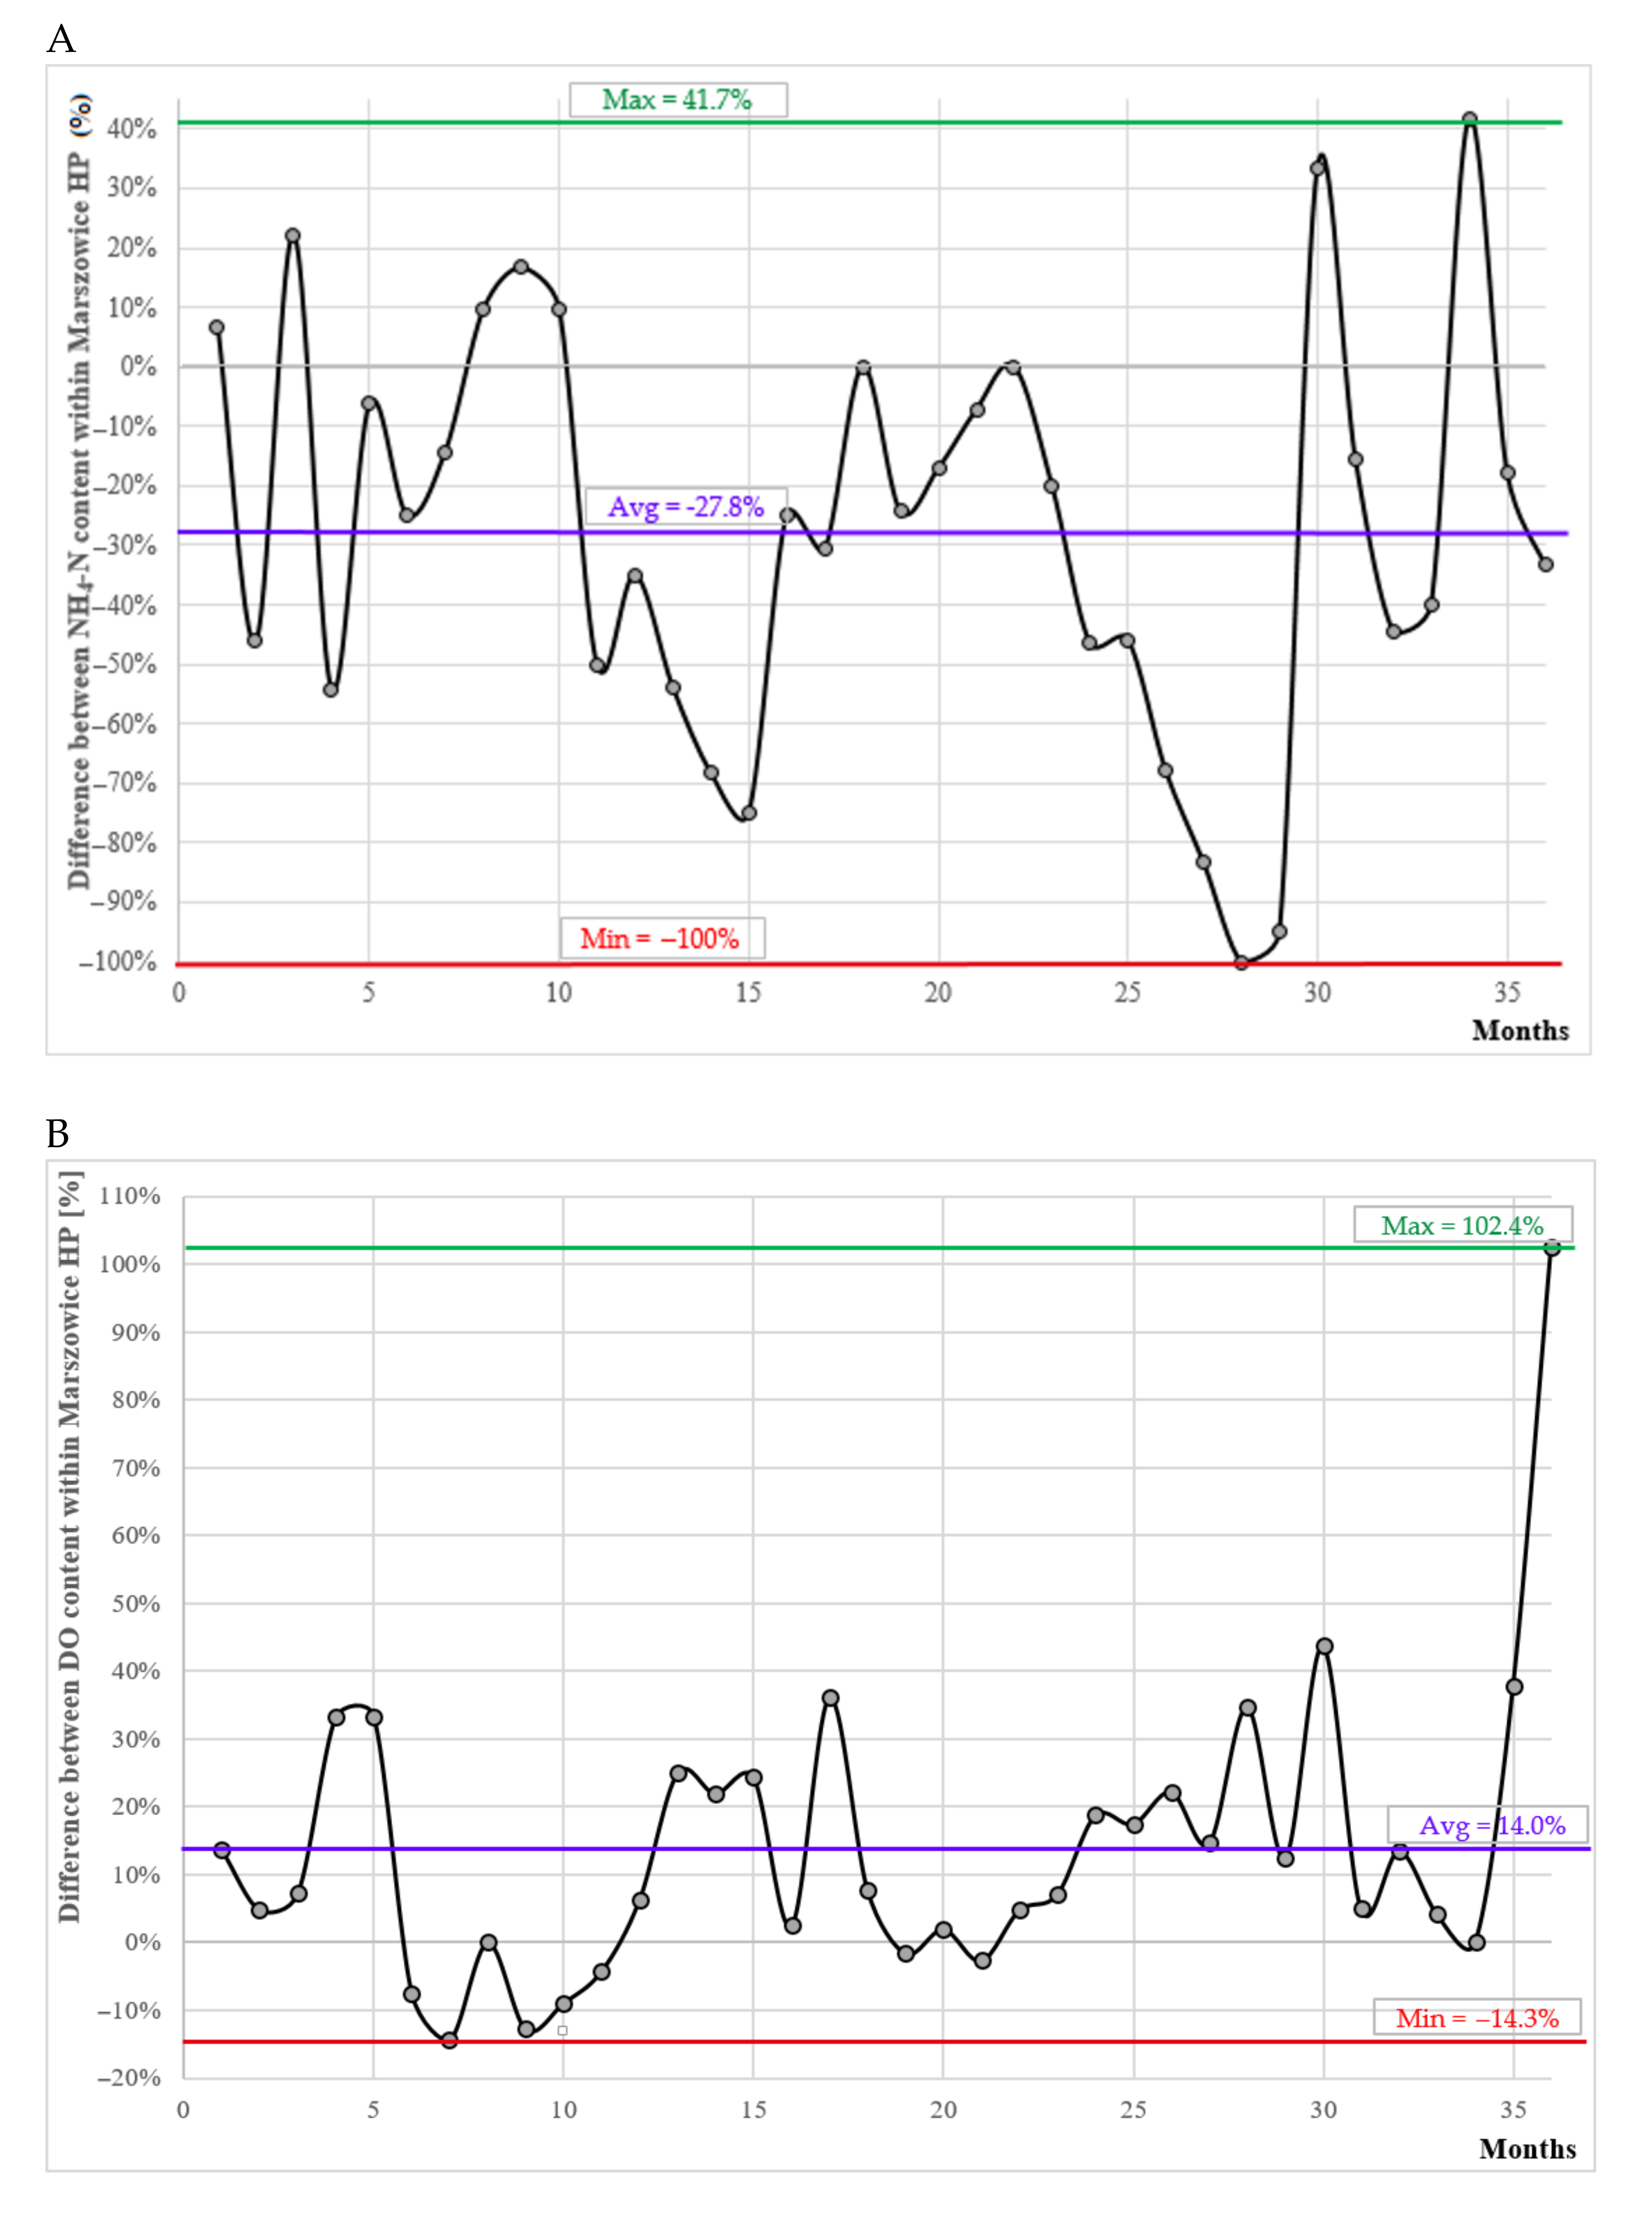
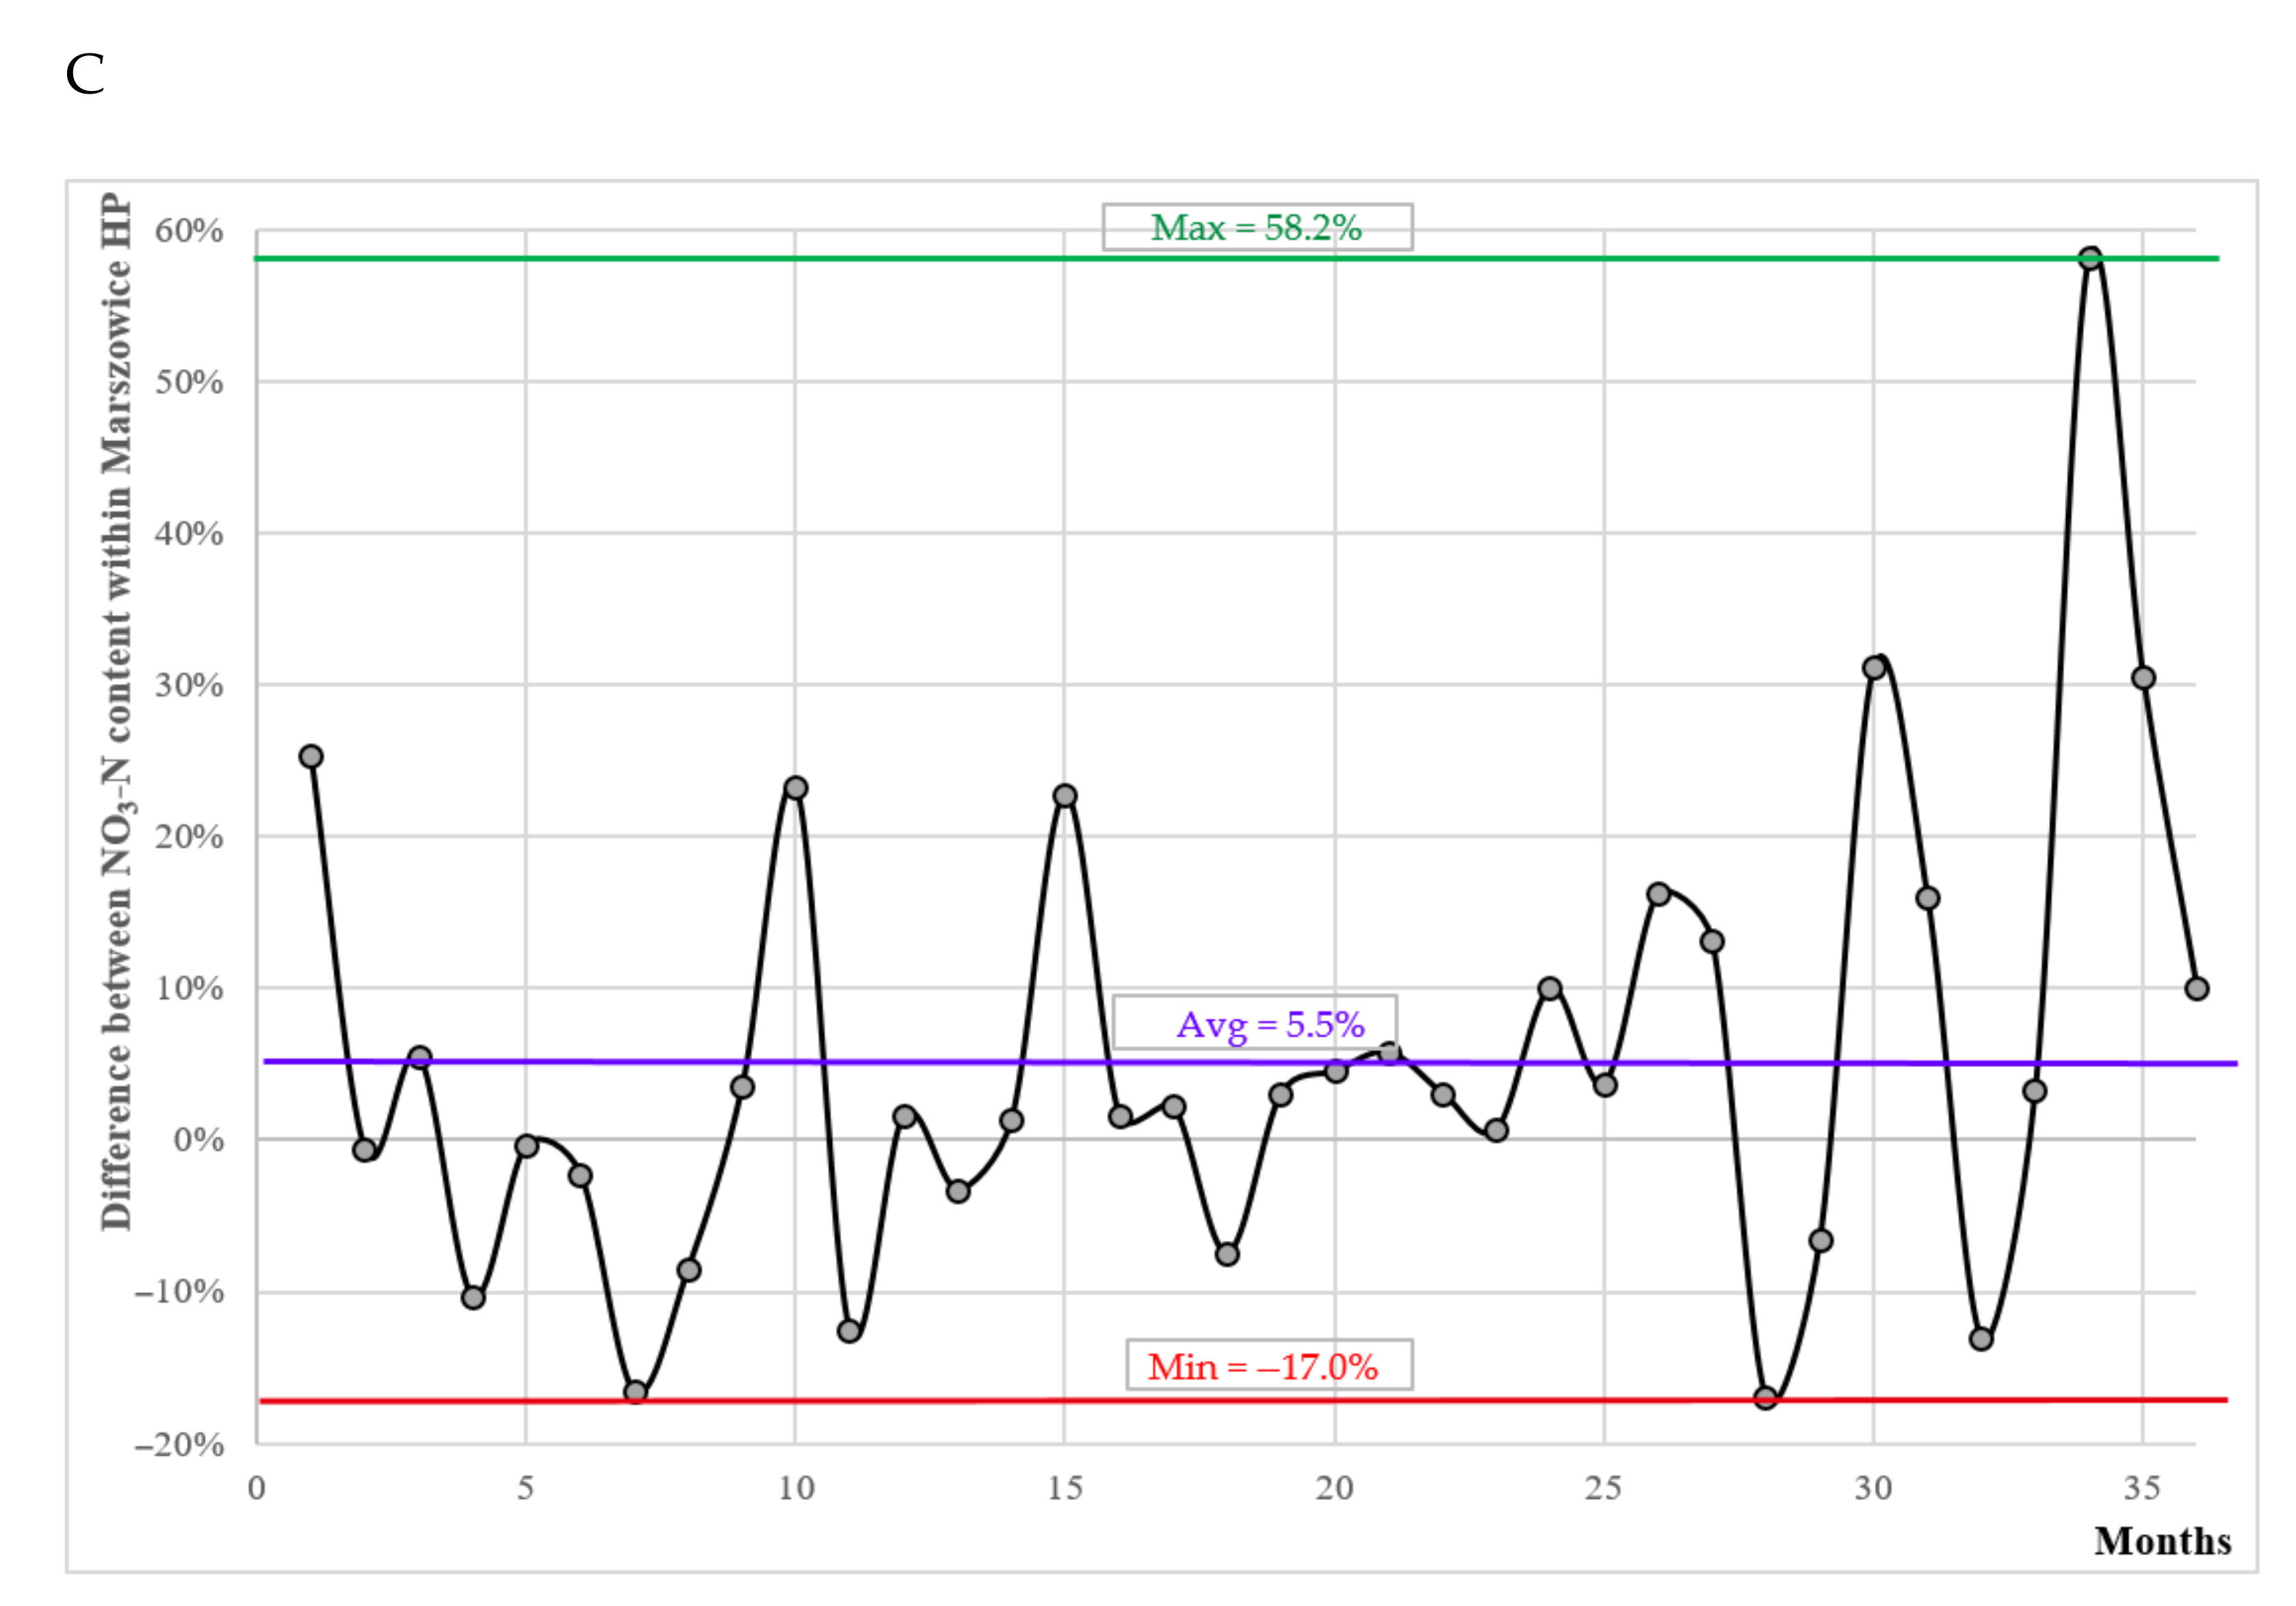
Based on the above analyses, it can be concluded that statistically significant parameters with an effect below HPs greater than 5% were recorded for the Marszowice HP with regard to the following parameters: NH4-N (−27.83%), DO (14.04%), and NO3-N (5.50%). For these parameters, graphs were drawn showing the variability of the percentage effects of individual parameters over time (Figure 9).
Analysing the results from the highest effects, a decrease in content was found for NH4-N below the Marszowice HP. This means that, according to the literature review, some of the nutrients remain above the hydropower facility and accumulate in bottom sediments above the damming thresholds. This effect is clear and applies to 29 out of 36 analysed research months (minimum value of the effect = −100%, average = −27.8%, maximum = 41.7%).
In the case of dissolved oxygen, the effect of HPs is smaller, mainly due to the phenomenon of hydraulic jump. Downstream of the hydropower structure, the water is usually oxygenated as a result of a vortex motion. Such a relationship was visible in 28 out of 36 analysed months, with the maximum effect being 102.4%, the average effect 14.0%, and the lowest −17.0%.
The smallest effect of the statistically significant parameters that was simultaneously higher than the standard statistical error was for NO3-N. In this case, there was an increase below the HP, which is contrary to the decrease in content usually assumed in the literature below the HP. The reason may be the agricultural use of the catchment area and surface runoff from the surrounding meadows and pastures where plant protection products are applied [11,26]. The NO3-N increase effect was recorded in 24 out of 36 months (the minimum achieved effect value was −17.0%, the average was −5.5%, and the maximum was −58.2%).
Other effects greater than 5% were for TP (Skalka HP) and NO2-N (Marszowice HP), indicating a decrease in nutrient concentrations below HPs. The results for BOD5 are also convergent, which proves the greater amount of oxygen necessary for the oxidation of organic compounds by organisms, and thus a higher content of organic substances below HPs. However, it is difficult to say what kind of organic substances they are. The only heterogeneous results, with an effect higher than 5%, were for turbidity for the Sadowice and Skałka HPs; these values are higher below the damming, while for the Marszowice HP they were lower. The field observations show that the decrease in turbidity in the Marszowice HP may be caused by the stagnation of sediments suspended in the derivative canal, deteriorating the oxygen conditions there (which is reflected in the results of NH4-N, NO2-N, and DO). In the case of the Sadowice and Skałka HPs, some of the bottom sediments are passed through the damming thresholds and, due to the vortex movement caused by water discharges, mixed in the water column, causing greater turbidity of the water. This may result from the construction of HPs: in the first case, water is taken from the left bank of the river, and in the second and third from the entire bed [26,82].
Looking at the number of statistically significant impacts (for the Sadowice HP, 0; for Skałka, two; and for Marszowice, five), it can be concluded that a higher damming height causes a greater number of impacts (Sadowice = 1.8 m, Skałka = 2.2 m, Marszowice = 3.75 m) [82]. The power of HPs also correlates in this case with the damming height and may have an impact on the number and magnitude of impacts.
Compared to other hydropower studies, there is an increase in dissolved oxygen content below hydropower facilities (San Xusto Flow Hydroelectric Power Station in Spain [56] of 7.12%, vs. in this study from 0.56% to 14.04%), a decrease in TP content (storage HPs in Lithuania with average head [38] by 26.97%, run-of-river large HP in Brazil by 28%, this study from 7.22% to 0.19%). According to other studies, there are drops among other nutrients: NO3 by 14%, TN by 2.08–15.49%; in the case of this study, there was a decrease of 5.06% for TN in one power plant, while in the others there was an increase of almost 0% and 3.15% (this results from taking into account only NH4-N, NO3-N, and NO2-N, without other forms of it, which may give different results; NO3-N takes higher values than NO2-N and NH4-N, so the final results could be different). The same relationship applies to NO3-N, i.e., the change in the value between about −5% and +5% (the reason is most likely the agricultural use of the areas near the Marszowice HP) [26].
The results summarized in Table 7 show that, the higher the slope of a HP, the greater the impact, and that the type of HP influences the magnitude of the impact (although the HPs in Lithuania [48] have a much lower damming height than the HP in Brazil [61], the change for TP is comparable and the percentage change for TN compared to the results in this article is three times higher). The differences in the magnitude of the effects of hydropower facilities indicate that the type of HP is much more important than the damming height: the greatest impact is therefore caused by reservoir HPs with a high damming height, while the smallest is caused by flow power plants with a low damming height.

3.5. The State of Physicochemical Elements at the Tested Measuring Points (Water Quality)

The general physicochemical condition of the considered parameters exceeds the assumed water quality standards [83] at each of the measuring points (taking into account the worst results). Exceedances concern the following parameters: NO2-N, NO3-N (without the 1 W point), BOD5, pH (without the 1W point), DO (without the 8 point), conductivity (9–16 W points), NH4-N, and TP (1W, 9W, 10W, 11W, and 16W). The standard was met for most or all of the points for temperature (class I), NH4-N, and TP (class II). The results show strong pollution in the lower reaches of the Bystrzyca River with substances of organic origin, deteriorating the oxygen and physical properties of the water. In addition, in the case of conductivity, the deterioration takes place at points within the city limits of Wrocław. HPs do not have an effect or have an insignificant effect on the considered parameters in the context of their classification to a specific class of physicochemical conditions (points 2/3, 6/7, and 13/14). As a supplement to the analyses, confirming the pollution of the Bystrzyca River with organic compounds, the standards for TSS, TDS, COD-Mn, SO4, and Cl were exceeded at all points, as well as for KN and TN at points 9W, 10W, 11W, and 16W. The greatest exceedances were for TSS and KN (approximately 10-fold greater than the limits). Due to the difficulty of comparing the results for monitoring points from several to several dozen years with our own results from 2–3 years, the issue of time variability of parameters and factors affecting them is described in more detail in Section 3.7. Table 8 and Table 9 show the physicochemical condition of the considered parameters in all analysed points on the Bystrzyca River.
Designations in the table: blue = very good status of parameter (first class), green = good status of parameter (second class), red = does not meet the standards, n/d = no data, italics = points above and below HPs.

3.6. Requirements for the Living Conditions of Aquatic Organisms

The river is the habitat of aquatic organisms. An important element of the functioning of water-related ecosystems is the fulfilment of certain requirements regarding the physicochemical properties of the water. For this reason, due to natural conditions but also aquaculture purposes, these criteria are defined. For the purposes of the assessment, salmonids and cyprinids are most often distinguished due to their different ecological tolerances [100].
The most important factor determining the living conditions of aquatic organisms is the content of dissolved oxygen. In the case of the considered HPs, the conditions for the life of salmonids were not met, in accordance with the Polish requirements [75] (Table 10)—the concentration of dissolved oxygen was lower than 7 mg/L at the Sadowice and Skałka HPs and above at the Marszowice HP (in 23 out of 24 months). For cyprinids, the assumed requirements were met at each point, i.e., dissolved oxygen concentration higher than 5 mg/L. Taking into account other studies, above the Marszowice HP, carp and other aquatic organisms well adapted to difficult conditions, such as water fleas, would survive. In other cases, most organisms would survive, with the exception of, for example, juvenile forms of salmonids (Table 11). Typically, most aquatic organisms survive at oxygen concentrations higher than 5 mg/L and are resistant to drops in this level for a short time, and therefore all HPs would meet this condition (values lower than 5 mg/L were recorded only once in the whole research period).
With regard to the other parameters, the temperature criterion for salmonids within the Marszowice HP was not met; it was 0.5–0.6 degrees higher than the norm, but its fluctuations do not exclude the existence of this group of organisms. The amplitude of the pH at the points above and below this HP was also a bit too high for cyprinids and salmonids—0.6 degrees or 0.5. Exceedances of the BOD5 standard for salmonids were found for all HPs—in this case, they are exceeded by about 2-fold, which indicates too much pollution with organic compounds (for cyprinids, these exceedances were insignificant; they were recorded above the Sadowice HP, below the Skałka HP, and above and below the Marszowice HP). Salmonid standards for nitrite were not met; concentrations were double the norm. The TP values for salmonids were slightly exceeded, and this applies to the point below the Sadowice HP and within the Marszowice HP. Standards were met at all points for pH, NH4-N (salmonids and cyprinids), TP, and dissolved oxygen and nitrite (cyprinids), as well as for temperature fluctuations. The overall results show that, within the considered HPs, the assumed standards for salmonids and for cyprinids in relation to points 2, 7, 13, and 14 (above Sadowice HP, below Skałka HP, and within Marszowice HP) were not met, although in the light of the results, it can be seen that the HPs themselves on the Bystrzyca River scale have little impact on this condition, especially looking at the data from many years (see Section 3.5 and Section 3.7); other factors play a major role. The worst conditions for fish are in the Marszowice HP, the only one located in a highly urbanized area (Wrocław) [26]. It should be added that no HP has a fish ladder, which significantly prevents the migration of aquatic organisms that are unable to overcome this transverse barrier and are injured or die after attempting to pass through it [82,101,102,103,104].

3.7. Other Factors Influencing the Physicochemical Status of the Bystrzyca River

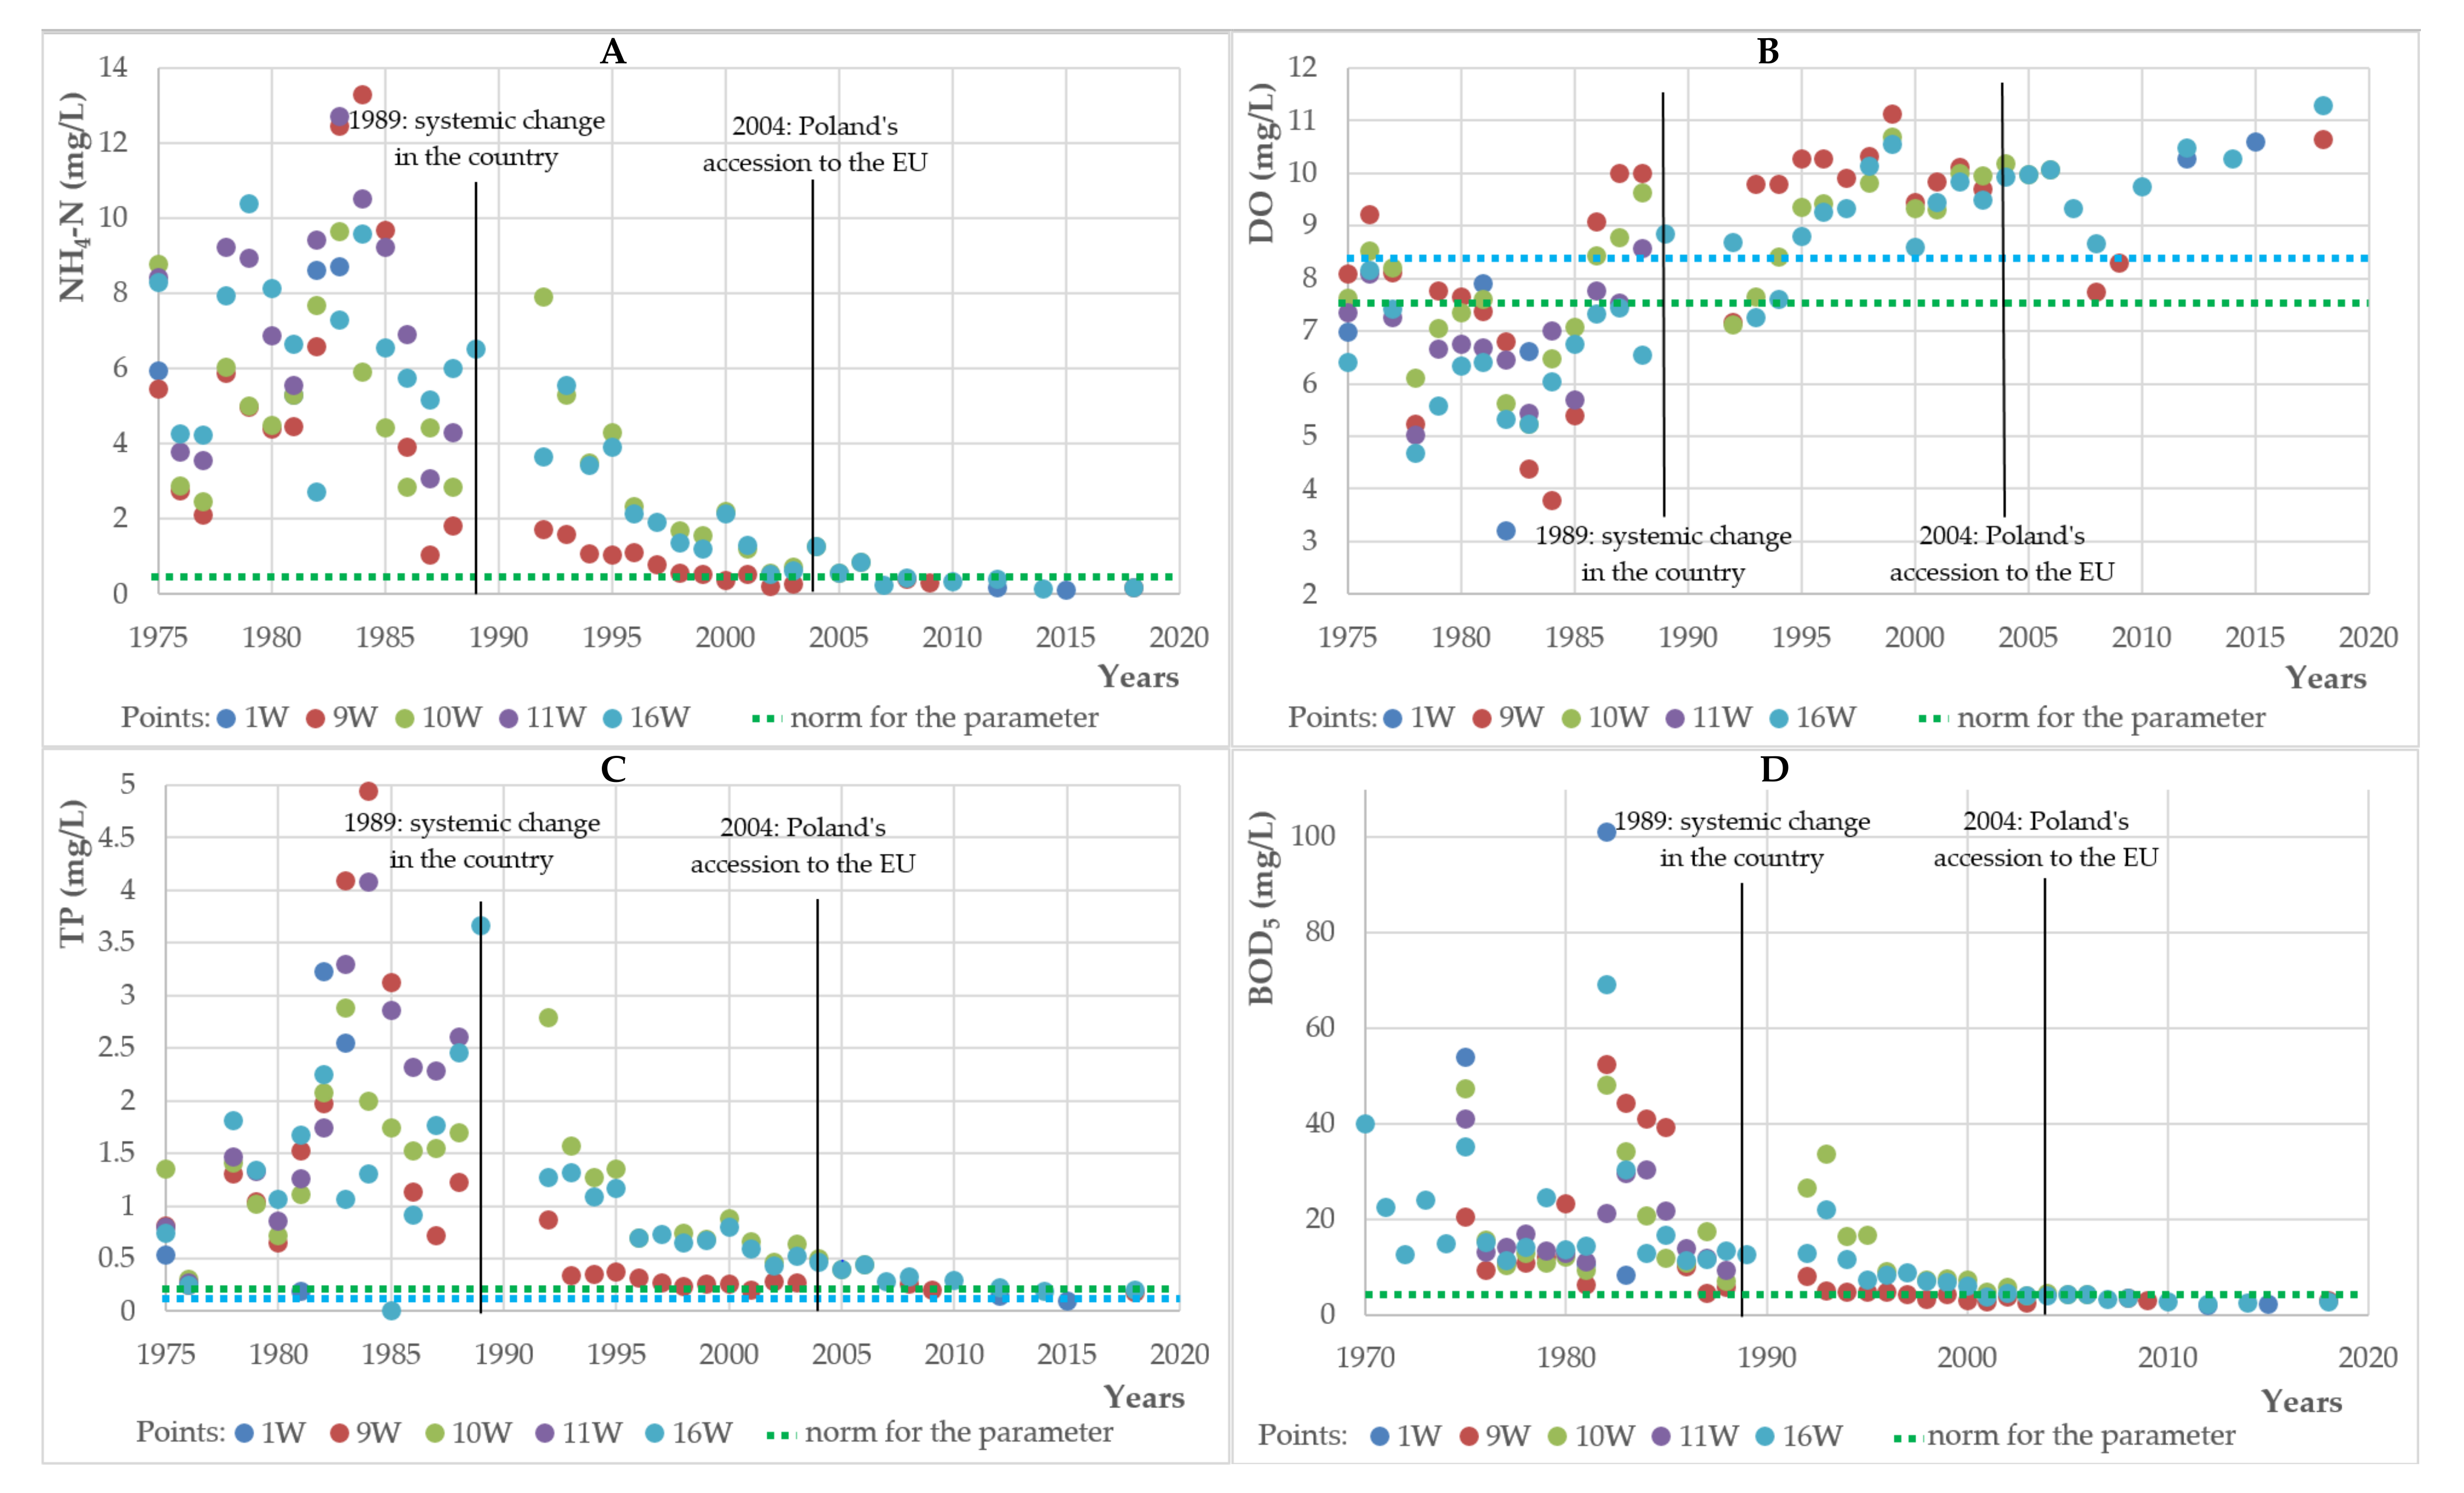
The state of the physicochemical elements in the Bystrzyca River has changed over the years. As can be seen in Figure 10, there are distinct periods when the condition has gradually started to improve. The most spectacular cause of this state of affairs was June 4, 1989, when the first democratic elections were held in Poland [105]. Since then, the system has changed from communist to democratic, which means a thorough overhaul of the existing political and economic system [106]. In the context of the parameters mentioned below (NH4-N, DO, BOD5, and TP), it is associated in particular with the abandonment of Poland’s economic development attitude towards heavy industry and switching to services, precision industry, and more environmentally friendly agriculture, not using a highly toxic large-scale plant [107]. The systemic change was also associated with wider international cooperation, e.g., in the field of environmental protection (including the ratification in 1996 of the provisions contained in the 1992 UN Earth Summit on climate change, sustainable development, biodiversity, and forest protection) [108].
Another important event for Poland, which resulted in the tightening of regulations related to the monitoring of the aquatic environment, was Poland’s accession to the European Union on May 1, 2004 [109]. Along with joining the ranks of this institution, the country gained access to a number of facilities, such as EU subsidies, but in return was obliged to implement EU law [110]. The most important legal act in the field of water protection is the Water Framework Directive [79], thanks to which new procedures and institutions related to the issues of rational use of water resources, as well as ensuring their appropriate quantitative and qualitative status, were created. The first such commitment in Poland was to achieve at least good ecological status in surface water bodies (JCWP) by 2015, and in the event of noncompliance with the standards by 2021 [79,111]. There is also a new water quality assessment system that takes into account the chemical and ecological status of JCWP (along with the new assessment system, more restrictive water quality standards have been implemented, distinguished for various types of abiotic waters) [112]. In the context of renewable energy sources, Poland takes into account the assumptions of the EU Directive related to RES [113,114,115], implementing them in its own energy policy and assuming, inter alia, achieving appropriate levels of the use of renewable energy sources in the country’s energy balance (21% in 2030) [116].
To confirm the above statements, the results for selected physicochemical parameters, presented in Figure 10, will be compared. In the case of NH4-N, the median value until 1989 was 5.9 mg/L, in 1990–2003 1.36 mg/L, and from 2004 0.40 mg/L. Thus, it has decreased almost 15-fold since the change of the political system. In the case of DO, the values were, respectively, 7.04, 9.49, and 10.07 mg/L (increase by 43%), for TP, 1.44, 0.66, and 0.28 mg/L (decrease by 80.6%), and for BOD5, 14.09, 6.18, and 3.31 mg/L (decrease by 76.5%). Other examples include TSS (decrease 64.5%), COD-Mn (decrease 82.9%), and NO2-N (decrease 77.5%).
In all research periods, regardless of the location of the research points, the Marszowice, Skałka, and Sadowice HPs operated, and looking, for example, at the median of mean NH4-N concentrations at points above and below Marszowice HP (statistically significant results for this parameter), for the common years the river studies did not differ significantly (at point 10 W the value was 0.174 mg/L, while at 16 W it was 0.1795 mg/L; common study period: 1977–1988, 1992–1996, and 1998–2006).

4. Conclusions

The conclusions of the research are as follows:
(1)
The investigated HPs influence the selected physicochemical parameters of water (Section 3.1 and Section 3.2).
(2)
On the scale of the studied section of the Bystrzyca River, the following parameters changed statistically significantly: EC (effect size 0.924), NO3-N (0.541), DO (0.322), pH (0.310), and TP (0.179) (Table 5).
(3)
A statistically significant effect (p < 0.05) was found for the Skałka HP (EC and pH) and Marszowice (EC, NO3-N, DO, pH, and NH4-N) (Section 3.2).
(4)
Statistically significant and higher than 5% impact within the Marszowice HP on the following parameters: NH4-N (decrease below the HP by 27.83%), DO (increase by 14.0%), and NO3-N (increase by 5.5%) (Table 6).
(5)
Taking into account our results and those from the literature review, we see that the scale of the impact of HPs is influenced by their type and water level. The higher the damming height, the greater the impact on the values of physicochemical parameters (the damming heights of the Marszowice, Skałka, and Sadowice HPs are, respectively, 3.75, 2.2, and 1.8 m; five, two, and zero parameters changed significantly within the HPs) (Table 6 and Table 7).
(6)
It was found that run-of-river HPs have less impact on physicochemical parameters than reservoir ones and this is more important than the damming height (e.g., change of TP below HPs: reservoir HP, with a damming height of 5–15 m = −26.97%, run-of-river HP, damming height 243 m = −28.0%, run-of-river HPs below 5 m = −7.22 to −0.19%) (Table 7).
(7)
Our results corroborate the results of other scientists in terms of an increase in dissolved oxygen below hydropower facilities, a decrease in conductivity, and a decrease in TP concentrations. The results for turbidity, NO3-N, and TN are partially different (decreases in other tests, negative and positive values in our own tests, but usually they are not statistically significant) (Section 3.4).
(8)
HPs should be tested each time within the barrages on which they are located. Research has shown that HPs have little impact on the shaping of water quality over a larger time and spatial scale (longitudinal profile of the watercourse) (Section 3.3 and Appendix A), where a greater role may be played by the use of the river basin, the applicable political system, and environmental requirements (e.g., in agriculture and water protection) (Section 3.7).
(9)
There were no significant differences in the impact of HPs on physicochemical parameters in the context of the assessment of their condition (water quality classification) and in terms of meeting the requirements for the life of aquatic organisms. The results were similar above and below hydropower facilities (Section 3.5 ).

Author Contributions

Author Contributions: Conceptualization, P.T. and M.W.; methodology, P.T. and M.W.; software, P.T.; validation, P.T.; formal analysis, P.T.; investigation, P.T. and M.W.; resources, P.T. and M.W.; data curation, P.T.; writing—original draft preparation, P.T.; writing—review and editing, M.W.; visualization, P.T.; supervision, M.W. All authors have read and agreed to the published version of the manuscript.

Funding

This research received no external funding.

Data Availability Statement

Not applicable.

Conflicts of Interest

The authors declare no conflict of interest.

Appendix A

Figures showing the temporal and spatial variability of statistically significant parameters on the scale of the Bystrzyca River, Poland.
Figure A1. Temporal and spatial variability of EC at the tested measurement points, including the physicochemical condition of the parameter and statistical significance within the Sadowice, Skałka, and Marszowice HPs (p < 0.05).
Energies 14 02075 g0a1
Figure A2. Temporal and spatial variability of NO3-N at the tested measurement points, including the physicochemical condition of the parameter and statistical significance within the Sadowice, Skałka, and Marszowice HPs (p < 0.05).
Energies 14 02075 g0a2
Figure A3. Temporal and spatial variability of DO at the tested measurement points, including the physicochemical condition of the parameter and statistical significance within the Sadowice, Skałka, and Marszowice HPs (p < 0.05).
Energies 14 02075 g0a3
Figure A4. Temporal and spatial variability of pH at the tested measurement points, including the physicochemical condition of the parameter and statistical significance within the Sadowice, Skałka, and Marszowice HPs (p < 0.05).
Energies 14 02075 g0a4
Figure A5. Temporal and spatial variability of TP at the tested measurement points, including the physicochemical condition of the parameter and statistical significance within the Sadowice, Skałka, and Marszowice HPs (p < 0.05).
Energies 14 02075 g0a5

References

  1. REN21 (Renewable Energy Policy Network for the 21st Century). Renewables 2020: Energy Status Report 2020; REN21: Paris, France, 2021. [Google Scholar]
  2. Hoes, O.A.; Meijer, L.J.; Van Der Ent, R.J.; Van De Giesen, N.C. Systematic high-resolution assessment of global hydropower potential. PLoS ONE 2017, 12, e0171844. [Google Scholar] [CrossRef] [PubMed]
  3. Redl, C.; Hein, F.; Buck, M.; Graichen, P.; Jones, D. The European Power Sector in 2020: Up-to-Date Analysis on the Electricity Transition; Agora Energiewende, EMBER: Berlin, Germany, 2021. [Google Scholar]
  4. Henley, W. 2020 Hydropower Status Report: Sector Trends and Insights Report; IHA (The International Hydropower Association): London, UK, 2021. [Google Scholar]
  5. Tomczyk, P.; Wiatkowski, M. Challenges in the Development of Hydropower in Selected European Countries. Water 2020, 12, 3542. [Google Scholar] [CrossRef]
  6. Hamududu, B.H.; Killingtveit, Å. Hydropower Production in Future Climate Scenarios; the Case for the Zambezi River. Energies 2016, 9, 502. [Google Scholar] [CrossRef] [Green Version]
  7. Donk, P.; Van Uytven, E.; Willems, P.; Taylor, M.A. Assessment of the potential implications of a 1.5 °C versus higher global temperature rise for the Afobaka hydropower scheme in Suriname. Reg. Environ. Chang. 2018, 18, 2283–2295. [Google Scholar] [CrossRef]
  8. Bilotta, G.S.; Burnside, N.G.; Turley, M.D.; Gray, J.C.; Orr, H.G. The effects of run-of-river hydroelectric power schemes on invertebrate community composition in temperate streams and rivers. PLoS ONE 2017, 12, e0171634. [Google Scholar] [CrossRef] [PubMed] [Green Version]
  9. Kjaerstad, G.; Arnekleiv, J.V.; Speed, J.D.M.; Herland, A.K. Effects of hydropeaking on benthic invertebrate community composition in two central Norwegian rivers. River Res. Appl. 2018, 34, 218–231. [Google Scholar] [CrossRef]
  10. Zhou, S.; Tang, T.; Wu, N.; Fu, X.; Jiang, W.; Li, F.; Cai, Q. Impacts of cascaded small hydropower plants on microzooplankton in Xiangxi River, China. Acta Ecol. Sin. 2009, 29, 62–68. [Google Scholar] [CrossRef]
  11. Wiatkowski, M.; Rosik-Dulewska, C.; Tomczyk, P. Hydropower Structures in the Natura 2000 Site on the River Radew: An Analysis in the Context of Sustainable Water Development. Ann. Set Environ. Prot. 2017, 19, 65–80. [Google Scholar]
  12. Camargo, J.A. Responses of aquatic macrophytes to anthropogenic pressures: Comparison between macrophyte metrics and indices. Environ. Monit. Assess. 2018, 190, 173. [Google Scholar] [CrossRef]
  13. Virbickas, T.; Vezza, P.; Kriaučiūnienė, J. Impacts of low-head hydropower plants on cyprinid-dominated fish assemblages in Lithuanian rivers. Sci. Rep. 2020, 10, 21687. [Google Scholar] [CrossRef]
  14. Chiogna, G.; Majone, B.; Paoli, K.C.; Diamantini, E.; Stella, E.; Mallucci, S.; Lencioni, V.; Zandonai, F.; Bellin, A. A review of hydrological and chemical stressors in the Adige catchment and its ecological status. Sci. Total. Environ. 2016, 540, 429–443. [Google Scholar] [CrossRef] [Green Version]
  15. Bejarano, M.D.; Sordo-Ward, Á.; Alonso; Nilsson, C. Characterizing effects of hydropower plants on sub-daily flow regimes. J. Hydrol. 2017, 550, 186–200. [Google Scholar] [CrossRef] [Green Version]
  16. Młyński, D.; Operacz, A.; Wałęga, A. Sensitivity of methods for calculating environmental flows based on hydrological characteristics of watercourses regarding the hydropower potential of rivers. J. Clean. Prod. 2020, 250, 119527. [Google Scholar] [CrossRef]
  17. Nguyen, T.H.T.; Forio, M.A.E.; Boets, P.; Lock, K.; Ambarita, M.N.D.; Suhareva, N.; Everaert, G.; Van Der Heyden, C.; Dominguez-Granda, L.E.; Hoang, T.H.T.; et al. Threshold Responses of Macroinvertebrate Communities to Stream Velocity in Relation to Hydropower Dam: A Case Study from The Guayas River Basin (Ecuador). Water 2018, 10, 1195. [Google Scholar] [CrossRef] [Green Version]
  18. Kibler, K.M.; Tullos, D.D. Cumulative biophysical impact of small and large hydropower development in Nu River, China. Water Resour. Res. 2013, 49, 3104–3118. [Google Scholar] [CrossRef]
  19. Kumar, A.; Sharma, M. Greenhouse Gas Emissions from Hydropower Reservoirs. Hydro Nepal J. Water Energy Environ. 2012, 11, 37–42. [Google Scholar] [CrossRef] [Green Version]
  20. Soininen, N.; Belinskij, A.; Vainikka, A.; Huuskonen, H. Bringing back ecological flows: Migratory fish, hydropower and legal maladaptivity in the governance of Finnish rivers. Water Int. 2018, 44, 321–336. [Google Scholar] [CrossRef] [Green Version]
  21. Klaver, G.; Van Os, B.; Negrel, P.; Petelet-Giraud, E. Influence of hydropower dams on the composition of the suspended and riverbank sediments in the Danube. Environ. Pollut. 2007, 148, 718–728. [Google Scholar] [CrossRef]
  22. Del Tánago, M.G.; Gurnell, A.M.; Belletti, B.; De Jalón, D.G. Indicators of river system hydromorphological character and dynamics: Understanding current conditions and guiding sustainable river management. Aquat. Sci. 2016, 78, 35–55. [Google Scholar] [CrossRef]
  23. Anderson, D.; Moggridge, H.; Warren, P.; Shucksmith, J. The impacts of ‘run-of-river’ hydropower on the physical and ecological condition of rivers. Water Environ. J. 2015, 29, 268–276. [Google Scholar] [CrossRef] [Green Version]
  24. Warner, R.F. Environmental impacts of hydroelectric power and other anthropogenic developments on the hydromorphology and ecology of the Durance channel and the Etang de Berre, southeast France. J. Environ. Manag. 2012, 104, 35–50. [Google Scholar] [CrossRef]
  25. Bishwakarma, M.; Støle, H. Real-time sediment monitoring in hydropower plants. J. Hydraul. Res. 2008, 46, 282–288. [Google Scholar] [CrossRef]
  26. Wiatkowski, M.; Tomczyk, P. Comparative Assessment of the Hydromorphological Status of the Rivers Odra, Bystrzyca, and Ślęza Using the RHS, LAWA, QBR, and HEM Methods above and below the Hydropower Plants. Water 2018, 10, 855. [Google Scholar] [CrossRef] [Green Version]
  27. Bakken, T.H.; Sundt, H.; Ruud, A.; Harby, A. Development of Small Versus Large Hydropower in Norway—Comparison of Environmental Impacts. Energy Procedia 2012, 20, 185–199. [Google Scholar] [CrossRef] [Green Version]
  28. Bunea, F.; Ciocan, G.D.; Oprina, G.; Baran, G.; Babutanu, C.A. Hydropower Impact on Water Quality. Environ. Eng. Manag. J. 2010, 9, 1459–1464. [Google Scholar] [CrossRef]
  29. Siergieiev, D.; Widerlund, A.; Lundberg, A.; Almqvist, L.; Collomp, M.; Ingri, J.; Öhlander, B. Impact of Hydropower Regulation on River Water Composition in Northern Sweden. Aquat. Geochem. 2013, 20, 59–80. [Google Scholar] [CrossRef]
  30. Tomczyk, P.; Wiatkowski, M. Shaping changes in the ecological status of watercourses within barrages with hydropower schemes—Literature review. Arch. Environ. Prot. 2020, 46, 78–94. [Google Scholar] [CrossRef]
  31. Kelly-Richards, S.; Silber-Coats, N.; Crootof, A.; Tecklin, D.; Bauer, C. Governing the transition to renewable energy: A review of impacts and policy issues in the small hydropower boom. Energy Policy 2017, 101, 251–264. [Google Scholar] [CrossRef]
  32. Rodriguez, J.-F. Hydropower landscapes and tourism development in the Pyrenees. Revue Géographie Alpine 2012, 100. [Google Scholar] [CrossRef] [Green Version]
  33. Ezcurra, E.; Barrios, E.; Ezcurra, P.; Ezcurra, A.; Vanderplank, S.; Vidal, O.; Villanueva-Almanza, L.; Aburto-Oropeza, O. A natural experiment reveals the impact of hydroelectric dams on the estuaries of tropical rivers. Sci. Adv. 2019, 5, eaau9875. [Google Scholar] [CrossRef] [PubMed] [Green Version]
  34. Spänhoff, B. Current status and future prospects of hydropower in Saxony (Germany) compared to trends in Germany, the European Union and the World. Renew. Sustain. Energy Rev. 2014, 30, 518–525. [Google Scholar] [CrossRef]
  35. Igliński, B. Hydro energy in Poland: The history, current state, potential, SWOT analysis, environmental aspects. Int. J. Energy Water Resour. 2019, 3, 61–72. [Google Scholar] [CrossRef] [Green Version]
  36. Wei, G.; Yang, Z.; Cui, B.; Li, B.; Chen, H.; Bai, J.; Dong, S. Impact of Dam Construction on Water Quality and Water Self-Purification Capacity of the Lancang River, China. Water Resour. Manag. 2009, 23, 1763–1780. [Google Scholar] [CrossRef]
  37. Yu, B.; Xu, L. Review of ecological compensation in hydropower development. Renew. Sustain. Energy Rev. 2016, 55, 729–738. [Google Scholar] [CrossRef]
  38. Fjeldstad, H.-P.; Pulg, U.; Forseth, T. Safe two-way migration for salmonids and eel past hydropower structures in Europe: A review and recommendations for best-practice solutions. Mar. Freshw. Res. 2018, 69, 1834–1847. [Google Scholar] [CrossRef] [Green Version]
  39. Schilt, C.R. Developing fish passage and protection at hydropower dams. Appl. Anim. Behav. Sci. 2007, 104, 295–325. [Google Scholar] [CrossRef]
  40. Kuriqi, A.; Pinheiro, A.N.; Sordo-Ward, A.; Bejarano, M.D.; Garrote, L. Ecological impacts of run-of-river hydropower plants—Current status and future prospects on the brink of energy transition. Renew. Sustain. Energy Rev. 2021, 142, 110833. [Google Scholar] [CrossRef]
  41. Suwal, N.; Kuriqi, A.; Huang, X.; Delgado, J.; Młyński, D.; Walega, A. Environmental Flows Assessment in Nepal: The Case of Kaligandaki River. Sustainability 2020, 12, 8766. [Google Scholar] [CrossRef]
  42. Okuku, E.O.; Bouillon, S.; Ochiewo, J.O.; Munyi, F.; Kiteresi, L.I.; Tole, M. The impacts of hydropower development on rural livelihood sustenance. Int. J. Water Resour. Dev. 2015, 32, 267–285. [Google Scholar] [CrossRef] [Green Version]
  43. Bejarano, M.; Sordo-Ward, A.; Gabriel-Martin, I.; Garrote, L. Tradeoff between economic and environmental costs and benefits of hydropower production at run-of-river-diversion schemes under different environmental flows scenarios. J. Hydrol. 2019, 572, 790–804. [Google Scholar] [CrossRef]
  44. Schramm, M.P.; Bevelhimer, M.S.; DeRolph, C.R. A synthesis of environmental and recreational mitigation requirements at hydropower projects in the United States. Environ. Sci. Policy 2016, 61, 87–96. [Google Scholar] [CrossRef] [Green Version]
  45. Mensah, J. Sustainable development: Meaning, history, principles, pillars, and implications for human action: Literature review. Cogent Soc. Sci. 2019, 5. [Google Scholar] [CrossRef]
  46. Chala, G.T.; Ma’Arof, M.I.N.; Sharma, R. Trends in an increased dependence towards hydropower energy utilization—a short review. Cogent Eng. 2019, 6. [Google Scholar] [CrossRef]
  47. Česonienė, L.; Dapkienė, M.; Punys, P. Assessment of the Impact of Small Hydropower Plants on the Ecological Status Indicators of Water Bodies: A Case Study in Lithuania. Water 2021, 13, 433. [Google Scholar] [CrossRef]
  48. Vaikasas, S.; Bastienė, N.; Pliūraitė, V. Impact of small hydropower plants on physicochemical and biotic environments in flatland riverbeds in Lithuania. J. Water Secur. 2015, 1, 1–13. [Google Scholar] [CrossRef] [Green Version]
  49. Foley, M.M.; Duda, J.J.; Beirne, M.M.; Paradis, R.; Ritchie, A.; Warrick, J.A. Rapid water quality change in the Elwha River estuary complex during dam removal. Limnol. Oceanogr. 2015, 60, 1719–1732. [Google Scholar] [CrossRef]
  50. Ashby, S.L.; Myers, J.L.; Laney, E.; Honnell, D.; Owens, C. The Effects of Hydropower Releases from Lake Texoma on Downstream Water Quality. J. Freshw. Ecol. 1999, 14, 103–112. [Google Scholar] [CrossRef]
  51. Bouaroudj, S.; Menad, A.; Bounamous, A.; Ali-Khodja, H.; Gherib, A.; Weigel, D.E.; Chenchouni, H. Assessment of water quality at the largest dam in Algeria (Beni Haroun Dam) and effects of irrigation on soil characteristics of agricultural lands. Chemosphere 2019, 219, 76–88. [Google Scholar] [CrossRef]
  52. Hudson-Edwards, K.A.; Macklin, M.G.; Jamieson, H.E.; Brewer, P.A.; Coulthard, T.J.; Howard, A.J.; Turner, J.N. The impact of tailings dam spills and clean-up operations on sediment and water quality in river systems: The Ríos Agrio–Guadiamar, Aznalcóllar, Spain. Appl. Geochem. 2003, 18, 221–239. [Google Scholar] [CrossRef]
  53. Zhang, Y.; Xia, J.; Liang, T.; Shao, Q. Impact of Water Projects on River Flow Regimes and Water Quality in Huai River Basin. Water Resour. Manag. 2010, 24, 889–908. [Google Scholar] [CrossRef]
  54. Muhammetoglu, A.; Muhammetoglu, H.; Oktas, S.; Ozgokcen, L.; Soyupak, S. Impact Assessment of Different Management Scenarios on Water Quality of Porsuk River and Dam System—Turkey. Water Resour. Manag. 2005, 19, 199–210. [Google Scholar] [CrossRef]
  55. Brainwood, M.; Burgin, S.; Maheshwari, B. Temporal variations in water quality of farm dams: Impacts of land use and water sources. Agric. Water Manag. 2004, 70, 151–175. [Google Scholar] [CrossRef]
  56. Valero, E. Characterization of the Water Quality Status on a Stretch of River Lérez around a Small Hydroelectric Power Station. Water 2012, 4, 815–834. [Google Scholar] [CrossRef] [Green Version]
  57. Álvarez, X.; Valero, E.; De La Torre-Rodríguez, N.; Acuña-Alonso, C. Influence of Small Hydroelectric Power Stations on River Water Quality. Water 2020, 12, 312. [Google Scholar] [CrossRef] [Green Version]
  58. Fantin-Cruz, I.; Pedrollo, O.C.; Girard, P.; Zeilhofer, P.; Hamilton, S.K. Changes in river water quality caused by a diversion hydropower dam bordering the Pantanal floodplain. Hydrobiology 2015, 768, 223–238. [Google Scholar] [CrossRef]
  59. Winton, R.S.; Calamita, E.; Wehrli, B. Reviews and syntheses: Dams, water quality and tropical reservoir stratification. Biogeosciences 2019, 16, 1657–1671. [Google Scholar] [CrossRef] [Green Version]
  60. Wu, J.-H.; Zhou, Y.; Ma, F. Air entrainment of hydraulic jump aeration basin. J. Hydrodyn. 2018, 30, 962–965. [Google Scholar] [CrossRef]
  61. Fantin-Cruz, I.; Pedrollo, O.; Girard, P.; Zeilhofer, P.; Hamilton, S.K. Effects of a diversion hydropower facility on the hydrological regime of the Correntes River, a tributary to the Pantanal floodplain, Brazil. J. Hydrol. 2015, 531, 810–820. [Google Scholar] [CrossRef]
  62. Lewis, W.M. Basis for the protection and management of tropical lakes. Lakes Reserv. Res. Manag. 2000, 5, 35–48. [Google Scholar] [CrossRef]
  63. Preece, R.M.; Jones, H.A. The effect of Keepit Dam on the temperature regime of the Namoi River, Australia. River Res. Appl. 2002, 18, 397–414. [Google Scholar] [CrossRef]
  64. Magadza, C.H.D. Environmental state of Lake Kariba and Zambezi River Valley: Lessons learned and not learned. Lakes Reserv. Res. Manag. 2010, 15, 167–192. [Google Scholar] [CrossRef]
  65. Pimenta, A.M.; Albertoni, E.F.; Palma-Silva, C. Characterization of water quality in a small hydropower plant reservoir in southern Brazil. Lakes Reserv. Res. Manag. 2012, 17, 243–251. [Google Scholar] [CrossRef]
  66. Da Cruz, R.F.; Hamilton, S.K.; Tritico, H.M.; Fantin-Cruz, I.; de Figueiredo, D.M.; Zeilhofer, P. Water quality impacts of small hydroelectric power plants in a tributary to the Pantanal floodplain, Brazil. River Res. Appl. 2021, 37, 448–461. [Google Scholar] [CrossRef]
  67. Lobato, T.D.C.; Hauser-Davis, R.A.; De Oliveira, T.F.; Maciel, M.C.; Tavares, M.R.M.; Da Silveira, A.M.; Saraiva, A.C.F. Categorization of the trophic status of a hydroelectric power plant reservoir in the Brazilian Amazon by statistical analyses and fuzzy approaches. Sci. Total. Environ. 2015, 506–507, 613–620. [Google Scholar] [CrossRef]
  68. Olden, J.D.; Naiman, R.J. Incorporating thermal regimes into environmental flows assessments: Modifying dam operations to restore freshwater ecosystem integrity. Freshw. Biol. 2010, 55, 86–107. [Google Scholar] [CrossRef]
  69. Zhong, Y.; Power, G. Environmental impacts of hydroelectric projects o n fish resources. Regul. Rivers Res. Manag. 2015, 12, 81–98. [Google Scholar] [CrossRef]
  70. Bogen, J.; Bønsnes, T.E. The impact of a hydroelectric power plant on the sediment load in downstream water bodies, Svartisen, northern Norway. Sci. Total. Environ. 2001, 266, 273–280. [Google Scholar] [CrossRef]
  71. Maavara, T.; Parsons, C.T.; Ridenour, C.; Stojanovic, S.; Dürr, H.H.; Powley, H.R.; Van Cappellen, P. Global phosphorus retention by river damming. Proc. Natl. Acad. Sci. USA 2015, 112, 15603–15608. [Google Scholar] [CrossRef] [Green Version]
  72. Smith, V.; Tilman, G.; Nekola, J. Eutrophication: Impacts of excess nutrient inputs on freshwater, marine, and terrestrial ecosystems. Environ. Pollut. 1999, 100, 179–196. [Google Scholar] [CrossRef]
  73. Vowles, A.S.; Karlsson, S.P.; Uzunova, E.P.; Kemp, P.S. The importance of behaviour in predicting the impact of a novel small-scale hydropower device on the survival of downstream moving fish. Ecol. Eng. 2014, 69, 151–159. [Google Scholar] [CrossRef] [Green Version]
  74. Xue, S.; Wang, Y.; Li, K.; Li, R. Wang Effects of Total Dissolved Gas Supersaturation in Fish of Different Sizes and Species. Int. J. Environ. Res. Public Health 2019, 16, 2444. [Google Scholar] [CrossRef] [PubMed] [Green Version]
  75. Brown, R.S.; Colotelo, A.H.; Pflugrath, B.D.; Boys, C.A.; Baumgartner, L.J.; Deng, Z.D.; Silva, L.G.M.; Brauner, C.J.; Mallen-Cooper, M.; Phonekhampeng, O.; et al. Understanding Barotrauma in Fish Passing Hydro Structures: A Global Strategy for Sustainable Development of Water Resources. Fisheries 2014, 39, 108–122. [Google Scholar] [CrossRef]
  76. Ma, Q.; Li, R.; Feng, J.; Lu, J.; Zhou, Q. Cumulative effects of cascade hydropower stations on total dissolved gas supersaturation. Environ. Sci. Pollut. Res. 2018, 25, 13536–13547. [Google Scholar] [CrossRef] [PubMed]
  77. Geoportal (Topographic Map, Map of Protected Areas, Hydrographic Map). Available online: https://mapy.geoportal.gov.pl/imap/Imgp_2.html (accessed on 10 February 2021).
  78. Grzywna, A.; Bronowicka-Mielniczuk, U. Spatial and Temporal Variability of Water Quality in the Bystrzyca River Basin, Poland. Water 2020, 12, 190. [Google Scholar] [CrossRef] [Green Version]
  79. The European Parliament and the Council. Directive 2000/60/EC of the European Parliament and of the Council Establishing a Framework for Community Action in the Field of Water Policy; The European Parliament and the Council: Brussels, Belgium, 2000. [Google Scholar]
  80. Arle, J.; Mohaupt, V.; Kirst, I. Monitoring of Surface Waters in Germany under the Water Framework Directive—A Review of Approaches, Methods and Results. Water 2016, 8, 217. [Google Scholar] [CrossRef]
  81. WIOŚ/OBKŚ (Regional Inspectorate for Environmental Protection/Environmental Research and Control Center), Water Quality Report in the Dolnośląskie/Wrocławskie Voivodeship (Measurement Points: Kamionna, Jarnołtów, Samotwór, Leśnica and Janówek on the Bystrzyca River), Wrocław 1970–1989, 1992–2008, 2012, 2013, 2015, 2018, Poland (technical reports).
  82. RZGW (The State Water Holding “Polish Waters”—Regional Water Management Authority). List of Hydropower Plants in the Area of RZGW Wrocław’s Operation; Regional Water Management Authority: Wrocław, Poland, 2020. [Google Scholar]
  83. Minister of Maritime Economy and Inland Navigation. Regulation of the Minister of Maritime Economy and Inland Navigation of 11 October 2019 on the Classification of Ecological Status, Ecological Potential and Chemical Status and the Method of Classifying the Status of Surface Water Bodies as Well as Environmental Quality Standards for Priority Substances; OJ 2019 item 2149; Prime Minister of Poland: Warsaw, Poland, 2019. (In Polish) [Google Scholar]
  84. Wdowczyk, A.; Szymańska-Pulikowska, A. Differences in the Composition of Leachate from Active and Non-Operational Municipal Waste Landfills in Poland. Water 2020, 12, 3129. [Google Scholar] [CrossRef]
  85. Minister of the Environment (in Poland). Regulation of the Minister of the Environment of October 4, 2002 on the Requirements to Be Met by Inland Waters That Are the Environment for Fish Living in Natural Conditions; Minister of the Environment: Warsaw, Poland, 2002. (In Polish) [Google Scholar]
  86. Lloyd, R. Pollution and Freshwater Fish, 1st ed.; Fishing News Books Ltd.: London, UK, 1992. [Google Scholar]
  87. Bergheim, A.; Selmer-Olsen, A.R. River pollution from a large trout farm in Norway. Aquaculture 1978, 14, 267–270. [Google Scholar] [CrossRef]
  88. Roberts, R.J.; Shepherd, C.J. Handbook of Trout and Salmon Diseases, 1st ed.; Fishing News: London, UK, 1974. [Google Scholar]
  89. Stiff, M.J.; Cartwright, N.G.; Crane, R.I. Environmental Quality Standards for Dissolved Oxygen, 1st ed.; National Rivers Authority: Bristol, UK, 1992. [Google Scholar]
  90. Chapman, G. Ambient Water Quality Criteria for Dissolved Oxygen, 1st ed.; U.S. Environmental Protection Agency (USEPA): Duluth, MN, USA; Narrangansett, RI, USA, 1986. [Google Scholar]
  91. JRB Associated. Analysis of Data Relating Dissolved Oxygen and Fish Growth; JRB Associated: Newport News, VA, USA, 1984. [Google Scholar]
  92. EIFAC (European Inland Fisheries Advisory Commision). Water Quality Criteria for European Freshwater Fish; FAO: Rome, Italy, 1987. [Google Scholar]
  93. Beamish, F. Respiration of fishes with special emphasis on standard oxygen consumption: III. Influence of oxygen. Canadian J. Zool. 2011, 42, 355–366. [Google Scholar] [CrossRef]
  94. Coble, W.C. Fish Populations in Relation to Dissolved Oxygen in the Wisconsin River. Trans. Am. Fish. Soc. 1982, 111, 612–623. [Google Scholar] [CrossRef]
  95. Lawson, T.B. Fundamentals of Aquacultural Engineering, 1st ed.; Springer: Boston, MA, USA, 1995. [Google Scholar] [CrossRef]
  96. Homer, D.H.; Waller, W.T. Chronic effects of reduced dissolved oxygen on Daphnia magna. Water Air Soil Pollut. 1983, 20, 23–28. [Google Scholar] [CrossRef]
  97. Spoor, W.A. Distribution of fingerling brook trout, Salvelinus fontinalis (Mitchill), in dissolved oxygen concentration gradients. J. Fish Biol. 1990, 36, 363–373. [Google Scholar] [CrossRef]
  98. Glińska-Lewczuk, K.; Gołaś, I.; Koc, J.; Gotkowska-Płachta, A.; Harnisz, M.; Rochwerger, A. The impact of urban areas on the water quality gradient along a lowland river. Environ. Monit. Assess. 2016, 188, 624. [Google Scholar] [CrossRef]
  99. Zbierska, J.; Ławniczak, A.E.; Zbierska, A. Changes in the trophic status of Lake Niepruszewskie (Poland). J. Ecol. Eng. 2015, 16, 65–73. [Google Scholar] [CrossRef] [Green Version]
  100. Speers-Roesch, B.; Norin, T. Ecological significance of thermal tolerance and performance in fishes: New insights from integrating field and laboratory approaches. Funct. Ecol. 2016, 30, 842–844. [Google Scholar] [CrossRef]
  101. Puzdrowska, M.; Heese, T. Experimental Studies on the Spatial Structure and Distribution of Flow Velocities in Bolt Fishways. J. Ecol. Eng. 2019, 20, 82–99. [Google Scholar] [CrossRef]
  102. Mueller, M.; Pander, J.; Geist, J. Evaluation of external fish injury caused by hydropower plants based on a novel field-based protocol. Fish. Manag. Ecol. 2017, 24, 240–255. [Google Scholar] [CrossRef] [Green Version]
  103. Kougias, I.; Aggidis, G.; Avellan, F.; Deniz, S.; Lundin, U.; Moro, A.; Muntean, S.; Novara, D.; Pérez-Díaz, J.I.; Quaranta, E.; et al. Analysis of emerging technologies in the hydropower sector. Renew. Sustain. Energy Rev. 2019, 113, 109257. [Google Scholar] [CrossRef]
  104. Operacz, A.; Wałęga, A.; Cupak, A.; Tomaszewska, B. The comparison of environmental flow assessment—The barrier for investment in Poland or river protection? J. Clean. Prod. 2018, 193, 575–592. [Google Scholar] [CrossRef]
  105. Benoit, K.; Hayden, J. Institutional Change and Persistence: The Evolution of Poland’s Electoral System, 1989–2001. J. Politi. 2004, 66, 396–427. [Google Scholar] [CrossRef] [Green Version]
  106. Gomułka, S. Poland’s economic and social transformation 1989–2014 and contemporary challenges. Central Bank Rev. 2016, 16, 19–23. [Google Scholar] [CrossRef] [Green Version]
  107. Millard, F. Environmental policy in Poland. Environ. Polit. 1998, 7, 145–161. [Google Scholar] [CrossRef]
  108. Bartniczak, B.; Raszkowski, A. Sustainable forest management in Poland. Manag. Environ. Qual. Int. J. 2018, 29, 666–677. [Google Scholar] [CrossRef]
  109. Niedziałkowski, K.; Paavola, J.; Jędrzejewska, B. Governance of biodiversity in Poland before and after the accession to the EU: The tale of two roads. Environ. Conserv. 2012, 40, 108–118. [Google Scholar] [CrossRef] [Green Version]
  110. Kobus, P.; Wąs, A. Changes in Polish Farmers’ Attitudes toward Risk after Poland’s Accession to the EU. J. Food Prod. Mark. 2016, 23, 1–10. [Google Scholar] [CrossRef]
  111. Chancellery of the Sejm in Poland. Act of 20 July 2017—Water Law. J. Laws 2017, 2017, 1556. [Google Scholar]
  112. Szoszkiewicz, K.; Jusik, S.; Pietruczuk, K.; Gebler, D. The Macrophyte Index for Rivers (MIR) as an Advantageous Approach to Running Water Assessment in Local Geographical Conditions. Water 2019, 12, 108. [Google Scholar] [CrossRef] [Green Version]
  113. European Commission. 2020 Climate & Energy Package; European Commission: Brussels, Belgium, 2007; Available online: https://ec.europa.eu/clima/policies/strategies/2020_en (accessed on 29 January 2020).
  114. European Parliament and the Council. Directive 2009/28/EC of the European Parliament and of the Council of 23 April 2009 on the Promotion of the Use of Energy from Renewable Sources and Amending and Subsequently Repealing Directives 2001/77/EC and 2003/30/EC.; European Parliament and the Council: Brussels, Belgium, 2009. [Google Scholar]
  115. Huđek, H.; Žganec, K.; Pusch, M.T. A review of hydropower dams in Southeast Europe—Distribution, trends and availability of monitoring data using the example of a multinational Danube catchment subarea. Renew. Sustain. Energy Rev. 2020, 117, 109434. [Google Scholar] [CrossRef]
  116. Ministry of Economy. Energy Policy of Poland Until 2030; Annex to the Resolution No. 202/2009 of the Council of Ministers of 10 November 2009; Ministry of Economy: Warsaw, Poland, 2009. [Google Scholar]
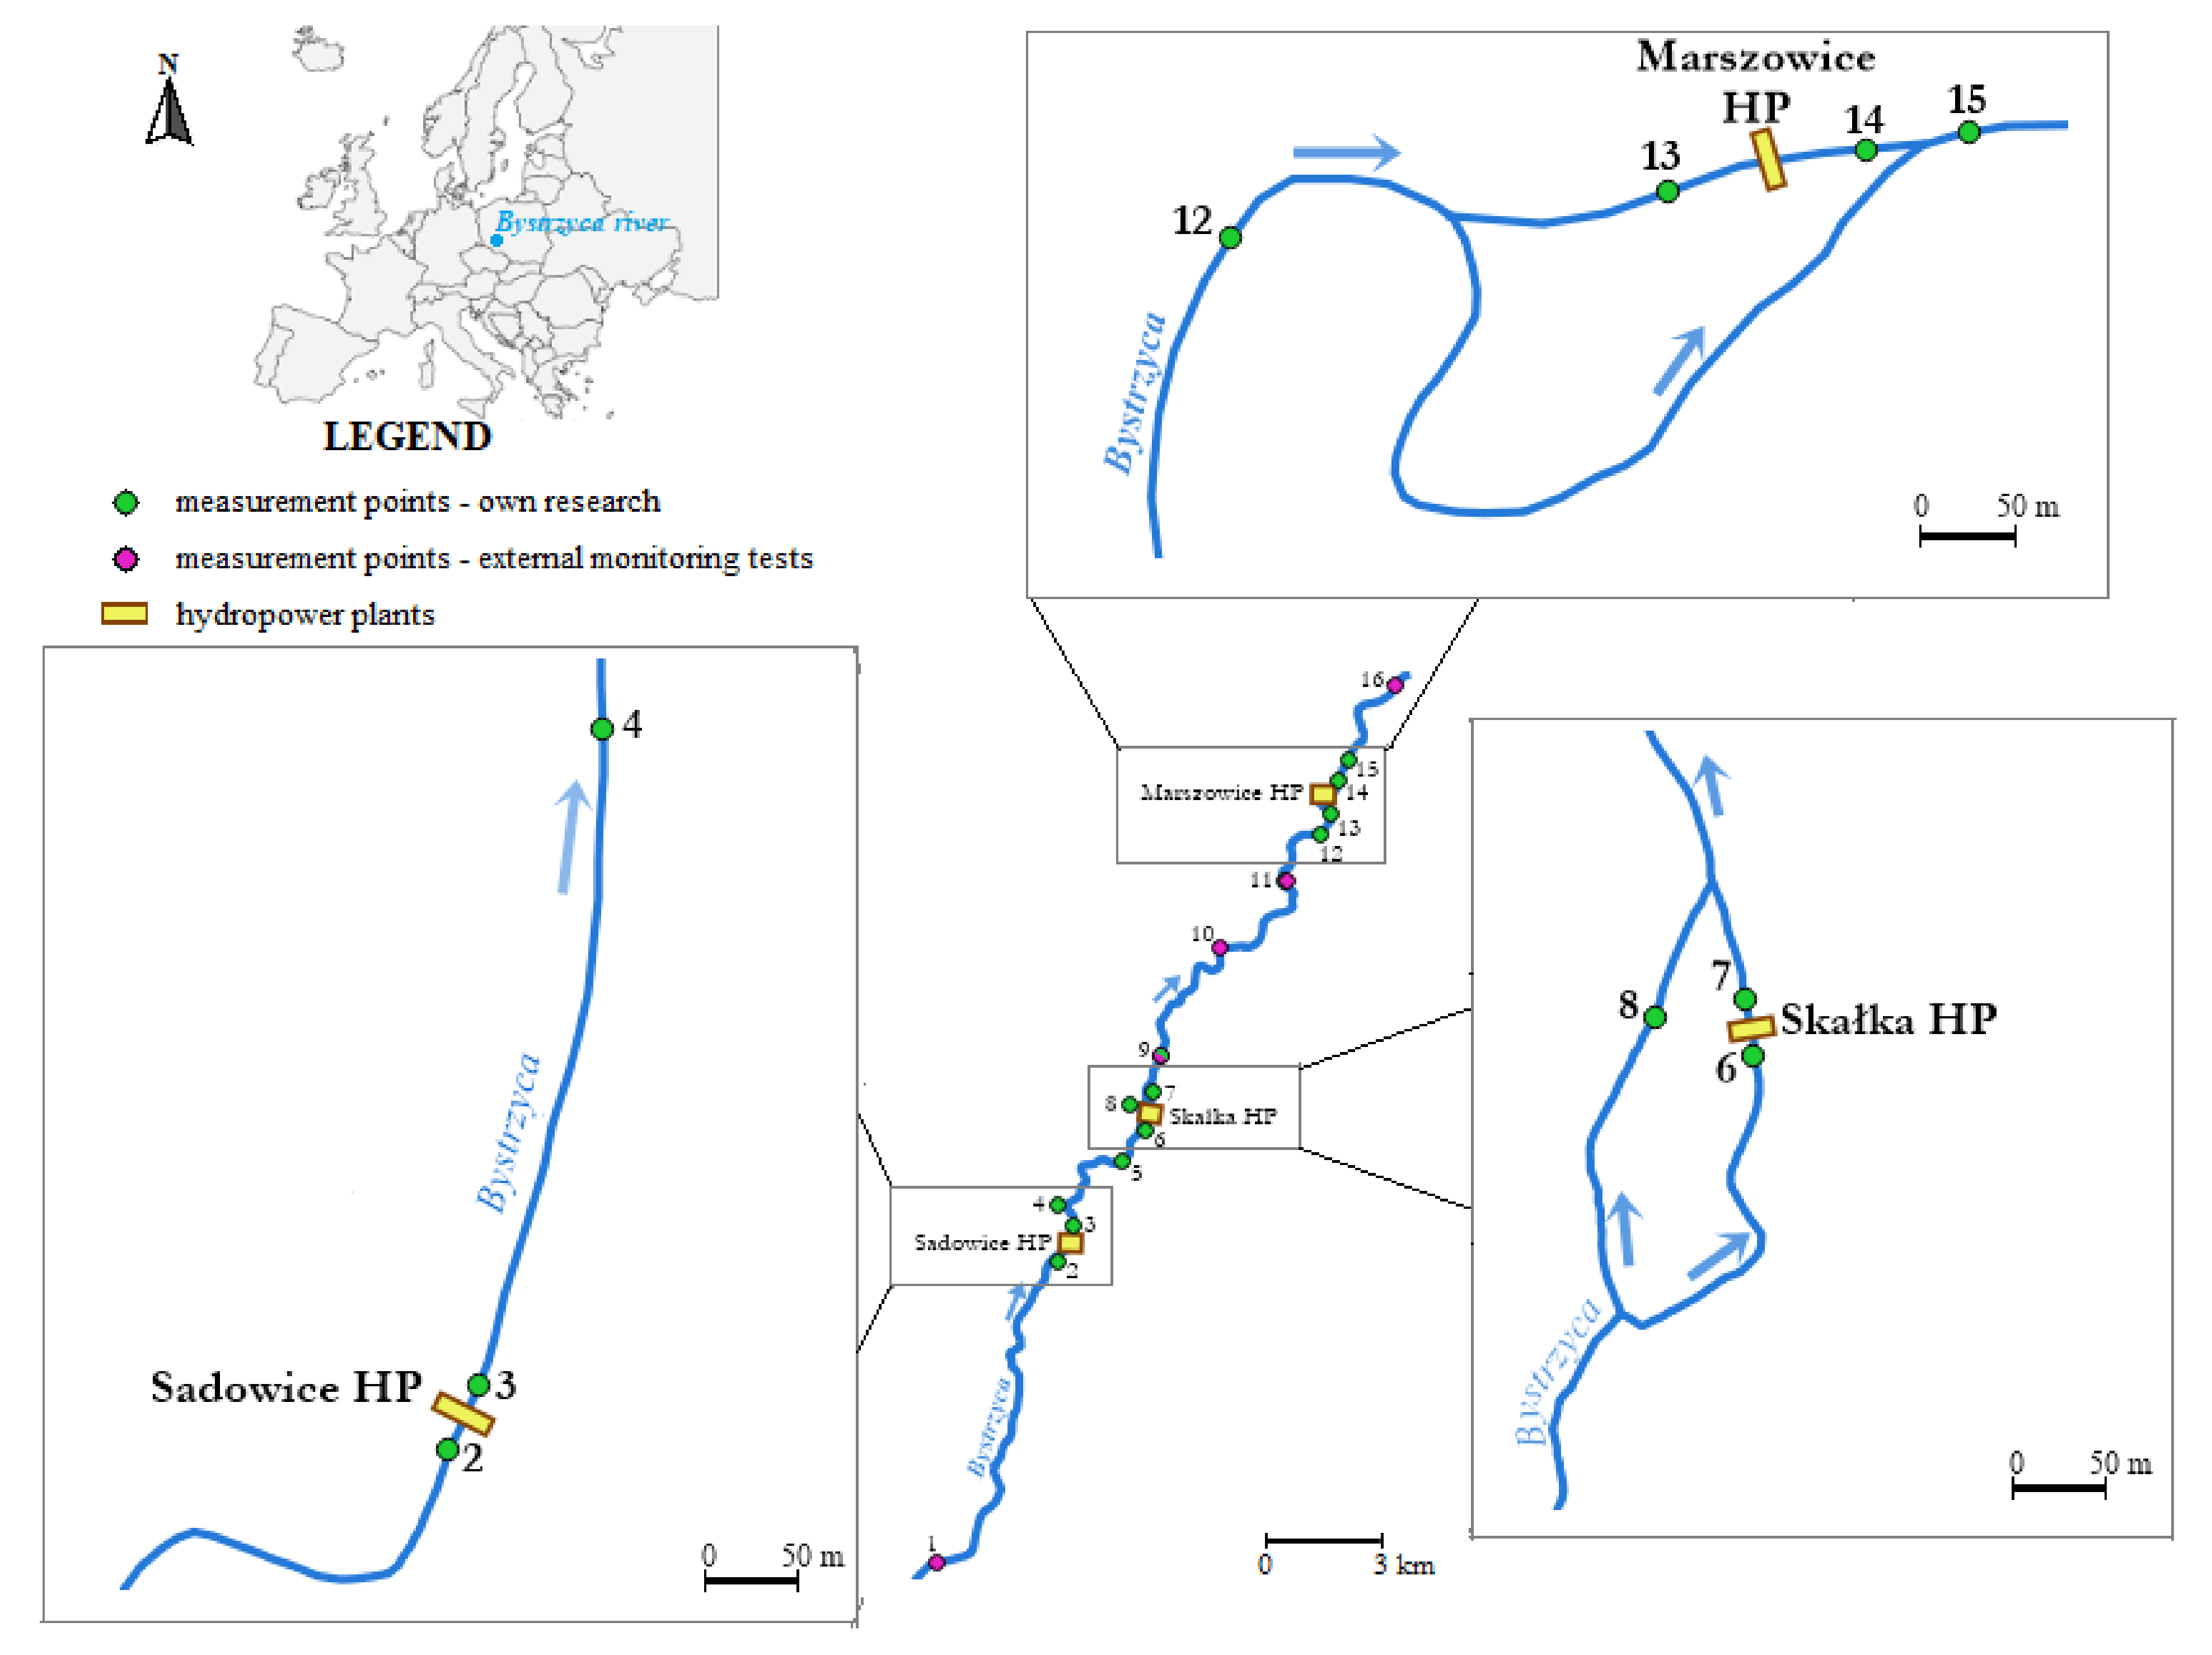
Figure 1. Location of research points and facilities, Bystrzyca River, Poland.
Energies 14 02075 g001
Figure 2. Research facilities (from left): Marszowice, Skałka, and Sadowice hydropower plants.
Energies 14 02075 g002
Figure 3. Research procedure followed in the article.
Energies 14 02075 g003
Figure 4. Statistical analyses of electrolytic conductivity (EC): boxplots (A; this research and WIOŚ), HCA (B; this research), and PCA (C; this research).
Energies 14 02075 g004
Figure 5. Statistical analyses for nitrate nitrogen (NO3-N): HCA (A) and PCA (B; this research).
Energies 14 02075 g005
Figure 6. Statistical analyses for dissolved oxygen (DO): PCA (A) and boxplots (B; this research).
Energies 14 02075 g006
Figure 7. Statistical analyses for pH—PCA (this research).
Energies 14 02075 g007
Figure 8. Statistical analyses for total phosphorus (TP): PCA (A) and HCA (B; this research).
Energies 14 02075 g008
Figure 9. Percentage change in selected statistically significant physicochemical parameters with an average change greater than 5%: (A) ammonium nitrogen (NH4-N), (B) dissolved oxygen (DO), and (C) nitrate nitrogen (NO3-N) below the Marszowice hydropower plant, June 2017–May 2020.
Energies 14 02075 g009aEnergies 14 02075 g009b
Figure 10. Temporal variability of selected physicochemical parameters (from the top left (AD): NH4-N, DO, TP, and BOD5) at monitoring points on the Bystrzyca River, taking into account important events in Poland’s history.
Energies 14 02075 g010
Table 1. List of test points for physicochemical elements on the Bystrzyca River [81].
Point No.Name of the PointRiver km *This ResearchExternal TestsResearch Period
1 WBystrzyca River above Czarna Woda River
(Kamionna)
33.5 X1975, 1981–1983, 2012, 2015
2Sadowice hydropower plant (point above HP)26.15X 06.2018
−05.2020
3Sadowice hydropower plant (point below HP)26.05X
4Sadowice hydropower plant (reference point)25.95X
5Małkowice—reference point22.2X
6Skałka hydropower plant (point above HP)20.05X
7Skałka hydropower plant (point below HP)19.95X
8Bystrzyca river next to Skałka HP—a natural bed20.0X
9Bystrzyca above Strzegomka River (Samotwór)
9 WBystrzyca above Strzegomka River (Samotwór)17.9XX1975–2003 **, 2018
10 WBystrzyca below Strzegomka River (Jarnołtów)14.8 X1975–2006 **
11 WBystrzyca below Leśnica7.7 X1975–1989
12Bystrzyca above the division into a HP canal and a natural bed4.15X 06.2018
−05.2020
13Marszowice hydropower plant (point above HP)4.05X 06.2017
−05.2020
14Marszowice hydropower plant (point below HP)3.95X
15Marszowice hydropower plant (reference point)3.85X
16 WBystrzyca—estuary to the Odra River (Janówek)1.2 X1975–2008 **, 2013, 2018
* counted from the mouth to the spring of the river; ** without 1990 and 1991.
Table 2. Characteristics of research facilities described in the article [82].
Name
of the HP
RiverRiver Length (km)Type
of HP
Generation (MW)Type of TurbineYear of ConstructionFish LadderDamming Height (m)
Marszowice (in Wrocław)Bystrzyca4400run-of-river *0.385Francis1912N3.75
SkałkaBystrzyca19,982run-of-river *0.07Kaplanbefore
1939
N2.2
SadowiceBystrzyca26,050run-of-river0.06Francis1921N1.8
* located in the diversion channel.
Table 3. List of tested physicochemical parameters with methods of their determination.
No.ParameterThis Research External TestsName of the MethodMeasurement Range
1.pHXXPotentiometric method0.00–14.00
2.Electrolytic conductivity (EC)XXConductometric method0.1–2000 mS/cm
3.Temperature of waterXXTemperature sensor−50.0–199.9 °C
4.TurbidityX Nephelometric method0.1–1000 NTU
5.Total suspended solids (TSS) XFiltration though
glass-fibre filters
0.01–4000 mg/L
6.Total dissolved solids (TDS) X0–2000 mg/L
7.Ammonium nitrogen (NH4-N)XXSpectrophotometric method0.001–1000
8.Nitrate nitrogen (NO3-N)XX0.1–7.0
9.Nitrite nitrogen (NO2-N)XX0.001–1.2
10.Kjeldahl nitrogen (KN) XMethod after mineralization with Se-
11.Total nitrogen (TN) XSpectrophotometric method-
12.Total phosphorus (TP)XX0.001–0.5 PO4-P
13.Dissolved oxygen (DO)XXElectrochemical sensor0.00–20.00
14.Biochemical oxygen demand (BOD5)XXDilution method0.1–2000
15.Chemical oxygen demand (COD) XPermanganate method0.1–1000
16.Sulphates (SO4) XGravimetric method using BaCl10–1000
17.Chlorides (Cl) XMohr’s method5–400
Table 4. Basic statistics for tested physicochemical parameters at reference points, points above HPs and below HPs (this research).
Physicochemical ParameterGroup of PointsStatistical Parameter
Min.Max.Avg.Mdn.SD
pH (-)Reference points6.608.707.998.100.47
Points above HPs6.608.707.928.100.49
Points below HPs6.608.607.988.100.46
EC (µS/cm)Reference points312.0931.0526.6491.5134.1
Points above HPs318.0961.0537.1493.0136.9
Points below HPs318.0933.0531.4489.5136.2
Temperature of water (°C)Reference points0.1022.7011.109.806.62
Points above HPs0.5021.5011.099.706.53
Points below HPs0.1022.6011.3710.006.49
Turbidity (NTU)Reference points1.20190.0011.395.5023.95
Points above HPs1.50160.0010.405.8018.64
Points below HPs1.20115.009.695.5016.33
NH4-N (mg/L)Reference points0.0001.1020.1540.1090.168
Points above HPs0.0001.1800.1690.1290.170
Points below HPs0.0001.0940.1560.1090.169
NO3-N (mg/L)Reference points0.1115.3121.5911.4301.051
Points above HPs0.3145.8491.5351.3231.072
Points below HPs0.2894.6211.5551.3810.995
NO2-N (mg/L)Reference points0.00300.13680.02890.02130.0240
Points above HPs0.00000.13370.02900.02130.0248
Points below HPs0.00000.13680.02810.02130.0252
TP (mg/L)Reference points0.0200.2900.1120.1000.054
Points above HPs0.0300.2900.1160.1000.059
Points below HPs0.0101.0150.1310.1000.136
DO (mg/L)Reference points3.5012.809.339.202.29
Points above HPs2.7013.208.678.402.63
Points below HPs3.6012.709.099.302.54
BOD5 (mg/L)Reference points0.39.03.83.61.8
Points above HPs0.49.13.73.41.7
Points below HPs0.610.13.93.61.8
Table 5. Summary of the results of the within-group analysis of variance for repeated parameters (ANOVA)—a variant for all research points (this research).
ParameterdfError dfFp (< 0.05)ηp2
EC1.62037.259279.9160.000 * (points 6/7)0.924
NO3-N2.45556.46327.1440.000 * (13/14)0.541
DO4.939113.60710.9020.000 * (13/14)0.322
pH3.94190.64910.3140.000 * (6/7, 13/14)0.310
TP1.35631.1994.9700.024 *0.178
BOD55.580128.3412.0820.0640.083
NO2-N1.57236.1471.5250.2320.062
NH4-N1.36031.2891.4670.2430.060
Turbidity1.20427.6861.1900.2960.049
Temperature1.68131.9300.5170.5700.026
Designations in the table: * = statistically significant value (p < 0.05); italics = parameters subject to further analysis.
Table 6. Average percentage change in physicochemical parameters below the Sadowice, Skałka, and Marszowice hydropower plants.
Mean Change below HPs
Sadowice HP
(Points 2 and 3)
Skałka HP
(Points 6 and 7)
Marszowice HP
(Points 13 and 14)
Parameter
EC−1.17%−2.02% *−1.51%
NO3-N2.40%−4.97%5.50% *
DO0.56%1.50%14.04% *
pH0.37%−0.93% *2.16%*
TP−2.58%7.22%−0.19%
BOD520.16%14.78%7.80%
NO2-N1.26%4.66%9.77%
NH4-N2.50%2.32%27.83% *
Turbidity5.75%5.95%7.14%
Temperature2.14%1.58%−0.10%
Designations in the table: * = statistically significant value (p < 0.05), bold = value considered significant for analysis.
Table 7. Summary of the average percentage changes in the values of physicochemical parameters below selected hydropower plants.
Reference
Parameter
Vaikasas et al.
2015 [48]
Valero 2012
[56]
Fantin-Cruz
et al. 2015 [61]
This Research
pH 0.17% from −0.93%* to 2.16% *
Temperature 2.73% from −0.10% to 2.14%
DO 7.12% from 0.56% to 14.04% *
EC 7.50% from −2.02%* to −1.17%
Turbidity 38.00% *from −7.14% to 5.95%
TP0%26.97% 28.00% *from –7.22% to −0.19%
NO3 14.00% *from −4.97% to 5.50% *1
TN−2.08%15.49% from −5.06% to 3.15% 2
Type of hydropowerstorage (reservoir)run‒of‒river
Damming height<5 m5–15 m70 m243 m1.8–3.75 m
LocationLithuaniaSpainBrazilPoland
Designations: 1 NO3-N, 2 TN = NH4-N + NO3-N + NO2-N, * -statistically significant value (p < 0.05), bold = value considered significant for analysis.
Table 8. The state of physicochemical elements at own points and points tested by WIOŚ [81,83].
PointParameter
TempECpHNH4-NNO3-NNO2-NTPDOBOD5
1 W20.04327.4–8.111.92.000.2942.793.4132
220.05057.0–8.40.5492.760.0690.196.66.2
319.85027.0–8.40.5302.720.0690.216.36.0
420.05057.0–8.40.5302.770.0810.266.77.2
519.84997.0–8.50.3742.830.0670.216.37.0
619.85117.0–8.50.4252.780.0660.196.55.6
719.75027.0–8.50.4322.800.0660.196.86.1
819.95037.0–8.40.4532.820.0660.208.07.3
920.15066.9–8.40.3483.220.0630.176.05.8
9 W19.17556.8–8.39.8254.710.3703.056.527.8
10 W19.511886.8–8.210.4755.200.5823.235.964.9
11 W20.0n/d6.4–8.014.455.660.6385.116.652.0
1220.67477.2–8.50.4893.640.0680.217.37.4
1321.08176.9–8.50.4363.600.0640.263.87.2
1421.38047.1–8.50.3773.730.0700.223.78.5
1521.38157.0–8.60.3463.780.0670.213.67.5
16W20.310986.9‒.8.210.505.200.4202.876.036.0
Norms
(I and II class)
I: ≤ 22.0
II: ≤ 24.0
I: ≤ 352
II: ≤ 518
I: 7.7–8.1
II: 7.3–8.1
I: ≤ 0.13
II: ≤ 0.563
I: ≤ 1.0
II: ≤ 2.4
I: ≤ 0.01
II: ≤ 0.03
I: ≤ 0.15
II: ≤ 0.27
I: ≥ 8.4
II: ≥ 7.6
I: ≤ 2.1
II: ≤ 3.3
Table 9. The state of physicochemical elements at points tested by WIOŚ [81,83].
Parameter
PointTSSTDSKNTNCOD-MnSO4Cl
1 W88.05781.0682.9499.5106.979.7
9 W143.87383.597.42124.9222.086.0
10 W128.081212.415.034.35272.890.0
11 W207.5850n/dn/d251.7205.4114.5
16 W111.87929.4911.527.9260.097.3
Norms
(I and II class)
I: ≤ 11.0
II: ≤ 15.0
I: ≤ 266
II: ≤ 383
I: ≤ 1.0
II: ≤ 1.3
I: ≤ 2.0
II: ≤ 4.1
I: ≤ 7.8
II: ≤ 9.2
I: ≤ 28.4
II: ≤ 74.5
I: ≤ 13.0
II: ≤ 29.8
Designations in the table: blue = very good status of parameter (first class), green = good status of parameter (second class), red = does not meet the standards, n/d = no data.
Table 10. List of physicochemical parameters within Sadowice, Skałka, Marszowice HPs (points 2/3, 6/7, 13/14) in terms of meeting the requirements for the existence of salmonids and cyprinids [85].
ParameterPoint
Requirement
23671314
Temperature
(98% compliance)
≤21.5 °C (salmonids S)++++- (22.0)- (22.1)
≤28.0 °C (cyprinids C)++++++
max ∆ 1.5 °C (S)+++
max ∆ 3.0 °C (C)+++
DO (100%)≥7 mg/L (S)- (5.9)- (6.0)- (6.2)- (6.4)- (4.1)+
≥5 mg/L (C)+++++ +
pH (95%)6–9 (S/C)++++++
max ∆ 0.5 (S/C)++- (0.6)
BOD5
(95%)
≤3 mg/L (S)- (6.2)- (6.0)- (5.6)- (6.1)- (7.2)- (8.5)
≤6 mg/L (C)-++---
TP
(95%)
≤0.2 mg/L (S)+- (0.21)++- (0.26)- (0.22)
≤0.4 mg/L (C)++++++
NO2
(95%)
≤0.01 mg/L (S)- (0.021)- (0.021)- (0.020)- (0.020)- (0.019)- (0.021)
≤0.03 mg/L (C)++++++
NH4-N (95%)≤0.78 mg/L (S/C)++++++
Designations in the table: blue = compliance with requirements, red = noncompliance with requirements, numeric values = physicochemical parameter values for the specified compliance percentile.
Table 11. Examples of dissolved oxygen concentrations necessary for the life of various groups of aquatic organisms.
SpeciesCriterionReference(s)
Salmonids>5.0Lloyd 1992 [76], Bergheim et al. 1978 [87]
>5.5 (fish), >7.0 (eggs)Roberts and Shepherd 1974 [88]
>7.0 (100%), >9.0 (50%)Stiff et al. 1992 [89]
>6.0 (early life stages), >3.0Chapman 1986 [90]
>6.0 (juveniles)JRB Associates 1984 [91]
>4.8EIFAC 1987 [92]
Cyprinids >5.0 (100%), >7.0 (50%)Stiff et al. 1992 [89]
>2.9 (carp)Beamish 2011 [93]
Freshwater fish>5.0Coble 1982 [94], Winton et al. 2019 [99]
>6.0 (100%)Lawson 1995 [95]
Daphnia magna>3.7 (100%)Homer and Waller 1983 [96]
Well-adapted organisms (e.g., cyanobacteria)>2.0Spoor 1990 [97]
Publisher’s Note: MDPI stays neutral with regard to jurisdictional claims in published maps and institutional affiliations.