Article

A Fundamental Study on the Development of New Energy Performance Index in Office Buildings

1
Green Energy Technology Research Center, Kongju National University, Cheonan 31080, Korea
2
SK E&C Co., Ltd., Seoul 03163, Korea
3
Korean Institute of Civil Engineering and Building Technology, Goyang 10223, Korea
4
AIMT Co., Ltd., Daegu 42709, Korea
5
Institute of Technology, Sonusys Co., Ltd., Gimpo 10028, Korea
*
Author to whom correspondence should be addressed.
Energies 2021, 14(8), 2064; https://doi.org/10.3390/en14082064
Submission received: 28 November 2020 / Revised: 22 March 2021 / Accepted: 6 April 2021 / Published: 8 April 2021

Abstract

:
Recently, there have been significant concerns regarding excessive energy use in office buildings with a large window-to-wall ratio (WWR) because of the curtain wall structure. However, prior research has confirmed that the impact of the window area on energy consumption varies depending on building size. A newly proposed window-to-floor ratio (WFR) correlates better with energy consumption in the building. In this paper, we derived the correlation by analyzing a simulation using EnergyPlus, and the results are as follows. In the case of small buildings, the results of this study showed that the WWR and energy requirement increase proportionally, and the smaller the size is, the higher the energy sensitivity will be. However, results also confirmed that this correlation was not established for buildings approximately 3600 m2 or larger. Nevertheless, from analyzing the correlation between the WFR and the energy requirements, it could be deduced that energy required increased proportionally when the WFR was 0.1 or higher. On the other hand, the correlation between WWR, U-value, solar heat gain coefficient (SHGC), and material property values of windows had little effect on energy when the WWR was 20%, and the highest effect was seen at a WWR of 100%. Further, with an SHGC below 0.3, the energy requirement decreased with an increasing WWR, regardless of U-value. In addition, we confirmed the need for in-depth research on the impact of the windows’ U-value, SHGC, and WWR, and this will be verified through future studies. In future studies on window performance, U-value, SHGC, visible light transmittance (VLT), wall U-value as sensitivity variables, and correlation between WFR and building size will be examined.

1. Introduction

1.1. Research Background and Objective

According to the International Energy Agency (IEA), final energy use in buildings grew from 118 EJ in 2010 to around 128 EJ in 2019. Factors contributing to this rise are particularly due to energy demand for cooling, power appliances and devices, as well as extreme weather events. In 2019, emissions resulting from direct energy used in buildings were about 3 GtCO2. This corresponds to a 5% increase compared to year 2020. Actually, CO2 emissions from building energy consumption reached a record peak of 10 GtCO2 in 2019. Even 28% of the global CO2 emissions was reported to be connected to power generation for building energy use [1].
Recently, most buildings being built for office purposes in Korea are constructed with a curtain wall structure. Curtain wall buildings have many advantages such as improved indoor daylighting levels, beautiful aesthetics, increased speed and quality of construction, structural flexibility, material efficiency, and so on [2]. However, from the energy consumption perspective, thermal insulation performance of curtain walls is lower compared to external insulated walls. Subsequently, it has been pointed out as the major cause of increasing building energy consumption.
However, unlike residential buildings, office buildings have a relatively high proportion of cooling and equipment load. There were reported cases of cooling overloads in winter, and it is difficult to determine energy vulnerability of buildings simply by window performance indices such as U-value, solar heat gain coefficient (SHGC), etc.
On the other hand, office buildings with a curtain wall structure vary widely in floor area but have similar floor and ceiling heights [3,4]. In addition, the window-to-wall ratio (WWR) is easily calculated regardless of building size and is widely used as an energy performance index. [2] However, through prior research [5,6], it was confirmed that this index is not reliable as the building size increases. Moreover, it was shown that, as the floor size increases, the impact of window area on heat loss reduces, confirming that even curtain wall structured office buildings can realize sufficiently low energy losses [3,4,7]. WWR considers the ratio of glazing-to-wall area, whereas the window-to-floor ratio (WFR) considers the relationship between the window and the depth of the floor. Thus, although both are related to the window specifications, WWR mainly considers only the wall size while WFR largely factors the floor area. Keeping in mind that the length of the wall is also the length of the floor, WFR considers the depth or the width of the floor as well. It is worth mentioning that WFR is more sensitive for daylight factor analysis because it takes the floor depth into account. Thus, WFR is useful for evaluation of daylight related factors, visual comfort, and lighting location.
In this study, quantitative analysis of energy consumption patterns of office buildings was conducted. The approach adopted considered WFR, which is different from the WWR method often used in existing research on energy consumption patterns. Further, a simple formula was derived for estimation of energy consumption patterns that provides indices to be used in the building planning stage.

1.2. Research Method and Scope

This study quantitatively analyzed the impact of building size and window area on building energy consumption. For the purpose of deriving a correlation, we limited the scope analysis to square plains to limit the diversity of floor areas of office buildings. We assumed the ratio of the core area to be 20% of the floor area and performed simulations [8]. As an analysis tool, the EnergyPlus program developed by the U.S. Department of Energy (DOE) was used.
EnergyPlus [9] is a dynamic heat load simulation engine that combines the advantages of the existing DOE-2 and BLAST programs. It has a feature that performs window performance analysis based on ISO 15099 and reflects it in the program.
On the other hand, building energy consumption was analyzed focusing on heating, cooling, and lighting energy, which are greatly affected by window performance, and we assumed no energy transfer between floors by only analyzing the reference floor. The ideal HVAC model in EnergyPlus was used with electric energy as the energy source for cooling/heating system and lighting for all cases. Energy consumption analysis was performed for building operation based on the delivered energy.

2. Analysis of Previous Research

Various studies on energy correlation analysis on high-rise buildings with high daytime use and with various window characteristics have been actively performed both in Korea and abroad. Many studies have been conducted on office buildings with curtain wall structure. Recently, studies on the impact of curtain wall structured office buildings on cooling/heating peak load and building energy consumption including window performance, WWR, and size of awnings have been carried out.
Goia F. [10] analyzed optimal WWR values for minimizing heat and cooling load in European climates. The optimized value was in 0.3 < WWR < 0.45 with different orientation except for very cold and warm climates. Chi et al. [11] investigated optimal WWR value based on experiments and simulations in rural residences (Sizhai province) in China. Orientations of the simulation model were divided into 18 directions. Through indoor environment simulation, daylight factor, air temperature, and air velocity were analyzed for the test scenarios with different orientation and WWR combinations. The simulation results were verified by experiments.
Wen et al. [12] suggested a strategy to choose WWR value for minimizing energy demand and CO2 emissions for buildings in Japan. WWR maps were drawn with case studies, and appropriate values were 0.3 < WWR < 0.5. The main criteria of WWR were light density, climate, window orientation, internal gains, and building size. Xue et al. [13] considered daylight and energy saving to optimize WWR with sunshades in China. Radiance and EnergyPlus programs were used to analyze yearly cooling demand and daylighting levels. Optimal parameters factored minimizing cooling demand and satisfying the daylighting requirements. According to different window orientations, 0.4–0.78 of WWR values were evaluated.
Phillips et al. [14] utilized triple bottom line assessment of WWR for three different climates in US office buildings. Life cycle assessment (LCA), HVAC equipment’s embodied energy, and distribution of operational energy of US DOE’s large-scale office (12 stories) were evaluated with different WWRs. Results showed that improved U-values may result in greater energy savings than WWR values.
Troup et al. [15] used Commercial Building Energy Consumption Survey (CBECS) data to analyze WWR effects for office buildings. The statistical data were investigated by linear regression analysis. Energy use intensity (EUI) decreased with year of construction, regardless of WWR. The ideal WWR value was 0.34 based on 2012 CBECS data. Badeche et al. [16] investigated the most prominent factors towards window optimization. In semi-arid climate, window orientation was found to be the most prominent parameter. In Mediterranean climate, the parameters relative to glazing were found to be the most important. For all climates and in all directions, lower glazing ratio was the most efficient. Optimal values were 0.4 < WWR < 0.5 in a semi-arid climate in the southern direction.
In “Window Systems for High-Performance Buildings” (John et al., 2004), various energy saving alternatives were derived considering window performance and WWR focusing on cooling/heating, hot water supply, and lighting energy under various climate conditions, and various indicators that can be utilized in planning stage were developed and presented [4].
Yoon et al. [5] demonstrated the inconsistency in the correlation between energy and WWR according to building size and presented WFR as a new alternative. The quantitative index presented in this work was used as the basic data in this study.
In addition, in the study by Yoon et al. [6], the impact of glazing performance on building energy was analyzed in various perspectives. Furthermore, it was shown that, in buildings with high cooling and lighting load, SHGC and visible light transmittance (VLT) have a larger impact than U-value on building energy, which points out a problem in the current policy that regulates energy performance of a building based only on U-value.
Jeong et al. [8] investigated the impact of characteristics of curtain wall window type on building cooling/heating energy and analyzed and compared the impacts of other elements (minimum ventilation volume, medium air cooling/natural ventilation, building size, local climate characteristics) on building energy performance.
Lim et al. [17] suggested an optimized alternative for the sheath system considering the solar load based on the performance of an awning device. According to this paper, the performance of an external awning device is affected by increasing solar radiation in the order of west, east, south, and north. Installing long awnings with complex functions is the best in terms of performance, and results showed the necessity of a strategy to install them in consideration of the characteristic of each direction.
However, there are some limitations for energy consumption prediction for buildings based on WWR. For example, based on parametric evaluations, Marino et al. [18] investigated the optimal size of window surface. Although an influential factor, WWR was not the only analysis index. Results showed that energy consumption was strongly influenced by insulation characteristics, climatic conditions, façade configurations, and presence of shading devices. Moreover, it was concluded that the optimal WWR did not vary greatly by assessing WWR versus each parameter.
Didwania et al. [19] evaluated the optimal WWR for office buildings considering different floor orientations, floor sizes, and equivalent floor shape. It was concluded that emphasis should not only be prioritized for the type of glazing, but attention should also be given to the WWR that is being adopted for different orientations, different floor size/shape, and different types of glass. In addition, the optimum WWR for the cases differed by a maximum of 25, even though the floor size was comparable. This shows that WWR is not the only definitive factor to consider towards building design and related prediction of energy consumption.
H. Shen et al. [20] presented sensitivity analysis of daylighting and energy performance for private offices considering WFR, glazing type, insulation thermal resistance, space aspect ratio, shading transmittance, shading front, and back reflectance. Results showed that WFR and glazing type dominated the variation of both heating demand and cooling demand. Furthermore, for heating demand, space aspect ratio was the third most important factor.
Other researchers investigated the effect of WWR and WFR on thermal performance of a building with respect to orientation [21].
This study analyzed energy consumption characteristics of office buildings by utilizing variables studied in previous studies, such as building size, WWR, window performance, and lighting control. Through this, the usefulness of WWR, which is used as the current energy performance index, was verified. In addition, an alternative energy performance index, WFR, was quantified and validated. Furthermore, the purpose of this study was to enable the quantification index of energy consumption pattern with respect to the WFR performed in this work to be widely used as a new design index.

3. Simulation Overview

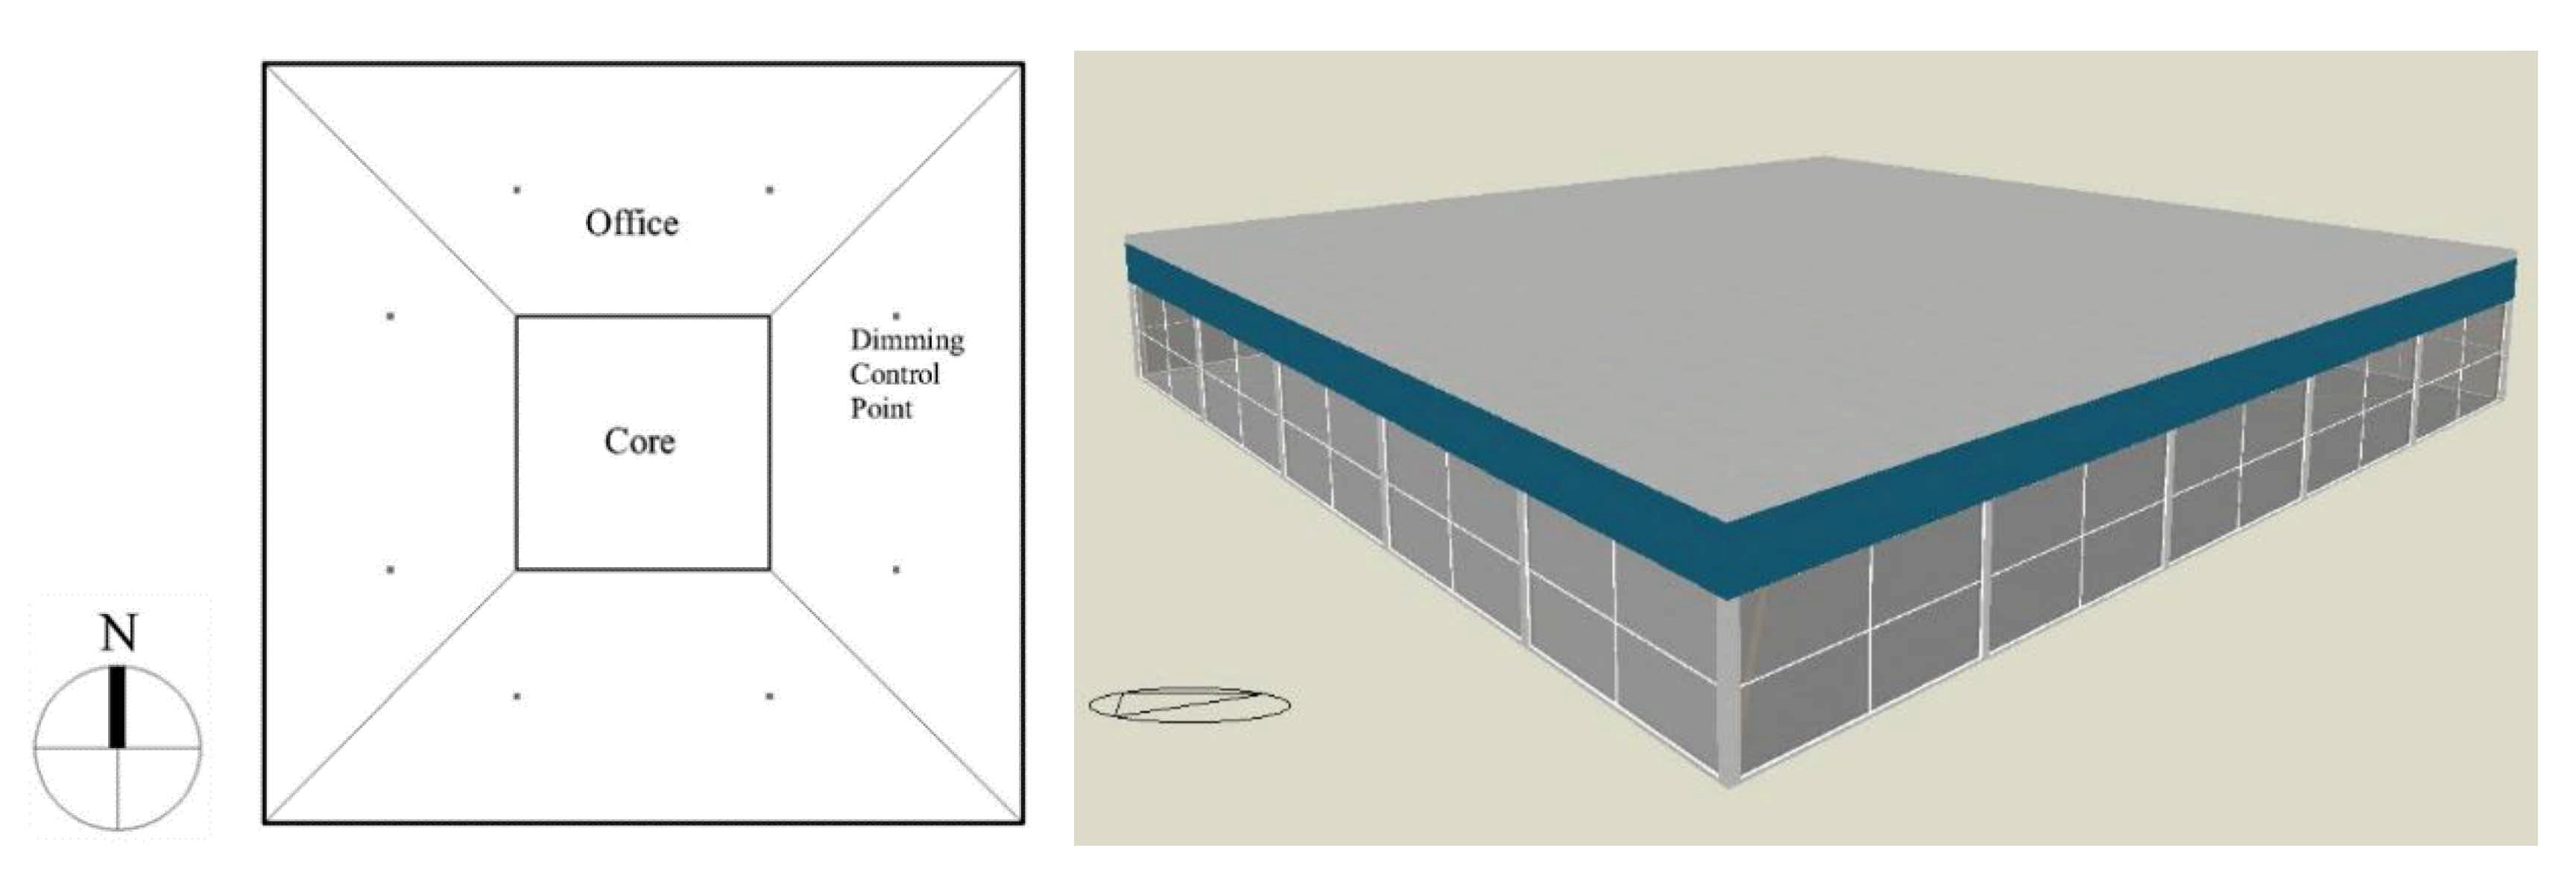
3.1. Baseline Building Model

In the case of Korea, most newly constructed office buildings are mainly steel framed reinforced concrete buildings with a curtain wall structure that finishes the building wall with glass for reasons such as design, construction period, cost, etc. The window area is also larger than that of general residential buildings. In line with this, the baseline curtain wall building model was designed. Concerning the baseline model, the core of curtain wall structure was located in the center of the building. The wall and the floor areas were limited to square building that was the same in each direction to exclude the effect of orientation. In this model, a square model was adopted to unify zoning for each direction and to analyze its impact, and the core are ratio of 20% was used by citing the value of a standard domestic non-residential building model [9]. The building floor height was set to 4.2 m and the ceiling height to 2.8 m. Finally, the basic window condition was examined by varying the building width and length equally in a range of 10~100 m. Figure 1 displays a schematic diagram for the target model with these conditions.
Experimentally, a virtual wall was installed inside the office space to divide one large space into four virtual spaces to subdivide the effect of lighting energy from the visible light entering into the room through windows from each direction. For this, two dimming control sensors were installed at ½ position of wall-core distance in each virtual space to maximize the use of visible light in achieving the target illuminance, and its influence was also optimized.
For daylight control, a method was selected that primarily applies visible light entering through the window via continuous control and compensates for insufficient lighting levels with artificial lighting. The adjustment of artificial light by visible light was linear, and the minimum input power fraction was set to 10%. The position of the daylight control sensor was set to 0.85 m, which is the height of a general working surface. Analysis factors from the above target model are listed in Table 1.
As shown in Table 1, the WFR significantly decreased with increasing building size, which indirectly showed that the impact of the window on energy decreased.
For the exterior of the building to be simulated, a curtain wall type office space and a spandrel structured plenum were applied. The boundary condition between floor and roof was set as the insulation condition for only the reference floor to assume that there was no heat exchange between floors. The U-value of glazing component for curtain wall was 0.25 W/m2K. In addition, wall composition and materials properties are shown in Table 2.
For simulation analysis, various schedules such as basic building occupancy density, heating from lighting, dimming control plan, heating from equipment, occupant schedule, and cooling/heating schedule must be included. In this work, factors and operating conditions of the building to be simulated were assumed as shown in Table 3.
The simulation was performed with EnergyPlus, and typical meteorological year (TMY2) meteorological data for Seoul area provided by TRNSYS were applied to the EnergyPlus for analysis. TMY2 meteorological data have the existing time reference year (TRY) form with additional horizontal solar radiation incident at face and direct solar radiation incident upon a normal surface data. The system finds a representative month for each year of a 30 year (1961–1990) period then combines 12 month data to provide the annual meteorological data. Monthly average values for major factors of meteorological data in Seoul area are listed in Table 4.

3.2. Window Materials Perperties of the Building Model

The main purpose of this study was to evaluate the correlation between the window area and the floor area of an office building with a curtain wall structure. For the simulation analysis model, the values of U-value 1.96 W/m2.K, SHGC 0.691, and VLT 0.7444 were applied to the thermal and the optical performances of the window. In this study, modeling was performed by varying from 0.2 to 0.7 in order to analyze the effect of SHGC change on building energy.

4. Analysis of Simulation Results

This paper aimed to find a pattern for building energy performance according to various building sizes and WWR area and to present a new energy performance index. The results from analyses were as follows.

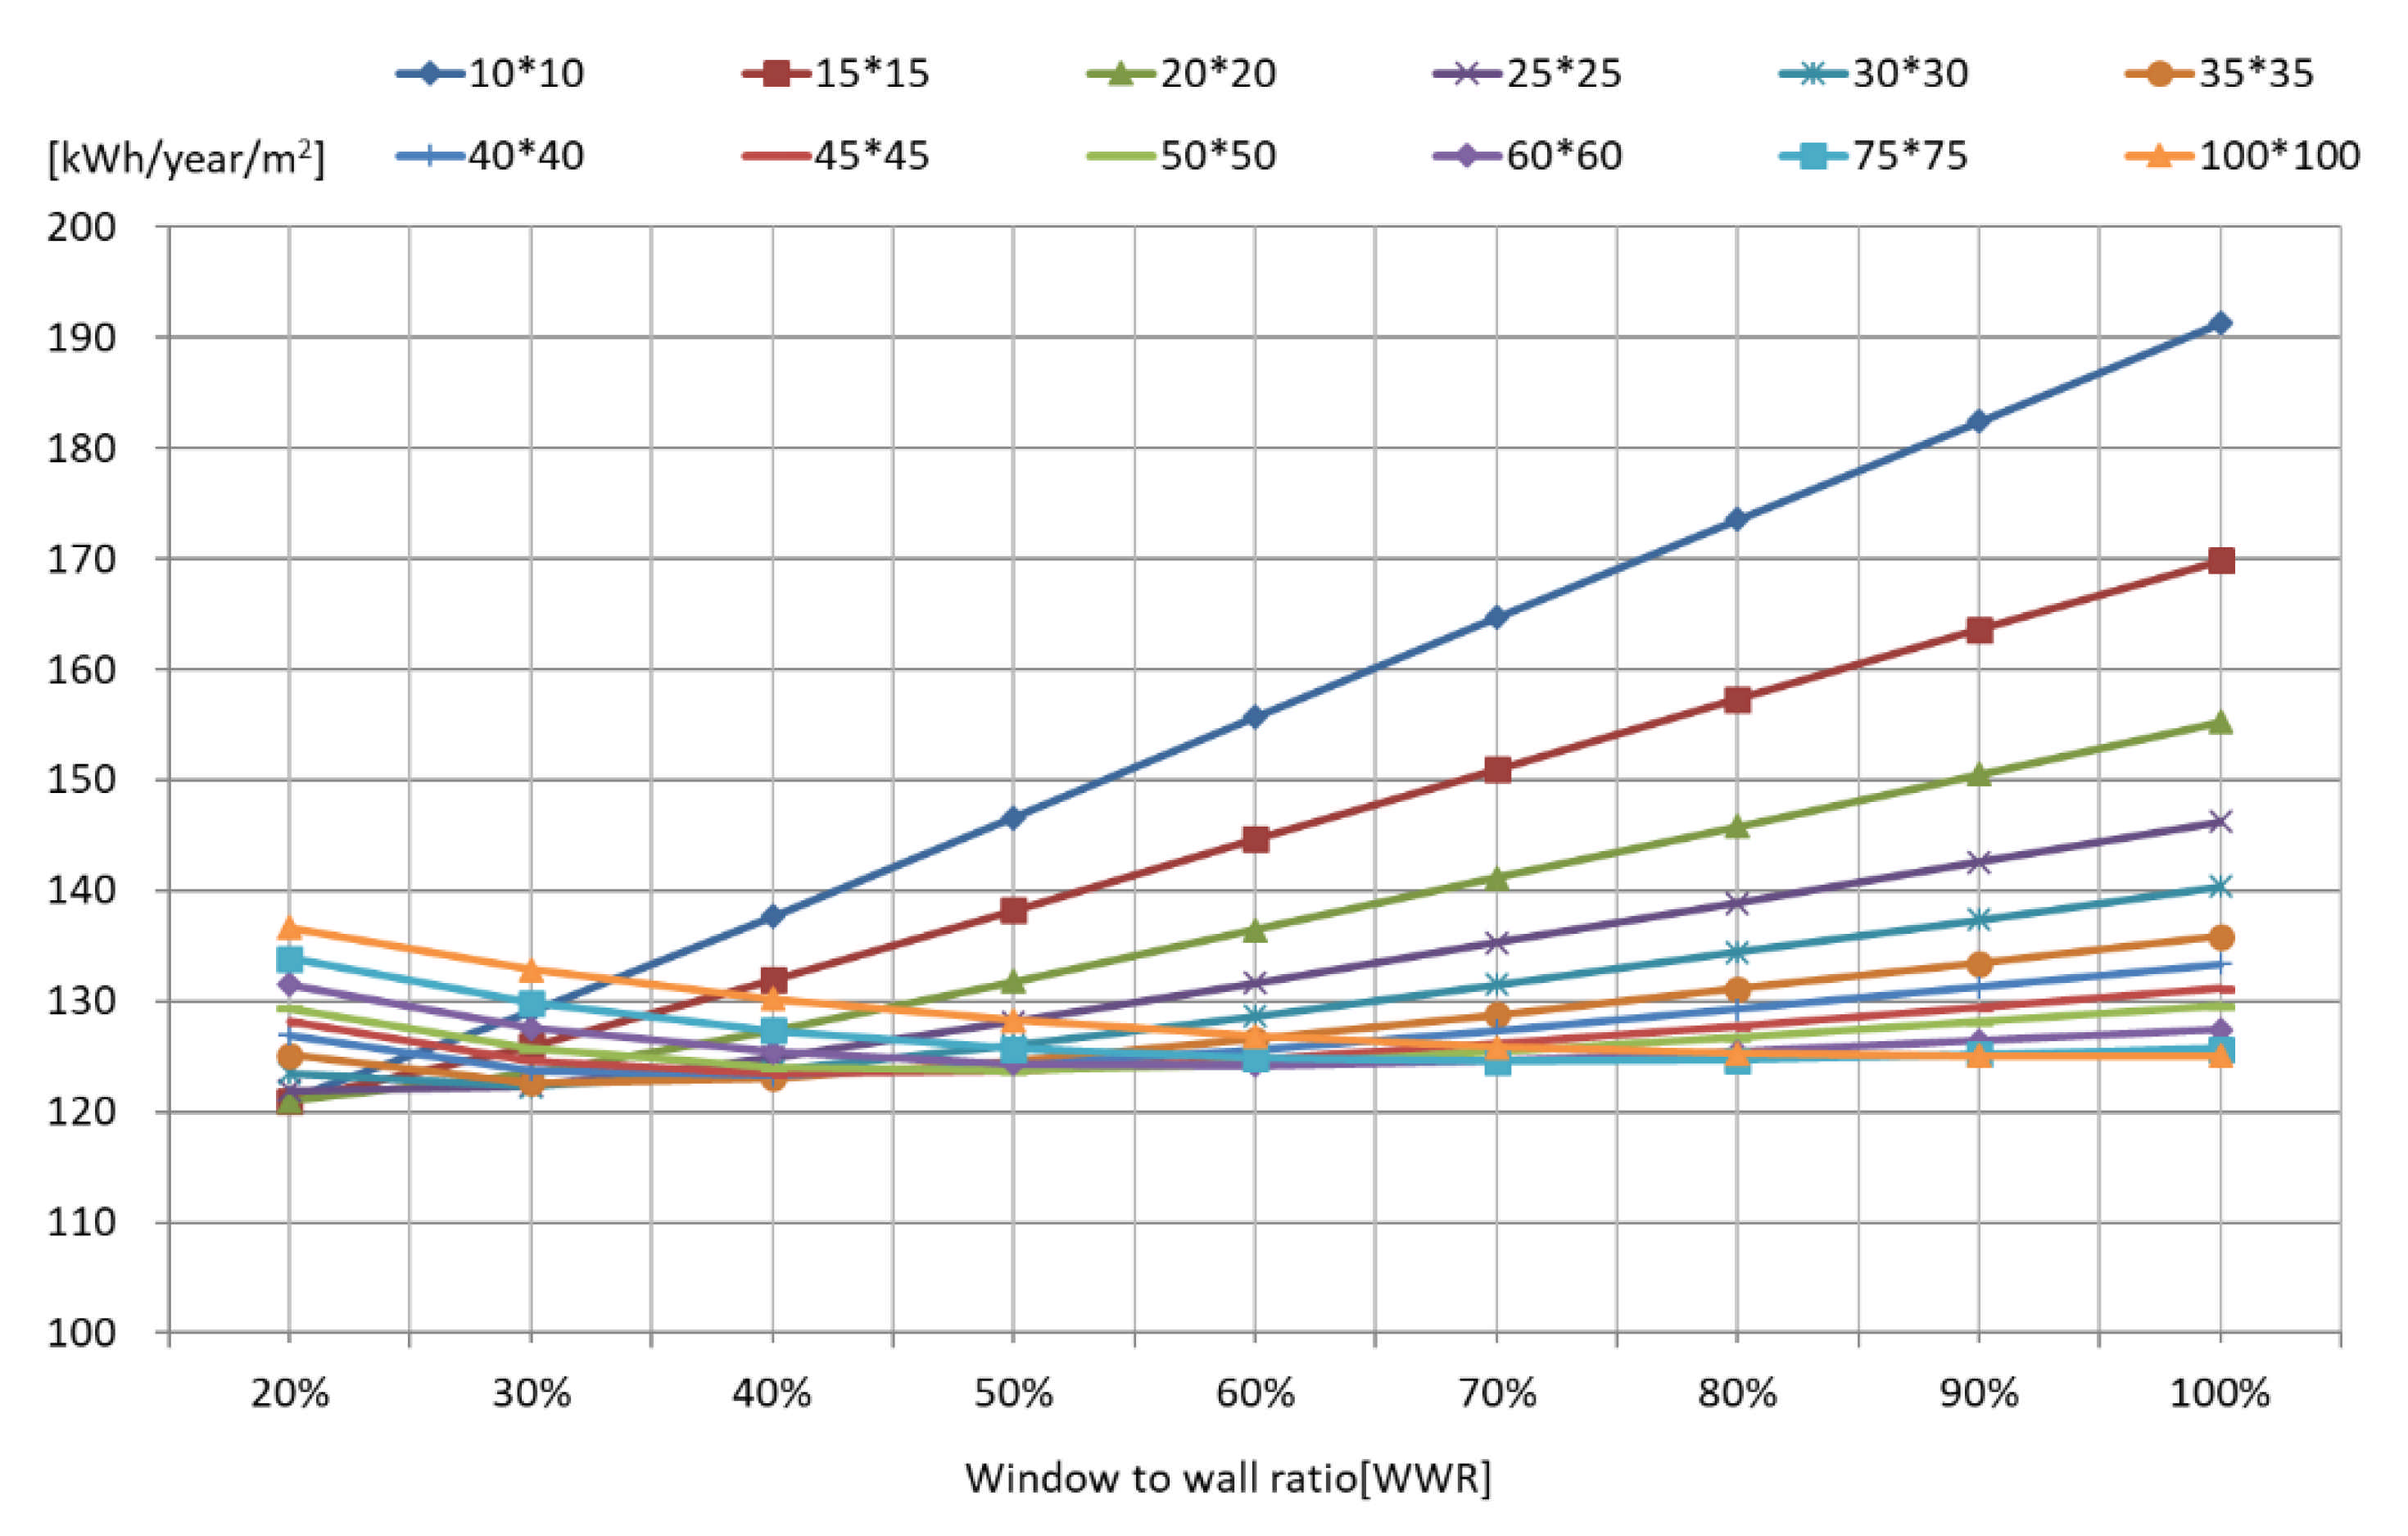
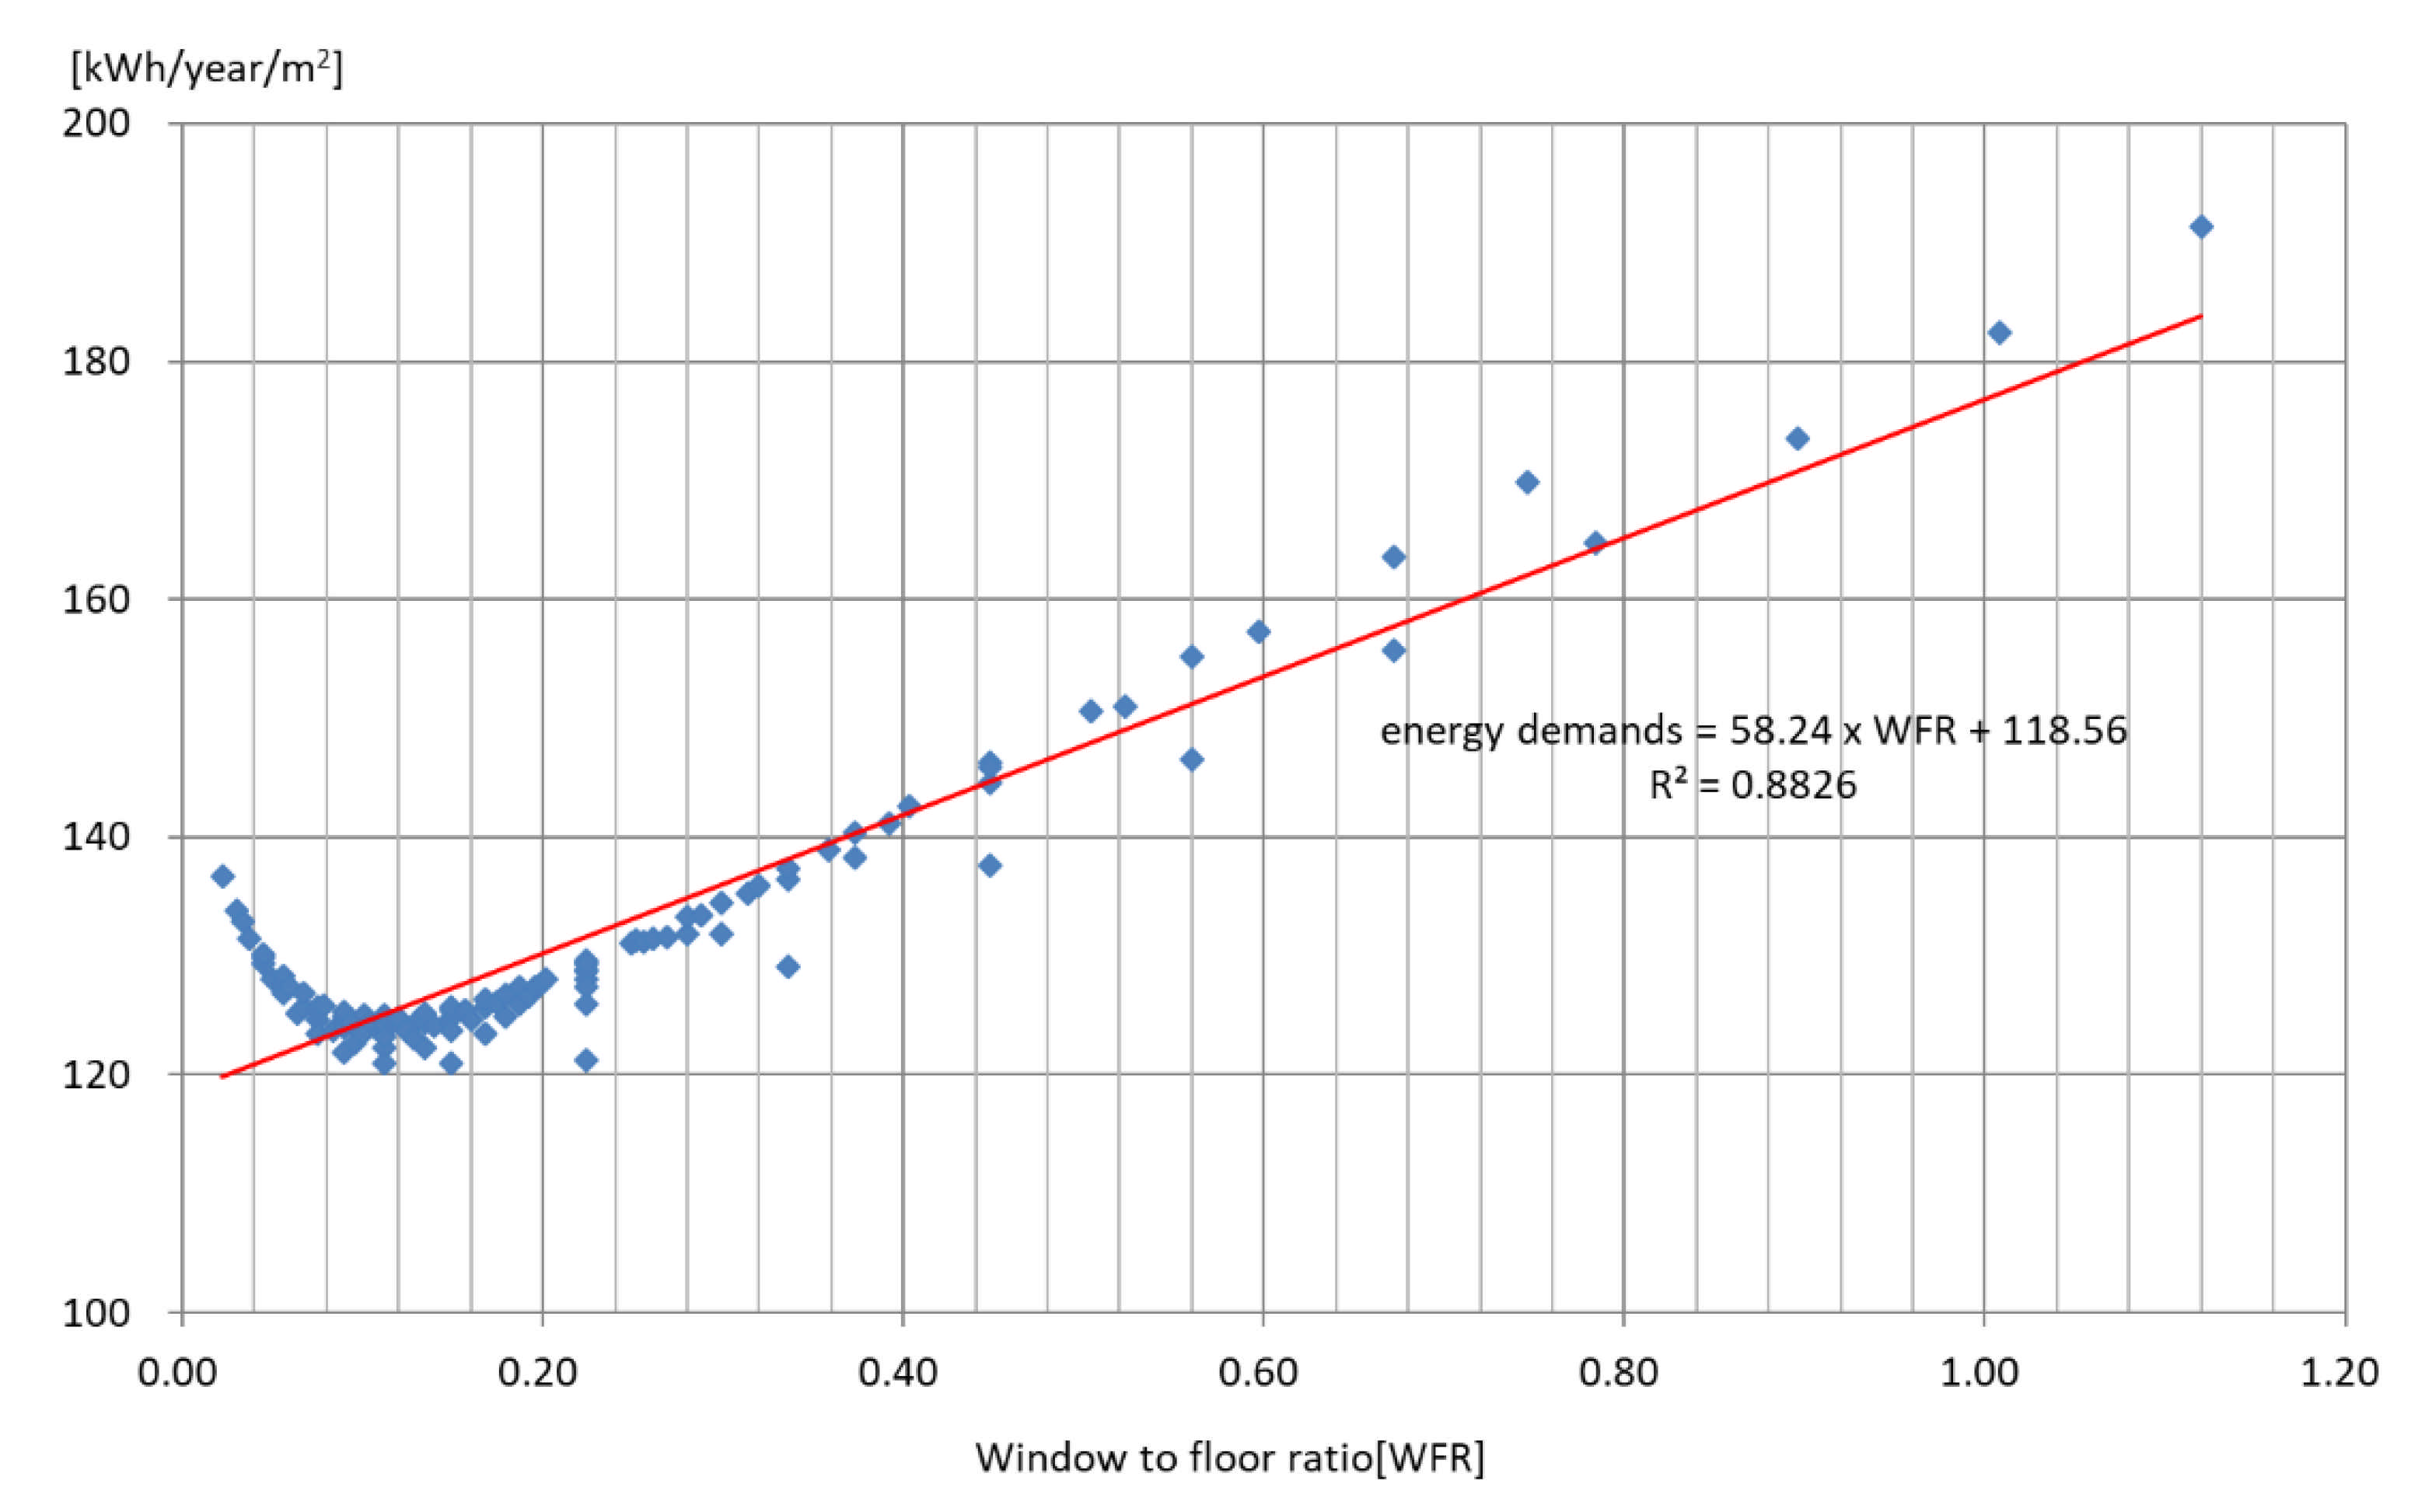
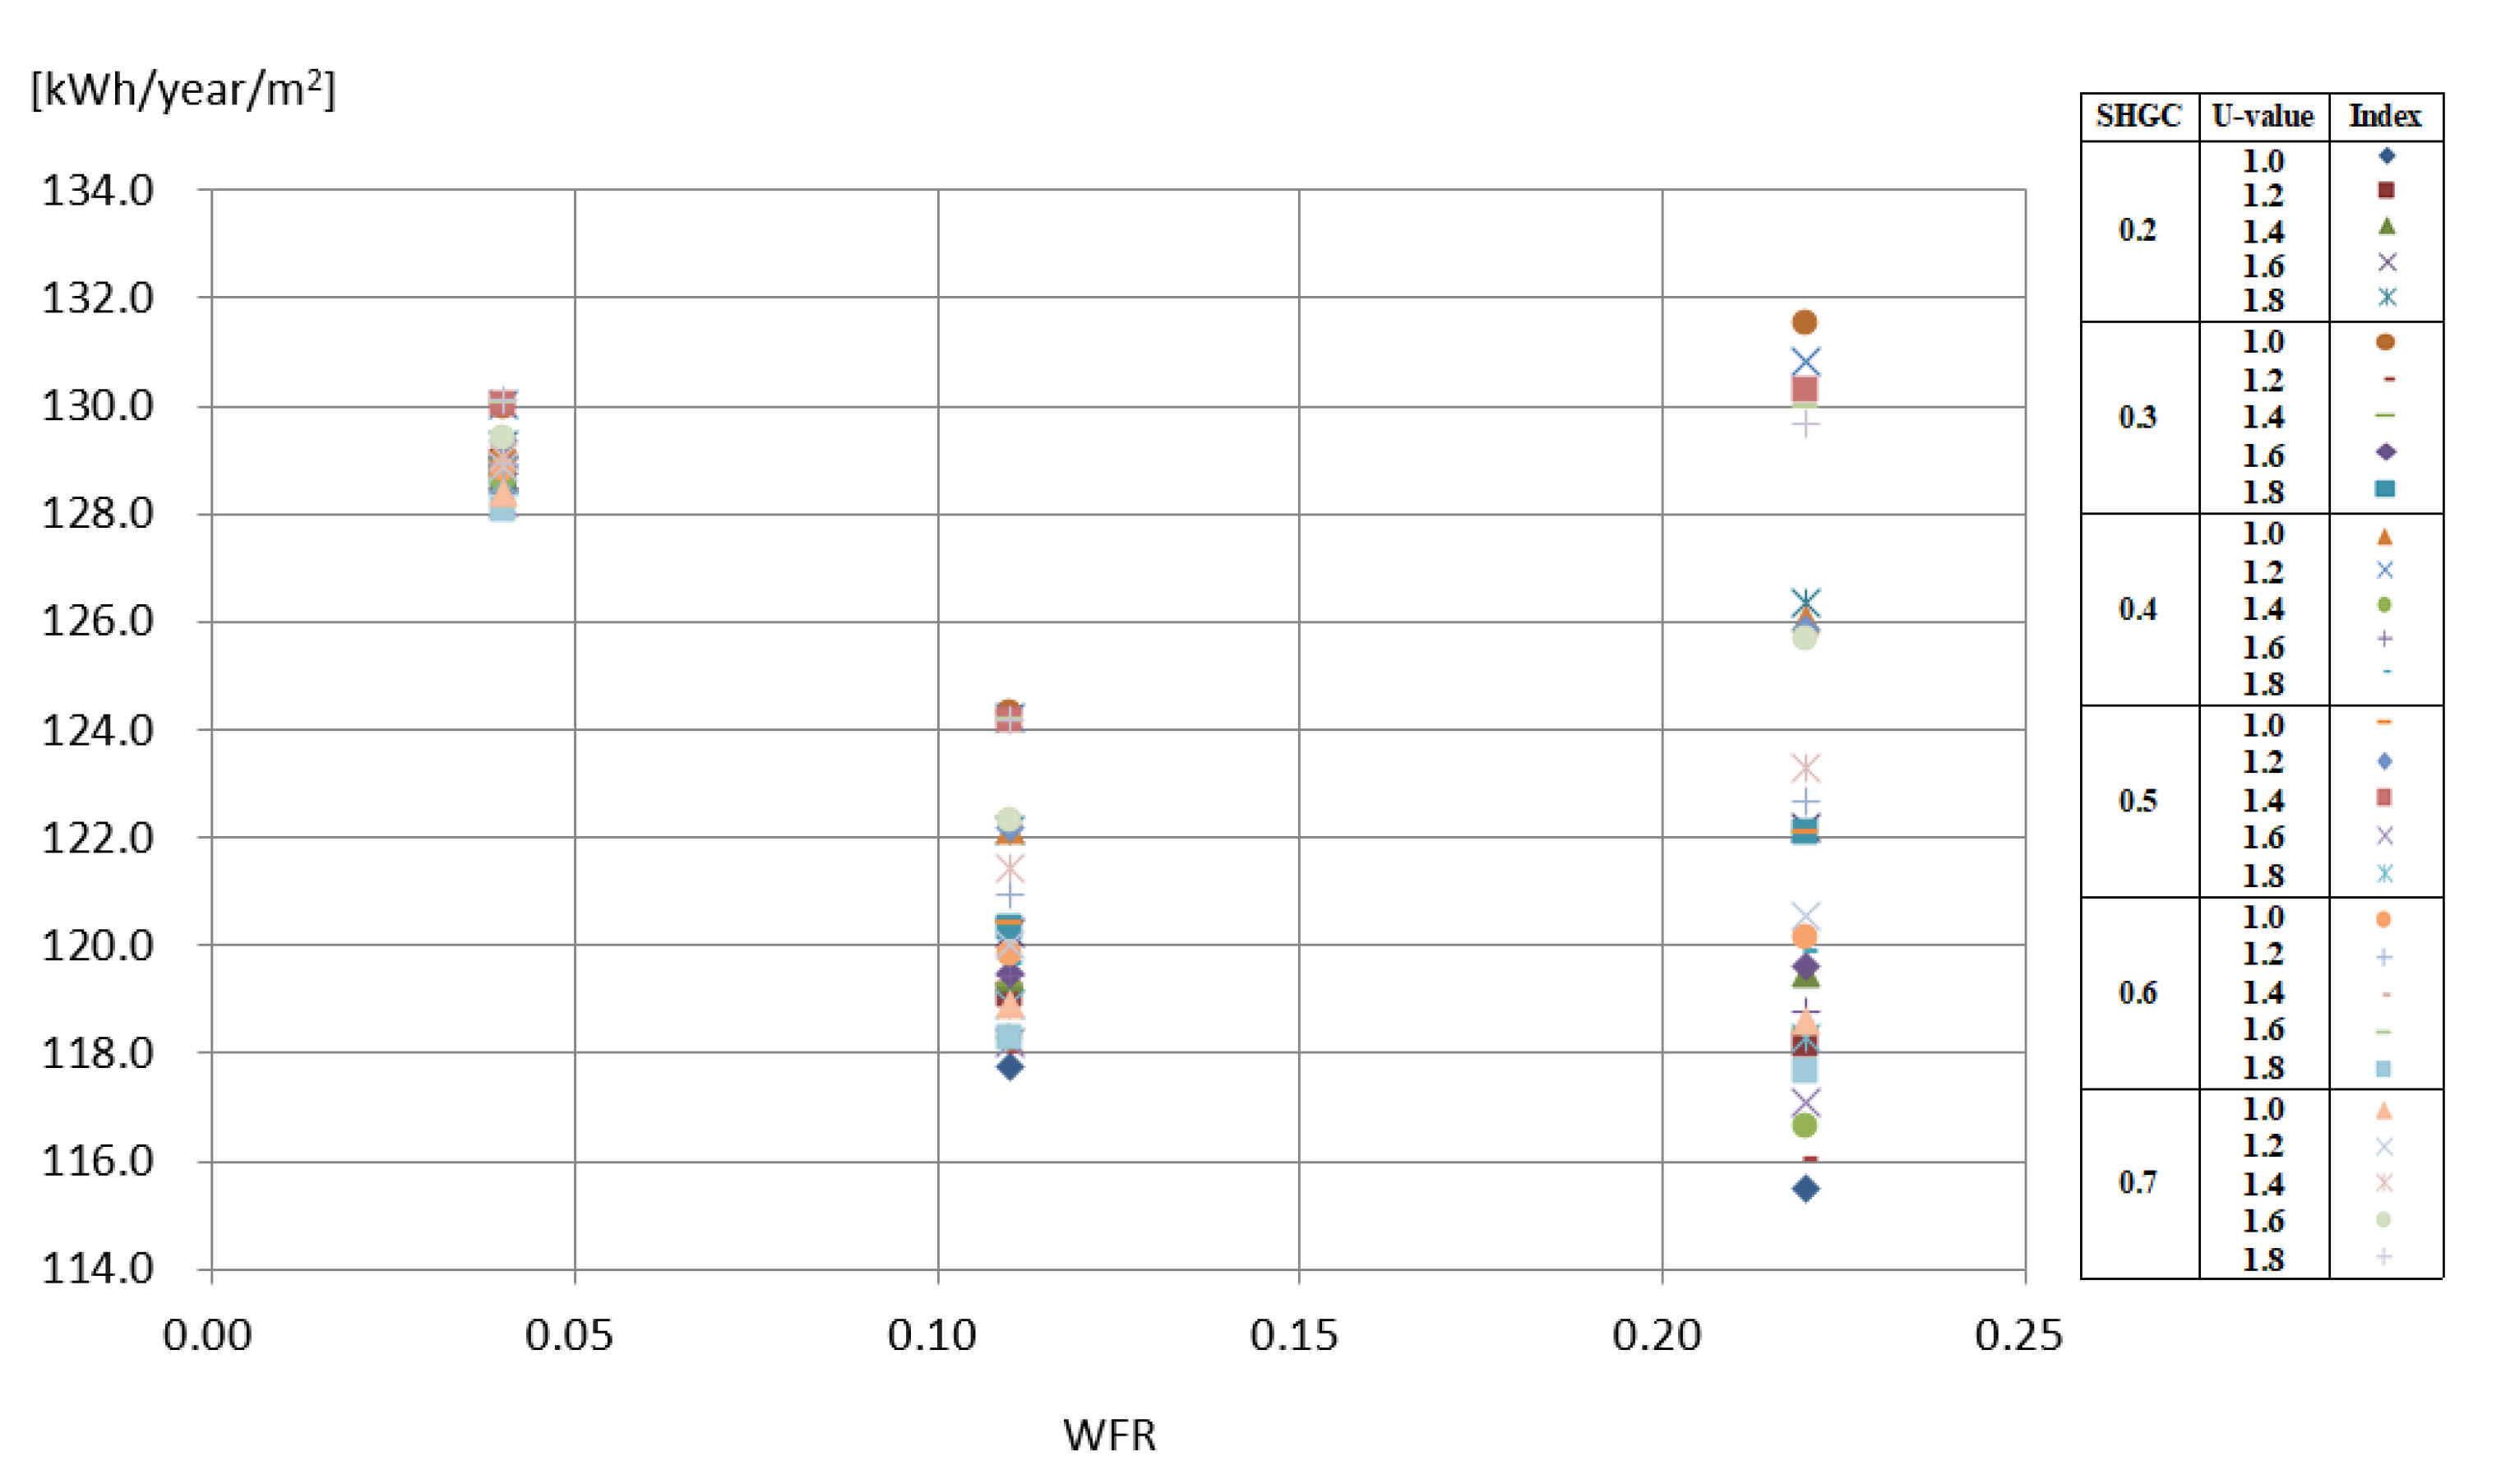
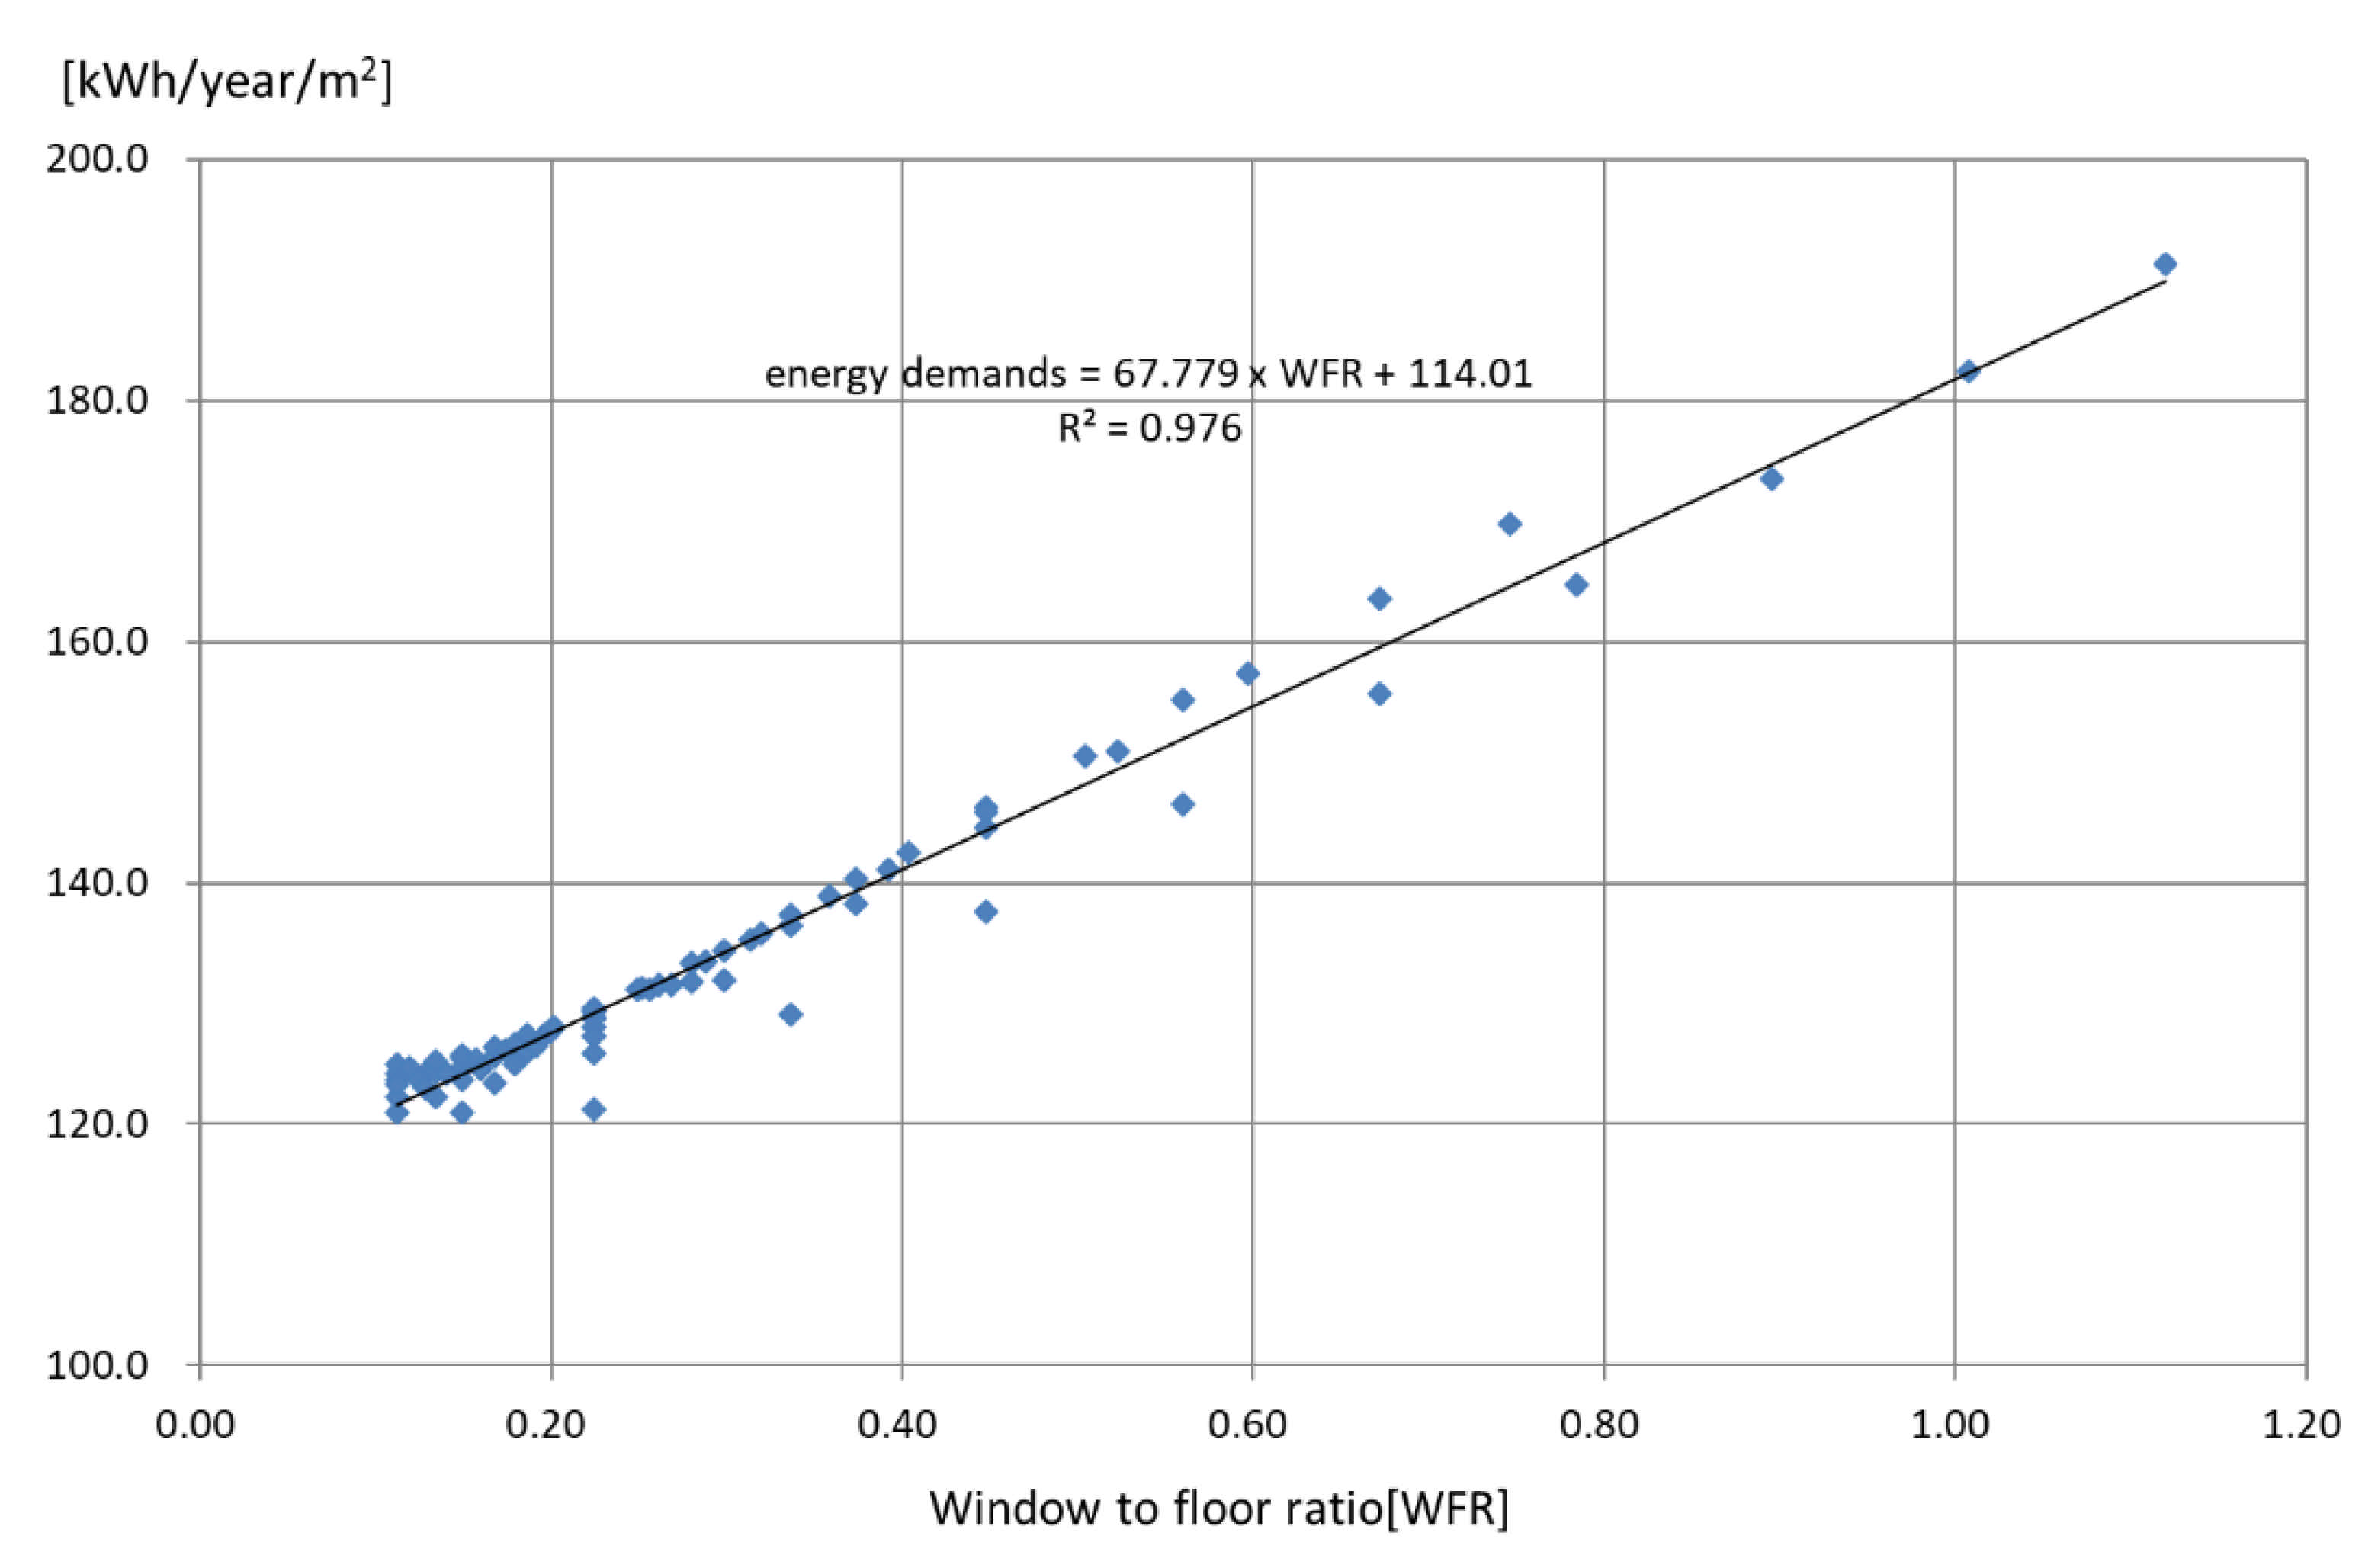
4.1. Correlation between WWR and Building Energy

Table 5 summarizes results from analyzing energy demand with respect to building size with focus on WWR. Figure 2 illustrates energy demand per unit area in a graph to examine the results in more details.
Table 5 and Figure 2 have many implications. First, in terms of the window-to-wall area, impact of window-to-wall area on energy greatly increased (maximum 70 kWh/m2) with smaller building size, but as the size increased, the impact reduced, and after a certain size (30 × 30), it was shown that the impact was not proportional to the WWR anymore. Thus, it is possible to utilize the WWR as an energy performance index for buildings with sizes below 2500 m2, however, it is not reasonable for larger buildings.
In addition, in buildings with sizes larger than 3600 m2, WWR of 20% had the largest energy demand, and in buildings with sizes of 10,000 m2, WWR of 100% had the largest energy demand.
Figure 3 and Figure 4 show the energy demand with respect to WFR verified. Figure 3 shows the distribution of energy demand for all WFR, and it can be seen that, in ranges with low WFR, the trend was reversed. Thus, as shown in Figure 4, results from analysis of WFR above 0.1 showed a linearly increasing trend. Moreover, it could be deduced that R2, the coefficient of determination, was about 0.97, which implied very high correlation.
This correlation certainly varied depending on the simulation condition and the structure performance assumed previously, but the trend was expected to be similar.

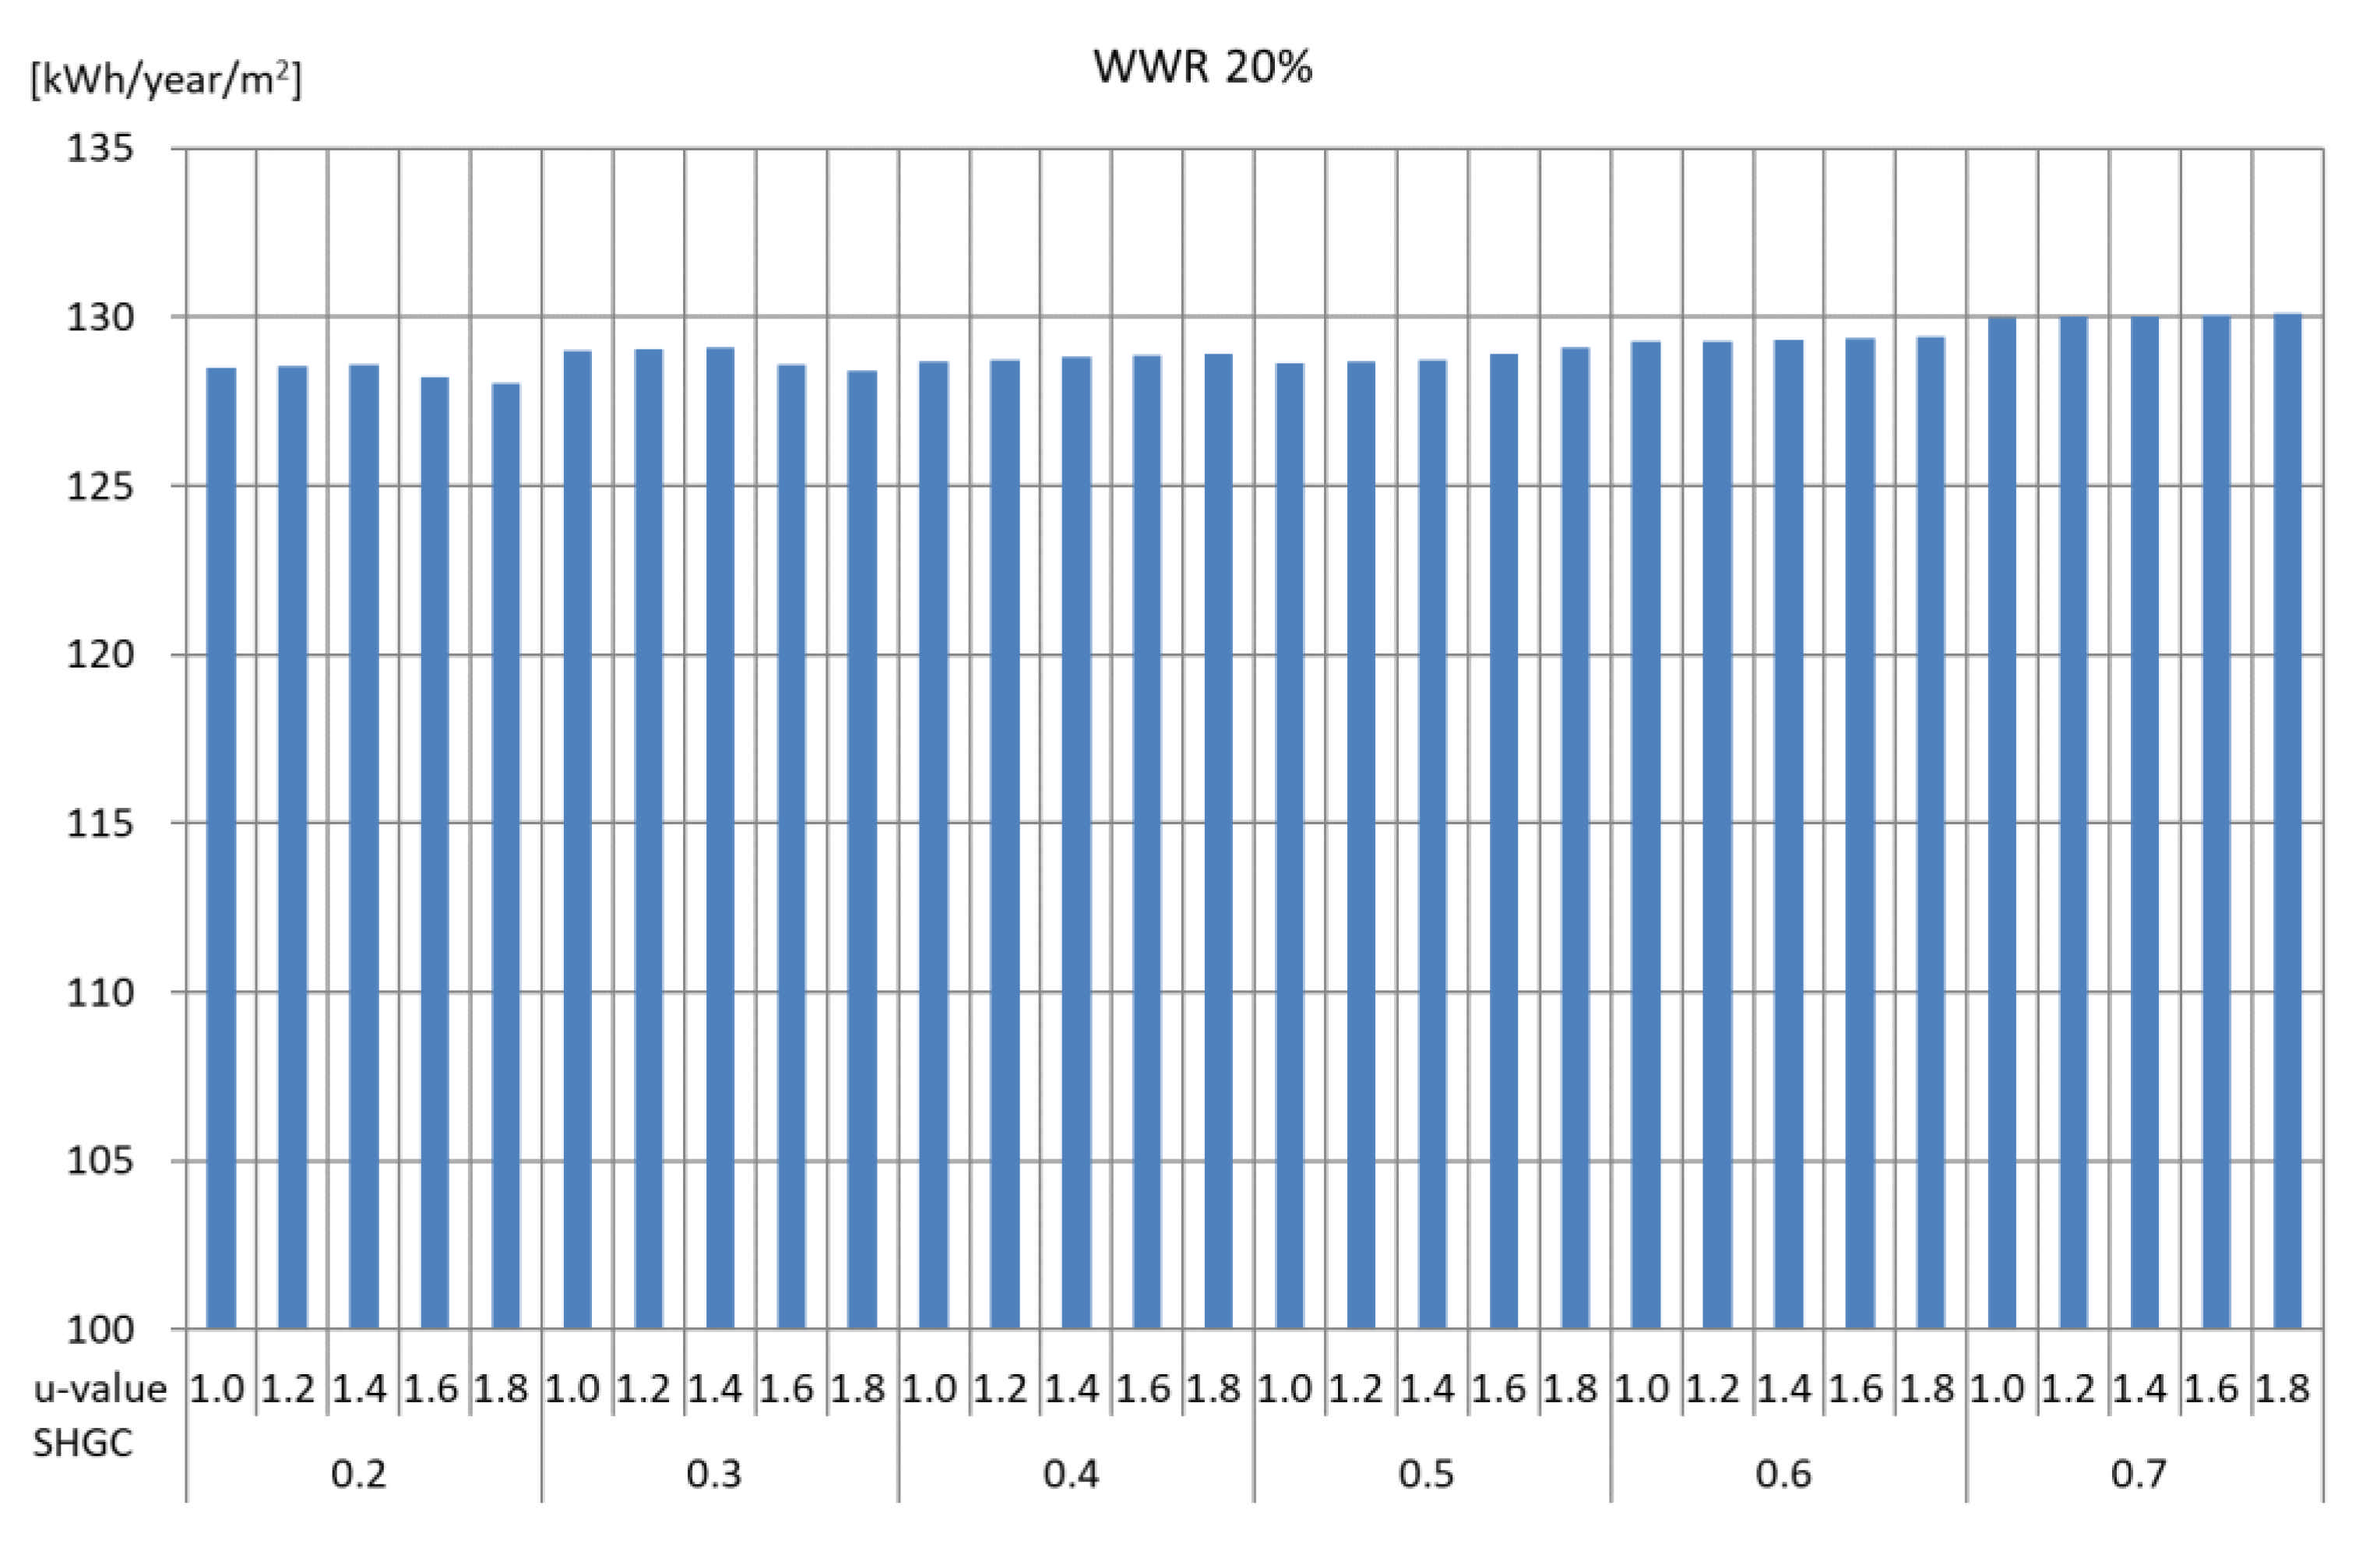
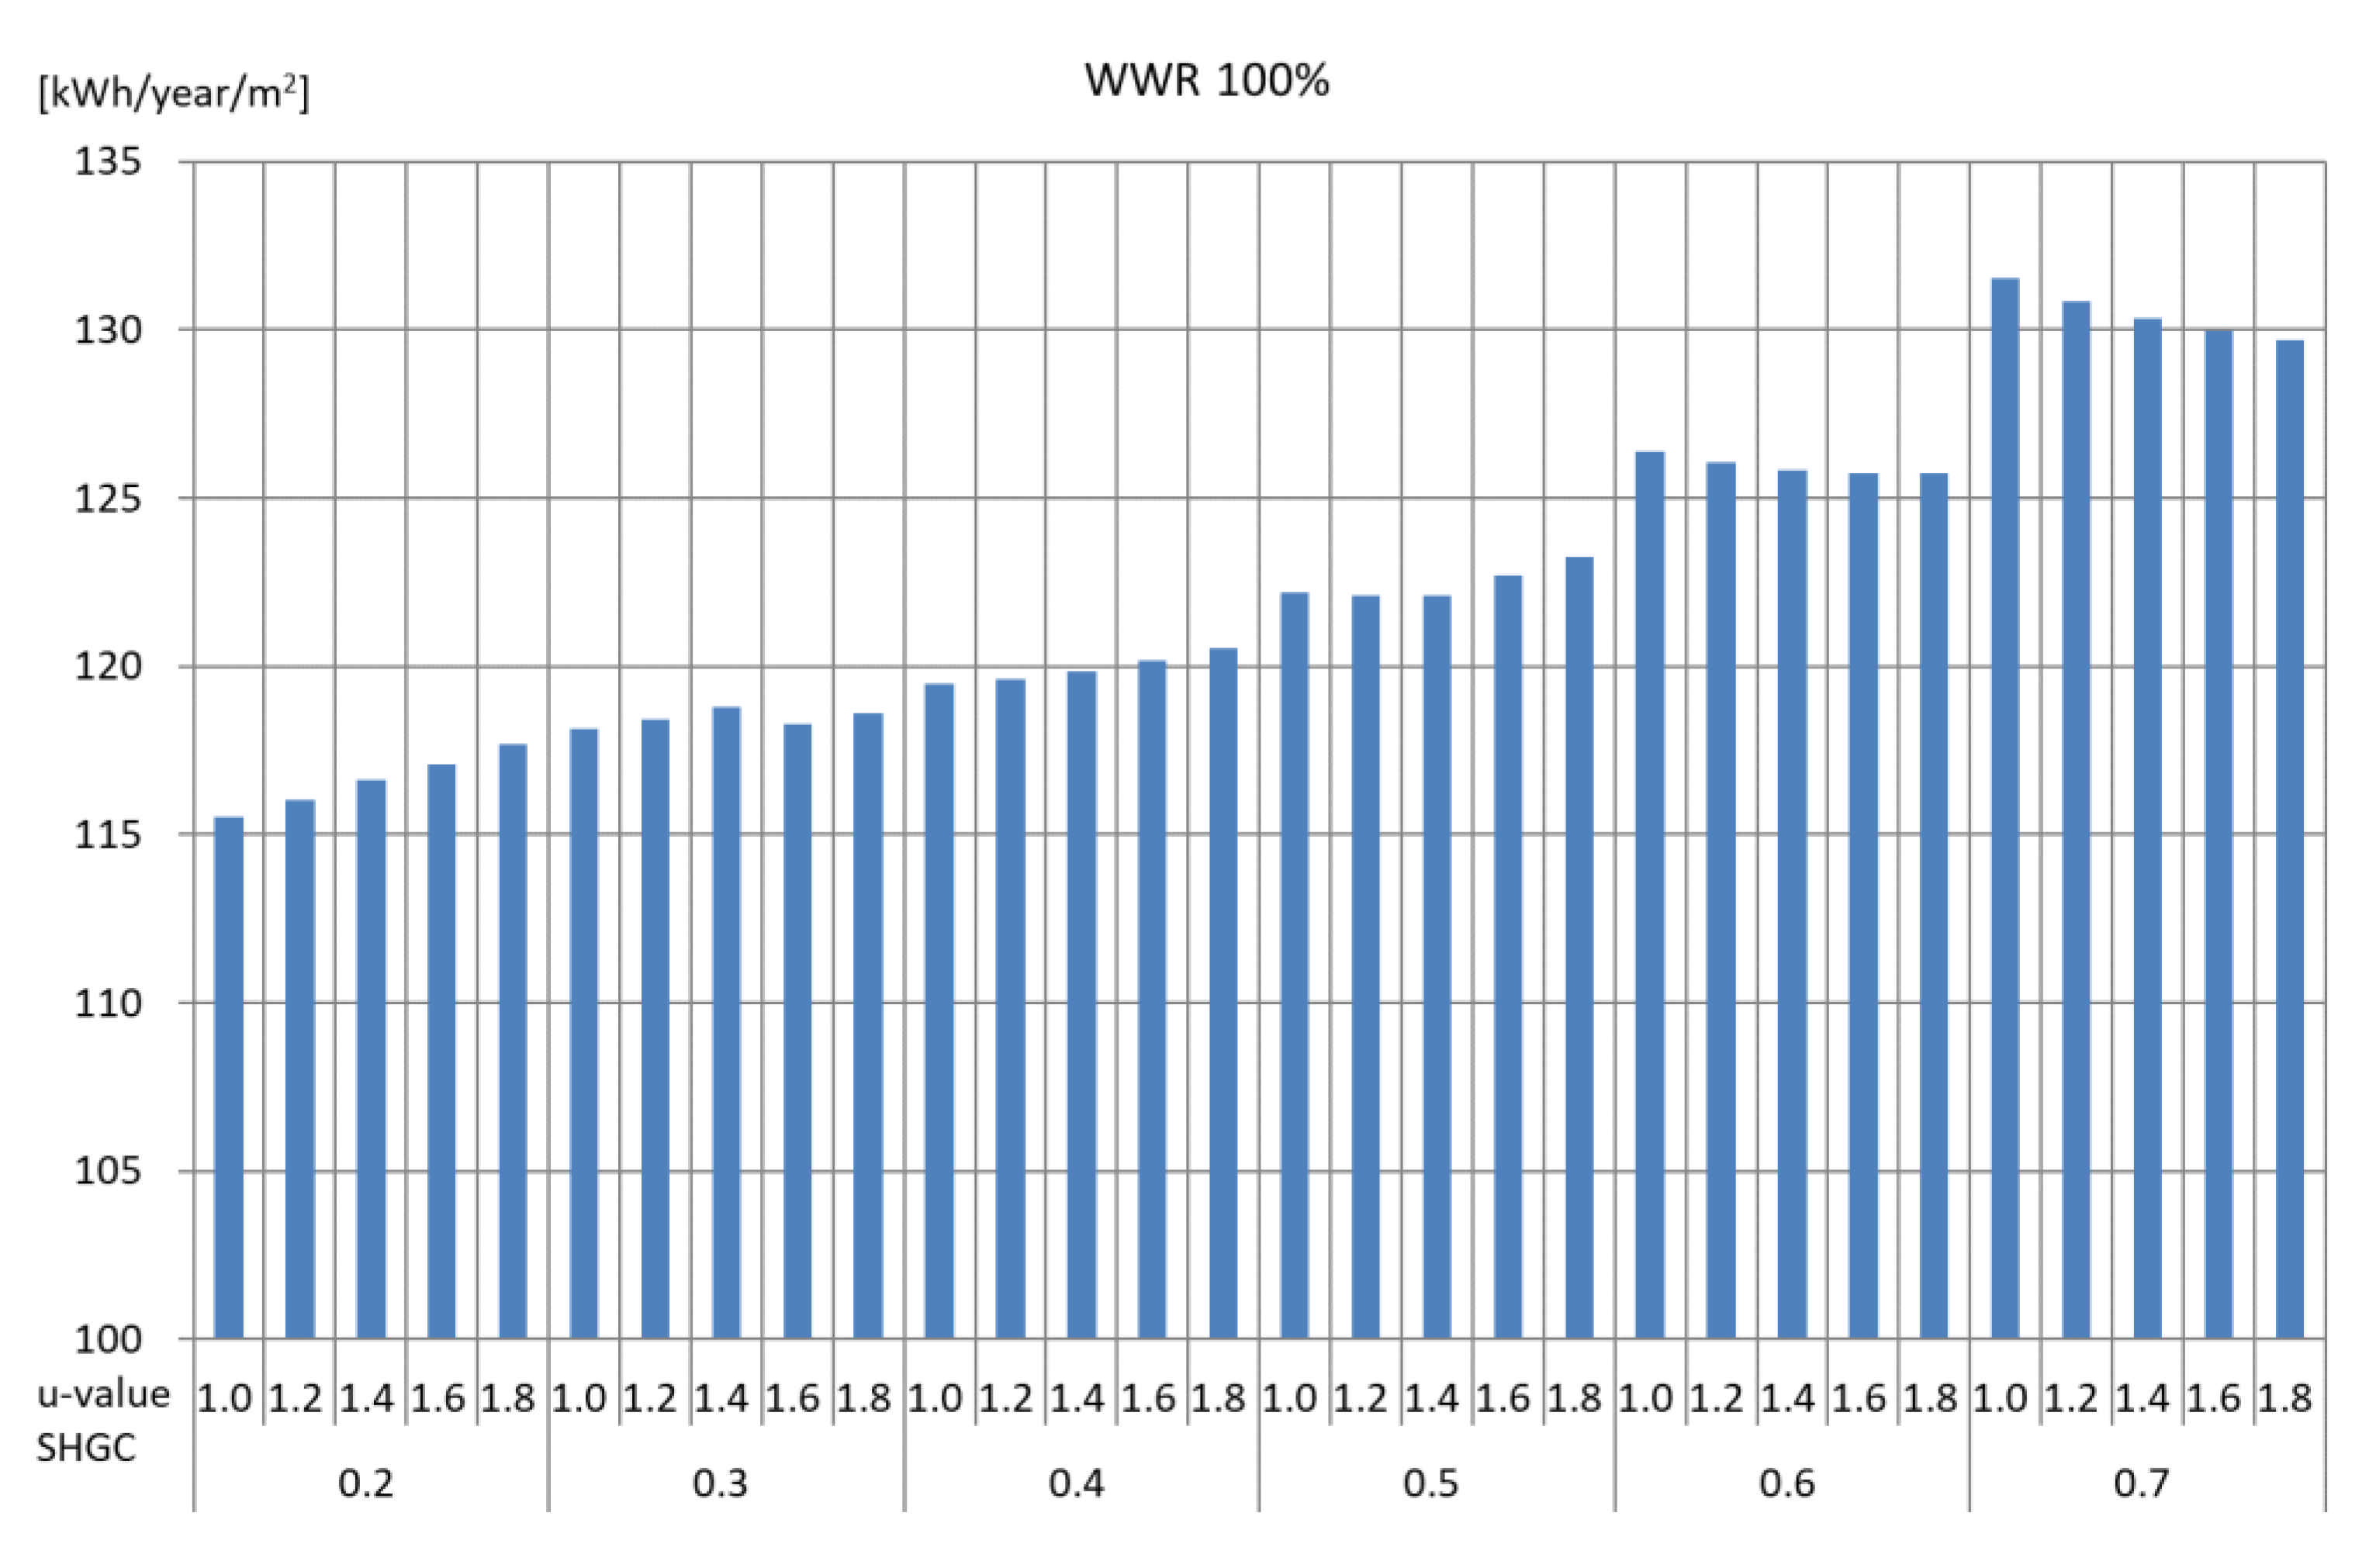
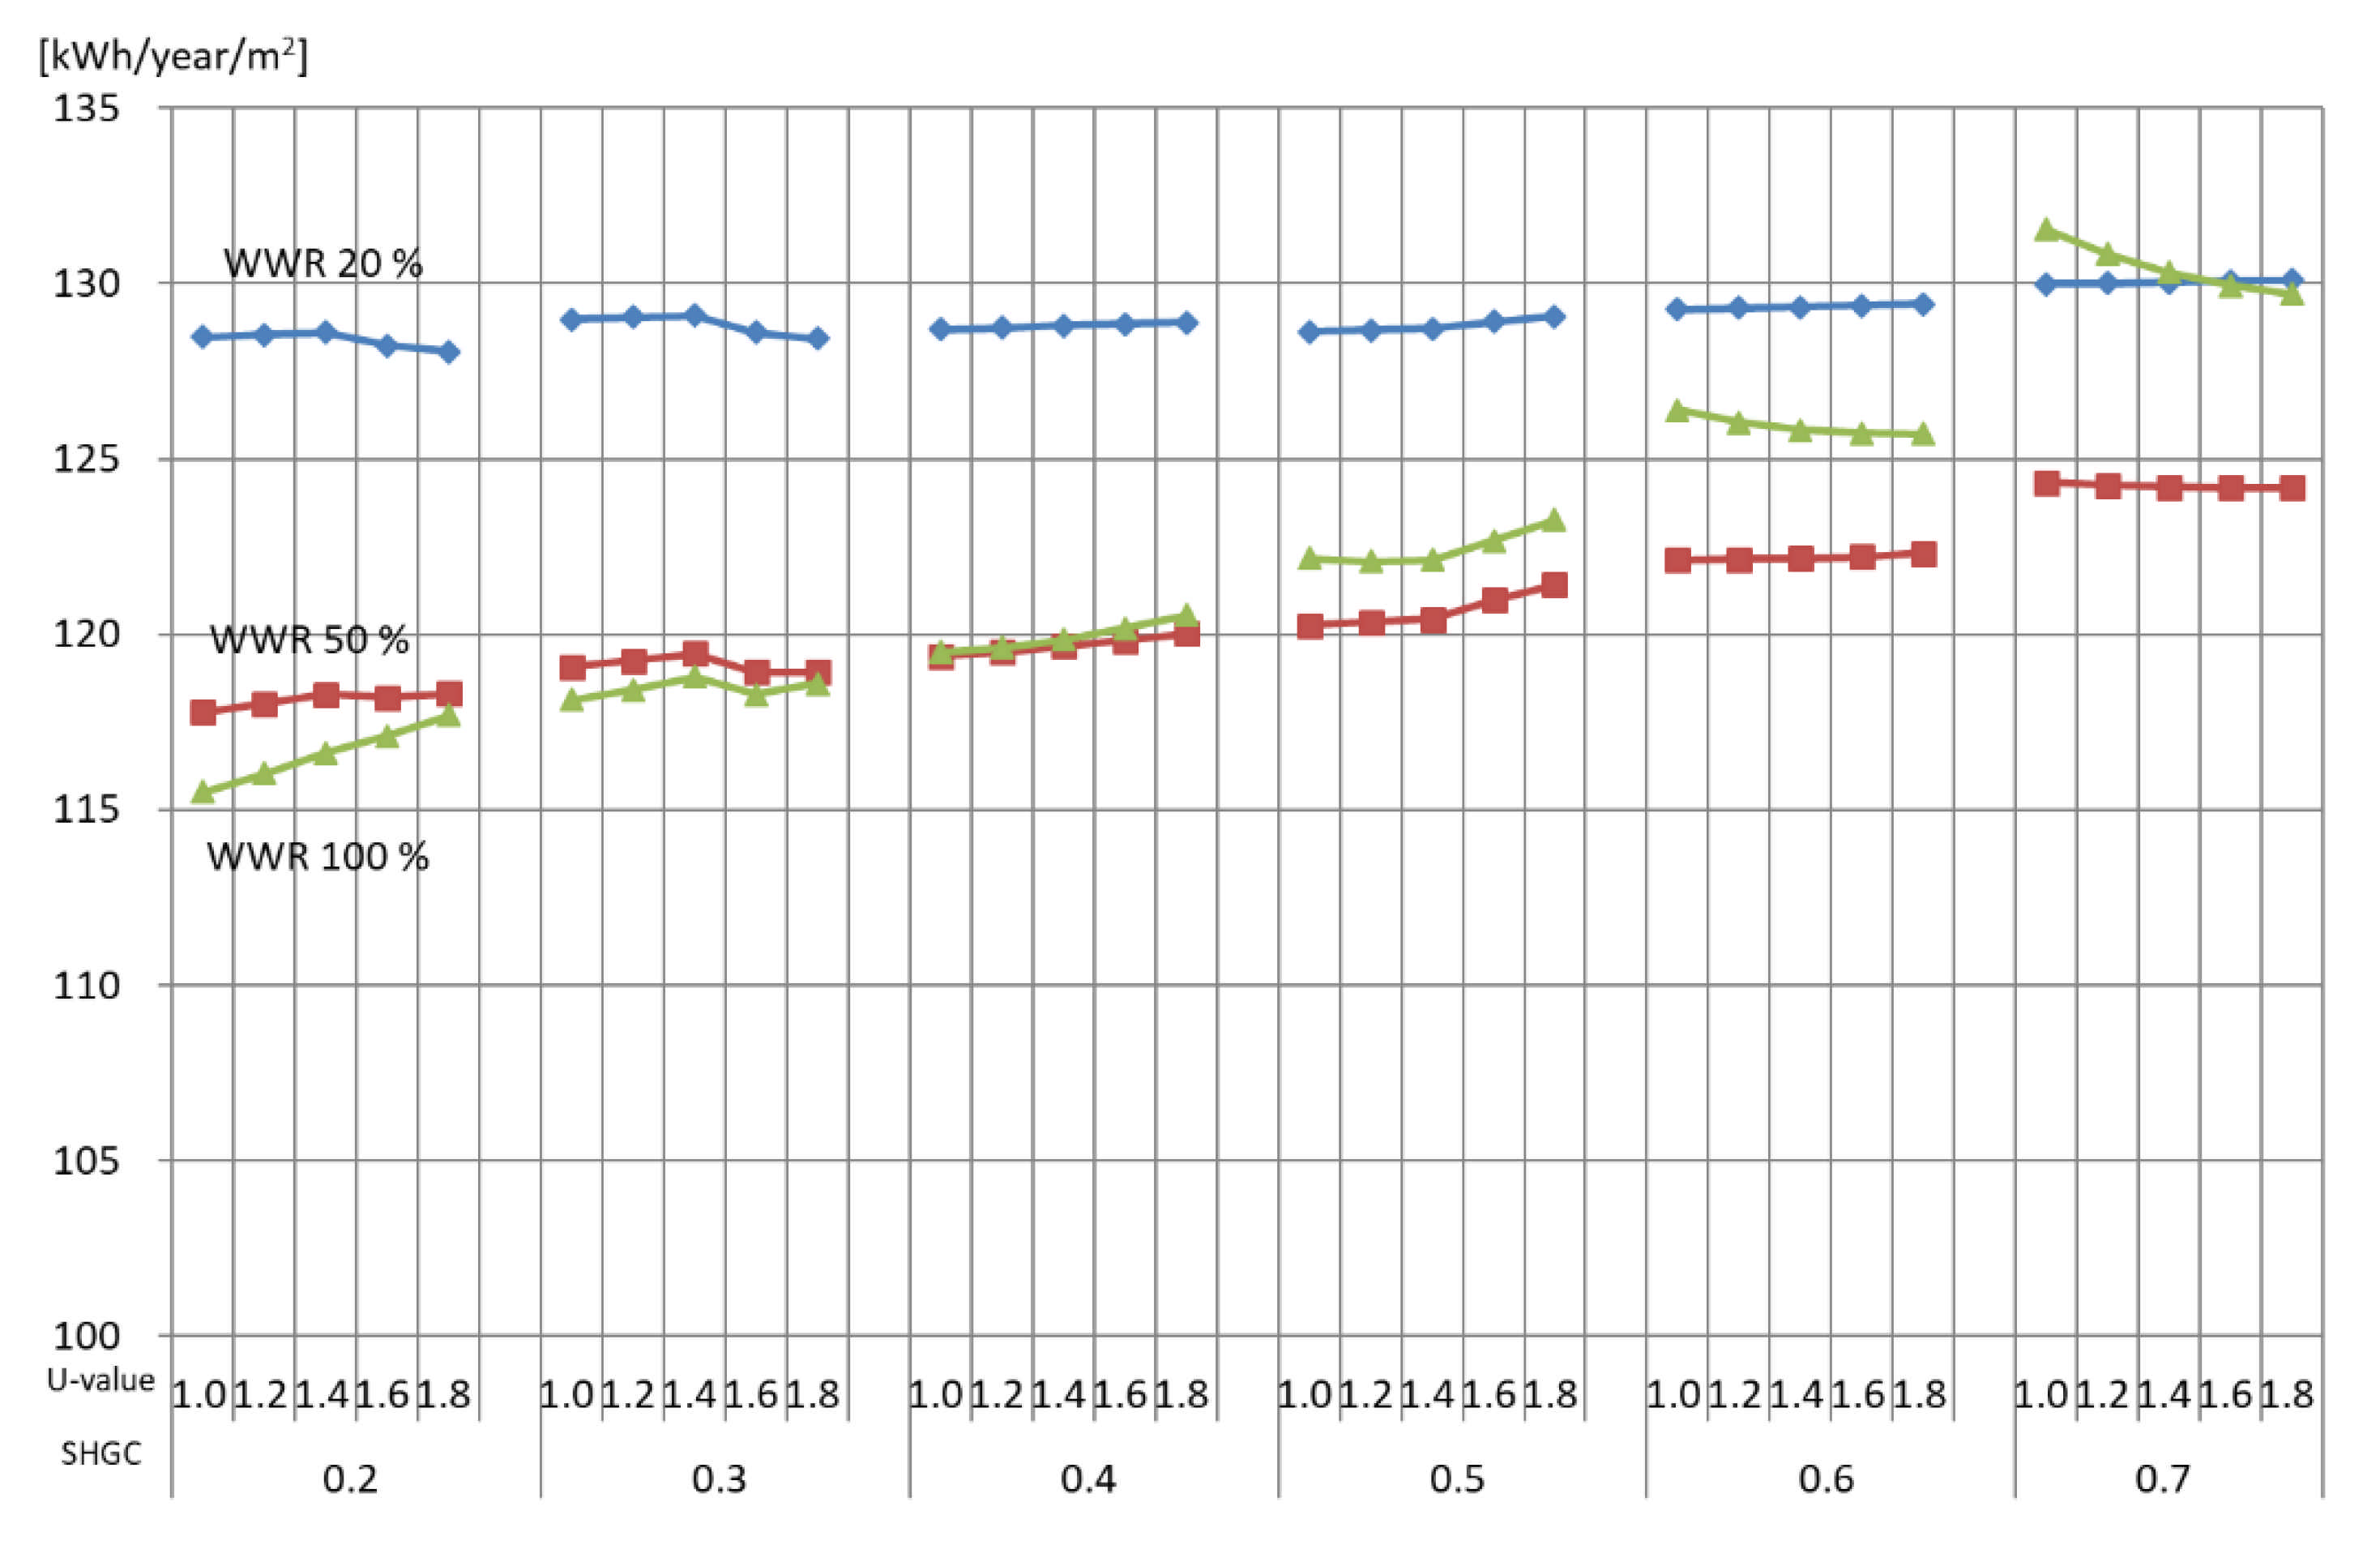
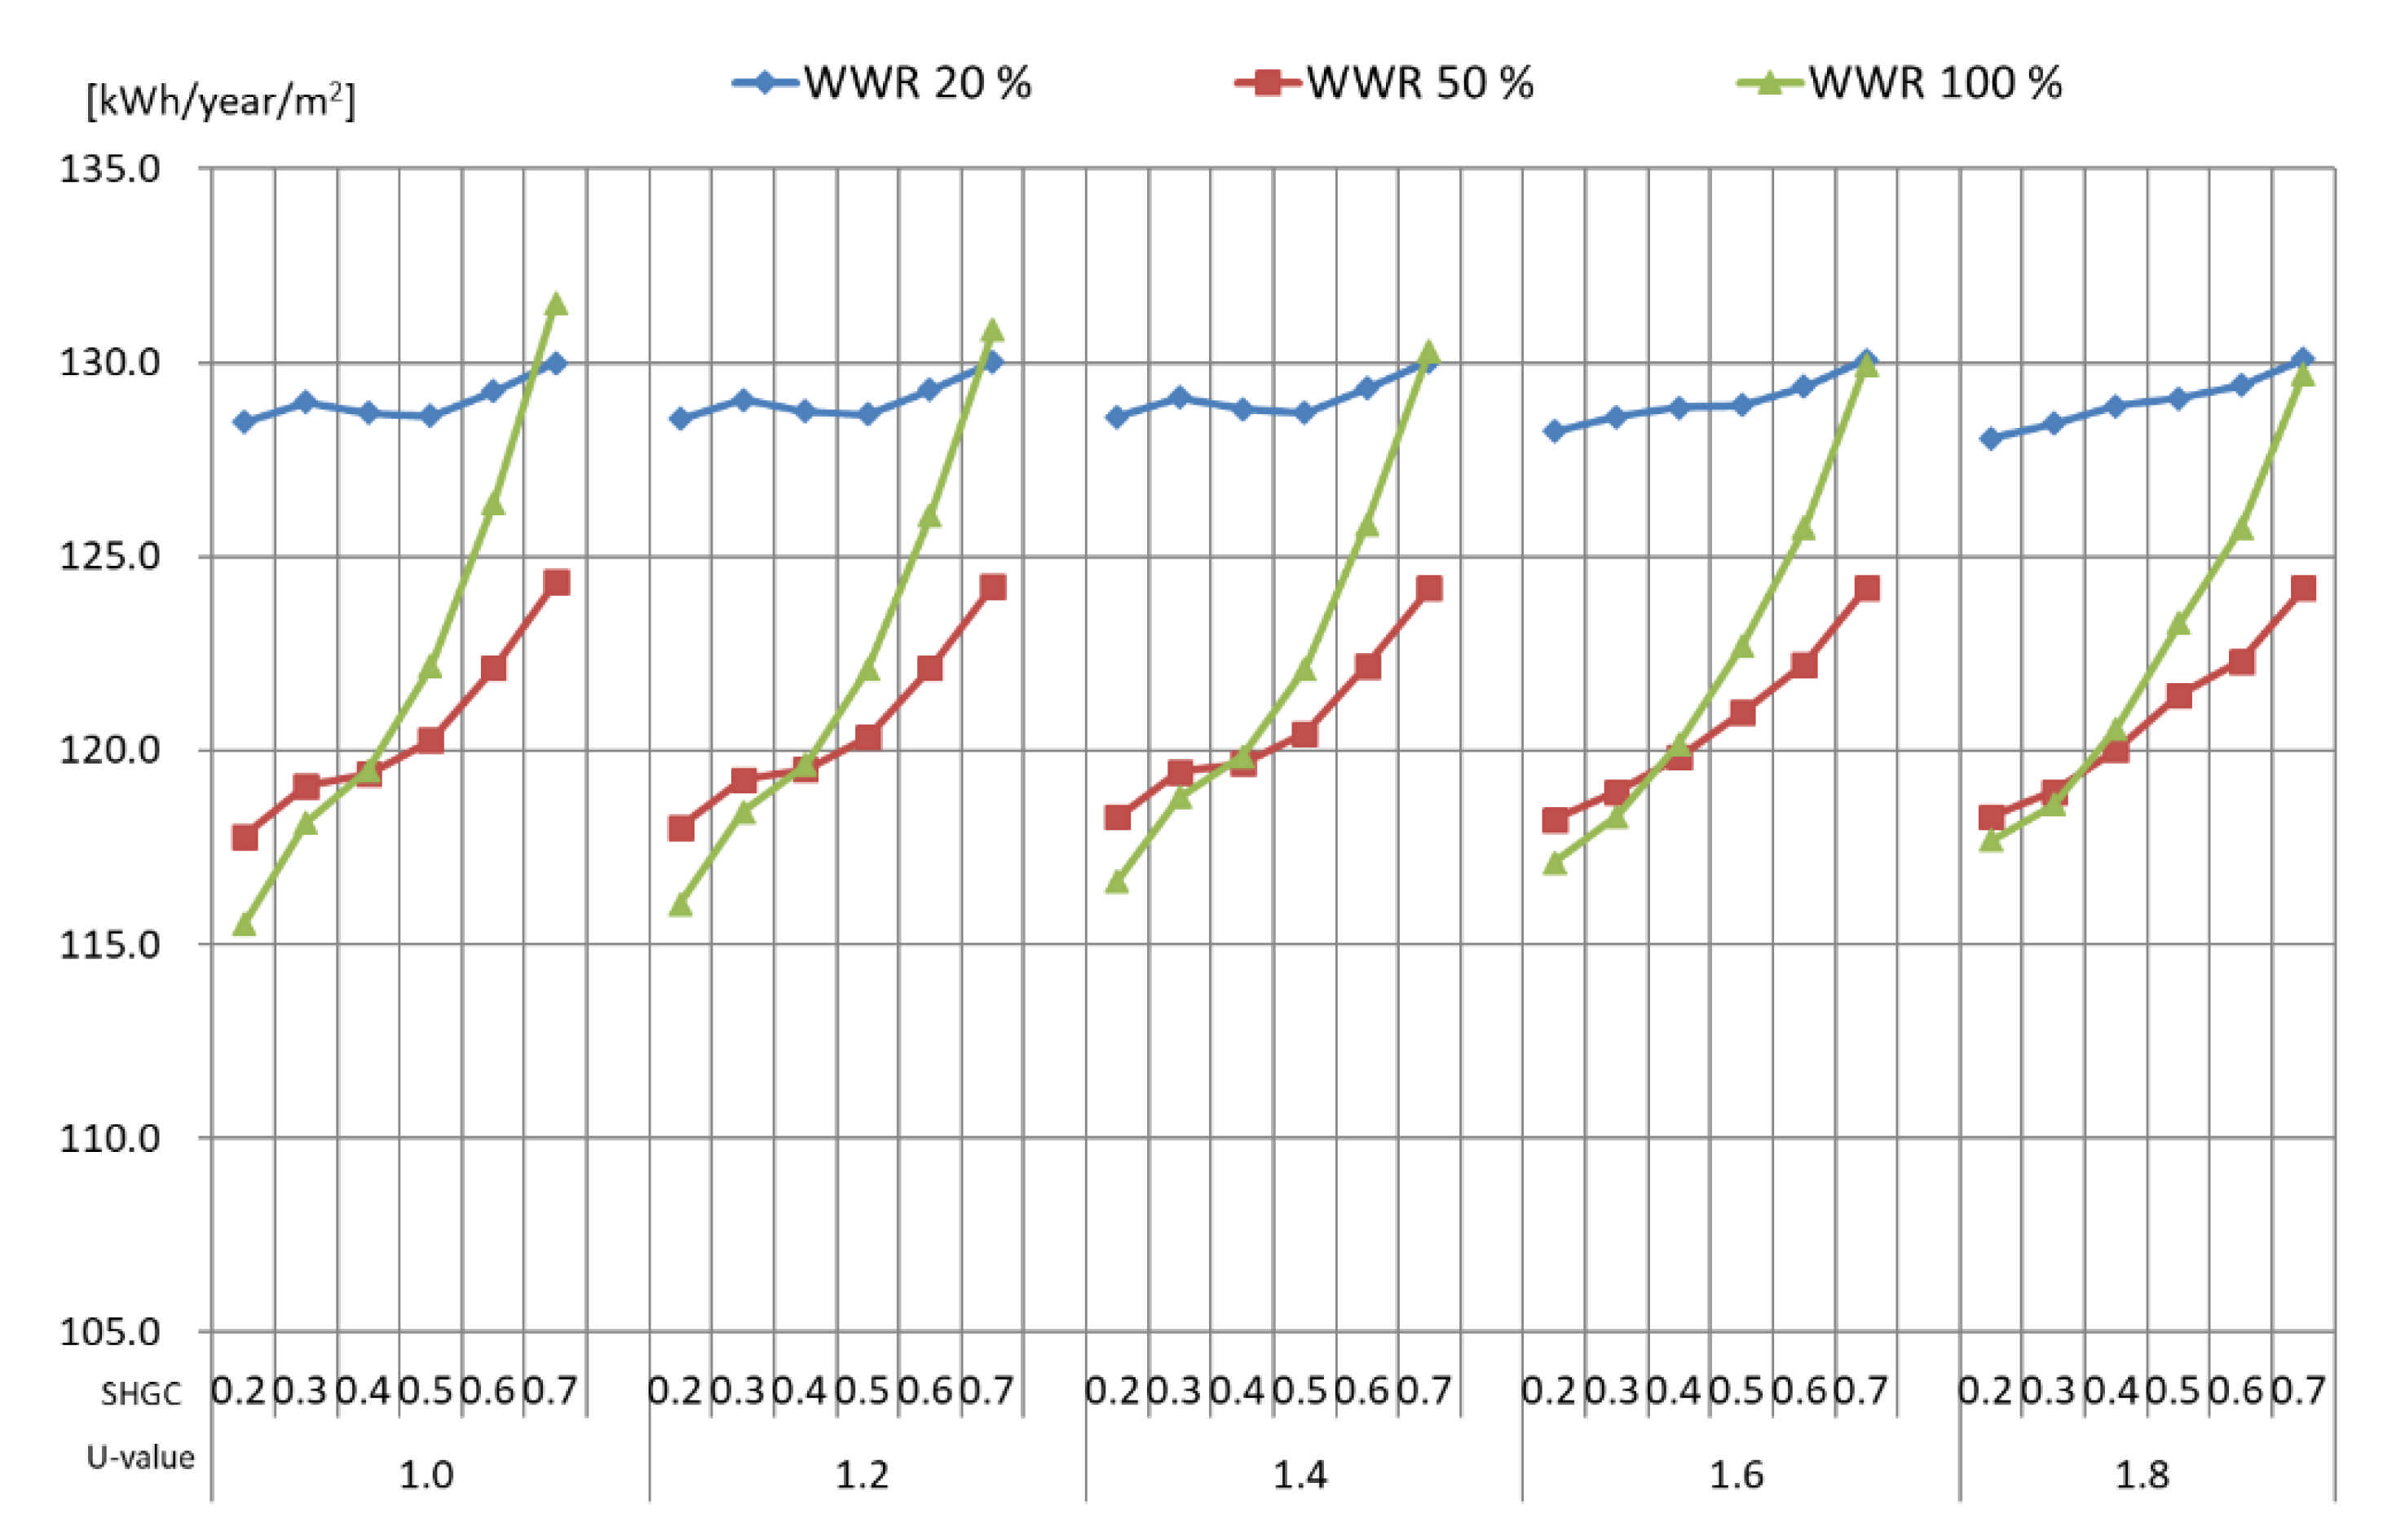
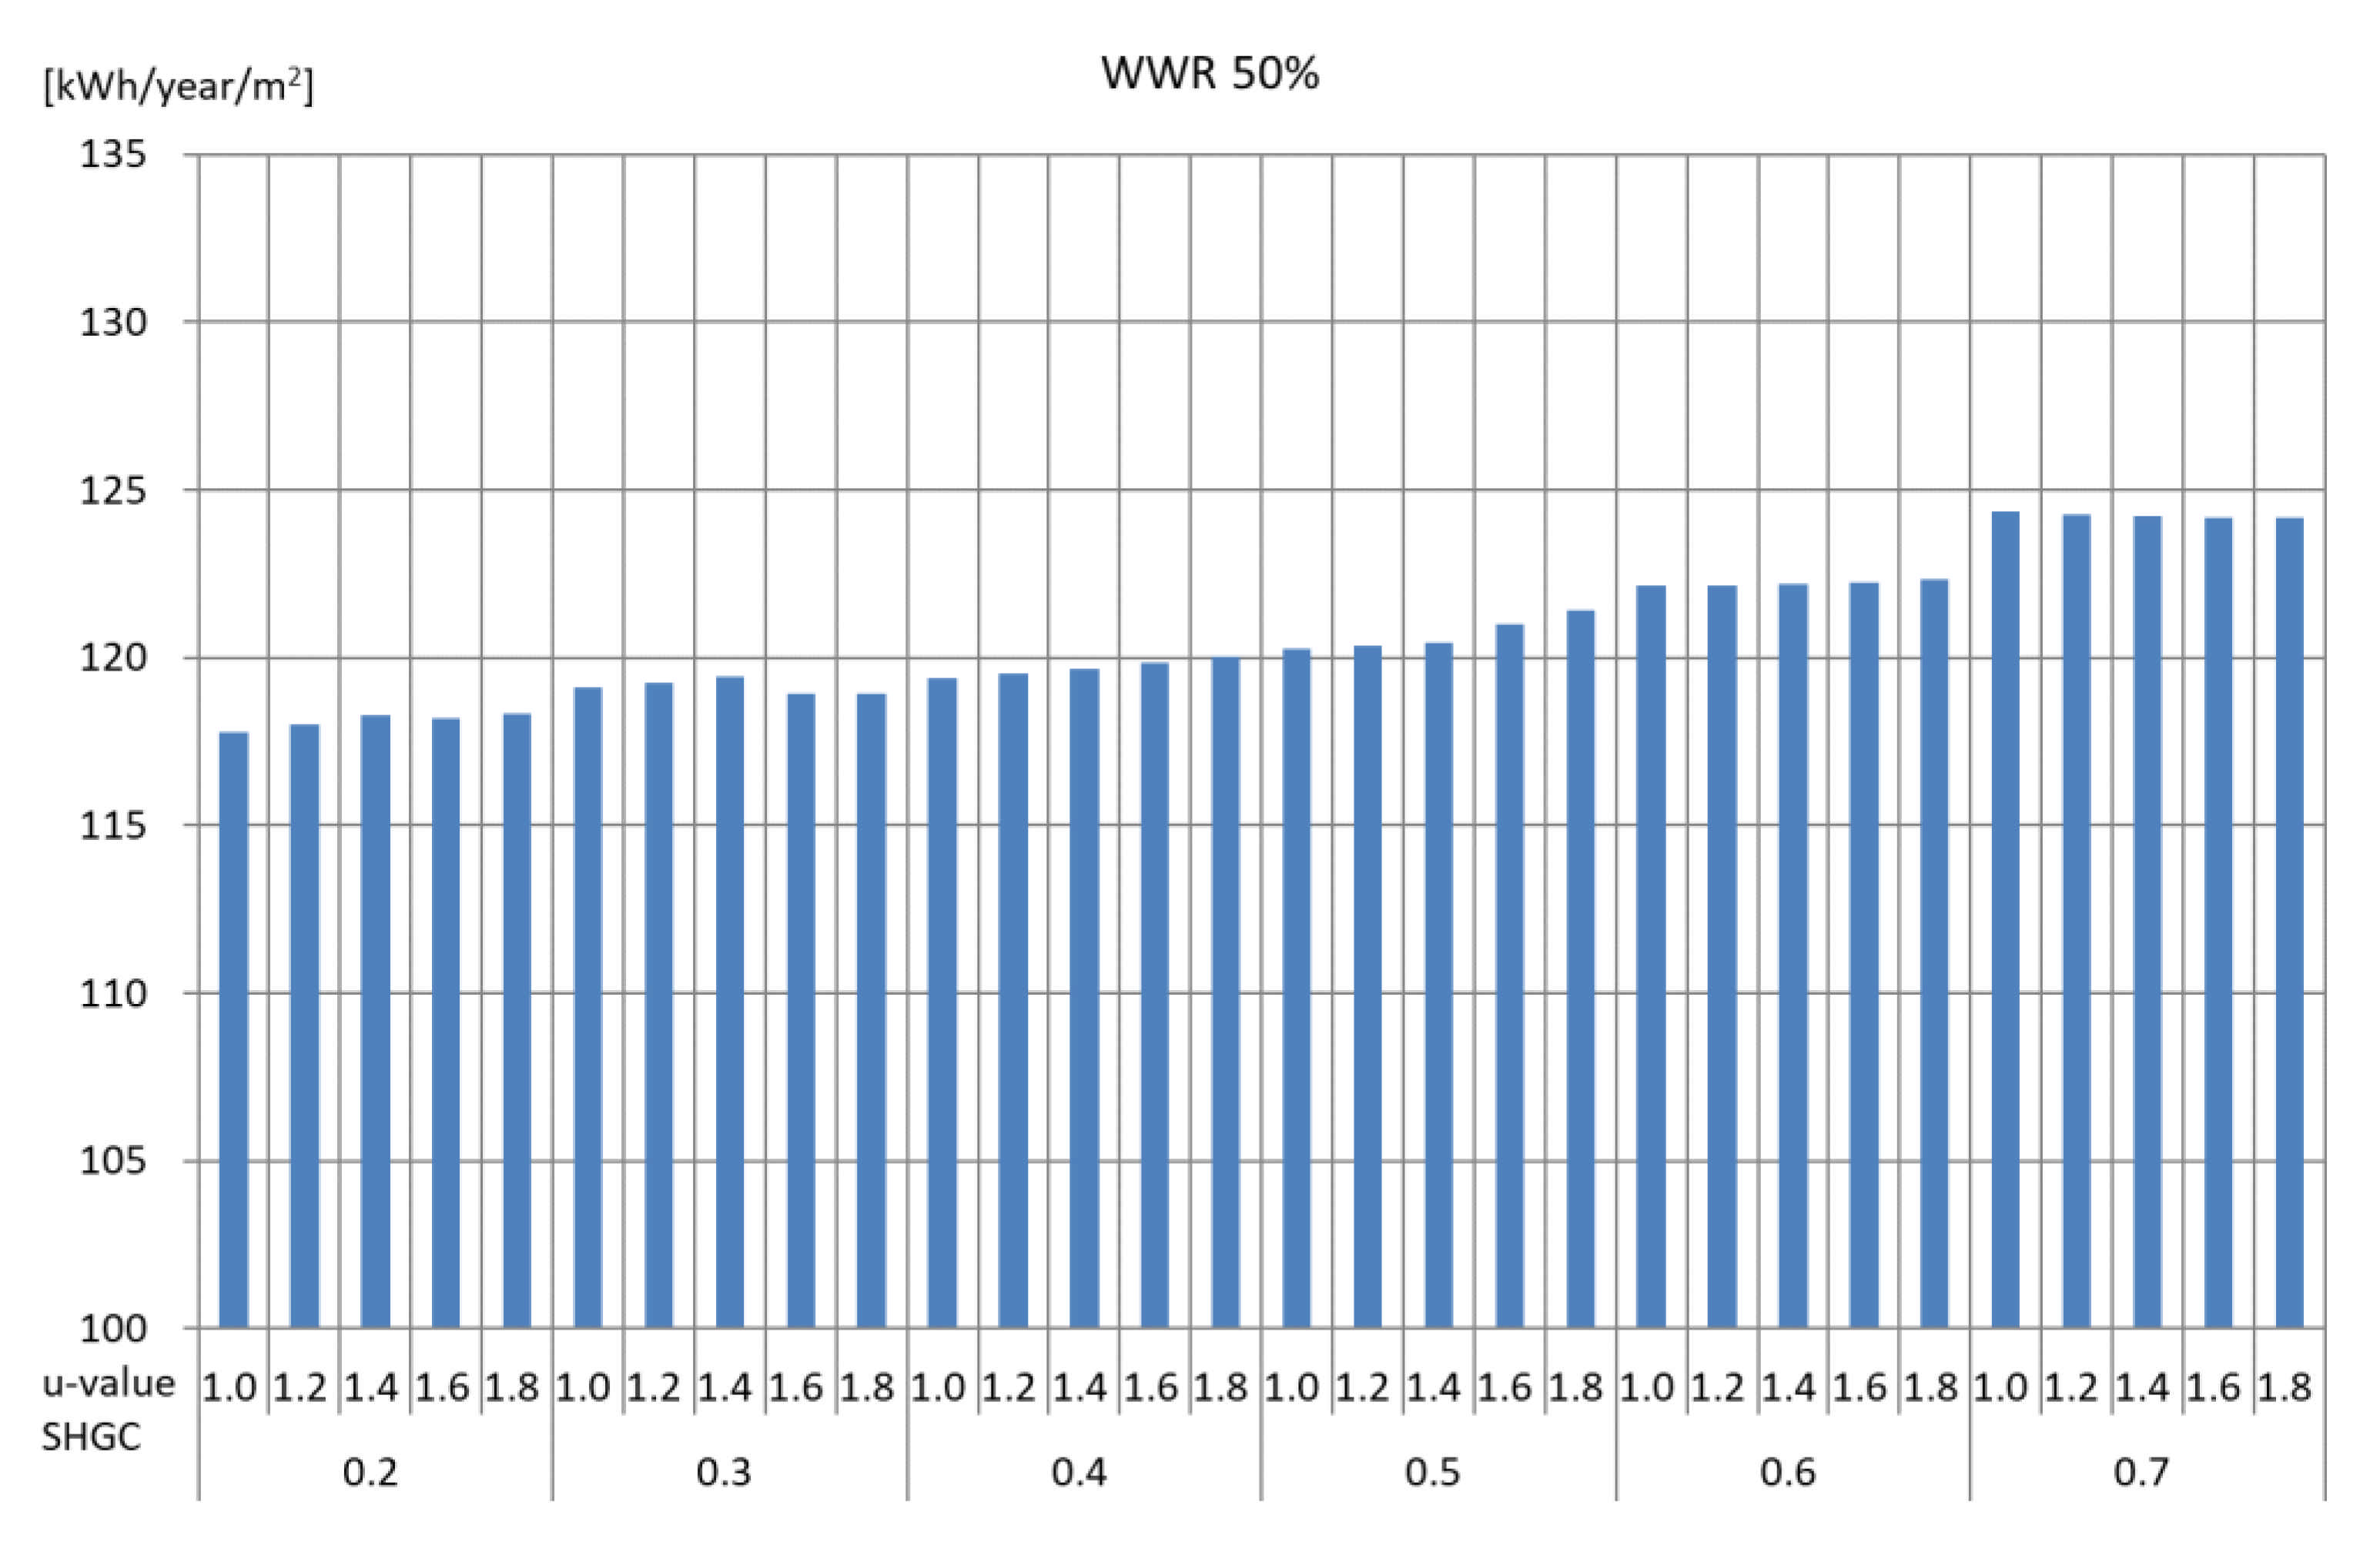
4.2. Correlation between Window Performance and Buliding Energy Use

The correlation between window performance and building energy use was analyzed, which had the biggest impact on energy performance of an office building with curtain wall structure. The building size was assumed to be 50 m × 50 m, and visible light transmission was fixed to be 0.7. In addition, among the values of window performance, U-value was in a range of 1.0 W/m2K~1.8 W/m2, and SHGC was in a range of 0.2~0.7. Analysis was performed with WWR at 20%, 50%, and 100%, and the results are presented in Table 6.
Firstly, in the case of 20%WWR, sensitivity (maximum value–minimum value) to energy performance with respect to changes in SHGC and U-value was confirmed to be very low per unit area with 130 kWh/year/m2 for the entire results from the analysis. As shown in Table 1, the impact of the window on building energy was relatively low with a very low WFR of 0.04.
Next, in the case of 50% WWR, sensitivity to energy performance was 6.5 kWh/m2 and was approximately 3.2 times the value compared to 20% WWR. In this case, WFR was 0.11, and this was attributed to be in a range where the window started to impact the energy performance.
Finally, in the case of 100% WWR, sensitivity to energy performance was 16.0 kWh/m2, which was approximately eight times the value compared to 20% WWR and approximately 2.45 times the value compared to 50% WWR. In this case, WFR was relatively low as well at 0.22, but it was in a range where the window started to significantly impact the energy performance.
Figure 5, Figure 6 and Figure 7 illustrate energy demand per window-to-wall area with respect to U-value and SHGC in the same scale, and Figure 8 summarizes all of them.
In the case of 20% WWR, the entire range of SHGC and U-value did not have large impact, and starting in the case of 50% WWR, energy demand increased with higher SHGC, but above 0.6, energy demand decreased with higher U-value.
In general, there was a trend of decreasing energy demand with lower SHGC and U-value, but in the case of large WWR, there was a trend of increasing energy demand with lower U-value at above 0.6 SHGC.
From these results, it can be seen that the correlation between WWR and energy demand was not proportional, and it showed similar characteristics to the previously analyzed results. Further, in cases of high WWR, it was shown that, if SHGC was maintained below 0.4, superior or similar energy demand to the case of low WWR could be maintained.
Figure 8 summarizes energy demand according to various U-values for fixed SHGC values. Figure 9 summarizes energy demand for various SHGC values for fixed U-values. As shown in Figure 9, it can be seen that energy demand proportionally increased with SHGC regardless of WWR, and the rate of increase was higher for larger WWR.
In particular, energy demand was displayed to be lower with larger WWR at SHGC below 0.3, implying that it is advantageous to design office buildings with lower SHGC instead of U-value.
Finally, Figure 10 illustrates the distribution of energy demand with respect to WFR. As shown in Figure 3 earlier, when WFR was below 0.1, they were inversely proportional, but when it was above 0.1, it was seen that the combination of impacts from SHGC and U-value appeared to be complex. Further, it was noticed that, as WFR increased, building energy sensitivity from the window’s SHGC and U-value showed a large difference. However, it can be seen that the energy performance prediction using WFR was more reasonable than the conventional method using WWR, which confirmed that energy sensitivity analysis must be performed additionally for various materials properties of the window.

5. Conclusions

This paper analyzed the limitations of the existing WWR that was used as an energy performance index and proposed WFR as a new alternative. The possibility of using this as an index and a correlation with respect to materials properties of window was considered. The summary of the results from analyses is as follows.
(1) As window-to-wall area increased, the building’s energy demand also increased proportionally, however, it was noticed that the distribution pattern was inconsistent depending on the building size. In particular, for buildings with sizes larger than 3600 m2, it was impossible to determine energy demand of the building by WWR (see Figure 2).
(2) By examining the impact from WFR, energy demands per unit area of the building almost matched together at similar ratios, and as this ratio increased, energy demand for the building was shown to proportionally increase (See Table 5, Figure 4). At WFR approximately below 0.1, energy demand was shown to increase with lower WFR, implying that it may be appropriate to maintain above a certain ratio (see Figure 3).
(3) In the case of a mid-sized building, energy sensitivity analyses with U-value and SHGC showed minimal impact for 20% WWR (see Figure 5).
(4) In the case of a mid-sized building with large WWR, it was shown that maintaining SHGC below 0.4 secured excellent energy performance (see Figure 8 and Figure 9).
(5) In the case of a mid-sized building, the impact of different material properties of the window appeared to be large, as WWR increased from the energy sensitivity analysis with respect to WFR (see Figure 10).
(6) It was shown that the energy performance index by WFR proposed in this paper was more reasonable than the conventional energy performance index using WWR (see Figure 4 and Figure 10).
In the future, in-depth research on WFR by analyzing building energy sensitivity with respect to various materials properties of window and wall performance will be studied.

Author Contributions

Conceptualization, W.-K.C.; methodology, W.-K.C. and G.-S.C.; software, S.-B.K.; validation, W.-K.C. and J.-H.K.; formal analysis, W.-K.C.; investigation, S.-K.S. and G.-S.C.; resources, W.-K.C. data curation, S.-B.K. and Y.-T.K.; writing—original draft preparation, W.-K.C.; writing—review and editing, J.-H.K.; visualization, J.-H.K.; supervision, Y.-T.K.; project administration, S.-K.S.; funding acquisition, W.-K.C. All authors have read and agreed to the published version of the manuscript.

Funding

This research was funded by the Korea Institute of Energy Technology Evaluation and Planning (KETEP) and the Ministry of Trade, Industry & Energy (MOTIE) of the Republic of Korea (No. 20183010014370), and Basic Science Research Program through the National Research Foundation of Korea (NRF) funded by the Ministry of Education (NRF-2018R1D1A1A09083870).

Institutional Review Board Statement

Not applicable.

Informed Consent Statement

Not applicable.

Conflicts of Interest

The authors declare no conflict of interest.

References

  1. Tracking Buildings 2020, International Energy Agency, Paris. Available online: https://www.iea.org/reports/tracking-buildings-2020 (accessed on 31 January 2021).
  2. Kazmierczak, K. Review of Curtain Walls, focusing on Design Problems and Solutions. In Proceedings of the International conference on Building Enclosure Science & Technology, Portland, OR, USA, 12–14 May 2010. [Google Scholar]
  3. Yoon, Y.S.; Mun, S.H.; Yoon, J.H.; Hyun, J.H.; Choi, M.H.; Hwang, W.J.; Shin, J.G.; Choi, W.K. A Study of Correlation between Window to Floor Ration and Building Energy in Buildings. J. Archit. Inst. Korea 2012, 27, 243–250. [Google Scholar]
  4. Yoon, J.H.; Hong, W.H.; Hwang, W.J.; Choi, W.K. A Study of Correlation Between Performance and Building Energy -Focused on the U-value, SHGC and VLT in a Curtain Wall building. J. Archit. Inst. Korea 2011, 27, 341–348. [Google Scholar]
  5. John, C.; Stephen, S.; Eleanor, S.L.; Dariush, A.; Todd, W. Window Systems for High-Performance Buildings; W.W. Norton & Company, Inc.: New York, NY, USA, 2004. [Google Scholar]
  6. Jung, J.H.; Choi, S.H.; Min, J.K. The Analysis on Annual Energy Performance according to Characteristics of Curtain-wall Glasses in Office Building. In Proceedings of the Korean Society of Ecological and Environmental Architecture Conference, Seoul, Korea, 26 May 2010. [Google Scholar]
  7. Jeong, Y.S.; Jung, H.K.; Jang, H.K.; Yu, K.H. A study on the reference building based on the building design trends for non-residential building. J. Korean Sol. Energy Soc. 2014, 34, 1–11. [Google Scholar] [CrossRef]
  8. EnergyPlus Documentation–Getting Started; U.S. Department of Energy, 2010.
  9. Lim, T.S.; Kim, B.S. Improvement of Indoor Thermal Environment through Solar Heat Gain Loads Reduction for an Office Building. Archit. Inst. Korea 2010, 10, 313–320. [Google Scholar]
  10. Goia, F. Search for the Optimal window-to-wall ratio in Office Buildings in different European Climates and the Implications on Total Energy Saving Potential. Solar Energy 2016, 132, 467–492. [Google Scholar] [CrossRef]
  11. Chi, F.; Wang, Y.; Wang, R.; Li, G.; Peng, C. An Investigation of Optimal window-to-wall Ratio based on changes in Building Orientations for Traditional Dwellings. Solar Energy 2020, 195, 64–81. [Google Scholar] [CrossRef]
  12. Wen, L.; Hiyama, K.; Koganei, M. A Method for creating Maps of recommended window-to-wall ratios to assign appropriate default Values in Design Performance Modeling: A Case Study of a typical Office Building in Japan. Energy Build. 2017, 145, 304–317. [Google Scholar] [CrossRef]
  13. Xue, P.; Li, Q.; Zhao, M.; Liu, J. Optimization of window-to-wall ratio with Sunshades in China low Latitude Region considering Daylighting and Energy Saving Requirements. Appl. Energy 2019, 233–234, 62–70. [Google Scholar] [CrossRef]
  14. Phillips, R.; Troup, L.; Fannon, D.; Eckelman, M.J. Triple bottom Line Sustainability Assessment of window-to-wall ratio in US Office Buildings. Build. Environ. 2020, 182, 1–13. [Google Scholar] [CrossRef]
  15. Troup, L.; Phillips, R.; Eckelman, M.J.; Fannon, D. Effect of window-to-wall ratio on measured Enrgy Consumption in US office Buildings. Energy Build. 2019, 203, 1–10. [Google Scholar] [CrossRef]
  16. Badeche, M.; Bouchahm, Y. Design optimization Criteria for Windows providing Low Energy Demand in Office Buildings in Algeria. Environ. Sustain. Indic. 2020, 6, 1–10. [Google Scholar] [CrossRef]
  17. Marino, C.; Nucara, A.; Pietrafesa, M. Does Window-to-wall Ratio have a Significant Effect on the Energy Consumption of Buildings? A Parametric Analysis in Italian Climate Conditions. J. Build. Eng. 2017, 13, 169–183. [Google Scholar] [CrossRef]
  18. Didwania, S.K.; Garg, V.; Mathur, J. Optimization of Window-Wall Ratio for Different Building Types; ResearchGate: Berlin, Germany, 2011; pp. 1–11. [Google Scholar]
  19. Shen, H.; Tzempelikos, A. Sensitivity analysis on daylighting and energy performance of perimeter offices with automated shading. Build. Environ. 2013, 59, 303–314. [Google Scholar] [CrossRef]
  20. Basack, S.; Sarkar, A. Evaluation of Correction Factor in Quasi-steady State Method for Assessment of Operational Cooling Impact of Orientation on Window, Wall and Floor Area. J. Chart. Assoc. Build. Eng. 2018, 9, 26–30. [Google Scholar]
  21. Yoon, Y.S.; Choi, W.K.; Sim, M.H. A study on the characteristics of the energy performance in curtain wall building. J. Archit. Inst. Korea 2013, 29, 255–263. [Google Scholar]
Figure 1. Unit plan and modeling image of simulation.
Energies 14 02064 g001
Figure 2. Energy demand per area according to the WWR by building size.
Energies 14 02064 g002
Figure 3. Energy demands per area according to the WFR.
Energies 14 02064 g003
Figure 4. Energy demands per area when WFR ≥ 0.1.
Energies 14 02064 g004
Figure 5. Energy demands/area when WWR = 20%.
Energies 14 02064 g005
Figure 6. Energy demands/area when WWR = 50%.
Energies 14 02064 g006
Figure 7. Energy demands/area when WWR = 100%
Energies 14 02064 g007
Figure 8. Energy demands/area according to the WWR and window properties 1.
Energies 14 02064 g008
Figure 9. Energy demands per area according to the WWR and window properties 2.
Energies 14 02064 g009
Figure 10. Energy demands per area according to the WFR and window properties.
Energies 14 02064 g010
Table 1. Window-to-wall ratio (WWR) and window-to-floor ratio (WFR) in building of floor height 4.2 m and ceiling height 2.8 m.
WWR
(%)
Building Size (m2)10*1015*1520*2025*2530*3035*3540*4045*4550*5060*6075*75100*100
Floor Area (m2)10022540062590012251600202525003600562510000
100Window Area (m2)112.0168.0224.0280.0336.0392.0448.0504.0560.0672.0840.01120.0
WFR1.120.750.560.450.370.320.280.250.220.190.150.11
90Window Area (m2)100.8151.2201.6252.0302.4352.8403.2453.6504.0604.8756.01008.0
WFR1.010.670.500.400.340.290.250.220.200.170.130.10
80Window Area (m2)89.6134.4179.2224.0268.8313.6358.4403.2448.0537.6672.0896.0
WFR0.900.600.450.360.300.260.220.200.180.150.120.09
70Window Area (m2)78.4117.6156.8196.0235.2274.4313.6352.8392.0470.4588.0784.0
WFR0.780.520.390.310.260.220.200.170.160.130.100.08
60Window Area (m2)67.2100.8134.4168.0201.6235.2268.8302.4336.0403.2504.0672.0
WFR0.670.450.340.270.220.190.170.150.130.110.090.07
50Window Area (m2)56.084.0112.0140.0168.0196.0224.0252.0280.0336.0420.0560.0
WFR0.560.370.280.220.190.160.140.120.110.090.070.06
40Window Area (m2)44.867.289.6112.0134.4156.8179.2201.6224.0268.8336.0448.0
WFR0.450.300.220.180.150.130.110.100.090.070.060.04
30Window Area (m2)33.650.467.284.0100.8117.6134.4151.2168.0201.6252.0336.0
WFR0.340.220.170.130.110.100.080.070.070.060.040.03
20Window Area (m2)22.433.644.856.067.278.489.6100.8112.0134.4168.0224.0
WFR0.220.150.110.090.070.060.060.050.040.040.030.02
Table 2. Components and thermo-physical properties of materials [21].
Description
(U-Value, W/m2K)
MaterialConductivity
(W/m K)
Specific Heat
(J/kg K)
Density
(kg/m3)
Internal Wall
(1.600)
Mortar0.8808962800
lightweight Concrete0.38010001200
Mortar0.8808962800
Slab (3.535)Concrete1.40010002100
Spandrel
(0.356)
Glass1.0008372400
Air0.02410051.293
Aluminum1608802800
Glass wool0.036100024
Aluminum1608802800
Table 3. Simulation setting conditions.
Setting temperatureHeating: 20 °C
Cooling: 26 °C
Operating scheduleWeekday: 08:00~18:00
Weekend: Off
Occupancy0.11 people/m2
Met.126 W/person
Internal gainsOffice15 W/m2
Core2 W/m2
Target luxOffice400 lux
Core100 lux
Lighting3.4 W/m2 100 lux
(dimming control)
Infiltration0.3 ACH
HVACIdeal load air system
Weather dataSeoul TMY2
Table 4. Weather data factors and monthly averages.
MonthDry Bulb Temp.
(°C)
Dew Point Temp.
(°C)
Relative Humidity
(%)
Global Radiation (kWh/m2)Wind Speed
(m/s)
Jan−1.29−7.8460.4037.202.35
Feb.0.98−7.2454.3844.142.55
Mar.6.87−1.7655.4260.832.77
Apr.13.042.8453.4974.672.72
May18.2710.2362.3681.972.46
Jun.22.8215.6766.0985.902.07
Jul.25.2920.3074.3367.502.19
Aug.24.8419.9774.3165.911.56
Sep.20.9214.8069.3252.411.83
Oct.15.487.7461.3149.691.78
Nov.6.20−0.6862.6133.852.14
Dec.0.99−5.6559.8139.542.25
Table 5. Energy demands according to the building size.
(a) Total energy demands according to the building size (kWh)
WWR10*1015*1520*2025*2530*3035*3540*4045*4550*5060*6075*75100*100
20%12,117.927,220.948,388.976,206.5111,148.5153,314.7203,061.3259,402.8323,319.2473,272.8752,832.11366,458.1
30%12,906.928,333.349,367.476,449.0110,022.0150,260.0198,014.1252,380.6314,163.7459,343.7730,549.91328,527.3
40%13,767.529,678.350,941.678,067.2111,332.5150,717.6197,222.0249,932.6310,030.2451,372.3716,479.11,301,919.2
50%14,655.031,102.852,719.580,073.8113,391.2152,620.4198,662.0250,459.7309,291.7447,706.4707,163.01282,725.8
60%15,565.232,540.254,582.882,256.5115,795.2155,027.2201,023.8252,585.7310,865.3447,146.5702,364.81268,574.7
70%16,470.133,969.356,462.384,534.4118,366.8157,768.7203,786.9255,386.5313,517.1448,681.4700,566.41258,687.2
80%17,351.035,397.458,328.286,795.8120,979.3160,660.1206,880.6258,600.2316,728.9451,536.9701,511.21,252,927.4
90%18,242.536,811.760,212.189,098.6123,634.9163,474.2210,103.1262,044.3320,292.1455,043.1704,071.21,250,324.3
100%19,128.338,210.362,081.091,410.9126,345.6166,442.8213,312.0265,526.3323,955.8458,827.3706,983.41,250,313.2
(b) Energy demands per area according to the building size (kWh/m2)
Floor area (m2)10022540062590012251600202525003600562510,000
20%121.2121.0121.0121.9123.5125.2126.9128.1129.3131.5133.8136.6
30%129.1125.9123.4122.3122.2122.7123.8124.6125.7127.6129.9132.9
40%137.7131.9127.4124.9123.7123.0123.3123.4124.0125.4127.4130.2
50%146.6138.2131.8128.1126.0124.6124.2123.7123.7124.4125.7128.3
60%155.7144.6136.5131.6128.7126.6125.6124.7124.3124.2124.9126.9
70%164.7151.0141.2135.3131.5128.8127.4126.1125.4124.6124.5125.9
80%173.5157.3145.8138.9134.4131.2129.3127.7126.7125.4124.7125.3
90%182.4163.6150.5142.6137.4133.4131.3129.4128.1126.4125.2125.0
100%191.3169.8155.2146.3140.4135.9133.3131.1129.6127.5125.7125.0
Table 6. Energy demands according to the window properties (visible light transmittance: 0.7).
SHGCU-ValueWWR 20%WWR 50%WWR 100%
(-)(W/m2K)(kWh/Year)(kWh/Year/m2)(kWh/Year)(kWh/Year/m2)(kWh/Year)(kWh/Year/m2)
0.21.0321,183.0128.5294,451.5117.8288,763.0115.5
1.2321,345.1128.5295,046.8118.0290,083.4116.0
1.4321,491.2128.6295,700.5118.3291,567.4116.6
1.6320,561.1128.2295,520.8118.2292,754.8117.1
1.8320,129.3128.1295,760.1118.3294,225.9117.7
0.31.0322,456.2129.0297,715.8119.1295,325.9118.1
1.2322,600.5129.0298,144.1119.3296,046.7118.4
1.4322,731.5129.1298,619.5119.4296,981.1118.8
1.6321,510.8128.6297,320.5118.9295,736.0118.3
1.8321,046.6128.4297,326.8118.9296,470.5118.6
0.41.0321747.5128.7298,458.7119.4298,704.7119.5
1.2321,863.8128.7298,749.1119.5299,075.9119.6
1.4321,990.2128.8299,145.7119.7299,630.3119.9
1.6322,100.9128.8299,563.3119.8300,416.8120.2
1.8322,217.3128.9300,053.1120.0301,369.9120.5
0.51.0321,561.9128.6300,641.4120.3305,424.7122.2
1.2321,671.1128.7300,838.7120.3305,206.6122.1
1.4321,777.0128.7301,077.5120.4305,278.9122.1
1.6322,264.3128.9302,430.7121.0306,689.6122.7
1.8322,678.6129.1303,567.2121.4308,169.3123.3
0.61.0323,154.9129.3305,307.7122.1315,962.8126.4
1.2323,242.0129.3305,330.3122.1315,122.3126.0
1.4323,337.1129.3305,435.4122.2314,573.0125.8
1.6323,430.2129.4305,546.5122.2314,327.7125.7
1.8323,537.0129.4305,771.5122.3314,304.7125.7
0.71.0324,964.0130.0310,849.6124.3328,848.1131.5
1.2325,031.0130.0310,614.6124.2327,115.9130.8
1.4325,086.7130.0310,481.8124.2325,785.7130.3
1.6325,160.2130.1310,455.5124.2324,875.4130.0
1.8325,241.7130.1310,473.4124.2324,268.9129.7
SHGC: solar heat gain coefficient.
Publisher’s Note: MDPI stays neutral with regard to jurisdictional claims in published maps and institutional affiliations.

