Article

Hot Box Investigations of a Ventilated Bioclimatic Wall for NZEB Building Façade

INSA Strasbourg ICUBE, University of Strasbourg, 67000 Strasbourg, France
*
Author to whom correspondence should be addressed.
Energies 2021, 14(5), 1327; https://doi.org/10.3390/en14051327
Submission received: 1 February 2021 / Revised: 21 February 2021 / Accepted: 23 February 2021 / Published: 1 March 2021

Abstract

:
The building sector is the largest consumer of energy, but there are still major scientific challenges in this field. The façade, being the interface between the exterior and interior space, plays a key role in the energy efficiency of a building. In this context, this paper focuses on a ventilated bioclimatic wall for nearly zero-energy buildings (NZEB). The aim of this study is to investigate an experimental setup based on a hot box for the characterization of the thermal performances of the ventilated wall. A specific ventilated prototype and an original thermal metrology are developed. This paper presents the ventilated prototype, the experimental setup, and the experimental results on the thermal performances of the ventilated wall. The influence of the air space thickness and the air flow rate on the thermal performances of the ventilated wall is studied.

1. Introduction

The building sector is the industry mainly responsible for energy consumption in Europe [1]. Reducing the energy consumption and the emission of gases from buildings has become a recent priority in Europe. In this context, France is placing the construction sector at the center of its strategy to meet this challenge [2]. Nowadays, buildings must ensure low energy consumption and comfortable environment quality. However, the building envelope has one of the largest impacts on building energy consumption. These aspects generate innovative façade design [3,4]. In particular, a ventilated façade can be also a response to this approach [5].
Ventilated façades are used often by architects. In addition to the aesthetic aspect, the primary purpose of this type of façade is to protect the insulation materials by dissipating moisture. A ventilated façade can also provide energy savings. Nowadays, in Europe, the construction of zero-energy buildings (ZEB) and the transformation of existing buildings into nearly zero-energy buildings (NZEB) are expected. For these reasons, a ventilated façade can be an interesting solution for both existing and new buildings.
A ventilated façade is composed of two panes separated by a ventilated cavity. One possible definition of ventilated façade is “A ventilated double facade can be defined as a traditional single façade doubled inside or outside by a second, essentially glazed facade. Each of these two facades is commonly called a skin. A ventilated cavity—having a width which can range from several centimetres at the narrowest to several metres for the widest accessible cavities—is located between these two skins” [6].
There are several different ventilated façade concepts and several classifications [5,6]. Generally, classifications are based on façade geometry, the type of ventilation of the cavity, and the airflow concept [7,8,9]. The ventilated façade can be continuous or divided into modules. The air layer forms a thermal buffer zone. The façade geometry can be box window type, shaft box type, a corridor façade, or a multi-story double skin façade. The cavity ventilation that occurs through openings in the external and internal skin can be natural, mechanical, or hybrid. Possible airflow concepts are as follows: supply air, exhaust air, static air buffer, external air curtain, and internal air curtain [10]. The presence of integrated systems (photovoltaic, solar collector) can also be classification criteria. For example, Ibanez-Puy [11] classifies ventilated façades as double skin façades, building integrated photovoltaic, solar chimneys, Trombe wall, solar wall, façade solar collectors, and opaque ventilated façades.
For several years, publications on ventilated walls increased significantly [12,13,14,15]. Despite the high number of publications on ventilated walls, the influence of the air space thickness cavity on the thermal performances of the ventilated wall was rarely studied. Table 1 provides an overview of different studies on the ventilated façade from the point of view of air space thickness.
A hot box apparatus is used to measure the thermal behavior of large specimens of building materials. Two standard methods are given in the literature: guarded hot box (GHB) and calibrated hot box (CHB) [23,24]. The guarded hot box (GHB) is composed of three cells: a hot cell, a cold cell, and a guarded chamber used to minimize lateral heat losses. A calibrated hot box (CHB) is composed only of two cells: a hot cell and a cold cell [24]. Different standard hot box experiments can be carried out: the European EN ISO 8990, the American ASTM C1363-05, and the Russian GOST 26602.1-99 [23,24]. Many publications deal with the thermal characterization of building materials using a hot box apparatus. However, few papers studied the thermal properties of air cavity wall using a hot box. Aviram [25] studied the thermal behavior of a variable ratio cavity wall using a guarded hot box and CFD analysis. Lucchi [24] introduces a hot box procedure to study the thermal performance and the air flux in a wall with an internal air cavity. More recently, a new hot box was developed to study the hydrothermal behavior of historic walls [26].
This paper describes an experimental study on the thermal performance of a ventilated bioclimatic wall. The objective of this study was to develop an experimental setup able to characterize the influence of the air space thickness and the air flow rate on the thermal performances of the ventilated wall. A specific ventilated prototype and an original thermal metrology based on a hot box was developed in this study.
The overall structure of this paper takes the form of four parts, including this introduction. The second part, Experimental Setup, presents the ventilated bioclimatic prototype, the hot box, and the instrumentation involved in the test specimen. The third part presents the experimental results for ambient temperature, surface temperature, heat transfer coefficient, and pre-heating efficiency, which allows for the evaluation of the thermal performance of the ventilated wall. Finally, a conclusion gives a summary of the findings.

2. Experimental Setup

2.1. Bioclimatic Ventilated Wall and Hot Box

The ventilated wall prototype is presented in Figure 1. This prototype consists of two walls and a ventilated air chamber (a cavity between the two walls). The first wall is fixed, while the second one is mobile, allowing the thickness of the ventilated cavity to be varied. These two walls are made of an aluminum alloy and polyethylene. The dimensions are 1 m high, 1 m wide, and 3 mm thick. Based on the manufacturer’s data, the aluminum composite has a thermal resistance of 0.008 m2·K·W−1 and has low roughness, with the surfaces being smooth. The ventilated air chamber is a non-hermetically sealed cavity that participates in the supply of fresh air to the building. A convective exchange takes place in the cavity along the axis of the wall, which disturbs the radial heat flow between the interior and exterior environments (Figure 1).
The experimental study was carried out in a hot box (Figure 2). This hot box is a device composed of two climatic chambers whose ambiances are controlled. The first climatic chamber reproduced indoor conditions, and the second reproduced outdoor conditions (Figure 2). The hot box is characterized by a range of temperature from −30 °C to +60 °C and a range of humidity from 10% to 98%. Each climatic chamber has its own refrigeration unit that allows for the production of cold with a temperature accuracy of ±2 °C. Each climatic chamber also has 3 electric resistors of 2.5 kW that allow for the production of heat with a temperature accuracy of ±3 °C. The hot box was connected to a computer to control the temperature and humidity of each climatic chamber. These two climatic chambers were separated by a sample holder (size of 1 × 1 × 0.4 m). One of the two chambers was mounted on slides, allowing access to the sample holder as well as to the inside of the two climatic chambers. The ventilated bioclimatic prototype was fixed in the specimen holder. A ventilation system was used to impose air flow in the cavity. Moving the mobile wall can vary the air space thickness.
Experiments were carried out for different configurations to provide variable air space thickness and variable air flow rate. The air space thickness varied from 5 mm to 85 mm. The air flow rate varied from 10 to 30 m3·h−1. Fifty experiments were carried out. An overview of the fifty experiments is given in Table 2.

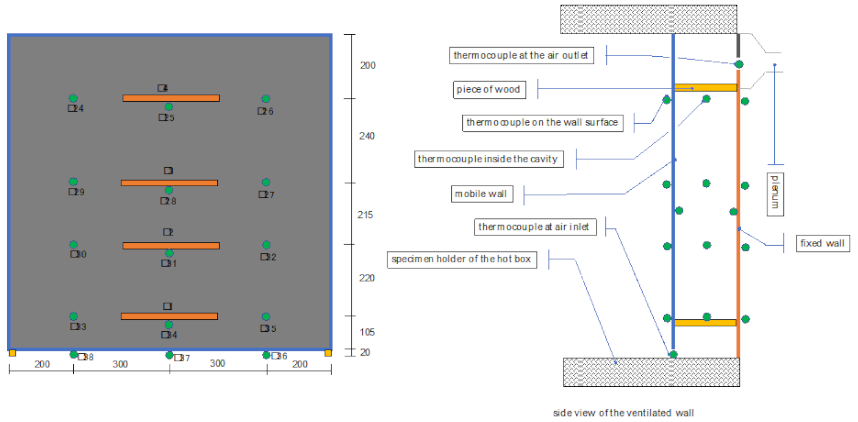
2.2. Thermal Metrology

The instrumentation was composed of K-type thermocouples and PT-100 probes. The hot box ambient temperature was measured in the hot cell and the cold cell with K-type thermocouples and PT-100 sensors (hot box sensors). The hot box instrumentation is presented in Figure 3. The ventilated prototype consisted of two walls and an air cavity. The first wall was fixed while the second one was mobile, allowing the thickness of the ventilated cavity to be varied. The wall surface temperature was measured by 24 K-type thermocouples (12 thermocouples on the fixed wall and 12 thermocouples on the mobile wall). The position of the thermocouples is given in Figure 4, Figure 5 and Figure 6. Thermocouple measurements were compared to those obtained using an infrared camera (FLIR T650 SC). The infrared camera was installed in the front of the wall. The area covered by the infrared camera had a surface area of 10 cm2. The thermal flux was measured with 8 Captec flux meters (4 flux meters on the fixed wall and 4 flux meters on the mobile wall), allowing for the estimation of heat flux on both sides of the ventilated cavity (Figure 4). The air cavity temperature was measured by 10 K-type thermocouples (4 thermocouples in the cavity, 3 thermocouples at the entrance of the cavity, and 3 thermocouples at the exit of the cavity). To control the airflow velocity inside the air cavity, a convergent plenum was installed (Figure 4). A fan was used to vary the airflow velocity inside the cavity. A CTV 210 hot wire anemometer from the manufacturer KIMO measured the airflow rate. All the sensors were connected to a Keithley 2700 data acquisition system. Data acquisition and processing were then carried out via the LabVIEW software (Figure 7).
The characteristics of the sensors used are given in Table 3.

3. Experimental Results

Specific experiments were undertaken to test the hot box and the ventilated wall prototype (Figure 8). Experiments were carried out in steady state under the following conditions:
-
Hot cell: ambient temperature conditions of 20 °C and relative humidity (55%);
-
Cold cell: temperature conditions of 0 °C and relative humidity (75%);
-
Variable airflow rate: 10, 20, and 30 m3·h−1;
-
Variable air space thickness: from 5 to 85 mm.
These specific experiments were carried out to investigate the ventilated wall prototype in terms of its capability to pre-heat the air in the cavity. Our experiments are distinguished from standard hot box methods used for the estimation of the thermal resistance of a wall in steady-state regime by using a calibrated hot box or guarded hot box such as EN ISO 8990.

3.1. Ambient Temperature

The ambient temperature was measured in both the hot cell and cold cell with K-type thermocouples and PT-100 sensors (hot box sensors). The temperature difference between the hot cell and the cold cell was 20 °C. This temperature difference allowed us to obtain a heat flux that could be measured correctly by the flux meters [27].
Under the specified conditions (20 °C in the hot cell and 0 °C in the cold cell), a significant difference (2.6 °C for the cold cell and 4.3 °C for the hot cell) was observed between the ambient temperature measured with the hot box sensor and the ambient temperature measured by our thermocouples. This difference can be explained by the fact that the cells are not watertight, since an artificial air flow was created between them. However, for standard use of the hot box, there should not be any air exchange between the cells; the regulation system of the device was thus disturbed.
Figure 9 presents the air temperature in the cold cell and the hot cell. The temperature was measured by six K-type thermocouples (three thermocouples (T42, T43, and T44) in the cold cell and three thermocouples (T39, T40, and T41) in the hot cell). It can be seen in Figure 9 that the air temperature inside the hot box was homogenous in both the cold cell and the hot cell. The mean air temperature was −4.6 ± 0.05 °C for the cold cell and 15.7 ± 0.18 °C for the hot cell.

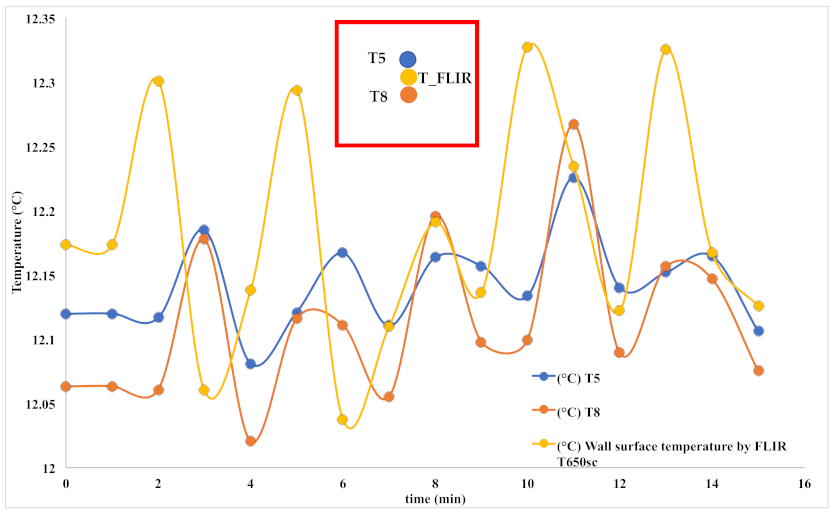
3.2. Surface Temperatures

Measurement of surface temperatures was performed by thermocouples. Thermocouple measurements (T8 and T5 thermocouple measurements) were compared to data obtained using an FLIR 650 TS infrared camera (Figure 10). The area covered by the infrared camera had a surface area of 10 cm2. The T8 and T5 thermocouples were located on the upper and lower part of this surface. The mean value measured by thermocouples T5 and T8 and the infrared camera were 12.14 °C, 12.11 °C, and 12.18 °C, respectively. The measurements of the surface temperature performed by the thermocouples are in accordance with the measurements made by the infrared camera and confirm the reliability of the instrumentation of the walls (Figure 11).

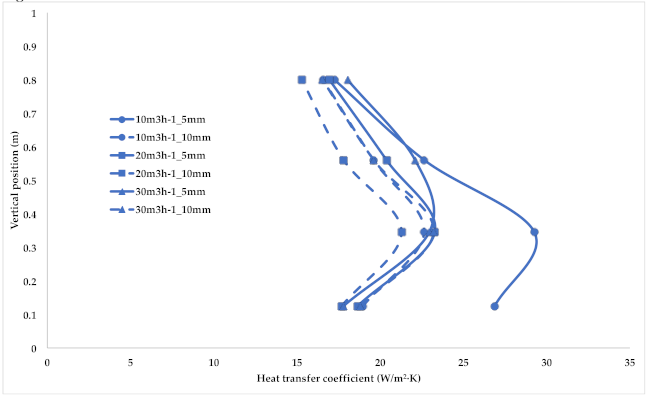
3.3. The Convection Heat Transfer Coefficient

The convection heat transfer coefficient was estimated from Newton’s law, involving the heat flux, the ambient temperature, and the wall temperature:
h = q/(Ts − Ta)
The heat flux, the ambient temperature, and the wall temperature were measured using thermal metrology describes before. We used two cavity thicknesses (0.005 and 0.01 m) and three airflow rates (10, 20, and 30 m3·h−1). Each sample wall was equipped with four flux meters and four thermocouples at different heights, making it possible to obtain four local estimates of the h-factor per cell. For the ambient temperature in each of the cells, a single air temperature was considered, corresponding to the average of the measurements of the three thermocouples installed in each cell. Figure 12 and Figure 13 show the local convection heat transfer coefficient h in the cold cell and in the hot cell. The values of the heat transfer coefficient varied between 15 and 25 W.m−2·K−1. The mean value of the heat transfer coefficient was 19.9 ± 1.3 W.m−2·K−1 for the cold cell and 18.7 ± 2.3 W.m−2·K−1 for the hot cell. This order of magnitude is consistent with the correlations that can be found in the literature [28].
From Figure 12 and Figure 13, we also noted that the thickness of the cavity and the airflow rate had no significant influence on the convection heat transfer coefficient value. This means that these two parameters had no influence on the ambiances of the two climate cells. On the other hand, the coefficient h depends on the position from which it was calculated, and it can be seen that for a given height, the estimates of the coefficient h are relatively homogeneous. It can be thought that, in each of the cells, the air movements caused by the regulation system were not uniform near the walls of the sample, causing local variations in the coefficient h. As depicted in Figure 12, two values are apart for 10 m3/h_5 mm. This can be explained by a bad contact between the flux meters and the sample during this test.
Figure 14 and Figure 15 show the global heat transfer coefficient in both the hot cell and the cold cell. The global heat transfer coefficient was estimated from temperature measurements (thermocouples) and heat fluxes (flux meters measurements). As we can see in Figure 14 and Figure 15, there are small differences between the measurements, which can be explained by the uncertainties of the convection heat transfer coefficient.
Finally, the uncertainties for the local convection heat transfer coefficient h were estimated (Table 4). An uncertainty of 5% for the flux meters and an uncertainty of 0.02 °C for the thermocouples were considered. As can be observed from Table 4, the uncertainties are smaller in the hot cell, as the fluxes and temperature differences involved are larger. It is in the cold cell, at the lower part of the wall, that the uncertainties are the greatest; at this point, the temperatures between the wall and the environment of the cold cell are very close, often of the order of one-tenth of a degree.

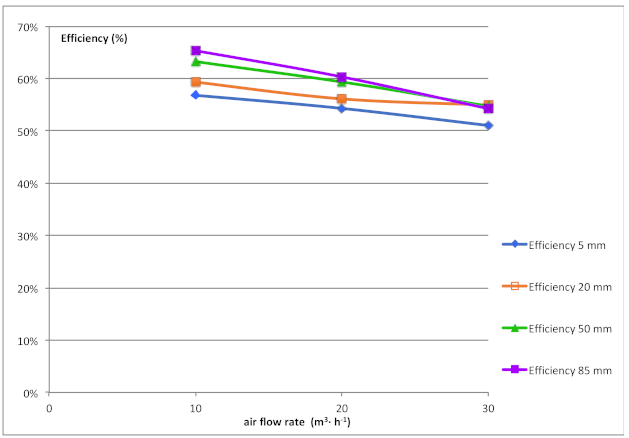
3.4. Thermal Performance of the Ventilated Wall

The objective of this study was to characterize the influence of the air space thickness and the air flow rate on the thermal performances of the ventilated wall. The thermal performance of the ventilated wall was evaluated through the pre-heating efficiency according to Equation (2) “which represent the potentiality of the ventilatd wall in terms of its capability to pre-heat the air in the cavity” [29].
E = (Tinlet − Tout)/(Tin − Tout)
where
-
Tinlet: the supply air temperature measured in the top of the air cavity;
-
Tout: the outside air temperature (cold cell);
-
Tin: the inside air temperature (hot cell).
Figure 16 shows the pre-heating efficiency of the ventilated wall. Experiments were carried out for different air space thicknesses (5, 20, 50, and 85 mm) and different air flow rates (10, 20, and 30 m3·h−1). It can be seen that the pre-heating efficiency of the ventilated wall increased with the air space thickness. For an air flow of 10 m3·h−1, the pre-heating efficiency of the ventilated wall increased from 57% (for an air space thickness of 5 mm) to 65% (for an air space thickness of 85 mm). It can be also seen that the pre-heating efficiency of the ventilated wall decreased with the air flow rate. For an air space thickness of 85 mm, the pre-heating efficiency of the ventilated wall decreased from 65% (for an air flow rate 10 m3·h−1) to 54% (for an air flow rate 30 m3·h−1).

4. Conclusions

This work describes an experimental study on the thermal performance of a ventilated bioclimatic wall. A ventilated wall prototype and an original hot box thermal metrology were developed. This paper presents the ventilated wall prototype, the experimental setup, and the experimental results. The ambient temperature, the surface temperature of the ventilated prototype, and the local heat transfer coefficients of the ventilated wall were measured. In addition, an uncertainty analysis on the local heat transfer coefficient is presented. Experimental results show that vertical position had a significant influence on the local heat transfer coefficient value. Finally, the influence of the air space thickness and the air flow rate on the thermal performances of the ventilated wall was studied. The results show the pre-heating efficiency of the ventilated wall increased with the air space thickness and decreased with the air flow rate. It is suggested that the increase in air space thickness of the ventilated wall can be used to obtain an interesting ventilated façade performance.

Author Contributions

Conceptualization, D.S. and M.S.; methodology, D.S., M.S. and F.G.; investigation D.S., M.S. and F.G. writing—original draft preparation D.S., M.S. and F.G., writing—review and editing D.S., M.S. and F.G. All authors have read and agreed to the published version of the manuscript.

Funding

This research was funded by Arconic Foundation and by the Ministry of higher education of Republic of Indonesia.

Institutional Review Board Statement

Not Applicable.

Informed Consent Statement

Not Applicable.

Data Availability Statement

The data presented in this study are available on request from the corresponding author.

Acknowledgments

The authors acknowledge the financial contribution of the Arconic Foundation and the Ministry of higher education of Republic of Indonesia.

Conflicts of Interest

The authors declare no conflict of interest.

Nomenclature

Epre-heating efficiency of the ventilated wall
hconvection heat transfer coefficient, W.m−2·°C−1
HRrelative humidity inside the cell, %
Ttemperature, °C
qflux density, W·m−2

Indices

aambiance of the cell
inrelative to the inside air temperature (hot cell)
inletrelative to the supply air temperature measured in the top of the air cavity
outrelative to the outside air temperature (cold cell)
swall surface

References

  1. Bâtiments à Énergie Positive et Réduction Carbone. Available online: https://www.batiment-energiecarbone.fr (accessed on 2 September 2020).
  2. Evaluation of the Energy Performance of Building Directive 2010/31/EU. 2015. Available online: https://ec.europa.eu/smart-regulation/roadmaps/docs/2016_ener_023_evaluation_energy_performance_ofbuildings_directive_en.pdf (accessed on 1 June 2015).
  3. Pflug, T.; Nestle, N.; Kuhn, T.; Siroux, M.; Maurer, C. Modeling of facade elements with switchable U-value. Energy Build. 2018, 164, 1–13. [Google Scholar] [CrossRef]
  4. Pflug, T.; Bueno, B.; Siroux, M.; Kuhn, T. Potential analysis of a new removable insulation system. Energy Build. 2017, 154, 391–403. [Google Scholar] [CrossRef]
  5. Gregório-Atem, C.; Aparicio-Fernández, C.; Coch, H.; Vivancos, J.L. Opaque Ventilated Façade (OVF) Thermal Performance Simulation for Office Buildings in Brazil. Sustainability 2020, 12, 7635. [Google Scholar] [CrossRef]
  6. Loncour, X.; Deneyer, A.; Blasco, M.; Flamant, G.; Wouters, P. Classification & illustration of facade concepts. Contributed Report 03, Belgian Building Research Institute—BBRI. 2005. Available online: https://www.aivc.org/resource/cr-03-ventilated-double-skin-fa-ades-classification-illustration-facade-concepts (accessed on 1 June 2005).
  7. Chan, H.Y.; Riffat, S.B.; Zhu, J. Review of passive solar heating and cooling technologies. Renew. Sustain. Energy Rev. 2010, 14, 781–789. [Google Scholar] [CrossRef]
  8. Lai, C.M.; Hokoi, S. Solar façades: A review. Build. Environ. 2015, 91, 152–165. [Google Scholar] [CrossRef]
  9. Barbosa, S.; Ip, K. Perspectives of double skin façades for naturally ventilated buildings: A review. Renew. Sustain. Energy Rev. 2014, 40, 1019–1029. [Google Scholar] [CrossRef]
  10. Haase, M.; Marques da Silva, F.; Amato, F. Simulation of ventilated facades in hot and humide climate. Energy Build. 2009, 41, 361–373. [Google Scholar] [CrossRef]
  11. Ibanez-Puy, M.; Vidaurre Arbizu, M.; Sancristan-Fernandez, J.A.; Martin-Gomez, C. Opaque Ventilated Façades: Thermal and energy performance review. Renew. Sustain. Energy Rev. 2017, 79, 180–191. [Google Scholar] [CrossRef]
  12. Shameri, M.A.; Alghoul, M.A.; Sopian, K.; Zain, M.F.M.; Elayeb, O. Perspectives of double skin façade systems in buildings and energy saving. Renew. Sustain. Energy Rev. 2011, 15, 1468–1475. [Google Scholar] [CrossRef]
  13. Quesada, G.; Rousse, D.; Dutil, Y.; Badache, M.; Hallé, S. A comprehensive review of solar facades. Opaque solar facades. Renew. Sustain. Energy Rev. 2012, 16, 2820–2832. [Google Scholar] [CrossRef]
  14. Khanal, R.; Lei, C. Solar chimney—A passive strategy for natural ventilation. Energy Build. 2011, 43, 1811–1819. [Google Scholar] [CrossRef]
  15. Saadatian, O.; Sopian, K.; Lim, C.H.; Asim, N.; Sulaiman, M.Y. Trombe walls: A review of opportunities and challenges in research and development. Renew. Sustain. Energy Rev. 2012, 16, 6340–6351. [Google Scholar] [CrossRef]
  16. Alaidroos, A.; Krarti, M. Experimental validation of a numerical model for ventilated wall cavity with spray evaporative cooling systems for hot and dry climates. Energy Build. 2016, 131, 207–222. [Google Scholar] [CrossRef]
  17. Aleksandrowicz, O.; Yezioro, A. Mechanically ventilated double-skin facade in a hot and humid climate: Summer monitoring in an office tower in Tel Aviv. Archit. Sci. Rev. 2018, 61, 171–188. [Google Scholar] [CrossRef]
  18. Wang, J.; Du, Q.; Zhang, C.; Xu, X. Energy Performance of Triple Glazed Window with Built-in Venetian Blinds by Utilizing Forced Ventilated airflow. Procedia Eng. 2017, 205, 3993–4000. [Google Scholar] [CrossRef]
  19. Souza, L.C.; Souza, H.A.; Rodrigues, E.F. Experimental and numerical analysis of a naturally ventilated double-skin façade. Energy Build. 2018, 165, 328–339. [Google Scholar] [CrossRef]
  20. Parra, J.; Guardo, A.; Egusquiza, E.; Alavedra, P. Thermal performance of ventilated double skin façades with venetian blinds. Energies 2015, 8, 4882–4898. [Google Scholar] [CrossRef]
  21. Michaux, G.; Greffet, R.; Salagnac, P.; Ridoret, J.B. Modelling of an airflow window and numerical investigation of its thermal performances by comparison to conventional double and triple-glazed windows. Appl. Energy 2019, 242, 27–45. [Google Scholar] [CrossRef]
  22. Gloriant, F.; Joulin, A.; Tittelein, P.; Lassue, S. Using heat flux sensors for a contribution to experimental analysis of heat transfers on a triple-glazed supply-air window. Energy 2021, 215, 119154. [Google Scholar] [CrossRef]
  23. Asdrubaldi, F.; Baldinelli, G. Thermal transmittance measurements with the hot box method: Calibration, experimental procedures, and uncertainty analyses of three different approaches. Energy Build. 2011, 43, 1618–1626. [Google Scholar] [CrossRef]
  24. Lucchi, E.; Roberti, F.; Alexandra, T. Definition of an experimental procedure with the hot box method for the thermal performance evaluation of inhomogeneous walls. Energy Build. 2018, 179, 99–111. [Google Scholar] [CrossRef]
  25. Aviram, D.P.; Fried, A.N.; Roberts, J.J. Thermal properties of a variable cavity wall. Build. Environ. 2001, 36, 1057–1072. [Google Scholar] [CrossRef]
  26. Andreotti, M.; Calzolari, M.; Davoli, P.; Pereira, L.D.; Lucchi, E.; Malaguti, R. Design and Construction of a New Metering Hot Box for the In Situ Hygrothermal Measurement in Dynamic Conditions of Historic Masonries. Energies 2020, 13, 2950. [Google Scholar] [CrossRef]
  27. Sukamto, D.; Gloriant, F.; Siroux, M. Mise en place d ’un dispositif expérimental pour la caractérisation énergétique d’une paroi bioclimatique ventilée. In Proceedings of the Conférence SFT Belfort Therm. Mix Énergétique, Belfort, France, 1 June 2020. [Google Scholar]
  28. Padet, J. Convection Thermique et Massique Principes Généraux; Techniques de l’ingenieur: Saint-Denis, France, 2005; pp. 1–23. [Google Scholar]
  29. Fantuccia, S.; Serraa, V.; Perino, M. Dynamic insulation systems: Experimental analysis on a parietodynamic wall. Energy Procedia 2015, 78, 549–554. [Google Scholar] [CrossRef] [Green Version]
Figure 1. Ventilated wall.
Energies 14 01327 g001
Figure 2. Hot box.
Figure 2. Hot box.
Energies 14 01327 g002
Figure 3. Hot box instrumentation. Two climatic chambers are separated by a sample holder. The ambient temperature is measured by 6 K-type thermocouples (3 thermocouples, T42, T43, and T44 in the cold cell and 3 thermocouples, T39, T40, T41 in the hot cell).
Energies 14 01327 g003
Figure 4. Ventilated wall instrumentation: wall surface temperature is measured by K-type thermocouples, air temperature is measured by K-type thermocouples, thermal flux is measured by flux meters, and airflow rate is measured by a hot wire anemometer.
Energies 14 01327 g004
Figure 5. Mobile wall instrumentation.
Energies 14 01327 g005
Figure 6. Fixed wall instrumentation.
Energies 14 01327 g006
Figure 7. Data acquisition system.
Energies 14 01327 g007
Figure 8. Experimental setup.
Energies 14 01327 g008
Figure 9. Ambient temperature in the cold cell and in the hot cell.
Energies 14 01327 g009
Figure 10. Surface temperature measurement by infrared camera.
Energies 14 01327 g010
Figure 11. Surface temperature. Thermocouple and infrared camera measurements.
Energies 14 01327 g011
Figure 12. Local convection heat transfer coefficient in the cold cell.
Energies 14 01327 g012
Figure 13. Local convection heat transfer coefficient in the hot cell.
Energies 14 01327 g013
Figure 14. Global heat transfer coefficient (cold cell).
Energies 14 01327 g014
Figure 15. Global heat transfer coefficient (hot cell).
Energies 14 01327 g015
Figure 16. Pre-heating efficiency of the ventilated wall. Experiments were carried out for variable air space thicknesses (5, 20, 50, and 85 mm) and variable air flow rates (10, 20, and 30 m3·h−1).
Energies 14 01327 g016
Table 1. Overview of different studies on ventilated façades.
AuthorYearsSampleAir Space Thickness
A. Alaidroos [16]2016Ventilated wall0.1 m
O. Aleksandrowicz [17]2018Double skin façade0.2 m
J. Wang [18]2017Triple glazed windows0.03 m, 0.01 m
L. C. O. Souza [19]2018Ventilated double-skin façade0.1 m
J. Parra [20]2015Ventilated double-skin façade0.2 m, 2 m
G. Michaux [21]2019Triple glazed windows0.01 m
F. Gloriant [22]2021Triple glazed windows0.013 m
Table 2. Overview of 50 experiments.
Test NumberAir Space Thickness (mm)Air Flow Velocity (m3·h−3)Cold Cell Temperature Ta1 (°C)Hot Cell Temperature Ta2 (°C)Temperature Difference between Hot Cell and Cold Cell (°C)
159.94−4.3415.5619.9
2519.61−4.6415.6320.27
3529.99−4.4515.8220.27
4109.94−4.6415.5820.23
51019.96−4.7215.6120.32
61029.99−4.4715.820.27
71510−4.6115.5820.19
81519.99−4.6315.6620.29
91530.09−4.4115.8720.28
10209.98−4.6715.6220.29
112020.43−4.6615.6420.29
122029.84−4.4115.8620.27
132510.02−4.6715.6120.28
142520.08−4.6315.6820.31
152529.81−4.4315.8720.3
16309.9−4.6515.6620.31
173019.85−4.6215.7120.33
183029.98−4.3215.920.22
193510.22−4.6515.6320.28
203519.89−4.6415.6320.27
213530.039−4.3215.9520.28
22408.98−4.6715.6620.33
234020.07−4.6115.7420.35
244030.05−4.2915.8620.15
25459.04−4.6615.6420.3
264520.03−4.6215.620.22
274530.07−4.4015.9120.31
285010.01−4.7115.5920.31
295020.04−4.6515.6220.27
305029.94−4.4515.8220.27
31559.99−4.6215.6620.28
325520.08−4.6115.5120.11
335530.01−4.3715.7720.14
346010.01−4.6315.5920.22
356019.73−4.5815.720.28
366029.9−4.1915.8520.04
376510.01−4.6515.5220.17
386520.03−4.6915.6420.32
396530.05−4.4515.8520.3
407010.07−4.7215.5820.29
417020.03−4.6415.5320.16
427030.37−4.3715.7820.15
43759.98−4.6815.4720.15
447520.01−4.7015.5720.27
457530.62−4.3815.7120.09
46809.98−4.7515.4720.22
478020.49−4.6615.5920.25
488030.13−4.4615.7220.18
49859.99−4.6715.4920.16
508520.27−4.7215.520.22
Table 3. Thermal metrology.
TypeMetrologic MeansRangeUncertainty
Air temperaturePT-100−70 °C to + 200 °C0.1 °C
K-type Thermocouples−75 °C to + 250 °C0.02 °C
Surface temperatureK-type Thermocouples−75 °C to + 250 °C0.02 °C
Infrared camera FLIR T650 SC−40 °C to + 150 °C1%
Thermal FluxCaptec Flux meter 5%
Air flow velocityHot wire anemometer KIMO CTV 2100–30 m/s0.3 m/s
Table 4. Uncertainties for the local convection heat transfer coefficient.
Vertical Position (m)Cold CellHot Cell
Cavity of 5 mm for 10, 20, 30 Flow Rate (m3·h−1)Cavity of 10 mm for 10, 20, 30 Flow Rate (m3·h−1)Cavity of 5 mm for 10, 20, 30 Flow Rate (m3·h−1)Cavity of 10 mm for 10, 20, 30 Flow Rate (m3·h−1)
102030102030102030102030
0.81.51.51.71.51.41.71.51.51.41.81.81.6
0.562.72.32.72.22.02.41.21.21.11.31.31.2
0.354.63.03.03.12.73.21.51.61.51.61.61.4
0.125.12.82.73.12.93.41.41.31.51.41.51.2
Publisher’s Note: MDPI stays neutral with regard to jurisdictional claims in published maps and institutional affiliations.

