Article

Time Delay Approach to Renewable Energy in the Visegrad Group

1
Department of Public Policy, Warsaw School of Economics, 02-554 Warszawa, Poland
2
Department of Local Government Economy and Financing, Warsaw School of Economics, 02-554 Warszawa, Poland
*
Author to whom correspondence should be addressed.
Energies 2021, 14(7), 1928; https://doi.org/10.3390/en14071928
Submission received: 27 February 2021 / Revised: 17 March 2021 / Accepted: 30 March 2021 / Published: 31 March 2021

Abstract

:
Climate changes necessitate measures to reduce greenhouse gas emissions (GHG). The European Union’s climate and energy policy places particular emphasis on the development of renewable energy, considered to be the primary mean in achieving the climate neutrality goal by 2050. Having in mind the aforementioned, the study was conducted to determine time delay in the development of renewable energy sources between the Visegrad Group (V4) countries and Germany, considered the most advanced country in developing renewable energy and having the greatest impact on shaping European Union climate and energy policy. The time delay econometric method was used in four of its variants. The research results show that, despite the existence of support mechanisms, the development of renewable energy sources (RES) in the V4 countries has a high mutual correlation. There is a hight correlation between RES penetration in energy mix and UE goals of the climate and energy policy until 2020. At the same time, the available data from the analysed period 2004–2019 indicate growing time delay between the reference facility—Germany and the surveyed group. The paper identifies the primary factors behind the identified time delay and proposes research areas that could direct the future research of those aspects.

1. Introduction

One of the basic economic challenges is the ability to estimate the degree of backwardness or delay in the development between entities. These entities can be groups of countries, individual countries, local government units or individual economic entities. The time delay method is used for estimating the degree of delay in the development. Time delays, in addition to identifying the backwardness between analysed entities, can also be the basis for constructing predictions about their development. In this study, the delay method was used to estimate the degree of backwardness in the development of renewable energy sources (RES) between the Visegrad Group (V4) countries i.e., Czech Republic, Hungary, Poland and Slovakia, and Germany—the leader of the European Union (EU) in the energy transformation process who has the greatest impact on European Union climate and energy policy on regional and global level.
The level of penetration and dynamics of RES in energy mix are the factors of the economic growth. The impacts of renewable energy on consolidated economic growth prospects of the country is the subject of research [1]. The study by Kahia [2] provides strong evidence of a long-run relationship between real GDP, renewable and non-renewable energy consumption, real gross fixed capital formation, and the labour force. Bhatatacharya [3] provided valuable insights into the effects of renewable energy consumption on the economic growth of major renewable energy consuming countries in the world. Consequently, this research could be the base on future discussion on sources of differences in economic growth among countries.
Therefore, the aim of the study is to estimate the degree of backwardness in the field of developing RES between Germany and the analysed group four. Analysing the conditions for the development of the V4 countries, on one hand one should consider significant similarities (which undoubtedly include historical conditions or developmental ambitions), whilst on the other hand the differences (e.g., social, economic and environmental). Undoubtedly, a common starting point connecting all EU countries is the process of integration with the European Union, which in case of all the countries in question was finalised by full membership in the community. The process of integration with the EU required aspiring candidates to accept many regulations in regards to protection of the natural environment, which unambiguously translated also into the V4 energy sector [4,5]. The aim of the study is to determine which of the V4 countries made a better use of the period of systemic and economic transformations, and which of the countries “lag behind”. For the benefit of analysis the following hypothesis was adopted: Despite the EU membership and acceptance of the RES development goals, the V4 countries increased backwardness gap in developing RES in relation to Germany. In support of this hypothesis, part 5 of the article identifies prospective future research areas and provides analysis of the results in the context of other studies in this area.

2. Materials and Methods

2.1. Utilized Date

Two key statistics for Primary energy were selected for analysis: Consumption and Renewable power generation. The statistical data originate from the Eurostat database and cover the period 2004–2019.
Table 1 presents statistical data on primary Energy consumption in countries of interest. According to the provided data, between 2004 and 2019, in all countries, except Poland, primary energy consumption decreased. In Poland, primary energy consumption increased from 1040.4 Terawatt-hours (TWh) in 2004 to 1188.0 TWh in 2019 (an increase by 147.6 TWh, i.e., by 14.9%).
In the case of Germany, the data indicate decrease in consumption of primary energy between 2004 and 2019 totalling 333.2 TWh (i.e., −9.1%), in the case of the Czech Republic 55.1 TWh (i.e., by −10.9%), Hungary 11.7 TWh (−4.2%), and Slovakia 29.3 TWh (−16.1%).
In the years 2004–2019, renewable power generation (see Table 2) grew dynamically in all surveyed countries. The analysis of statistical data shows that in 2004 the V4 countries hardly used renewable energy.
The development of renewable energy expressed in generation was particularly dynamic in the years 2004–2015. The years 2016–2019 are a period of stabilization. However, this problem did not apply to Germany, where the growth of renewable power generation is constant.
Table 3 shows the share of renewable power generation in primary energy consumption. The analysis of aforementioned data shows that Germany is the undisputed leader in the share of renewable power generation in primary energy consumption. What is worth to mention, is that the share of renewable power generation in primary energy consumption is steadily rising in all the studied countries.

2.2. Sample Characteristic

For the benefit of this research, the V4 countries were selected and studied. Germany, which is the EU leader in the process of energy transformation, was selected as the reference country. The selected countries have similar characteristics: they joined the EU on 1 May 2004, during the Cold War period until 1989 they remained in the communist system (in the years 1949–1991 to the Council for Mutual Economic Assistance), in 1991 they have formed the V4, with consequences for their energy policy in the form of infrastructure development, energy efficiency and quality of administration. From the point of view of formulating public policies, the surveyed countries belonged to the group of economies in the transformation period, so they were alien to long-term and strategic thinking, which is of key importance from the point of view of energy policy requiring long-term and strategi thinking.
The states presented in the analysis have always been part of a community with the same civilization and cultural roots as well as religious and intellectual values that they wish to preserve and strengthen. There are also differences between the V4 countries, resulting from the size of their economies and the consumption of electricity, oil and gas, which, from the point of view of the adopted research method, can’t be ignored. Countries that are EU members have committed under art. 4 par. 1 of Directive 2009/28/EC of the European Parliament and of the Council of 23 April 2009 on the promotion of the use of energy from renewable sources, amending and then repealing Directives 2001/77/EC and 2003/30/EC undertook to prepare national action plans in the field of energy from renewable sources in accordance with the requirements contained in the decision of the European Commission of 30 June 2009 [6].
The actions undertaken by the analysed countries result from the agenda of actions adopted in 2008 as the climate and energy package, containing three key goals: reducing greenhouse gas emissions by 20% (compared to 1990 levels), 20% share of renewable energy in total energy consumption, 20% increase in energy efficiency by 2020. Goals were as follows: for the Czech Republic 13.5% [7], Slovakia 14% [8], Hungary 14.65% [9] Poland 15% [10], of energy from renewable sources in gross final consumption of energy. Despite the positive changes in the share of renewable energy across the European Union, changes vary from country to country. The energy mix depends, to a large extent, on domestic resources and the ability to produce primary energy [11]. It is assumed that only collective economic adjustment on a global scale can contribute to reducing the negative effects of environmental degradation and climate change [12].

2.3. Research Process

The taxonomic methods, which enable researchers to order data sets according to multiple features simultaneously, prove to be useful in studies on the competitiveness of economies, cities or regions. Their use in regional and local studies is particularly justified, as these methods enable multi-feature classification of spatial units. As a result of the application of taxonomic methods, we obtain synthetic measures, the most important goal of which is to “organize” the objects according to the level of the multi-feature phenomenon. The construction of the meter takes into account all diagnostic variables, but depending on the adopted method, their impact on its value may be varied.
This also applies to the interpretation of the obtained results. Considering the above, when examining the degree of backwardness in the analysed group: the Czech Republic, Slovakia, Poland and Hungary, and the reference country of Germany using the time delay method, the authors proposed an 8-stage research process:
  • selection of countries to study,
  • method selection,
  • finding data on the share of renewable energy sources in final energy consumption and the size of GDP,
  • processing of data from point 1 and generating the GDP/RES ratio,
  • substitution of the GDP/RES ratio for the method of calculating time shifts,
  • analysis of the test results with the use of time shifts,
  • looking for factors explaining the results of the study,
  • conclusions from the study.

2.4. Methods

The time delay between the Yo object and the Yx object determines the degree of difference in the development of the given units. The concept of the time delay is presented in Figure 1, which shows the course of the Y variable for 5 objects. It should also be noted that this graph applies to the rare cases where the delays between the test object Yo and the reference objects Y1–Y4 are constant in time.
The delay of the object Yo in relation to the object Y1 is four periods, in relation to the object Y2 is 12 periods, while in relation to the object Y4 has a negative delay (d = −2) in relation to the reference object, therefore the information about the variable Y4 is useless in the process of examining the delays of the Yo variable (the Yo object can possible be treated as a reference for the Y4 object). In the case of the object Y3, the delay is much greater, and its size can be estimated using the chaining method. The use of a chain link enables an increase in the number of reference objects, and also extends the possibilities of the future forecast period [13].
The above example shows the essence of time delays, without explaining how to assess the size of these delays. In practice, delays vary from time to time in different periods and it is necessary to provide a formal assessment of the estimated individual delays between the forecast facility and the reference facilities. These methods can be divided into two groups [13]:
  • evaluations constant in time (estimation of static, individual time delays);
  • dynamic assessments (estimating dynamic individual time delays).
The procedures in the first group provide estimates that are constant over time, while the delay estimates obtained with the procedures in the second group are dynamic and vary over time.

2.4.1. Estimating Static, Individual Time Delays

In the first (I) variant, the methodology of determining individual, static time delays between the predicted object Yo and the reference object Y1 is based on the differences expressed in the formula:
Δ t d = y t 0 y t d 1
(d = 1, …, n − 1; t = d + 1, …, n)., where n is a number of periods. The time delay between these objects equals the shift amount d, for which the parameter:
Δ ¯ d = t = d + 1 n Δ t d n d
where (d = 1, …, n − 1), takes the minimum value, provided that the variables Yo and Y1 do not have disjoint intervals of variability, and that the object Y1 is “ahead” of the object Yo in time. These conditions can be expressed as follows:
min t { y t 1 } < max t { y t 0 } max t { y t 1 } > min t { y t 0 }
Minimum parameter value:
ω = min d { Δ ¯ d }
is the average error that is made in the period (d + 1; n), taking as the values of the variable Yo the shift by d periods of the values of the variable Y1.

2.4.2. Estimating Dynamic, Individual Time Delays

The second (II) variant of determining individual time delays between the predicted object Yo and the reference object Y1 is based on the differences:
Δ t i = y t 0 y i 1
where (t, i = 1, …, n).
For t = 1, …, n one looks for:
ω t = min i { Δ t i } ;
provided that the series Di has both positive and negative elements. The time delay between Yo and Y1 in period t is given by the equation:
dt = ti;
this delay can be both positive and negative, and is also dynamic.
The next (III) variant of determining individual time delays is a variant that uses “smoothed” values of the variable Y only for the object predicted Yo. The sequence of operations in this variant consists of the following stages: based on the implementation of the Yo variable, the parameters of the trend function fo are estimated. For this purpose, for example, the classical method of least squares can be used. The functions most often used to describe the development tendency include the following functions: linear, power, exponential, second order polynomial and logistic. When selecting the function to describe the trend, it is also advisable—if possible—to use non-statistical information on the regularity of the development of the phenomenon under study. Bearing in mind the above, the situation in which a linear function was used was analysed in this paper. In addition, the possibility of using the exponential function as an alternative or complement to the data obtained using the linear function was also indicated. Therefore, the following formulas can be used to determine the time delays [13]:
  • in the case of a linear approximation:
Y t 0 = a 0 + b 0 t + e t ;
parameter:
t ˜ t = y t 1 a 0 b 0
in the case of the approximation by the exponential function:
Y t 0 = a 0 b 0 t e t ;
parameter:
t ˜ t = lg y t 1 lg a 0 lg b 0
The size of the individual time delay between the objects Yo and Y1 is given by the equation:
d t = t ˜ t t
where (t = 1, …, n).
However, it should be noted that in the case of Yo variable prediction, only information about the Y1 variable for which dt > 0 is used.
The fourth variant (IV) is essentially similar to the variant III. The difference is that the smoothed values of the Y variable are introduced not only to the forecast object, but also to the reference object Y1. The t ˜ parameter is therefore determined for the theoretical values of the variable Y1, which are obtained from the trend [13]:
Y t 1 = f 1 t , ξ .
In this case, to estimate time delays, it is worth considering the following situations:
  • the fo and f1 functions are linear functions:
Y t 0 = a 0 + b 0 t + e t ; Y t 1 = a 1 + b 1 t + e t ;
parameter:
t ˜ t = a 1 a 0 b 0 + b 1 b 0 t
  • the fo and f1 functions are exponential functions:
Y t 0 = a 0 b 0 t e t ; Y t 1 = a 1 b 1 t e t ;
parameter:
t ˜ t = lg a 1 lg a 0 lg b 0 + lg b 1 lg b 0 t
  • the fo function is an exponential function and the f1 function is a linear function:
Y t 0 = a 0 b 0 t e t ; Y t 1 = a 1 b 1 t + e t ;
parameter:
t ˜ t = lg a 0 lg b 0 + lg a 1 b 1 t lg b 0
  • the fo function is a linear function, while the f1 function is an exponential function:
Y t 0 = a 0 + b 0 t + e t ; Y t 1 = a 1 + b 1 t e t ;
parameter:
t ˜ t = a 0 b 0 + a 1 b 0 b 1 t
Looking closely at the cognitive attractiveness and value of presented particular variants of the time delays, it must be explicitly expressed that dynamic time delays are better suited for modeling the course of the forecasted variables. Nevertheless, the existing trends identification remains essential to this study. For this reason it is critical that all variants, both static and dynamic, are included in calculations.

3. Results

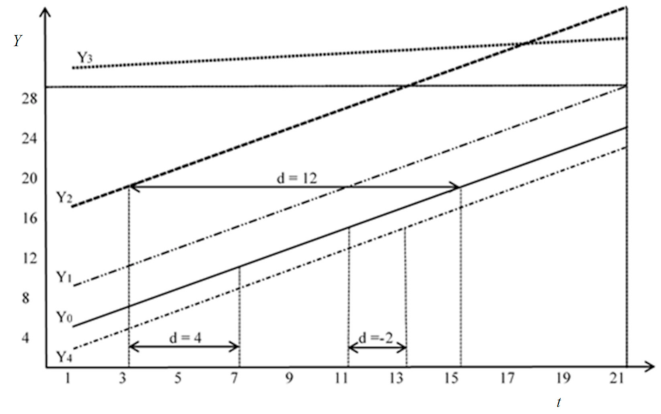
The course of the determined statistical delays of V4 countries with respect to Germany, prepared with the use of variant I, are presented in Table 4. The static delay in case of Poland is 8 years, because for d = 8, the lowest average error in the approximation of the Y0 variable by means of the Y1 variable, shifted in time, is ω = 0.0010.
In the case of Slovakia, the delay in relation to Germany is 13 years (for t = 13, ω = 0.0003). The delay of Hungary is 12 years (for t = 12, ω = 0.0004), and the Czech Republic’s delay is similar to Poland’s and amounts to 9 years (ω = 0.0003).
In the case of dynamic variant II, the delay for Poland in relation to Germany can be determined for t > 8 (see Table 5). According to the necessary condition, only in these ranks there are both positive and negative elements.
The time delay in Poland was years 7 in 2013, 8 years in 2014, 7 years in 2015, 9 years in 2016, 10 years in 2017, 12 years in 2018 and 11 years in 2019.
The time delay in the Czech Republic in the years 2011–2019 was, respectively: 7 years in 2011–2013, 8 years in 2014, 9 years in 2015, 10 years in 2016, 11 years in 2017, 12 years in 2018 and 13 years in 2019.
In the case of Hungary, the time delay in relation to Germany increased systematically. It was first observed in 2009, amounting to 5 years, increasing over the studied period to 13 years in 2019. The situation was even worse in Slovakia.
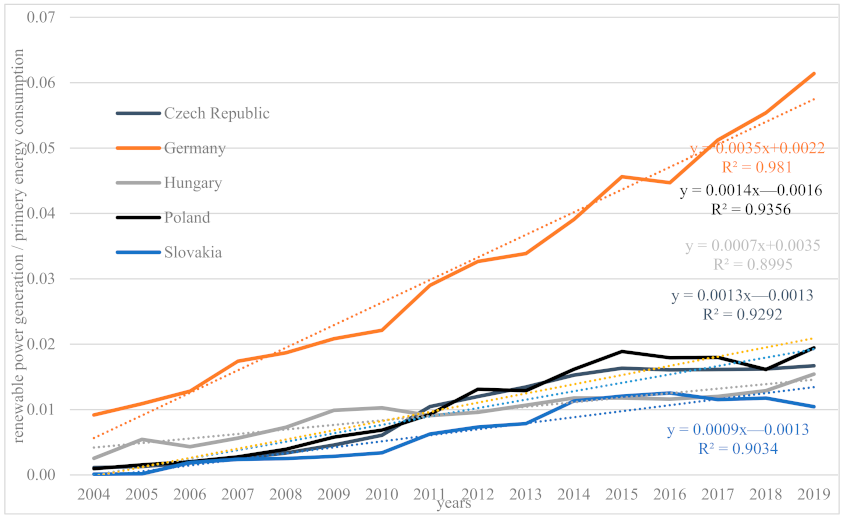
Interesting information can be inferred from the results obtained in variant III. After estimating the linear parameters by the method of least squares, the following evaluations of the trend function parameters were obtained:
For Germany: t D E ^ = 0.0035 t + 0.0022 , correlation coefficient R2DE = 0.981;
For Poland: t P L ^ =   0.0014 t 0.0016 , correlation coefficient R2PL = 0.9356;
For Czech Republic: t C Z ^ =   0.0013 t 0.0013 , correlation coefficient R2CZ = 0.9292;
For Hungary: t H U ^ =   0.0007 t + 0.0035 , correlation coefficient R2HU = 0.8995;
For Slovakia: t S K ^ =   0.0009 t 0.0013 , correlation coefficient R2SK = 0.9034.
Correlation coefficients indicate that the studied variables are very strongly correlated. Therefore, the correlation coefficients calculated for all functions indicate a high compliance of the function fit with empirical data, which allows for further research. We calculate the ei residuals for subsequent observations using the formula: ei = Yi − I (see Figure 2).
The delay of Poland, the Czech Republic, Hungary and Slovakia in relations to Germany, as shown by the analysis of the data obtained using variant III of the method, dynamically changes over time (see Table 6).
In the analysed years (2004–2019), the gap between Germany and Poland is increasing. If in 2004 it was 6.7 years, then in 2019 it increased to 29 years (see Table 6). A similar tendency was also noted in other countries of the V4. In the case of the Czech Republic, the delay increased from 7.1 years in 2004 to 32.2 in 2019. Even greater disproportions appeared in the case of Slovakia and Hungary, where the time delay in relation to Germany in 2019 was 53.7 and 66.7 years, respectively.
As shown by method III, this negative tendency is constant for the all analysed countries, and apart from short breaks (e.g., in Poland in 2009–2010) it leads to an increasing development gap in relation to Germany.
In variant IV, the parameters t were determined for linear functions of the variable’s trend based on the equations (assuming that Germany is the reference object):
t P L ^ =   2.71   +   2.5 t ; t C S ^ =   2.69 + 2.69 t ; t H U ^ =   1.86     +   5 t ; t S K ^ =   3.89   +   3.89 t ;
The t parameter for the studied countries with the time delay for the years 2004–2019 is presented in the Table 7.
The delay between Poland and Germany in 2004–2019, measured with variant IV, was characterized by a constant increase and in 2019 reached the level of over 26.7 years.
The results obtained on the basis of method IV are consistent with the previous variants and indicate a deepening of development differences between the V4 countries and Germany.

4. Discussion

The EU 20-20-20 goals became the starting point for the renewable energy sources development process in all researched countries: Poland, Hungary, Slovakia and the Czech Republic. The next step was the implementation in October 2014 of “A policy framework for climate and energy in the period from 2020 to 2030” [14], which introduced a reduction of CO2 emissions by 40% compared to 1990 level, and in the case of the EU ETS sector (40% of overall emissions), the reduction level by 43% compared to 2005, the share of RES at the level of 27% in total energy consumption and the improvement of energy efficiency also by 32.5%. The Member States of the European Union introduced in November 2018 the “RES Promotion Directive” [15] defining share of RES in final energy consumption at a 32% level. These goals are supported by the EU ETS Emissions Trading System directive [16] system which, while changed on several occasions, remains the basic tool of EU’s climate policy. Both directives promote RES, and impact the CO2 emission levels by degrading the profitability of energy sources emitting CO2. This is particularly acute for a country such as Poland, where the share of high-emission coal energy sources has fluctuated in the last decade around 80% with a downward trend. The requirement to develop and submit the National Energy and Climate Plans (NECP) by the end of 2019 also mobilized the countries of the region to act. The energy transformation process means substitution natural gas with biogas [17], coal with charred biowaste [18], diesel with biodiesel or vegetable oil [19]. It also implicates the need of new approach to production and management [20,21].
The EU climate-policy regulations introducing RES as one of the elements of achieving the goals of reducing CO2 emissions explain the high level of correlation between the countries in the studied group. In years 2017–2019, Poland and Hungary followed the similar trend, with the stable trend in the Czech Republic and declining in Slovakia. The introduction of the climate goals tied to financial incentives and penalties system forces countries to mobilize their resources in the quest to meet EU quotas. In the effect, the closer to 2020, the greater the level of correlation between those countries will be observed.
The adopted research methodology aimed at ascertaining the time shift, and not the impact of individual regulations implementing the “RES Promotion Directive” [15] or the EU ETS system on the dynamics of RES development in the studied group. This is prospective area of research that may provide a significant more detailed information on the climate policy goals and effectiveness of tools for their implementation. It is also worth undertaking research on the effect of supporting mining and renewable energy on the dynamics of the latter in Poland and the scale of reducing CO2 emissions.
The adoption of the new European Union budget by European Council (12 December 2020) for 2021–2027 and the Covid-19 recovery fund may change this unfavourable tendency, which is the deepening time delay between Germany and the study group. At the same time, at the meeting of the Council, a decision was made to reduce greenhouse gas emissions by 55% by 2030 [22], which will significantly affect the studied countries by increasing the level of the urgency to abandon coal. It does not mean, however, that the development of renewable energy is the only option. It is also possible, the aforesaid countries would develop nuclear energy, which would fill in the gap left by moving away from coal. Even if RES is developed, it is not certain whether it will be prosumer energy—in this case mainly photovoltaics, or whether it will be big large-scale investments, for example offshore wind farms. The preferred model of RES development by the European Commission, i.e., the prosumer model [23], is visible in the Czech Republic and Slovakia, taking into account the dynamic development of the prosumer in Poland, this country will also join this model. Prospective areas of research include the issues of tightening the climate policy and the development of prosumer energy, as well as the advantage of technological preferences of the countries of the studied area.
The presented results of the econometric study indicate an increasing time delay in the studied region V4) in relation to the reference object, which is Germany. The adopted test method is not based on the installed capacity but on the production. For this reason, slight fluctuations in the time delay measurement are due to seasonal factors such as weather conditions. Such observations may explain the changes in the period 2017–2018 (see Table 5) of the time delay.
In the case of Slovakia, the amount of installed PV capacity did not change in 2018–2019 and amounted to 1386 MW, in Poland in 2017–2018 the change in installed wind capacity was slightly higher than 5766 MW and 5917 MW. In both cases, they are the predominant sources of RES production.
However, in the case of Poland, the gap widened in 2015–2016 with the constant generation level. And while it is obvious that a gap has increased as a result of the very dynamic development of RES in Germany, it is worth considering other reasons for this tendency. In the case of Poland, it was caused by the adoption of the Distance Act, which prohibited the construction of wind turbines at a distance closer than ten times the turbine’s mast height from buildings, which resulted in a decrease in the dynamics of new power generation after 2015, and in connection with an increase in the time delay. The other countries surveyed followed the trend. In the previous period, the increase in installed capacity was quite dynamic. It can be concluded that the applied research methodology allows to spot qualitative ex post changes in the examined object, but only in the area of trend research, i.e., changes in a trend, a lateral trend, an upward or downward trend. This observation may open the way to the use of this method to prepare forecasts of time delay and RES growth dynamics.
The results of the application of variant IV show a high level of correlation of successive results, which proves the existence of a reference facility for the implementation of energy policy goals for RES development both in the case of the studied countries and in the case of the reference facility (Germany). However, in the case of Germany, a higher level of correlation is clearly visible, which indicates a better quality of the implemented energy policy. This conclusion confirms the fact that the German Energiewende has a more well-established and stable policy in relation to the Visegrad group states. Thus, group policies can be considered to be highly volatile, liquid, i.e., lack strategic depth in formulation and implementation [24,25]. This phenomenon results in a high level of instability of the regulatory system and support mechanisms [26,27], which increases the risk of operating in the energy sector. The path dependency in the energy policy is also observed [28]. In Germany, a high level of correlation indicates the linearity of this policy and the pursuit of the adopted goals. Researching the quality of energy policies is difficult in some countries because, as in the case of Poland, despite attempts to formulate it in 2015, 2019, they failed, which resulted in the fact that the updated version from 2009 was valid in Poland.
The Czech Republic, on the other hand, followed the process of creating energy policy used in Energiewende, identifying the quality of power networks as a limitation for the development of renewable energy sources. The starting point for its application was the adoption on 4 March 2015 (then amended on 16 September 2019) of the National Action Plan for Smart Grids [29], which primarily covers infrastructure development, which made possible on 25 January 2016 the adoption of the National Renewable Energy Action Plan of the Czech Republic [7]. Thus, the Czech government initially made a diagnosis of energy networks, adopted their development method, and then included RES in this infrastructure. Such an institutional and regulatory arrangement indicates that strategic documents are not subject to change, while operational documents such as NAP SG and NAP RES may be subject to modification over time. Thus, a good institutional system enables the evaluation of the policy pursued. In the Czech Republic, the mechanism included in the NAP SG in the form of reporting the effects of policy implementation serves this purpose, which from the point of view of the theory of formulating and conducting public policy is a very important element of verifying goals and tools over time, improving the quality of the policy pursued. Reporting is to be done every 5 years and the need to present an annual evaluation of progress in achieving the goals contained in the SEP, i.e., the document standing above the NAP SG and NAP RES, was introduced every year by 31 December. The current policy was adopted on 16 May 2015, for the period until 2040. Maintaining Czech politics as a social process is also served by the mechanism of social consultations, which activates the social process of creating such a policy. Both the reporting, evaluation and public consultation mechanism. The consequences of institutional changes require further research, the more so because of the existing time shift effect. At the same time, the applied research method makes it possible to assess the presented changes.
An open question for the next research is both the assessment of the quality of the policy pursued, but also the assessment of the extent to which the examined group of countries from the Visegrad group deviates from the path marked by the years of communism and the political transformation. It can be argued that despite the 20-20-20 goals of the European policy, the “path dependency” has not been overcome by 2020.
The ad hoc actions, lack of strategic thinking, and overcoming the features of economies that limit development are typical of countries undergoing transformation. This is reflected in the literature on the subject, where various reasons for this fact are identified, e.g., [30] the existing culture of a short-term rather than strategic thinking [24]. The results of the study show the lack of fluidity in the implementation of the adopted development path through the emergence of disruptive factors, i.e., resulting from the weakness of the administration—institutions and officials, ergo weak, often silo perception of the strategies of states and security. Empirical facts indicate that Poland, despite attempts to prepare the updated Energy Policy, has never gone beyond the framework of consultations and the document from 2009, not corresponding to the existing EU’s current climate and energy policy, is still in force. Several attempts to update this policy were made to no avail [31]. Defining the future energy mix is a key signal for companies, which enables them to create an action strategy and define directions of development research. Due to the lack of regulatory stability and clearly defined objectives translated into specific support tools, the increase in energy production from RES results from political decisions, and at the same time the ownership structure of energy production (controlled by the State Treasury) from informal relations. In this research, this phenomenon can be observed both in methods I, II, III and IV. The underlying reasons, disruptive factors and the impact of uncertainty in investment decision processes have to be identified in further research. Further research should also examine the impact of informal relations on investments in renewable energy and, more broadly, in the energy sector.
The results of econometric studies show that Germany is gaining an advantage over the group of studied countries. It is very likely that this is due to the technological advantage in the field of zero-emission technologies. As a result, with the use of support mechanisms, the investment multiplier reaches a high level, and thus causes a strong GDP growth effect. In turn, the group of countries studied have a small amount of low-emission technologies [32], and thus the multiplier effects are smaller, so there is no snowball effect between support mechanisms, GDP growth and further technology development. Research shows the current scale of the effects of this mechanism a 1% increase in renewable energy consumption boosts German economic growth by 0.2194 [1]. This area seems very important to the authors for further analysis and identification of factors that may contribute to the formation of the time delay. Worth further examining is the relationship between the adopted support mechanisms or new regulations and the installed capacities in the system and their energy production and further time delay.
Public participation is one of the key mechanisms driving the development of RES. Compared to the reference object in the surveyed countries, public participation is not sufficient. This may explain why the time delay between the reference object and the examined objects deepens. This causes not only the failure to define the prosumer model as the target, but also a slow development of RES. The conclusions from the subject literature overview indicate that the participation of civil society is key in the development of renewable energy sources, as for example a coalition building processes in Chile [33], building local groups in support of the development of renewable energy sources in the Netherlands [34].
One should also remember the structural conditions in the energy system, which may limit the possibilities of increasing the share of RES. These include the quality of power grids and the mechanisms for balancing RES in the power system through interconnections with other countries, the presence of flexible energy sources (production and storage) in the energy system [35,36]. Due to the recognition of gas by the European Commission as a transitional fuel in the energy transformation, the analysed countries, until recently fully dependent on gas imports from Russia, must take this factor into the decision-making process. They raise energy security issues in connection with the need to use gas from this direction, but the expansion of the north-south infrastructure (LNG in Świnoujście, Baltic Pipe, and gas connections with Lithuania, Slovakia and the Czech Republic) will abolish this restriction from 2022.
Gas issues in RES development that have been addressed. In this context, an interesting area of research is the question of the influence of the region’s dependence on Russian gas on the development of renewable energy sources in the study group [37]. The hypothesis put forward in the study on strategic change in the development of renewable energy sources is confirmed by partial data from the first half of 2020. However, it was only the year 2022 that will give a definite answer to what extent energy security issues contributed to the poor development of RES in the region.
The development of RES results not only from the support mechanisms, but also from the formation of electricity prices, which encourage or not to make investments. In this context, the issue of the impact of the EU ETS on electricity prices is important. The discussion in the literature on this issue is widely presented [38]. Research is also being undertaken on the impact of RES on electricity prices on the spot market [39]. An important aspect under consideration is the issue of support mechanisms and electricity prices in Germany [40]. The data presented below (see Table 8) showing electricity prices in the period between 2015 and 2020 for non-household entities. Between 2015 and 2020, 10 measurements show that, depending on the country, prices vary in relation to the reference object. In the case of the Czech Republic, in the case of only one measurement, the prices were higher than in the reference object, in Hungary, three measurements indicate higher prices than in the reference object, one equal price and six with lower prices. Slovakia shows eight readings with higher prices and two with lower prices, and Poland in nine cases with lower prices and one with equal prices. The lack of clarity in the development of electricity prices makes it difficult to determine the impact of electricity prices on the development of RES. Thus, the subject of the study, i.e., the determination of the time delay between facilities, it is worth undertaking research on the impact of prices on the time delay in RES development. Undoubtedly, it is worth considering differences in purchasing power between individual countries in such studies. In the context of the prices presented for non-household entities, purchasing power is less important, but it transfers the price impulse to products consumed on the local market and being exported.
It is also worth considering the integration of the electricity market in the European Union and the markets of the surveyed countries. The issues of regulatory quality, flexibility, security levels and interconnectors can hinder this process. On the basis of the presented research, it is not possible to determine to what extent these factors impact the time gap between countries.
The assessment of the European Commission regarding NEPC is negative for the examined countries [14]. Nevertheless, the convergence of the results shows that they are moving in the same direction, but much slower than the reference object. This is confirmed by the facts, which is the German declaration to abandon coal by 2038, while Slovakia and the Czech Republic are considering this issue, and Poland has not made a decision yet, only Hungary has declared it by 2030 [14]. Taking into account the issues of differences in economic development between the reference object and the studied countries, it is worth studying the thesis [41], that it will not be possible to equalize the differences in the RES development without external assistance. The progressing regulatory processes make even harder, if not impossible, for the studied countries to bridge the gap without significant EU assistance. It has to examined why the mechanisms and tools of the European Union’s climate and energy policy, despite the presence of assistance programs, do not reduce the gap but increase it instead. Widening gap has undisputable a negative effect on the cohesion of the European Union.
The presented research method can be also applied as an energy policy planning tool. In the literature on the subject, energy planning models (EPMs) play an indispensable role in policy formulation and energy sector development [42,43,44,45].

5. Conclusions

The conducted econometric study shows that the time delay between Germany and the countries of the Visegrad group (Poland, Slovakia, the Czech Republic, and Hungary) is deepening. The applied variants identify a different scale of the time delay, confirming the same trend. The conclusions is that despite the EU membership and acceptance of the RES development goals, the V4 countries increased backwardness gap in developing RES.
Research confirms that the adoption of the RES quantity targets mobilizes countries. They all increased the share of RES, however, this does not correspond with reduction of the time delay between the study group and the reference object. Germany is profiting from the snowball effect, while this effect has not yet occurred in the researched countries. Studies on renewable energy are conducted from various research perspectives: economic, social, and sociological, using various methods and methodology. The results of this paper, as well as the method of time delay approach could be used in prospective studies to increase the knowledge on RES development and economic growth, efficiency of the public policy (in the sense of strategy and tools), the role of support mechanism at different levels—global, regional, national and local. The increase in the time delay may result from many factors examined in the discussion part and requires further research. Particularly promising and interesting is the application of the presented methodology in forecasting and supporting formulation and implementation of energy policy.
In the conditions of a competitive European market, a thorough analysis and observation of the environment as well as the study of mutual conditions between countries or regions is necessary. It is important to realize that in order to assess the current situation and forecast future conditions, one should use methods that reflect the best studied phenomenon. Undoubtedly, it is beneficial to use many different methods and to draw conclusions and forecasts on their basis. The analysis of time delay measurements presented in the article is a proposal that allows to determine one’s own position in relation to the reference object. The study of a phenomenon that changes over time, in addition to learning about the regularities occurring in past periods, also allows us to forecast the course of the phenomenon in the future. For this purpose, analogical forecasting can be used, which consists in predicting the future states of a given variable on the basis of data about other variables, similar to it for some reasons. Therefore, this article can be used as a starting material for further research related to forecasting the development and convergence of the studied countries.

Author Contributions

Conceptualization, K.K. and G.M.; methodology, K.K. and G.M.; writing—original draft preparation, K.K. and G.M.; writing—review and editing, K.K. and G.M. All authors have read and agreed to the published version of the manuscript.

Funding

This research received no external funding.

Institutional Review Board Statement

Not applicable.

Informed Consent Statement

Not applicable.

Data Availability Statement

All data is shown within this article.

Conflicts of Interest

The authors declare no conflict of interest.

References

  1. Rafindadi, A.A.; Ozturk, I. Impacts of Renewable Energy Consumption on the German Economic Growth: Evidence from Combined Cointegration Test. Renew. Sustain. Energy Rev. 2017, 75, 1130–1141. [Google Scholar] [CrossRef]
  2. Kahia, M.; Ben Aïssa, M.S.; Charfeddine, L. Impact of Renewable and Non-Renewable Energy Consumption on Economic Growth: New Evidence from the MENA Net Oil Exporting Countries (NOECs). Energy 2016, 116, 102–115. [Google Scholar] [CrossRef]
  3. Bhattacharya, M.; Paramati, S.R.; Ozturk, I.; Bhattacharya, S. The Effect of Renewable Energy Consumption on Economic Growth: Evidence from Top 38 Countries. Appl. Energy 2016, 162, 733–741. [Google Scholar] [CrossRef]
  4. Maśloch, G. Socio-Economic Conditions of the Construction of the Self-Sufficient Energy Regions in the Countries of Central and Eastern Europe (CEECs). Int. J. Innov. Manag. Technol. 2019, 10, 87–91. [Google Scholar] [CrossRef]
  5. Albi, A. EU Enlargement and the Constitutions of Central and Eastern Europe, 1st ed.; Cambridge University Press: Cambridge, UK, 2005; ISBN 978-0-521-84541-0. [Google Scholar]
  6. European Commission Decision of 30 June 2009 Establishing a Template for National Renewable Energy Action Plans under Directive 2009/28/EC of the European Parliament and of the Council 2009. Available online: https://eur-lex.europa.eu/LexUriServ/LexUriServ.do?uri=OJ:L:2009:182:0033:0062:EN:PDF (accessed on 20 December 2020).
  7. National Renewable Energy Action Plan of the Czech Republic. Available online: https://ec.europa.eu/energy/sites/ener/files/documents/dir_2009_0028_action_plan_czechrepublic.zip (accessed on 11 December 2020).
  8. National Renewable Energy Action Plan (Slovak Republic). Available online: https://ec.europa.eu/energy/sites/ener/files/documents/dir_2009_0028_action_plan_slovakia.zip (accessed on 11 December 2020).
  9. Péter, O.; Bencsik, J. Hungary’s Renewable Energy Utilisation Action Plan on Trends in the Use of Renewable Energy Sources until 2020 (Data Provision under Article 4 (3) of Directive 2009/28/EC) 2010. Available online: http://www.buildup.eu/sites/default/files/content/national_renewable_energy_action_plan_hungary_en.pdf (accessed on 12 December 2020).
  10. Minister Gospodarki Krajowy Plan Działania w Zakresie Energetyki Ze Źródeł Odnawialnych 2010. Available online: https://www.ebb-eu.org/legis/ActionPlanDirective2009_28/national_renewable_energy_action_plan_poland_pl.pdf (accessed on 20 December 2020).
  11. Ringel, M.; Knodt, M. The Governance of the European Energy Union: Efficiency, Effectiveness and Acceptance of the Winter Package 2016. Energy Policy 2018, 112, 209–220. [Google Scholar] [CrossRef]
  12. Stern, N. The Economics of Climate Change: The Stern Review; Cambridge University Press: Cambridge, UK, 2007; ISBN 978-0-521-70080-1. [Google Scholar]
  13. Grabiński, T. Metody określania opóźnień czasowych i wykorzystanie ich w procesie prognozowania. In Metody Statystyki Międzynarodowej; PWE: Warszawa, Poland, 1988; pp. 204–205. [Google Scholar]
  14. European Commission Communication from the Commission to the European Parliament, the Council, the European Economic and Social Committee and the Committee of the Regions an EU-Wide Assessment of National Energy and Climate Plans Driving Forward the Green Transition and Promoting Economic Recovery through Integrated Energy and Climate Planning 2020. Available online: https://eur-lex.europa.eu/legal-content/EN/TXT/PDF/?uri=CELEX:52020DC0564&from=EN (accessed on 3 January 2021).
  15. RES Promotion Directive. Available online: https://eur-lex.europa.eu/legal-content/EN/TXT/PDF/?uri=CELEX:32018L2001&from=EN (accessed on 15 December 2020).
  16. Emissions Trading System. Available online: https://ec.europa.eu/clima/policies/ets/revision_pl#tab-0-0 (accessed on 15 December 2020).
  17. Maroušek, J.; Strunecký, O.; Kolář, L.; Vochozka, M.; Kopecký, M.; Maroušková, A.; Batt, J.; Poliak, M.; Šoch, M.; Bartoš, P.; et al. Advances in Nutrient Management Make It Possible to Accelerate Biogas Production and Thus Improve the Economy of Food Waste Processing. Energy Sources Part. Recovery Util. Environ. Eff. 2020, 1–10. [Google Scholar] [CrossRef]
  18. Mardoyan, A.; Braun, P. Analysis of Czech Subsidies for Solid Biofuels. Int. J. Green Energy 2015, 12, 405–408. [Google Scholar] [CrossRef]
  19. Cheban, I.; Dibrova, A. Development of Liquid Biofuel Market: Impact Assessment of the New Support System in Ukraine. J. Int. Stud. 2020, 13, 262–278. [Google Scholar] [CrossRef] [Green Version]
  20. Kliestik, T.; Nica, E.; Musa, H.; Poliak, M.; Mihai, E.-A. Networked, Smart, and Responsive Devices in Industry 4.0 Manufacturing Systems. Econ. Manag. Financ. Mark. 2020, 15, 23. Available online: https://addletonacademicpublishers.com/contents-emfm/1956-volume-15-3-2020/3820-networked-smart-and-responsive-devices-in-industry-4-0-manufacturing-systems (accessed on 14 March 2021). [CrossRef]
  21. Peters, E.; Kliestik, T.; Musa, H.; Durana, P. Product Decision-Making Information Systems, Real-Time Big Data Analytics, and Deep Learning-Enabled Smart Process Planning in Sustainable Industry 4.0. J. Self Gov. Manag. Econ. 2020, 8, 16. Available online: https://addletonacademicpublishers.com/contents-jsme/1962-volume-8-3-2020/3826-product-decision-making-information-systems-real-time-big-data-analytics-and-deep-learning-enabled-smart-process-planning-in-sustainable-industry-4-0 (accessed on 14 March 2021). [CrossRef]
  22. European Council European Council Meeting (10 and 11 December 2020)—Conclusions 2020. Available online: https://www.consilium.europa.eu/media/47296/1011-12-20-euco-conclusions-en.pdf (accessed on 22 December 2020).
  23. Buzek, J.; Księżopolski, K.M. Pokonywanie Barier Administracyjnych w Rozwoju Mikroźródeł Energii Odnawialnej Jako Podstawy Energetyki Obywatelskiej–Doświadczenia w Polsce i w Unii Europejskiej; EFRWP: Warszawa, Poland, 2017; ISBN 978-83-948933-1-6. [Google Scholar]
  24. Księżopolski, K.M.; Pronińska, K.M.; Sulowska, A.E. Odnawialne Źródła Energii w Polsce: Wybrane Problemy Bezpieczeństwa, Polityki i Administracji; Elipsa: Warszawa, Poland, 2013; ISBN 978-83-7151-992-5. [Google Scholar]
  25. Księżopolski, K. Strategy Game. Euro-Norwegian Cooperation in the Field of Energy Efficieny and Security. Methodology, Recommendations and Conclusions 2017. Available online: http://isecs.eu/wp-content/uploads/2018/01/The-Strategic-Game-2017.pdf (accessed on 5 October 2020).
  26. Księżopolski, K.; Pronińska, K. Studium Barier Administracyjnych i Proceduralnych w Rozwoju OZE Na Obszarach Wiejskich. 2017. Available online: http://isecs.eu/wp-content/uploads/2017/05/Studium-barier-administracyjnych.pdf (accessed on 6 December 2020).
  27. Maśloch, G.; Szkoła Główna Handlowa (Warszawa). Oficyna Wydawnicza Uwarunkowamia i Kierunki Rozwoju Energetyki Odnawialnej w Polsce; Oficyna Wydawnicza SGH—Szkoła Główna Handlowa: Warszawa, Poland, 2018; ISBN 978-83-8030-270-9. [Google Scholar]
  28. Księżopolski, K.; Maśloch, G.; Kotlewski, D. Energetyka odnawialna—wyzwanie dla krajów Europy Środkowo-Wschodniej. In Raport SGH i Forum Ekonomicznego 2020; pp. 29–166. ISBN 978-83-8030-386-7. Available online: https://ssl-www.sgh.waw.pl/pl/Documents/raport_sgh_2020/Raport_Krynica_2020.pdf (accessed on 6 January 2021).
  29. National Action Plan for Smart Grids. Available online: http/www.mpo.cz/assets/dokumenty/52353/60358/633375/priloha001.pdf (accessed on 14 December 2020).
  30. Pronińska, K.M. Developemet of Green Energy in Coal Based Energy Culture—Implication for Polands Energy Security. Kwart. Nauk. OAP UW e-Polit. 2013, 7, 54–75. [Google Scholar]
  31. Księżopolski, K.M. Polityka Klimatyczno-Energetyczna Polski w Latach 2014–2015; Instytut Badań nad Bezpieczeństwem, Energetyką i Klimatem: Warszawa, Poland, 2015; ISBN 978-83-944127-0-8. [Google Scholar]
  32. Księżopolski, K.M.; Wiliński, W.; Bartoszczuk, P.; Szkoła Główna Handlowa (Warszawa); Oficyna Wydawnicza. Forum Ekonomiczne Ekologia (Ekoinnowacje) w Krajach Europy Środkowo-Wschodniej na tle Globalnych Wyzwań w:Europa Środkowo-Wschodnia Wobec Globalnych Trendów: Gospodarka, Społeczeństwo i Biznes; Oficyna Wydawnicza SGH—Szkoła Główna Handlowa: Warszawa, Poland, 2019; ISBN 978-83-8030-301-0. [Google Scholar]
  33. Madariaga, A.; Allain, M. Contingent Coalitions in Environmental Policymaking: How Civil Society Organizations Influenced the Chilean Renewable Energy Boom. Policy Stud. J. 2020, 48, 672–699. [Google Scholar] [CrossRef]
  34. Boon, F.P.; Dieperink, C. Local Civil Society Based Renewable Energy Organisations in the Netherlands: Exploring the Factors That Stimulate Their Emergence and Development. Energy Policy 2014, 69, 297–307. [Google Scholar] [CrossRef]
  35. Varone, A.; Ferrari, M. Power to Liquid and Power to Gas: An Option for the German Energiewende. Renew. Sustain. Energy Rev. 2015, 45, 207–218. [Google Scholar] [CrossRef] [Green Version]
  36. Bianco, V.; Driha, O.M.; Sevilla-Jiménez, M. Effects of Renewables Deployment in the Spanish Electricity Generation Sector. Util. Policy 2019, 56, 72–81. [Google Scholar] [CrossRef]
  37. Księżopolski, K. A New Opportunty in Poland’s Energy Policy and Energy Security after the 2019 Parliamentary Elections. 2019, pp. 99–103. Available online: https://warsawinstitute.org/new-opportunty-polands-energy-policy-energy-security-2019-parliamentary-elections/ (accessed on 10 December 2020).
  38. Landis, F.; Heindl, P. Renewable Energy Targets in the Context of the EU ETS: Whom Do They Benefit Exactly? Energy J. 2019, 40. [Google Scholar] [CrossRef]
  39. Ryota Keeley, A.; Matsumoto, K.; Tanaka, K.; Sugiawan, Y.; Managi, S. The Impact of Renewable Energy Generation on the Spot Market Price in Germany: Ex-Post Analysis Using Boosting Method. Energy J. 2020, 41. [Google Scholar] [CrossRef]
  40. Traber, T.; Kemfert, C. Impacts of the German Support for Renewable Energy on Electricity Prices, Emissions, and Firms. Energy J. 2009, 30. [Google Scholar] [CrossRef]
  41. Sachs, J.D. The Ages of Globalization: Geography, Technology, and Institutions; Columbia University Press: New York, NY, USA, 2020; Available online: https://onlinelibrary.wiley.com/doi/full/10.1111/padr.12379 (accessed on 10 December 2020)ISBN 978-0-231-19374-0.
  42. Debnath, K.B.; Mourshed, M. Forecasting Methods in Energy Planning Models. Renew. Sustain. Energy Rev. 2018, 88, 297–325. [Google Scholar] [CrossRef] [Green Version]
  43. Keles, D.; Jochem, P.; McKenna, R.; Ruppert, M.; Fichtner, W. Meeting the Modeling Needs of Future Energy Systems. Energy Technol. 2017, 5, 1007–1025. [Google Scholar] [CrossRef] [Green Version]
  44. Jebaraj, S.; Iniyan, S. A Review of Energy Models. Renew. Sustain. Energy Rev. 2006, 10, 281–311. [Google Scholar] [CrossRef]
  45. Tsai, S.-B.; Xue, Y.; Zhang, J.; Chen, Q.; Liu, Y.; Zhou, J.; Dong, W. Models for Forecasting Growth Trends in Renewable Energy. Renew. Sustain. Energy Rev. 2017, 77, 1169–1178. [Google Scholar] [CrossRef]
Figure 1. Time delays between the reference and the forecast object.
Energies 14 01928 g001
Figure 2. The corelation of Poland, the Czech Republic, Hungary and Slovakia in relations to Germany variant III.
Energies 14 01928 g002
Table 1. Primary energy: Consumption [TWh].
Country2004200520062007200820092010201120122013201420152016201720182019
Czech Republic525.2517.2527.0521.1511.0489.8510.2499.0495.8486.2475.3467.1460.0480.6479.7473.7
Germany3983.23935.04031.53858.33896.73654.03807.33667.33713.63818.33657.33722.23783.33828.93733.23650.0
Hungary287.6307.3302.7297.2294.0269.6275.2273.8254.2241.5242.2254.3258.6271.3273.2275.9
Poland1040.41063.21115.61111.11130.91090.21161.81167.51132.01135.21093.01104.41153.01198.71217.51188.0
Slovakia211.9223.4215.4202.8209.1190.4202.7194.9187.2191.8178.6180.3181.1191.5188.5182.6
Table 2. Renewables: Renewable power generation—[TWh].
Countries2004200520062007200820092010201120122013201420152016201720182019
Czech Republic0.590.670.961.311.712.243.105.225.956.547.267.637.397.757.787.91
Germany36.5442.8751.6367.1572.8076.1484.23106.37121.29129.34142.94169.81169.13196.19206.78224.10
Hungary0.731.671.311.672.142.672.832.492.432.572.853.003.003.263.524.26
Poland0.991.652.253.084.456.307.9710.8114.8414.6317.6620.8520.6721.5619.6523.10
Slovakia0.030.040.400.480.520.540.691.221.371.512.022.172.272.212.221.91
Table 3. Renewable/Consumtion.
Countries2004200520062007200820092010201120122013201420152016201720182019
Czech Republic0.00110.00130.00180.00250.00340.00460.00610.01050.01200.01350.01530.01630.01610.01610.01620.0167
Germany0.00920.01090.01280.01740.01870.02080.02210.02900.03270.03390.03910.04560.04470.05120.05540.0614
Hungary0.00250.00540.00430.00560.00730.00990.01030.00910.00960.01070.01180.01180.01160.01200.01290.0154
Poland0.00100.00150.00200.00280.00390.00580.00690.00930.01310.01290.01620.01890.01790.01800.01610.0194
Slovakia0.00010.00020.00190.00240.00250.00290.00340.00630.00730.00780.01130.01210.01250.01150.01180.0104
Table 4. The delay of Poland, the Czech Republic, Hungary and Slovakia in relations to Germany (I variant).
Countrytω
Czech Republic90.0003
Hungary120.0004
Poland80.0010
Slovakia130.0003
Table 5. The delay of Poland, the Czech Republic, Hungary and Slovakia in relations to Germany (variant II).
Countries2004200520062007200820092010201120122013201420152016201720182019
Czech Republic 7778910111213
Hungary 5678991011121213
Poland 767879101211
Slovakia 101011121315
Table 6. The delay of Poland, the Czech Republic, Hungary and Slovakia in relations to Germany III variant.
YearCountries
PolandCzech RepublicHungarySlovakia
t ˜ t t ˜ t t ˜ t t ˜ t
20047.696.78.067.18.107.111.6410.6
20058.926.99.387.410.568.613.5511.5
200610.297.310.857.913.3010.315.6712.7
200713.579.614.3910.419.8615.920.7816.8
200814.499.515.3710.421.6916.722.2017.2
200916.0310.017.0311.024.7718.824.6018.6
201016.949.918.0211.026.6019.626.0319.0
201121.8613.923.3115.336.4328.433.6725.7
201224.4715.526.1217.141.6632.737.7328.7
201325.3415.327.0617.143.3933.439.0829.1
201429.0618.131.0620.150.8339.844.8733.9
201533.7321.736.0924.160.1748.252.1340.1
201633.0720.135.3922.458.8645.951.1238.1
201737.7423.740.4126.468.2054.258.3844.4
201840.7125.743.6128.674.1359.162.9948.0
201945.0029.048.2332.282.7166.769.6653.7
Table 7. The delay of Poland, the Czech Republic, Hungary and Slovakia in relations to Germany variant IV.
YearCountries
PolandCzech RepublicHungarySlovakia
t ˜ d t ˜ d t ˜ d t ˜ d
20045.214.25.384.43.142.17.786.8
20057.715.78.086.18.146.111.679.7
200610.217.210.777.813.1410.115.5612.6
200712.718.713.469.518.1414.119.4415.4
200815.2110.216.1511.223.1418.123.3318.3
200917.7111.718.8512.828.1422.127.2221.2
201020.2113.221.5414.533.1426.131.1124.1
201122.7114.724.2316.238.1430.135.0027.0
201225.2116.226.9217.943.1434.138.8929.9
201327.7117.729.6219.648.1438.142.7832.8
201430.2119.232.3121.353.1442.146.6735.7
201532.7120.735.0023.058.1446.150.5638.6
201635.2122.237.6924.763.1450.154.4441.4
201737.7123.740.3826.468.1454.158.3344.3
201840.2125.243.0828.173.1458.162.2247.2
201942.7126.745.7729.878.1462.166.1150.1
Table 8. Electricity prices for non-household entities.
Time/Countires2015-S22016-S12016-S22017-S12017-S22018-S12018-S22019-S12019-S22020-S1
European Union—27 countries (from 2020)0.08230.07930.07830.07620.07510.07750.07790.08360.07770.0811
European Union—28 countries (2013–2020)0.08610.08170.08020.07790.07650.07940.08010.08520.0799
Czech Republic0.07730.0720.07210.06770.06990.07220.07100.06460.06610.0716
Germany0.08130.07880.07930.07610.07860.07710.07800.08550.07180.0849
Hungary0.07830.07290.07190.06380.06490.07380.07370.08610.08560.0849
Poland0.08130.07620.07690.06730.06510.06480.06490.07950.06300.0800
Slovakia0.10770.10470.10670.07410.07360.07900.08190.09210.09520.0977
Source: EUROSTAT Electricity prices for non-household consumers—bi-annual data (from 2007 onwards) [NRG_PC_205].
Publisher’s Note: MDPI stays neutral with regard to jurisdictional claims in published maps and institutional affiliations.

