Article

The Influence of Opencast Lignite Mining Dehydration on Plant Production—A Methodological Study

by
Benedykt Pepliński
1,* and
Wawrzyniec Czubak
2
1
Department of Law and Enterprise Management in Agribusiness, Faculty of Economics Sciences, Poznan University of Life Sciences, 60-637 Poznan, Poland
2
Department of Economics and Economic Policy in Agribusiness, Faculty of Economics Sciences, Poznan University of Life Sciences, 60-637 Poznan, Poland
*
Author to whom correspondence should be addressed.
Energies 2021, 14(7), 1917; https://doi.org/10.3390/en14071917
Submission received: 25 February 2021 / Revised: 23 March 2021 / Accepted: 25 March 2021 / Published: 30 March 2021

Abstract

:
In many circles, brown coal continues to be viewed as a cheap source of energy, resulting in numerous investments in new opencast brown coal mines. Such a perception of brown coal energy is only possible if the external costs associated with mining and burning coal are not considered. In past studies, external cost analysis has focused on the external costs of coal burning and associated emissions. This paper focuses on the extraction phase and assesses the external costs to agriculture associated with the resulting depression cone. This paper discusses the difficulties researchers face in estimating agricultural losses resulting from the development of a depression cone due to opencast mineral extraction. In the case of brown coal, the impacts are of a geological, natural-climatic, agricultural-productive, temporal, and spatial nature and result from a multiplicity of interacting factors. Then, a methodology for counting external costs in crop production was proposed. The next section estimates the external costs of crop production arising from the operation of opencast mines in the Konin-Turek brown coal field, which is located in central Poland. The analyses conducted showed a large decrease in grain and potato yields and no effect of the depression cone on sugar beet levels. Including the estimated external costs in the cost of producing electricity from mined brown coal would significantly worsen the profitability of that production.

1. Introduction

Lignite is widely used in the generation of electricity and is considered to be an abundant resource. World reserves of low-rank coals (LRCs) such as lignite amount to 200–280 billion Mg (Gt) and account for 20–25% of global coal reserves [1,2,3,4]. With this background, the utilization of lignite for energy production is expected to remain a common practice in the decades to come since the availability of lignite is considerable in many countries of Europe and the world [5]. It is estimated that global production of lignite could increase from the present level, which is approximately 1.05 Gt [6], and reach its peak of 2–3 Gt in the second half of the 21st century [7,8]. Lignite is accumulated in fairly shallow deposits, therefore, it is most often mined in open pits, whereas in the case of hard coal, especially in Europe, underground mines are more common. In the future, new opencast mines of lignite and hard coal will be launched, especially because open-pit coal mining is perceived as a cheaper option and the one that enables using modern technologies [9]. The development of mining will still be promoted by the fairly common belief, especially among the countries with abundant lignite resources, that lignite is cheap, if not the cheapest, source of energy [10,11,12,13]. From a global perspective, lignite is considered an energy resource with substantial security of supply; no other fossil fuel is so easily available with such certainty for the next decades [1]. In the countries with abundant fossil fuel resources, exploitation of more coal deposits is carried out or scheduled; also, new coal-fired and lignite-fired power plants are being put into operation or are planned to be launched. This applies particularly to China, India, Turkey, Vietnam, Indonesia, Bangladesh, Japan, South Africa and the Philippines [14,15].
In Poland, lignite is also perceived as a cheap energy source [16,17,18,19]. This is reflected in the draft of the latest Energy Policy of Poland [20], in which three deposits with 1.8 billion tons of lignite are assumed as a long-term energy reserve. In the case of the Złoczew deposit, with resources of 611 million tons, an environmental consent decision for the proposed open-pit mine was issued on 28 March 2018. The only requirement missing to launch the open-pit mine is the exploitation concession [21].
In the context of sustainable economic development and the concept of the European Green Deal, the perception of coal—as a cheap energy source—is only possible if the external costs of mining and combustion of coal are not taken into account. Those costs have been the subject of many analyses over the past years. One of the first attempts to value the external effects of energy consumption was made by Hohmeyer in 1988 [22]. The works by Rowe et al. [23] and Lee et al. [24] called the RFF/ORNL research, are recognized as the first comprehensive elaborations on the external costs in a fuel cycle. They focused on the entire fuel cycle of different kinds of power plants. In 1999, Krewitt et al. [25] used the bottom-up method to determine the average external costs connected with the generation of energy in the mines in Germany and Europe. The authors used the EcoSense model which originates from the ExternE methodology, as well as the CORINAR database (Core Inventory Air Emissions) [4]. They focus on the external costs associated with the combustion of coal. For example, the ExternE Model with EcoSense software package provides air quality and impact assessment models along with a database (population, use of land, agricultural production, buildings, and materials, etc.) that contains relevant input data for the whole of Europe [26]. The model determines a range of factors affecting human health, buildings, biodiversity, and crop yields using concentration-response functions, e.g., to SO2, NOx and their aerosols, heavy metals, and solid particles (PM2.5, PM10) [27,28,29,30].
Despite the claims that external costs of energy production have been comprehensively estimated, no analyses of external costs caused by geological damage have been performed so far [31]. There are also no studies that analyze the external costs in agriculture and forestry caused by a cone of depression, which is created as a result of draining coal deposits during their exploitation. Additionally, in the review of 20 different external cost analyses from various regions of the world, no study took account of the external costs incurred by agriculture, which may provide evidence of the above. There are only a few on the losses caused by refraining from farming as a result of the land being taken over by open-pit mines and power plants along with their supporting facilities [22,32]. Thus, there is no reflection on the full spectrum of impact, which is required to assess the sustainability of development and the European Green Deal. This study is an attempt to fill that knowledge gap and to start a discussion on the methodology of calculating agricultural external costs associated with the existing cones of depression created around open pits. In the first papers related to this subject [33,34,35], there were many simplifications made regarding the level of yield decline, i.e., the same level of yield decline was assumed for the entire period of the impact of open casts. By using only one period for estimating the external cost of a fall in yields, there is a risk of a significant over- or underestimation of external costs. Furthermore it was calculated by comparing the yield levels in the Wielkopolskie Voivodship before the launch of the open-cast mine, however, 30 years later, in the eastern part of the Wielkopolskie Voivodship, a multi-pit lignite open-cast mine is now operational. This makes it possible to maintain the condition of comparability of factors influencing the level of yields based on the vicinities being compared [33,34,35].
The problem of exploiting more deposits is also important in the context of the law of entropy discussed by Georgescu-Roegen, who stated that energy tends to degrade irreversibly to increasingly poorer qualities, i.e., from low entropy for valuable natural resources to high entropy for worthless waste and pollution. He argued that the use of exhaustible resources would result in the inevitable collapse of the world economy, leading to human extinction [36].
The study aims to assess the assumptions and methodology used to estimate the external costs in agricultural crop production located in the vicinity of open-cast lignite mines and the costs associated with the cones of depression created around the opencast pits. In the context of the above-mentioned generalizations, simplifications or the omission of agricultural external costs can achieve only results of a scientific and research novelty. In the study, an exemplary analysis is performed for the Konin-Turek lignite basin located in central Poland. The obtained research results apply to Polish conditions, however, the scientific universality of the study allows that the assumptions and methodology applied here can be adapted to the analysis of external costs incurred by agriculture in any region of the world and for any large-scale open-cast mines.

2. External Costs in Agriculture and the Difficulties Associated with Their Estimation

The variety of sources from which energy can be generated requires the knowledge of the actual production costs that make it possible to properly allocate the resources owned. Therefore, to make proper comparisons, it is necessary to take into account all types of expenses, not only investment, fuel, maintenance, and operation costs of the power plants, but most importantly, the external costs of electricity generation [37,38]. External costs are those incurred by third parties and future generations to produce energy, rather than the expenditures of direct recipients and providers of electricity [39,40]. Incorporating those costs in electricity market prices would contribute to the use of more modern and cleaner energy sources [28,41,42], while the most harmful technologies would be the first ones to be forced out of the market.
In the case of electricity generation from black coal and lignite, apart from the well-researched external costs associated with coal combustion and air pollution, in particular, the costs related to human health [43], there are also external costs associated with the exploitation operations and land reclamation after coal mining, in both underground and open-pit mines [44].
Open-cast mining is associated with the absolute and long-term necessity to drain the coal deposits to the bottom of the lowest levels of the exploited coal seams, which leads to the creation of the above-mentioned cones of depression. There are two types of cones of depression: discharge cone of depression and pressure relief cone of depression. The first one is a gravitational lowering of the groundwater table (the most critical issue in agriculture and forestry) within the area surrounding the coal deposits. In a vertical cross-section, the shape of the cone of depression resembles a funnel-shaped curve, i.e., the water table near the edge of the pit rapidly rises and it goes up more slowly as the distance grows. The Polish law requires the investor to define the estimated area around the open-pit mine where the water table will permanently be lowered by at least one meter creating an area of depressions. In the case of lignite open-cast mines, the range of the cone of depression usually varies from a few to several kilometers, starting from the edge of the open pit, and it has the shape of an ellipse. The actual impact area, i.e., the area where the water table is lowered down, is much larger and reaches up to several dozen kilometers, starting from the edge of the open pit.
In turn, the pressure relief cone of depression, which is much larger than the area of depressions, is the territory where groundwater pressure is reduced. The changes in water pressure in deeper aquifers caused by hydrogeological cracks can lower the groundwater and surface water levels because it triggers a local outflow of water to deeper ground layers, it can also reduce or generate a loss of supply of subsoil resources with water from deeper aquifers [45,46].
Various difficulties that researchers face when estimating the losses in agriculture due to the development of cones of depression as a result of open-cast mining of minerals—lignite in this case—are of geological, nature-climatic, agro-industrial, temporal-spatial nature and result mainly from the multiplicity of interactive factors. Those factors have an impact on one another and are also interdependent in many ways.
The geological factors are related to the size of the cone of depression and the changes in the water levels of subsurface water resources, which is very important in the case of agriculture. Not only the size and extent of the drainage is a crucial issue but also the pace of restoring water conditions after the drainage of the deposit is completed. The key geological factors include:
  • Drainage depth—with the increase of the depth of the open pit, the area of a cone of depression becomes larger,
  • Drainage period—with the increase of the drainage time, the area of a cone of depression also increases,
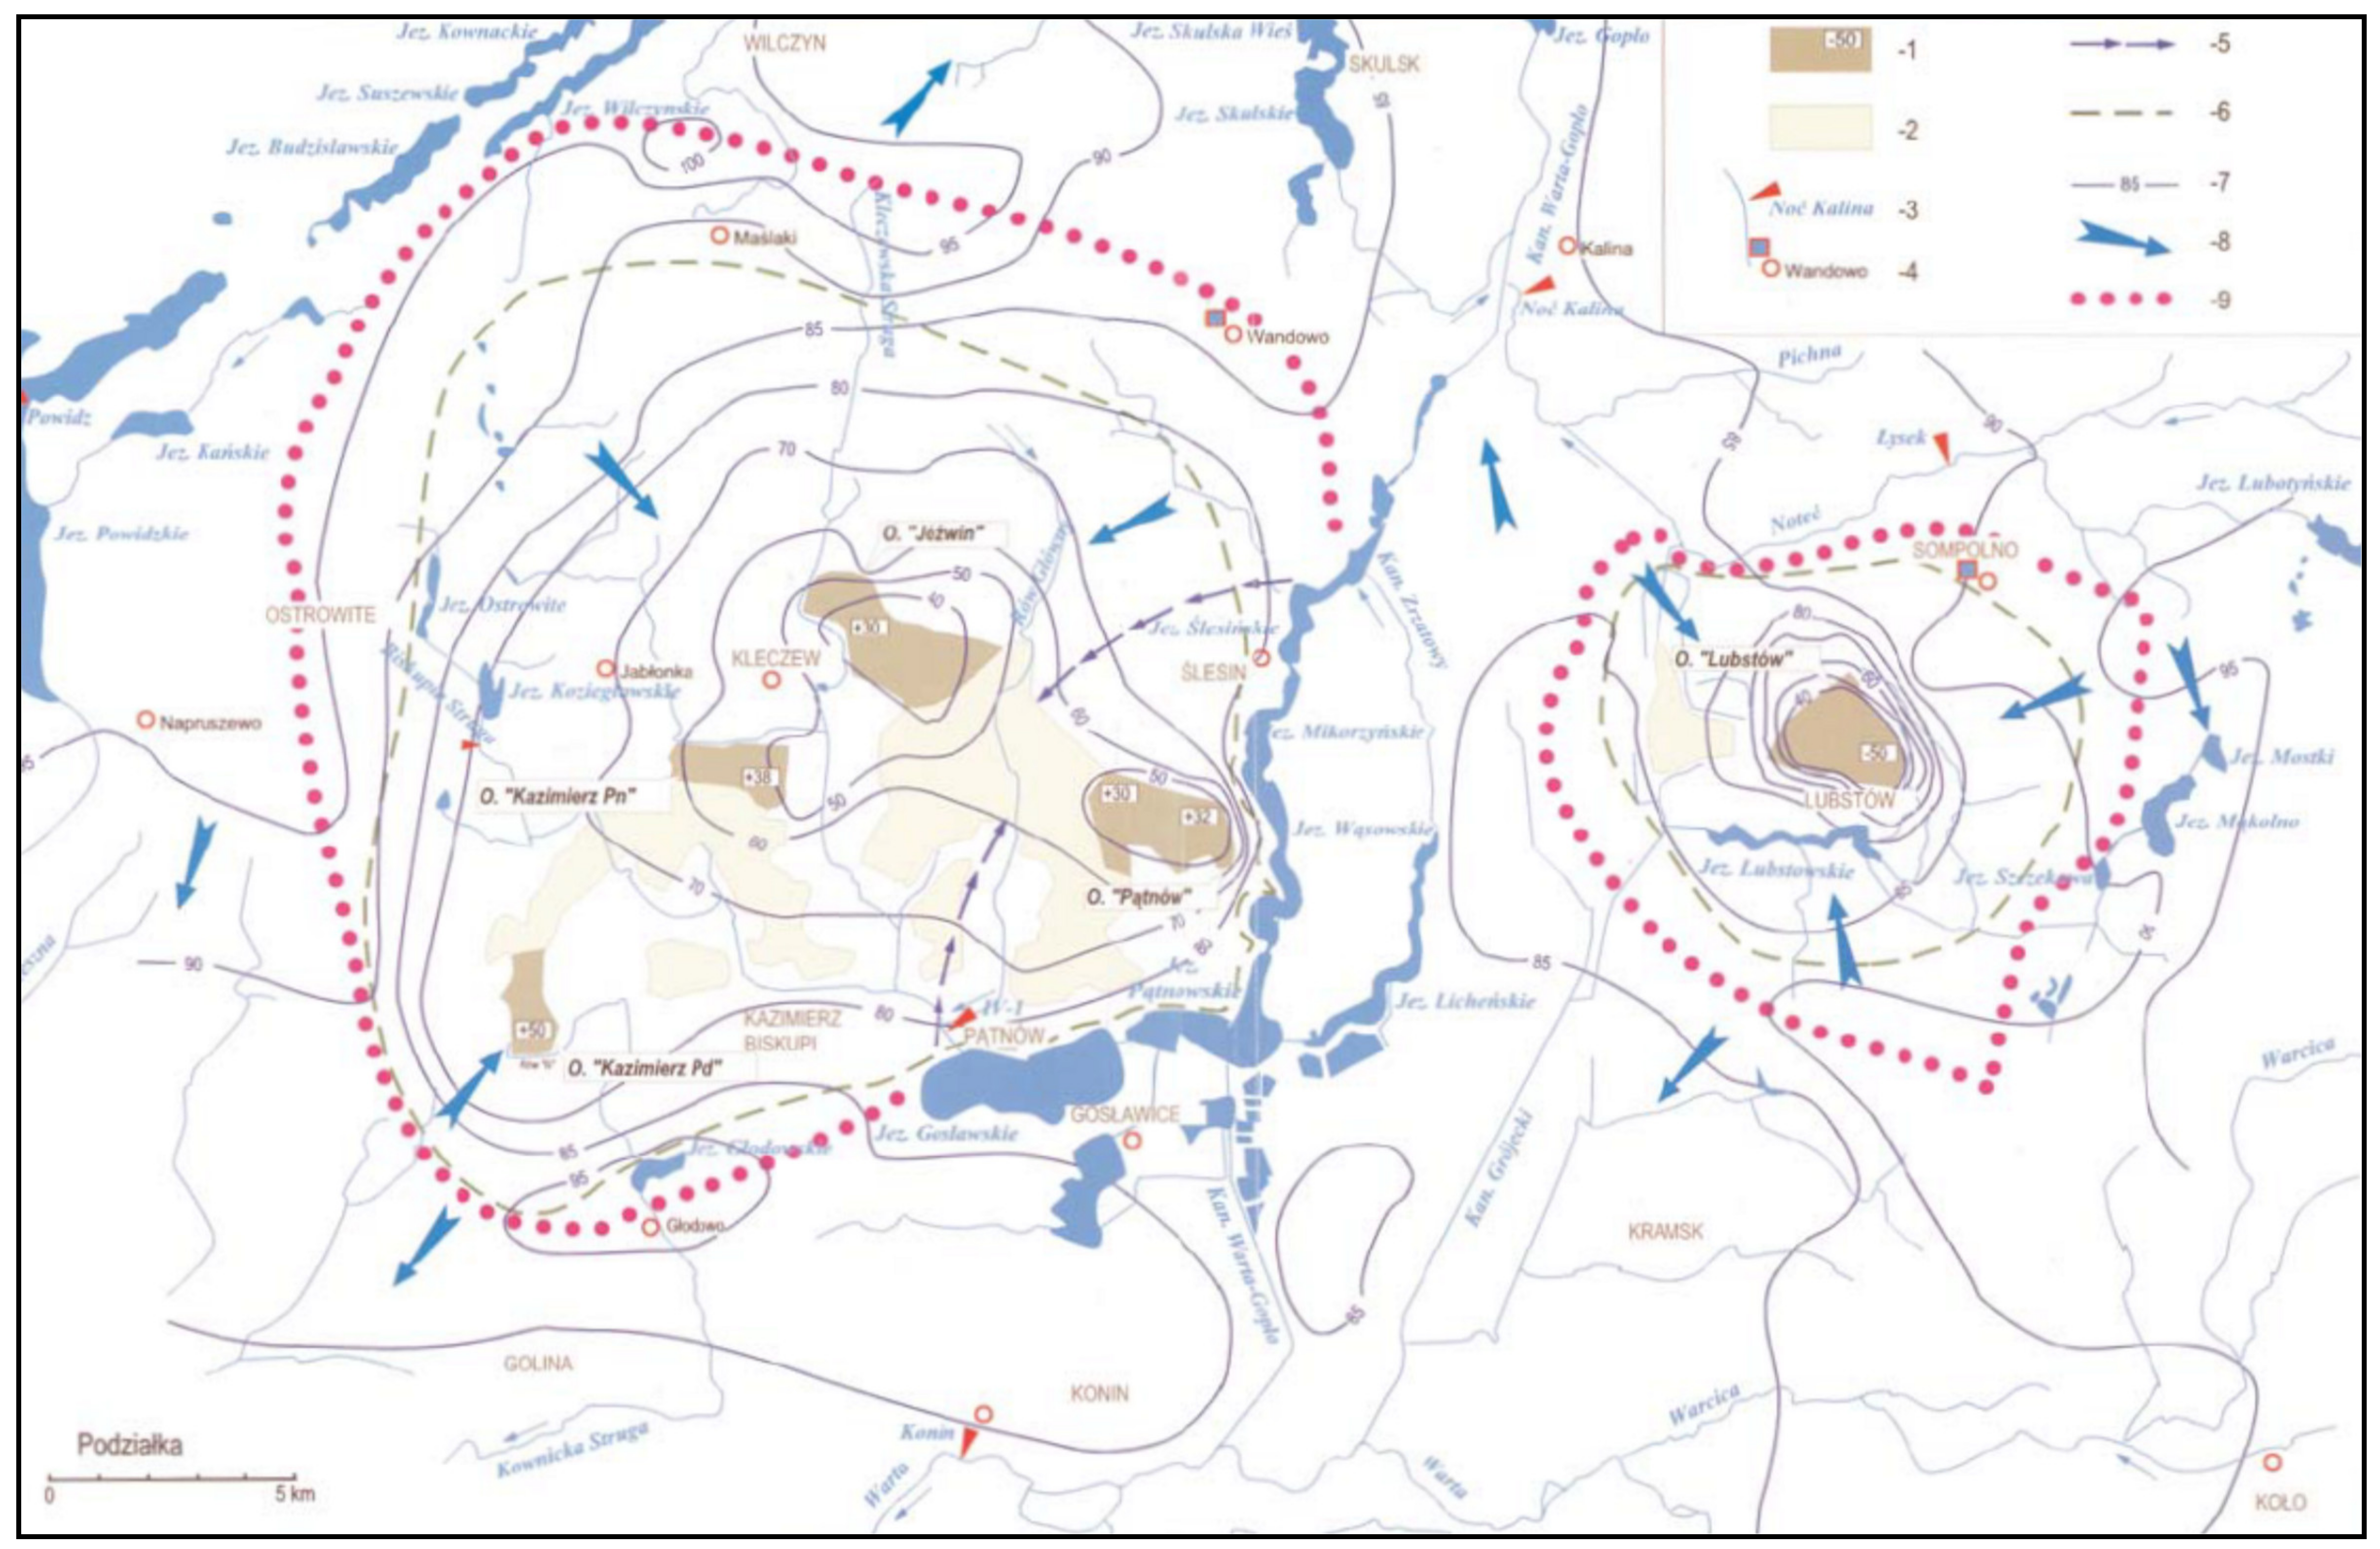
  • Location of the opencast in the catchment area, its size and the directions of inflow of groundwater—in simplified terms, if the open-pit mine is situated in a valley, the drained area increases but the water relations are restored faster. The location of an open-cast mine on a water parting reduces the drainage area, however it is much more difficult and it takes longer for the water level to get restored after the drainage is completed because the runoff of water from the areas situated higher up is restricted,
  • The geological structure of drained areas such as the shape and the direction of buried valleys, abundance in water, tectonic faults, hydrogeological cracks, the thickness of geological layers which affect the conditions of supply, circulation, and drainage of groundwater—those factors are very specific for every open cast, however, the location of thicker and impermeable layers closer to the surface reduces the risk and the area of drainage of subsurface and surface water resources,
  • The amount of rainfall and surface water supply—with the increase of the abundance of rain and the level of subsurface water, the impact of the mine on the areas located further away from the open cast decreases. The increase in the share of drained agricultural land reduces the permeation of water into deeper soil layers, especially in the period from late autumn to early spring. High variability of the level of precipitation, both seasonal and during individual years, affects the changes in the level of groundwater, which makes it difficult to determine the actual impact of open-pit mines on water conditions,
  • Local conditions, e.g., impermeable formations that create areas of the perched water table, hydrogeological cracks that lower the level of subsurface water below the standard level of the area,
  • The initial (primary) level of groundwater, which in the case of peripheral areas of the impact land means that the mine will affect the areas with higher water levels while it will not have any influence on the surrounding areas with lower water tables, even those located further away.
In the case of open-pit mines, where there is usually a shift of the mining front and the already exploited areas of the open pit are backfilled, there is also a shift of the area of cones of depression. The dynamics of these changes mean that despite the use of more advanced econometric models, taking into account the actual conditions of the mining industry’s impact on the environment, the range of a cone of depression cannot be determined [47]. Therefore, already at the very beginning of the research, there is a large obstacle that makes it difficult to estimate losses in agriculture resulting from the operation of open-pit mines.
Consequently, the amount of water that is pumped out of individual open pits varies considerably. In the case of lignite open-pit mines in Germany, an average of 6.3 m3 of water is pumped out along with each ton of coal [48]. In Poland, over the period from 1945 to 2017, an average of 6.8 m3 of water was pumped out per 1 ton of mined lignite, but in the second decade of the 21st century, this ratio was nearly 8.0 m3, on average [16,18]. There were, however, large discrepancies between individual coal deposits. In the case of small deposits in the Konin-Turek Basin, the ratio exceeded 42 m3 of water/Mg of coal, and regarding the deposits in Turów, it was 2.2 m3 of water/Mg of coal [16].
The agro-industrial factors are also highly changeable. In the context of the studied subject, precipitation is particularly important and, as mentioned above, it is a major source of groundwater supply. Precipitation is also one of the most important factors that determine crop yield [49,50]. It is not only the overall amount of precipitation that is important but also its distribution over time, especially during the growing season. There are certain temperatures, a range of which in a given place and during a particular period is quite predictable, which is also important. In general, the observed systematic increase in global temperatures has a negative impact on agriculture. Firstly, it increases evaporation which reduces the amount of rainwater available to crops and in deeper soil layers which leads to lowering the groundwater level and consequently creates the risk of soil drought. Secondly, it causes a decrease in the agricultural efficiency of precipitation [51,52]. This efficiency is also deteriorated by a change in the nature of precipitation—from continuous to convectional rain, [53,54,55] and an increase in torrential rains. In the research conducted for Germany, for instance, it was estimated that every time temperature increased by 1 degree, the amount of heavy rain increased by 6.5% [56]. All of the above, in turn, lead to an increase in the dependence of crops on the level of groundwater [57,58]. However, in cooler regions such as northern Europe, climate change can have a positive impact on the yield mainly by extending the growing season [59,60].
Agro-industrial difficulties stem from, first of all, the biological nature of open space production, which is affected by many factors. Those, in turn, influence the final result, i.e., the crop the farmer wants to harvest. From the point of view of the analyzed subject, the nature-climatic factors that should be mentioned include the amount and distribution of precipitation (including snow cover), temperature distribution, groundwater levels, types and quality of soil, the topography of the land, and the length of the growing season. There are also economic factors which include, e.g., the level of agricultural development, agrarian structure, production intensity, availability of techniques and technologies, and quality of human capital [61].
Launching a new open-cast mine and lowering of groundwater level leads to a change in the conditions of production, which also affects the abundance of the yield. Sensitivity to water deficit is related to the type of crop plants [62] and the potential yield [63,64]. However, as has been indicated by numerous studies on the impact of groundwater levels on crop yield, it is difficult to estimate the extent of production losses caused by reduced water availability. Vereecken et al. [65] for instance, state that the impact of soil texture on groundwater is highly nonlinear, that is why simple texture-yield dependence is difficult to assess and understand. This is further complicated by the fact that soils with the same textural parameters can have drastically different structures and therefore water retention behaviors due to the variability in soil compaction, organic content, or aggregation [61,66]. In other studies, the key role of groundwater during dry periods is pointed out, which, if available, can account for 50–100% of total water use in the case of many crops [57,67,68,69,70,71,72,73]. Since the amount of used water grows in direct proportion to the increase in yield [74], in the areas of high yield where there has been a substantial reduction in the water table, crop losses will be significant, especially during the years of lower than average rainfall. The difficulties in estimating the losses are further complicated by the fact that in different parts of the same field or at different times during the growing season, depending on local conditions, differences in yield loss can vary considerably.
Additionally, the shortage of data and the difficulty in measuring and analyzing the data on groundwater and soil texture makes it necessary to use, for many studies, topographic features instead, such as the gradient of the slope or the elevation above sea level, which can cause discrepancies in the obtained results such as permanent fluctuations in yield within the same field [61,75,76,77]. Again, in this case, assessing the impact of changing groundwater levels on the yield is difficult because despite a fairly large number of groundwater level monitoring instruments located within the area of an open-pit it is possible to observe the trends only for a specific spot.
A significant challenge in the process of valuing the external costs of agriculture associated with open-pit mining is time. This is primarily related to the period of several decades that is required to design and launch an open-pit mine, the exploitation and the restoration of water relations.
Designing a large open-cast mining plant is a multifaceted, complicated, and time-consuming process [78]. In the case of the Tagebau Garzweiler lignite opencast mine in the Rhineland basin, it took 30 years from the decision to start a preparatory work until the proverbial “first shovel” hit the ground [35]. The process of de-watering begins with the construction of an access trench and, depending on its depth and width, it usually starts several years before the commencement of extraction of the raw material of the deposit. The main factor that determines the period of mining of deposits is the volume of the resources to be extracted and the demand for that raw material. Once the process of mining is complete, the reclamation process begins. In the majority of cases of open-pits, in the lowest parts of the excavation, water reclamation is most popular and it involves flooding the area and creating a water reservoir. The remaining area is covered with forests or it undergoes a process of recreational reclamation. Agricultural reclamation is not performed by many countries or it is implemented to a small extent because it is expensive. Farming on the reclaimed land can only be successful if the texture of topsoil is maintained based on scientific standards [79]. Moreover, the restoration of fully balanced and productive soils is a rather difficult task that lasts several decades [80]. The reclaimed areas, that represent a group of urban soils, often differ significantly from naturally formed soils in terms of many properties: lack of accumulation potential, low content of nutrients, yield instability, which makes them economically unattractive for farmers for many years [33,81,82]. In Poland, out of the three lignite basins, land reclamation is performed only in the Konin-Turek one, what is more, the share of land reclamation towards agriculture is decreasing over the subsequent years [83,84]. More and more often, industrial parks, and recently also photovoltaic power stations, are created in reclaimed post-mining areas to mitigate the social consequences of mining activities [81]. An example here is the activities of ZE PAK SA (Power Plant Group Pątnów-Adamów-Konin joint-stock company), which, in August 2021, plans to launch a 70 MWp solar farm on the reclaimed area of the Koźmin mine [85].
The process of restoring water conditions in the areas affected by a cone of depression is long and depends on many factors. Though it is one of the most important components in groundwater studies, recharge is also one of the least understood, largely because recharge rates vary widely in space and time, and rates are difficult to directly measure [86,87]. In the case of Polish lignite open-pit mines, it is estimated that the process of restoring water conditions will be equal to, and sometimes even longer than, the time it took to drain the coal bed [88]. This requires estimating the external costs in agriculture over several dozen or even 100s of years. It is also important to be aware that the full restoration of water relations in the majority of open pits will never be possible. This is related to water reclamation of the lowest-lying parts of excavation, where the water table level can be located several dozen meters below the original ground level, which is typical in the case of most open pits.
Over such a long period, huge changes take place, not only in the crop yield, which is the result of technological modifications (i.e., management practices and crop varieties) and meteorological (mainly precipitation, its structure and temperature, which is particularly important in drought-prone areas). There are also changes in the amount of agricultural land and its structure, the structure of sown areas, prices of crop raw materials and means of production, time value of money, and the volume of livestock production, which may, to a greater or lesser extent, determine the demand for fodder and the share of crop production intended for sale.
Launching an open-cast mine and the decrease in the yield caused by the impact of the mine on water resources leads to a decline in the profits of the farms operating in this area. Over time, the mine has an increasing impact on the investment capacity of those farms, which leads to large discrepancies in the level of agricultural development compared to the neighboring areas, to gradual resignation from keeping livestock and running agricultural production. In extreme cases, it can lead to a local collapse of agriculture and related industries (pre- and post-production). An example here may be the midwestern regions of the United States, [89] or the intensively irrigated North China Plain [90] and Syria [91], where agriculture has collapsed over vast areas due to overexploitation of groundwater resources.
The main reasons for spatial differences in the crop yield are technological changes (i.e., management practices and variations), meteorological factors (mainly precipitation in the areas of dry farming), types of soil and the amount of stored groundwater available to crops, and interactions among all the above-mentioned factors [92,93].

3. Materials and Methods

Calculations of external costs may be carried out at different points in the life cycle of a mining project. The optimal time is the period when a decision is being made whether to conduct (or not conduct) the mining of a given deposit as it makes it possible to estimate the actual cost of the project, not only for the entrepreneur, but also with regard to the environment, and abandon projects that do not increase the welfare of the whole society.
In order to fulfil Georgescu-Roegen’s principle of absolute totality [36] for the processes associated with opencast lignite mining, it is necessary to determine the temporal and spatial extent of the impact of the opencast in three areas: coal extraction, the impact of the depression funnel created in the coal mining process on agriculture, and the impact on the rest of nature, including humans. In this study, only the second area will be analyzed.
When calculating the full external cost associated with open-pit mining of raw materials for agriculture, external costs stemming from the following must be taken into consideration:
  • Use of agricultural land for an open pit, an external dump, and the necessary accompanying infrastructure, e.g., a power plant, conveyor belts, access roads, etc. (the term “open pit area” will be also used later in this paper),
  • The occurrence of areas with lowered groundwater level (the term “cone of depression area” will be also used later in the paper),
  • Changes in animal populations in the area impacted by the open pit (it will not be analyzed in this paper).
When calculating the external costs in crop production, one must take into account the fact that in the case of larger deposits, the exploitation of which lasts from around a dozen to several dozen years, the exclusion of land from agricultural production is gradual. For this reason, it is necessary to calculate the average agricultural area excluded from agricultural production, which can be done using the following formula:
A o A L = i = 1 n A c 1 × S 100 + A c 2 × S 100 + + A c n × S 100 t
where:
  • AoAL—stands for the average area of agricultural land excluded from agricultural production in the area of the open-pit mine (ha AL),
  • Ac—stands for the surface allocated for the open-pit mine, the external dump, and the necessary infrastructure, in particular years (ha),
  • S—stands for the share of agricultural land in the total area of the analyzed territory (%),
  • t—stands for the period of the impact of the open-pit mine, covering the period from the first exclusion of agricultural land until the completion of reclamation, or the entire period of the open-pit mine exerting its impact (years).
If the level of average exclusion of grounds for the open-pit mine is known, the average area of agricultural land excluded from agricultural production can be calculated from the formula:
A o A L = A c t × E A L S 100 ,
where
  • Act—stands for total surface allocated for the open-pit mine, the external dump, and the necessary infrastructure (ha),
  • EAL—is an indicator of the average exclusion of area for open-pit mining (%).
The information on the rate at which areas are being taken up by the open-pit mine is usually provided by the investor, or the indicator for similar open-cast mines can also be used. In the case of smaller open-pit mines and a shorter mining time, the indicators will be higher and will oscillate around 80–90%; in the case of larger open-pit mines with longer mining time, they may reach approx. 60% [34,94].
The external costs for the agriculture located in the area of the open-pit mine, the external dump, and the necessary infrastructure can be calculated from the formula:
E c o = i = 1 n A o A L × S p i 100 × Y o i xt × p i × P i ,
where
  • Eco—stands for the external cost in the area of the open-pit mine, the external dump, and the necessary infrastructure ($, €),
  • Spi—stands for the average share of the i-th crop in the structure of agricultural land (%),
  • Yoi—stands for the yield of the i-th crop in the area of the open-pit mine (t × ha−1),
  • pi—stands for the average selling price of the i-th crop ($, € × t−1),
  • Pi—stands for the profitability of the production of the i-th crop (%). The average profitability of the whole crop production can also be used in the calculations, but in such a case, it is necessary to use this value for all analyzed crops.
In the case of calculating external costs in the cone of depression area, the first step should also be to determine the average area of the cone of depression. At the initial stage, when drainage of the open-pit mine is commenced, the cone of depression develops; subsequently, together with the movement of the mining front and the storage of the mined part of the open-pit, the cone of depression moves as well, and after the completion of the drainage, water relationships, as well as the area of the cone of depression, are slowly restored. The average area of farmland within the cone of depression area can be calculated from the following formula:
A d A L = i = 1 n A f 1   ×   S 100 + A f 2   ×   S 100 + + A f n   ×   S 100 t ,
where
  • AdAL—stands for the average area of agricultural land (UR) within the area of the cone of depression (ha UR),
  • Af—stands for the area of the cone of depression in subsequent years.
Due to the fact that it is virtually impossible to realistically determine the area of the cone of depression in particular years, it is necessary to include the estimates of an average cone of depression area, which are uncertain.
External costs within the area of the cone of depression can be calculated from the following formula:
E c f = i = 1 n A d A L × S f i 100 × Y f i × t × p i × P i c l i 100 ,
where
  • Ecf—stands for the external cost in the area of the cone of depression,
  • Sfi—stands for the share of the i-th crop in the structure of agricultural land in the area of the cone of depression (%),
  • Yfi—stands for the yield of the i-th crop in the area of the cone of depression, in the period where the cone of depression does not exert impact (t × ha−1),
  • Cli—stands for the estimated average loss of yield for i-th crop (%). For crops where it is not possible to estimate losses, one may use an average weighted level of losses, calculated from losses incurred in crops for which the parameter is known. The average loss in yield for the entire crop production can also be used in calculations, but in such a case, it is recommended that the value be used for all analyzed crops. The amount of lost yield when calculations are based on the level of yield that does not take into account decreased yield due to the cone of depression (mainly ex-ante analyses) can be calculated from the following formula:
    C l i = 100 Y f d i Y f i 100
When calculations are based on the level of yield taking into account lower yields due to the cone of depression (mainly ex-post analyses), the following formula can be used:
C l i = Y f i Y f d i × 100 100 ,
where
  • Yfdi—stands for the yield of the i-th crop in the area of the cone of depression, in the period where the cone of depression exerts impact.
In the case of crops for which there are no data on yields, marketing prices, and/or prices of production profitability, one may calculate the value of external costs for crops for which full data are available, and estimate the external cost for other crops with the use of the following formula:
E c o = i = 1 n A d A L × s f o 100 × V × t × P i × C l i 100 ,
where
  • Eco—stands for the external cost in the area of the cone of depression,
  • Sfo—stands for the average share of other crops in the structure of agricultural land (%),
  • V—the average value of crop production sales ($, € × ha−1).
A practical simplification that allows omitting the process of estimating the area of a depression funnel is to use statistical data available for administrative units, e.g., counties or regions. In this case, the estimated yield losses will show the average yield loss for the administrative units concerned, i.e., both the areas most affected by the depression funnel and the areas with smaller or even no impact. However, care should be taken to ensure that the proportion of areas not affected by the impact of open pits is as small as possible. In this case, the AdAL area will cover farmland within these administrative units.
The total Ec external costs constitute the sum of the costs from the area of the open-pit mine and the cone of depression:
E c = E c o + E c i
Both in the area of the open-pit mine and in the area of the cone of depression, the average cultivation area of individual crops can be calculated using the structure of sown areas in the analyzed territory in the period preceding the analysis. Alternatively, one may take into account the trends into the structure of sown areas from a longer period of time, however, it is not certain whether the trends will continue as the structure of sown area constitutes a response to changes in the profitability of particular crops.
Proper determination of the level of yield is important in the context of cost estimation. In recent decades, the development of crop cultivation (which is providing increasingly prolific types of cultivated crops), crop technology, as well as an increase in the level of mineral fertilization and the development of technological advice, have contributed to a significant increase in the level of yields in most regions of the world. However, there are very large regional differences.
In countries with a high level of yields the possibilities of their further development are already quite limited, especially in the context of the tendency to limit the use of mineral fertilizers (especially yield-forming nitrogen fertilizers) and reduce the use of plant protection products. It particularly pertains to EU countries in which, according to the latest plans of the European Commission, the use of mineral fertilizers and pesticides is to be reduced by 2030, and the use of the most dangerous pesticides is to be reduced by half [95]. It seems reasonable to use the current level of yields in calculations concerning countries of Western Europe.
However, in countries and regions where yields are poor (especially in comparison with countries characterized by similar natural and climatic conditions with the highest average yield), it is reasonable to prepare a yield forecast. To this end, one may use trends in the level of yielding of the most important crops cultivated in the area of the open-pit mine, for which the external costs are estimated. If the period of the impact of the open-mine pit is estimated for, e.g., 60 years, it is reasonable to include in the forecast the increase in yields from half of the period, that is the changes in yields from the last 30 years. A comparative analysis based on the method of spatio-temporal analogy of agricultural development can also be performed by simulating the development of agriculture in the open pit region on the example of agricultural development in a country with similar natural and climatic conditions. Considering country “X”, which 30 years earlier was at the level of agricultural development close to the current level of agricultural development in the open pit area, it can be assumed that in 30 years, the assessed region will achieve production results similar to those currently present in country X. The average results from three variants can also be taken into account: the current yield level, the yield level estimated based on the trends, or the level based on spatio-temporal analysis [35].
To avoid overestimations and underestimations associated with long-term price forecasting, it seems optimal to include current prices in the calculation, using average prices from the last 3–5 years or from a period corresponding to the length of the price cycle for a given product, e.g., 4 years, which corresponds to the length of the pork cycle and the length of the cycle in the grain market [96].
The profitability of agricultural production, which is strongly correlated with purchase prices, can be estimated similarly. It is also justified to take into account the fixed costs for the profit generated on farms, as reducing the scale of production will cause a deterioration in the use of the existing fixed assets, and to adjust it to the reduced scale of production takes a long time. Taking Polish conditions into account, it is reasonable to assume the profitability level adjusted for fixed costs at 25% [35].
The last factor, but at the same time the most important one, taken into account when estimating external costs caused by the cone of depression created during opencast mining, is the decrease in the crop yield. Since the analysis of the external costs of a given open-cast mine should be performed before the commencement of the operation, it seems optimal to conduct an external cost analysis based on the studies conducted for the mines which are already closed and reclaimed or several dozen years old, where the negative effects of the cone of depression have already fully developed. In Poland, this criterion is best met by the Konin-Turek lignite basin, where large-scale mining began in 1955 and is due to be completed by 2030. As the level of the yield in individual years is characterized by a high dependence on weather conditions, primarily on rainfall, the amount and distribution of which may significantly differ between various regions and over individual years, therefore, to reduce the level of variability of the yield conditioned by weather factors, it is advisable to adopt averaging, e.g., of 5 years, which was also done for the analyses of this study.
Due to the multitude of interacting factors affecting the decrease in the level of the yield as a result of the occurrence of the cone of depression, the estimation of the losses based on the level of the yield obtained only in the area of the impact of open-cast mines is associated with high uncertainty. Therefore, a comparative analysis of the crops of grain, sugar beet, and potatoes in the area of the influence of an open pit and the yields of those crops obtained in neighboring areas will be conducted. The choice of those particular crops was dictated by their dominant role in the sown areas. Furthermore, the above-mentioned crops can be considered indicative in the context of estimating the dependency of the yield on lowering of groundwater table, as they differ in: root system, soil requirements, and demand for water during the growing season. The analysis will be conducted in two ways. First, an analysis of the yield at the voivodship level will be performed (in the analysis conducted for this work, the administrative division will be used which was in force in the years 1975–1998, when Poland was divided into 49 voivodships). The time range for this scenario will be 1956–1997. Because over the years 1956–1974, in Poland, there was a three-tier administrative division in force (voivodships—regions, poviats—districts, and gminas—local authorities), it was necessary to calculate the average yield in the area corresponding to the area of voivodships for the division in the period 1975–1998, based on the data on individual powiats. To assess the yield of a certain voivodship, poviats were taken into account, which, in 1975, were part of a given voivodeship; the weighted mean was calculated. Second, an analysis at the district level will be conducted, however, due to data availability, it will cover only the years 1960–1973. Despite the short period of the analysis, it allows determining whether, and to what extent, the decrease in the yield in the immediate vicinity of the open pit is different from the areas located further away, and it helps to assess the range of an impact of the open-cast mine.
For the above-mentioned analyses, Statistics Poland data was used, such as Statistical Yearbook of Voivodships, Statistical Yearbook of the Regions, etc. [97,98,99,100,101,102,103,104,105,106,107]. To determine the impact of multi-pit lignite mining on the level of the yield, the districts were divided into 5 groups:
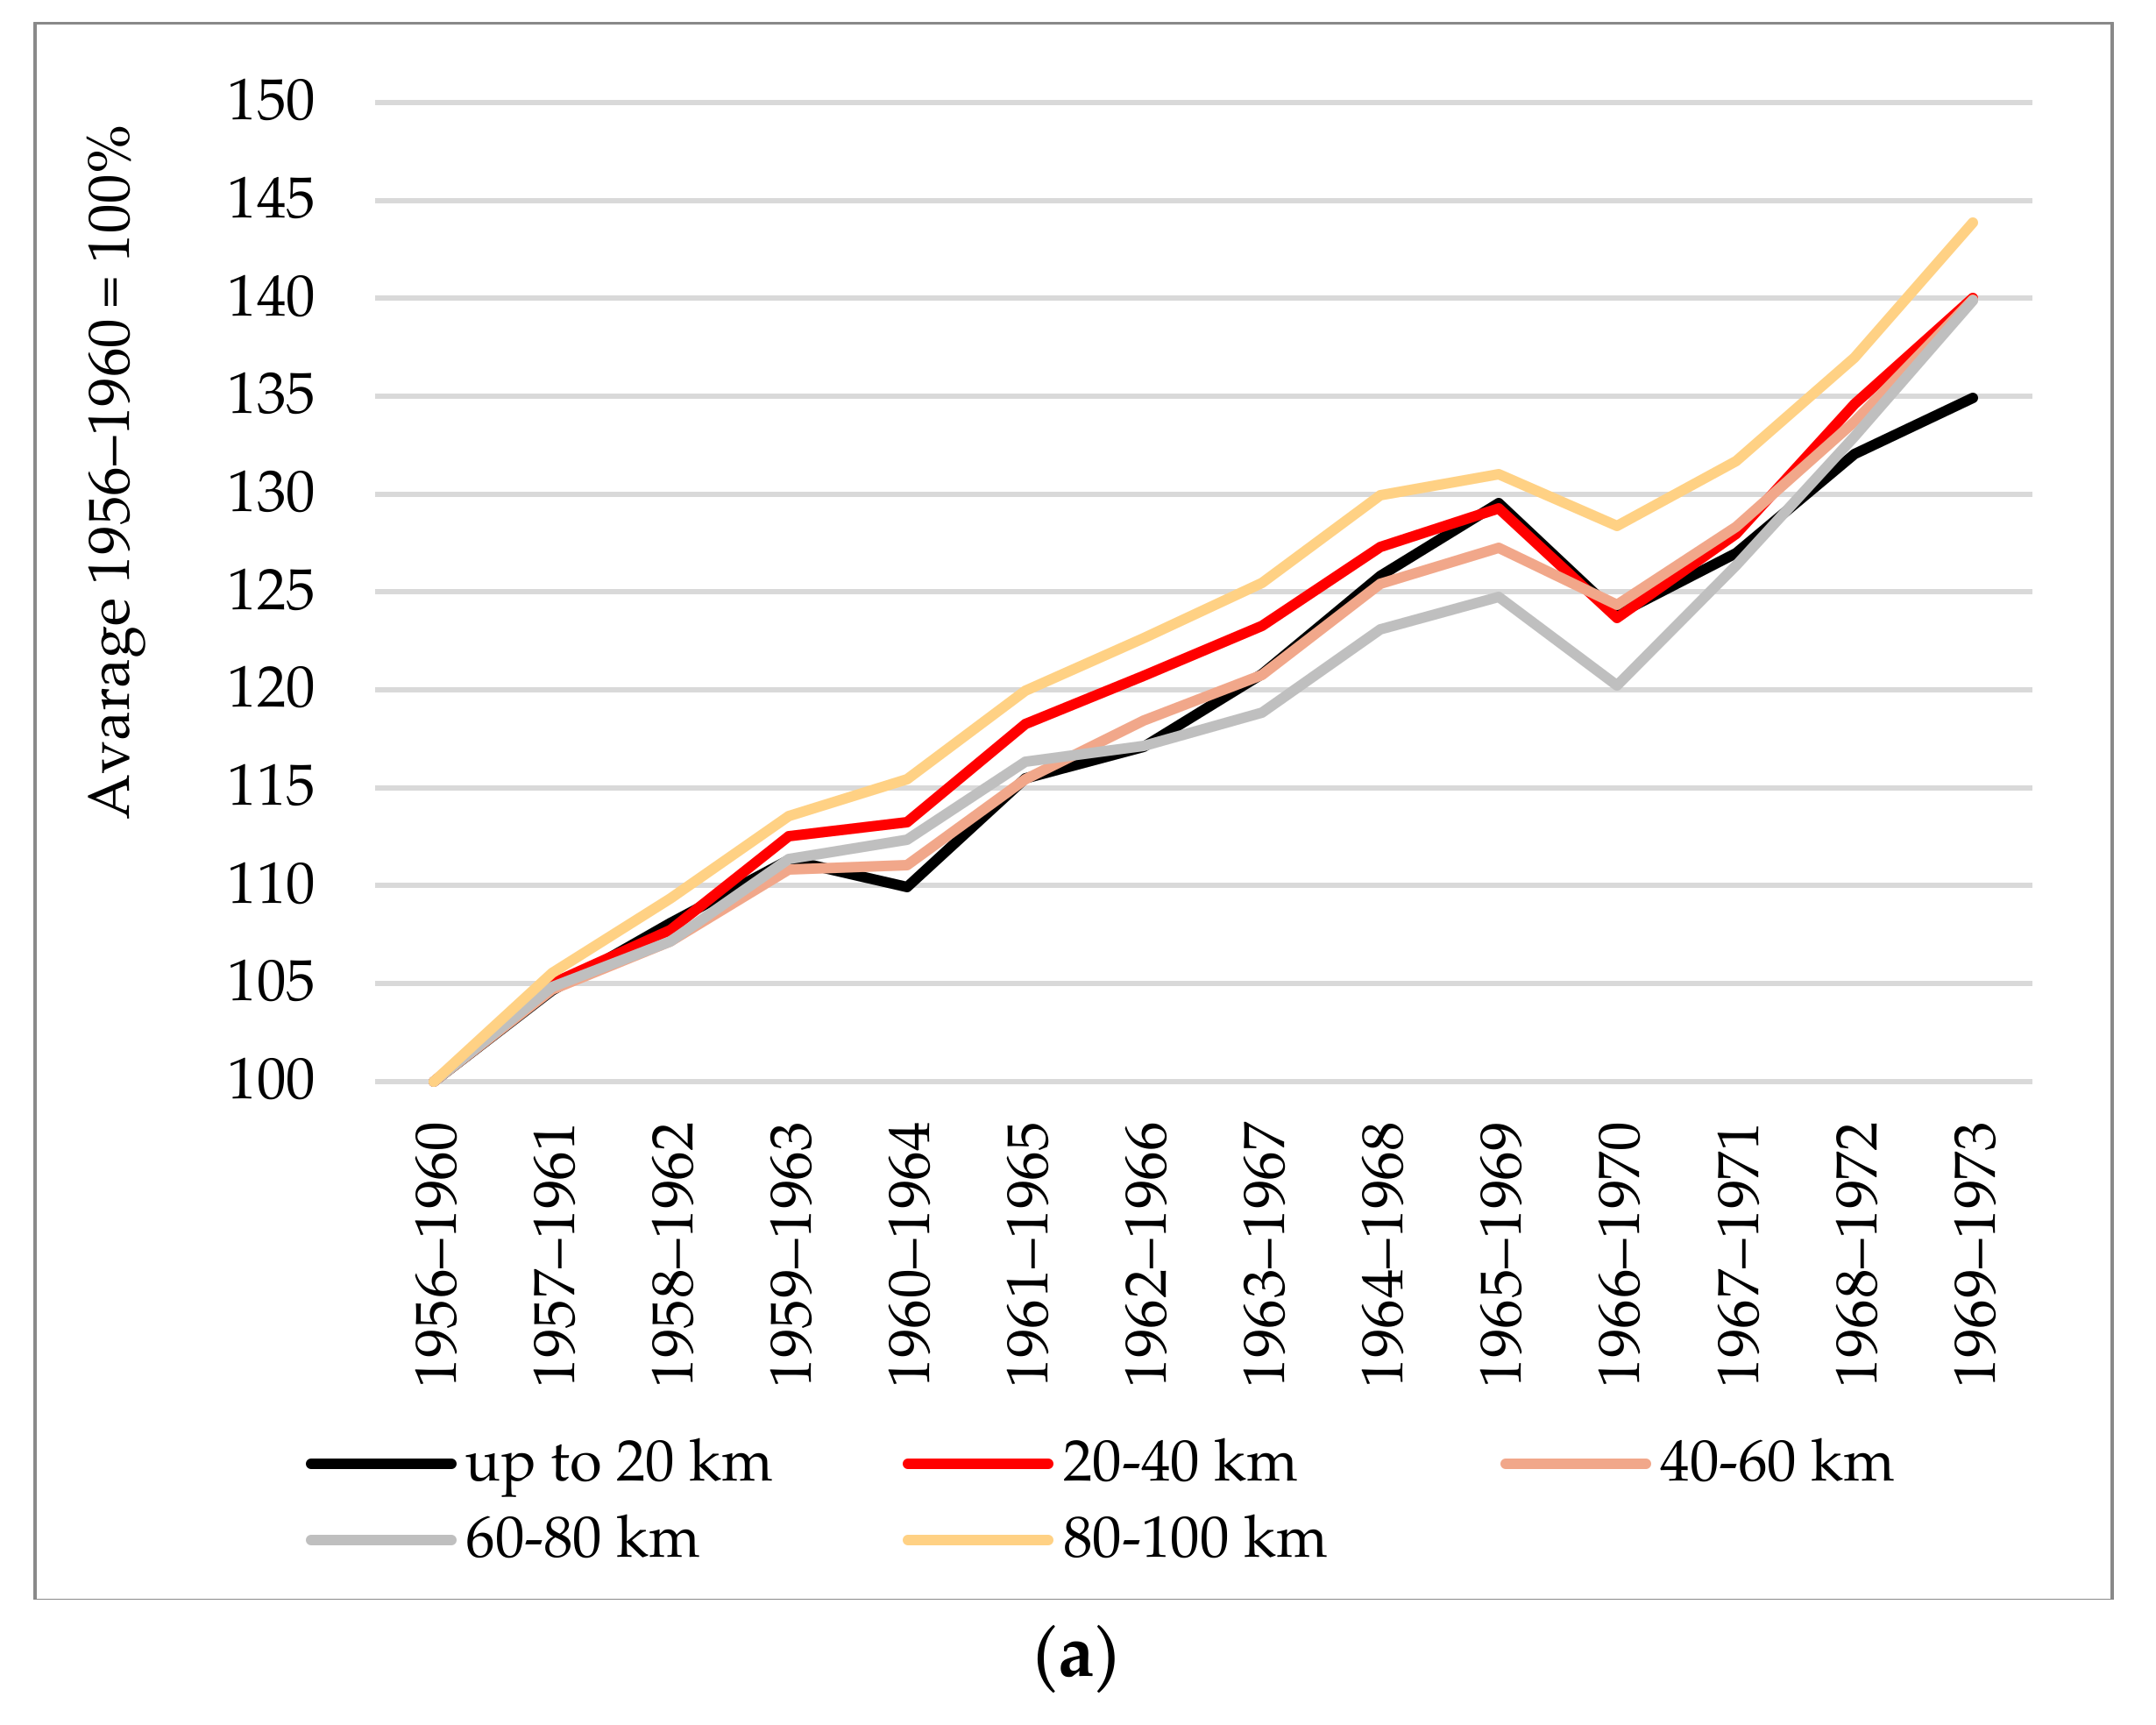
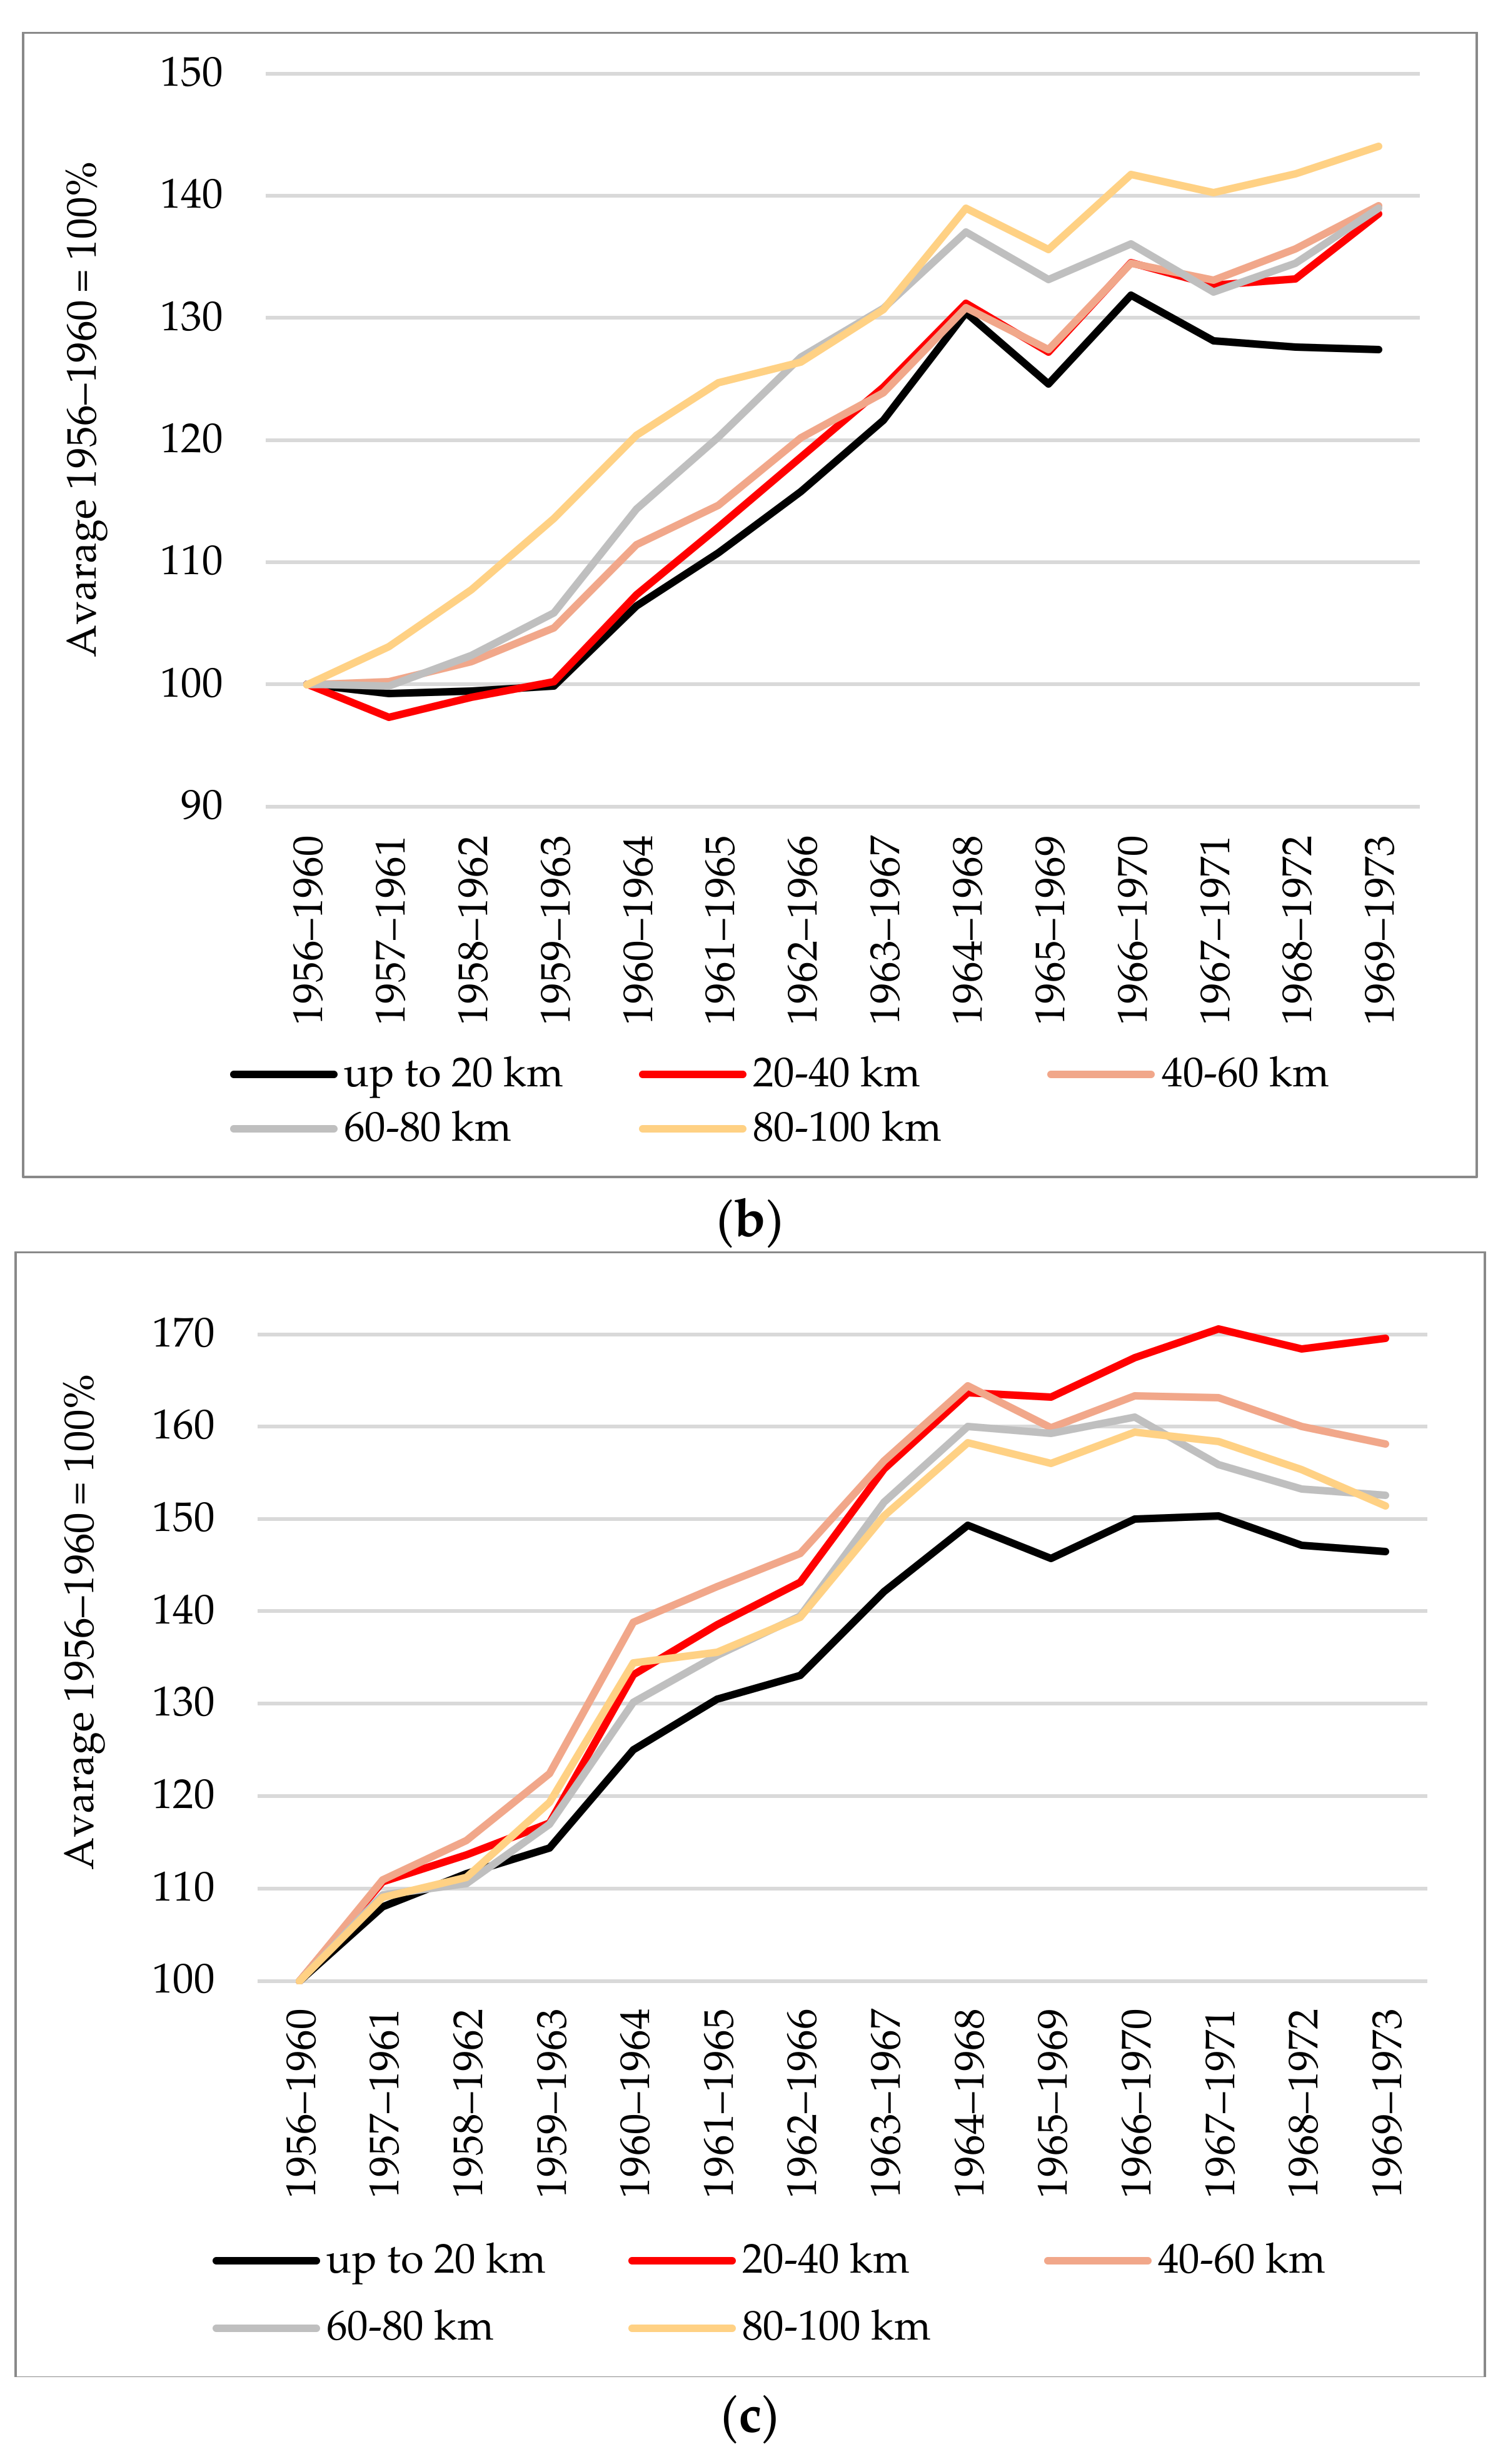
The first group, “up to 20 km”, includes the districts of Konin and Turek, where brown lignite open-pit mines are located,
The second group, 4 districts located at an average distance of 21–40 km away from the open pits,
The third group, 6 districts located at an average distance of 41–60 km away from the open pits,
The fourth group, 10 districts located at an average distance of 61–80 km away from the mines,
The fifth group, 16 districts located at an average distance of 81–100 km away from the mines.
Łódź is not included in the analyses, and the areas which until 1974 were part of the administrative Łódź Voivodship are also excluded from the calculations, where, as a result of the expansion of the city, according to Sinclair’s theory, the extensification of production could already proceed, which anticipated the urban use of agricultural land [108].
For the analyses at the voivodship level, three groups of regions were created:
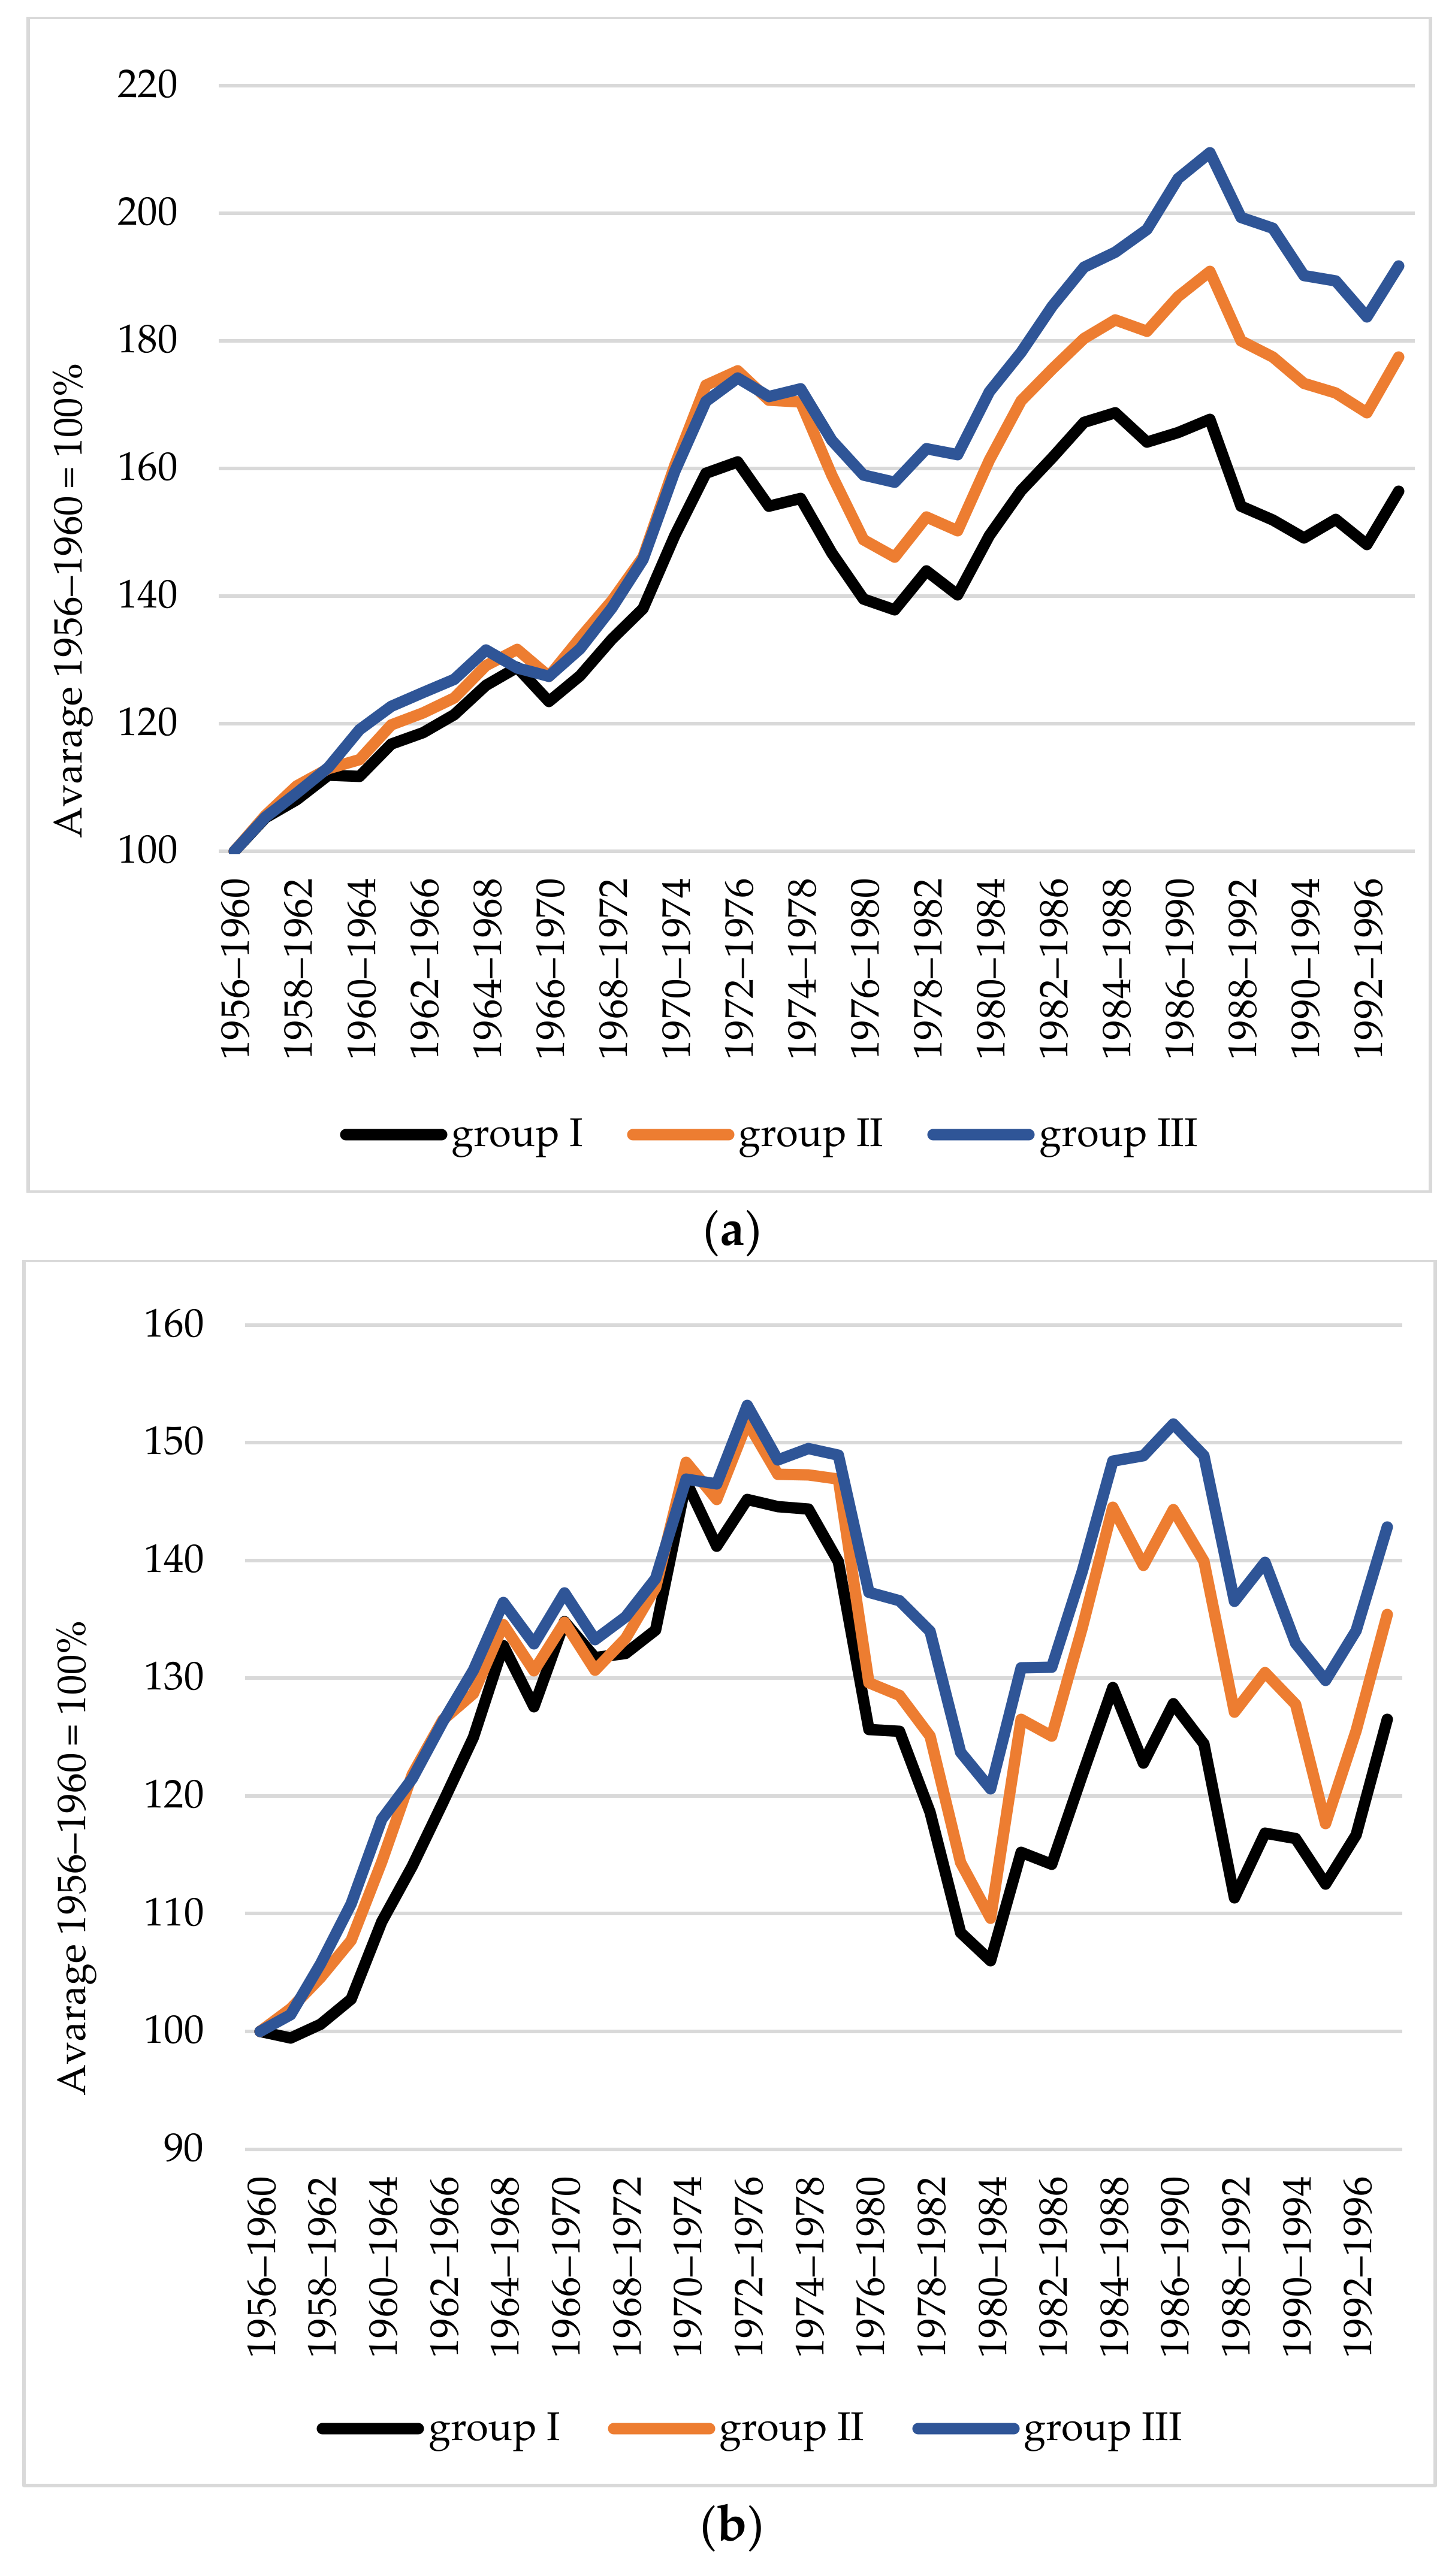
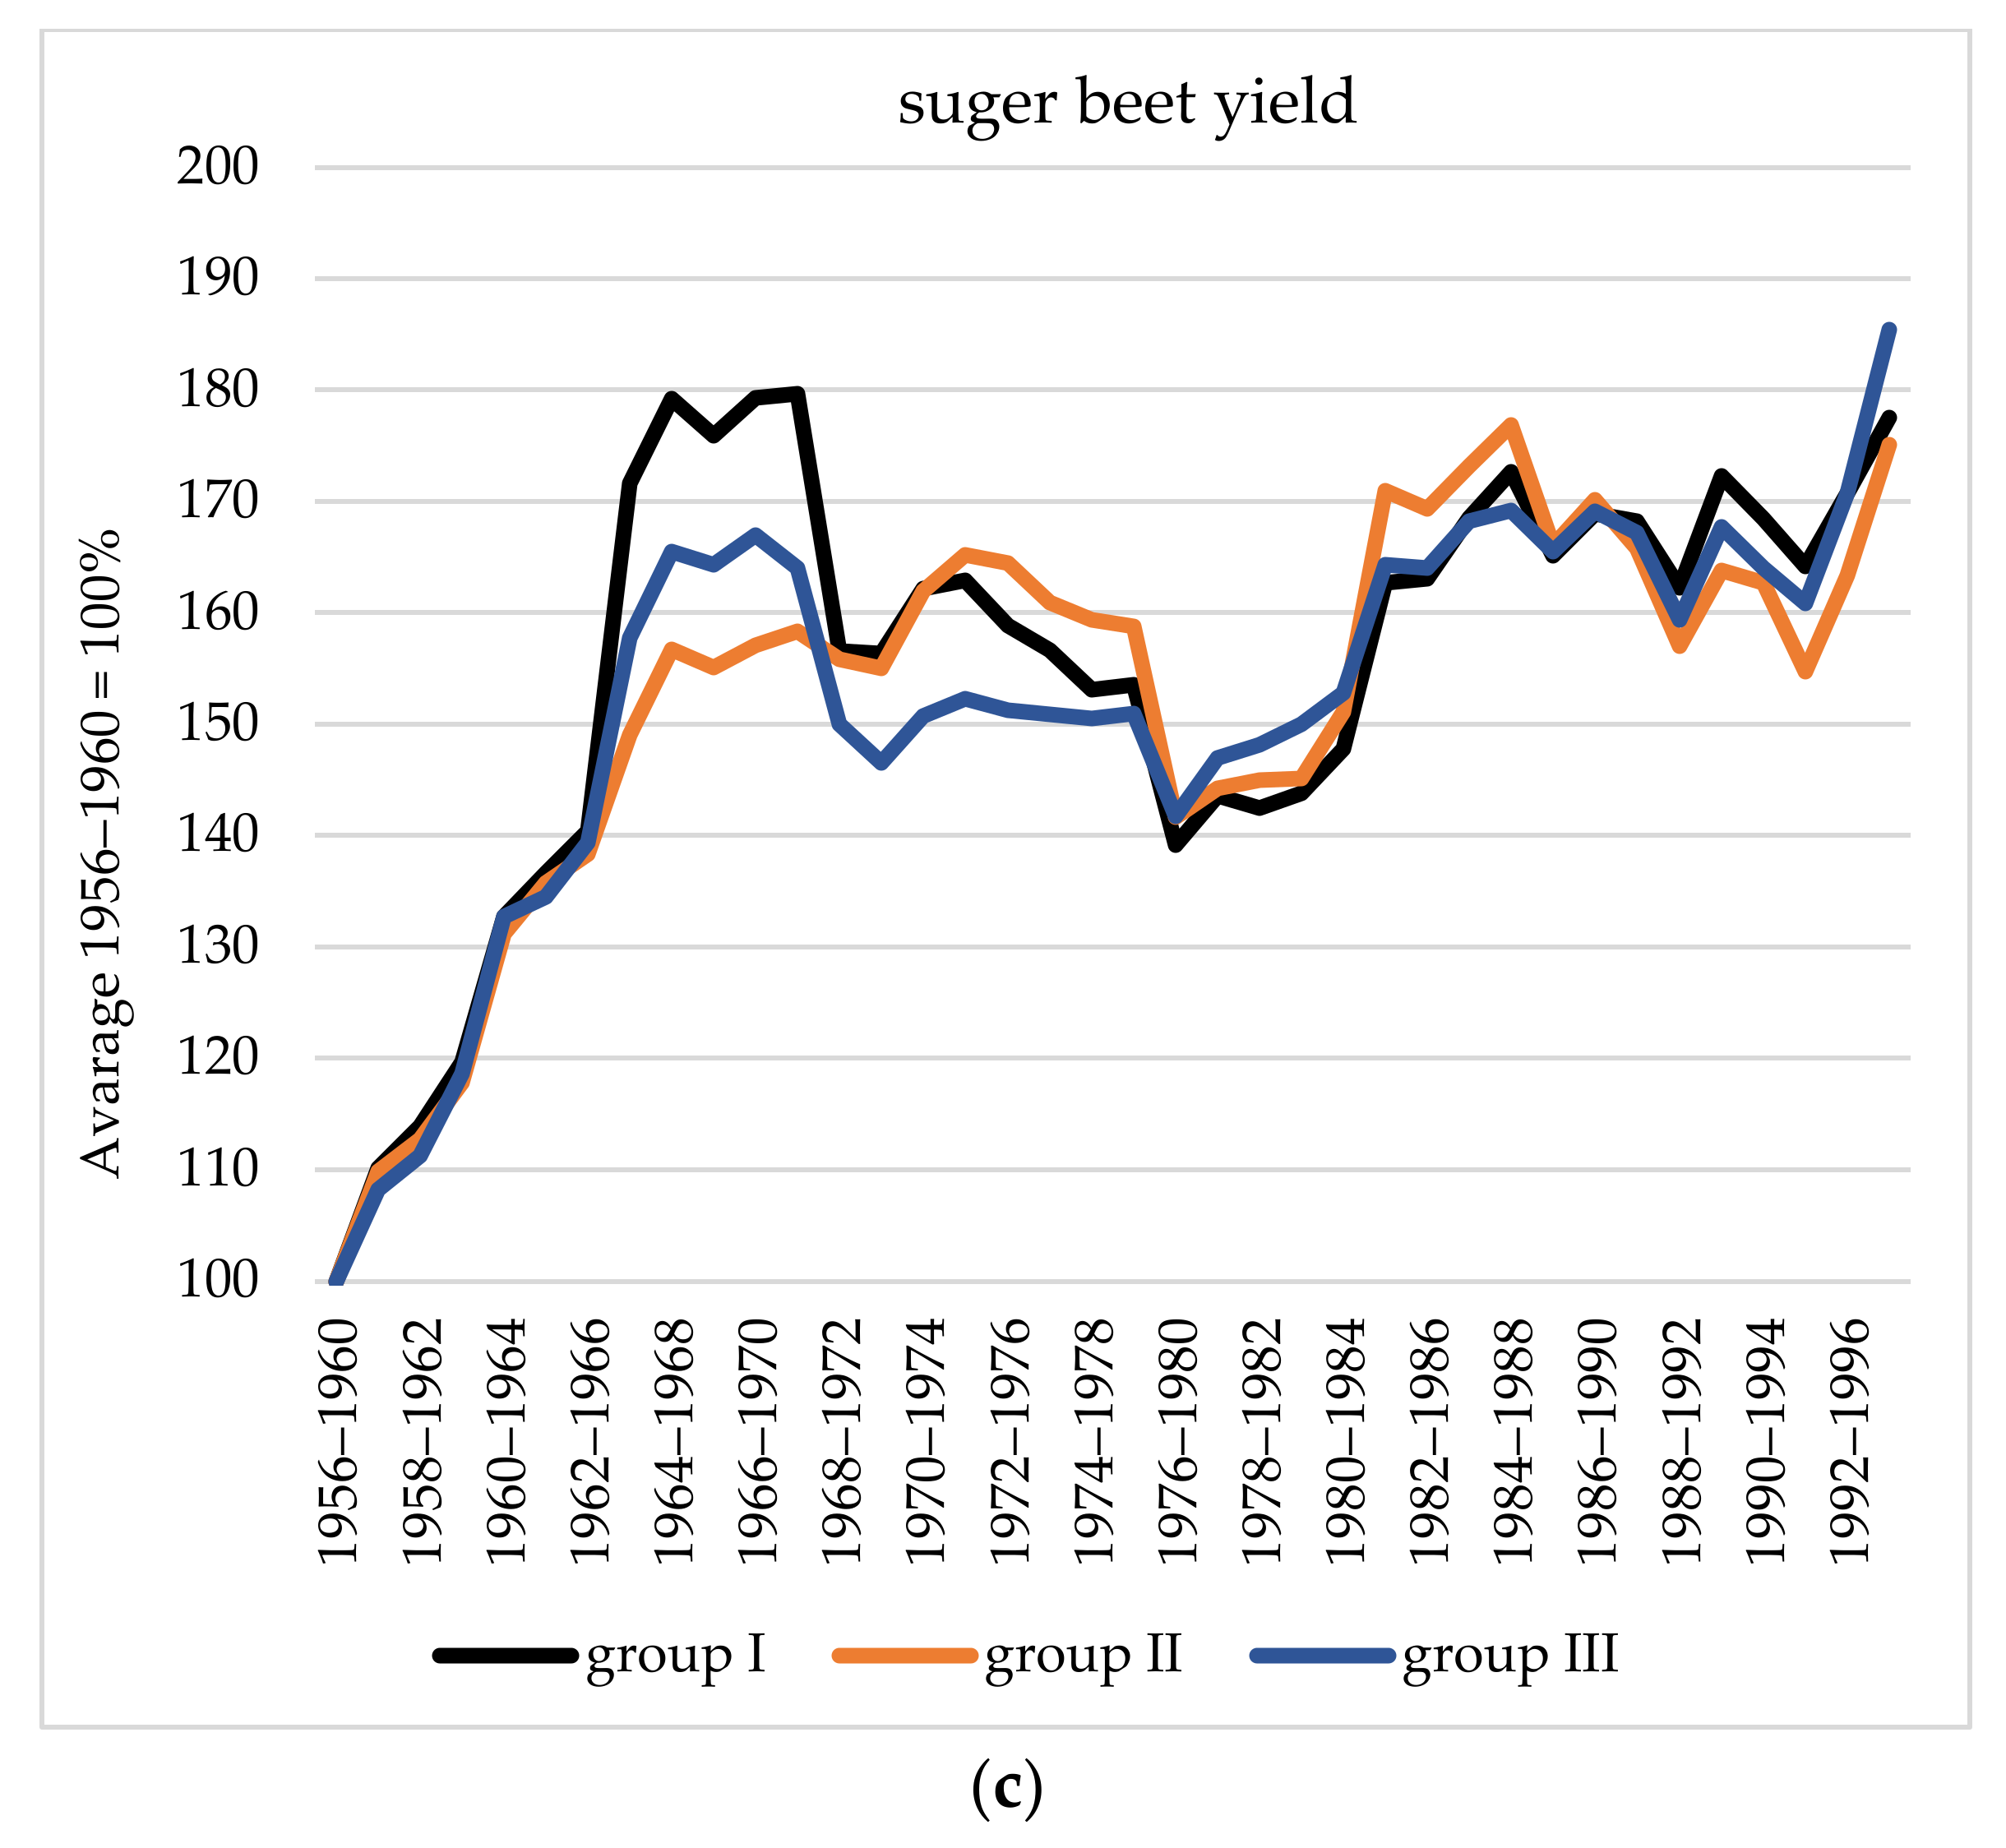
Group I, the district of Konin Voivodship, where lignite open-cast mines are located,
Group II, the Bydgoszcz and Włocławek Voivodship, which are located closest to the open-cast mines. In this group, it was also possible to include the district of Sieradz, however, after 1980, the southern part of it was located within the range of strong influence of Bełchatów open-cast mine, which could cause discrepancies in the calculations of the yield level in this group in that period,
Group III, the remaining 6 voivodships located at an average distance of up to 100 km away from the nearest open pits, i.e., Leszno, Kalisz, Płock, Poznań, Sieradz, and Toruń Voivodships.
The time range of the study for which external costs associated with lignite mining in the Konin-Turek Basin were estimated to cover the years 1960–2060. In order to determine the current level of external costs that should be included in electricity prices paid by current consumers, the average level of external costs for generated electricity in the Konin-Turek Basin for the years 2015–2024 was estimated.
Kruskal-Wallis one-way analysis of variance by ranks test was used to test the homogeneity of the distributions of yield change dynamics in the studied regions. This test was used to verify the hypothesis that the differences between the medians of the study variable were not significant in several populations.
The hypothesis concerns medians of consecutive populations:
  • H0: Ѳ1 = Ѳ2=…= Ѳk
  • H1: Ǝi, jϵ{1,…,k} ѲiѲj, where
  • Ѳ1, Ѳ2,… Ѳk is the median of the tested variable x for the i-th group.
Hypothesis verification was based on a statistic defined by the formula:
H = 1 C 12 n n + 1 i = 1 k T i 2 n 1 3 n + 1 ,
where
  • n = n1+ n2+…+ nk;
  • T1 (i- 1,2,…,k) denotes the sum of ranks in each trial;
  • C—correction for bind ranks C = 1 ( k 3 k ) n 3 n
The p value determined on the basis of the test statistic was compared with the significance level α:
  • if p ≤ α ⇒ we reject H0 and accept H1
  • if p > α ⇒ there are no grounds to reject H0
In assessing yield level differences between starting years (1956–1960) and final years (1993–1997), analysis of variance (ANOVA, Analysis of variance) was also used to show statistically significant differences between the means in the three groups identified. In the analysis of variance, groups of ni elements were compared, yielding a total of n = i = 1 k n i independent observations xij for j = 1, 2, … ni [109]. The presence of differences between the means indicated an association between the mean for the tested observation and the qualitative variable that was the basis for separating the groups (here: distance from the outcrop). The null hypothesis of equality of all group means μ (1, 2, …, i) was tested:
  • H0: μ1 = μ2 = μ3 = … = μk, where
  • μ(1, 2, …, k) denotes the mean of the dependent variable in the k-th group,
  • towards the alternative hypothesis:
  • H1: at least two group means differ.
In view of this, the alternative hypothesis was that there was a significant difference between the compared groups means.
The decision to accept or reject the null hypothesis was based on the Fisher-Snedecor F test determined as:
F = intergroup   variance   intragroup   variance
If the analyzed factor of group separation is significant, then the variation within each separated group will be small (the intragroup variance will be small). The greater the difference between the groups (the intergroup variance) and the smaller the difference between the elements of each group (the intragroup variance), then the value of the F statistic is large, which argues against the null hypothesis of equality of means in the compared groups, and therefore is the basis for the rejection of H0. The presence of statistically significant differences in yields was verified using the analysis of variance at the significance level of α = 0.05 [109].

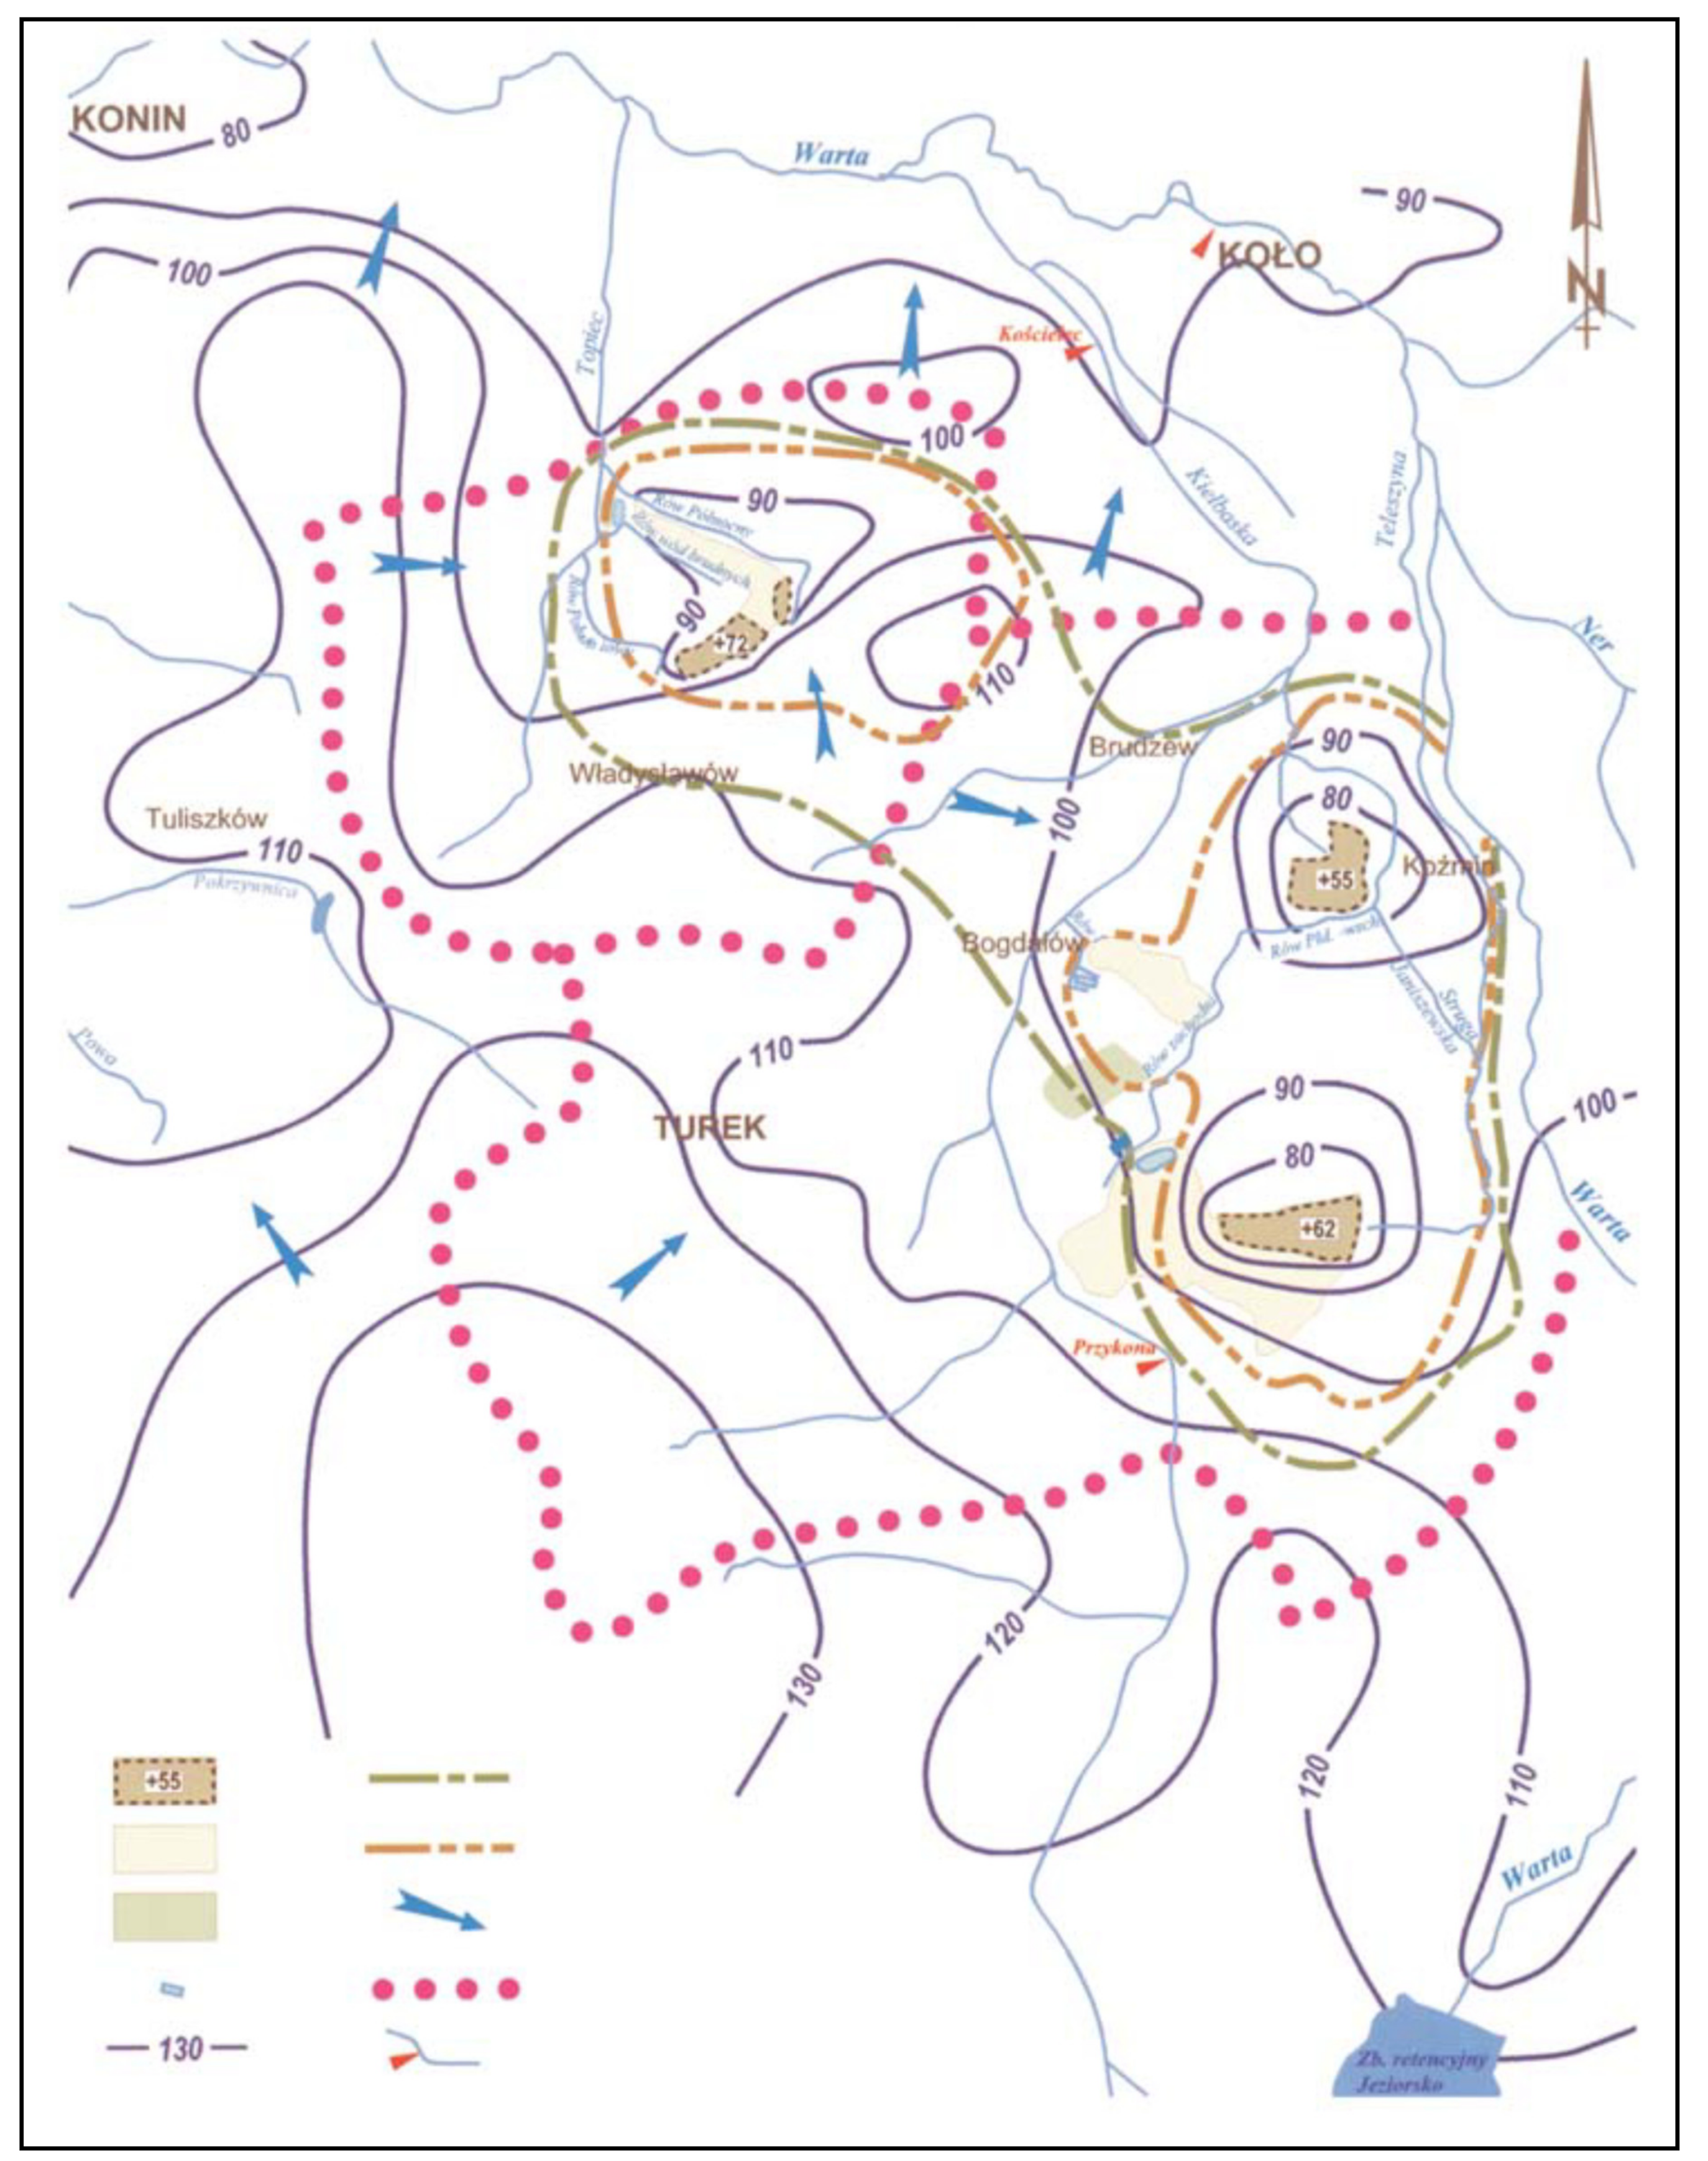
4. Characteristics of the Konin-Turek Lignite Basin

The Konin-Turek lignite basin is located in the Wielkopolskie Voivodship, approximately 100 km east of Poznań and 200 km west of Warsaw. In Poland, apart from the Konin-Turek coal basin, lignite is mined on an industrial scale in three open-pit mines: Bełchatów and Szczerców located south of Łódź and Turów, situated in the south-western part of the country near the border with Germany and the Czech Republic. The characteristic feature of the Konin-Turek basin is the relatively shallow coal seam, located mainly at the depth of up to 70 m, the low abundance of coal deposits, and their geographical dispersion over the districts of Konin and Turek (Figure 1 and Figure 2). Only the Drzewce open-pit mine is located in the neighboring district of Koło. The first open pit of the deposit in Morzysław was exploited in the period 1941–1953 and 1.04 Mg of lignite was extracted from it, which was used mainly by the local population and to supply a briquetting plant. Lignite produced by the open-pit mine in Niesłusz was managed in a similar way. The exploitation of lignite on an industrial scale started with the opening of the “Konin’’ power station in 1958. For the purpose of the power plant, an open-cast mine in Gosławice was launched, which operated from 1957 to 1974. The lignite was stored in shallow coal seams (up to 18.7 m), which was associated with a formation of a relatively small cone of depression. It also involved fairly low external costs incurred by agriculture. It was not until more open-pit mines were launched that lignite was mined over larger areas and from greater depths (Table 1), which justifies the need to undertake the research on the external costs incurred by agriculture in the area affected by the appearance of the outcrops. The actual depth of operation of dry wells is several meters greater. In the years 1991—2009, lignite was extracted from as many as 9 open pits.
In total, from 1947 to 2019, approximately 631.1 Mg of lignite was mined from the deposits located in the districts of Konin and Koło, and approximately 216.8 Mg of lignite was extracted in the district of Turek. Only 36.5 Mg is left to be mined in the entire Konin-Turek Basin, in four oh the open-pit mines, three will have their production completed by 2023. The operation of the extraction required moving a total of over 4.8 billion m3 of material and occupying 20.8 thousand ha of land. In the years 1945–2017, 5.34 billion m3 of water was pumped out of the deposits located in the districts of Konin and Koło and 4.21 billion m3 of water in the district of Turek, resulting in a waterlogging index of 8.6 m3 water × Mg−1 and 19.6 m3 water × Mg−1 of extracted lignite respectively, compared to an average of 6.8 m3 × Mg−1 in the entire Polish lignite mining industry. The recent years of mining are characterized by an increase in the amount of pumped-out water per the amount of extracted coal. In 2017, for instance, the waterlogging index in the Konin-Turek Basin was 13.5 m3 × Mg−1 and 42.3 m3 × Mg−1 [16].
The amount of water pumped out and the multi-pit mining method in the Konin-Turek Basin have resulted in the formation of extensive cones of depression, some of which are combined into a regional cone of depression area. The area of cones of depression is changing due to the opening of new open-cast mines and the simultaneous completion of the exploitation of other deposits. As of 1996, in the district of Konin, the range of the cone of depression was approximately 100 km2 in the Pliocene aquifer (discharge cone) and approximately 450 km2, the later Tertiary period (Figure 1). In the district of Turek, discharge cones of depression within the Quaternary period (overburden) layers covered several km2 of the area around the mines, and the cone of depression area covered approximately 90 km2 in the Neogene formations and nearly 200 km2 in the Cretaceous formations (Figure 2). The inflows to the drainage systems of individual open pits ranged from approximately 20 to approximately 80 m3 × min−1. During the period of maximum drainage, the total amount of water inflows into the mines in the district of Konin reached 130–150 m3 × min−1, and in the district of Turek—120–170 m3 × min−1. The range of the cones of depression created over the later Tertiary period reached 50–80 m [113]. Meanwhile, before the commencement of exploitation in the area of Pątnów, the level of the groundwater table lay at a depth of up to 7.5 m below ground level, from 2 to 4 m below ground level on average. The natural fluctuations of the level of the water table in the annual cycle ranged from 0.4 m to 3.8 m [117]. Regarding the open-cast mine in the region of Tomisławice, before the mine was launched, the groundwater table was located mostly at the depth of 0.5−1.5 m, and in the case of only 7% of the measurement stations, the level of the water table was observed on the depth of over 2.0 m [118]. The above data indicate relatively good water conditions in the period preceding the exploitation of lignite in the studied coalfield.
The expected period of restoration of water conditions is significantly varied. In the case of the analyzed open pits, the restoration of water relations is difficult because it is the region with the lowest precipitation in Poland. Filling in the end reservoirs may take from approximately 10 years in the case of the mine in Lubstów, up to 25 years for the open-pit mine in Kazimierz Północ, to approximately 40 years in the case of the Jóźwin IIB open-cast mine [88,119,120] and it also depends on the possibility of accelerating those processes through the discharge of water from the drainage of other outcrops and supplying the reservoirs with water from rivers. The estimates regarding filling in the post-mining reservoirs differ from the forecasts provided by the management of the open-cast mines and those included in Table 1. Since the water surface of mining subsidence reservoirs in post-mining areas is usually located significantly lower than the original ground level, the full restoration of water conditions within the territory of the open pit will take even longer. Therefore, it has been assumed that the reconstruction of water relations in the region will probably not be completed by 2060.
The productivity of lignite depends on its calorific value and the efficiency of the power units. The net calorific value of lignite mined in Poland in the years 2004–2019, was approximately 8437 MJ–kg−1 on average [121] within a range of 7400 to 10300 MJ–kg−1 [122]. Lignite-fired power plants are among the oldest power stations in Poland and are mostly characterized by low net/gross generation efficiency of 29.2/32.0% for Konin, 30.0/32.9% for Adamów, 31.0/33.7% for Pątnów, and 41.0/44.0% for Pątnów II [123]. Consequently, in the period 2015–2019, 1.364 Mg of lignite were consumed per net MWh × 106 [124,125,126], which, taking this efficiency into account, allows to produce approximately MWh × 106 of net electricity from the extracted coal, and the coal planned to be mined, in the Konin-Turek Basin.

5. Results

Agriculture in Poland, until 1990, was functioning within a centrally planned economy. Despite many attempts to reconstruct agriculture following the Soviet model, Polish agriculture was dominated by small individual farms. Until the end of the 1960s, it remained stagnant and without any prospects for development. The restrictions on access to new machinery, means of production, and fodder were particularly bothersome (the priority was given to state farms). Strong attachment to land along with the restrictions on trade associated with agricultural land limited the restructuring of Polish agriculture, e.g., the average size of a private farm increased from 5.3 ha in 1960 to 6.7 ha in 1990 [96]. Agriculture in Poland was also characterized by low productivity, including a low amount of yield. The introduction of the market economy accelerated restructuring processes in agriculture, however, the improvement of productivity of Polish farming and the pace of concentration processes are still too slow to achieve the level of the development of the Western European countries [127,128]. The above-mentioned conditions also apply to the area under examination.
Grain harvest, sugar beet, and potato yield in the analyzed region, in the years 1956–1973, was characterized by a high growth rate, however, it started from a very low level. In the districts of Konin and Turek, where coal was produced, the average level of yield in the years 1956–1960 was similar to the yield in the other districts under the study, however, grain harvest was lower by 5–10%, and in the case of sugar beet and potatoes, it was higher than in the other groups of the analyzed districts (Table 2). Over the years 1969–1973, the level of crops in the districts of Konin and Turek was less favorable compared to the other districts. This was due to the lowest growth pace, which was 4.9–8.9 percentage points lower in the case of grain and more than 10 percentage points lower for potatoes and sugar beet. The analysis of changes in the level of yield, presented in Figure 3, shows that the pace of growth of yield in the districts with coal mines was similar to the pace in other regions until the late 1960s, however, later on, there was a progressive differentiation observed regarding the growth of yield. This coincides with the period of launching new open-pit mines in the districts of Konin and Turek, i.e., Pątnów (1962), Adamów (1964), Kazimierz (1965), and Jóźwin (1971) and the development of cones of depression. It may indicate the growing negative impact of the developing cones of depression on the level of yield in the districts of Konin and Turek. No negative impact on the crop yield in the neighboring districts was noted during this period.
The analysis at the voivodship level, due to the longer time period for which the data is available, allowed us to determine the long-term impact of the open-pit mines located in the Konin-Turek lignite basin. The average agricultural productivity of grain, potatoes, and sugar beet in 1956–1960, did not differ significantly among the three analyzed groups of voivodships. In the case of grain, the analysis of the yield, according to the data from the voivodships, also indicates an increase in the negative impact of open-pit mines on agricultural output since the late 1960s, and in the case of potatoes, since the mid-1970s. (Figure 4).
In the case of sugar beet, this applied to a lesser extent, as in the second part of the analyzed period, for all voivodships, there was a stabilization or even a decline in the yield. The lower sensitivity of sugar beet to falling levels of groundwater may be due to the fact that the plant has a deeper root system, which allows taking water from deeper layers of soil, and the requirement for the vegetable to be cultivated on better quality soils naturally helps to reduce the sensitivity of sugar beet to changes in the levels of groundwater. This does not mean that the farmers growing this plant did not experience any losses. As can be seen from the data in Figure 3, the reduction in sugar beet yields occurred only in the vicinity of the open-pit mines, where the decrease of the level of the water table was the greatest, and it was compensated, at the voivodship level, with the highest increase of the yield in the districts located 20–40 km away from the open-cast mines. Therefore, it can be assumed that if there were no open-pit mines in the Konin Voivodship, the dynamics of the agricultural productivity of sugar beet would be higher than in the voivodships from group III.
In the case of grain and potatoes, however, the disproportions in the level of yield between particular groups of voivodships increased. Regarding grain, the agricultural output in the Konin Voivodship, in the years 1956–1961, was lower than in the voivodships from group III by 2.0%, while in the period 1993–1997 by 20.1%, which indicates a loss of 18.4% of the yield. When it comes to potatoes, instead of 4.5% higher yields, the level of agricultural productivity was lower by 7.5%, which means a decrease in the yield by 11.4%. For the voivodships from group II, the yield loss during this period was 7.4% for grain and 5.2% in the case of potatoes. Taking into account the importance of particular crops in the structure of arable land, the farmers in the Konin Voivodship lost 16.4% of their harvest, on average, and in the case of the voivodships from group II—7.0%. Considering the average of the last 10 five-year periods that are analyzed, the losses amounted to 17.2% and 7.5%, respectively.
Kruskal-Wallis one-way analysis of variance by ranks test was used to test the homogeneity of the distributions of yield change dynamics in the studied regions. This test is used to verify the hypothesis that the differences between the medians of the study variable are not significant in several populations.
As a result of the analysis, it is noted that there are no statistically significant differences in yield changes for sugar beets. The test probability level p = 0.5084 exceeds the critical value in this case, so there is no basis for rejecting the hypothesis of an equal rate of change in sugar beet yields. On the other hand, the test probability level p ≤ 0.05 allows rejecting the input null hypothesis of equality of the dynamics of changes in yields of cereals (p = 0.0047) and potatoes (p = 0.0005). Thus, distance from the mine had a statistically significant effect on yield gains in the three regions studied. The multiple comparisons test indicates that the difference in the rate of increase in cereals and potato yields between Konin Voivodeship and Voivodeships from group III (the furthest from the outcrop) proved statistically significant at the 0.05 significance level. The significance of differences in yield changes between Konin Voivodeship and Voivodeships from group II was slightly weaker; these results were significant at the 0.08 significance level. The results confirm previous findings indicating that as the distance of farms from the outcrop increased, the rate of increase in yields of cereals and potatoes, shallow-rooted crops, was much faster. As explained earlier, the lack of response of sugar beets to the decrease in water table caused by the outcrop was due to the biological specificity of this crop, where the deeper root system allows the use of sub-bottom water resources located even deeper (lowered due to the loss of water due to the outcrop).
In addition to analyzing the dynamics of change in Table 3, changes in absolute values of yields of selected crops were presented.
The ANOVA analysis of variance indicates that at the adopted level of significance α = 0.05, there are no grounds to reject the null hypothesis of equality of the mean values of grain, potato, and sugar beet yields in the compared groups. Nevertheless, it is worth noting changes in statistical significance when comparing the starting and final periods. The observed changes in average yield height (Table 3) are reflected in the change in the probability of significance of the differences: in the first period they were completely insignificant (cereals p = 0.91; potatoes p = 0.58; sugar beets p = 0.62), and in the last period the probabilities were 0.52, 0.43 and 0.49, respectively (although still significantly above the α = 0.05 level) (Table 4). Despite the lack of significance of differences, this interpretation of the results was proposed because the observed changes are related to agricultural production. Since agricultural field production determines the livelihood of a farm, managers make every effort to offset the impact of adverse factors. Nevertheless, the presented calculations show an outlined trend of yield divergence, to the disadvantage of the regions closest to the outcrop. Even if they are small, for selected crops they can determine the profitability of production in general.
Due to the long period of the impact of external costs on agriculture associated with the operation of open-pit mines in the Konin-Turek Basin, estimated until 2060, three reference periods were adopted to calculate the costs: first—for the years 1961–1987, taking into account the level of yield loss compared to the average figure from the period 1956–1960, second—for the years 1988–2033, assuming the average level of yield loss from 10 five-year periods, and third—for the years 2034–2060, considering the level of yield reduction as assumed for the first period, but in the reverse order. With such assumptions, in the whole analyzed period of 100 years, the decline of the yield in the Konin Voivodship amounted to 11.7%, and in the voivodships from group II—4.7%.
Three variants of yield level were adopted. First, the average yield from the years 2015–2019 was assumed for the whole period of the impact of the open-pit mine in Konin district, i.e., until 2060. Second, until 2019, the actual yield was assumed for each group of voivodships, and after 2019, the yield level was adjusted by the average annual increase in productivity from the period 1999 to 2019. For the third variant, the actual yield was also assumed until 2019, while for the following years it was assumed that in 2050 the level of the yield in the areas of voivodships from group III will reach the level of the output achieved by Germany in 2015.
Calculating the external costs of crop production resulting from the seizure of 20.8 thousand ha of land, the share of arable land was assumed to correspond to the share of arable land in the district of Konin, and a share of 60% of land excluded from agricultural production during the whole period of the operation of open-cast mines and after reclamation. The average share of arable land in the total area of the Konin Voivodship, in the entire analyzed period, was estimated at 68.9%.
The total of external costs for the entire period of the research, assuming that the decrease in the yield in the area affected by the operation of opencast mines is entirely the result of the cones of depression, was estimated at €5.6 billion, which, with an estimated electricity production of 648.4 TWh, equals to €8.66 per kWh (Table 5), which accounted for 16.1% of the price on the Polish market of SPOT TGE S.A. in 2019 [129].

6. Discussion

In Polish literature, there is no analysis of the influence of open-cast mining on agriculture. In the ongoing discussion, the most popular subject is the impact of open-pit mining on the level of soil moisture. Most of the authors [130,131,132,133,134,135,136] claim that there is no negative impact of cones of depression on the upper layers of the terrain and they concentrate on the negative effects of the cones on deeper layers. However, a significant decline in levels of groundwater is noticed [137]. Among the few researchers who suggest the negative impact of cones of depression on the content of moisture of farmland are Chodak et al. [138,139] and Wlodek et al. [140], however, they do not indicate the level of losses that farmers should consider.
The conducted analysis presents a huge influence of multi-pit lignite mining in the Konin-Turek Basin. The long period of exploitation and the related deficits of underground water resources led to a systematic increase in losses resulting from a slower pace of growth of agricultural productivity compared to the areas located further away from the open-pit mines. This undoubtedly contributed to a significant weakening of the economic strength of agriculture in the areas of cones of depression, which indirectly, through reduced investment and intensity of production, caused an increase in losses of the yield and insufficient use of the already limited productive capacity of soils. The loss of 16.4% of crops in the perspective of 10 years in the entire Konin Voivodship should be considered as significant, especially in the economic context, because regardless of the level of agricultural output farmers are forced to perform all cultivation and care treatments, bear the full costs of crop protection and seeds and the majority of the costs of fertilizers. Consequently, any loss of yield means a reduction in profit. It should also be assumed (in the context of the research at the district level) that in the regions located closer to open-pit mines the level of the loss of the yield will be even greater. This was confirmed by a survey conducted among farmers living in the area where open-cast mines were planned to be launched, whose farmlands were located approximately 20 km away from the spot. They expected a 40% decline in their yield [35].
The level of future yield and losses in agriculture will be determined by the level of agricultural development, production intensity, and the technologies that are used. High levels of local agricultural development, adequate know-how, capital, and the ability to adapt technology to changing conditions can minimize the losses caused by the appearance of a cone of depression.
The reason for the decline in agricultural productivity was the lowering level of the water table in large areas surrounding the open pit, which increased the dependence of the crops on rainfall during the growing season. With relatively favorable weather conditions, the effects of lowering the water table as a result of the appearance of a cone of depression are insignificant, however, in the period of deficiency in rainfall, the importance of the possibility to be able to use groundwater increases. The great decline in grain production with a limited impact of a cone of depression on sugar beet indicates that shallow-rooted crops are particularly vulnerable to drainage caused by open-pit mining. They are subject to greater damage during the years with a low amount of rainfall. Assessing the impact of drought on agricultural production is particularly difficult, despite the fact that there has been some research performed that allowed us to estimate the effect of the dry season on the soil at a regional scale [63]. A study conducted in the Czech Republic, on the effects of drought on crop yields, has shown that in the case of severe drought, the crop, depending on the species, decreases by 0.8–1.5 t × ha−1 (with average yield in recent years at approximately 5.8 t × ha−1), potato yield declined by approximately 3.0 t × ha−1 (with average yield in recent years at approximately 28.0 t × ha−1), and rapeseed yield declined by 0.55 t × ha−1 (with average yield over the recent years at approximately 3.3 t × ha−1). According to the studies, sweetcorn is characterized by relatively high tolerance to drought [141].
The optimal level of groundwater to obtain the highest yield is 0.7–1.6 m, and it is 1.5–2.5 m in the case of corn [57,142,143]. Therefore, it can be assumed that to achieve high agricultural output, the level of groundwater should be 1–3 m [61,72,144]. In turn, the level of groundwater below 4.0 m leads to a collapse of agricultural productivity. For example, according to the studies conducted on the Inland Pampas, during two growing seasons (2006/2007 and 2007/2008), the areas within these optimum bands had yields that were 3.7, 3.0, and 1.8 times larger than those where the water table was below 4 m for wheat, maize, and soybean, respectively [143]. According to research in the Hungarian Plain, the decline in groundwater level led to a stagnation in wheat and sweetcorn yield. In the case of sweetcorn, the yield loss was estimated at an average 0.65 t × ha−1, indicating that a 1.0 m drop in the level of groundwater, under the conditions recorded between 1986 and 2010, would result in a 2.33 t × ha−1 decline in corn yield in this region [57]. The level of the yield loss, according to the above-mentioned studies, is therefore similar to the losses resulting from the occurrence of cones of depression in the Konin-Turek lignite basin.
The estimated external costs of €5.6 billion, resulting in €8.66 per MWh of produced electricity must be considered as significant from an economic point of view. Current consumers of electricity generated from 2015 to 2024 from lignite from the Konin-Turek Basin should pay even more, €14.29. Despite the numerous uncertainties regarding the impact of cones of depression on the level of yield, the conducted research proved a huge level of external costs involved, which should not be completely ignored. There is also a lot of discrepancies in the studies on external costs in the case of power generation, e.g., the costs related to health damage and internalization of emission costs [28]. If the estimated external costs were to be included in the costs of electricity production, e.g., a necessity to cover the estimated losses for farmers, the profitability of electricity production from lignite would significantly change and, consequently, its attractiveness would decrease compared to other renewable and non-renewable energy sources. The performed analysis concerned the open-pit mine terminating its operation, therefore, the research covered a period when the level of yield was much lower than it is presently. In the case of analyses of external costs for open-pit mines which are planned to be launched, and in the regions with a higher level of agricultural development, even greater losses should be expected.
The production of electricity from fossil fuels, including lignite, and its impact on the environment have also been the subject of many studies. The issue of environmental pollution caused by dust and gases from their combustion was addressed most often. The estimations of external costs differ significantly due to the variety of analyzed factors, various research methodologies, availability of data, the efficiency of power plants, combustion technology, etc. (Table 6). For example, in the case of Thailand, only the impact of the emission of PM10 and NOx in sparsely-populated areas was analyzed, while the study conducted by Macy et al. included sulfur dioxide, nitrogen oxides, dust particles, carbon monoxide and dioxide, volatile organic compounds, polycyclic aromatic hydrocarbons, and the difference in the level of external costs was approximately 10 times higher. In the case of Bosnia and Herzegovina, lignite with different calorific values and sulfur content was analyzed.
One of the few works analyzing external costs at the stage of lignite extraction associated with the emission of suspended particulate matter during the mining process estimated external costs at 5.0 € × MWh−1 [149]. The external costs estimated in this study, on the effects of open-cast lignite mining on agricultural plant production, are similar. To determine the full amount of external costs borne by agriculture, it is still necessary to perform analyses for livestock production, which, due to its dependence on feed produced on the farmland where the animals are kept (especially the large dependence in the case of cattle and sheep), is also subject to restrictions related to cones of depression.
Conducting full research on external costs is particularly important in the context of the Energy Policy of Poland until 2040 [150], approved in January 2021, which leaves it to the discretion of potential investors to launch two more lignite open-pit mines in Złoczew and Ościsłowo, the coal seams of which, according to this document, are not to be extracted. The prices of CO2 emission allowances, environmental conditions, and the development of new technologies are to play a key role in the management of the terrain. However, in the published strategy, as well as in other government documents, there is no mention of external costs, which should support the decision-making processes regarding the profitability of coal extraction and its combustion. To determine the total amount of external costs, it is necessary to assess the following:
External costs associated with the emission of dust in combustion processes and the impact on human health and global warming,
External costs associated with the emission of suspended particulates as a result of mining processes,
External costs for agriculture (both crop and animal production), for agri-food industry and forestry, related to the drainage of open pits.
The inclusion of these external costs as essential factors in rational decision-making with regard to investments will surely contribute to abandoning the mining of other deposits in Poland and will contribute to faster improvement of air quality.

Author Contributions

Conceptualization, methodology, resources, investigation and editing, B.P.; writing, B.P. and W.C.; Kruskal-Wallis and ANOVA analysis of variance, W.C. Authorship must be limited to those who have contributed substantially to the work reported. All authors have read and agreed to the published version of the manuscript.

Funding

This research received no external funding.

Institutional Review Board Statement

Not applicable.

Data Availability Statement

The data is available from the authors upon request.

Conflicts of Interest

The authors declare no conflict of interest.

References

  1. Thielemann, T.; Schmidt, S.; Gerling, J.P. Lignite and hard coal: Energy suppliers for world needs until the year 2100–An outlook. Int. J. Coal Geol. 2007, 72, 1–14. [Google Scholar] [CrossRef]
  2. Federal Institute for Geosciences and Natural Resources. Energy Study 2014: Reserves, Resources and Availability of Energy Resources; Federal Institute for Geosciences and Natural Resources: Hanover, Germany, 2014.
  3. Kashiwagi, T.; Ishino, H.; Takagi, T.; Hirose, K. Mine-mouth Power Generation System Based on Upgraded Brown Coal (UBC). Kobelco Technol. Rev. 2015, 33, 28–33. [Google Scholar]
  4. Bielecki, A.; Ernst, S.; Skrodzka, W.; Wojnicki, I. The externalities of energy production in the context of development of clean energy generation. Environ. Sci. Pollut. Res. 2020, 27, 11506–11530. [Google Scholar] [CrossRef] [PubMed] [Green Version]
  5. Violidakis, I.; Drosatos, P.; Nikolopoulos, N. Critical review of current industrial scale lignite drying technologies. In Low-Rank Coals for Power Generation, Fuel and Chemical Production; Luo, Z., Agraniotis, M., Eds.; Woodhead Publishing: Cambridge, UK, 2017; pp. 41–71. [Google Scholar] [CrossRef]
  6. Wilczyński, M. Coal in Poland: After the Sunset, Change Partnership.org. 2016. Available online: http://www.changepartnership.org/wp-content/uploads/2016/02/Wilczynski-2016-Coal-in-Poland-after-the-sunset-translation-FINAL.pdf (accessed on 8 December 2020).
  7. Mohr, S.H.; Evans, G.M. Forecasting coal production until 2100. Fuel 2009, 88, 2059–2067. [Google Scholar] [CrossRef] [Green Version]
  8. Patzek, T.; Croft, G. A global coal production forecast with multi–Hubbert cycle analysis. Energy 2010, 35, 3109–3122. [Google Scholar] [CrossRef]
  9. Mukherjee, S.; Pahari, D.P. Underground and Opencast Coal Mining Methods in India: A Comparative Assessment. Space Cult. India 2019, 7, 39–55. [Google Scholar] [CrossRef]
  10. Braun, M. Environmental External Costs from Power Generation by Renewable Energies; Institut für Energiewirtschaft und Rationelle Energieanwendung, Universität Stuttgart: Stuttgart, Germany, 2004. [Google Scholar]
  11. International Institute for Sustainable Development. Financial Supports for Coal and Renewables in Indonesia; International Institute for Sustainable Development: Winnipeg, MB, Canada, 2017. [Google Scholar]
  12. Samadi, S. The Social Costs of Electricity Generation—Categorising Different Types of Costs and Evaluating Their Respective Relevance. Energies 2017, 10, 356. [Google Scholar] [CrossRef] [Green Version]
  13. Karkour, S.; Ichisugi, Y.; Abeynayaka, A.; Itsubo, N. External-Cost Estimation of Electricity Generation in G20 Countries: Case Study Using a Global Life—Cycle Impact—Assessment Method. Sustainability 2020, 12, 2002. [Google Scholar] [CrossRef] [Green Version]
  14. Adani’s Coal Mine Plans, and Why Coal Is Still So Lucrative. Available online: https://www.dw.com/en/adanis-coal-mine-plans-and-why-coal-is-still-so-lucrative/a-52025626 (accessed on 4 January 2021).
  15. Global Coal Exit List. Available online: https://coalexit.org/ (accessed on 4 January 2021).
  16. Kasztelewicz, Z. Report on the Condition of the Lignite Coal Industry in Poland and Germany Together with a Diagnosis of Measures for the Development of this Industry in the First Half of the 21st Century; AGH University of Science and Technology: Krakow, Poland, 2018. (In Polish) [Google Scholar]
  17. Kasztelewicz, Z.; Tajduś, A.; Cała, M.; Ptak, M.; Sikora, M. Strategic conditions for the future of brown coal mining in Poland. Energy Policy J. 2018, 21, 155–178. [Google Scholar] [CrossRef]
  18. Pietraszewski, A. Polish lignite mining in 2014. Węgiel Brunatny 2015, 90, 4–14. (In Polish) [Google Scholar]
  19. Widera, M.; Kasztelewicz, Z.; Ptak, M. Lignite mining and electricity generation in Poland: The current state and future prospects. Energy Policy 2016, 92, 151–157. [Google Scholar] [CrossRef]
  20. Ministry of Energy. Energy Policy of Poland Until 2040 (EPP2040)—Extract from Draft v. 2.1; Ministry of Energy: Warsaw, Poland, 2019.
  21. Pactwa, K.; Woźniak, J.; Strempski, A. Sustainable mining—Challenge of Polish mines. Resour. Policy 2018. [Google Scholar] [CrossRef]
  22. Faaij, A.; Meuleman, B.; Turkenburg, W.; van Wijk, A.; Bauen, A.; Rosillo-Calle, F.; Hall, D. Externalities of biomass based electricity production compared with power generation from coal in the Netherlands. Biomass Bioenergy 1998, 14, 125–147. [Google Scholar] [CrossRef]
  23. Rowe, R.D.; Lang, C.M.; Chestnut, L.G.; Latimer, D.A.; Rae, D.A.; Bernow, S.M.; White, D.E. New York State Environmental Externalities Cost Study; Empire State Electric Energy Research Corporation, Oceana: New York, NY, USA, 1995. [Google Scholar]
  24. Lee, R.; Krupnik, A.; Burtraw, D. Estimating Externalities of Electric Fuel Cycles: Analytical Methods and Issues and Estimating Externalities of Coal Fuel Cycles; Techical Report; McGraw—Hill/Utility Data Institute: Washington, DC, USA, 1995. [Google Scholar]
  25. Krewitt, W.; Heck, T.; Trukenmüller, A.; Friedrich, R. Environmental damage costs from fossil electricity generation in Germany and Europe. Energy Policy 1999, 27, 173–183. [Google Scholar] [CrossRef]
  26. EC. ExternE—Externalities of Energy, Methodology 2005 Update; Office for Official Publications of the European Communities: Luxembourg, 2005. [Google Scholar]
  27. Rečka, L.; Ščasný, M. Brown coal and nuclear energy deployment: Effects on fuel-mix, carbon targets, and external costs in the Czech Republic up to 2050. Fuel 2018, 216, 494–502. [Google Scholar] [CrossRef]
  28. Jorli, M.; Van Passel, S.; Saghdel, H.S. External costs from fossil electricity generation: A review of the applied impact pathway approach. Energy Environ. 2018, 29, 635–648. [Google Scholar] [CrossRef] [Green Version]
  29. Ščasný, M.; Massetti, E.; Melichar, J.; Carrara, S. Quantifying the Ancillary Benefits of the Representative Concentration Pathways on Air Quality in Europe; Nota di Lavoro, No. 84.2015; Fondazione Eni Enrico Mattei (FEEM): Milan, Italy, 2015. [Google Scholar]
  30. Preiss, P.; Klotz, V. EcoSenceWeb V1-3; Insitute of Energy Economics and the Rational Use of Energy: Stuttgart, Germany, 2008. [Google Scholar]
  31. Wang, L.; Watanabe, T.; Xu, Z. Monetization of External Costs Using Lifecycle Analysis—A Comparative Case Study of Coal–Fired and Biomass Power Plants in Northeast China. Energies 2015, 8, 1440–1467. [Google Scholar] [CrossRef] [Green Version]
  32. Máca, V.; Melichar, J.; Ščasný, M. Internalization of External Costs of Energy Generation in Central and Eastern European Countries. J. Environ. Dev. 2012, 21, 181–197. [Google Scholar] [CrossRef] [Green Version]
  33. Pepliński, B. External costs of opencast brown coal mining in agriculture and agri–food industry (on the example of Wielkopolska). Cent. Eur. Econ. J. 2018, 5, 154–171. [Google Scholar] [CrossRef] [Green Version]
  34. Pepliński, B. External costs of open-cast lignite mining for the agri–food industry (as illustrated by the example of the Oczkowice mine). J. Agribus. Rural Dev. 2018, 2, 213–223. [Google Scholar] [CrossRef]
  35. Poczta, W.; Pepliński, B.; Sadowski, A.; Czubak, W. Impact of the Planned Oczkowice Mine on the Economic, Productive and Social Potential of Agriculture and its Surroundings in the South–Western Functional Area of the Wielkopolskie Voivodeship; Poznań University of Life Sciences: Poznan, Poland, 2017. (In Polish) [Google Scholar]
  36. Georgescu-Roegen, N. The Entropy Law and the Economic Process; Harvard University Press: Cambridge, MA, USA, 1971. [Google Scholar]
  37. Dal, E.; Koksal, M.A. Modeling the use of renewable energy sources for electricity generation based on technological, political, and environmental constraints. Energy Procedia 2017, 142, 3129–3134. [Google Scholar] [CrossRef]
  38. Rafaj, P.; Kypreos, S. Internalisation of external cost in the power generation sector: Analysis with global multi-regional MARKAL model. Energy Policy 2007, 35, 828–843. [Google Scholar] [CrossRef]
  39. Coester, A.; Hofkes, M.; Papyrakis, E. Economics of renewable energy expansion and security of supply: A dynamic simulation of the German electricity market. Appl. Energy 2018, 231, 1268–1284. [Google Scholar] [CrossRef]
  40. Redlinger, R.Y.; Andersen, P.; Morthorst, P. Wind Energy in the 21st Century—Economics, Policy, Technology and the Changing Electricity Industry; Palgrave Macmillan: Basingstoke, UK, 2002. [Google Scholar] [CrossRef]
  41. Becker, N.; Soloveitchik, D.; Olshansky, M. A weighted average incorporation of pollution costs into the electrical expansion planning. Energy Environ. 2012, 23, 1–15. [Google Scholar] [CrossRef]
  42. Sakulniyomporn, S.; Kubaha, K.; Chullabodhi, C. External costs of fossil electricity generation: Health–based assessment in Thailand. Renew. Sustain. Energy Rev. 2011, 15, 3470–3479. [Google Scholar] [CrossRef]
  43. Bozicevic Vrhovcak, M.; Tomsic, Z.; Debrecin, N. External costs of electricity production: Case study Croatia. Energy Policy 2005, 33, 1385–1395. [Google Scholar] [CrossRef]
  44. Maxim, A. Sustainability assessment of electricity generation technologies using weighted multi-criteria decision analysis. Energy Policy 2014, 65, 284–297. [Google Scholar] [CrossRef]
  45. Przybyłek, J. Current problems of the lignite open cast mines dewatering in the Wielkopolska region. Górnictwo Odkrywkowe 2018, 2, 5–14. (In Polish) [Google Scholar]
  46. Przybyłek, J.; Górski, J. The Oczkowice lignite deposit. Voicing concern for proper hydrogeological recognition. Przegląd Geologiczny 2016, 64, 183–191. (In Polish) [Google Scholar]
  47. Adamczyk, A.F.; Motyka, J. Methodical problems of determination of depression cone boundaries in the areas affected by mining drainage. Współczesne Problemy Hydrogeologii 1995, 7, 209–212. (In Polish) [Google Scholar]
  48. Pusch, M.; Hoffmann, A. Conservation concept for a river ecosystem (River Spree, Germany) impacted by flow abstraction in a large post-mining area. Landsc. Urban Plan. 2000, 51, 165–176. [Google Scholar] [CrossRef]
  49. Mwadzingeni, L.; Mugandani, R.; Mafongoya, P. Factors affecting the performance of Tshiombo Irrigation Scheme in Limpopo Province, South Africa. J. Agribus. Rural Dev. 2020, 3, 269–277. [Google Scholar] [CrossRef]
  50. Shoko, R.R.; Chaminuka, P.; Belete, A. Maize yield sensitivity to climate variability in South Africa: Application of the ARDL-ECM approach. J. Agribus. Rural Dev. 2019, 4, 363–371. [Google Scholar] [CrossRef]
  51. Rybka, K.; Nitka, Z. Modern phenotypes of cereals for growing in areas endangered with drought. Biuletyn Instytutu Hodowli Aklimatyzacji Roślin 2014, 273, 55–72. (In Polish) [Google Scholar]
  52. Zawora, T.; Ziernicka–Wojtaszek, A. Extreme values of precipitation deficiencies and excesses in the light of contemporary climate change based on the example from the Podkarpackie province. Infrastruktura Ekologia Terenów Wiejskich 2008, 5, 23–29. (In Polish) [Google Scholar]
  53. Sillmann, J.; Roeckner, E. Indices for extreme events in projections of anthropogenic climate change. Clim. Chang. 2008, 86, 83–104. [Google Scholar] [CrossRef] [Green Version]
  54. Trenberth, K.E.; Dai, A.; Rasmussen, R.M.; Parsons, D.B. The Changing character of precipitation. Bull. Am. Meteorol. Soc. 2003, 84, 1205–1217. [Google Scholar] [CrossRef]
  55. Easterling, D.R.; Horton, B.; Jones, P.D.; Peterson, T.C.; Karl, T.R.; Parker, D.E.; Salinger, M.J.; Razuvayev, V.; Plummer, N.; Jamason, P.; et al. Maximum and Minimum Temperature Trends for the Globe. Science 1997, 277, 364–367. [Google Scholar] [CrossRef] [Green Version]
  56. Tomassini, L.; Jacob, D. Spatial analysis of trends in extreme precipitation events in high-resolution climate model results and observations for Germany. J. Geophys. Res. Atmos. 2009, 114, D12113. [Google Scholar] [CrossRef]
  57. Pinke, Z.; Decsi, B.; Kozma, Z.; Vári, Á.; Lövei, G.L. A spatially explicit analysis of wheat and maize yield sensitivity to changing groundwater levels in Hungary, 1961–2010. Sci. Total Environ. 2020, 715, 136555. [Google Scholar] [CrossRef]
  58. Jalota, S.K.; Vashisht, B.B.; Sharma, S.; Kaur, S. Climate change and groundwater. In Understanding Climate Change: Impacts on Crop Productivity and Water Balance; Academic Press: Cambridge, UK, 2018. [Google Scholar]
  59. Ray, D.K.; Ramankutty, N.; Mueller, N.D.; West, P.C.; Foley, J.A. Recent patterns of crop yield growth and stagnation. Nat. Commun. 2012, 3, 1293. [Google Scholar] [CrossRef] [Green Version]
  60. Olesen, J.E.; Bindi, M. Consequences of climate change for European agricultural productivity, land use and policy. Eur. J. Agron. 2002, 16, 239–262. [Google Scholar] [CrossRef]
  61. Zipper, S.C.; Soylu, M.E.; Booth, E.G.; Loheide, S.P. Untangling the effects of shallow groundwater and soil texture as drivers of subfield–scale yield variability. Water Resour. Res. 2015, 51, 6338–6358. [Google Scholar] [CrossRef] [Green Version]
  62. Chai, Q.; Gan, Y.; Zhao, C.; Xu, H.; Waskom, R.M.; Niu, Y.; Siddique, K.H.M. Regulated deficit irrigation for crop production under drought stress. A review. Agron. Sustain. Dev. 2016, 36, 3. [Google Scholar] [CrossRef] [Green Version]
  63. Zipper, S.C.; Qiu, J.; Kucharik, C.J. Drought effects on US maize and soybean production: Spatiotemporal patterns and historical changes. Environ. Res. Lett. 2016, 11, 094021. [Google Scholar] [CrossRef]
  64. Cattivelli, L.; Rizza, F.; Badeck, F.-W.; Mazzucotelli, E.; Mastrangelo, A.M.; Francia, E.; Marè, C.; Tondelli, A.; Stanca, A.M. Drought tolerance improvement in crop plants: An integrated view from breeding to genomics. Field Crop. Res. 2008, 105, 1–14. [Google Scholar] [CrossRef]
  65. Vereecken, H.; Weynants, M.; Javaux, M.; Pachepsky, Y.; Schaap, M.G.; van Genuchten, M.T. Using pedotransfer functions to estimate the van Genuchten–Mualem soil hydraulic properties: A review. Vadose Zone J. 2010, 9, 795–820. [Google Scholar] [CrossRef]
  66. Connolly, R.D. Modelling effects of soil structure on the water balance of soil-crop systems: A review. Soil Tillage Res. 1998, 48, 1–19. [Google Scholar] [CrossRef]
  67. Talebnejad, R.; Sepaskhah, A.R. Effect of different saline groundwater depths and irrigation water salinities on yield and water use of Quinoa in Lysimeter. Agric. Water Manag. 2015, 148, 177–188. [Google Scholar] [CrossRef]
  68. Wu, Y.; Liu, T.; Paredes, P.; Duan, L.; Pereira, L.S. Water use by a groundwater dependent maize in a semi–arid region of Inner Mongolia: Evapotranspiration partitioning and capillary rise. Agric. Water Manag. 2015, 152, 222–232. [Google Scholar] [CrossRef] [Green Version]
  69. Karimov, A.K.; Šimůnek, J.; Hanjra, M.A.; Avliyakulov, M.; Forkutsa, I. Effects of the shallow water table on water use of winter wheat and ecosystem health: Implications for unlocking the potential of groundwater in the Fergana Valley (Central Asia). Agric. Water Manag. 2014, 131, 57–69. [Google Scholar] [CrossRef]
  70. Ayars, J.E.; Shouse, P.; Lesch, S.M. In situ use of groundwater by alfalfa. Agric. Water Manag. 2009, 96, 1579–1586. [Google Scholar] [CrossRef]
  71. Yang, J.; Wan, W.; Deng, W.; Zhang, G. Water fluxes at a fluctuating water table and groundwater contributions to wheat water use in the lower Yellow River flood plain, China. Hydrol. Proc. 2007, 21, 717–724. [Google Scholar] [CrossRef]
  72. Kahlown, M.A.; Ashraf, M.; Zia-ul-Haq. Effect of shallow groundwater table on crop water requirements and crop yields. Agric. Water Manag. 2005, 76, 24–35. [Google Scholar] [CrossRef]
  73. Hutmacher, R.B.; Ayars, J.E.; Vail, S.S.; Bravo, A.D.; Dettinger, D.; Schoneman, R.A. Uptake of shallow groundwater by cotton: Growth stage, groundwater salinity effects in column lysimeters. Agric. Water Manag. 1996, 31, 205–223. [Google Scholar] [CrossRef]
  74. Rydałowski, M. The influence of groundwater level and year conditions on the evapotranspiration of salix viminalis l. in view of lysimetric analyses. Woda Środowisko Obszary Wiejskie 2016, 16, 73–84. (In Polish) [Google Scholar]
  75. Kravchenko, A.N.; Bullock, D.G. Spatial variability of soybean quality data as a function of field topography: I. Spatial data analysis. Crop Sci. 2002, 42, 804–815. [Google Scholar] [CrossRef]
  76. Kravchenko, A.N.; Bullock, D.G. Spatial variability of soybean quality data as a function of field topography: II. A proposed technique for calculating the size of the area for differential soybean harvest. Crop Sci. 2002, 42, 816–821. [Google Scholar] [CrossRef]
  77. Kravchenko, A.N.; Thelen, K.D.; Bullock, D.G.; Miller, N.R. Relationship among crop grain yield, topography, and soil electrical conductivity studied with cross-correlograms. Agron. J. 2003, 95, 1132–1139. [Google Scholar] [CrossRef]
  78. Kennedy, B.A. Surface Mining, 2nd ed.; Society for Mining, Metallurgy and Exploration Inc.: Englewood, CO, USA, 1990. [Google Scholar]
  79. Shah, A.M. Reclaiming Indian Mines. Cornerstone 2015, 3, 36–39. [Google Scholar]
  80. Pietrzykowski, M. Reclamation and reconstruction of terrestrial ecosystems on mine sites–ecological effectiveness assessment. In Energy Science and Technology, Coal Energy; Govil, J.N., Ed.; Studium Press LLC: Houston, TX, USA; New Dehli, India, 2015; Volume 2, pp. 121–151. [Google Scholar]
  81. Pavloudakis, F.; Roumpos, C.; Karlopoulos, E.; Koukouzas, N. Sustainable Rehabilitation of Surface Coal Mining Areas: The Case of Greek Lignite Mines. Energies 2020, 13, 3995. [Google Scholar] [CrossRef]
  82. Gruszczyński, S. Classification of soils in post mining areas reclamation. Przegląd Górniczy 2010, 66, 120–125. (In Polish) [Google Scholar]
  83. Kasztelewicz, Z. Approaches to post-mining land reclamation In Polish open-cast lignite mining. Civ. Environ. Eng. Rep. 2014, 12, 55–67. [Google Scholar] [CrossRef] [Green Version]
  84. Michalski, A. Methods of management of former opencast mining areas of “Adamów” S.A. in Turek and “Konin” S.A. in Kleczew. Soil Sci. Annu. 2004, 55, 281–290. [Google Scholar]
  85. The Photovoltaic Farm in Brudzew Will be Built by ZE PAK Subsidiary. Available online: https://www.wnp.pl/energetyka/farme-fotowoltaiczna-w-brudzewie-wybuduje-spolka-corka-ze-pak,439843.html (accessed on 17 January 2021). (In Polish).
  86. Szczepiński, J. The Significance of Groundwater Flow Modeling Study for Simulation of Opencast Mine Dewatering, Flooding, and the Environmental Impact. Water 2019, 11, 848. [Google Scholar] [CrossRef] [Green Version]
  87. Healy, R. Estimating Groundwater Recharge, 1st ed.; Cambridge University Press: Cambridge, UK, 2010. [Google Scholar]
  88. Stachowski, P. Assessment of the reconstruction of the water table in the areas transformed by brown coal mining. Rocznik Ochrona Środowiska 2007, 9, 225–238. (In Polish) [Google Scholar]
  89. Basso, B.; Kendall, A.D.; Hyndman, D.W. The future of agriculture over the Ogallala Aquifer: Solutions to grow crops more efficiently with limited water. Earths Future 2013, 1, 39–41. [Google Scholar] [CrossRef]
  90. Kendy, E.; Zhang, Y.; Liu, C.; Jinxia, C.; Wang, J.; Steenhuis, T. Groundwater recharge from irrigated cropland in the North China Plain: Case study of Luancheng County, Hebei Province, 1949–2000. Hydrol. Process. 2004, 18, 2289–2302. [Google Scholar] [CrossRef]
  91. Aw-Hassan, A.; Rida, F.; Telleria, R.; Bruggeman, A. The impact of food and agricultural policies on groundwater use in Syria. J. Hydrol. 2014, 513, 204–215. [Google Scholar] [CrossRef] [Green Version]
  92. Calvino, P.A.; Andrade, F.H.; Sadras, V.O. Maize yield as affected by water availability, soil depth, and crop management. Agron. J. 2003, 95, 275–281. [Google Scholar] [CrossRef]
  93. Leeper, R.A.; Runge, E.C.A.; Walker, W.M. Effect of plant–available stored soil moisture on corn yields: 1. Constant climatic conditions. Agron. J. 1974, 66, 723–727. [Google Scholar] [CrossRef]
  94. Kasztelewicz, Z.; Sikora, M.; Zajączkowski, M. The Poniec-Krobia deposit in extending the Konin lignite mining and power generation basin. Energy Policy J. 2012, 15, 135–146. (In Polish) [Google Scholar]
  95. European Commission. A Farm to Fork Strategy for a Fair, Healthy and Environmentally-Friendly Food System; Communication from the Commission to the European Parliament, the Council, the European Economic and Social Committee and the Committee of the Regions; 20.5.2020 COM (2020) 381 Final; European Commission: Brussels, Belgium, 2020. [Google Scholar]
  96. Pepliński, B. Determinants of Regional Changes in the Pig Production Sector in Poland; Poznań University of Life Sciences: Poznan, Poland, 2019. (In Polish) [Google Scholar]
  97. Central Statistical Office. Procurement and Prices of Agricultural Products in 2015–2019; Central Statistical Office: Warsaw, Poland, 2020. (In Polish)
  98. Central Statistical Office. Statistical Yearbook 1956–1997; Central Statistical Office: Warsaw, Poland, 1998. (In Polish)
  99. Central Statistical Office. Statistical Yearbook of Voivodships 1975–1997; Central Statistical Office: Warsaw, Poland, 1998. (In Polish)
  100. Central Statistical Office. Statistical Yearbook of Poviats 1970–1974; Central Statistical Office: Warsaw, Poland, 1975. (In Polish)
  101. Central Statistical Office. Poviats Statistics 1966–1970; Central Statistical Office: Warsaw, Poland, 1971. (In Polish)
  102. Central Statistical Office. Statistical Yearbook of the Bydgoszcz Voivodship 1960–1974; Central Statistical Office: Bydgoszcz, Poland, 1975. (In Polish)
  103. Central Statistical Office. Statistical Yearbook of the Łódź Voivodship 1960–1974; Central Statistical Office: Lodz, Poland, 1975. (In Polish)
  104. Central Statistical Office. Statistical Yearbook of the Poznań Voivodship 1960–1974; Central Statistical Office: Poznan, Poland, 1975. (In Polish)
  105. Central Statistical Office. Statistical Yearbook of the Warszawa Voivodship 1960–1974; Central Statistical Office: Warsaw, Poland, 1975. (In Polish)
  106. Central Statistical Office. Economic Development of Poviats in the Years 1950–1965; Central Statistical Office: Warsaw, Poland, 1966. (In Polish)
  107. Local Date Bank. Available online: https://bdl.stat.gov.pl/BDL/start (accessed on 5 January 2021).
  108. Pepliński, B. Animal production location in suburban areas of Polish metropolitan centers. Sustainability 2020, 12, 2619. [Google Scholar] [CrossRef] [Green Version]
  109. Stanisz, A. An Accessible Statistics Course Using STATISTICA PL with Examples from Medicine; StatSoft: Krakow, Poland, 2007. (In Polish) [Google Scholar]
  110. Plans for Reclamation of Post-Mining Areas as Part of Activities Carried Out by ZE PAK S.A. Available online: https://www.google.com/url?sa=t&rct=j&q=&esrc=s&source=web&cd=&ved=2ahUKEwiPpe6r7MruAhVNiYsKHdDzAJgQFjAEegQIBRAC&url=http%3A%2F%2Forka.sejm.gov.pl%2Fopinie9.nsf%2Fdok%3FOpenAgent%26669_20201014_2&usg=AOvVaw08GYu_jyh245tOoCSpN3-- (accessed on 2 February 2021). (In Polish)
  111. Gilewska, M.; Otremba, M. Revitalisation of post-mining resions in the area of the town of Konin. Zeszyty Naukowe Inżynieria Środowiska 2013, 149, 59–67. (In Polish) [Google Scholar]
  112. Kordowski, J.; Brykała, D.; Bartczak, A.; Kaczmarek, H.; Słowiński, M. Anthropogenic and Natural Changes of Geographical Environment in the Kuyavian-Pomeranian Voivodeship–Selected Examples, Prace Geograficzne 223; PAN: Warsaw, Poland, 2010. (In Polish) [Google Scholar]
  113. Paczyński, B.; Sadurski, A. Regional Hydrogeology of Poland: Mineral, Curative and Thermal Waters and Mine Waters; Państwowy Instytut Geologiczny: Warsaw, Poland, 2007; Volume II. (In Polish) [Google Scholar]
  114. Kasztelewicz, Z.; Czyż, J.; Dwornik, E. Mining art in the 60th anniversary of KWB “Konin”. Węgiel Brunatny 2005, 53, 23–29. (In Polish) [Google Scholar]
  115. Wachowiak, G.; Wachowiak, A. Reservoir at the closing excavation of the open pit “Pątnów” of the lignite opencast mine “Konin” and its water balance in 2003–2004. Badania Fizjograficzne Polska Zachodnia Seria A Geografia Fizyczna 2005, 56, 157–176. (In Polish) [Google Scholar]
  116. Opencasts. Available online: http://www.kwbkonin.pl/ (accessed on 25 January 2021). (In Polish).
  117. Maćkowiak, J.; Siepielska, T.; Gradecki, D. Impact of lignite drainage in the Konin region on the near-surface aquifer. Węgiel Brunatny 1998, 22, 26–28. (In Polish) [Google Scholar]
  118. Mocek, A.; Owczarzak, W. Monitoring of Soil-Soil Water Table Necessary for Delineation of Soil Degradation Zones (Mainly Grasslands) in the Area Covered by the Stage and Soil Survey in the Tomisławice Open-Pit Area; Poznań University of Life Sciences: Poznan, Poland, March 2013. (In Polish) [Google Scholar]
  119. Magdziarek, M.; Brusiło, A.; Waloch, P.; Magdziarek, M.; Szulczyk, J.; Marecki, M. Report on Environmental Impact of the Odkrywka Ościsłowo; Ekogeo, Przedsiębiorstwo Projektowo—Usługowe: Wargowo, Poland, 2015. (In Polish) [Google Scholar]
  120. Szablewski, W.; Derkowska–Sitarz, M. Filling of Lubstów reservoir of KWB Konin S.A. Górnictwo Odkrywkowe 2014, 60, 40–46. (In Polish) [Google Scholar]
  121. Gilecki, R.; Kacprowska, J.; Dembicz, E.; Nagrodkiewicz, L.; Stosio, M. Primary Energy Balance 2004–2019; Agencja Rozwoju Energii: Warsaw, Poland, 2020. (In Polish) [Google Scholar]
  122. Kasztelewicz, Z.; Ptak, M.; Sikora, M. Lignite as the optimal energy source for Poland. Zeszyty Naukowe IGSMiE PAN 2018, 106, 61–84. (In Polish) [Google Scholar]
  123. Kasztelewicz, Z.; Patyk, M. The Modern and Efficiently Coal Power Plants Strategic Challenge for Polish. Energy Policy J. 2015, 18, 46–59. (In Polish) [Google Scholar]
  124. Zespół Elektrowni Pątnów-Adamów-Konin SA, 2016 Results. Available online: https://ri.zepak.com.pl/en/presentations.html?y=2016 (accessed on 31 January 2021).
  125. Zespół Elektrowni Pątnów-Adamów-Konin SA, 2014 Results. Available online: https://ri.zepak.com.pl/en/presentations.html?y=2014 (accessed on 31 January 2021).
  126. Zespół Elektrowni Pątnów-Adamów-Konin SA, 2012 Results. Available online: https://ri.zepak.com.pl/en/presentations.html?y=2013 (accessed on 31 January 2021).
  127. Sadowski, A.; Czubak, W.; Poczta, W.; Rowiński, J. Area and economic structures of Polish agriculture and other EU countries. In The Structure of Polish Agriculture Compared to the European Union; Poczta, W., Rowiński, J., Eds.; CeDeWu: Warsaw, Poland, 2019; pp. 45–81. (In Polish) [Google Scholar]
  128. Pepliński, B.; Poczta, W.; Rowiński, J. Structure of livestock production and its evolution. In The Structure of Polish Agriculture Compared to the European Union; Poczta, W., Rowiński, J., Eds.; CeDeWu: Warsaw, Poland, 2019; pp. 83–139. (In Polish) [Google Scholar]
  129. Electricity Market Characteristics. 2019. Available online: https://www.ure.gov.pl/en/markets/electricity/elctricitymrket/292,2019-Electricity-Market-Characteristics.html (accessed on 3 February 2021).
  130. Włodek, S.; Biskupski, A. Soil moisture dynamics in the Belchatow brown coal mine area. Soil Sci. Annu. 2011, 62, 420–427. (In Polish) [Google Scholar]
  131. Owczarzak, W.; Mocek, A.; Kaczmarek, Z. Impact of the “Drzewce” open-cast mine drainage barrier on the hydrological changes in the surrounding area. Soil Sci. Annu. 2011, 62, 311–324. (In Polish) [Google Scholar]
  132. Owczarzak, W.; Mocek, A.; Kaczmarek, Z.; Gajewski, P. The evaluation of natural and anthropogenic degradation of soils in the area of dehydration influence of Drzewce lignite pit. Soil Sci. Annu. 2008, 59, 177–190. (In Polish) [Google Scholar]
  133. Biskupski, A.; Włodek, S.; Pabin, J. Soil moisture dynamics within the depression sink of brown coal open mine at Belchatow. Soil Sci. Annu. 2008, 59, 18–24. (In Polish) [Google Scholar]
  134. Pabin, J.; Włodek, S.; Biskupski, A. The influence of the deep drainage of the brown coal strip mine at Belchatow on soil water content. Soil Sci. Annu. 2008, 59, 191–195. (In Polish) [Google Scholar]
  135. Włodek, S.; Biskupski, A.; Pabin, J. Soil moisture in the region of brown coal strip mine at Belchatow. Soil Sci. Annu. 2008, 59, 230–235. (In Polish) [Google Scholar]
  136. Mocek, A.; Owczarzak, W.; Kaczmarek, Z. Changes of groundwater levels in soils surrounding the “Kozmin” brown coal exploitation hollow. Roczniki Akademii Rolniczej Poznaniu Melioracje Inżynieria Środowiska 2002, 23, 331–342. (In Polish) [Google Scholar]
  137. Mocek, A.; Owczarzak, W.; Kaczmarek, Z. Hydrological changes in the soils of Warta Pravalley within the influance of “Koźmin” lignite pit. Contemp. Probl. Manag. Environ. Prot. 2009, 1, 109–124. [Google Scholar]
  138. Chodak, T.; Kaszubkiewicz, J.; Bogda, A.; Szerszeń, L.; Bogacz, A. Water conditions of soils located within the range of depression funnel of the existing water intake in Brzeg Głogowski and the planned one in the region of Czerna-Dobrzejowice. Zeszyty Problemowe Postepow Nauk Rolniczych 1995, 418, 169–174. (In Polish) [Google Scholar]
  139. Chodak, T.; Borkowski, J.; Bogda, A.; Szerszeń, L.; Nowiński, S. Prognosis of changes in soil environment within the range of depression funnel of “Potoczek” water intake. Zeszyty Problemowe Postepow Nauk Rolniczych 1995, 418, 175–184. (In Polish) [Google Scholar]
  140. Włodek, S.; Biskupski, A.; Pabin, J.; Hryńczuk, B.; Kaus, A. The dynamics of ground moisture in the region of brown coal strip mine at Bełchatów on the example of locality Łękińsko. Roczniki Akademii Rolniczej Poznaniu 1999, 160, 211–219. (In Polish) [Google Scholar]
  141. Hlavinka, P.; Trnka, M.; Semerádová, D.; Dubrovský, M.; Žalud, Z.; Možný, M. Effect of drought on yield variability of key crops in Czech Republic. Agric. For. Meteorol. 2009, 149, 431–442. [Google Scholar] [CrossRef]
  142. Ren, D.; Xu, X.; Engel, B.; Huang, G. Growth responses of crops and natural vegetation to irrigation and water table changes in an agro–ecosystem of Hetao, upper Yellow River basin: Scenario analysis on maize, sunflower, watermelon and tamarisk. Agric. Water Manag. 2018, 199, 93–104. [Google Scholar] [CrossRef]
  143. Nosetto, M.D.; Jobbágy, E.G.; Jackson, R.B.; Sznaider, G.A. Reciprocal influence of crops and shallow ground water in sandy landscapes of the Inland Pampas. Field Crop. Res. 2009, 113, 138–148. [Google Scholar] [CrossRef]
  144. Morgan, B.J.; Daughtry, C.S.; Russ, A.L.; Dulaney, W.P.; Gish, T.J.; Pachepsky, Y.A. Effect of shallow subsurface flow pathway networks on corn yield spatial variation under different weather and nutrient management. Int. Agrophys. 2019, 33, 271–276. [Google Scholar] [CrossRef]
  145. Georgakellos, D.A. Impact of a possible environmental externalities internalisation on energy prices: The case of the greenhouse gases from the Greek electricity sector. Energy Econ. 2010, 32, 202–209. [Google Scholar] [CrossRef]
  146. Büke, T.; Köne, A.C. Estimation of the health benefits of controlling air pollution from the Yatağan coal-fired power plant. Environ. Sci. Policy 2011, 14, 1113–1120. [Google Scholar] [CrossRef]
  147. Dimitrijević, Z.; Tatić, K.; Knežević, A.; Salihbegović, I. External costs from coal-fired thermal plants and sulphur dioxide emission limit values for new plants in Bosnia and Herzegovina. Energy Policy 2011, 39, 3036–3041. [Google Scholar] [CrossRef]
  148. Taranto, Y.; Köksal, M.A.; Dal, E. The External Cost of Fossil Fuel Use in Power Generation, Heating and Road Transport in Turkey; Shura Energy Transition Center: Istanbul, Turkey, 2020. [Google Scholar]
  149. Papagiannis, A.; Roussos, D.; Menegaki, M.; Damigos, D. Externalities from lignite mining-related dust emissions. Energy Policy 2014, 74, 414–424. [Google Scholar] [CrossRef]
  150. Ministry of Energy. Energy Policy of Poland Until 2040 (EPP2040); Ministry of Energy: Warsaw, Poland, 2021.
Figure 1. Location of coal deposits and cones of depression in the district of Konin as of 1996. Source: Map from [113]. Map legend: 1-lignite open-cast mines and a level of the drainage of coal bed; 2-external waste banks; 3-rivers and water level gauges of the Institute of Meteorology and Water Management; 4-rainfall and groundwater measuring stations of IMGW; 5-boundaries of the inflow zone of filtered water from lakes; 6-the range of the cone of depression in the Cretaceous-Neogene aquifer; 7-hydroisohipsa curves (meters above sea level) of the water table of the Cretaceous-Neogene aquifer as of 1996; 8-directions of groundwater runoff; 9-hydrogeological water parting of the catchment area.
Energies 14 01917 g001
Figure 2. Location of coal deposits and cones of depression in the district of Turek as of 1996. Source: Map from [113]. Map legend as in Figure 1.
Energies 14 01917 g002
Figure 3. Yield level dynamics of selected crops depending on the distance from the open–cast mines (according to the data from the analyzed districts): (a) cereal; (b) potato; (c) sugar beet. Source: Based on [100,101,102,103,104,105,106].
Energies 14 01917 g003aEnergies 14 01917 g003b
Figure 4. Yield level dynamics of selected crops depending on the distance from the open-cast mines (according to the data from the analyzed voivodships): (a) cereal; (b) potato; (c) sugar beet. Source: Based on [100,101,102,103,104,105,106].
Energies 14 01917 g004aEnergies 14 01917 g004b
Table 1. Characteristics of lignite open-cast mines in the Konin-Turek Basin.
Coal SeamExtraction Period (Years)Production Volume Until 2019 (Mg)Remaining to be Mined (Mg)Depth of Deposit (m)Completion of Filling in the End Reservoir (Year)
Deposits of coal in the districts of Konin and Koło
Morzysław1941–19531-15-
Niesłusz1953–19614.1-27-
Gosławice1958–197338.9-55-
Pątnów1962–2001129.8-70-
Kazimierz1965–2011131-702024
Jóźwin1971–20221464.9582055
Lubstów1982–2009107-1582026
Drzewce2005–202331.24552035
Tomisławice2010–203015.126.8672042
Deposits of coal in the district of Turek
Adamów1964–20201090.8552036
Bogdałów1975–199138-50-
Władysławów1976–201238-552024
Koźmin1991–201631.8 452023
Sources: Based on [88,110,111,112,113,114,115,116].
Table 2. The yield of selected crops and the dynamics of yield depending on the distance from the open-pit mines (according to the data from the analyzed districts).
GroupAverage Yield in 1956–1960 Years [t × ha−1]Average Yield in 1969–1973 Years [t × ha−1]Dynamic [%]
CerealPotatoSugar BeetCerealPotatoSugar BeetCerealPotatoSuger Beet
up to 20 km1.5613.721.92.1117.432.1135.0127.4146.5
20–40 km1.6713.419.42.3318.632.9140.0138.5169.6
40–60 km1.7213.321.82.4018.534.4139.9139.2158.1
60–80 km1.7012.818.02.3717.727.4139.9139.0152.5
80–100 km1.6412.619.92.3518.230.2143.9144.1151.4
Sources: Calculations based on [100,101,102,103,104,105,106].
Table 3. The yield of selected crops and the dynamics of yield depending on the distance from the open-pits mines (according to the data from the analyzed voivodships).
GroupAverage Yield in 1956–1960 Years [t × ha−1]Average Yield in 1993–1997 Years [t × ha−1]Dynamic [%]
CerealPotatoSuger BeetCerealPotatoSuger BeetCerealPotatoSuger Beet
group I1.6313.520.132.5617.035.7156.4126.5177.5
group II1.6813.019.482.9817.634.1177.4135.4175.1
group III1.6712.920.283.2018.437.6191.7142.8185.5
Sources: Calculations based on [100,101,102,103,104,105,106].
Table 4. Results of the analysis of variance test for significance of differences in yields of selected crops in three groups depending on the distance from the outcrop (according to data from voivodeships) at the beginning and end of the analysis period.
CultivationTime PeriodTest Results
Cereals1956–1960Analysis of varianceF = 0.0962p = 0.9096
Levene’s test for homogeneity of varianceF = 0.5161p = 0.6212
Least significant differences test{1}↔{2}
p = 0.6763
{1}↔{3}
p = 0.7570
{2}↔{3}
p = 0.8262
1993–1997Analysis of varianceF = 0.7265p = 0.5217
Levene’s test for homogeneity of varianceF = 2.1508p = 0.1976
Least significant differences test{1}↔{2}
p = 0.5278
{1}↔{3}
p = 0.2892
{2}↔{3}
p = 0.6133
Potatoes1956–1960Analysis of varianceF = 1.4104p = 0.3147
Levene’s test for homogeneity of varianceF = 0.6015p = 0.5780
Least significant differences test{1}↔{2}
p = 0.3755
{1}↔{3}
p = 0.1549
{2}↔{3}
p = 0.5005
1993–1997Analysis of varianceF = 0.9901p = 0.4250
Levene’s test for homogeneity of varianceF = 3.6032p = 0.0938
Least significant differences test{1}↔{2}
p = 0.6946
{1}↔{3}
p = 0.2785
{2}↔{3}
p = 0.3745
Sugar Beets1956–1960Analysis of varianceF = 0.5185p = 0.6199
Levene’s test for homogeneity of varianceF = 0.5371p = 0.6101
Least significant differences test{1}↔{2}
p = 0.6732
{1}↔{3}
p = 0.7997
{2}↔{3}
p = 0.3490
1993–1997Analysis of varianceF = 0.8080p = 0.4889
Levene’s test for homogeneity of varianceF = 3.3950p = 0.1032
Least significant differences test{1}↔{2}
p = 0.6574
{1}↔{3}
p = 0.6880
{2}↔{3}
p = 0.2554
{1}—group I; {2}—group II; {3}—group III.
Table 5. External costs related to the exploitation of lignite in the Konin-Turek Basin, in the period 1961–2060 (€ million).
SpecificationVariant IVariant IIVariant IIIAverage€ × MWh−1
Yield decline caused by the operation of open-cast lignite mines
Open-pit mining area191717180.03
Group I30942752281528874.45
Group II28632603265727084.18
Total59765372548956128.66
Source: own calculations.
Table 6. External costs of air pollution caused by lignite combustion € × MWh−1.
StudyGeorgakellos [145]Sakulniyomporn [42]Büke, Köne [146]Dimitrijević [147]Coester [39] Máca [32] Wang [31] Taranto [148]
CountryGreeceThailandTurkeyBosnia and HerzegovinaGermanyCzech, Hungary, PolandChinaTurkey
Year of analysis2003–20042006–2008200720081995–2003201020152018
Health impactsNoYesYesNoYesYesYesNo
External costs43.96.81.8–35.22.7–19.211.158.1–77.563.836.3
Source: own calculations.
Publisher’s Note: MDPI stays neutral with regard to jurisdictional claims in published maps and institutional affiliations.

