1. Introduction
Climate change is one of the main challenges of modern civilization [
1,
2]. The global nature of this challenge has forced international cooperation, which has resulted in international agreements, especially the United Nations Framework Convention on Climate Change (UNFCC) entered into force on 21 March 1994 [
3]. The Kyoto Protocol operationalizes the UNFCC by committing industrialized countries and economies in transition to limit and reduce greenhouse gas (GHG) emissions in accordance with agreed individual targets. The provisions of the Kyoto Protocol were the basis for the launch in 2005 of the world’s largest organized emissions trading system, the European Union Emissions Trading Scheme (EU ETS). This system aims to reduce greenhouse gas emissions while limiting the negative economic effects of this solution as much as possible [
4].
The EU ETS was implemented gradually. At the beginning it consisted of an allocation of free allowances to all enterprises emitting GHG. Later, the auctioning mechanism started to be introduced. The period of system implementation can be divided into three phases: Phase I (2005–2006), Phase II (2007–2012), and Phase III (from 2013). In Phase I and II, free allowances were allocated at the national level (National Allocation Plans). In Phase I and II each country allocated allowances on its own, although later the approval of the European Commission was required. In Phase I, the allocation amounted to almost 100% of the existing CHG emission, in Phase II it was about 90%. Since the third trading period, EU harmonized rules have been the basis for allocation. Very detailed rules of allowance allocation have been introduced. Since 2013, no free allowances have been allocated in the electricity generation sector and companies have been obliged to buy 100% allowances. The exceptions are eight countries (Bulgaria, Cyprus, Czech Republic, Estonia, Hungary, Lithuania, Poland and Romania) whose energy sector was covered by the so-called derogation for energy. This derogation expires on 31 December 2030. In sectors other than power generation, a gradual transition to the auction system began. This allocation was based on a system of benchmarks calculated at the level of emissions associated with a specific product. The benchmark is the average emission from the 10% most efficient installations from the subsector. The benchmark system is to reflect technological progress and provide an incentive for operators to upgrade their installations. A new category has also been added of sectors at risk of carbon leakage, which may receive free allowances of up to 100% of the benchmark. The proper functioning of this system largely affects the achievement of the declared objectives (the system covers around 45% of total EU emissions), but also the proper functioning of the financial system if the transition to a low-carbon economy is too rapid and unexpected (transition risk). These objectives are particularly important for the energy sector [
5,
6]. The effect of a too rapid and unexpected shift to green energy may result in the sale of shares in energy companies, a reduction in their investment capacity and increasing pressure on energy prices. Industry (especially energy-intensive companies) would suffer in this way, followed by other sectors of the economy and consequently households [
7,
8].
The impact of the EU ETS on the decarbonization of the economy can be observed on the capital market [
9]. The changes taking place in the emission allowances market are one of the sources of carbon risk priced as carbon premium on the capital market [
4]. The aim of the paper is to find out whether there is a stable carbon premium in energy-intensive sectors. This premium is defined as the excess abnormal rate of return of dirty companies over relatively green ones. The occurrence of the carbon premium reflects investors’ reactions to the introduction and functioning of the EU ETS. It is evident that investors take carbon risk into account in their decisions. More broadly, carbon risk affects the allocation of capital between clean and dirty entities. The occurrence of a carbon premium therefore proves that the EUETS corrects the functioning of the market mechanism.
To analyze the size of the carbon premium we used the CAPM model and multi-factor Fama-French models. The conducted analyses were based on data of 39 EU ETS companies from the Orbis BVD database [
10], EquityRT [
11], information from the Directorate-General for Climate Action of European Commission [
12] and from the Fama French data library [
13]. Our approach is based on the studies by Oestrich and Tsiakas [
14] and Bernardini et al. [
15] The novelty of our study lies in the application of our own criterion for the separation of the portfolios of so-called brown companies (DIRTY) and green companies (CLEAN) based on the amount of emission allowances allocation. The divisions used so far have ignored the impact of the mechanisms for allocating emission allowances—as a result of this, the estimated carbon premium may have been unstable, especially in periods when the allocation rules have changed. In addition, we are focusing on energy-intensive companies, highlighting their strong relationship with the electric utilities. This allows us to examine the existence of carbon risk transmission between electric utilities and energy-intensive companies.
2. Carbon Risk and Carbon Premium—Literature Review
The problem of climate warming is not neutral to the level of risk borne by companies and investors. Karydas and Xepapadeas [
16] indicate that climate change is conducive to a positive and increasing risk premium. They state that the occurrence of environmental risk reduces the share of high-carbon assets in the market portfolio. A particular type of climate risk is the carbon risk. This risk applies both to companies that are affected by the greenhouse effect and to companies that emit greenhouse gases. The carbon risk is related to the role that CO
2 plays in a company’s value chain, including its public perception as an issuer. The level of carbon risk may also be affected by companies’ ability to adapt to changes in regulation and technology caused by climate warming [
17]. The carbon risk therefore reflects the positive as well as the negative consequences that companies will suffer due to changes in regulations, technology and attitudes of customers and investors caused by global warming. The financial nature of this risk makes the literature view it mainly from the perspective of the capital market. Roncalli et al. [
18] claim that it is linked to the market risk priced by the stock exchange and can be decomposed into a common (or systematic) and specific (or idiosyncratic) risk factor. As it is not possible to identify specific risk, researchers usually focus on the common risk factor that drives the carbon risk.
The search for an answer to the question of whether carbon risk significantly affects the capital market makes it necessary to measure this risk. This can be done by examining the relationship between EU Emission Allowances (EUA) price movements and returns on shares, using multi-factor regression models (MFM). Oberndorfer [
19] and Veith et al. [
20] were the first to do this. Both analyses lead to a common conclusion: on average, changes in the prices of emission allowances and stock prices were positively correlated. Oberndorfer [
19], in particular, states that these correlations differed according to the time and country of the companies’ domicile. In addition, Veith et al. [
20] found that the prices of emission allowances did not have a positive effect on carbon-free companies. Mo et al. [
21] extend the analysis of previous work mainly by comparing estimated effects in different periods. The attempt at estimation covers the years 2006–2009 and thus includes stages I and II of the EU ETS operation. They found that, on average, the correlation between carbon price changes and stock prices was positive in the first trading period [
19,
20], while in the second period it was negative. In addition, stock prices were much more sensitive to carbon price changes in phase II than before. In both cases, the differences are attributed to a more stringent allocation of allowances in phase II. Further studies on this subject are presented by Tian et al. [
22] and Pereira da Silva et al. [
23] The former show that the relationship between carbon prices and stock prices was largely due to specific shocks in the carbon market. Their investigation is undertaken for both phases I and II of the EU-ETS based on simple OLS, panel data and time-series analysis. The results indicate that the relationship between the EUA market and stock returns of electricity companies was largely driven by strong market shocks recorded in both periods. If the market shock impact is controlled, this relationship depends on the carbon intensity of the electricity generators. The stock returns of carbon-intensive companies are negatively affected by the EUA returns, while the opposite is true for less carbon-intensive producers. The volatility of stock returns of electricity companies is significantly driven in the same direction by the volatility of the EUA market.
By limiting the analysis to the Spanish stock exchange but, importantly, relying on data covering phases II and III, Pereira da Silva et al. [
23] expand the standard MFM approach to vector cointegration. Using the Vector Error Correction Model (VECM), which allows to monitor dynamic interactions between variables, the authors concluded that the relationship between carbon prices and stock prices was weak but positive in phase II and statistically insignificant in phase III. This result reflects well the transition from free allowances to full auctions for the electricity sector. In addition, this positive dependence is much stronger for the subgroup of clean energy producers.
Roncalii et al. [
18] indicate that the carbon beta of a stock can be interpreted as its carbon-related systematic risk. Therefore, it contains financial information that is extremely useful from a trading point of view. In particular, it can be used to improve the construction of a minimum variance portfolio, the main goal of which is to avoid unrewarded risks. Their research confirms that carbon risk is reflected in the valuation of stocks and indicates several stylized facts. Firstly, they note that carbon risk was valued more in early 2010 than it is now, with the relationship more present in the Eurozone. Secondly, they observe the convergence of absolute carbon risk valuation in different regions, except Japan. With regard to relative carbon risk, they confirm another transatlantic division, which they generally observe in investing in the Environmental Social Governance (ESG) [
24,
25]. European stocks have, on average, a negative beta carbon factor, while in North America it is positive. They also observe some differences between sectors. For example, there is a clear difference in the dynamics of carbon beta between the materials and energy sectors, and the other sectors.
The presented studies on the impact of carbon risk on the capital market only allow to determine in a very general way whether technological and regulatory changes and the public perception of issuers affect returns on shares. From the point of view of investors, it is also necessary to establish an appropriate carbon risk premium. The ability to quantify this premium is very important for managing the risk in investment portfolios. Furthermore, the analysis of the carbon premium can be additionally used to assess the correct functioning of tools to reduce CO
2 emissions—such as the ETS. In response to this need, the Fama-French-Carhart model [
26] can be extended to include a risk factor related to the level of emissions. This technique was used by Oestreich and Tsiakas [
14], among others, who carried out an extensive analysis of the carbon risk and the development of the carbon premium on the German market. Their analysis covered 65 German companies listed on the stock exchange. They divided all the companies into three portfolios, taking into account the criterion of the size of the free allocation. They included in the “DIRTY” portfolio companies whose allocation was greater than 1 million units, and in the “CLEAN” portfolio companies which did not receive free allocation. The absence of free allocation means that the company did not emit CO
2. Companies for which the free allocation was greater than zero but less than one million were included in the third “MEDIUM” portfolio. They then calculated the alpha factor for these models using the CAPM model, the Fama and French three-factor model and the four-factor model. The alpha of the DMC portfolio (DIRTY minus CLEAN) was this carbon premium. They made calculations for several periods, indicating that the carbon premium was only relevant for the first trading period (2005–2007). Bernardini et al. [
15] analyzed the carbon premium for electric utilities and have a different view on the impact of the EU ETS on stock returns. In their study, they see a statistically significant low-carbon premium which rose between 2012 and 2016. This means that investors engaged in strategies focused on low-carbon companies achieve a higher risk-adjusted return. This premium, which is large and statistically significant in particular from 2012 onwards, can be interpreted as an additional return that occurred when the market saw and valued the lower risk of companies with a larger share of the energy mix of low-carbon greenhouse gas installations. The analysis with a multifactor model to identify and measure the risk premium show that since the decarbonization process has accelerated (from 2012), an investment strategy more oriented towards low-carbon stocks would have harvested benefits in terms of higher yield, without altering the overall risk profile.
Important research on carbon risks was conducted by Görgen et al. [
17] They estimated the carbon premium on a sample of over 1600 companies from 43 countries. It is noteworthy that they use different nomenclature, often found in the literature. The equivalent of DIRTY, CLEAN and DMC portfolios are BROWN, GREEN and brown-minus-green (BMG), respectively. Their research is also distinguished by the methodology of qualification for individual portfolios. To isolate the clean (green) and dirty (brown) portfolios, they used a complex Brown-Green-Score (BGS) benchmark of more than fifty carbon risk variables, covering the three dimensions of corporate emissions: actual emissions, public perception of emissions and the company’s adaptability. They have not detected a significant carbon risk premium, stating that this may be related to the opposing price movements of brown firms and firms becoming greener, and also, that carbon risk is associated with unpriced cash-flow changes rather than priced discount-rate changes. In our view, this may be due to the fact that the BMG factor is based on more than 50 proxy variables, so investors may have some difficulty understanding which risk dimension is priced in by the market. In addition, authors use information on emissions from several databases, and it has been proven that there are large differences between databases in this respect [
27].
Similar analyses were also conducted on American companies by Bolton and Kacperczyk [
28]. It turned out that shares of companies with higher total CO
2 emissions (and changes in emissions) bring higher profits after controlling for size, book-to-market relations, momentum and other factors. They cannot explain this carbon premium through differences in unexpected profitability or other known risk factors. They also find that institutional investors implement exclusionary screening based on direct emission intensity in a few salient industries. Their results are consistent with the point of view that investors are demanding compensation for exposure to carbon emission risk. This conclusion has also been confirmed by studies on other than US capital markets. Bolton and Kacperczyk [
29] discovered the presence of positive carbon risk premium in all sectors on three continents, in Asia, Europe and North America. On the other hand, however, there are more and more studies showing that it is green companies that provide an additional premium. In et al. [
30] and Cheema-Fox et al. [
31] indicate that companies that are efficient in terms of carbon emissions are more profitable and generate higher profits. Matsumura et al. [
32] show that the market valuation is lower for companies with higher carbon emissions. Choi et al. [
33] provide evidence that stocks with higher carbon exposure achieve significantly lower future returns than other comparable stocks. Their results are in line with the view that exposure to CO
2 emissions indicates deteriorating investment opportunities in the future [
34].
Studies carried out to date on the impact of the EU ETS on the level of carbon risk premium have taken into account the division of companies into brown and green, considering criteria such as the carbon emission intensity of production [
15] and the absolute size of emission allowances [
14]. Such an approach is justified when examining the effectiveness of the system in achieving climate targets. However, it is irrelevant when examining the impact of the system on the companies that are most affected by it. Indeed, the efficiency of the system in achieving climate targets may be limited by the existing mechanism for the allocation of free emission allowances. This is particularly important when the way in which free emission allowances are allocated is changed during the system’s operation. Consequently, the results obtained may be unstable. On the other hand, very sophisticated indicators are used, which the average investor is not able to use. Therefore, in our study, we use the criterion of missing emission allowances to allocate companies between portfolios—thereby taking into account companies’ exposure to changes in the price of CO
2 emission allowances. We describe our solution in detail in the third paragraph of the paper.
3. Materials and Methods
From a methodological point of view, our study modifies and extends the analyses carried out by Oestrich and Tsiakas [
14] or Bernardini et al. [
15] In the first place, we classified the companies in the sample into one of three groups, taking into account their exposure to carbon risk: DIRTY, MEDIUM and CLEAN. For all companies, we have calculated weekly rates of return, which we have cleared of outliers within companies, using the winsorization technique. The use of this technique is based on the conviction that our intention is to detect a long-term relationship. One-off events, on the other hand, could artificially inflate as well as understate the statistics obtained. This is particularly important because of the relatively small number of portfolios created. Outlier observations have been defined as 5% of the most outlier observations, symmetrically. Then, based on the rates of return of individual companies, we calculated average rates of return on portfolios (portfolios of equal weight). On the basis of these portfolios, we examined regressions, in which the intercept (αi) constitutes an additional, abnormal, in the context of valuation models, rate of return.
We have carried out the estimation on several theoretical models, thereby avoiding a situation where the calculated premium would be correlated with another premium on the market, for example a size premium. In such a situation, the calculated carbon premium would be irrelevant, as it would not add anything new to the models currently used. From an investor’s point of view, it would also be irrelevant, as it could be obtained more cheaply by investing in indices of large companies.
The first theoretical model is the classic CAPM. This model explains the relationship between risk and the return expected by investors. According to this model, stock returns depend on the risk-free rate
, the market risk premium (
) and the risk index
. Beta reflects a company’s individual risk in relation to market risk. It is a concept that measures the expected move in a stock relative to movements in the overall market. By transferring the risk-free rate of return to the left side of the equation in its original form and making estimates with the intercept, we obtain an additional risk-free rate of return αi. The statistically significant difference in these ratios between the DIRTY and CLEAN portfolios is a carbon premium. The regressive model can be written as follows:
where
is the rate of return of the portfolio
i, over time
t,
is the risk-free rate of return over time
t,
is the rate of return of the market portfolio over time
t, while
is a random error.
The subsequent models can be seen as an extension of the CAPM, or rather as exemplary forms of the Intertemporal Capital Assets Pricing Model (ICAPM) [
35], as the CAPM does not provide for additional factors. The ICAPM, unlike the classical CAPM, is a multi-period model. Alternatively, they can be considered as models based on the theory of price arbitrage [
36]. The Fama-French three-factor model (FF3) [
37], in addition to the so-called market premium (
rM,t −
rf,t), takes into account the size effect, measured as the difference in rates of return between small and large companies (small-minus-big, SMB), and the potential premium, measured as the difference in rates of return between companies with a high book-to-market value ratio and a low book-to-market value ratio (high-minus-low, HML). This model can be written as follows:
where
SMBt is a size effect (small-minus-big), and
HMLt is a value premium (high-minus-low). This model will continue to be marked as FF3.
The four-factor model [
26], in addition to the previously mentioned factors, takes into account a momentum premium (WML, winners-minus-losers), which is the difference between the returns on a portfolio consisting of companies with the highest rate of return (winners) and a portfolio consisting of companies with the lowest rate of return (losers). The model supplemented by the WML factor takes the following form:
where
WMLt refers to a momentum premium.
The last model used in our analysis is the Fama-French [
38] five-factor model. This model is not an extension of the four-factor model, because we will not find a momentum premium in it. Instead, it takes into account, in addition to the three factors from the FF3 model, a profitability premium (RMW, robust-minus-weak) and an investment level premium (CMA, conservative-minus-aggressive). The first is calculated as the difference between the rates of return of portfolios consisting of companies with the highest profitability (robust) and the lowest profitability (weak). The investment premium, on the other hand, is the difference between the returns on portfolios of companies with a conservative investment style and an aggressive style. The five-factor model has the following form:
where
RMWt is a profitability premium and
CMAt is an investment factor.
Contrary to the work of Oestrich and Tsiakas [
14], it is not only German companies that are the subject of our study, but companies from all EU ETS countries. Instead, the sectors covered by the study are limited. We have carried out the study only on companies in the energy and energy-intensive sectors, which distinguishes our study from the study by Bernardini et al. [
15], who carried out the study only for electric utilities. This choice is a compromise between practical and theoretical considerations. In the context of valuation models, this choice is justified by the sectoral orientation of institutional investors in the market [
39]. The choice of the energy sector results from the importance of this sector for the economy. However, a small number of energy companies could prevent reliable results from being obtained. Noting the particular links between the energy sector and energy-intensive sectors, it seems that extending the study to include companies from energy-intensive sectors is a good compromise. This makes it possible to support the assumption of carbon risk transmission from the energy sector to other sectors, which is an important element of the transition risk concept [
15].
The second difference concerns the basis for qualification of companies in particular portfolios. In the reference study [
14], companies whose free allocation of allowances was higher than 1 million allowances were qualified to the DIRTY portfolio, companies which did not receive allowances were qualified to the CLEAN portfolio, and companies which received allowances but not more than 1 million to the MEDIUM portfolio. In our study, we use our own carbon risk exposure ratio (CRER) as an inclusion criterion for portfolios, which we write as:
where: Emission—number of tonnes of greenhouse gases emitted (in tonnes of CO
2 equivalent), Allocation—the number of emission allowances (EUAs) allocated to an operator of an installation (company), with one EUA giving entitlement to emit one tone, Total Assets—value of company assets in thousands of EURO.
The criterion we propose is a combination of two primary factors that determine the level of exposure to carbon risk: the activity’s emission intensity and the share of free allocation. The divisions used so far have ignored the impact of the allocation mechanisms for emission allowances. In our indicator, it is important that, as we move away from free allocation, the emissivity of assets becomes more important. Moreover, unlike the rather arbitrary qualification criterion (million-unit limit) used in the Oestrich and Tsiakas study [
14], the qualification is based on the percentile of the CRER. In the DIRTY portfolio we include companies whose maximum CRER between 2005 and 2016 was higher than or equal to the 80th percentile of the sample companies, and in the CLEAN portfolio when it was lower than or equal to the 20th percentile.
The CRER structure is based on the assumption that exposure to carbon risk depends on the number of missing allowances relative to asset value. The more emission rights in relation to assets companies have to buy the more they are exposed to fluctuations in the market price of EUAs. Therefore, allowance allocation is one of the determinants of carbon risk exposure.
In the study, the maximum value of CRER from the period 2005–2016 was used. The adoption of this solution was forced by the lack of data. However, our analysis shows that CRER for individual companies does not change significantly over time.
The study also differs in the period covered by the analysis. Our research covers the years 2003–2019, so the scope of the analysis goes beyond 2012, which is particularly important since, as stated by Oestrich and Tsiakas [
14], the carbon premium was in its initial phase, but it disappeared after 2009.
We have carried out a study on the energy-intensive companies covered by the EU ETS. The focus on the energy intensive companies is due to the fact that they are the largest emitters of greenhouse gases after the power companies. The convergence of our results with those of similar studies in the electric utilities sector confirms the transmission of carbon risk from the electric utilities sector to energy-intensive sectors, which is an important assumption of the concept of transition risk. Energy-intensive companies often generate their own electric power, which justifies their inclusion in the research sample.
The EU ETS was introduced in 2005, but our research period covers two earlier years. In our view, investors may have factored the implementation of the scheme into their decisions in advance, when the details of how the scheme would work were already known. On 31 May 2002, the European Community approved the Kyoto Protocol (Decision 2002/358/EC). This decision included reduction targets for individual countries. At that moment the burden sharing proposed in the Internal Burden Sharing Agreement was formally confirmed. On 13 October 2003 Directive 2003/87/EC was adopted, which established a system of emission allowance trading within the Community.
There are three reasons why other emissions trading systems in the world were not included in the analysis. Firstly, because of the weak link between these systems, which results in a large difference in allowance prices between the different systems [
40]. Secondly, due to the observation that investors are often locally oriented [
39,
41]. Extending the analysis to other trading systems would be fully justified in a situation where the systems are interlinked or assumed in theory, full diversification, no transaction costs, and so on. Currently, a small number of schemes are interconnected, and the links that exist in the world are, as they are naturally primarily local. Thirdly, extending the study would require the use of databases such as CDP, Trucost and Bloomberg. The disadvantage of these databases is that the information collected on emissions is based on information provided by companies, or is estimated. Although such a selection would have significantly increased the sample and extended the emissions analyzed to include indirect emissions, the reliability of information on emissions was crucial for us. As Busch et al. [
27] pointed out, there are significant differences between the available databases in terms of companies’ emissivity. By focusing on the EU ETS, we can be sure that reported emissions are subject to the same monitoring, reporting and verification procedures.
The data used in the study comes from three sources. Weekly rates of return on stocks of individual companies come from the Equity RT, information on free allowances received from 2005 to 2016 is taken from the database of the Directorate-General for Climate Action of European Commission, while information on the size of assets is taken from ORBIS. It should be noted that the information on allocations is attributed to installations and not to companies. We have therefore aggregated this information for the company that was listed as an “operator of installations” in the database. We have linked 15,164 installations to companies (from the ORBIS database), which accounts for almost 90% of all installations, and after excluding airline operators and public institutions (universities, hospitals, etc.), it represents almost 99.3% of all installations. We have finally identified 8711 companies, including 460 listed companies (according to the ORBIS database). After narrowing the sample to energy-intensive sectors, the number of companies was 182. Having eliminated any information gaps, the sample was established at 39 companies. This large sample reduction is due to the fact that many of the public companies were not publicly listed, or were being delisted, acquired, or were new entities (
Appendix A).
4. Results
Portfolio composition and basic descriptive statistics are presented in
Appendix B. Comparing the descriptive statistics of individual companies with similar statistics in the Oestrich and Tsiakas study [
14], there is a much higher volatility of the rates of return and a lower average. These differences are mainly due to the period of the rate of return used in the study. In our study, we used weekly rates of return and not monthly, as was the case in the work of Oestrich and Tsiakas [
14]. While high variability is beneficial for the selection of variables, its excessive value is a problem because it increases the random component. For this reason, we have not made a regression on the daily return rates, even though we had such data.
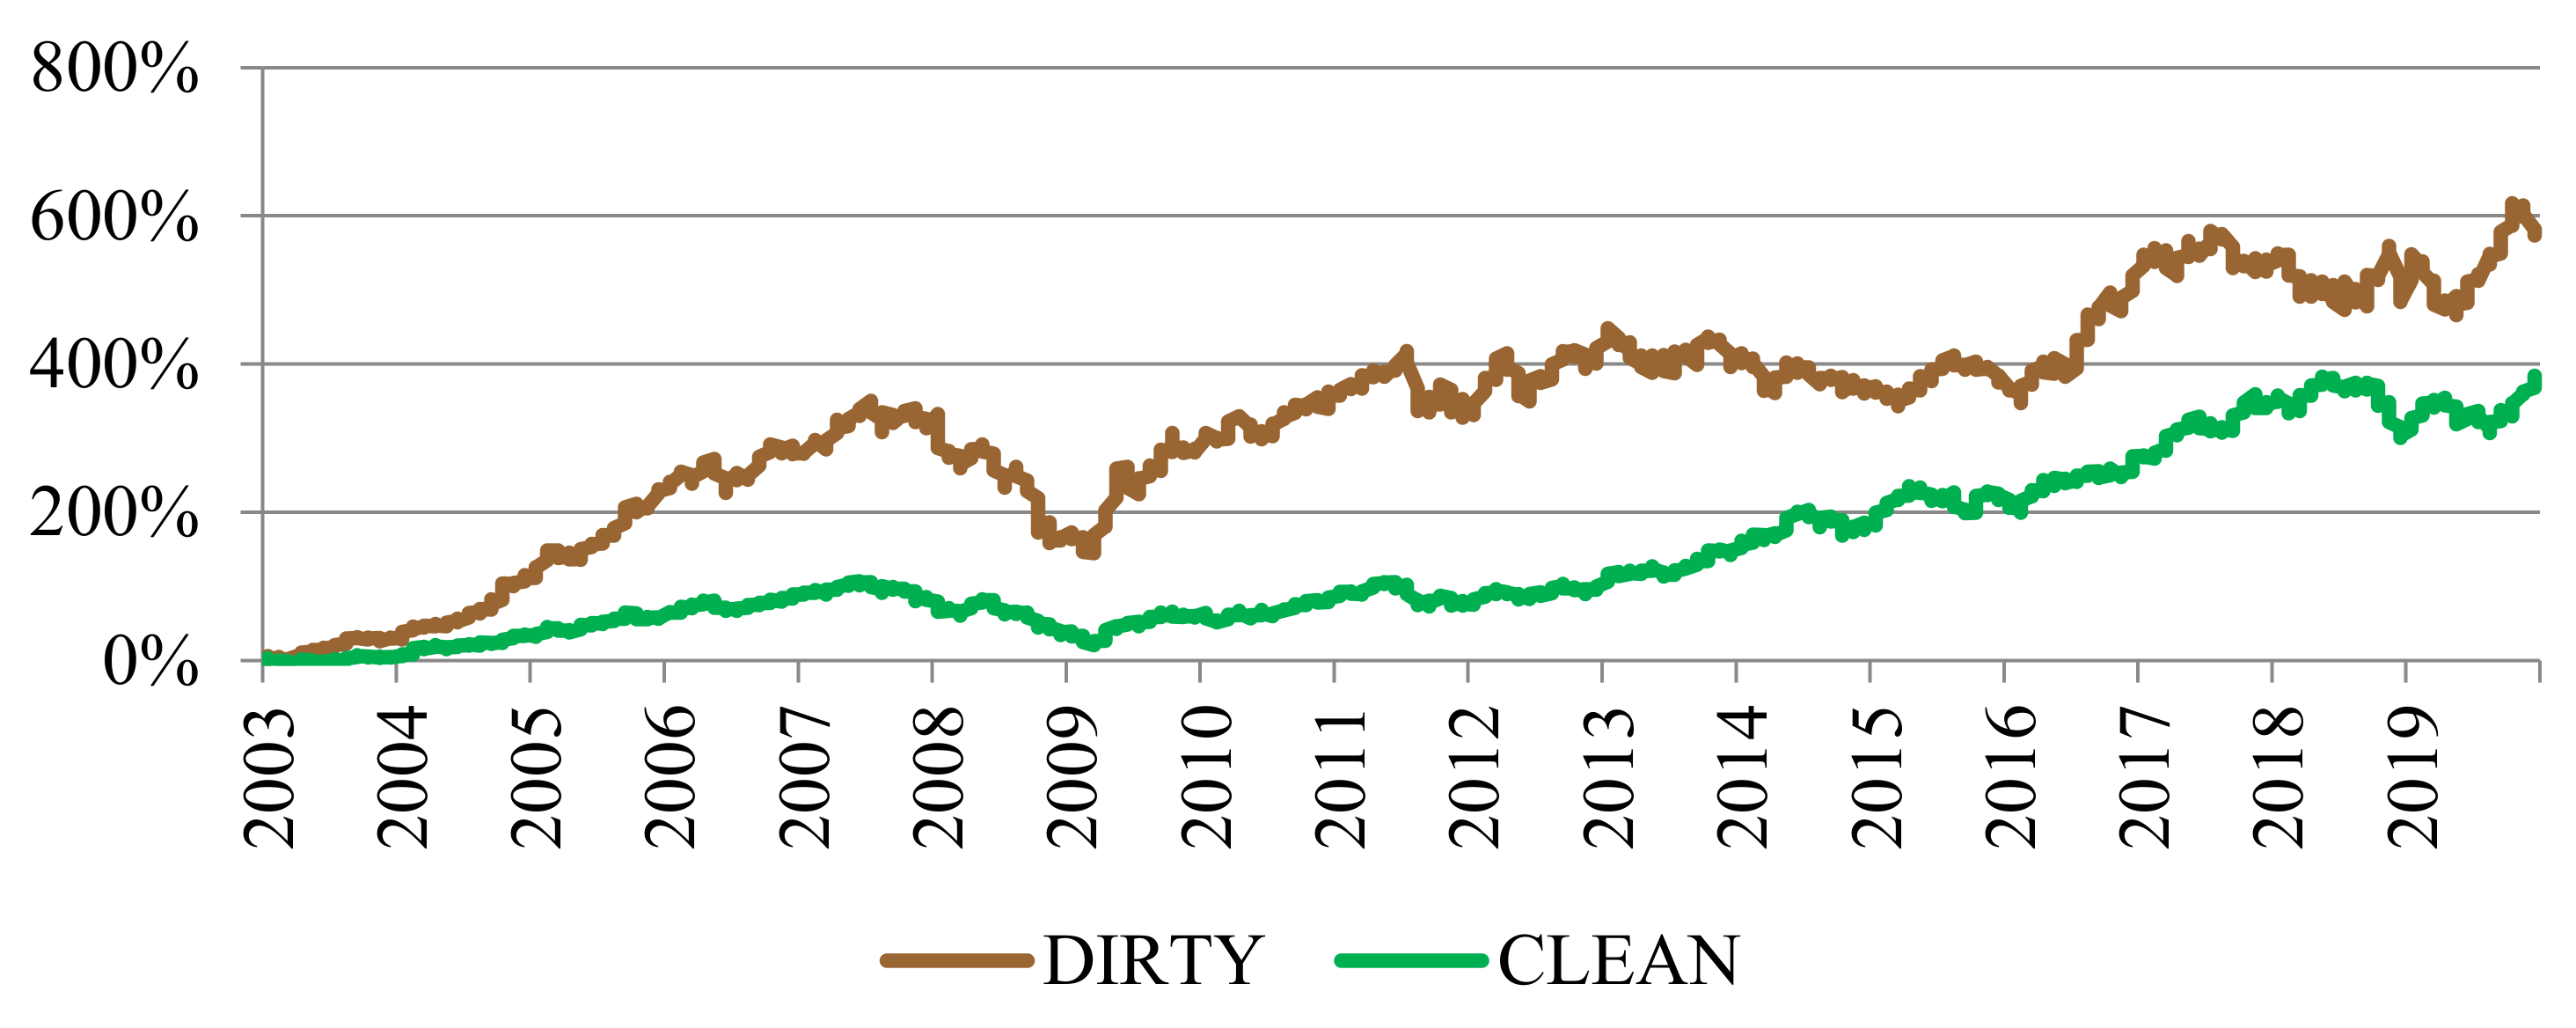
In order to assess the possibility for a carbon premium in energy-intensive companies, we first analyzed the development of the cumulative rate of return of the DIRTY and CLEAN portfolios created (
Figure 1).
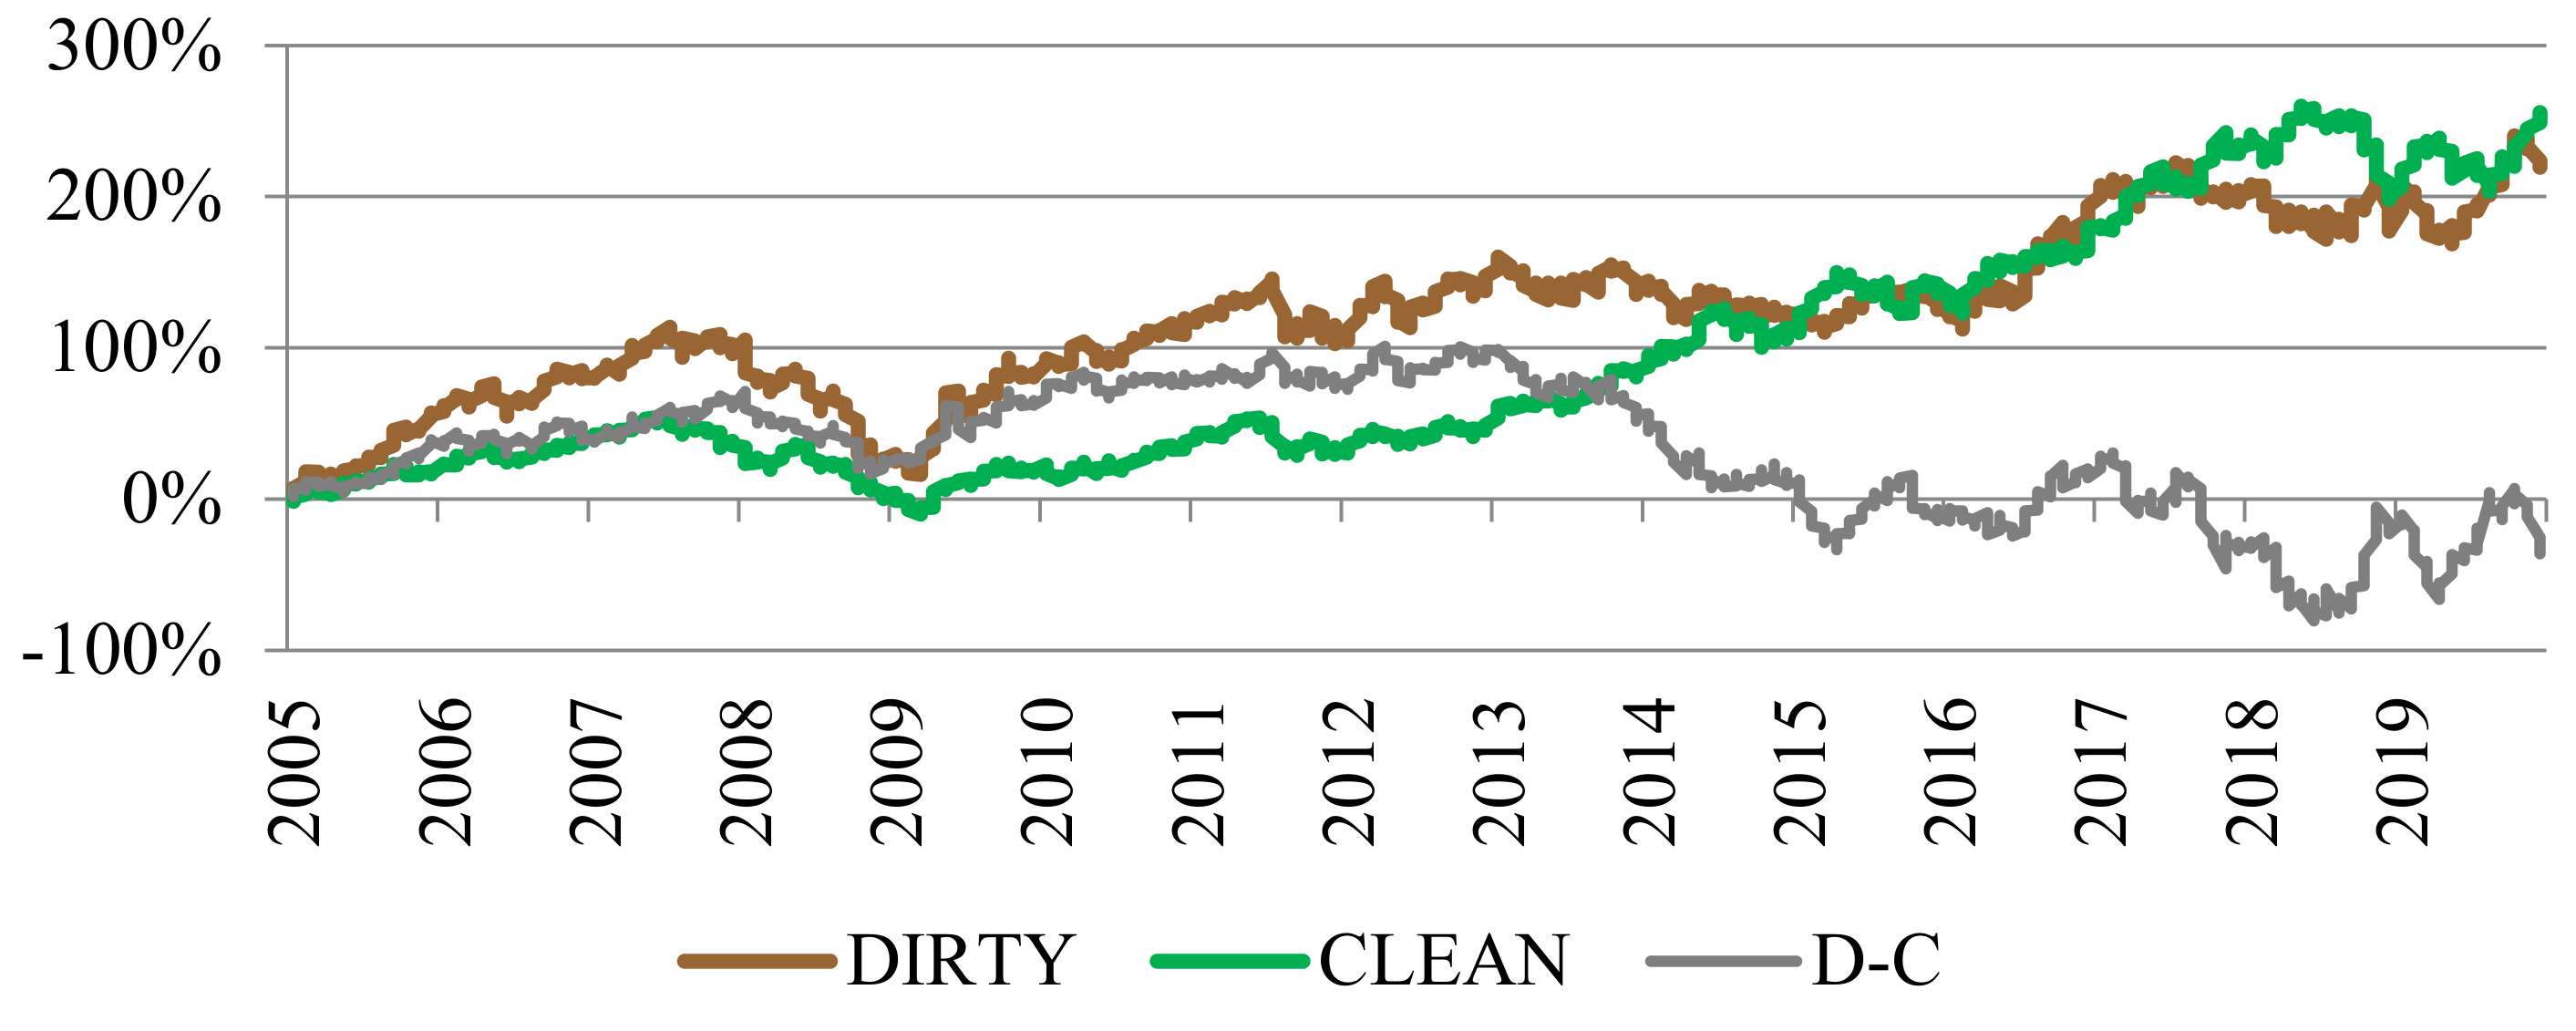
This analysis shows that the presence of a carbon premium may be controversial. If the carbon premium existed, it was unstable over time. It probably existed before the introduction of the EU ETS and during its first periods of operation (2003–2007 and 2008–2012). Interesting is the period 2013–2016, as the premium may have been negative during this period. In the following years, it is difficult to assess whether the carbon premium was present. This is more apparent after excluding the period before the introduction of the EU ETS from the analysis (
Figure 2).
As shown by analyses carried out over the full research period (2003–2019), the alpha coefficient is meaningful for all portfolios created (
Table 1), although the analyses do not confirm the existence of a carbon premium (alpha coefficient for DIRTY-CLEAN). Importantly, the alpha for the DIRTY portfolio is higher than for the CLEAN portfolio, similarly for the MEDIUM portfolio.
The reasons for the instability of the carbon premium can be found in the numerous reforms of the EU ETS and the imbalance of the allowance market itself. It is sufficient to mention that from the second trading period (2007–2012) to the third one (2013—2020), operators of installations transferred 1,749,540,826 allowances [
33], which was almost equivalent to all allowances redeemed in one year. For this reason, the auction volume of allowances was reduced by 400 million units in 2014, 300 million units in 2015 and 200 million in 2016. These units have been credited with the Market Stability Reserve (IAS) established in 2018. Bearing in mind these imbalances and the reforms that have been carried out, we have decided to repeat the analyses for the sub-periods 2003–2012 and 2013–2019. The reason for this division is that by 2012 almost all allowances were allocated for free. Even between 2008 and 2012, despite the tightening of the rules, around 90% of allowances were allocated for free. During these years, supply exceeded demand, which was mainly due to the financial crisis in Europe. It was only in 2013 that demand almost equaled supply, and in 2014, for the first time since 2008, demand exceeded supply.
The repetition of the estimations in the two designated sub-periods confirms the assumption of imbalances in the allowance market (
Table 2). Our analyses indicate that the carbon premium was positive and significant in the first periods of the system’s operation and just before its launch. Since the third settlement period, however, it has lost its importance. What is more important, it might have changed its nature (negative value). We have also looked at the formation of premium in even shorter periods. First, we divided the first examined period (2003–2012) into three sub-periods: 2003–2004 (years before the introduction of the scheme), 2005–2007 (the first period of the EU ETS functioning), 2008–2012 (the second period of the EU ETS functioning).
For all sub-periods, the DIRTY portfolio ratio is higher than the CLEAN portfolio, but only for the periods 2003–2004 and 2005–2007 the carbon premium is statistically significant (
Table 3). Interestingly, the carbon premium is substantial in the years before the introduction of the EU ETS, which may indicate that investors have anticipated regulatory risk. It is worth noting that regardless of the model used, the size of the premium is extremely stable. Additionally, in all analyzed periods, the Sharpe ratio is the lowest for a portfolio consisting of relatively clean companies, which means that these are the least efficient (profitable) portfolios. For the period 2008–2012 this index is even negative, which means that it would be more profitable to buy risk-free instruments (e.g., T-bonds) than to invest in such a portfolio.
This relationship has completely changed over the period 2013–2015 (
Table 4). For these years, the alpha of the CLEAN portfolio is significantly higher than both DIRTY and MEDIUM portfolios. The situation is similar for the Sharpe ratio, this time the DIRTY portfolio turns out to be the least efficient and in addition it is negative for this portfolio. Extraordinarily, the carbon premium proved to be negative. This is in line with the results obtained by Bernardini et al. [
15] for the electric utilities. This shows that between 2013 and 2015, it was companies with a low carbon footprint that had a high carbon risk and a carbon premium. This is a surprising result, which may indicate a malfunctioning of the EU ETS (low allowance prices, huge stocks of allowances held by the largest emitters) or the use by companies of “dirty” hedging tools against this risk (futures contracts, options, etc.), as may be demonstrated by the insignificant alpha of the DIRTY portfolio. On the other hand, this premium can be understood as an additional return which occurred once the market perceived and priced the lower carbon risks of CLEAN companies, as found out by Bernardini et al. [
15] However, there is no doubt that the instability of the carbon premium mark is proof of the EU ETS malfunctioning.
In order to verify the results obtained, we repeated the analyses carried out using different percentiles of our CRER index as a criterion for allocating companies to portfolios. However, the results remained in line with those presented, only the statistical significance of alpha coefficient differed slightly in favor of the criterion originally used. We have also repeated the research using the division criterion proposed by Oestrich and Tsiakas [
14], with one modification. As there are only energy-intensive companies in our sample and no company has a zero allocation, this criterion has been modified and we have included in the CLEAN portfolio companies whose free allocation was less than the 20th percentile of companies in the sample. We have not obtained statistically significant results. The results remained the same for the 10th and 30th percentile. In some periods the alpha was significant in the CAPM model, although in other models it was insignificant (
Table 5). This confirms the concern that the criterion used by Oestrich and Tsiakas [
14] may carry the risk of a large part of the premium calculation resulting from, inter alia, the size.
In our study, we also examined the results when the emissions-to-assets criterion is applied. In almost every case, the asset emissivity criterion shows a lower and less significant premium. The exceptions are the periods 2005–2007 and 2016–2019. However, this state of affairs can be easily explained. In the period 2005–2007, investors had significantly limited access to information on allocations, so emissivity of assets was more important. The premium values for the period 2016–2019 when using the emissivity criterion are statistically insignificant.
5. Discussion
We noticed that in the previous studies authors paid little attention to the problem of choosing a criterion for dividing companies into clean and dirty ones. The fundamental conclusion of our research is that the choice of the criterion for dividing companies into clean and dirty is crucial for the results of measuring the carbon premium using the sorted portfolio method. In our opinion, the choice of this criterion should depend on the purpose of the study—and researchers should justify their choice each time. In our study, we used a criterion that takes into account the size of the allocation of emission rights, as it reflects the specifics of the system functioning.
The results obtained confirm the existence of a carbon premium on the European market for energy-intensive sectors. However, this premium is very unstable, which may indicate that the EU ETS is not functioning properly. This premium occurred before the introduction of the EU ETS and in the first settlement period, which may mean that investors were anticipating regulatory risk in this area. These results are consistent with the conclusions of Oestreich and Tsiakas [
14]. Our results are also consistent with the observations of Oberndorfer [
19] and Veith et al. [
20], who detected a positive correlation of energy company stock prices with allowance prices during this period. The positive correlation of stock prices and allowance prices may mean that investors assumed that power companies were passing on the cost of allowances.
In later years, premium gradually disappeared as allowance prices declined. It has taken a negative value for the period 2013–2015, which demonstrates that it is the relatively clean players who have the additional risk of regulating greenhouse gas emissions and investors expect an additional rate of return for this. This phenomenon can be explained by the fact that entities with a low carbon footprint have relatively higher costs of complying with the regulations (MRV—measuring, reporting, verification), while at the same time not benefiting from managing emission credits. Large players incur lower costs per tonne of emissions and, at the same time, are very active in the allowance market, use advanced financial instruments and efficiently hedge against this risk. On the other hand, these results can be explained by quite the opposite, as a premium that does not change the overall risk profile. Using this assumption, a positive premium in the first period can be equated with a free allocation of allowances, of which DIRTY companies received relatively more. By contrast, the reasons for the negative premium in the first years of the third settlement period (i.e., between 2013 and 2015) can be found in the desire of investors to reduce their exposure to carbon risk. These measures result from declining free allocations and the risk of allowance price increases. Such conclusions are confirmed by the assessment of the Sharpe ratio, although this indicator is a very general measure of the profitability of portfolios and does not isolate the impact of other risk factors. This finding is not confirmed by the results for the period 2016–2019, and no alpha coefficients were found to be significant for this period (
Table 4), although this was the period in which the highest increases in allowance prices occurred.
Like Bernardini, we detected a negative premium in the third accounting period, but only in 2013–2015, while we did not detect a significant premium in 2016–2019. In contrast, our results differ from those obtained by Görgen, et. al. [
17], who did not detect a significant carbon premium. This may be due to these authors’ use of a very complex criterion to divide companies into dirty and clean. In our opinion, investors prefer less sophisticated criteria for dividing companies. Our criterion gives better results than the one proposed by Oestreich and Tsiakas [
14]. It also gives better results than the asset emissivity criterion.
Differences in results for individual periods may have been due to changes in the rules governing the allocation of emission rights. While free allocation was indeed pervasive through the first two trading periods, the electricity sector was generally short of allocations. This should matter for the risk premium and seems to possibly explain some of our results. Our results may have been significantly affected by derogation processes in the energy sector, which some countries were subject to. In addition, companies could have used surplus allowances unused in previous years. It should also be noted that the occurrence of surplus in the first periods had influence on subsequent periods.
Our study confirms that initially the impact of EUETS on CO2 emission reduction was relatively small. In subsequent years, this situation gradually changes. As the number of free allocations of emission rights is reduced and the reduction targets of the EU climate policy increase, the price of allowances and their impact on the profitability of CO2 emissions increases. Therefore, it can be expected that this problem will become increasingly important and the carbon premium will stabilize in the future.


