Article

The RES in the Countries of the Commonwealth of Independent States: Potential and Production from 2015 to 2019

by
Maciej Chowaniak
1,
Zofia Gródek-Szostak
2,*,
Karolina Kotulewicz-Wisińska
3,
Małgorzata Luc
4,
Marcin Suder
5 and
Anna Szeląg-Sikora
6
1
Department of Agroecology and Crop Production, Faculty of Agriculture and Economics, University of Agriculture in Krakow, Al. Mickiewicza 21, 31-120 Krakow, Poland
2
Department of Economics and Enterprise Organization, Cracow University of Economics, 31-510 Krakow, Poland
3
Department of Political Science, Cracow University of Economics, 31-510 Krakow, Poland
4
Department of Geographical Information Systems, Cartography and Remote Sensing, Jagiellonian University in Cracow, 30-387 Kraków, Poland
5
Department of Applications of Mathematics in Economics, Faculty of Management, AGH University of Science and Technology, 30-067 Kraków, Poland
6
Faculty of Production and Power Engineering, University of Agriculture in Krakow, 30-149 Kraków, Poland
*
Author to whom correspondence should be addressed.
Energies 2021, 14(7), 1856; https://doi.org/10.3390/en14071856
Submission received: 1 February 2021 / Revised: 17 March 2021 / Accepted: 22 March 2021 / Published: 26 March 2021

Abstract

:
Amidst the changes and adjustments of the international energy situation, the leading trend is to shift from fossil fuels to low-carbon fuels, and ultimately, to enter the era of sustainable energy, based mainly on renewable energy. The ongoing changes in global security of energy supply and the high volatility of fossil energy prices also stimulate investment in alternative energy sources, making renewable energy sources (RES) one of the rapidly growing elements in the global energy system. This article fills the research gap by analyzing the potential of using renewable energy in the countries of the Commonwealth of Independent States (CIS) in the years 2015–2018. The authors address the energy potential in the years 2015–2019, and energy consumption in the years 2015–2018 as the potential of RES in the CIS countries was not researched after 2014. Please note that the study covers the CIS countries, along with Georgia and Ukraine, which are no longer formal members of the Community, but have been included for cognitive and comparative purposes. Upon comparing the increase in energy production in the CIS countries to the average increase for the European Union (EU) countries, the value of this increase is observably higher than the average for the EU countries only in Ukraine. However, the average for the entire CIS is much lower than the EU average, therefore in CIS countries, the changes in the volume of RES energy production are varied. In some countries, there is a significant increase in the production of this type of energy (e.g., Ukraine, Kyrgyzstan, Belarus, Kazakhstan, Georgia). However, there are also countries in which the changes are negligible, or which noted significant drops in RES energy production (Uzbekistan, Moldova, Russia, Armenia). The findings contribute to the RES market debate and the international relations theory by comparing political factors with territorial and economic factors.

1. Introduction

At the beginning of the 2020s, the world faces challenges such as ensuring sustainable development, meeting the growing energy demand, reducing greenhouse gas emissions, improving energy efficiency, and ensuring energy security [1,2]. Renewable energy is an effective tool to meet these challenges by using the available energy sources as efficiently as possible to reduce greenhouse gas emissions [3,4]. It also plays an important role in ensuring energy security, improving environmental protection, and increasing employment [5,6]. Both individual countries and Transnational Economic Organizations see renewable energy as a strategic instrument of next-generation technologies and have set high renewable energy targets as part of their policies [7,8]. With the development of national policies and the maturing of renewable energy technologies, experience in low-carbon development becomes critical [9]. Amidst the changes and adjustments of the international energy situation [10,11,12], the leading trend is to shift from fossil fuels to low-carbon fuels, and ultimately, to enter the era of sustainable energy, based mainly on renewable energy. The ongoing changes in global security of energy supply and the high volatility of fossil energy prices also stimulate investment in alternative energy sources, making renewable energy sources (RES) one of the rapidly growing elements in the global energy system [13]. The global energy trade network is the result of key trade decisions of individual countries. Recent studies indicate that the pursuit of energy security is one of the main factors in these strategic decisions [14,15,16]. For countries where fossil fuel resources (coal, oil, or gas) are scarce, import is the main way to ensure energy security. The resulting energy network is shaped by geopolitical factors such as foreign policy [17,18,19], the economic profile of importing countries, and strategic considerations of incumbent suppliers [20].
The literature review provides a perspective on the relationship between economic growth and alternative energy consumption. However, based on the diverse group of countries, time range, and empirical techniques, there is no single empirical, research-based proof. One of the pioneers of research in this field is Chien and Hu [21], who investigated the technical efficiency of the renewable energy production process in 45 economies. Based on data analysis, they have found that the use of renewable energy promotes technical efficiency and productivity in the observed economies. Similar results were obtained by Apergis and Payne [22], Fang [23], Tiwari [24], Bilgili and Özturk [25], Ozturk and Bilgili [26], Bhattacharya et al. [27], Hassine and Harrathi [28], and Ozca and Ozturk [29]. These tests ensure that the causal relationship between renewable energy consumption and its actual production is verified. Also noteworthy are the results of Sari and Soytas [30], who, by examining the causal relationship between disaggregated energy consumption and industrial production in the United States of America (USA), show that real production and employment stimulate the use of renewable energy. Similar results were obtained by Sadorsky [31] and Cho et al. [32], who argue that real Gross Domestic Product (GDP) growth will increase the use of renewable energy in emerging countries. Trifonov et al. [33] attempted to determine how medium- and long-term changes in the share of RES, their structural complexity, and the level of energy security in Eastern Europe, Caucasus, and Central Asia (EECCA) countries are interconnected.
Based on desk research, a research gap was diagnosed in the assessment of the potential and effectiveness of using RES in the countries of the Commonwealth of Independent States (CIS) in 2015–2019. The RES potential includes natural resources and the environment, as well as extractive, processing, and energy transport capacities (Table 1). Dualistic in nature, this potential is inherent in both the abundance of raw materials and the production potential of the region [34].
The studies on CIS energy efficiency available in the literature cover the years 2000–2014 [35]. Apergis and Payne [36] believe that the CIS countries had failed in reducing CO2 emissions due to certain challenges, and Çetintaş [37] provides empirical evidence that supports this statement. The relationship between energy demand and economic growth has been explored in 17 transition economies, and 8 of them are CIS countries. Their economic growth has increased the demand for energy due to its source, i.e., fossil fuels [22]. The findings show that the increase in the economic performance of the CIS has led to an increased level of CO2 emissions, resulting from the increased demand for energy in 1992–2005. Despite the contrasting results by Çetintaş [37], empirical studies by Apergis and Payne [36] show a promising future for environmental sustainability in the CIS countries.

2. Context and Research Goals

2.1. Geography of the Commonwealth of Independent States (CIS)

The area of the CIS is divided into the following country groups:
  • Eastern European Countries: Belarus, Moldova, Ukraine.
  • South Caucasus countries: Armenia, Azerbaijan, Georgia.
  • Central Asian countries: Kazakhstan, Kyrgyzstan, Tajikistan, Turkmenistan, Uzbekistan.
  • Due to its dominant role in the region, Russia is considered a separate category.
Established on 8 December 1991 by the Russian Federation, Belarus, and Ukraine, CIS has replaced the Union of Soviet Socialist Republics (USSR) for ca. three decades. Over time, it was joined by other countries of Eastern Europe (Moldova), the countries of the South Caucasus, and the countries of Central Asia. Currently, the Community consists of 9 countries: Azerbaijan, Armenia, Belarus, Kazakhstan, Kyrgyzstan, Moldova, the Russian Federation, Tajikistan, and Uzbekistan. Turkmenistan, Georgia, and Ukraine are not presented as full members of the organization due to the different perception of the sense of participation in the Commonwealth.
As a result of the ratification of the founding documents of the CIS (Agreement on the establishment of the CIS of 8 December 1991 and the Almaty Declaration of 21 December 1992), on 26 December 1991, Turkmenistan became the founding country of the CIS [38]. Currently, the country’s status is Associate Member, following the announcement at the CIS summit in August 2005 regarding participation in the works of the organization as an Associate Participant [39]. The change of membership status was motivated by the fact that Turkmenistan had the status of permanent neutrality, which was recognized and supported by the United Nations (UN) General Assembly Resolution “Permanent neutrality of Turkmenistan” of 12 December 1995. As noted by the Turkmen authorities, “due to the neutral status of Turkmenistan in the CIS, it cannot participate in military and law enforcement associations, as well as in bodies and structures with supranational powers” [40].
On 3 December 1993, following the decision of the Council of Heads of the CIS, Georgia was admitted to the organization [41], and on 9 December 1993, it signed the CIS Statute [42,43]. On the other hand, on 12 August 2008, President of Georgia M. Saakashvili announced that the country would withdraw from the CIS [44], and on 14 August 2008, the Georgian parliament unanimously voted in favor of withdrawing Georgia from the organization [45]. According to Art. 9 of the CIS Statute, a Member State has the right to leave the Community. The state shall notify the depositary of the Statute of such intention in writing 12 months before leaving the organization. In this case, under the CIS Statute, the obligations arising within the participation period are binding on individual states until they are fully implemented [46]. On 9 October 2009, the Minister of Foreign Affairs of Russia, S. Lavrov, announced that the CIS Council of Foreign Ministers made a formal decision to terminate Georgia’s membership in the CIS as of August 2009 [47]. On the other hand, Georgia officially left the ranks of the CIS on 18 August 2009 [48], which was caused by the outbreak of an armed conflict between the Russian Federation and Georgia in August 2008.
The current Ukrainian authorities have taken steps to ensure that Ukraine exits the Commonwealth of Independent States. Anyway, despite the signing of the Agreement on the establishment of the Commonwealth of Independent States in December 1991, Ukraine never signed the CIS Statute. Due to this fact, Ukraine ceased to be recognized as a member state of the CIS but is recognized as a founding country of the organization. As a result of the deterioration of bilateral relations between Ukraine and the Russian Federation, following Russia’s annexation of the Crimea and support for separatists in the Donetsk and Luhansk Oblasts on 19 March 2014, the Security and National Defense Council of Ukraine resolved to end its presidency in the CIS and the Secretary of the Council announced the commencement of the process of Ukraine’s withdrawal from the Commonwealth of Independent States [49].
However, on 3 September 2014, the secretary of the CIS Executive Committee announced that Ukraine had not withdrawn from the organization [50]. On 8 December 2014, Ukraine’s Supreme Council started debates on this subject, and on 9 November 2016, the Ukrainian Parliament debated the draft on Ukraine’s withdrawal from the CIS [51]. In March 2018, the President of Ukraine, Petro Poroshenko, proposed preparing in collaboration with the Council of Ministers a document on the official cessation of Ukraine’s participation in the CIS and the closure of the country’s representation in the relevant institutes in Minsk. On 19 May 2018, President Poroshenko signed a decree that implemented the decision of the Security and National Defense Council of Ukraine on the permanent cessation of Ukraine’s participation in the statutory bodies of the CIS [52]. On 28 August 2018, Ukraine closed its representation at the statutory bodies of the CIS [53]. Despite this, the CIS Executive Committee invited the present President of Ukraine, V. Zelenski, to participate in the annual CIS summit on 11 October 2019, but the President of Ukraine did not participate in it [54]. Currently, Ukraine is making an inventory of contracts concluded within the CIS, 15 of which have already been declared invalid due to non-compliance with Ukraine’s national interests. According to the Ministry of Foreign Affairs of Ukraine, the country has never been a member of the CIS as it has never signed the CIS Statute [55]. However, due to the lack of written notification of leaving the organization, Ukraine is still included in the CIS.

2.2. Determinants of Political and Economic Connections in the Former Union of Soviet Socialist Republics (USSR)

The historical factor, i.e., economic cooperation, during the existence of the USSR impacts the scale of connections in the CIS area. After 1991, as a result of the collapse of the USSR and the declaration of independence in individual republics, the scope of this cooperation decreased. Currently, the course of this cooperation is influenced by the diversity of economic specializations of individual countries, which determines its scope and shapes the foreign policy of these countries towards the countries of the former USSR.
The largest country in the region, the Russian Federation, has enormous reserves of natural resources, with special importance attached to energy resources, especially crude oil and natural gas. On the one hand, these resources are used for geopolitical purposes. On the other hand, they are essential for the country’s economic development. Azerbaijan, Kazakhstan, Turkmenistan, and Uzbekistan attach similar importance to energy resources. For example, in Azerbaijan, the key branch of the national economy is the oil sector, which generates approximately 37% of GDP (2019) and approximately 70% of budget revenues (2019) [56]. Also, nearly all export revenue comes from the sale of energy resources. The economy of Kazakhstan is characterized by a similar type of dependence. The production of crude oil in this country generates approximately 70% of the export value, providing approximately 50% of budget revenue and accounting for 15% of GDP [57]. In turn, in Turkmenistan, the production and export of natural gas are of the greatest economic importance. Uzbekistan, on the other hand, globally ranks 14th in terms of natural gas reserves and 11th in the world for mining, 3rd in cotton export, 7th in uranium resources, and 4th in gold resources [58,59].
For other former USSR states, industry and agriculture are of the greatest importance. In Armenia, it is the mining (ferromolybdenum and non-ferrous metal ores) and the processing industry (production of agri-food products). Its national income source structure is as follows: agriculture—11.99% (21.9% of the national workforce), industry 24.29% (22.9%), and services 54.23% (55.2%) [51,52].
In Belarus, the most important are the fuel, chemical, and electromechanical industries, as well as agriculture. The fuel industry generates approximately 20% of GDP and is of great importance for the national trade balance, and the state budget [60]. The chemical industry, and the related production of nitrogen and potassium fertilizers, rank next. Agriculture is ineffective because it is based on a collective farm system that is heavily dependent on direct and indirect support from the Belarusian authorities (such as loans, debt restructuring, low fertilizer prices).
On the other hand, Moldova is a country in which agriculture and related food industries are of great importance in the economy (generating approximately 35.2% of GDP) [61]. They are followed by the light industry, electromechanical and measuring equipment production, wood and furniture, chemical and pharmaceutical production, as well as the manufacturing of construction materials, perfumes, and cosmetics. Of all these economic branches, agricultural processing is of the greatest importance, as it accounts for approximately 2/3 of the total industrial production of the country and generates an equal part of export revenues.
The foundation for the economic development of eastern Ukraine is the metallurgical industry, covering all stages of technological processing of ores, from the mining, to enrichment, to the finished product in the form of cast iron, non-ferrous metals, and alloys. Additionally, this region is close to rich coal deposits (one of the main sources of energy supply) and has well-developed engineering, aviation, space, and defense industries. In the central part of Ukraine, machine-building, metal, food, pharmaceutical, chemical, petrochemical, and energy industries, as well as construction materials manufacturing, are of the greatest importance. The leading industries in the engineering industry include aerospace and electronics production, as well as the production of devices and tools. In this part of the country, highly developed agriculture is the raw material base for the agri-food industry. On the other hand, the western part of the country has strongly developed food, fuel, refining, chemical, forest, oil and gas production, mechanical engineering, energy, light, metal processing, and agriculture industries. Food products account for 65% of the production of consumer goods. The industry generates 23% of the regional gross product, while agriculture—12% [62].
In Georgia, the foundation of economic development is hydropower resources, deposits of base metals (mainly manganese), and coal. Georgia has no significant documented hydrocarbon deposits, but due to its geographical location, it is an important transit area for oil and gas (mainly from the Caspian Sea region). Due to its size, the country’s economy is dependent on foreign trade, with food as the main export good (80% of total export) [63].
Tajikistan has a hydropower potential estimated at 500 billion kWh per year, which is used only in ~5% [64]. Only the textile and food industries are developed. Tajikistan has large deposits of bauxite, uranium, and gold ores, with small amounts of oil, natural gas, and lead ore.
In Kyrgyzstan, the most important sector of the economy is agriculture, the share of which in the GDP structure is 25%, ensuring employment for 1/3 of the population. Moreover, Kyrgyzstan has significant amounts of natural resources, especially gold, but limited deposits of oil, gas (located at great depths), coal, and other metals (except gold). Non-ferrous metallurgy and the mining industry (approximately 60% of total industrial production) play a leading role in the Kyrgyz industry. Mining gold from the Kumtor deposit, which provides over 40% of the national export, is of the greatest economic importance for the country [65]. Among the CIS countries, Kyrgyzstan has the largest hydropower resources per capita and its hydropower complex, the second source of export revenues, is also of strategic importance. Currently, Kyrgyzstan exports electric power to Kazakhstan, Uzbekistan, Tajikistan, and China at 2–2.5 billion KWh per year [66].
Due to this economic specialization, a network of specific connections and dependencies has developed between these countries. The economies of Armenia, Belarus, Georgia, Moldova, and Ukraine are dependent on energy supplies from the Russian Federation. This dependency allows Russia to influence the governments of these countries, which is reflected in the pricing policy of the raw material supplied to these countries. Since the beginning of the 21st century, this has forced the above group of countries to strive for diversifying the import of these raw materials. On the other hand, countries such as Russia, Turkmenistan, Kazakhstan, Azerbaijan, and Uzbekistan are rich in energy resources. Although this group of countries still uses the only available pipeline system, built during the USSR era, for the transport of raw materials, since the 2000s, they have taken steps to reduce this dependence.
For example, Armenia imports gas from the Russian Federation, covering 80% of its annual gas demand [67]. As of 2007, the remaining 20% is covered by imports from Iran. Natural gas is delivered from Russia to Armenia in transit through Georgia, based on contracts concluded between Russia and Georgia. In 2017, 2 billion m3 was delivered to Armenia via transit through Georgia, and as a result, this country received 0.03 billion m3 of Russian gas [68].
In turn, the case of Moldova shows that the problem of unresolved conflict over Transnistria requires determining separate amounts of natural gas for the right-bank (Republic of Moldova) and left-bank (Transnistria) in the contracts concluded with Russia each year [69]. As a result, no special mechanism for keeping separate records of gas imports has been developed so far, and therefore, there is no adequate coverage of the customs costs. The lack of a single customs register of natural gas delivered to the Republic of Moldova and transited through its territory will complicate the financial and economic situation of this country in the future. Moreover, one of the peculiarities of Moldovan–Russian cooperation in the gas sector is that the share of Russian gas in total gas imports is 50%. Under the agreements concluded with Russia, the remaining amount of gas comes to Moldova through Russia, from Kazakhstan, and other Central Asian countries [70].
In Belarus, however, dependence on the Russian supplier is perceived as the sound policy of integration with Russia. The lack of engagement in diversification on the part of the authorities in Minsk stems from the fact that by appealing to a pro-Russian policy of integration, it has negotiated particularly generous preferential tariffs on gas imports, as well as crude oil [71], with Russia.
Another example of cooperation in the energy sector is the relationship between Russia and Ukraine. Due to the low domestic production of natural gas and crude oil, the Ukrainian authorities, trying to cope with the problem of the high energy consumption of the Ukrainian economy, are forced to import raw materials [72].
The strategy of the Russian gas industry is to develop gas production and distribution in new markets based on production capacities outside Russia. This has been the goal and policy of Gazprom’s cooperation with the countries of Central Asia since the 2000s.
Gazprom purchases natural gas in Central Asian countries such as Turkmenistan, Kazakhstan, Uzbekistan, and Azerbaijan. Purchases have been made in Turkmenistan since 2004, in Uzbekistan since 2003, in Azerbaijan since 2009, and in Kazakhstan since 2003. In the years 2003–2018, Gazprom purchased a total of 380.7 billion m3 of natural gas in the above-mentioned countries. Cooperation with the countries of Central Asia in terms of natural gas production and distribution is favorable to Russia. The advantage is that in the case of a decline in demand for gas abroad, Russia may compensate for losses by increasing domestic sales [73].
Nevertheless, taking advantage of their geographical location, the countries of the region have intensified cooperation with their immediate neighbors. Since 1998, Turkmenistan has been exporting gas to Iran via the Korpeje-Kurtkun gas pipeline (in 2010, the second gas pipeline from Turkmenistan to Iran: Dovlebat-Serahs-Hangeran, was launched), and since 2009, the country exports natural gas to China via the Trans-Asian gas pipeline running through the territory of Uzbekistan. The construction of the Turkmenistan–Afghanistan–Pakistan–India gas pipeline is planned [74].
Azerbaijan, on the other hand, launched the Baku–Tbilisi–Ceyhan oil pipeline and the Baku–Tbilisi–Erzurum gas pipeline in 2006–2007, through which it exports its raw materials, bypassing the transmission network of the former USSR area to European Union (EU) countries. As a result, Georgia stopped importing Russian gas in 2008 and started purchasing gas from Azerbaijan.
Such action, in the case of Azerbaijan, is aimed at diversifying energy production sources and increasing gas exports.The structure of economic relations and the presence of large deposits of energy resources in the CIS area result in a predominance of coal, natural gas, and oil in power production (Figure 1). A certain regularity can be observed in the CIS area, i.e., the countries with low energy resource reserves (e.g., Georgia, Kyrgyzstan, Moldova, Tajikistan) are dependent on their supplies and develop power production from other sources. On the other hand, in the CIS countries that have plenty of energy resources (e.g., Azerbaijan, Kazakhstan, Russia, Turkmenistan, Uzbekistan), power production is based mainly on these resources, and the countries specialize in their export. There are countries in the CIS area, which due to the insufficient amount of energy resources, have been producing nuclear power for years, e.g., Armenia and Ukraine. On the other hand, Russia, which ranks second among the European countries in terms of nuclear power generation capacity [75], produces 7% of its total power from the atom. Production of nuclear power is favored by the presence of uranium deposits in the territory of Russia. Interestingly, in 2014, Azerbaijan decided to complete the construction of a Soviet-era nuclear power plant [76] to diversify the country’s power production and increase its gas export.
As demonstrated in the above examples, Russia’s policy towards the CIS area is quite diverse, which yet again confirms that Russia pursues a different policy towards individual CIS countries, and leverages various forms of economic cooperation in the energy sector. Moreover, the leading factor determining the scope of cooperation in the energy sector between the CIS economies is the problem of their energy consumption [77]. As production increases, the demand for energy and its raw materials increases. Yet, after the collapse of the former USSR, only 40% of the production capacity of the CIS countries is used. As a result, a rational solution in this situation is to take measures for the development of RES in individual states of the former USSR [78].

2.3. Research Goals and Hypotheses

This article is a continuation of the authors’ research on the potential and effectiveness of the use and promotion of RES [79,80,81,82]. The conducted in-depth literature analyses fill the research gap by presenting the potential of using RES in the CIS countries in the years 2015–2018. Please note that the study covers the CIS countries, as well as Georgia and Ukraine, which are no longer formal members of the Community, but were also researched for cognitive and comparative purposes.
The purpose of the article is:
  • To present geographical and political factors influencing the potential and development of RES.
  • To present the energy production and RES potential of the CIS countries and to compare it against the EU countries.
  • To investigate the dynamics of changes in the potential and production of RES in recent years.
To achieve the adopted goals, the following research hypotheses were formulated:
Hypothesis 1:
CIS countries are developing less dynamically in terms of RES than EU countries.
Hypothesis 2:
CIS countries have much greater potential for RES than the EU countries, but they do not leverage it.
Hypothesis 3:
Although they were created after the collapse of the USSR, CIS countries chose a different RES policy, and their production and use of renewable energy vary.
The following research methods were used to address the research topic: desk research (subject literature and report data), and Gastner-Newman amorphous choropleths [83]. On the other hand, the dynamics were studied by calculating the average absolute gain and the average change index:
i G ¯ = y n y 1 n 1
where: y n and y 1 represent the situation at the end of the period considered and the situation at the beginning of the period, respectively [84].

3. Results and Discussion

3.1. The Current State of the Energy Potential and Renewable Energy Production in the CIS

As shown in the previous section, the maximum net generation capacity of power plants and other installations that use RES to produce electric power in the former USSR countries varies greatly.
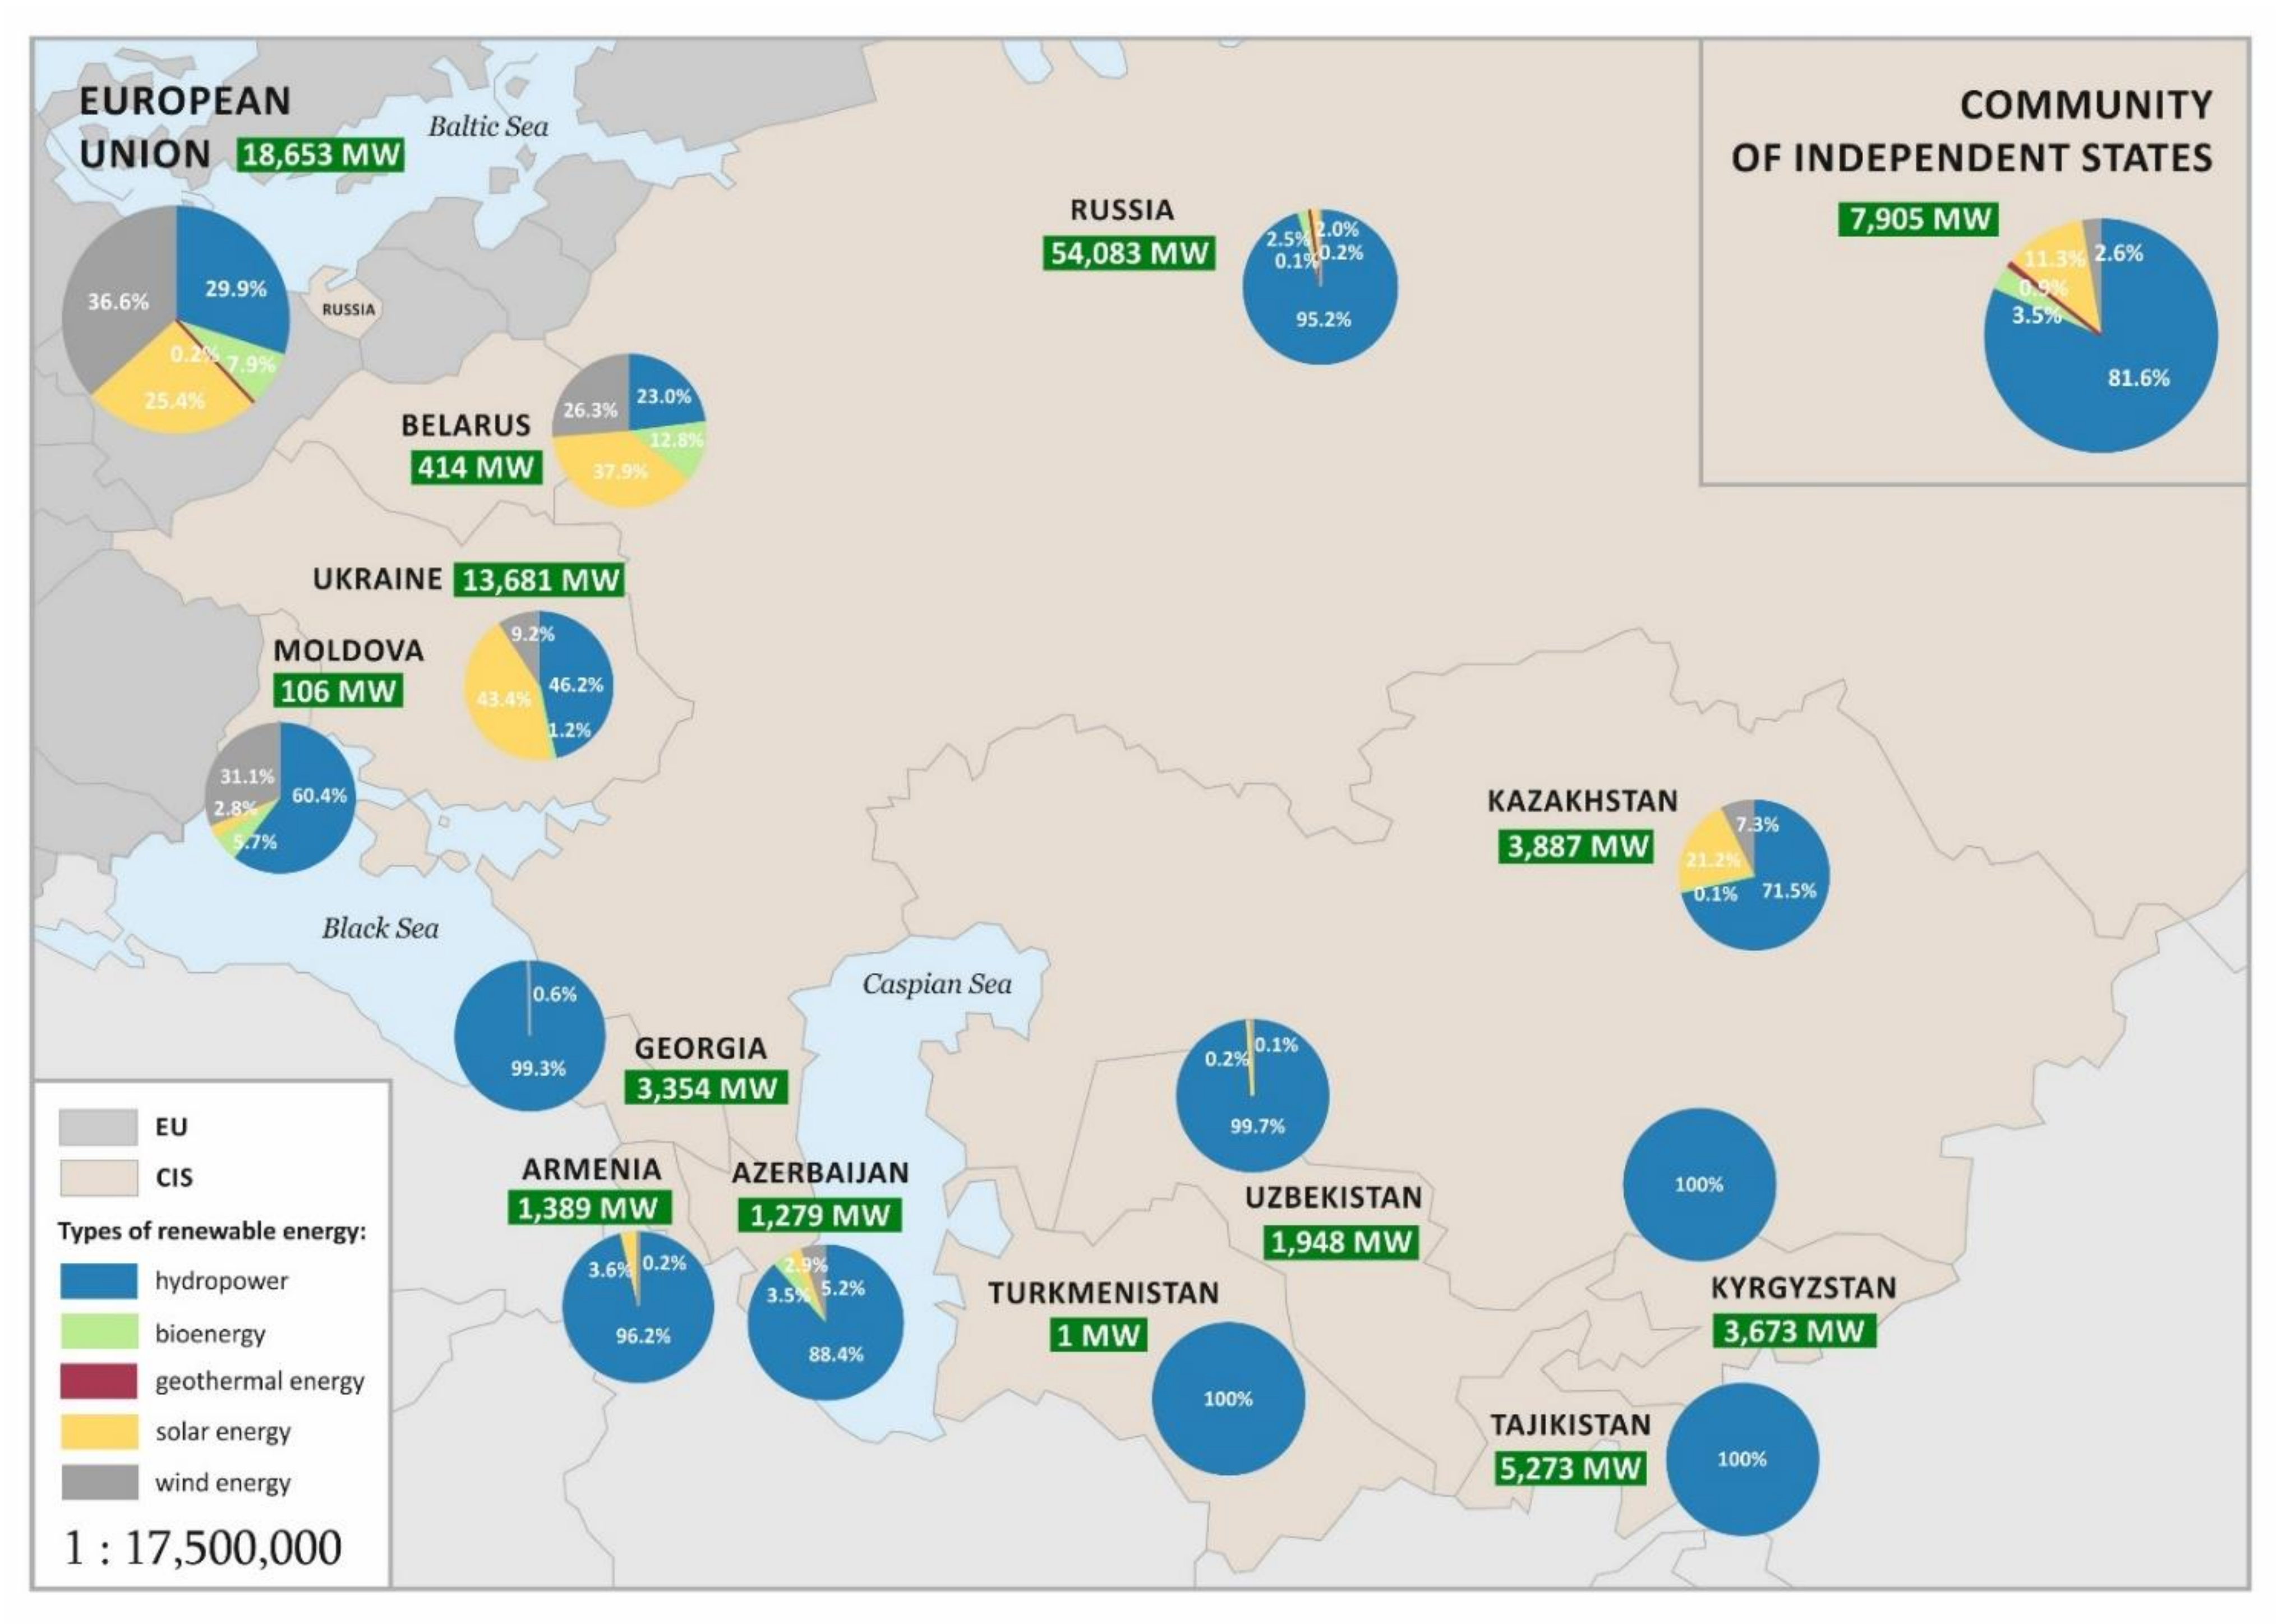
Figure 2 presents a map showing the total energy potential of individual countries along with the percentage distribution for individual types of RES and their values in 2019. Moreover, information about the average potential of a CIS country (including Ukraine and Georgia) was compared against the average potential of an EU Member State.
Figure 2 shows that the Russian Federation, the largest country in the world, has by far the greatest renewable energy production potential, over 54,000 MW. It is approximately four times greater than the potential of the second country, Ukraine, and more than 10 times more than the third country, i.e., Tajikistan. Turkmenistan has the lowest potential, i.e., only 1 MW, which allows a conclusion that it is a country with no renewable energy potential. Moldova and Belarus also have low renewable energy potential, 106 and 414 MW, respectively. For comparison, the average renewable energy potential value for EU countries is over 18,500 MW, and for the entire CIS, it is slightly under 8000 MW. As a result, it can be concluded that there is significant differentiation in the production capacity of individual CIS countries. At the same time, it can be observed that the average potential of the CIS countries is significantly lower than the average potential of the EU countries.
In Figure 2, there is also a noticeable difference in the distribution of types of renewable energy sources for the analyzed production capacity. For ten of the twelve CIS countries, the most RES potential is concentrated in hydropower. As many as 7 countries: Armenia, Georgia, Kyrgyzstan, Russia, Tajikistan, Turkmenistan, and Uzbekistan, have a hydropower potential of over 90%, and in 5 of them, it is over 99%. For the CIS countries, the hydropower potential constitutes on average of over 81.6% of the total potential. For comparison, in the EU countries, this water-based production capacity accounts for less than 30%. Only in the case of two CIS countries, i.e., Belarus and Ukraine, is the hydropower potential less than 50% of the total production capacity. In 2019, a significant potential of renewable energy of these countries was in solar energy. In Ukraine, it constitutes over 43%, and for Belarus, almost 40% of the renewable energy potential. Solar energy is also a significant part of the energy potential of Kazakhstan (over 20%). On average, the solar energy potential of the entire CIS is 11.3%, with the vast majority of this production capacity located in Ukraine. For comparison, in the EU countries, it is 25.4% on average, which is almost 14 percentage points more.
The wind energy potential can be considered significant in the case of 5 countries: Moldova (31.1%), Belarus (26.3%), Ukraine (9.2%), Kazakhstan (7.3%), and Azerbaijan (5.2%). For the entire CIS, the wind energy production capacity is 2.6% of the total potential. For comparison, in the EU, this potential constitutes the highest percentage of all RES and amounts to 36.6% on average. Similar to the potential of wind energy, bioenergy also constitutes a small percentage of the total energy potential. Its average for the CIS countries is 3.5%. The highest percentage of this type of renewable energy is observed in Belarus (over 12.8%) and Moldova (5.7%). Also, in this case, the potential of the EU countries is greater and amounts to almost 8% on average.
In the case of geothermal energy, the average potential of the former USSR countries is estimated at 74 MW, which is less than 1% of the total potential. However, it is still more than for the EU countries, where this potential is approximately 0.2%.
The above analysis clearly shows that the renewable energy potential for the CIS countries is mainly in hydropower, except Ukraine and Belarus, as well as Moldova and Kazakhstan [85,86,87,88]. In CIS, the distribution of renewable energy potential is distinctly different than in the EU, where it is significantly distributed over different types of energy.
Due to the huge disproportions among the CIS countries, the numerical analysis of their potential is based on and compared against data related to the total potential. However, they do not show the actual involvement of the authorities of individual countries in the development of RES [89,90,91,92].
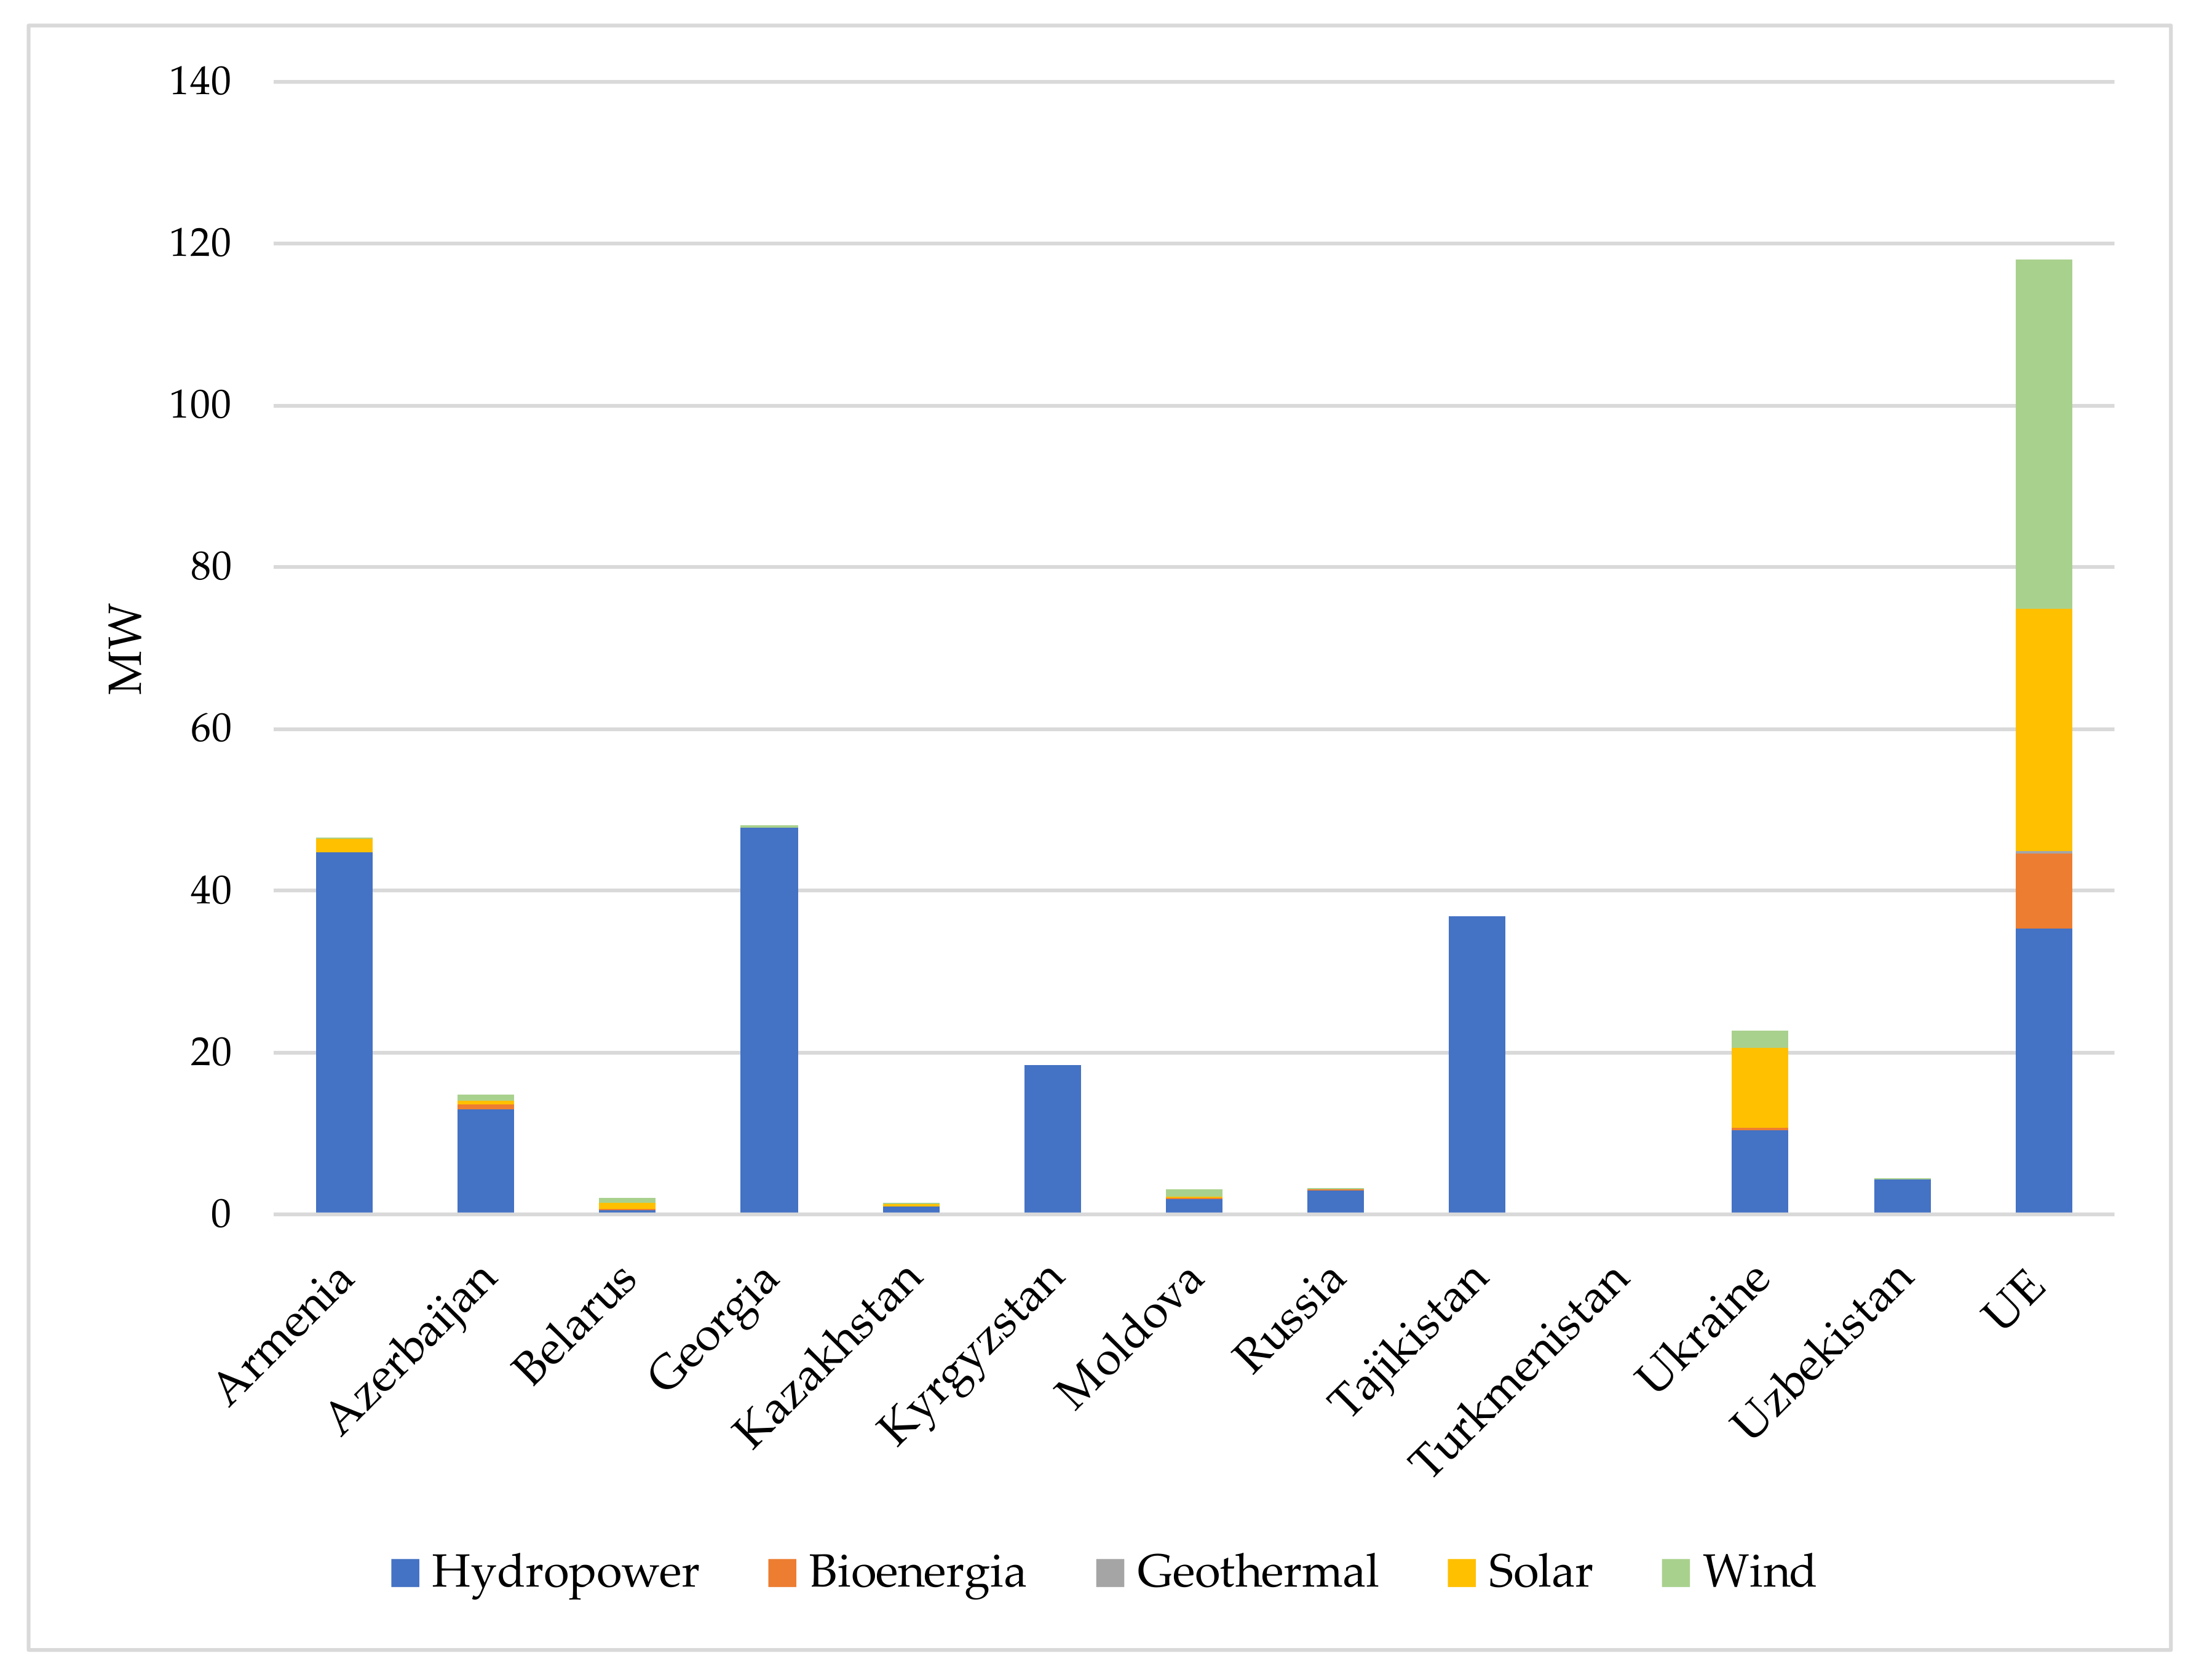
It is difficult to compare Russia’s energy potential with Georgia when Russia’s area is almost 245 times larger than that of Georgia. As a result, the article additionally compares the potentials of individual countries in terms of selected energy sources per 1000 km2. Such an approach allows indicating which countries belonging to the CIS are leaders in the production of renewable energy. Moreover, it is possible to compare the renewable energy potential with the average potential and energy production in the EU [93,94,95]. The Figure 3 show the energy production potential of individual renewable sources in 2019 for all analyzed countries and the EU average per 1000 km2 [96,97,98].
As demonstrated in Figure 3 Armenia and Georgia are the leaders in the potential of renewable energy production among the CIS countries. In the case of these countries, the total renewable energy production capacity is approximately 45 MW per 1000 km2. Tajikistan has a slightly lower potential in this respect and Ukraine—over 20 MW per 1000 km2. Meanwhile, in Russia, which has the greatest total RES potential, the capacity in this respect is slightly over 3 MW per 1000 km2 [99,100]. In this regard, none of the CIS countries can match the average potential for the EU countries, which is almost 120 MW per 1000 km2.
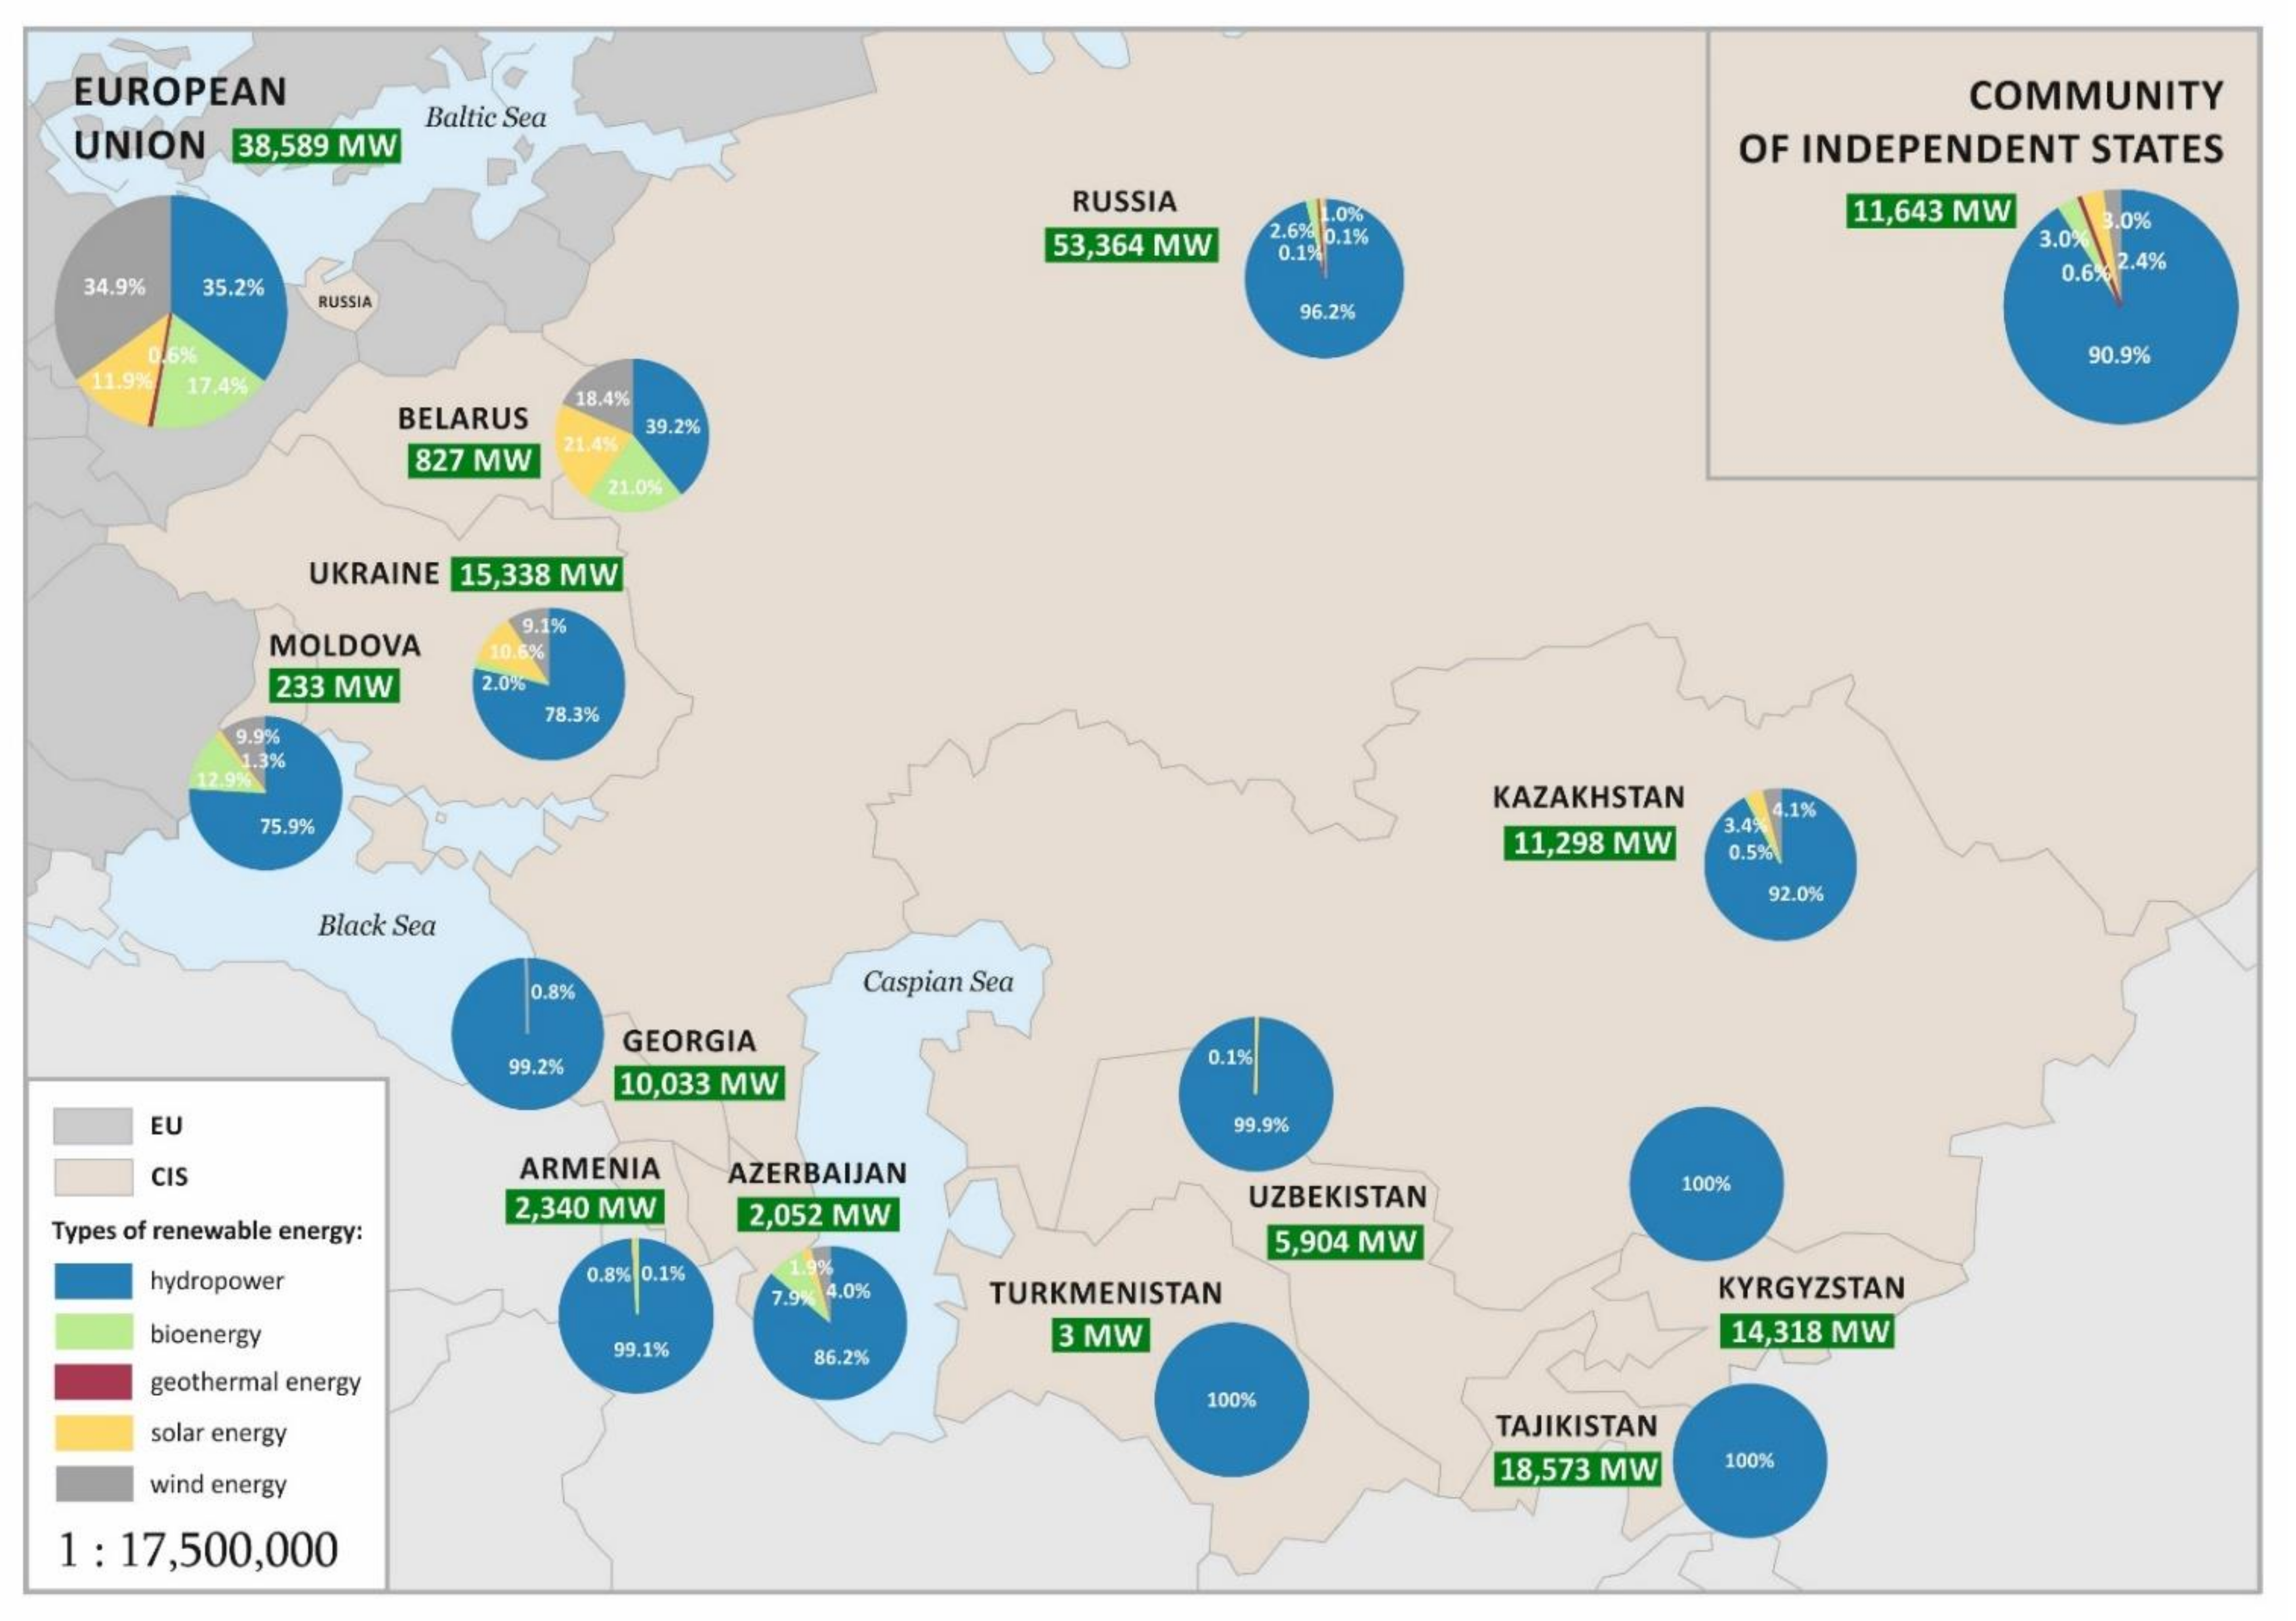
In addition to the energy potential, the volume of renewable energy production is an important element. Figure 4 shows a map with information on the total RES energy production, along with the percentage distribution for its types and their values in 2018. Moreover, information about the average potential of CIS (including Ukraine and Georgia) was compared against the average potential of an EU Member State [101,102].
Figure 4 shows that the Russian Federation produces the most renewable energy among the CIS countries, over 53,000 GWh, which accounts for over 1/3 of all renewable energy production in the CIS countries. Although a relatively small country, Tajikistan has a relatively high production of renewable energy, over 18.5 GWh, which is higher than the production in Ukraine (15.3 GWh), a country four times larger. The least renewable energy is produced in Turkmenistan, only 3 GWh, as well as in Moldova (233 GWh) and Belarus (828 GWh). For comparison, the average renewable energy potential value for EU countries is over 38,500 GWh, and for the entire CIS, it is slightly over 11,600 Gwh. Therefore, it can be concluded that there is significant differentiation in the renewable energy potential as per individual CIS countries. At the same time, it can be observed that the average potential of the CIS countries is significantly lower than the average potential of the EU countries. The distribution of electric energy production as per its sources is similar to that obtained for the potential.
To realistically compare the renewable energy production in individual countries, the total production volume was calculated per 1 million inhabitants. Figure 5 shows that Georgia, Tajikistan, and Kyrgyzstan are the undisputed leaders of renewable energy production (as per the number of inhabitants) among the former USSR countries. In the countries where water is the main RES, approximately 2500 GWh is produced per 1 million inhabitants, which is higher than the average production for EU countries. Moldova and Belarus are among the countries with the lowest renewable energy production per capita.

3.2. Dynamics of Changes in the Renewable Energy Potential and Production in the CIS Countries

One of the goals of this paper was to analyze the dynamics of changes in the potential and production of renewable energy. In addition to the presented renewable energy production capacity in 2019 and the analysis of the production volume in 2018, the paper also examines the changes that have occurred in the last four years in this respect in the analyzed countries. In the second part, the dynamics of RES energy efficiency for selected countries in 2015–2018 is presented, using Gastner-Newman cartograms. Table 2 presents the results of the analyzed dynamics of the energy potential based on the values of the average absolute growth and the average growth rate index in 2015–2019.
Upon analyzing the results in Table 2, it can be observed that Ukraine recorded the highest average increase in renewable energy production capacity. Each year, its renewable energy potential grew on average by approximately 1600 MW. The average dynamics index for Ukraine is 23.3%, which means that on average, Ukraine’s potential grows by such percentage annually. The demonstrated increase for Ukraine is primarily due to the significant increase in solar potential, which increased by an average of over 1273 MW each year. Belarus also recorded a significant percentage increase of the potential, however, due to its low level in 2015, an average increase of 49% year-to-year allows only approximately 72 MW of average potential increase. In the case of Belarus, the increase was distributed among all types of renewable energy (excluding geothermal energy). Kazakhstan recorded an average increase of over 10% of the potential, mainly due to investments in solar and wind energy. Moldova’s high growth rate (15.4%) is a result of its initially low potential in 2015. Statistically, between 2015 and 2019, the renewable energy potential in the CIS countries increased by approximately 150 MW each year. The average dynamics index is 2.7%. For comparison, in the EU countries, the average annual increase amounted to approximately 850 MW. The dynamics index for the EU countries is almost 7%.
To examine the changes that have occurred in the production of renewable energy in individual CIS countries, the productions in 2015 and 2018 were compared, as well as the determined average values of the absolute increase in production and the average rate of change.
The results of this analysis, presented in Table 3, clearly demonstrate that in the case of two countries, i.e., Moldova and Uzbekistan, the total renewable energy production decreased by approximately 10% on average each year. This was due to a reduction in hydropower production in both countries. Declines in the production of individual types of energy were also noted by Armenia (wind energy), Azerbaijan (bioenergy), and Russia (biothermal energy). However, in most cases, there has been an increase in renewable energy production within three years. The largest quantitative increase in production was observed in Ukraine and Kyrgyzstan [103,104,105].
The main factor impacting the total renewable energy production increase was the dynamic development of hydro and solar energy production. Belarus recorded a large percentage increase in renewable energy production (over 43%). Upon comparing the increase in energy production in the CIS countries to the average increase for the EU countries, it can be seen that the value of this increase was higher than the average for the EU countries only in Ukraine. However, the average for the entire CIS is much lower than the EU average. Thus, it can be seen that in CIS countries, the changes in the volume of RES energy production are varied [106,107,108]. In some countries, there is a significant increase in the production of this type of energy (e.g., Ukraine, Kyrgyzstan, Belarus, Kazakhstan, Georgia). However, there are also countries in which the changes are negligible, or which noted significant drops in RES energy production (Uzbekistan, Moldova, Russia, Armenia).
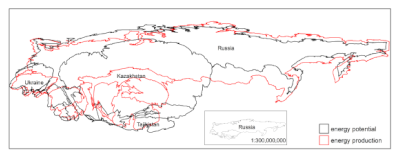
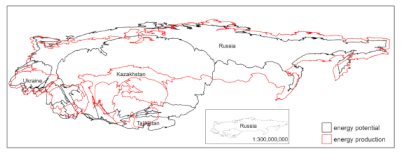
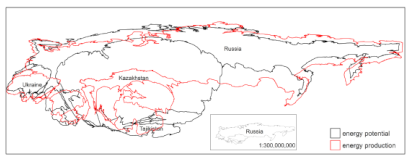
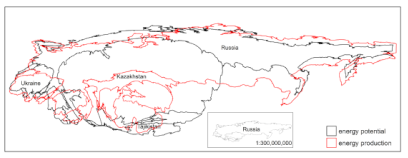
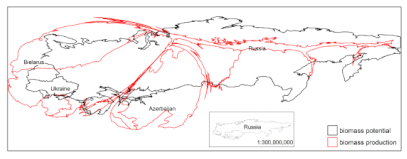
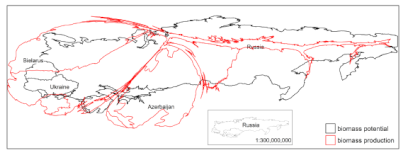
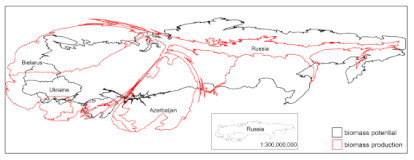
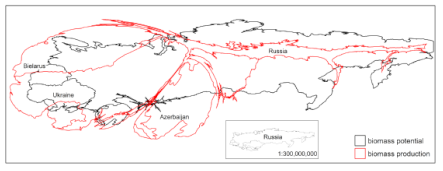
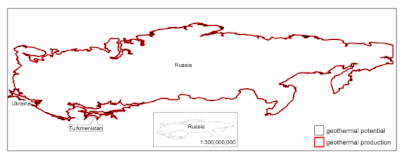
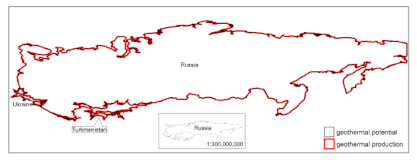
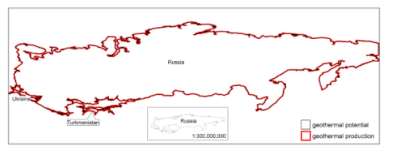
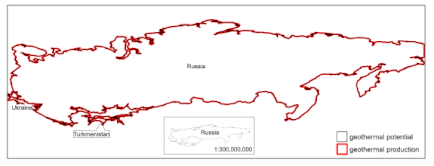
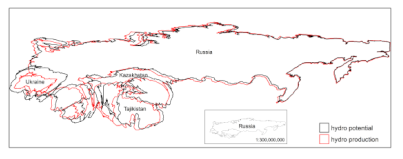
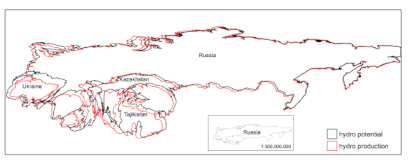
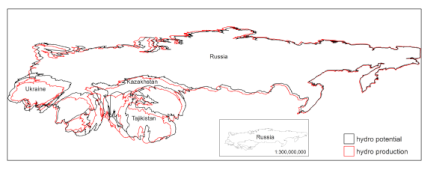
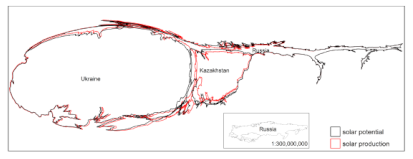
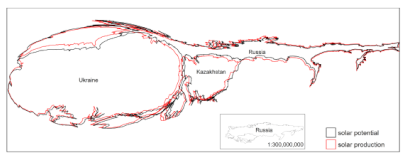
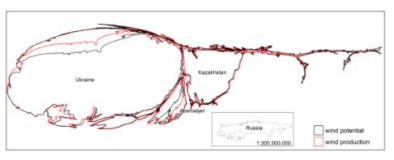
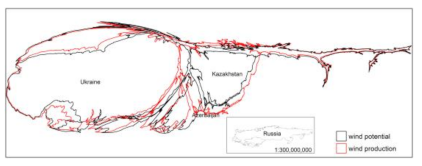
When it comes to the second part of the analysis, its results have been visualized using 24 maps (Table 4). These are amorphous choropleths, also known as Gastner-Newman choropleths. These maps are not supposed to inform about the values of phenomena, but about relations between them. Their purpose is to give a general impression of surplus and scarcity, to demonstrate which countries are not engaged in the production of a given type of energy at all, despite the significant potential. These maps are to help the reader remember these relations, which is only possible using an image, and not in the form of text or numbers, which are difficult to remember when it comes to areas. The map reinforces the message by showing spatial relationships that are not observable in the table or graph. Apart from comparing power production volumes in individual countries, the figures in Table 4 additionally show the potential of these countries for a given type of renewable energy. These maps show the differences between the characteristics very suggestively, which could otherwise be achieved only through a series of graphs, which the reader would have to study at length.
They present phenomena in reference units, but the size of these units depends on the scope of a given phenomenon. Therefore, large countries such as Russia sometimes increase their surface area, as in the case of the presentation of geothermal energy (100% at the time in question), or almost completely disappear, as in the case of wind energy (only 1.4–5.1% at the time in question). However, the advantage of the algorithm used in this approach is that despite the often significant deformation of the area, its approximate shape remains preserved, and thus recognizable. The example of Russia illustrates this well. This method also has some obvious disadvantages. It is not suitable for purposes other than strictly visualizing and demonstrating, because the resulting image is not a map in the cartometric sense. However, in the case of this publication, the method used seemed to best reflect three features of the presented phenomenon, i.e., renewable energy production: differences between the renewable energy potential and production, differences between the potential and production as per four types of renewable energy (biomass, geothermal, solar, and wind energy), and the variability of all these parameters over time. The more conventional methods failed in this case. The presented figure was created from 40 amorphous choropleths, assembled in the specific form of a matrix. For improved spatial orientation, a contour map of the area in question was added to each of the cartographs within the map’s outline.
The surveyed data is multi-time, as it presents the years 2015–2018 and represents the energy potential for various RES and the production of the various types of energy in the CIS. During this period, slight differences between the same parameters, year-to-year, were usually observed. The largest were related to both the potential and production of renewable energy and included Azerbaijan, Belarus, Kazakhstan, Russia, and Ukraine. The greatest positive changes took place in Kazakhstan and were associated with all types of renewable energy, except geothermal energy, which is not available there. Russia is the only producer of geothermal energy. For this reason, the country’s energy and production potential outlines completely overlap on both cartograms in each year. However, over the years, a slight decrease in both renewable energy potential and production can be observed, almost imperceptible at this scale.
The largest potential of biomass energy (approximately 90%) in the analyzed period is also definitely observed in Russia, although it has slightly decreased in the five years. Moreover, it is observed in Azerbaijan, Belarus, and Ukraine, as a slight increase during the time in question. It is interesting, however, that Russia uses this energy on a small scale, in contrast to the other countries mentioned. In each of them, the biomass energy production increases, but the increase is so negligible that it cannot be easily observed on the presented maps. On the other hand, in the case of wind and solar energy, there is an upward trend in both potential and production, similar to the European Union or the world. This growth rate is lower in Ukraine and higher in Belarus. The importance of Russia in terms of these types of energy is marginal, which is very well demonstrated by the specific shapes of the cartograms elongated to the east.
The visualization of the entire renewable energy potential and production is intriguing, as the latter is characterized by lower absolute values. This is because the renewable energy capacity data shown in the database represent the highest net generating capacity of power plants and other RES-based power-generating installations. The data regarding most of the presented countries and technologies refers the capacity installed and connected at the end of the calendar year. Pumped storage is treated as part of the total capacity but excluded from total generation. The capacity data are presented in megawatts (MW) and the generation data are presented in gigawatt-hours (GWh). All the data are rounded to the nearest one MW/GWh, while figures in the range 0–0.5 were shown as a 0. In the balances, the baseline for calculating renewable energy trade is the share of renewables in total production [109].
Please note the activities undertaken by individual CIS countries to promote RES technologies and cooperation. Through their cooperation with the Enterprise Europe Network (EEN) and participation in consortia, Ukraine, Armenia, Moldova, Georgia, and Belarus organize and co-organize events promoting and facilitating the transfer of renewable technologies. Promotional events are also organized in other CIS countries. Based on the data on promotional meetings of RES registered by the EEN, the following events were organized in the CIS in the period in question: in Russia—8, in Ukraine—1, in Moldova—5, and in Kazakhstan—1. For comparison, in the entire EU, 320 promotional events took place, approximately 12 per country, on average.

4. Conclusions

In conclusion, it should be noted that the CIS countries leverage various forms of cooperation in the energy sector. The development of alternative energy sources in these countries is still influenced by the political-economic ties formed during the Soviet era, as well as Russia’s differentiated policy towards these countries. This is confirmed by the discussed results, which also revealed a clear level of heterogeneity in the use of RES in the energy policy of the studied countries.
Moreover, the challenge for the CIS countries is still to strive to reduce the energy intensity of their economies. The problem is quite significant because if left unsolved, the production growth will result in increased demand for energy and its raw materials. For those countries still undergoing economic, political, and social transition, this problem requires a departure from the extensive solutions, i.e., increasing the extraction of energy resources, towards the intensive way, i.e., increasing the production per unit of consumed power. That is why it is so important to accelerate the development and popularization of energy-saving and alternative energy sources, i.e., RES.
For the CIS countries, due to the peculiarities of political and economic transformations, RES is a certain challenge due to, e.g., the lack of financial support for the development and popularization of RES [110]. Moreover, as an important field of sustainable development, energy (including renewable energy) encompasses both political and economic aspects of international business relations, apart from the environmental aspects [111]. This, in turn, can result in improving the quality of international relations in the CIS area in the future.
Therefore, although there are no direct and concrete international instruments on renewable energy, sufficient policies are already in place, whose implementation should be accelerated. Genuine political will, financial and technological cooperation among stakeholders, etc., can have a key impact on the mitigation process [87]. Moreover, it can be assumed that the future development of RES and related innovations will be very important also in terms of shaping the potentials of the former USSR countries. This factor may stimulate the process of industrial modernization and implementation of solutions, reducing dependence on crude energy resources: oil, natural gas, or coal. The progress in the implementation of RES technologies in the discussed countries can also stimulate the development of small and medium entrepreneurship and foster the process of structural changes in national economies.

Author Contributions

Conceptualization, Z.G.-S., M.S. and K.K.-W.; methodology, Z.G.-S., M.S. and M.L.; software, M.C. and A.S.-S.; validation, M.S. and K.K.-W.; formal analysis, A.S.-S. and M.C.; resources, Z.G.-S., K.K.-W. and A.S.-S.; writing—original draft preparation, Z.G.-S., K.K.-W., M.S. and M.L.; writing—review and editing, A.S.-S. and M.C.; visualization, M.S. and M.L.; project administration, Z.G.-S. and M.S. All authors have read and agreed to the published version of the manuscript.

Funding

This publication was financed by a subsidy granted to the University of Agriculture in Krakow. This publication was financed by a subsidy granted to the Cracow University of Economics. The publication was financed by a subsidy for the Faculty of Management of AGH University for the maintenance and development of research potential.

Institutional Review Board Statement

Not applicable.

Informed Consent Statement

Not applicable.

Data Availability Statement

Not applicable.

Conflicts of Interest

The authors declare no conflict of interest.

References

  1. Keles, S.; Bilgen, S. Renewable energy sources in Turkey for climate change mitigation and energy sustainability. Renew. Sustain. Energy Rev. 2012, 16, 5199–5206. [Google Scholar] [CrossRef]
  2. Sen, S.; Ganguly, S. Opportunities, barriers and issues with renewable energy development—A discussion. Renew. Sustain. Energy Rev. 2017, 69, 1170–1181. [Google Scholar] [CrossRef]
  3. Martinot, E.; Dienst, C.; Weiliang, L.; Qimin, C. Renewable Energy Futures: Targets, Scenarios, and Pathways. Annu. Rev. Environ. Resour. 2007, 32, 205–239. [Google Scholar] [CrossRef] [Green Version]
  4. Li, L.; Lin, J.; Wu, N.; Xie, S.; Meng, C.; Zheng, Y.; Wang, X.; Zhao, Y. Review and outlook on the international renewable energy development. Energy Built Environ. 2020. [Google Scholar] [CrossRef]
  5. Gródek-Szostak, Z.; Suder, M.; Kusa, R.; Sikora, J.; Niemiec, M. Effectiveness of Instruments Supporting Inter-Organizational Cooperation in the RES Market in Europe. Case Study of Enterprise Europe Network. Energies 2020, 13, 6443. [Google Scholar] [CrossRef]
  6. Gródek-Szostak, Z.; Suder, M.; Kusa, R.; Szeląg-Sikora, A.; Duda, J.; Niemiec, M. Renewable Energy Promotion Instruments Used by Innovation Brokers in a Technology Transfer Network. Case Study of the Enterprise Europe Network. Energies 2020, 13, 5752. [Google Scholar] [CrossRef]
  7. Ponce, P.; Oliveira, C.; Álvarez, V.; Río-Rama, M.D.L.C.D. The Liberalization of the Internal Energy Market in the European Union: Evidence of Its Influence on Reducing Environmental Pollution. Energies 2020, 13, 6116. [Google Scholar] [CrossRef]
  8. Sun, H.; Edziah, B.K.; Song, X.; Kporsu, A.K.; Taghizadeh-Hesary, F. Estimating Persistent and Transient Energy Efficiency in Belt and Road Countries: A Stochastic Frontier Analysis. Energies 2020, 13, 3837. [Google Scholar] [CrossRef]
  9. He, Y.; Xu, Y.; Pang, Y.; Tian, H.; Wu, R. A regulatory policy to promote renewable energy consumption in China: Review and future evolutionary path. Renew. Energy 2016, 89, 695–705. [Google Scholar] [CrossRef]
  10. Kankam, S.; Boon, E.K. Energy delivery and utilization for rural development: Lessons from Northern Ghana. Energy Sustain. Dev. 2009, 13, 212–218. [Google Scholar] [CrossRef]
  11. Nfah, E.M.; Ngundam, J.M.; Tchinda, R. Modelling of solar/diesel/battery hybrid power systems for far-north Cameroon. Renew. Energy 2007, 32, 832–844. [Google Scholar] [CrossRef]
  12. Dizdaroglu, D. The Role of Indicator-Based Sustainability Assessment in Policy and the Decision-Making Process: A Review and Outlook. Sustainability 2017, 9, 1018. [Google Scholar] [CrossRef] [Green Version]
  13. Yasar, N. Stationarity properties of renewable energy consumption in the commonwealth of independent states. Int. J. Energy Econ. Policy 2020, 10, 155–159. [Google Scholar] [CrossRef]
  14. Chalvatzis, K.J.; Ioannidis, A. Energy supply security in the EU: Benchmarking diversity and dependence of primary energy. Appl. Energy 2017, 207, 465–476. [Google Scholar] [CrossRef]
  15. Cohen, G.; Joutz, F.; Loungani, P. Measuring energy security: Trends in the diversification of oil and natural gas supplies. Energy Policy 2011, 39, 4860–4869. [Google Scholar] [CrossRef] [Green Version]
  16. Vivoda, V. LNG import diversification in Asia. Energy Strat. Rev. 2014, 2, 289–297. [Google Scholar] [CrossRef]
  17. Sutrisno, A.; Nomaler, Ö.; Alkemade, F. Has the global expansion of energy markets truly improved energy security? Energy Policy 2021, 148, 111931. [Google Scholar] [CrossRef]
  18. Bilgin, M. Geopolitics of European natural gas demand: Supplies from Russia, Caspian and the Middle East. Energy Policy 2009, 37, 4482–4492. [Google Scholar] [CrossRef]
  19. Ji, Q.; Zhang, H.-Y.; Fan, Y. Identification of global oil trade patterns: An empirical research based on complex network theory. Energy Convers. Manag. 2014, 85, 856–865. [Google Scholar] [CrossRef]
  20. Zhang, H.-Y.; Ji, Q.; Fan, Y. Competition, transmission and pattern evolution: A network analysis of global oil trade. Energy Policy 2014, 73, 312–322. [Google Scholar] [CrossRef]
  21. Chien, T.; Hu, J.-L. Renewable energy and macroeconomic efficiency of OECD and non-OECD economies. Energy Policy 2007, 35, 3606–3615. [Google Scholar] [CrossRef]
  22. Apergis, N.; Payne, J.E. Renewable energy consumption and growth in Eurasia. Energy Econ. 2010, 32, 1392–1397. [Google Scholar] [CrossRef]
  23. Fang, Y. Economic welfare impacts from renewable energy consumption: The China experience. Renew. Sustain. Energy Rev. 2011, 15, 5120–5128. [Google Scholar] [CrossRef]
  24. Tiwari, A.K. A structural VAR analysis of renewable energy consumption, real GDP and CO2 emissions: Evidence from India. Econ. Bull. 2011, 31, 1793–1806. [Google Scholar]
  25. Bilgili, F.; Ozturk, I. Biomass energy and economic growth nexus in G7 countries: Evidence from dynamic panel data. Renew. Sustain. Energy Rev. 2015, 49, 132–138. [Google Scholar] [CrossRef]
  26. Ozturk, I.; Bilgili, F. Economic growth and biomass consumption nexus: Dynamic panel analysis for Sub-Sahara African countries. Appl. Energy 2015, 137, 110–116. [Google Scholar] [CrossRef]
  27. Bhattacharya, M.; Paramati, S.R.; Ozturk, I.; Bhattacharya, S. The effect of renewable energy consumption on economic growth: Evidence from top 38 countries. Appl. Energy 2016, 162, 733–741. [Google Scholar] [CrossRef]
  28. Hassine, M.B.; Harrathi, N. The causal links between economic growth, renewable energy, financial development and for-eign trade in gulf cooperation council countries. Int. J. Energy Econ. Policy 2017, 7, 76–85. [Google Scholar]
  29. Ozcan, B.; Ozturk, I. Renewable energy consumption-economic growth nexus in emerging countries: A bootstrap panel causality test. Renew. Sustain. Energy Rev. 2019, 104, 30–37. [Google Scholar] [CrossRef]
  30. Sari, R.; Ewing, B.T.; Soytas, U. The relationship between disaggregate energy consumption and industrial production in the United States: An ARDL approach. Energy Econ. 2008, 30, 2302–2313. [Google Scholar] [CrossRef]
  31. Sadorsky, P. Renewable energy consumption and income in emerging economies. Energy Policy 2009, 37, 4021–4028. [Google Scholar] [CrossRef]
  32. Cho, S.; Heo, E.; Kim, J. Causal relationship between renewable energy consumption and economic growth: Comparison between developed and less-developed countries. Geosyst. Eng. 2015, 18, 284–291. [Google Scholar] [CrossRef]
  33. Trifonov, I.; Trukhan, D.; Koshlich, Y.; Prasolov, V.; Ślusarczyk, B. Influence of the Share of Renewable Energy Sources on the Level of Energy Security in EECCA Countries. Energies 2021, 14, 903. [Google Scholar] [CrossRef]
  34. Dolgiev, M.M. Energy Potential as the Most Important Factor of Ensuring Regional Economic Security. Available online: http://vestnik.adygnet.ru/files/2012.4/2214/dolgiev2012_4.pdf (accessed on 23 February 2021).
  35. Lobova, S.V.; Ragulina, J.V.; Bogoviz, A.V.; Alekseev, A.N. Energy security performance: A dataset on the member countries of the Commonwealth of Independent States, 2000–2014. Data Brief. 2019, 26, 104450. [Google Scholar] [CrossRef] [PubMed]
  36. Apergis, N.; Payne, J.E. Energy consumption and economic growth: Evidence from the Commonwealth of Independent States. Energy Econ. 2009, 31, 641–647. [Google Scholar] [CrossRef]
  37. Çetintaş, H. Energy consumption and economic growth: The case of transition economies. Energy Sources Part B Econ. Plan. Policy 2016, 11, 267–273. [Google Scholar] [CrossRef]
  38. Ehkonomicheskij Sud Sodruzhestva Nezavisimykh Gosudarstv, Reshenie o Tolkovanii po Zaprosu o Primenenii Polozhej Soglashenij i Drugikh Aktov Sodruzhestva s Dnia 31 Marta 1994 Goda No 02/94. Available online: http://www.sudsng.org/download_files/rh/1994/Rh_02_94_310394.pdf (accessed on 2 January 2021).
  39. Kotulewicz, K. Procesy integracyjne i relacje społeczno-polityczne na terytorium WNP. In Społeczne, Gospodarcze i Polityczne Relacje we Współczesnych Stosunkach Międzynarodowych; Bednarczyk, B., Lasoń, M., Eds.; Krakowska Szkoła Wyższa im. Andrzeja Frycza Modrzewskiego: Kraków, Poland, 2007; p. 35. [Google Scholar]
  40. Ehksperty SNG Obsudjat v Sredu Proekt Soglashenija ob Associirovannom Chlenstve Turkmnii v Sodruzhestve. Available online: https://forum.md/ru/656279 (accessed on 10 January 2021).
  41. Reshenie Glavy Gosarstv-Uchastnikov Sodruzhestva Nvisimykh Gosudarstv ot 22 Oktjabrja 1993 Goda—3 Dekabrja 1993 Goda “O Vstuplenii Respubliki Gruzja v Sodruzhestvo Nezavisimykh Gosudarstv”. Available online: http://base.spinform.ru/show_doc.fwx?rgn=3938 (accessed on 1 January 2021).
  42. Vstuplenie i Vykhod iz SNG; Uchastie i Chlenstvo v SNG. Dose. Available online: https://tass.ru/info/1061058 (accessed on 1 January 2021).
  43. O Ratifikacii Ustava Sodruzhestva Nezavisiykh Gosudarstv. Available online: http://adilet.zan.kz/rus/docs/B930005200 (accessed on 1 January 2021).
  44. Pjatidnevnaja Vojna (8–12 Avgusta 2008 Goda). Available online: https://www.kavkaz-uzel.eu/articles/210899 (accessed on 1 January 2021).
  45. Gruzija Oficialno Vyshla iz Sostava SNG. Available online: https://www.bbc.com/russian/international/2009/08/090817_georgia_leaves_cis (accessed on 1 January 2021).
  46. Ustav Sodruzhestva Nezavisimykh Gosudarstv (g. Minsk, 22 Janvarja 1993 Goda). Available online: https://cis.minsk.by/page/180 (accessed on 1 January 2021).
  47. SNG Oficialn Iskljuchilo Gruzju iz Svoikh Rjadov. Available online: https://korrespondent.net/world/609809-sng-oficialno-isklyuchilo-gruziyu-iz-svoih-ryadov (accessed on 1 January 2021).
  48. Gruzija: Mozhno Perezhitbez SNG. Available online: https://www.rosbalt.ru/world/2009/08/17/664239.html (accessed on 1 January 2021).
  49. Ukraina Reshila Vyjti iz SNG. Available online: https://lenta.ru/news/2014/05/27/ukraine/ (accessed on 1 January 2021).
  50. Kazakhstan Vstupajet v Poru Ispytanija Zrelost. Available online: http://tengemonitor.kazgazeta.kz/news/16018 (accessed on 1 January 2021).
  51. RIA Novosti Ukraina, V Radu Podan Zakonoproekt o Vykhode Ukrainy iz Organov SNG. Available online: https://rian.com.ua/politics/20161110/1018587604.html (accessed on 1 January 2021).
  52. Status Ukrainy v SNG. Dose. Available online: https://tass.ru/info/5215654 (accessed on 1 January 2021).
  53. Ukraina Zakryla Predstavitelstvo Pri Ustavnykh Organakh SNG. Available online: https://iz.ru/782812/2018-08-28/ukraina-zakryla-predstavitelstvo-pri-ustavnykh-organakh-sng (accessed on 1 January 2021).
  54. Odinnadcat Stulev: Ukrainu Priglasjat na Sammit SNG. Available online: https://iz.ru/897444/dmitrii-laru/odinnadtcat-stulev-ukrainu-priglasiat-na-sammit-sng (accessed on 1 January 2021).
  55. MFV Vyvel Ukrainu iz Gruppy SNG—Markarova. Available online: https://www.ukrinform.ru/rubric-economy/2799941-mvf-vyvel-ukrainu-iz-gruppy-sng-markarova.html (accessed on 1 January 2021).
  56. The State Statistical Committee of the Republic of Azerbaijan. Available online: https://www.stat.gov.az/ (accessed on 21 February 2021).
  57. Agency for Strategic Planning and Reforms of the Republic of Kazakhstan Bureau of National Statistics. Available online: https://stat.gov.kz/ (accessed on 4 February 2021).
  58. Invest in Uzbekistan, Economy. Available online: http://invest-in-uzbekistan.org/en/ekonomika/ (accessed on 4 February 2021).
  59. International Energy Agency for EU4Energy, Uzbekistan. Country Overview. Available online: https://www.eu4energy.iea.org/countries/uzbekistan (accessed on 4 February 2021).
  60. Bank Światowy. Available online: https://databank.worldbank.org/source/world-development-indicators# (accessed on 15 January 2021).
  61. Statistical Committee of the Republic of Armenia. Available online: https://www.armstat.am/file/article/trud_2020_4.2.pdf (accessed on 15 January 2021).
  62. National Statistical Committee the Republic of Belarus. Available online: https://www.belstat.gov.by/en/ (accessed on 4 February 2021).
  63. National Bureau Statistics of the Republic of Moldova. Available online: https://statistica.gov.md/index.php?l=en (accessed on 4 February 2021).
  64. State Statistic Service of Ukraine. Available online: http://www.ukrstat.gov.ua/ (accessed on 4 February 2021).
  65. National Statistics Office of Georgia. Available online: https://www.geostat.ge/en (accessed on 4 February 2021).
  66. Asoev, A.R. Toplivno-Energeticheskij Kompleks Respubliki Tadzhikistana, Agensvo po Statistike pri Prizidente Respubliki Tadzhikistan. Available online: https://unstats.un.org/unsd/energy/meetings/cis2011/ac.240-p2_fuel.ppt (accessed on 3 January 2021).
  67. Przewodnik po Rynku—Republika Kirgiska. Available online: https://www.parp.gov.pl/storage/publications/pdf/2008_kirgistan.pdf (accessed on 4 February 2021).
  68. Istorija Rossijsko-Armjanslikh Otnoshenij. Available online: https://tass.ru/info/5538778 (accessed on 15 June 2019).
  69. Gruzija. Available online: http://www.gazpromexport.ru/partners/georgia/ (accessed on 15 June 2019).
  70. Issledovanie Ehkonomiki Pridnestrovja, Centr Strategicheskikh Issledovanij i Reform, Kishinev-Tiraspol, Nojabr 2003, pp. 9–10. Available online: http://www.cisr-md.org/pdf/0311%20transn-research%20RUS.pdf (accessed on 3 January 2021).
  71. Godovoj Otchet 2003; Gazprom: Moscow, Russia, 2003; p. 70.
  72. Eberhardt, A. Gra Pozorów. Stosunki Rosyjsko-Białoruskie 1991–2008; PISM: Warszawa, Poland, 2008; pp. 143–149. [Google Scholar]
  73. Kotulewicz, K. Geostrategiczny wybór Rosji u Zarania Trzeciego Tysiąclecia. Tom II. Unia Europejska Jako Strategiczny Partner Federacji Rosyjskiej na Początku XXI Wieku. Cześć II; Aspekt Gospodarczy; Wydawnictwo Uniwersytetu Jagiellońskiego: Kraków, Poland, 2015; pp. 142–155. [Google Scholar]
  74. Generacija Ehletroehnergii. Available online: https://www.rosatom.ru/production/generation/ (accessed on 22 February 2021).
  75. Abbasov, S. Plany Azerbajdzhana po Razitiju Atomnoj Ehnergetiki Vyzyvajut Ozabochennost. Available online: https://russian.eurasianet.org/node/60602 (accessed on 22 February 2021).
  76. Rossija Nachala Pokupat Gaz za Rubezhom. Available online: https://lenta.ru/news/2019/04/15/turk_rus/ (accessed on 15 June 2019).
  77. Dzhumaev, I. Vneshnjaja Torgovla Turkmenistana: Tendencii, Problemy i Perspektivy; Universitet Centralnoj Azii, Institut Gosudarstvennogo Upravlenija i Politiki: Bishkek, Kyrgyz Republic, 2012; pp. 8–11. [Google Scholar]
  78. Gródek-Szostak, Z.; Luc, M.; Szeląg-Sikora, A.; Sikora, J.; Niemiec, M.; Ochoa Siguencia, L.; Velinov, E. Promotion of RES in a Technology Transfer Network. Case Study of the Enterprise Europe Network. Energies 2020, 13, 3445. [Google Scholar] [CrossRef]
  79. Velinov, E.; Petrenko, Y.; Vechkinzova, E.; Denisov, I.; Ochoa Siguencia, L.; Gródek-Szostak, Z. “Leaky Bucket” of Kazakhstan’s Power Grid: Losses and Inefficient Distribution of Electric Power. Energies 2020, 13, 2947. [Google Scholar] [CrossRef]
  80. Gródek-Szostak, O.; Siguencia, L.; Kajrunajtys, D. Impact of business environment institutions on effective entrepreneurial education. In Edulearn19: 11th International Conference on Education and New Learning Technologies; Torres EDULEARN Proceedings; Chova, L.G., Martinez, A.L., Eds.; IATED: Palma, Spain, 2019; pp. 10625–10629. [Google Scholar]
  81. Niemiec, M.; Paluch, Ł.; Gródek-Szostak, Z.; Szeląg-Sikora, A.; Sikora, J.; Mudryk, K. Evaluation of the environmental and economic aspects of the use of common reed from eutrophic lakes for energy purposes. In Proceedings of the IOP Conference Series: Earth and Environmental Science, Volume 214, International Conference on the Sustainable Energy and Environmental Development, Krakow, Poland, 14–17 November 2017; OP Publishing Ltd: Bristol, UK, 2019; p. 012117. [Google Scholar]
  82. Gródek-Szostak, Z.; Luc, M.; Szeląg-Sikora, A.; Niemiec, M.; Kajrunajtys, D. Economic Missions and Brokerage Events as an Instrument for Support of International Technological Cooperation Between Companies of the Agricultural and Food Sector. In Infrastructure and Environment; Krakowiak-Bal, A., Vaverkova, M., Eds.; Springer: Cham, Switzerland, 2019. [Google Scholar]
  83. 2012 US Presidential Election Results by County: Democrat & Republican Share of Vote. Available online: https://www.arcgis.com/home/item.html?id=4b8c9ce99a5749e298bb96366692f35d (accessed on 2 January 2021).
  84. Sobczyk, M. Statystyka; PWN: Warszawa, Poland, 2007. [Google Scholar]
  85. Grabara, J.; Tleppayev, A.; Dabylova, M.; Mihardjo, L.W.W.; Dacko-Pikiewicz, Z. Empirical Research on the Relationship amongst Renewable Energy Consumption, Economic Growth and Foreign Direct Investment in Kazakhstan and Uzbekistan. Energies 2021, 14, 332. [Google Scholar] [CrossRef]
  86. Kowalczyk, Z.; Kwaśniewski, D. Environmental impact of the cultivation of energy willow in Poland. Sci. Rep. 2021, 11, 4571. [Google Scholar] [CrossRef]
  87. Marinaş, M.C.; Dinu, M.; Soco, A.G.; Cristian, S. Renewable energy consumption and economic growth: Causality relationship in Central and Eastern European countries. PLoS ONE 2018, 13, e0202951. [Google Scholar] [CrossRef] [Green Version]
  88. Tiwari, A.K. Comparative performance of renewable and non-renewable energy sources on economic growth and CO2 emissions of Europe and Eurasian countries: A PVAR approach. Econ. Bull. 2011, 31, 2356–2372. [Google Scholar]
  89. Bielecki, A.; Ernst, S.; Skrodzka, W.; Wojnicki, I. The externalities of energy production in the context of development of clean energy generation. Environ. Sci. Pollut. Res. 2020, 27, 11506–11530. [Google Scholar] [CrossRef] [PubMed] [Green Version]
  90. Lotz, R.I. The Impact of Renewable Energy Consumption to Economic Welfare: A Panel Data Application; Working Paper; Department of Economics University of Pretoria: Pretoria, South Africa, 2013; Available online: http://www.up.ac.za/media/shared/Legacy/sitefiles/file/40/677/wp_2013_15.pdf (accessed on 8 March 2021).
  91. Ntanos, S.; Skordoulis, M.; Kyriakopoulos, G.; Arabatzis, G.; Chalikias, M.; Galatsidas, S.; Batzios, A.; Katsarou, A. Renewable energy and economic growth: Evidence from European countries. Sustainability 2018, 10, 2626. [Google Scholar] [CrossRef] [Green Version]
  92. Soava, G.; Mehedintu, A.; Sterpu, M.; Raduteanu, M. Impact of renewable energy consumption on economic growth: Evidence from European Union countries. Technol. Econ. Dev. Econ. 2018, 24, 1197–1215. [Google Scholar] [CrossRef]
  93. Chehabeddine, M.; Tvaronavičienė, M. Securing regional development. Insights Reg. Dev. 2020, 2, 430–442. [Google Scholar] [CrossRef]
  94. Nukusheva, A.; Ilyassova, G.; Kudryavtseva, L.; Shayakhmetova, Z.; Jantassova, A.; Popova, L. Transnational corporations in private international law: Do Kazakhstan and Russia have the potential to take the lead? Entrep. Sustain. Issues 2020, 8, 496–512. [Google Scholar] [CrossRef]
  95. Bryant, S.T.; Straker, K.; Wrigley, C. The discourses of power–governmental approaches to business models in the renewable energy transition. Energy Policy 2019, 130, 41–59. [Google Scholar] [CrossRef]
  96. Shindina, T.; Streimikis, J.; Sukhareva, Y.; Nawrot, Ł. Social and Economic Properties of the Energy Markets. Econ. Sociol. 2018, 11, 334–344. [Google Scholar] [CrossRef]
  97. Gavurova, B.; Perzelova, I.; Bencoova, B. Economic aspects of renewable energy use—Application of support schemes based on a particular biogas plant in Slovakia. Acta Montan. Slovaca 2016, 21, 217–228. [Google Scholar]
  98. Semenenko, I. Energy security of Ukraine in the context of its sustainable development. Equilibrium. Q. J. Econ. Econ. Policy 2016, 11, 537–555. [Google Scholar]
  99. An, J.; Gudmundsson, F.A.P.; Sokolinskaya, N.; Prosekov, S.; Meynkhard, A.; Simonyan, L. Efficiency of Renewable Energy Plants in Russia. Int. J. Energy Econ. Policy 2020, 10, 81–88. [Google Scholar] [CrossRef]
  100. Alekseev, A.N.; Bogoviz, A.V.; Goncharenko, L.P.; Sybachin, S.A. A Critical Review of Russia’s Energy Strategy in the Period until 2035. Int. J. Energy Econ. Policy 2019, 9, 95–102. [Google Scholar] [CrossRef] [Green Version]
  101. Dudin, M.N.; Frolova, E.E.; Protopopova, O.V.; Mamedov, A.A.; Odintsov, S.V. Study of innovative technologies in the energy industry: Nontraditional and renewable energy source. Entrep. Sustain. Issues 2019, 6, 1704–1713. [Google Scholar] [CrossRef]
  102. Østergaard, P.A.; Duic, N.; Noorollahi, Y.; Mikulcic, H.; Kalogirou, S. Sustainable development using renewable energy technology. Renew. Energy 2020, 146, 2430–2437. [Google Scholar] [CrossRef]
  103. Karatayev, M.; Clarke, M.L. A review of current energy systems and green energy potential in Kazakhstan. Renew. Sustain. Energy Rev. 2016, 55, 491–504. [Google Scholar] [CrossRef]
  104. Sineviciene, L.; Sotnyk, I.; Kubatko, O. Determinants of energy efficiency and energy consumption of Eastern Europe post-communist economies. Energy Environ. 2017, 28, 870–884. [Google Scholar] [CrossRef]
  105. Sikora, J.; Niemiec, M.; Szeląg-Sikora, A.; Gródek-Szostak, Z.; Kuboń, M.; Komorowska, M. The Impact of a Controlled-Release Fertilizer on Greenhouse Gas Emissions and the Efficiency of the Production of Chinese Cabbage. Energies 2020, 13, 2063. [Google Scholar] [CrossRef] [Green Version]
  106. Commonwealth of Independent States (CIS) Solar Photovoltaic (PV) Power Market Outlook 2019–2028. Available online: https://renewablemarketwatch.com/country-reports/cis/azerbaijan/commonwealth-of-independent-states-cis-solar-photovoltaic-pv-power-market-outlook-2019-2028-multi-user-2-5-users-detail (accessed on 8 March 2021).
  107. Project: “Enhancing Synergies in Commonwealth of Independent States (CIS) National Programmes on Energy Efficiency and Energy Saving for Greater Energy Security” Regional Study “Analysis of policies of CIS Countries on Improving Energy Efficiency and Potential for Developing Cooperation and Enhancing Synergies in the CIS Region”. Available online: https://unece.org/fileadmin/DAM/energy/se/pdfs/ee21/EE21_Subregional_projects/RegionalReportCISFinal28Oct201313_Eng.pdf (accessed on 8 March 2021).
  108. Chowaniak, M.; Głąb, T.; Klima, K.; Niemiec, M.; Zaleski, T.; Zuzek, D. Effect of tillage and crop management on runoff, soil erosion, and organic carbon loss. Soil Use Manag. 2020, 36, 581–593. [Google Scholar] [CrossRef]
  109. IRENA. Renewable Energy Statistics 2020 The International Renewable Energy Agency; IRENA: Abu Dhabi, United Arab Emirates, 2020. [Google Scholar]
  110. Karim, M.E.; Munir, A.B.; Karim, M.A.; Muhammad-Sukki, F.; Abu-Bakar, S.H.; Sellami, N.; Bani, N.A.; Hassan, M.Z. Energy Revolution for Our Common Future: An Evaluation of the Emerging International Renewable Energy Law. Energie 2018, 11, 1769. [Google Scholar] [CrossRef] [Green Version]
  111. Luc, M. Placing the idea of sustainable landscape in ecophilosophy. Probl. Sustain. Dev. 2014, 9, 81–88. [Google Scholar]
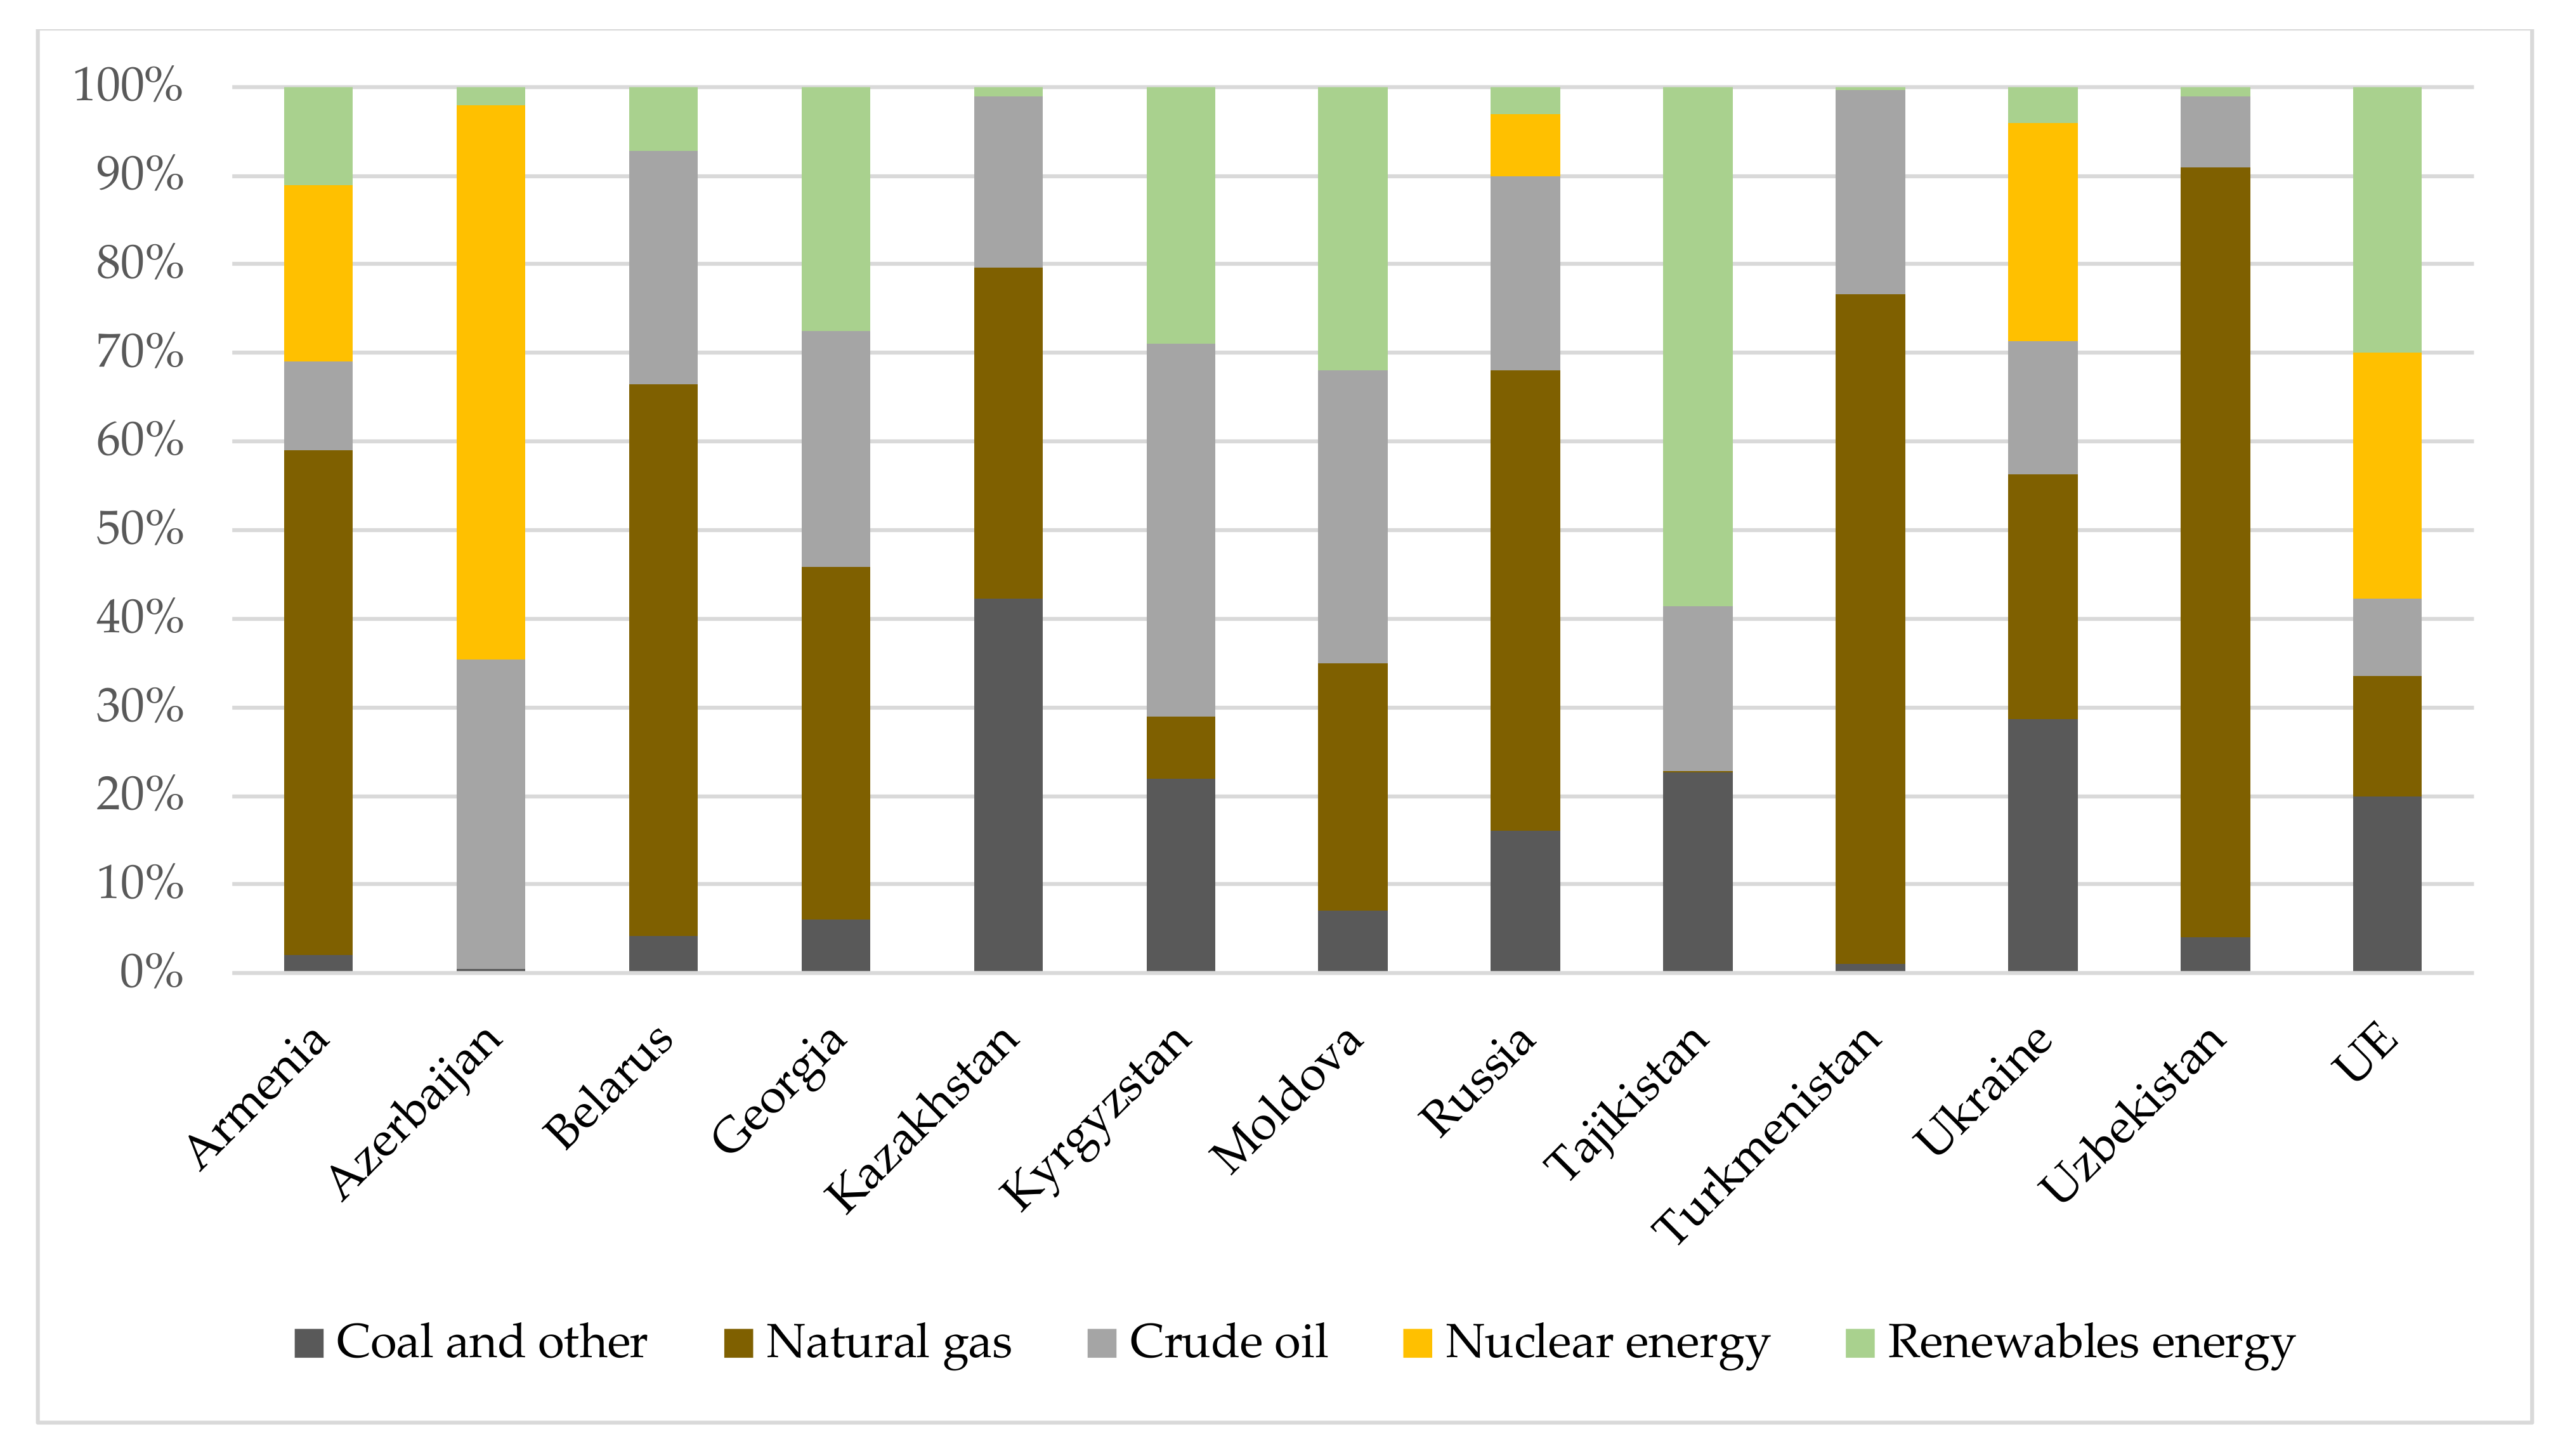
Figure 1. Structure of energy production sources in CIS and EU countries. Source: Own elaboration based on International Renewable Energy Agency (IRENA) 2020.
Energies 14 01856 g001
Figure 2. Energy potential of the CIS countries in 2019. Source: Own elaboration based on IRENE.
Energies 14 01856 g002
Figure 3. Energy production potential of individual renewable energy sources (RES) in 2019, as per area. Source: Own elaboration based on IRENE.
Energies 14 01856 g003
Figure 4. Renewable energy production in the CIS countries in 2018. Source: Own elaboration based on IRENE.
Energies 14 01856 g004
Figure 5. The volume of total production in the CIS in 2018, as per the population count. Source: Own elaboration based on IRENE.
Energies 14 01856 g005
Table 1. Total area and population of individual Commonwealth of Independent States (CIS) countries, as well as of CIS and European Union (EU).
CountryTotal Area
(in Thousand km2)
Population
(in Million)
Armenia29.82.991
Azerbaijan86.69.822
Belarus207.69.413
Georgia69.73.718
Kazakhstan2724.918.736
Kyrgyzstan198.56.263
Moldova33.83.553
Russia17,075.4146.238
Tajikistan143.17.800
Turkmenistan488.15.180
Ukraine603.737.289
Uzbekistan447.433.398
CIS total22,108.6284.401
EU total4478.1514.502
Source: Own elaboration, based on Eurostat.
Table 2. Dynamics of changes in the energy potential of the CIS countries and the average potential for EU countries in 2019.
CountryHydropowerBioenergyGeothermalSolarWindTotal Energy
Average Absolute Gain (MW)Average Growth Rate Average Absolute Gain (MW)Average Growth Rate Average Absolute Gain (MW)Average Growth Rate Average Absolute Gain (MW)Average Growth Rate (%)Average Absolute Gain (MW)Average Growth Rate (%)Average Absolute Gain (MW)Average Growth Rate (%)
Armenia12.31.3% 12.5 0.00.0%24.82.5%
Azerbaijan7.00.8%1.85.8% 8.094.9%14.5102.1%31.33.5%
Belarus15.541.7%4.514.6% 36.0129.4%16.536.1%72.449.1%
Georgia113.85.0% 0.3 5.3 119.35.2%
Kazakhstan25.01.2%0.5 169.878.8%53.058.0%248.310.3%
Kyrgyzstan−1.00.0% −1.00.0%
Moldova0.00.0%0.826.0% 0.544.2%8.0220.8%9.315.4%
Russia118.70.3%0.00.0%−1.0−1.7%250.7158.9%22.8110.7%391.11.0%
Tajikistan60.01.6% 60.01.6%
Turkmenistan0.00.0% 0.00.0%
Ukraine108.82.4%29.047.2% 1273.891.8%186.034.8%1597.523.3%
Uzbekistan45.53.3% 0.858.7%0.3 46.53.4%
CIS −60.7−1.2%6.13.1%−1.0−1.7%179.971.6%28.830.8%153.22.7%
EU 28.20.7%63.66.5%0.62.4%311.010.7%444.310.6%847.66.9%
Source: Own elaboration based on IRENE.
Table 3. The dynamics of renewable energy production in the CIS countries in 2015–2018.
CountryHydropowerBioenergyGeothermalSolarWindTotal Energy
Average Absolute Gain (MW)Average Growth Rate Average Absolute Gain (MW)Average Growth Rate Average Absolute Gain (MW)Average Growth Rate Average Absolute Gain (MW)Average Growth Rate (%)Average Absolute Gain (MW)Average Growth Rate (%)Average Absolute Gain (MW)Average Growth Rate (%)
Armenia28.11.7% 4.9 −0.3−14.3%32.71.9%
Azerbaijan32.62.6%−4.9−3.7% 8.7104.9%19.5161.9%55.93.9%
Belarus54.244.6%8.57.5% 42.4187.3%31.579.4%136.643.3%
Georgia373.95.6% 0.0 21.1 395.05.9%
Kazakhstan281.53.9%3.8 66.548.1%82.251.8%434.15.7%
Kyrgyzstan806.48.9% 806.48.9%
Moldova−33.8−17.2%3.826.0% 0.425.5%5.4145.9%−24.3−11.0%
Russia83.60.2%0.00.0%−1.0−1.7%118.5105.9%10.368.2%211.40.5%
Tajikistan418.33.2% 418.33.2%
Turkmenistan0.00.0% 0.00.0%
Ukraine1259.119.9%25.414.7% 81.37.7%23.12.3%1388.916.2%
Uzbekistan−550.7−10.0% 1.246.4%0.0 −549.5−10.0%
CIS 193.72.6%6.12.4%−1.0−1.7%24.911.8%17.59.9%241.22.9%
EU 58.30.6%86.91.8%0.60.3%173.75.6%660.27.5%979.83.6%
Source: Own elaboration based on IRENE.
Table 4. The RES potential and production matrix of the Commonwealth of Independent States in 2015–2018.
Year/Energy Type2015201620172018
All energy Energies 14 01856 i001 Energies 14 01856 i002 Energies 14 01856 i003 Energies 14 01856 i004
Biomass Energies 14 01856 i005 Energies 14 01856 i006 Energies 14 01856 i007 Energies 14 01856 i008
Geothermal Energies 14 01856 i009 Energies 14 01856 i010 Energies 14 01856 i011 Energies 14 01856 i012
Hydro Energies 14 01856 i013 Energies 14 01856 i014 Energies 14 01856 i015 Energies 14 01856 i016
Solar Energies 14 01856 i017 Energies 14 01856 i018 Energies 14 01856 i019 Energies 14 01856 i020
Wind Energies 14 01856 i021 Energies 14 01856 i022 Energies 14 01856 i023 Energies 14 01856 i024
Source: Own elaboration based on IRENE.
Publisher’s Note: MDPI stays neutral with regard to jurisdictional claims in published maps and institutional affiliations.