
Refrigeration of COVID-19 Vaccines: Ideal Storage Characteristics, Energy Efficiency and Environmental Impacts of Various Vaccine Options


Abstract
1. Introduction
- Ultra-low-temperature freezers, which are available on the market and can extend service life by up to six months;
- Pfizer thermal shipper, in which doses will arrive, which can be used as temporary storage units, recharging with dry ice every five days for up to 30 days of storage;
- Refrigeration units commonly available in hospitals. The vaccine can be stored for five days, refrigerated at 2–8 °C.
- The vaccine will arrive frozen between −25 °C and −15 °C and needs to be stored at the same temperature. After defrosting, the vaccine may be thawed in the refrigerator or at room temperature [8];
- Refrigerator: 2 °C to 8 °C for 2 h and 30 min;
- Room temperature: between 15 °C and 25 °C for 1 h.;
- Unpunctured vials may be kept between 8 °C and 25 °C for up to 12 h;
- Thawed vaccines cannot be refrozen;
- Vaccine vials may be stored in the refrigerator between 2 °C and 8 °C for up to 30 days before vials are punctured. After 30 days, any remaining vials should be removed from the refrigerator and discarded following manufacturer and jurisdiction guidance on proper disposal [7].
- It can be stored in a refrigerator (2 °C to 8 °C);
- It should not freeze;
- After the first dose is withdrawn, the vaccine should be used as soon as possible and within six hours. During use, it can be stored from 2 °C to 25 °C.
2. Materials and Methods
- Height, H = 2050 mm;
- Length, L = 1600 mm;
- Width, W = 790 mm;
- Gross volume, Vg = 2.59 m3;
- Useful volume, Vu = 1.05 m3;
- Estimated dose capacity, n = 100,000;
- Dose Volume, Vd = 0.3 ml (= 3.0 × 10⁻⁷ m3).
2.1. Vaccine Energy Usage Effectiveness Design (EUED)
2.2. Vaccine Total Equivalent Warming Impact (TEWI)
- Direct emission—refrigerant released during the lifetime of the equipment, including losses not recovered on the final disposal;
- Indirect emission—the impact of CO2 emissions from fossil fuels used to generate the electric energy that is used in the operation of the equipment throughout its lifetime.
3. Analysis and Discussion of Results
3.1. Worldwide Vaccine EUED
3.2. Worldwide Vaccine TEWI
4. Conclusions
Author Contributions
Funding
Institutional Review Board Statement
Informed Consent Statement
Data Availability Statement
Acknowledgments
Conflicts of Interest
References
- ABRAVA. Revista ABRAVA+Climatização & Refrigeração. Editora Novatécnica; ABRAVA: São Paulo, Brazil, 2021; ISSN 2358-8926. [Google Scholar]
- Ledford, H. Moderna COVID vaccine becomes second to get US authorization. Nature 2020. [Google Scholar] [CrossRef] [PubMed]
- Kaoru, T.; Fernandes, D. Anvisa Approves Emergency Use of Oxford and Coronavac Vaccine; CNN: São Paulo, Brazil. Available online: https://www.cnnbrasil.com.br/saude/2021/01/17/votos-anvisa-vacina-coronavac-oxford (accessed on 17 January 2021).
- Gamba, L. Argentina 1st Latin American Nation to OK Sputnik Vaccine. Plane Expected to Bring 300,000 Doses of Vaccine to Country Thursday. Anadolu Agency. Available online: https://www.aa.com.tr/en/americas/argentina-1st-latin-american-nation-to-ok-sputnik-vaccine/2086848 (accessed on 9 February 2021).
- Gewin, V. Safely Conducting Essential Research in the Face of COVID-19. Nature 2020, 580, 549–550. [Google Scholar] [CrossRef] [PubMed]
- Pfizer. Covid-19 Vaccine U.S. Distribution Fact Sheet. Available online: https://www.pfizer.com/news/hot-topics/covid_19_vaccine_u_s_distribution_fact_sheet (accessed on 10 February 2021).
- CDC. Moderna COVID-19 Vaccine. Storage and Handling Summary. Available online: https://www.cdc.gov/vaccines/covid-19/info-by-product/moderna/downloads/storage-summary.pdf (accessed on 9 February 2021).
- CDC. Info by Product. Available online: https://www.cdc.gov/vaccines/covid-19/info-by-product/moderna/index.htm (accessed on 10 February 2021).
- KIM, M.; LIU, R. Sinovac’s COVID-19 Vaccine Induces Quick Immune Response Study; REUTERS: Toronto, ON, Canada, 2020. [Google Scholar]
- Medicines & Healthcare Products Regulatory Agency. Decision: Information for UK Recipients on COVID 19 Vaccine AstraZeneca; Medicines & Healthcare Products Regulatory Agency: London, UK, 2021. [Google Scholar]
- Jones, I.; Roy, P. Sputnik V COVID-19 Vaccine Candidate Appears Safe and Effective. Lancet 2021. [Google Scholar] [CrossRef]
- CDC. Storage and Handling Summary. Available online: https://www.cdc.gov/vaccines/covid-19/info-by-product/janssen/downloads/janssen-storage-handling-summary.pdf (accessed on 19 May 2020).
- CDC. Pfizer-BioNTech COVID-19 Vaccine. Available online: https://www.cdc.gov/vaccines/covid-19/info-by-product/pfizer/index.html (accessed on 10 February 2021).
- COOLPACK. Software COOLPACK Version 1.49; IPU & Department of Mechanical Engineering Technical University of Denmark: Lynby, Denmark, 2011. [Google Scholar]
- ASHRAE 90.1. Standard 90.1-2019 (I-P Edition)—Energy Standard for Buildings Except Low-Rise Residential Buildings (ANSI Approved;IES Cosponsored); ASHRAE: Atlanta, GA, USA, 2019. [Google Scholar]
- AHRI 1201-2013. Performance Rating of Commercial Refrigerated Display Merchandisers and Storage Cabinets (SI) (AHRI); AURI: Arlington, TX, USA, 2013. [Google Scholar]
- AHRI 210/240-2017. Performance Rating of Unitary Air-Conditioning & Air-Source Heat Pump Equipment; AHRI: Arlington, TX, USA, 2017. [Google Scholar]
- ANSI/ASHRAE Standard 72—2018. Standard 72-2018—Method of Testing Open and Closed Commercial Refrigerators and Freezers (ANSI Approved); ANSI: Arlington, TX, USA, 2018. [Google Scholar]
- EPA. International Actions—The Montreal Protocol on Substances that Deplete the Ozone Layer. United States Environmental Protection Agency—EPA. Available online: https://www.epa.gov/ozone-layer-protection/international-actions-montreal-protocol-substances-deplete-ozone-layer (accessed on 10 February 2021).
- Unenviroment. The Kigali Amendment to the Montreal Protocol: HFC Phase-Down. Available online: https://www.unenvironment.org/ozonaction/resources/factsheet/kigali-amendment-montreal-protocol-hfc-phase-down (accessed on 10 February 2021).
- IPCC. Fourth Assessment Report. 2021. Available online: https://www.ipcc.ch/assessment-report/ar4/ (accessed on 22 January 2021).
- WHO. Guideline for Establishing or Improving Primary and Intermediate Vaccine Stores Vaccines and Biologicals; World Health Organization, Department of Vaccines and Biologicals, CH-1211: Geneva, Switzerland, 2002. [Google Scholar]
- OPTEON. Chemours Refrigerant Expert 1.0 Software. Available online: https://www.opteon.com/en/support/helpful-resources/refrigerant-expert-tool (accessed on 10 February 2021).
- Santos, A.F.; Souza, H.J.L.; Cantão, M.P.; Gaspar, P.D. Analysis of temperatures for geothermal heat pumps application in Paraná (Brazil). In Proceedings of the International Conference on Engineering—Engineering for Society (ICEUBI2015), University of Beira Interior, Covilhã, Portugal, 3–4 December 2015; ISBN 978-989-654-261-0. [Google Scholar]
- Santos, A.F.; Souza, H.J.L.; Cantão, M.P.; Gaspar, P.D. Analysis of temperatures for geothermal heat pumps application in Paraná (Brazil). Open Eng. 2016, 6, 485–491. [Google Scholar] [CrossRef]
- Santos, A.F.; de Souza, H.J.L.; Gaspar, P.D. Avaliação do desempenho térmico e energético de um datacenter por um novo índice de eficiência: Energy Usage Effectiveness Design—EUED. In Proceedings of the 11° Congresso Brasileiro de Ar Condicionado, Refrigeração, Aquecimento e Ventilação, Porto Alegre, Brazil, 25–27 September 2018. [Google Scholar]
- Santos, A.F.; Gaspar, P.D.; Souza, H.J.L. Avaliação do desempenho térmico e energético de um datacenter por um novo índice de eficiência: Energy Usage Effectiveness Design—EUED. In Proceedings of the Congresso Brasileiro de Refrigeração, Ar-Condicionado, Ventilação, Aquecimento e Tratamento de Ar (XVI CONBRAVA), São Paulo, Brazil, 10–13 September 2019. [Google Scholar]
- Santos, A.F.; de Souza, H.J.L.; Gaspar, P.D. Evaluation of the heat and energy performance of a datacenter by a new efficiency index: Energy Usage Effectiveness Design—EUED. In Proceedings of the 25th IIR International Congress of Refrigeration (ICR 2019), Montreal, QC, Canada, 24–30 August 2019. [Google Scholar] [CrossRef]
- Santos, A.F.; de Souza, H.J.L.; Gaspar, P.D. Evaluation of the heat and energy performance of a datacenter for a new efficiency index: Energy Usage Effectiveness Design—EUED. Braz. Arch. Biol. Technol. 2019, 62. [Google Scholar] [CrossRef]
- Santos, A.F.; Gaspar, P.D.; de Souza, H.J.L. New datacenter performance index: Perfect Design Datacenter—PDD. Climate 2020, 8, 110. [Google Scholar] [CrossRef]
- Santos, A.F.; Gaspar, P.D.; Souza, H.J.L. New index for Sustainability—TWI (Total Water Impact). Energies 2020, 13, 1590. [Google Scholar] [CrossRef]
- Santos, A.F.; Gaspar, P.D.; de Souza, H.J.L. Ecoenergetic simulation of HVAC systems in Data Centers. Climate 2021, 9, 42. [Google Scholar] [CrossRef]
- AHRI Standard 1361 (SI). 2017 Standard for Performance Rating of Computer and Data Processing Room Air Conditioners; AHRI: Arlington, VA, USA, 2017. [Google Scholar]
- EPE. Balanço Energético Nacional 2019. Relatório Síntese / Ano Base 2018. Ministério de Minas e Energia—MME/Empresa de Pesquisa Energética—EPE. 2019. Available online: https://www.epe.gov.br/sites-pt/publicacoes-dados-abertos/publicacoes/PublicacoesArquivos/publicacao-377/topico-470/Relat%C3%B3rio%20S%C3%ADntese%20BEN%202019%20Ano%20Base%202018.pdf (accessed on 10 February 2021).
- EPE. Anuário Estatístico de Energia Elétrica 2020. Ano Base 2019. Available online: https://www.epe.gov.br/sites-pt/publicacoes-dados-abertos/publicacoes/PublicacoesArquivos/publicacao-160/topico-168/EPEFactSheetAnuario.pdf (accessed on 10 February 2021).
- CNBC. J&J CEO Says People May Need Annual Covid Vaccine Shots for the Next Several Years. 2021. Available online: https://www.cnbc.com/2021/02/09/covid-vaccine-jj-ceo-says-people-may-get-annual-shots-for-the-next-several-years.html (accessed on 9 February 2021).
- ECCAPLAN. Calculadora Para Emissão de Carbono. Available online: https://calculadora.eccaplan.com.br/ (accessed on 10 February 2021).
- Ledford, H. J&J’s One-Shot COVID Vaccine Offers Hope for Faster Protection. Nature 2021. Available online: https://www.nature.com/articles/d41586-021-00119-7 (accessed on 21 March 2021). [CrossRef]


| Vaccine | Storage Temperature °C |
|---|---|
| Pfizer–BioNTech | −70 |
| Moderna | −25 |
| CoronaVac | 2 |
| Oxford–AstraZeneca | 2 |
| Sputnik V | −18 |
| Janssen COVID-19 | 2 |
| Vaccine | Inlet Vaccine Temperature (°C) | Cold Room Temperature (°C) | Cooling Load (Kw) |
|---|---|---|---|
| Pfizer–BioNTech | −60 | −70 | 2.23 |
| Moderna | −15 | −25 | 1.38 |
| CoronaVac | 8 | 2 | 1.02 |
| Oxford–AstraZeneca | 8 | 2 | 1.02 |
| Sputnik V | −12 | −18 | 1.28 |
| Janssen COVID-19 | 8 | 2 | 1.02 |
| Vaccine | Inlet Condenser Temperature (°C) | RFCT (°C) | Cold Room Temperature (°C) | RFET (°C) | EFISEN |
|---|---|---|---|---|---|
| Pfizer–BioNTech | 24 | 34 | −70 | −80 | 0.7 |
| Moderna | 24 | 34 | −25 | −35 | 0.7 |
| CoronaVac | 24 | 34 | 2 | −8 | 0.7 |
| Oxford–AstraZeneca | 24 | 34 | 2 | −8 | 0.7 |
| Sputnik V | 24 | 34 | −18 | −28 | 0.7 |
| Janssen COVID-19 | 24 | 34 | 2 | −8 | 0.7 |
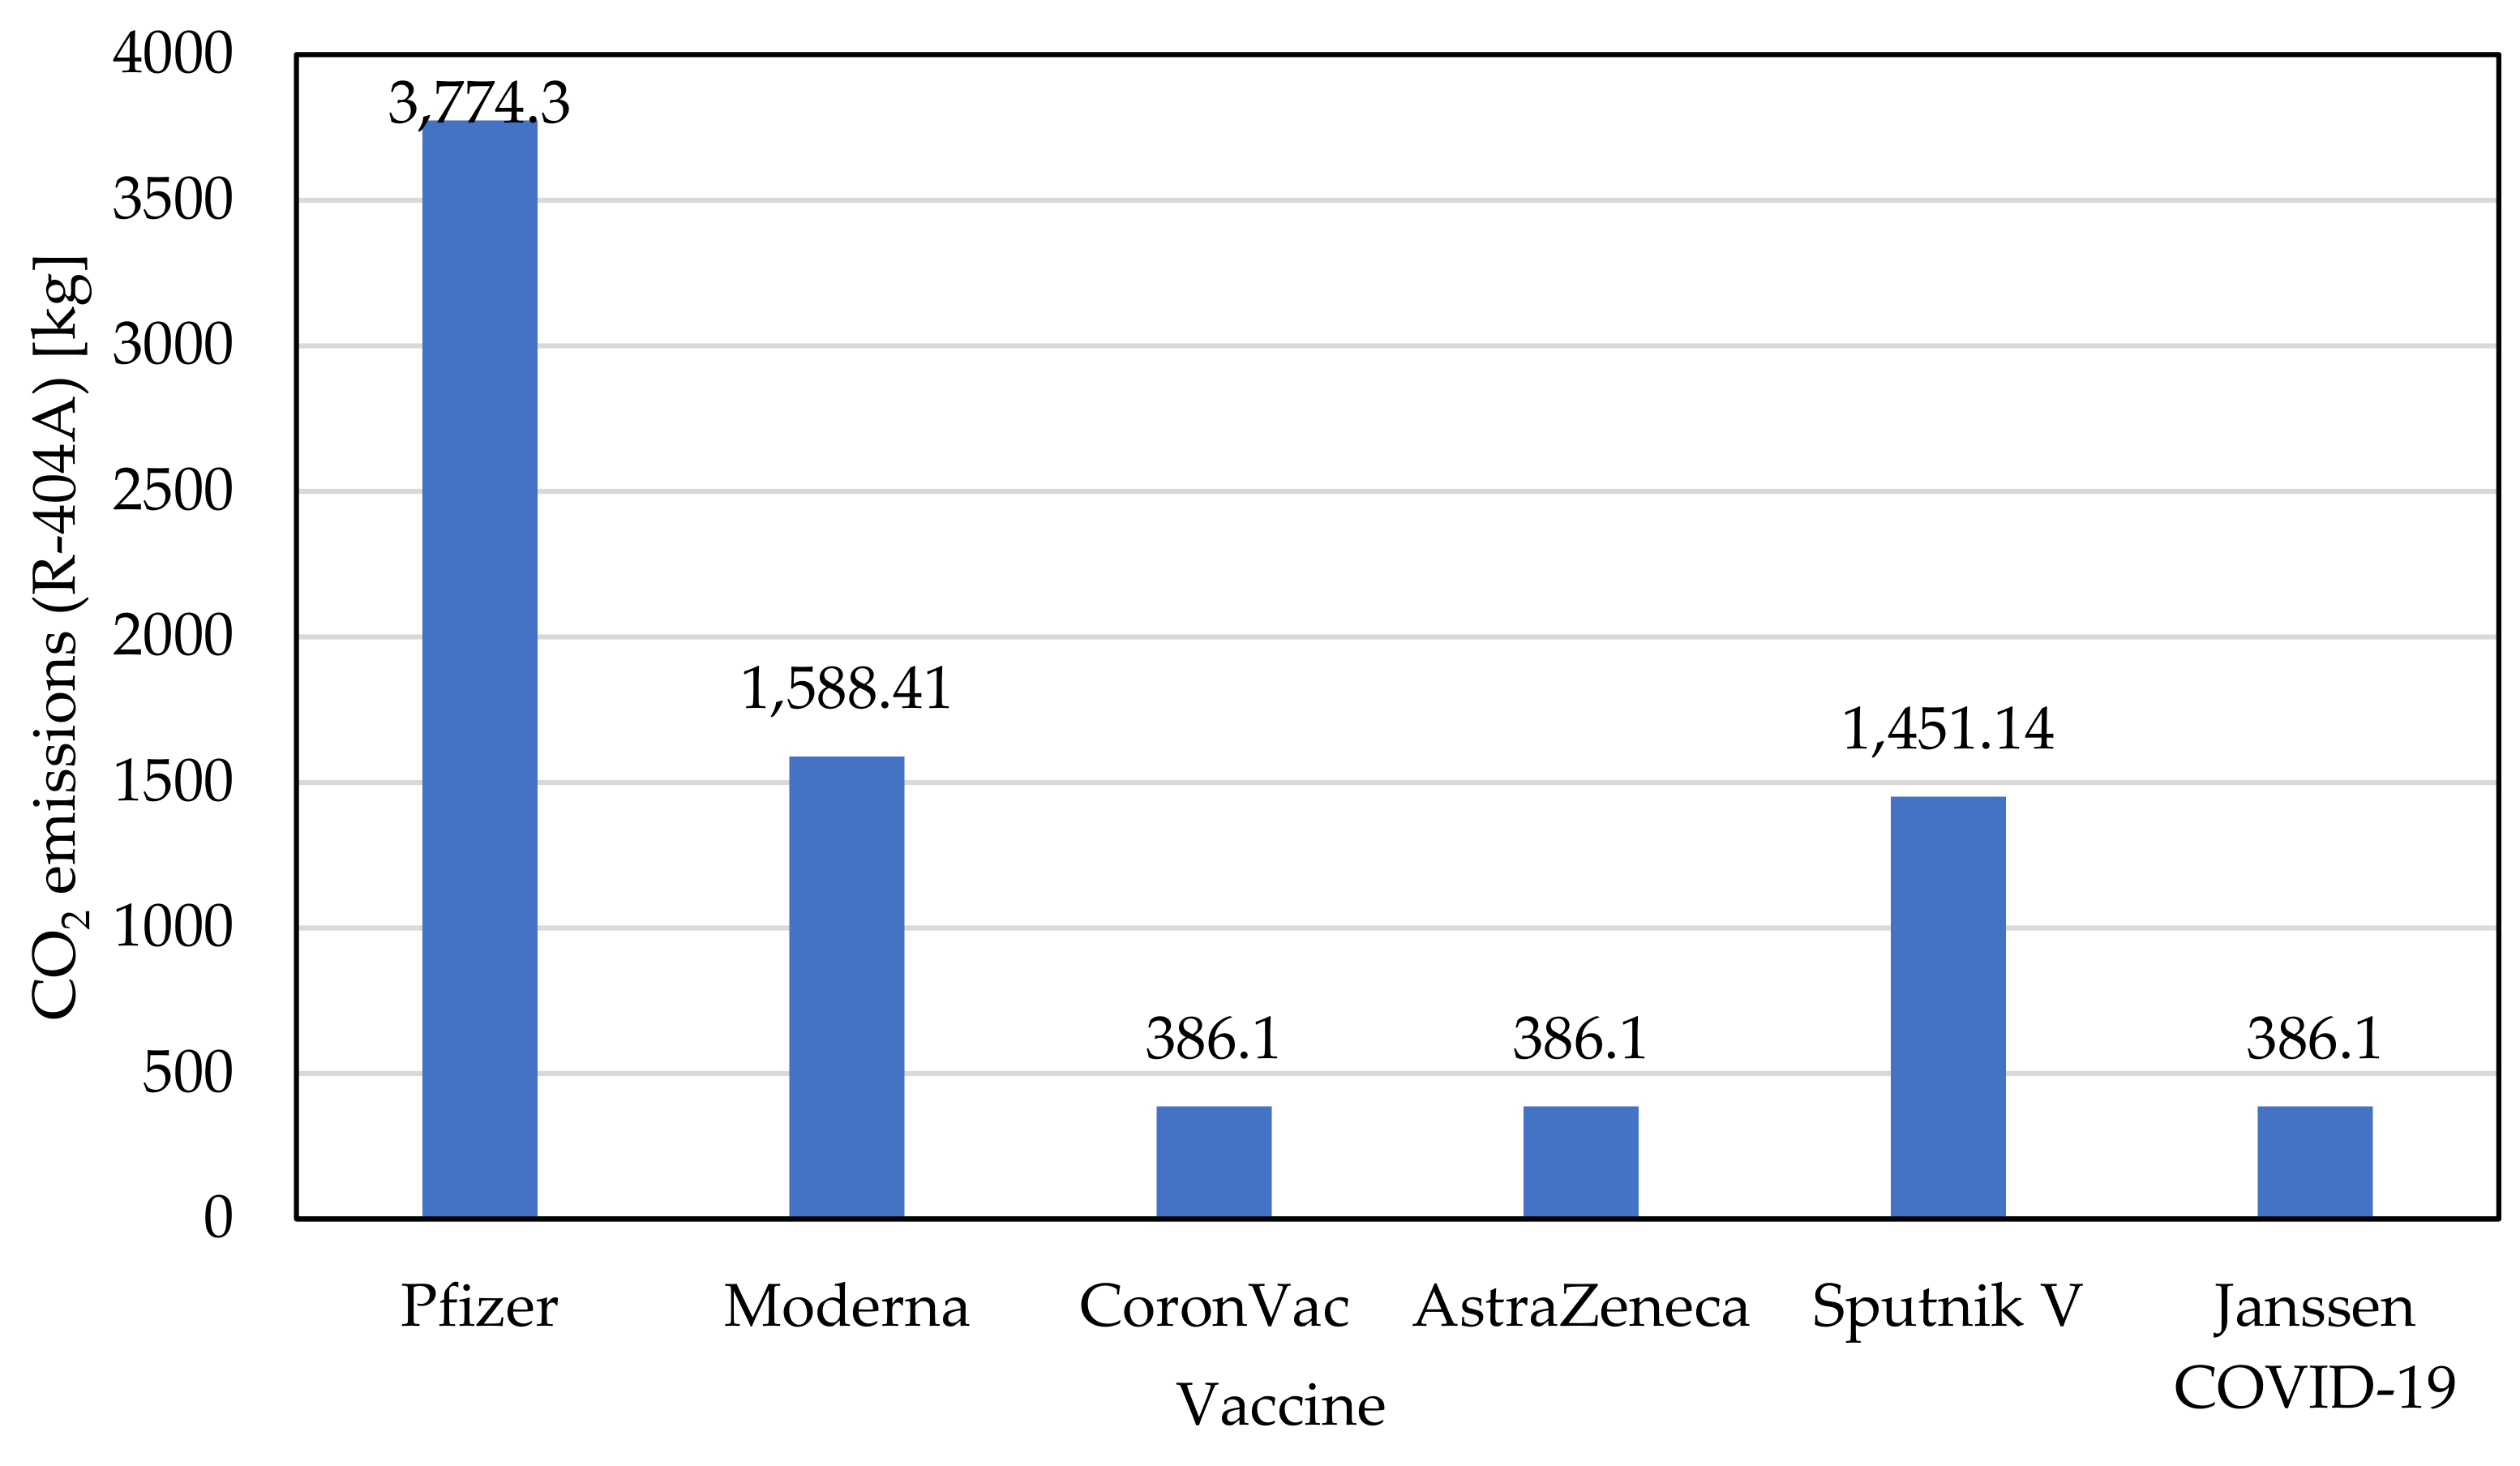
| Vaccine | Refrigerant | GWP | Refrigerant Load (kg) | CO2 Emissions (R 449A) (kg) | CO2 Emissions (R 404A) (kg) |
|---|---|---|---|---|---|
| Pfizer–BioNTech | R-508B & R-449A | 13,396 & 1430 | 0.15 + 0.45 | 2652.90 | 3774.30 |
| Moderna | R-449A | 1397 | 0.405 | 565.78 | 1588.41 |
| CoronaVac | R-134A | 1430 | 0.27 | 386.10 | 386.10 |
| Oxford–AstraZeneca | R-134A | 1430 | 0.27 | 386.10 | 386.10 |
| Sputnik V | R-449A | 1397 | 0.37 | 516.89 | 1451.14 |
| Janssen COVID-19 | R-134A | 1430 | 0.27 | 386.10 | 386.10 |
| Vaccine | Refrigerant | TEWI (Direct) | EUED (kWh/yr) | TEWI (Ind. USA) | TEWI (Ind. USA) | TEWI (Total Brazil) | TEWI (Total USA) |
|---|---|---|---|---|---|---|---|
| Pfizer–BioNTech | R-508B & R-449A | 4111.99 | 18,904.65 | 16,636.09 | 78,832.39 | 20,748.09 | 82,944.39 |
| Moderna | R-449A | 876.97 | 4968.00 | 4371.84 | 20,716.56 | 5248.81 | 21,593.53 |
| CoronaVac | R-134A | 598.45 | 2023.06 | 1780.29 | 8436.16 | 2378.75 | 9034.62 |
| Oxford–AstraZeneca | R-134A | 598.45 | 2023.06 | 1780.29 | 8436.16 | 2378.75 | 9034.62 |
| Sputnik V | R-449A | 801.18 | 4004.57 | 3524.02 | 16,699.06 | 4325.20 | 17,500.24 |
| Janssen COVID-19 | R-134A | 598.45 | 2023.06 | 1780.29 | 8436.16 | 2378.75 | 9034.62 |
| Vaccine | Vaccine EUED (MWh/yr) |
|---|---|
| Pfizer–BioNTech | 1,323,325.5 |
| Moderna | 347,760.0 |
| CoronaVac | 141,614.2 |
| Oxford–AstraZeneca | 141,614.2 |
| Sputnik V | 280,319.9 |
| Janssen COVID-19 | 141,614.2 |
| Vaccine | TEWI Total Brazil (Ton CO2 10 yr) | TEWI Total USA (Ton CO2 10 yr) |
|---|---|---|
| Pfizer–BioNTech | 1,452,366.09 | 5,806,106.98 |
| Moderna | 367,416.47 | 1,511,546.87 |
| CoronaVac | 166,512.35 | 632,423.06 |
| Oxford–AstraZeneca | 166,512.35 | 632,423.06 |
| Sputnik V | 302,764.08 | 1,225,016.55 |
| Janssen COVID-19 | 166,512.35 | 632,423.06 |
| Vaccine | Number of Cars in Brazil | Number of Cars in the USA |
|---|---|---|
| Pfizer–BioNTech | 39,682.13 | 158,636.80 |
| Moderna | 10,038.70 | 41,299.09 |
| CoronaVac | 4549.52 | 17,279.32 |
| Oxford–AstraZeneca | 4549.52 | 17,279.32 |
| Sputnik V | 8272.24 | 33,470.40 |
| Janssen COVID-19 | 4549.52 | 17,279.32 |
Publisher’s Note: MDPI stays neutral with regard to jurisdictional claims in published maps and institutional affiliations. |
© 2021 by the authors. Licensee MDPI, Basel, Switzerland. This article is an open access article distributed under the terms and conditions of the Creative Commons Attribution (CC BY) license (http://creativecommons.org/licenses/by/4.0/).
Share and Cite
Santos, A.F.; Gaspar, P.D.; de Souza, H.J.L. Refrigeration of COVID-19 Vaccines: Ideal Storage Characteristics, Energy Efficiency and Environmental Impacts of Various Vaccine Options. Energies 2021, 14, 1849. https://doi.org/10.3390/en14071849
Santos AF, Gaspar PD, de Souza HJL. Refrigeration of COVID-19 Vaccines: Ideal Storage Characteristics, Energy Efficiency and Environmental Impacts of Various Vaccine Options. Energies. 2021; 14(7):1849. https://doi.org/10.3390/en14071849
Chicago/Turabian StyleSantos, Alexandre F., Pedro D. Gaspar, and Heraldo J. L. de Souza. 2021. "Refrigeration of COVID-19 Vaccines: Ideal Storage Characteristics, Energy Efficiency and Environmental Impacts of Various Vaccine Options" Energies 14, no. 7: 1849. https://doi.org/10.3390/en14071849
APA StyleSantos, A. F., Gaspar, P. D., & de Souza, H. J. L. (2021). Refrigeration of COVID-19 Vaccines: Ideal Storage Characteristics, Energy Efficiency and Environmental Impacts of Various Vaccine Options. Energies, 14(7), 1849. https://doi.org/10.3390/en14071849