Article

Carbon Emission Estimation of Assembled Composite Concrete Beams during Construction

School of Civil Engineering, Shaoxing University, Shaoxing 312000, China
*
Author to whom correspondence should be addressed.
Energies 2021, 14(7), 1810; https://doi.org/10.3390/en14071810
Submission received: 21 February 2021 / Revised: 20 March 2021 / Accepted: 22 March 2021 / Published: 24 March 2021

Abstract

:
At present, the issue of carbon emissions from buildings has become a hot topic, and carbon emission reduction is also becoming a political and economic contest for countries. As a result, the government and researchers have gradually begun to attach great importance to the industrialization of low-carbon and energy-saving buildings. The rise of prefabricated buildings has promoted a major transformation of the construction methods in the construction industry, which is conducive to reducing the consumption of resources and energy, and of great significance in promoting the low-carbon emission reduction of industrial buildings. This article mainly studies the calculation model for carbon emissions of the three-stage life cycle of component production, logistics transportation, and on-site installation in the whole construction process of composite beams for prefabricated buildings. The construction of CG-2 composite beams in Fujian province, China, was taken as the example. Based on the life cycle assessment method, carbon emissions from the actual construction process of composite beams were evaluated, and that generated by the composite beam components during the transportation stage by using diesel, gasoline, and electric energy consumption methods were compared in detail. The results show that (1) the carbon emissions generated by composite beams during the production stage were relatively high, accounting for 80.8% of the total carbon emissions, while during the transport stage and installation stage, they only accounted for 7.6% and 11.6%, respectively; and (2) during the transportation stage with three different energy-consuming trucks, the carbon emissions from diesel fuel trucks were higher, reaching 186.05 kg, followed by gasoline trucks, which generated about 115.68 kg; electric trucks produced the lowest, only 12.24 kg.

1. Introduction

In recent years, with the rapid development of industrial buildings and the increasing demand for living quality, the total energy consumption and energy intensity of buildings have been increasing [1,2,3,4,5]. As a global boom, the construction industry consumes huge resources [6]. It, by direct or indirect actions, consumes more than 40% of the global energy produced and is responsible for 30% of CO2 emissions, which is one of the important sources of greenhouse gas emissions [7,8]. Therefore, industrial buildings must strategically reduce energy consumption and carbon emissions to mitigate the effects of global climate change. Prefabricated buildings have three characteristics of standardized design, factory production and assembly construction in the construction process [9,10,11]. The standardized production of prefabricated components in the factory is the most popular construction method at present, which can greatly reduce energy consumption and carbon emissions in the whole construction process [12], resulting in a good mitigating effect on the deterioration of the global ecological environment [13]. Therefore, relevant researches on the carbon emissions of prefabricated buildings have been conducted. Luna-Tintos et al. presented a methodological proposal for the quantitative evaluation of the embodied primary energy and CO2 production at each stage of the life cycle of prefabricated structural systems [14]. L. Jaillon et al. [15] analyzed the waste consumption generated by construction projects. Compared with traditional construction methods, prefabricated structures saved about 70% of the wooden formwork and reduced waste consumption by 52% on average. Wu et al. [16] analyzed the energy consumption and carbon emissions generated by the production, construction, operation and demolition of building materials for the entire office building. Among them, the operation stage contributed the most to energy consumption and carbon emissions, accounting for 86% and 81.3% of the total energy consumption and total carbon emissions, respectively. Liu et al. [17] studied the carbon emissions during the production stage of prefabricated concrete interior wallboards. In the production process of interior wallboards, the consumption of the component raw materials contributed the most to carbon emissions, accounting for about 96.2% of the total carbon emissions. Electric energy consumption and worker consumption contributed less, accounting for only 3.6% and 0.2% of the total carbon emissions, respectively. Seo et al. [18] studied the carbon emissions in the construction process of aluminum windows in Australia. Among them, the consumption of aluminum raw materials contributed a lot to carbon emissions, reaching about 88.2% of the total carbon emissions, while carbon emissions during the production and transportation stages were relatively small, accounting for only 11% and 0.5% of the total carbon emissions, respectively. Kong et al. [19] analyzed the carbon emissions in the construction process of composite slab components in Shaoxing City, Zhejiang province, China. During the production stage of the components, the carbon emissions generated by the composite slabs were relatively high, reaching about 97.5% of the total carbon emissions, while that during the transportation and installation stages only accounted for 0.6% and 1.9% of the total carbon emissions, respectively. According to a sustainable social housing proposal, Lopez-Escamilla et al. presented an appropriate and tested solution that can satisfy the comfortability and health of residents who live in social housing while maintaining low energy consumption [20].
To sum up, although the proportion of carbon emissions in the life cycle of prefabricated components of prefabricated buildings have been studied [21,22,23,24], there are still relatively few studies on the carbon emission reduction at all stages of the life cycle, especially during the transportation stage of prefabricated components, which requires further discussion. In this paper, based on the construction project of composite beams in Fujian province, China, under the actual diesel truck transportation, the calculation formula is used to analyze the carbon emissions generated during the production, transportation, and installation stages of composite beams in the whole construction process. In order to optimize the carbon emissions generated during the transportation stage of the components, it is assumed that carbon emissions generated by the two energy consumption methods of gasoline and electric energy are compared with actual diesel, so as to identify the transportation mode with the lowest carbon emissions and promote the industrial modernization process of low-carbon optimization of prefabricated buildings.

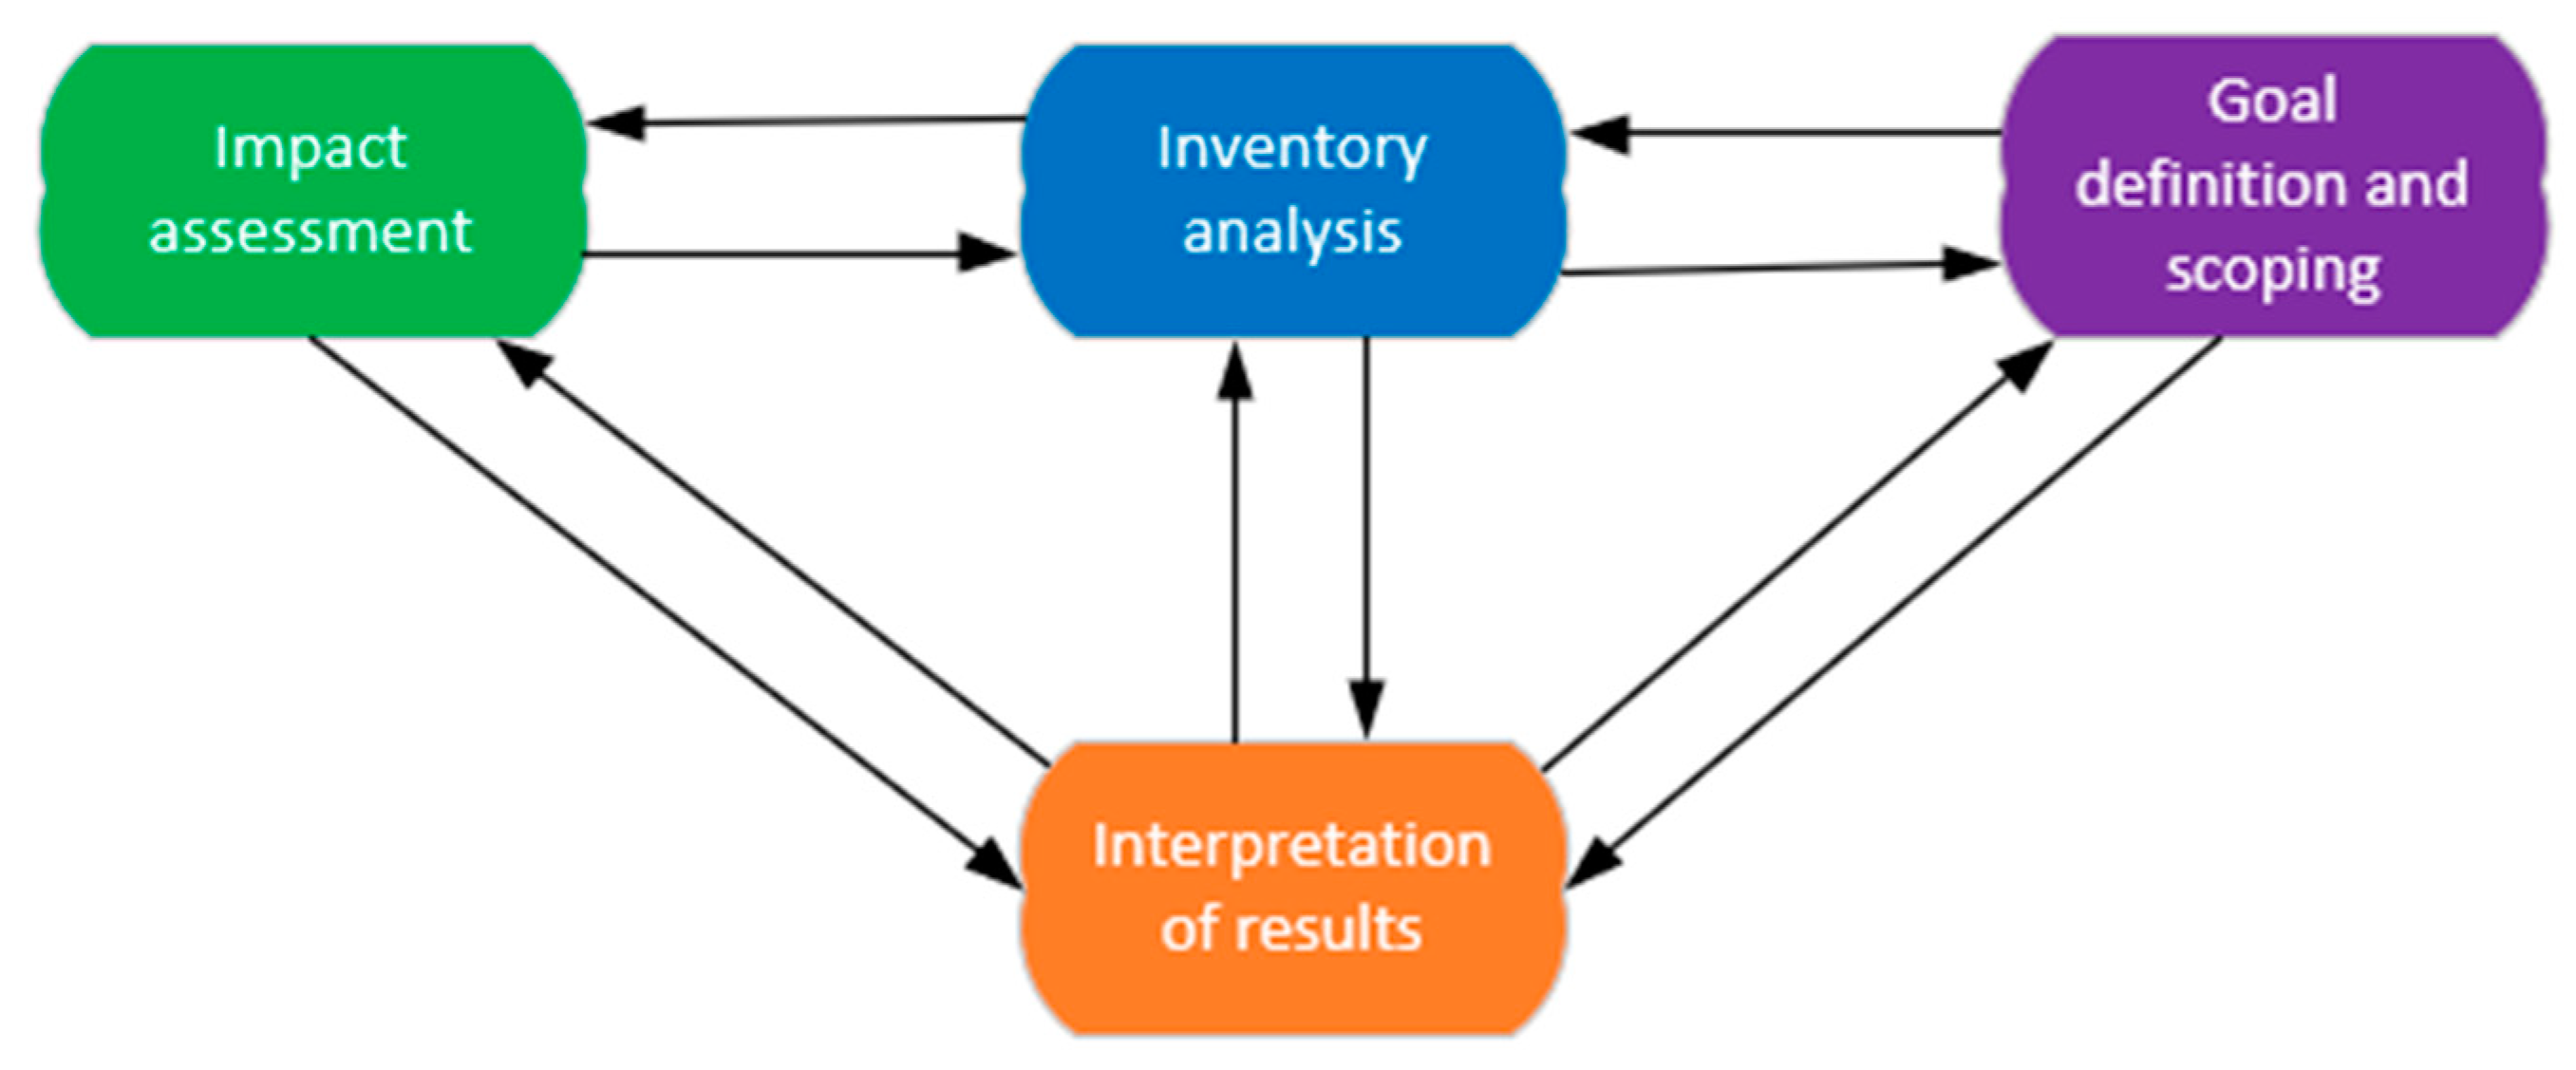
2. Life Cycle Assessment Theory

Life cycle assessment [25,26,27,28] is a process related to the environmental load of a product, process or activity from raw material collection, production, transportation, use and maintenance to the final disposal of the entire cycle. The contents of the evaluation include raw material extraction, product manufacturing, transportation, use and the recycling of materials and energy throughout the whole process. It mainly includes four major steps of goal definition and scoping, inventory analysis, impact assessment and the interpretation of results. It is a repetitive and interrelated process. Figure 1 shows the theoretical framework of life cycle assessment [28].
Goal definition and scoping [29] refers to the compilation of the environmental impact caused by the input to output of various energy substances in the life cycle of a product, process or activity, characterizing the environmental factors and degree of the system and process.
Inventory analysis [30] is a quantitative analysis of the consumption of resources and energy, and emissions of environmental gas pollution during the entire life cycle of products, processes or activities. The essence is data collection, collation and summary.
Impact assessment [31] is based on the first two steps to inventory and calculate the consumption of resources and energy in each stage of the life cycle, as well as the emissions of environmental gas pollution, and to characterize the energy consumption in each stage and the degree of environmental pollution impact. It is also the most critical step in the life cycle assessment process.
The interpretation of results [32] is to comprehensively consider the impact assessment and identify the weaker links in the product system, so as to seek effective improvement methods. It mainly includes three elements of identification, evaluation and reporting. The weaker links are identified first and then evaluated, so as to put forward suggestions for the improvement and finally form a document report.
Prefabricated buildings have a long life cycle. The whole process from raw material extraction through production, use and disposal has an impact on the environment. The life cycle assessment method is used to evaluate carbon emissions at each stage of the building life cycle, which is conducive to grasping the environmental impact, so as to reasonably optimize carbon emissions at each stage. In China, as prefabricated buildings are just emerging, most of the buildings are still in the construction stage, which cannot fully reflect the impact of the entire building life cycle on the environmental load.

3. Sources of Carbon Emissions in the Whole Construction Process of Prefabricated Components

At present, carbon emission calculation methods [30] mainly include an actual measurement method, material balance algorithm and carbon emission coefficient method. The actual measurement method is mainly to use monitoring tools to monitor the flow rate and concentration of the target gas, and use these monitored data to calculate the total emission of the target gas. The material balance algorithm is a quantitative analysis of the materials used during the entire life cycle of a product. According to the law of conservation of quality, the quality of input is equal to the quality of output, which is a more scientific and effective calculation method. The carbon emission coefficient method [33,34,35,36] refers to the amount of carbon emissions produced per unit of energy during the combustion or use of each energy source, and it is also a commonly used method for calculating carbon emissions. Compared with the previous two carbon emission calculation methods, the workload of calculating carbon emissions with the carbon emission coefficient method is greatly reduced, and the calculation process is relatively simple. Therefore, the carbon emission calculation method in this paper mainly adopts the carbon emission coefficient method, and the carbon emission coefficients are all from the basic database of China’s LCA [37].

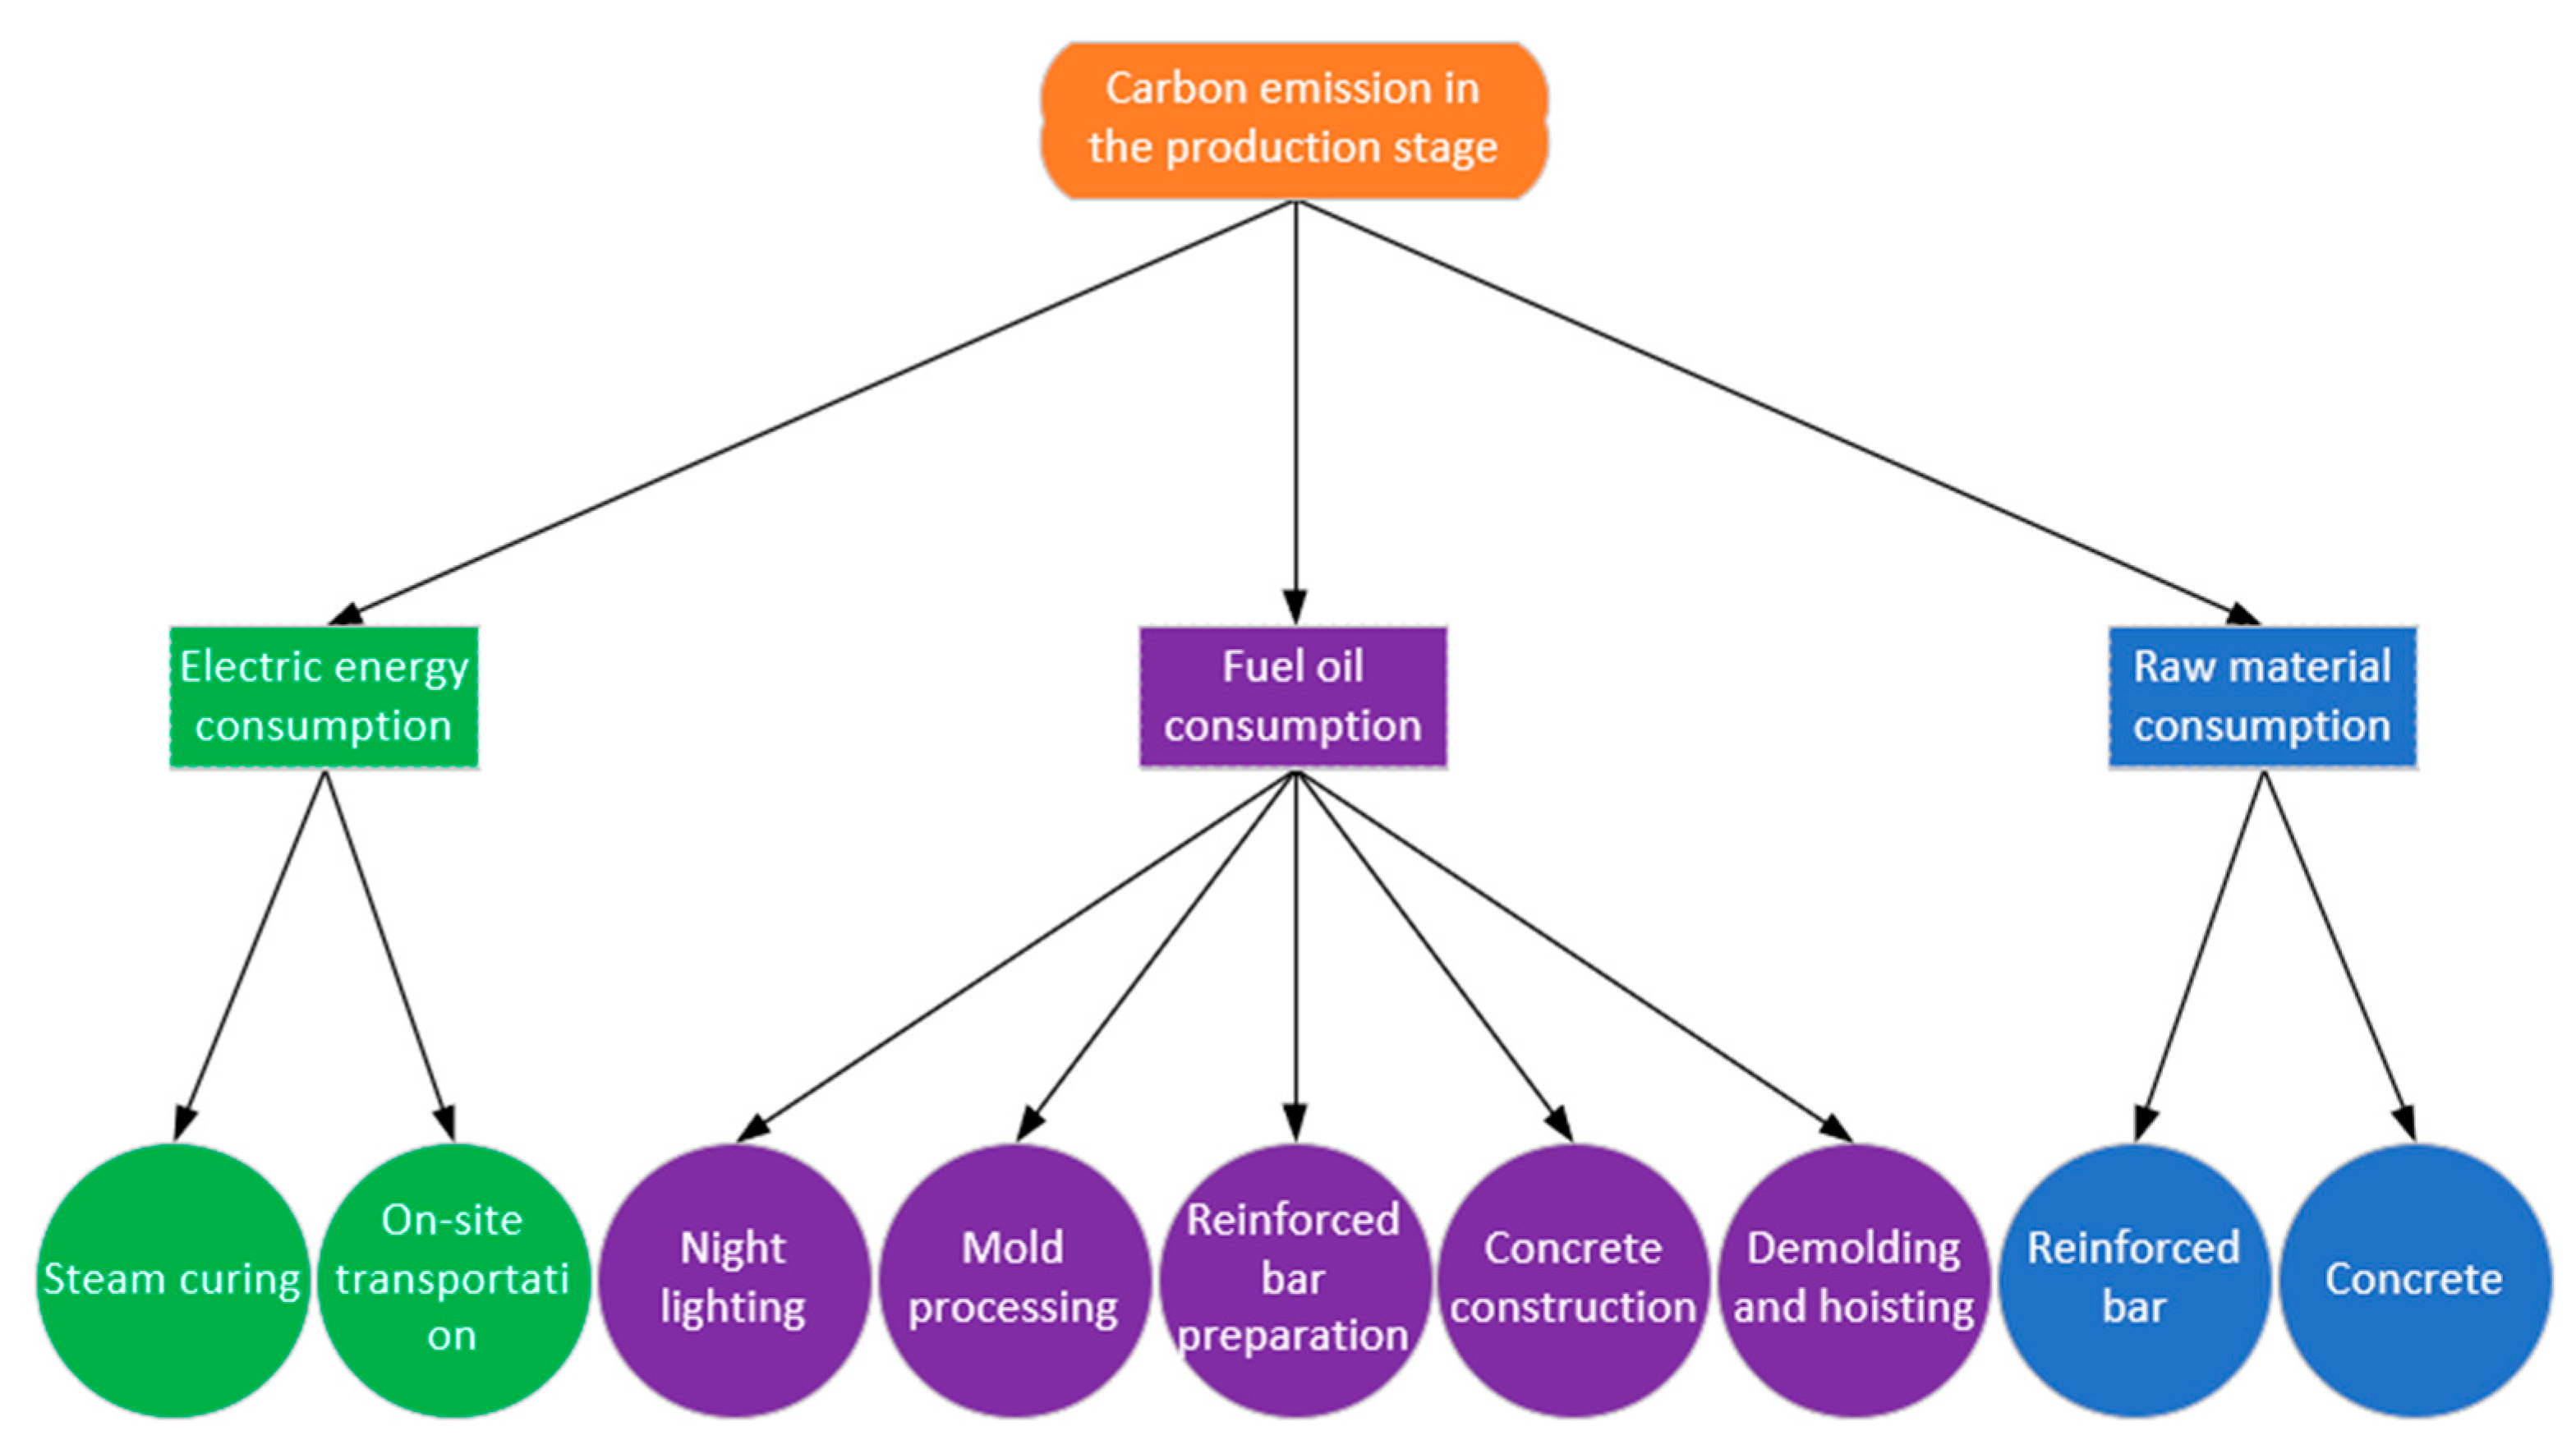
3.1. Production Stage

The production stage of prefabricated components of prefabricated buildings is completed in the factory in advance, and carbon emissions mainly come from the consumption of raw materials, fuel oil and electric energy. Among them, reinforced bars and concrete are the main raw materials. The consumption of electric energy can be divided into five parts: mold processing, reinforced bar preparation, concrete construction, demolding and hoisting, and night lighting. Among them, concrete construction mainly includes concrete transportation, mixing and vibrating. Mold processing mainly includes mold making and cleaning. Reinforced bar preparation mainly includes straightening, cutting and bending. The consumption of fuel oil can be divided into two parts: on-site transportation and steam curing. Steam curing is mainly used to accelerate the hardening of concrete, so as to reach the strength required for concrete demolding and hoisting in advance. On-site transportation refers to a process in which the components are transported to a specified location for stacking by a transportation truck after demolding. Figure 2 shows the source of carbon emissions produced by prefabricated components during the production stage.

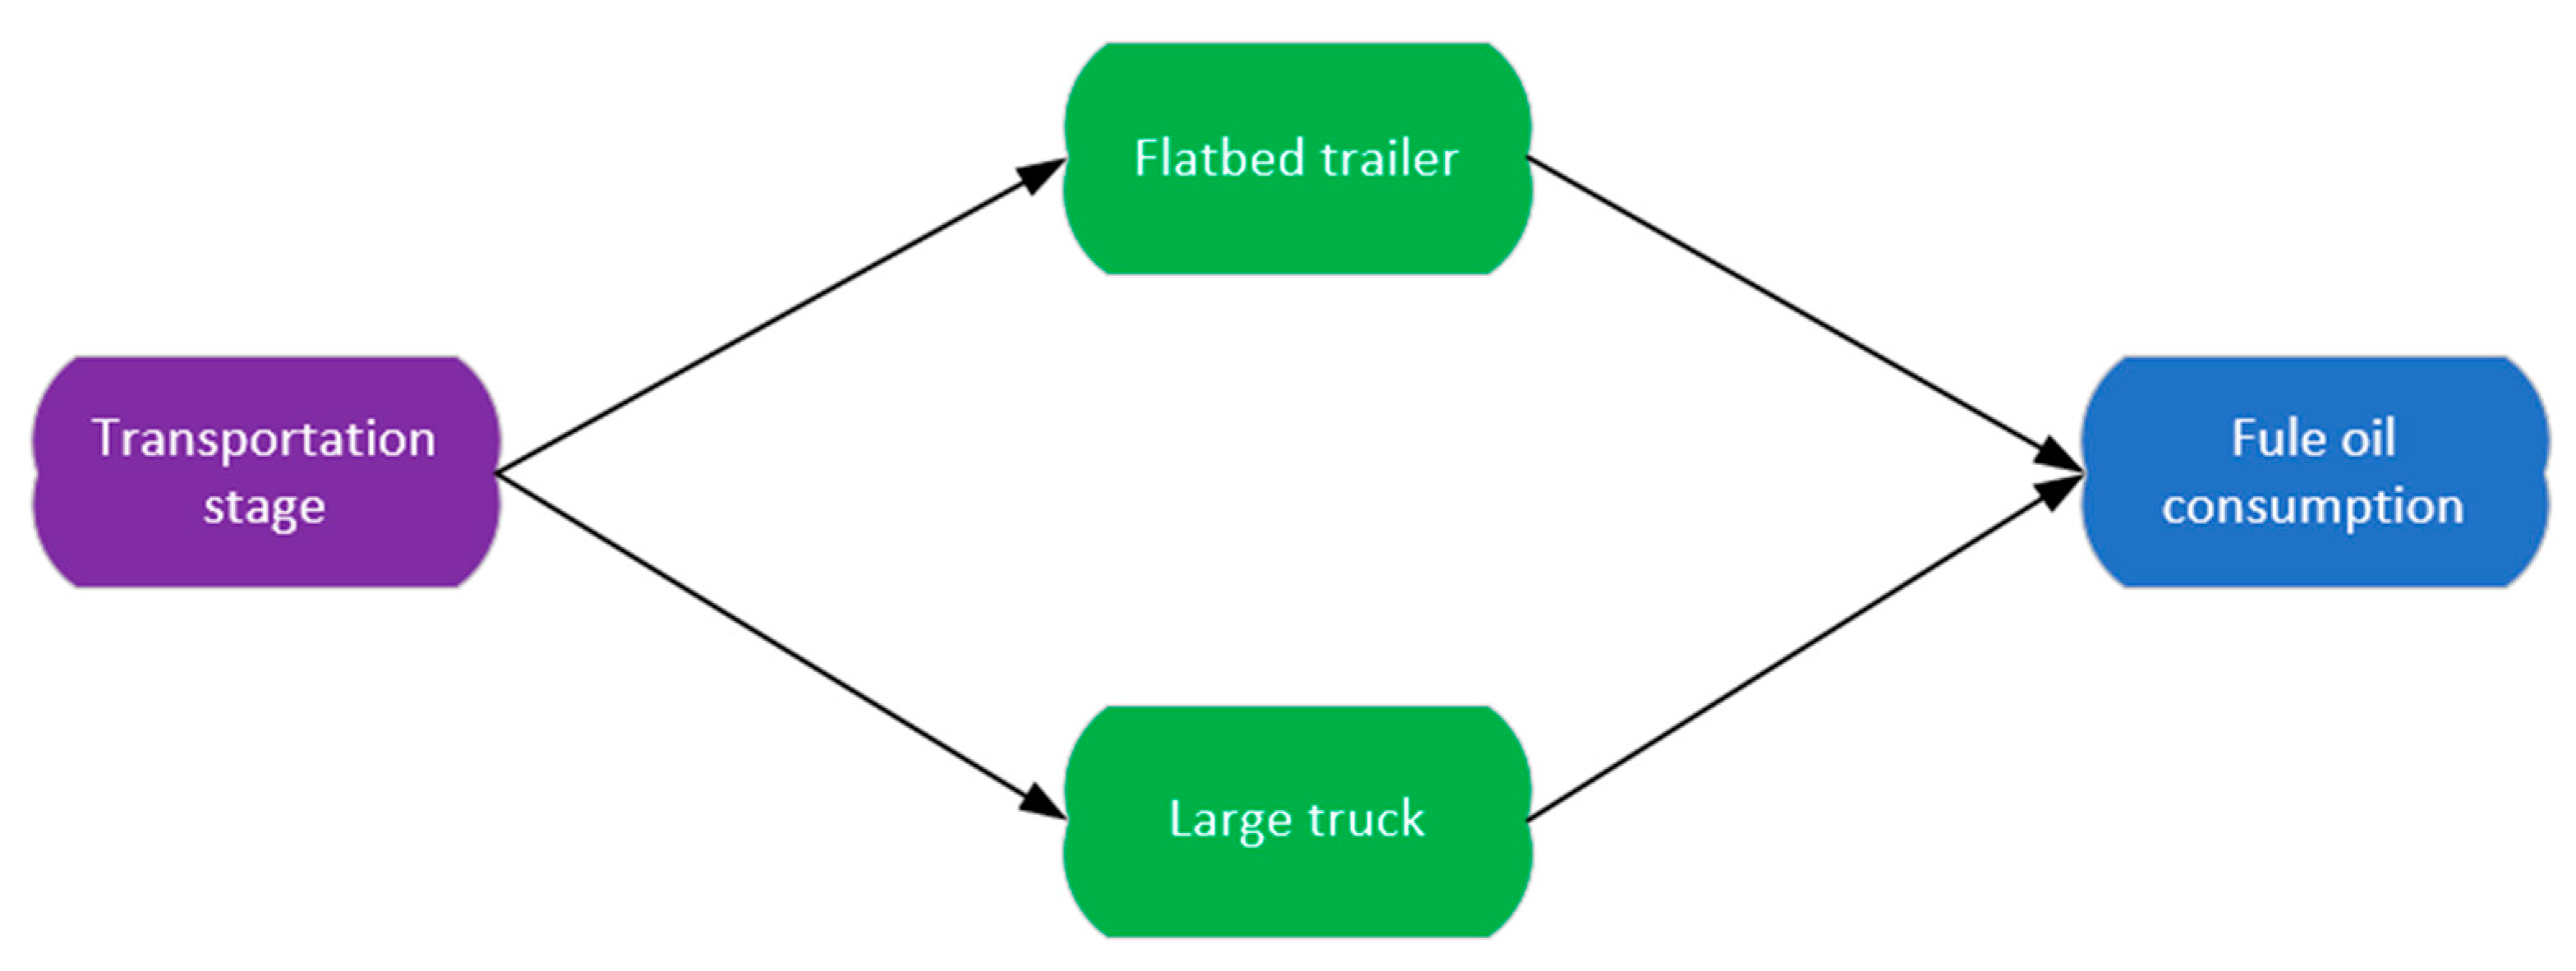
3.2. Transportation Stage

At present, transportation vehicles of prefabricated components mainly include large trucks and flatbed trailers, and the energy consumption mode of transportation is mostly diesel energy. The types of prefabricated components include beams, slabs, walls, columns and stairs. Carbon emissions mainly come from the exhaust emissions from the transportation vehicles, which are related to the distance traveled during transportation and the weight of the components carried. Figure 3 shows the sources of carbon emissions generated by prefabricated components during the transportation stage, and Table 1 shows the carbon emission coefficient of the main energy trucks.

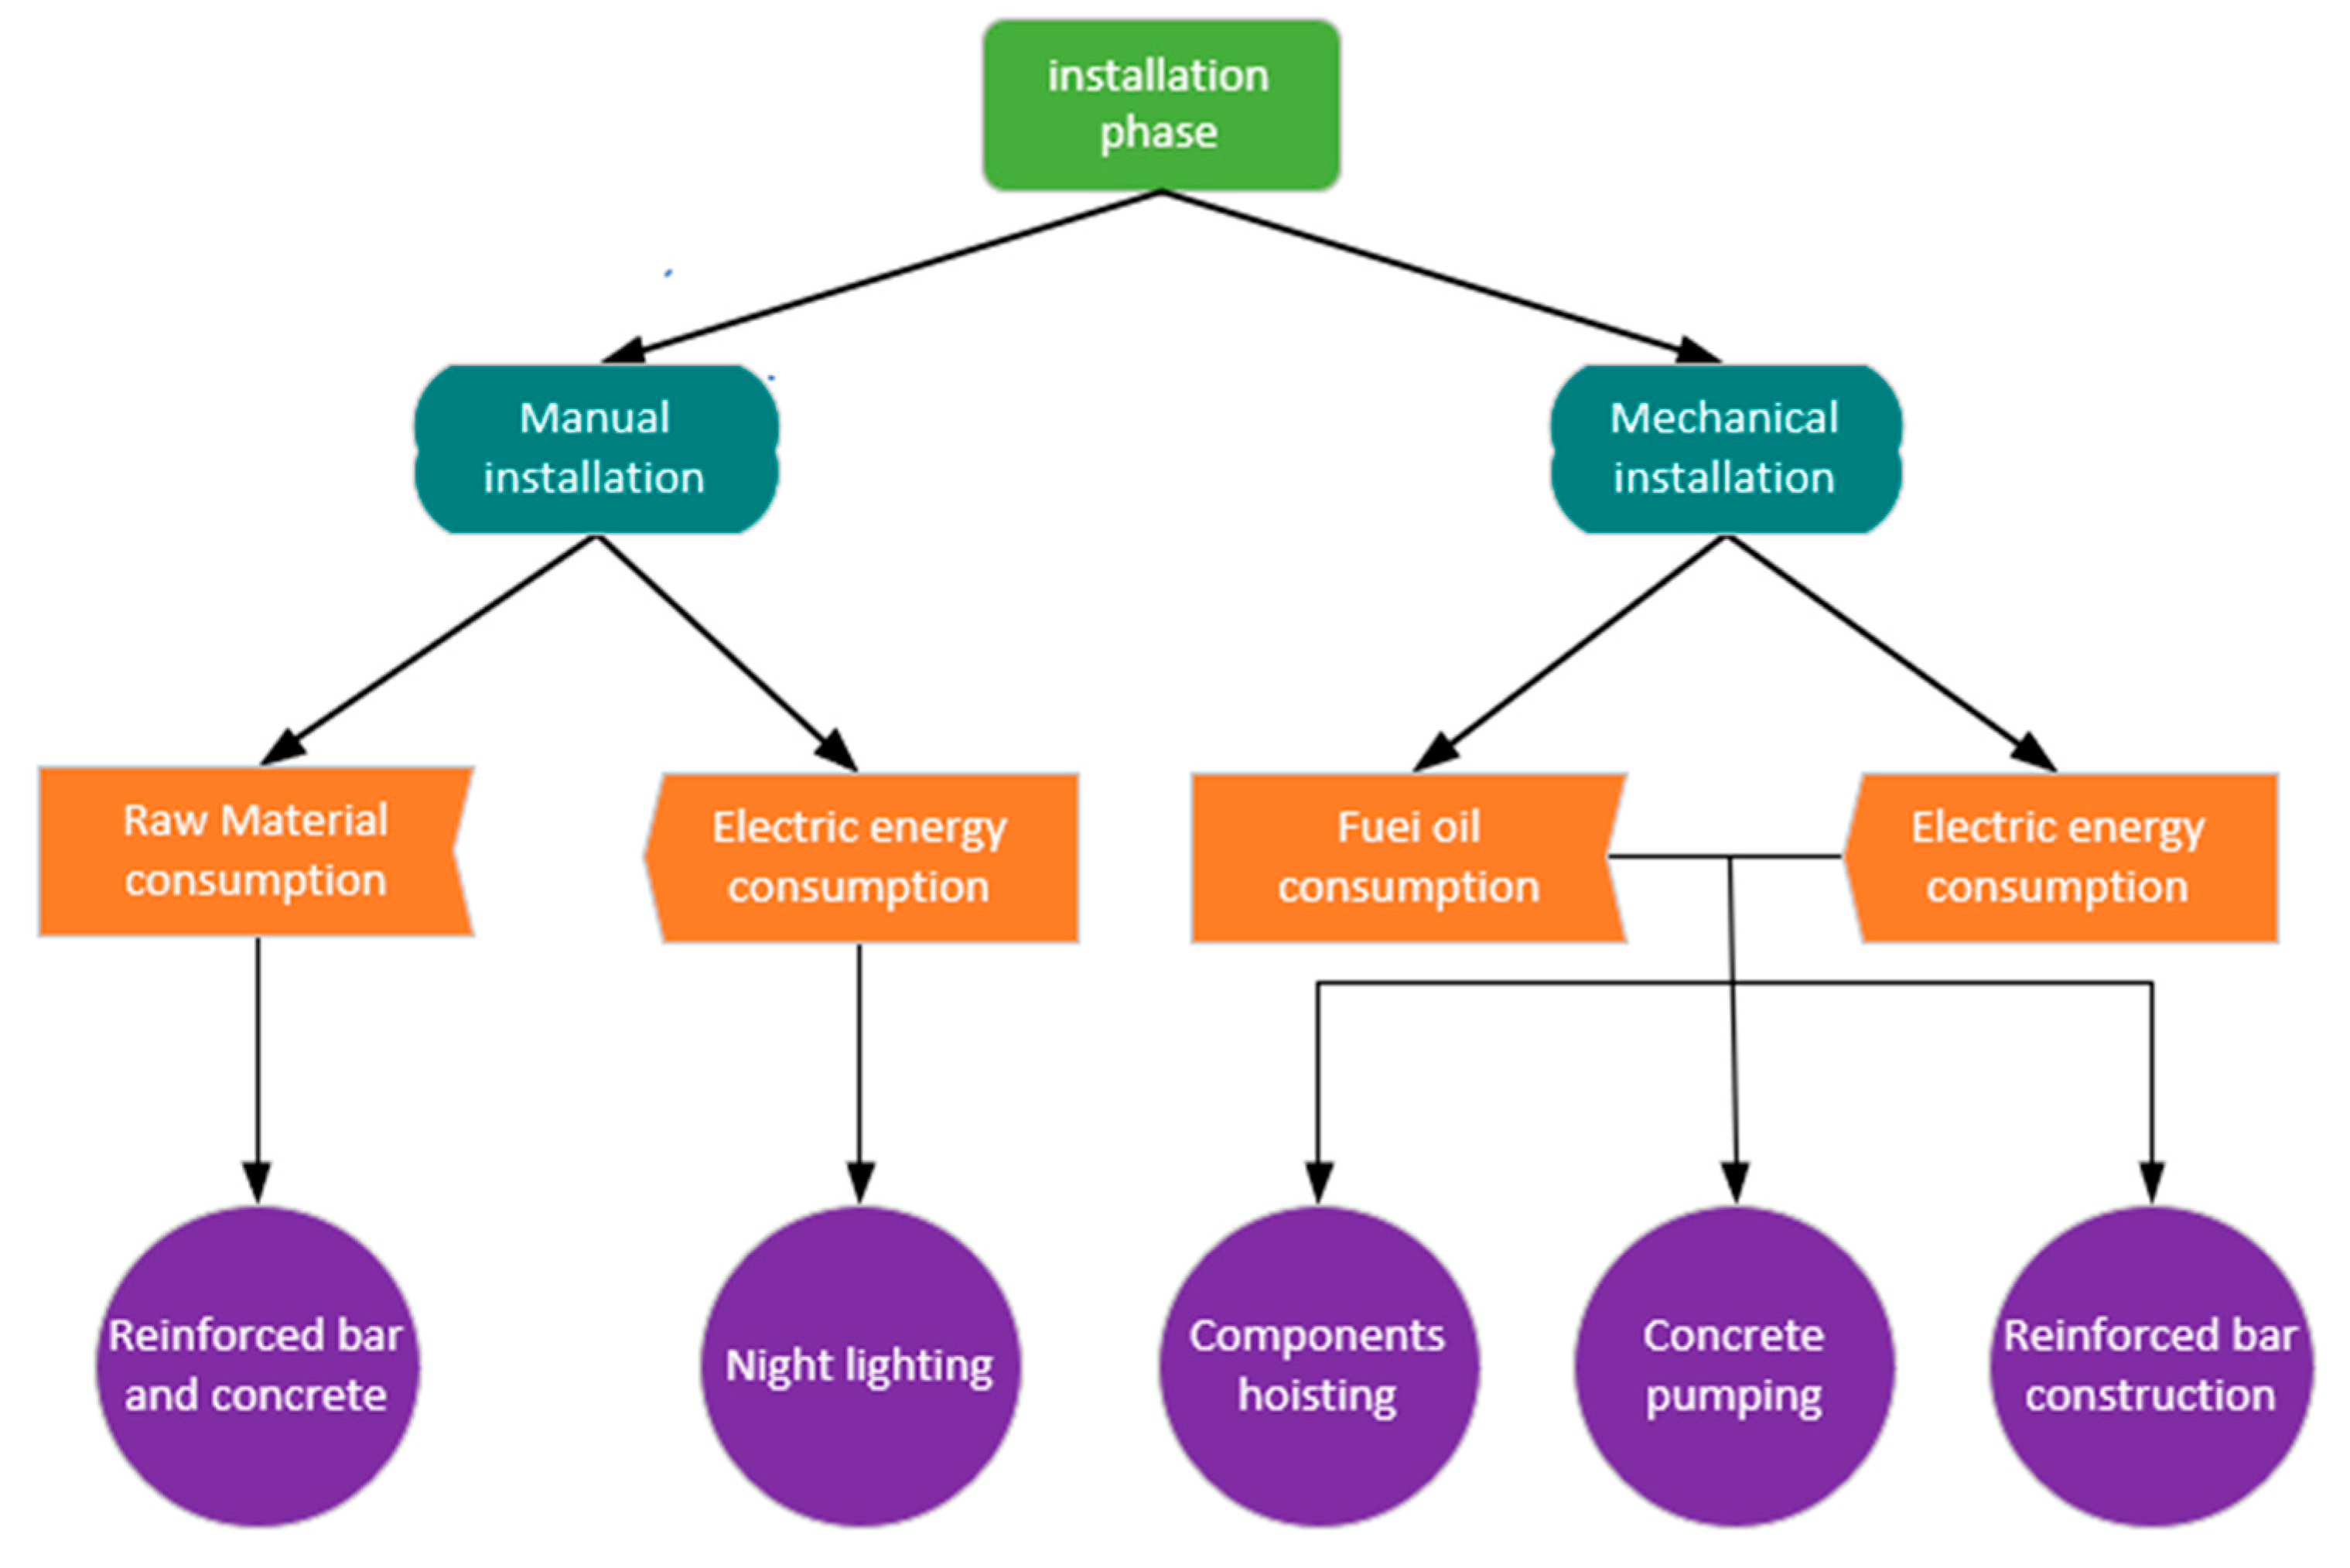
3.3. Installation Stage

The installation quality of prefabricated components has a great impact on the life cycle of the building during the use stage. The installation methods include manual installation and mechanical installation. Manual installation is used for concrete pouring, and carbon emissions mainly come from the consumption of raw materials and night construction lighting. Mechanical installation is used for the hoisting of prefabricated components, reinforced bar preparation and concrete pumping, and carbon emissions mainly come from the consumption of electric energy and fuel oil. Figure 4 shows the sources of carbon emissions generated by prefabricated components during the installation stage.

4. Calculation Model of Carbon Emissions

The total carbon emissions in the construction process of prefabricated components are the sum of that during the production, transportation and installation stages. The calculation model is shown in Equation (1):
C = C P + C T + C S
where, C represents the total carbon emissions generated in the construction process of prefabricated components; C P, C T and C S represent carbon emissions generated during the production, transportation and installation stages, respectively.

4.1. Production Stage

Carbon emissions generated during the production stage of prefabricated components mainly come from the following three aspects: raw materials, fuel oil and electric energy consumed during production. The calculation model is shown in Equation (2):
C P = i = 1 n ( C P m × F m + C P f × F f + C P e × F e )
where C P represents the total carbon emissions generated during the production stage of the prefabricated component; n indicates the type of prefabricated component; and CPm, CPf and CPe represent the consumption of raw materials, fuel oil, and electric energy during the production stage, respectively. Fm, Ff and Fe represent the carbon emission coefficients of raw materials, fuel oil, and electric energy consumed during the production stage, respectively.

4.2. Transport Stage

Carbon emissions generated during the transportation stage of prefabricated components are mainly from the exhaust emissions of the transportation vehicles. The calculation model is shown in Equation (3):
C T = i = 1 n { T s × D × ( W 1 + T b W 2 ) }
where C T represents the total carbon emissions generated during the transportation stage of prefabricated components, n represents the number of vehicles required to transport the prefabricated components, T s represents the carbon emission coefficient of the truck when it transports 1 t/km, and D represents the distance between the production plant and the construction site. W 1 and W 2 represent the weight carried by the truck in actual transportation and fully loaded transportation, T b represents the environmental load coefficient when the transportation truck returns with no load, and the environmental load of the truck returns with no load is T b times that when it is fully loaded.

4.3. Installation Stage
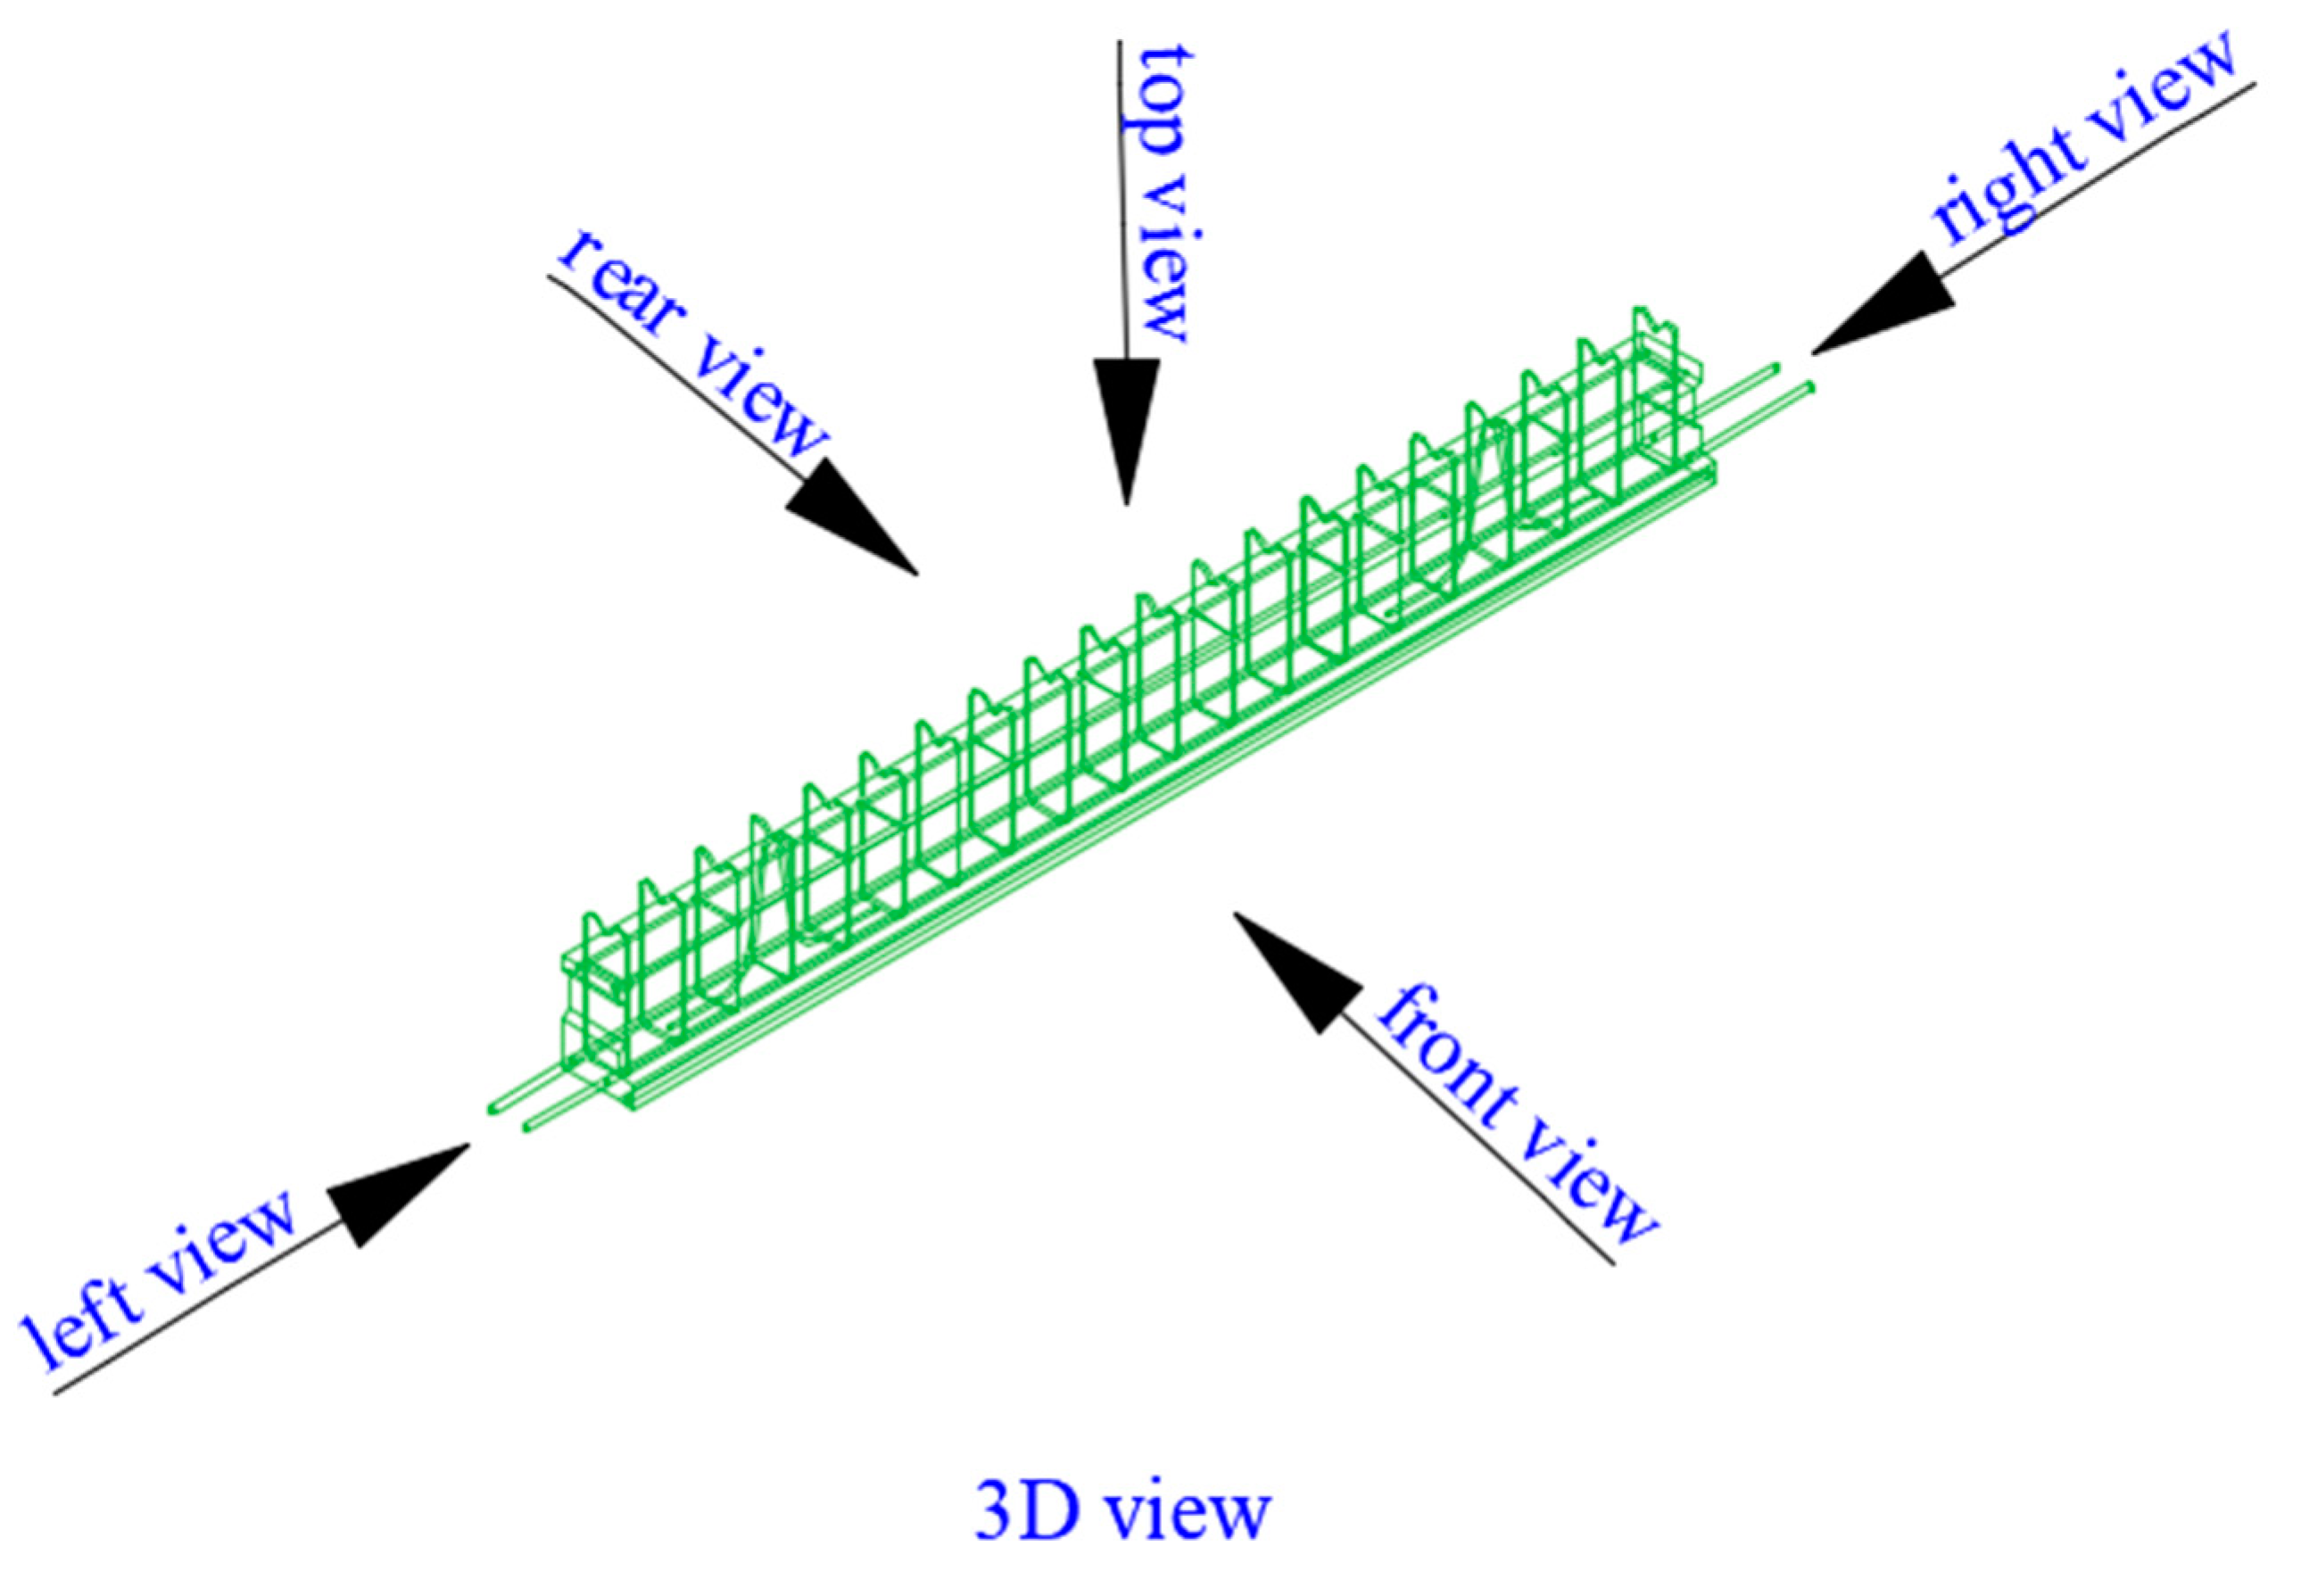
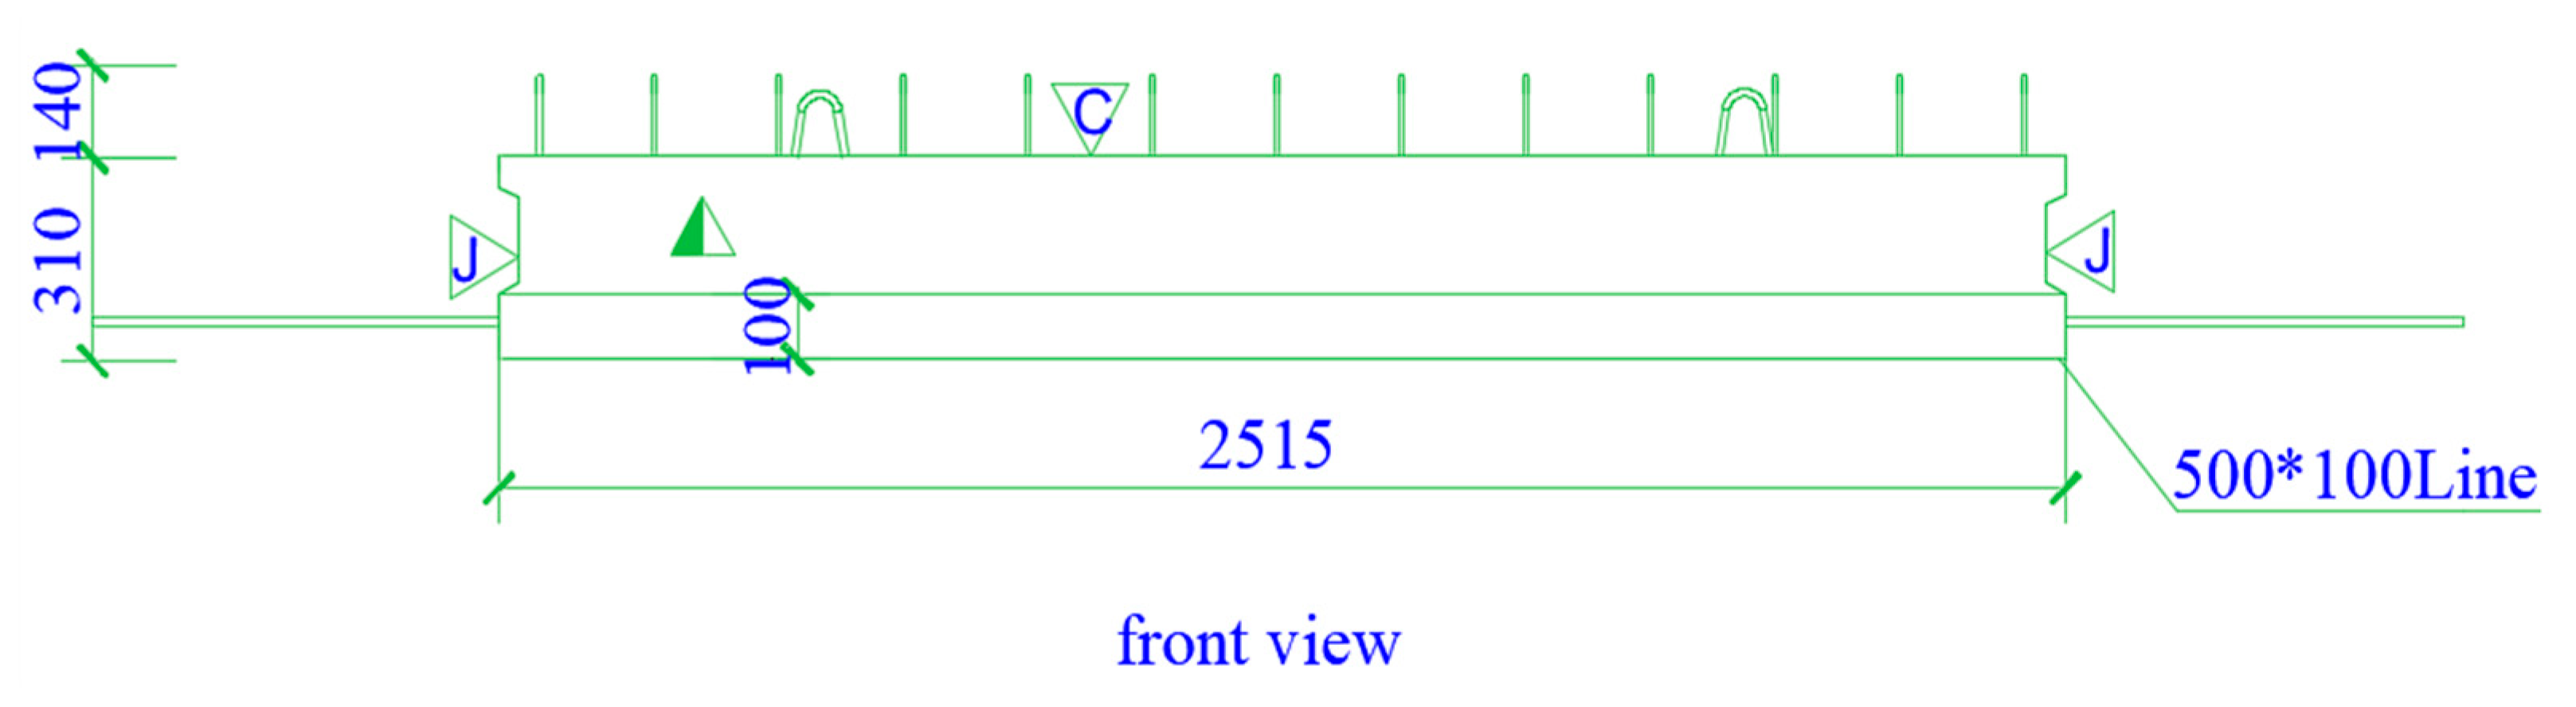
Carbon emissions generated during the installation stage of prefabricated components mainly come from the following three aspects: raw materials, fuel oil and electric energy consumed during installation. The calculation model is shown in Equation (4):
C S = i = 1 n ( C S m × F m + C S f × F f + C S e × F e )
where C S represents the total carbon emissions generated during the installation stage of prefabricated components; n indicates the type of prefabricated components; and CSm, CSf and CSe represent the consumption of raw materials, fuel oil, and electric energy during the installation stage. Fm, Ff and Fe represent the carbon emission coefficients of raw materials, fuel oil, and electric energy consumed during the installation stage, respectively.

5. Case Study

In the case of a commercial building in the prefabricated building in Fujian province, the total number of floors is 18, the site is located in the center of Fuzhou City, China. Among them, the first floor is constructed by the traditional cast-in-place method, and the second to 18th floors adopt a prefabricated construction. The total construction area is about 275 m2, and the main structure is a frame and shear wall. This paper mainly studied the carbon emissions in the construction process of CG-2 composite beams. The composite beam is 2.515 × 0.2 × 0.31 m in size and 0.156 m3 in volume. The raw materials are C30 concrete and hot-rolled reinforced bars. CG-2 composite beams are mainly used in building commercial houses (2~3F, 5~15F, 17~18F, one for each floor; a total of 15 CG-2 composite beams are required for this house). The prefabricated plant is 100 km away from the project site, and the actual transportation vehicle is a medium diesel truck (load 8 t). Figure 5 shows the 3D view of a CG-2 composite beam, and Figure 6 shows the front view of a CG-2 composite beam.

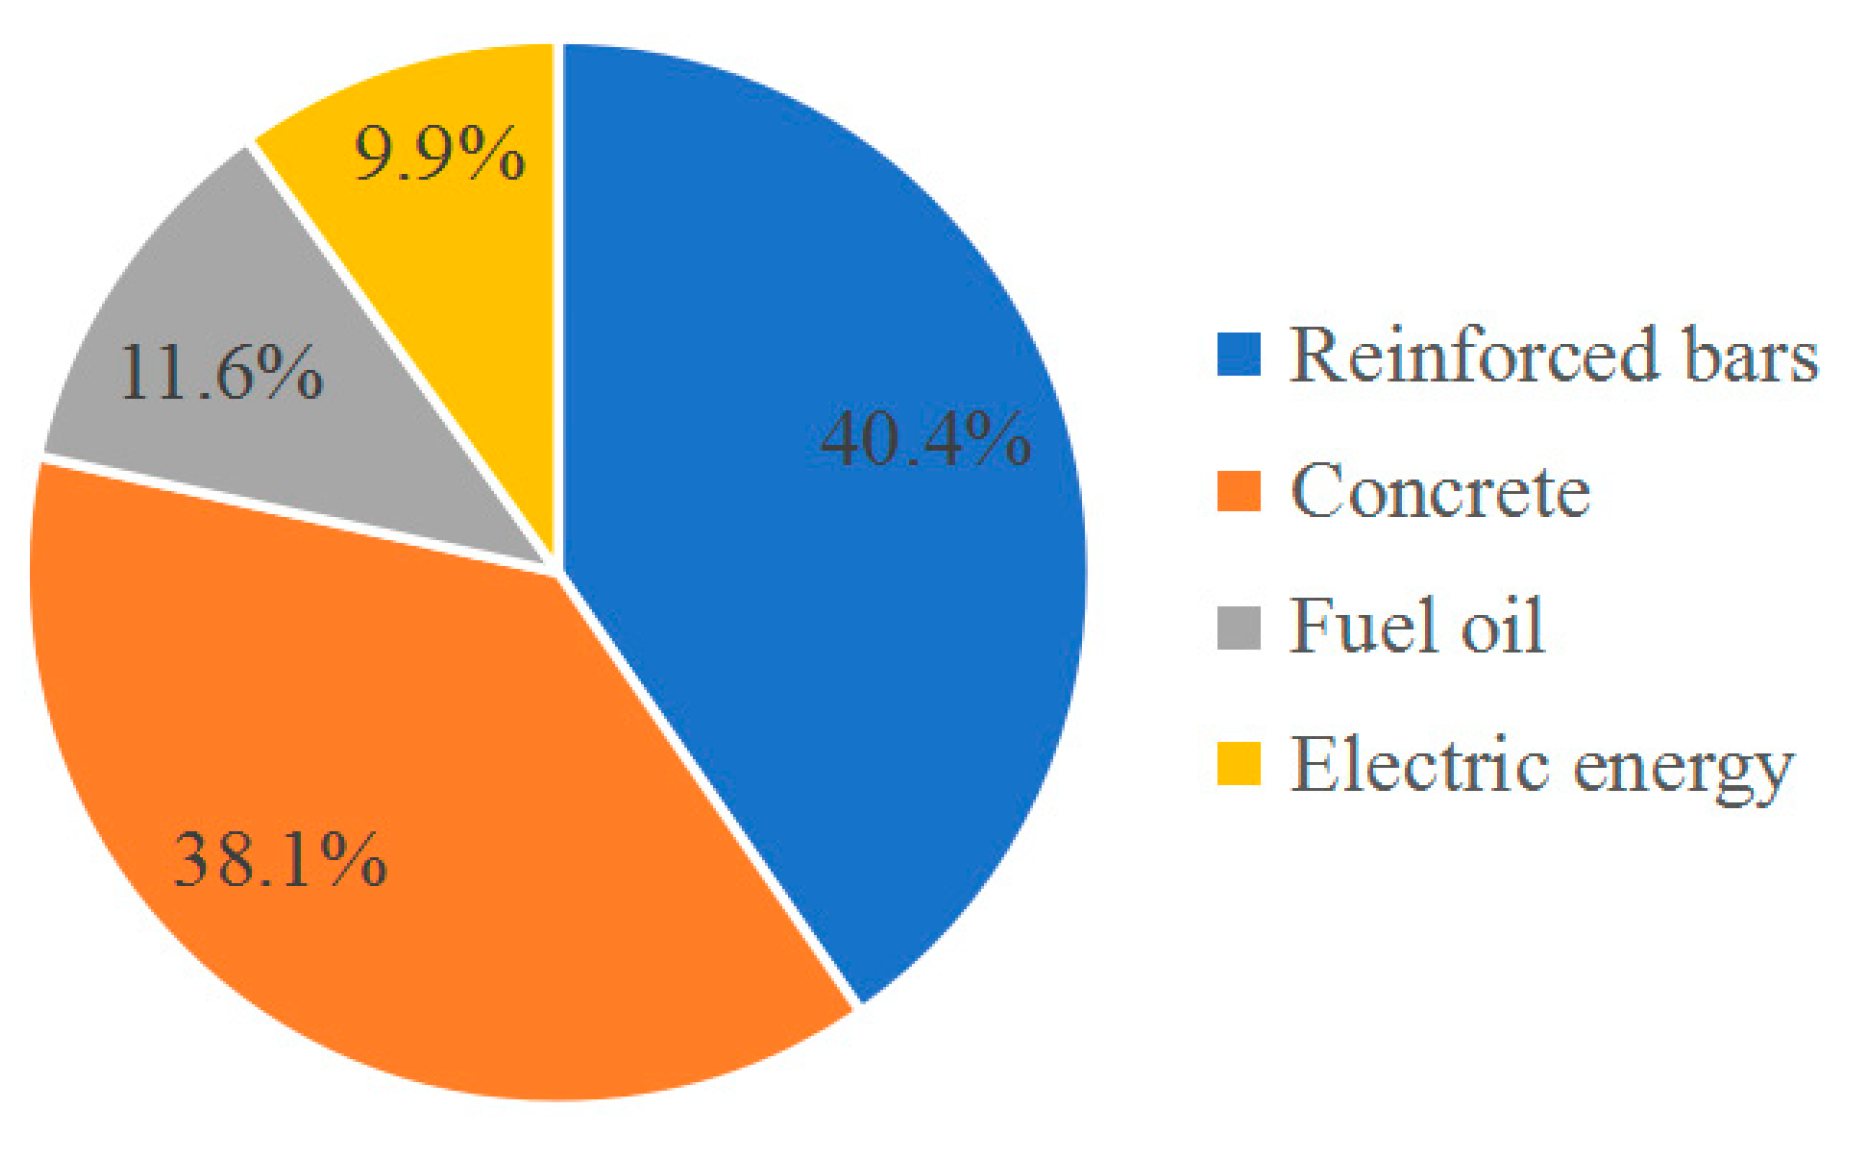
5.1. Production Stage

C30 concrete and hot-rolled reinforced bars are the main raw materials used during the production stage of CG-2 composite beams in the CR Wushanfu Project. The energy sources are mainly fuel oil and electric energy, which consume 70.5 L and 270.8 kwh, respectively. The hot-rolled reinforced bars of CG-2 composite beams mainly include a longitudinal load-bearing bar, stirrup and tensile bar, with four different diameter specifications—Φ14, Φ12, Φ8 and Φ6, respectively—and the numbers are 2, 2, 14 and 22, respectively. Table 2 shows the reinforcement characteristics of CG-2 composite beams.
The density of reinforced bars and concrete of CG-2 composite beams are 7890 kg/m3 and 2360 kg/m3, respectively. It can be seen from Table 2 that the total number of reinforced bars consumed by one CG-2 composite beam is 40, and the total volume consumed is 0.00258 m3. By using the density formula of reinforced bars ρ = m v , the mass of reinforced bars consumed can be calculated to be 20.356 kg. The volume of concrete consumed during the production stage of one CG-2 composite beam is 0.156 m3. By using the density formula of concrete ρ = m v , the mass of concrete consumed can be calculated as 368.16 kg. Table 3 shows the raw material consumption of one CG-2 composite beam.
According to Table 3 and Equation (2), the carbon emission coefficients of raw materials and energy can be used to calculate the total carbon emissions generated during the production stage of CG-2 composite beams, as shown in Table 4.

5.2. Transport Stage

CG-2 composite beams in CR Wushanfu project are actually transported by medium diesel trucks (load 8 t). It can be seen from Table 1 that under the same carrying weight and transportation distance, the electric truck transportation mode generates the least carbon emissions, the diesel truck produces the most, and the gasoline truck is in the middle in terms of its carbon emissions. In order to study the carbon emissions of composite beams under different modes of transportation with different energy consumptions in detail, the carbon emissions generated by assuming two different energy consumption methods of gasoline and electric energy is compared with actual diesel energy consumption, so as to rationally optimize the carbon emissions generated during the transportation stage. Table 5 shows the relevant parameters during the transportation stage of CG-2 composite beams.
According to Table 5, the total mass of one CG-2 composite beam is 388.5 kg. The total number of CG-2 composite beams is 15, and the total mass is 5.8275 t. It can be transported by a truck (load 8 t) in one time. By using Table 1 and Equation (3), the carbon emissions generated by the energy consumption of medium diesel trucks (load 8 t), medium gasoline trucks (load 8 t), and electric trucks (load 8 t) can be calculated, respectively, during the transportation stage, as shown in Table 6.

5.3. Installation Stage

The installation stage of CG-2 composite beams in the CR Wushanfu Project mainly includes two parts: crane hoisting and concrete pouring. The cast-in-place part of concrete pouring involves the consumption of raw materials, electric energy and fuel oil, but it is also related to other prefabricated components. Therefore, it is not considered in this study. The hoisting machinery for CG-2 composite beams is a tower crane, which uses electric energy and consumes about 392.4 kwh. According to Equation (4) and the carbon emission coefficient of electric energy, the carbon emissions generated by electric energy consumption during the installation stage of CG-2 composite beams can be calculated, as shown in Table 7.

6. Data Analysis

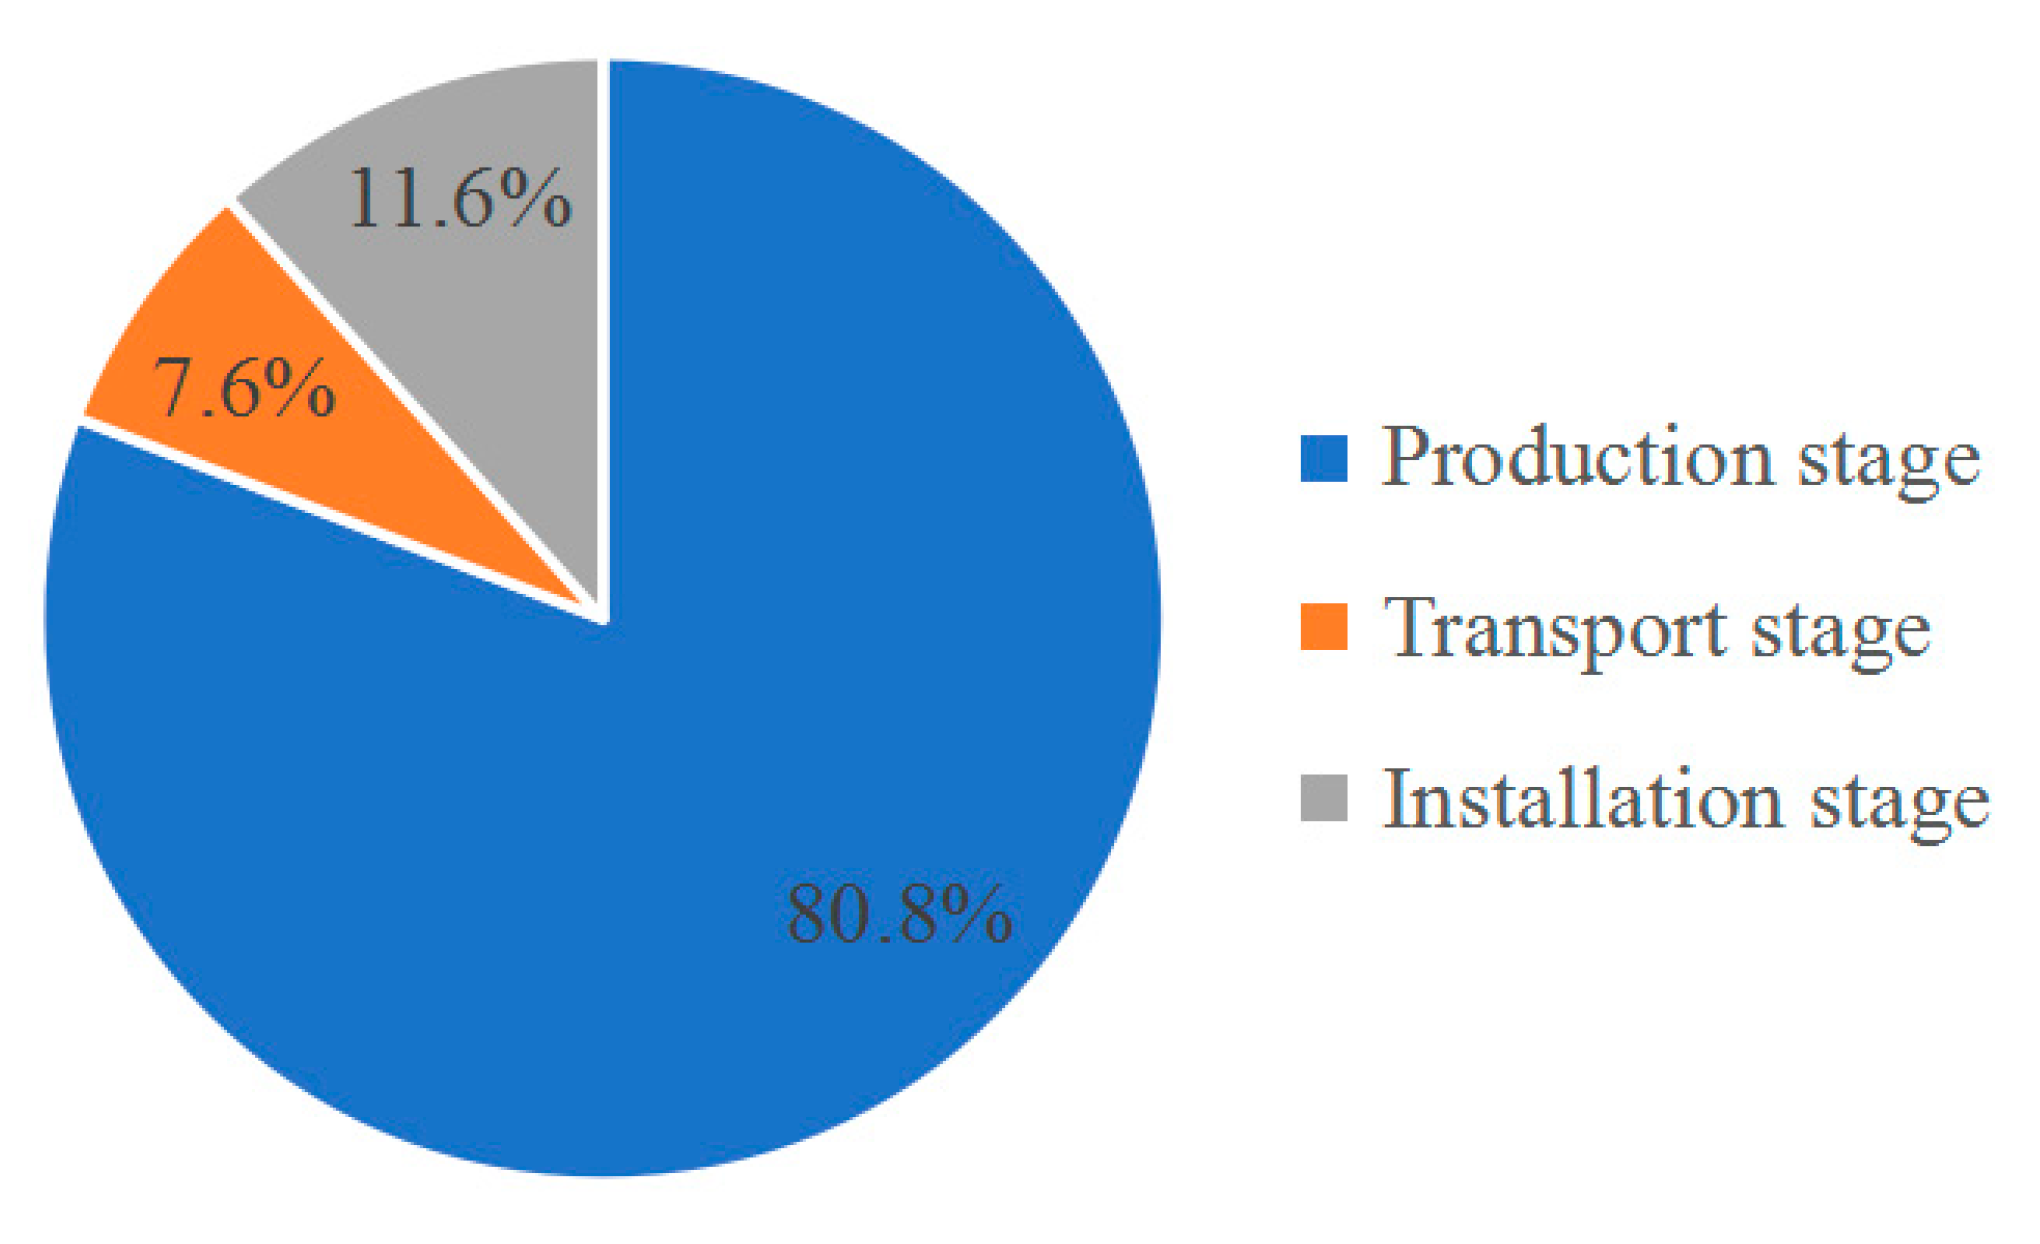
6.1. Carbon Emission Assessment in the Whole Construction Process of CG-2 Composite Beams

Life cycle assessment is the most commonly used method to evaluate the carbon emission of prefabricated buildings, and the construction of composite beams is an essential part of the construction process of prefabricated buildings. Using the life cycle assessment method to evaluate the construction of composite beams is conducive to mastering the impact of the whole construction process of composite beams on the environment, so as to optimize the carbon emission of each stage of the construction of composite beams. CG-2 composite beams used in the construction project of prefabricated commercial buildings in CR Wushanfu project were actually transported by medium diesel trucks (load 8 t load). Based on the life cycle assessment method, carbon emissions generated in the whole construction process of CG-2 composite beams were evaluated. It can be seen from above that the total carbon emissions generated in the whole construction process of composite beams is 2444.95 kg, with an average carbon emission of 8.81 kg/m2. Among them, carbon emissions from the production, transportation, and installation stages are 1975.19 kg, 186.05 kg, and 283.71 kg, respectively, accounting for 80.8%, 7.6%, and 11.6% of the total carbon emissions in the whole construction process. It also indicates that in the whole construction process of CG-2 composite beams, carbon emissions generated during the production stage are relatively large, which is about 4.2 times the sum of the carbon emissions generated during the transportation and installation stages. Therefore, in the construction process of prefabricated buildings, the component production stage should be considered as the key stage of carbon emission reduction. Figure 7 shows the proportion of carbon emissions at various stages in the whole construction process of CG-2 composite beams.
In order to further study the causes of the relatively high carbon emissions of CG-2 composite beams during the production stage, the proportion of carbon emissions from raw materials, electric energy and fuel oil consumed was further analyzed. The total carbon emissions of CG-2 composite beams during the production stage were 1975.19 kg, among which carbon emissions generated by the consumption of reinforced bars, concrete, fuel oil, and electric energy were 799.07 kg, 751.84 kg, 228.49 kg, and 195.79 kg, respectively, accounting for 40.4%, 38.1%, 11.6% and 9.9% of the total carbon emissions during the production stage, as shown in Figure 8.
It can be seen from Figure 8 that carbon emissions from raw material consumption of CG-2 composite beams contributed the most to the total carbon emissions generated during the production stage, reaching about 78.5%. Among them, the reinforced bars’ consumption of raw materials contributed the most, reaching about 40.4%. The reasons may be the following two points: (1) This study is about composite beams, which are 0.14 m above the concrete surface and still have hot-rolled reinforced bars. It is the cast-in-place part of concrete during the installation stage of composite beams, which is not included in the calculation of carbon emissions during the production stage; (2) The carbon emission coefficient of hot-rolled reinforced bars is much larger than that of C30 concrete. Under the condition of consuming the same mass, carbon emissions of hot-rolled reinforced bars are about 19 times that of C30 concrete.

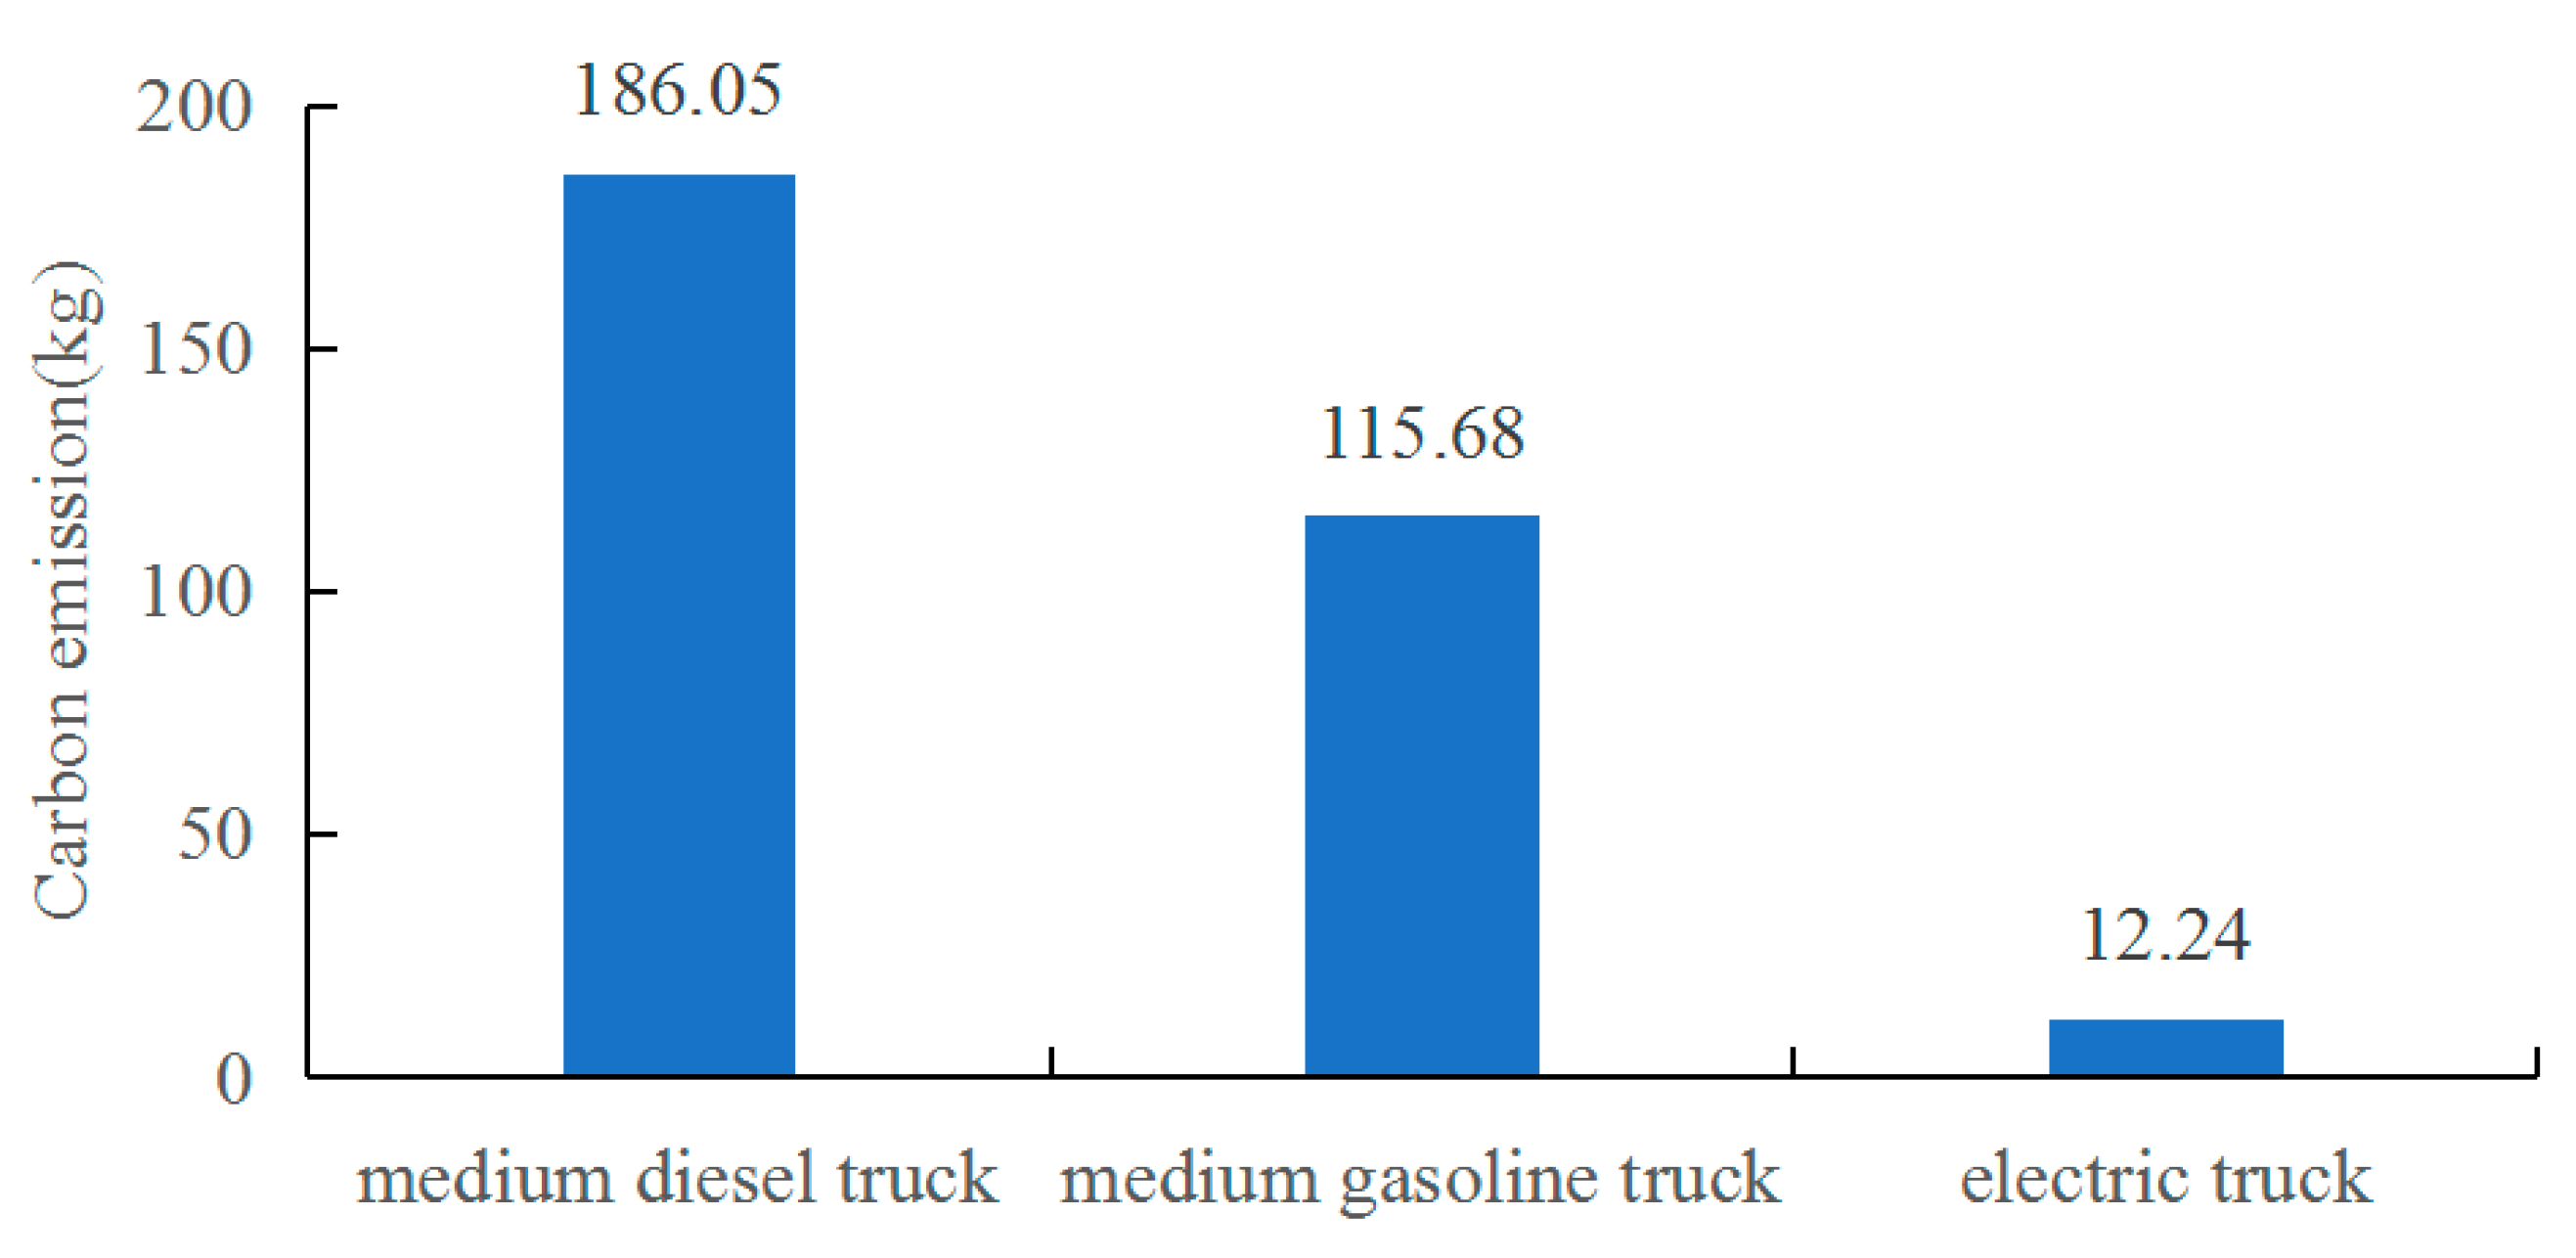
6.2. Carbon Emission Assessment of CG-2 Composite Beams under Three Different Types of Transportation Energy Consumption

The CG-2 composite beam components in the CR Wushanfu Project were transported by a medium diesel truck (load 8 t) with a carbon emission coefficient of 0.1663 kg CO2eq/(km.t). During the transportation stage, the carbon emissions of the CG-2 composite beams were 186.05 kg, accounting for 7.6% of the total carbon emissions in the whole construction process. In order to further optimize the carbon emissions of the CG-2 composite beams during the transportation stage, carbon emissions from medium gasoline trucks (load 8 t) and electric trucks (load 8 t) were compared with those from medium diesel trucks (load 8 t). Figure 9 shows the carbon emissions from CG-2 composite beams transported by different energy vehicles.
The carbon emissions generated during the production and installation stages of CG-2 composite beams in the whole construction process were 1975.19 kg and 283.71 kg, respectively. The carbon emissions generated by the use of medium diesel trucks, medium gasoline trucks, and electric trucks during the transportation stage were 186.05 kg, 115.68 kg and 12.24 kg, respectively, accounting for 7.6%, 4.9% and 0.5% of the total carbon emissions in the whole construction process. As can be seen from Figure 9, under the same distance and load, medium diesel trucks produced the most carbon emissions during the transportation stage, followed by medium gasoline trucks, and electric trucks produced the lowest. Therefore, in order to reduce the carbon emissions generated during the transportation stage, protect the ecological environment, and promote the development of low-carbon and environmentally friendly building industrialization, it is necessary to reduce the use of diesel- and gasoline-powered trucks, and vigorously promote electric trucks. However, at present, power generation mainly comes from coal fuel consumption. If renewable clean energy such as wind energy, solar energy and nuclear energy are used to replace coal fuel power generation in the future, carbon emissions will no longer affect the environment in the transportation process.

7. Conclusions

Based on the life cycle assessment method, the construction process of the CG-2 composite beam of the China Resources Wushan mansion in Fujian province was evaluated. The construction process of the CG-2 composite beam produced a total of 1044.85 g of carbon emissions per cubic meter. Compared with the traditional cast-in-situ beams of 1161.98 g of carbon emissions per cubic meter, the carbon emissions can be reduced by about 10%, saving energy and providing environmental protection advantages. Among them, the consumption of raw materials in the production stage of the CG-2 composite beam contributes the most to the carbon emissions during the construction process. Therefore, rational use of raw materials should be the primary measure for carbon emission reduction in prefabricated construction. In the transportation stage of CG-2 composite beams, the carbon emissions generated by electricity energy consumption are the least, and it should be promoted and used.
Due to some uncontrollable man-made factors, artificial respiration, water consumption, and carbon emissions generated during manual installation have not been included in the calculation. Therefore, in the future, as the construction level of prefabricated buildings continues to improve, the construction system will continue to be optimized, and the carbon emission sources in the entire construction process should be comprehensively considered. In the future, it is necessary to establish a structural system of lower environmental demand and to further explore the characteristics of these constructive processes [8], which is of great importance to satisfy the comfortability and health of residents who live in social housing while maintaining low energy consumption [20].

Author Contributions

Conceptualization, W.W.; formal analysis, K.X.; investigation, H.K.; writing—original draft preparation, K.X. and P.J.; writing—review and editing, N.L. All authors have read and agreed to the published version of the manuscript.

Funding

This research received no external funding.

Institutional Review Board Statement

Not applicable.

Informed Consent Statement

Not applicable.

Data Availability Statement

Not applicable.

Conflicts of Interest

The authors declare no conflict of interest.

References

  1. Ürge-Vorsatz, D.; Harvey, L.D.; Sevastianos, M.; Mark, D.L. Mitigating CO2 emissions from energy use in the world’s buildings. Build. Res. Inf. 2007, 35, 379–398. [Google Scholar] [CrossRef]
  2. Lang, S. Progress in energy-efficiency standards for residential buildings in China. Energy Build. 2004, 36, 1191–1196. [Google Scholar] [CrossRef]
  3. Amber, K.P.; Aslam, M.W.; Mahmood, A.; Anila, K.; Muhammad, Y.Y.; Bilal, A.; Chulam, Q.C.; Syed, K.H. Energy consumption forecasting for university sector buildings. Energies 2017, 10, 1579. [Google Scholar] [CrossRef] [Green Version]
  4. Wahid, F.; Kim, D.H. A prediction approach for demand analysis of energy consumption using k-nearest neighbor in residential buildings. Int. J. Smart Home 2016, 10, 97–108. [Google Scholar] [CrossRef] [Green Version]
  5. Chen, H.; Chen, W. Potential impact of shifting coal to gas and electricity for building sectors in 28 major northern cities of China. Appl. Energy 2019, 236, 1049–1061. [Google Scholar] [CrossRef]
  6. Huo, T.; Ren, H.; Zhang, X.; Cai, W.; Feng, W.; Zhou, N.; Wang, X. China’s energy consumption in the building sector: A statistical yearbook-energy balance sheet based splitting method. J. Clean. Prod. 2018, 185, 665–679. [Google Scholar] [CrossRef]
  7. Yang, L.; Yan, H.; Lam, J.C. Thermal comfort and building energy consumption implications—A review. Appl. Energy 2014, 115, 164–173. [Google Scholar] [CrossRef]
  8. Luna-Tintos, J.F.; Cobreros, C.; Herrera-Limones, R.; Lopez-Escamilla, A. Methodology comparative analysis in the Solar Decathlon competition: A proposal of housing model based on a prefabricated structural system. Sustainability 2020, 12, 1882. [Google Scholar] [CrossRef] [Green Version]
  9. Jun, X. The advantages and disadvantages of prefabricated building. Constr. Design Eng. 2018, 29, 30–33. [Google Scholar]
  10. Chang, Y.; Li, X.; Masanet, E.; Zhang, L.; Huang, Z.; Ries, R. Unlocking the green opportunity for prefabricated buildings and construction in China. Resour. Conserv. Recycl. 2018, 139, 259–261. [Google Scholar] [CrossRef]
  11. Navaratnam, S.; Ngo, T.; Gunawardena, T.; Henderson, D. Performance review of prefabricated building systems and future research in Australia. Buildings 2019, 9, 38. [Google Scholar] [CrossRef] [Green Version]
  12. Bonamente, E.; Merico, M.C.; Rinaldi, S.; Pignatta, G.; Pisello, A.L.; Cotana, F.; Nicolini, A. Environmental impact of industrial prefabricated buildings: Carbon and energy footprint analysis based on an LCA approach. Energy Procedia 2014, 61, 2841–2844. [Google Scholar] [CrossRef] [Green Version]
  13. Cao, X.; Li, X.; Zhu, Y.; Zhang, Z. A comparative study of environmental performance between prefabricated and traditional residential buildings in China. J. Clean. Prod. 2015, 109, 131–143. [Google Scholar] [CrossRef]
  14. Luna-Tintos, J.F.; Cobreros, C.; Lopez-Escamilla, A.; Herrera-Limones, R.; Torres-GarcIa, M. Methodology to Evaluate the Embodied Primary Energy and CO2 Production at Each Stage of the Life Cycle of Prefabricated Structural Systems: The Case of the Solar Decathlon Competition. Energies 2020, 13, 4311. [Google Scholar] [CrossRef]
  15. Jaillon, L.; Poon, C.S.; Chiang, Y.H. Quantifying the waste reduction potential of using prefabrication in building construction in Hong Kong. Waste Manag. 2008, 29, 309–320. [Google Scholar] [CrossRef] [PubMed]
  16. Wu, H.J.; Yuan, Z.W.; Zhang, L.; Bi, J. Life cycle energy consumption and CO2 emission of an office building in China. Int. J. Life Cycle Assess. 2012, 17, 105–118. [Google Scholar] [CrossRef]
  17. Liu, G.; Gu, T.; Xu, P.; Hong, J.; Shrestha, A.; Martek, I. A production line-based carbon emission assessment model for prefabricated components in China. J. Clean. Prod. 2019, 209, 30–39. [Google Scholar] [CrossRef]
  18. Seo, S.; Kim, J.; Yum, K.; McGregor, J. Embodied carbon of building products during their supply chains: Case study of aluminium window in Australia. Resour. Conserv. Recycl. 2015, 105, 160–166. [Google Scholar] [CrossRef]
  19. Kong, A.; Kang, H.; He, S.; Li, N.; Wang, W. Study on the carbon emissions in the whole construction process of prefabricated floor slab. Appl. Sci. 2020, 10, 2326. [Google Scholar] [CrossRef] [Green Version]
  20. Lopez-Escamilla, A.; Herrera-Limones, R.; Leon-Rodriguez, A.L.; Torres-GarcIa, M. Environmental Comfort as a Sustainable Strategy for Housing Integration: The AURA 1.0 Prototype for Social Housing. Appl. Sci. 2020, 10, 7734. [Google Scholar] [CrossRef]
  21. Aye, L.; Ngo, T.; Crawford, R.H.; Gammampila, R.; Mendis, P. Life cycle greenhouse gas emissions and energy analysis of prefabricated reusable building modules. Energy Build. 2012, 47, 159–168. [Google Scholar] [CrossRef]
  22. Xie, H.S.; Zhou, X.J.; Huang, Y.; Shang, Y.F. Research on the measurement of carbon emission from railway operation and evaluation of low-carbon effect. J. Railw. Eng. Soc. 2014, 31, 117–122. [Google Scholar]
  23. Zhang, Z.; Wang, B. Research on the life-cycle CO2 emission of China’s construction sector. Energy Build. 2016, 112, 244–255. [Google Scholar]
  24. Wang, S.; Fang, C.; Guan, X.; Pang, B.; Ma, H. Urbanisation, energy consumption, and carbon dioxide emissions in China: A panel data analysis of China’s provinces. Appl. Energy 2014, 136, 738–749. [Google Scholar]
  25. Atmaca, N. Life-cycle assessment of post-disaster temporary housing. Build. Res. Inf. 2017, 45, 524–538. [Google Scholar] [CrossRef]
  26. Qi, Y.; Zhang, Y.; Jiang, H.; Hou, H.; Li, J. Life cycle assessment in urban territories: A case study of Dalian city, China. Int. J. Life Cycle Assess. 2019, 24, 1194–1208. [Google Scholar]
  27. Benedek, K.; Zsuzsa, S. A visual method for detailed analysis of building life cycle assessment results. Appl. Mech. Mater. 2019, 887, 319–326. [Google Scholar] [CrossRef] [Green Version]
  28. ISO14040. Environmental Management—Life Cycle Assessment—Priniciples and Framework; International Standard Organization: Geneva, Switzerland, 1997. [Google Scholar]
  29. Zhang, X.; Wang, F. Life-cycle carbon emission assessment and permit allocation methods: A multi-region case study of China’s construction sector. Ecol. Indic. 2017, 72, 910–920. [Google Scholar] [CrossRef]
  30. Sandanayake, M.; Zhang, G.; Setunge, S. Environmental emissions at foundation construction stage of buildings-Two case studies. Build. Environ. 2016, 95, 189–198. [Google Scholar]
  31. Gao, Y.; Li, Z.; Zhang, H.; Yu, B.; Wang, J. A carbon emission analysis model for prefabricated construction based on LCA. J. Eng. Manag. 2018, 32, 30–34. [Google Scholar]
  32. Kumanayake, R.; Luo, H. Life cycle carbon emission assessment of a multi-purpose university building: A case study of Sri Lanka. Front. Eng. Manag. 2018, 5, 381–393. [Google Scholar]
  33. Hu, B.; Qiao, C.; Yuan, X.; Chen, W. Research Status of Carbon Emissions Accounting Methods for Industrial Buildings and Traditional Buildings. Build. Energy Effic. 2018, 46, 137–140. [Google Scholar]
  34. Peng, C. Calculation of a building’s life cycle carbon emissions based on Ecotect and building information modeling. J. Clean. Prod. 2016, 112, 453–465. [Google Scholar]
  35. Pandey, D.; Agrawal, M.; Pandey, J.S. Carbon footprint: Current methods of estimation. Environ. Monit. Assess. 2011, 178, 135–160. [Google Scholar]
  36. Song, M.; Guo, X.; Wu, K.; Wang, G. Driving effect analysis of energy-consumption carbon emissions in the Yangtze River Delta region. J. Clean. Prod. 2015, 103, 620–628. [Google Scholar]
  37. Gong, X.; Nie, Z.; Wang, Z.; Zuo, T. Research and development of Chinese LCA database and LCA software. Rare Met. 2006, 25, 101–104. [Google Scholar]
Figure 1. Theoretical framework of life cycle assessment.
Energies 14 01810 g001
Figure 2. Carbon emissions sources of prefabricated components during the production stage.
Energies 14 01810 g002
Figure 3. Carbon emissions sources of prefabricated components during the transportation stage.
Energies 14 01810 g003
Figure 4. Carbon emissions sources of prefabricated components during the installation stage.
Energies 14 01810 g004
Figure 5. 3D view of CG-2 composite beam.
Energies 14 01810 g005
Figure 6. Front view of CG-2 composite beam.
Energies 14 01810 g006
Figure 7. Proportion of carbon emissions at various stages in the whole construction process of CG-2 composite beams.
Energies 14 01810 g007
Figure 8. Proportion of carbon emissions generated by various materials and energy consumption of CG-2 composite beams during the production stage.
Energies 14 01810 g008
Figure 9. Carbon emissions from CG-2 composite beams transported by different energy vehicles.
Energies 14 01810 g009
Table 1. Carbon emission coefficient of main energy truck.
Transportation VehiclesValue/[kg CO2eq/(km.t)]
Medium Gasoline truck (load 2 t)0.1034
Heavy Gasoline truck (load 10 t)0.1402
Medium Diesel truck (load 8 t)0.1663
Heavy Diesel truck (load 10 t)0.1772
Electric truck0.0109
Table 2. Reinforcement characteristics of CG-2 composite beam.
DiameterAmountSize (mm)Volume (m3)
Φ142 Energies 14 01810 i0010.00125
Φ122 Energies 14 01810 i0020.00056
Φ81 Energies 14 01810 i0030.00012
Φ813 Energies 14 01810 i0040.00025
Φ611 Energies 14 01810 i0050.00029
Φ69 Energies 14 01810 i0060.00006
Φ62 Energies 14 01810 i0070.00005
total40 0.00258
Table 3. Reinforcement characteristics of CG-2 composite beam.
Product NameDensity (kg/m3)Volume (m3)Mass (kg)
Hot-rolled reinforced bar78900.0025820.356
C30 concrete23600.156368.16
Reinforced concrete24490.15858388.516
Table 4. Total carbon emissions generated by raw materials and energy consumed during the production stage of CG-2 composite beams.
Product NameConsumptionCarbon Emission CoefficientCarbon Emission (kg)
Hot-rolled reinforced bar305.34 kg2.617 kg CO2eq/kg799.07
C30 concrete2.34 m3321.3 kg CO2eq/m3751.84
Fuel oil70.5 L3.24 kg CO2eq/L228.49
electric energy270.8 kwh0.723 kg CO2eq/kwh195.79
Total1975.19
Table 5. Relevant parameters of CG-2 composite beams during the transportation stage.
NameValue
CG-2 composite beam components15
CG-2composite beam volume0.1586 m3
CG-2composite beam density2450 kg/m3
CG-2composite beam mass388.5 kg
One-time transportation distance100 km
One-time transportation components15
One-time transportation mass5.8275 t
Transportation numbers1
No-load coefficient of truck0.67
Table 6. Carbon emissions generated by three different energy consumption methods.
Transportation VehicleCarbon Emission Coefficient
/[kg CO2eq/(km.t)]
Carbon Emissions (kg)
Medium Diesel oil truck (load 8 t)0.1663186.05
Medium Gasoline truck (load 8 t)0.1034115.68
Electric truck (load 8 t)0.010912.24
Total313.97
Table 7. Carbon emissions generated by electric energy consumption during the installation stage of CG-2 composite beams.
Energy ConsumptionConsumption (kwh)Carbon Emission CoefficientCarbon Emissions (kg)
Electric energy392.40.723 kg CO2eq/kwh283.71
Total283.71
Publisher’s Note: MDPI stays neutral with regard to jurisdictional claims in published maps and institutional affiliations.

