
Study on Worldwide Embodied Impacts of Construction: Analysis of WIOD Release 2016

Abstract
1. Introduction
1.1. Background
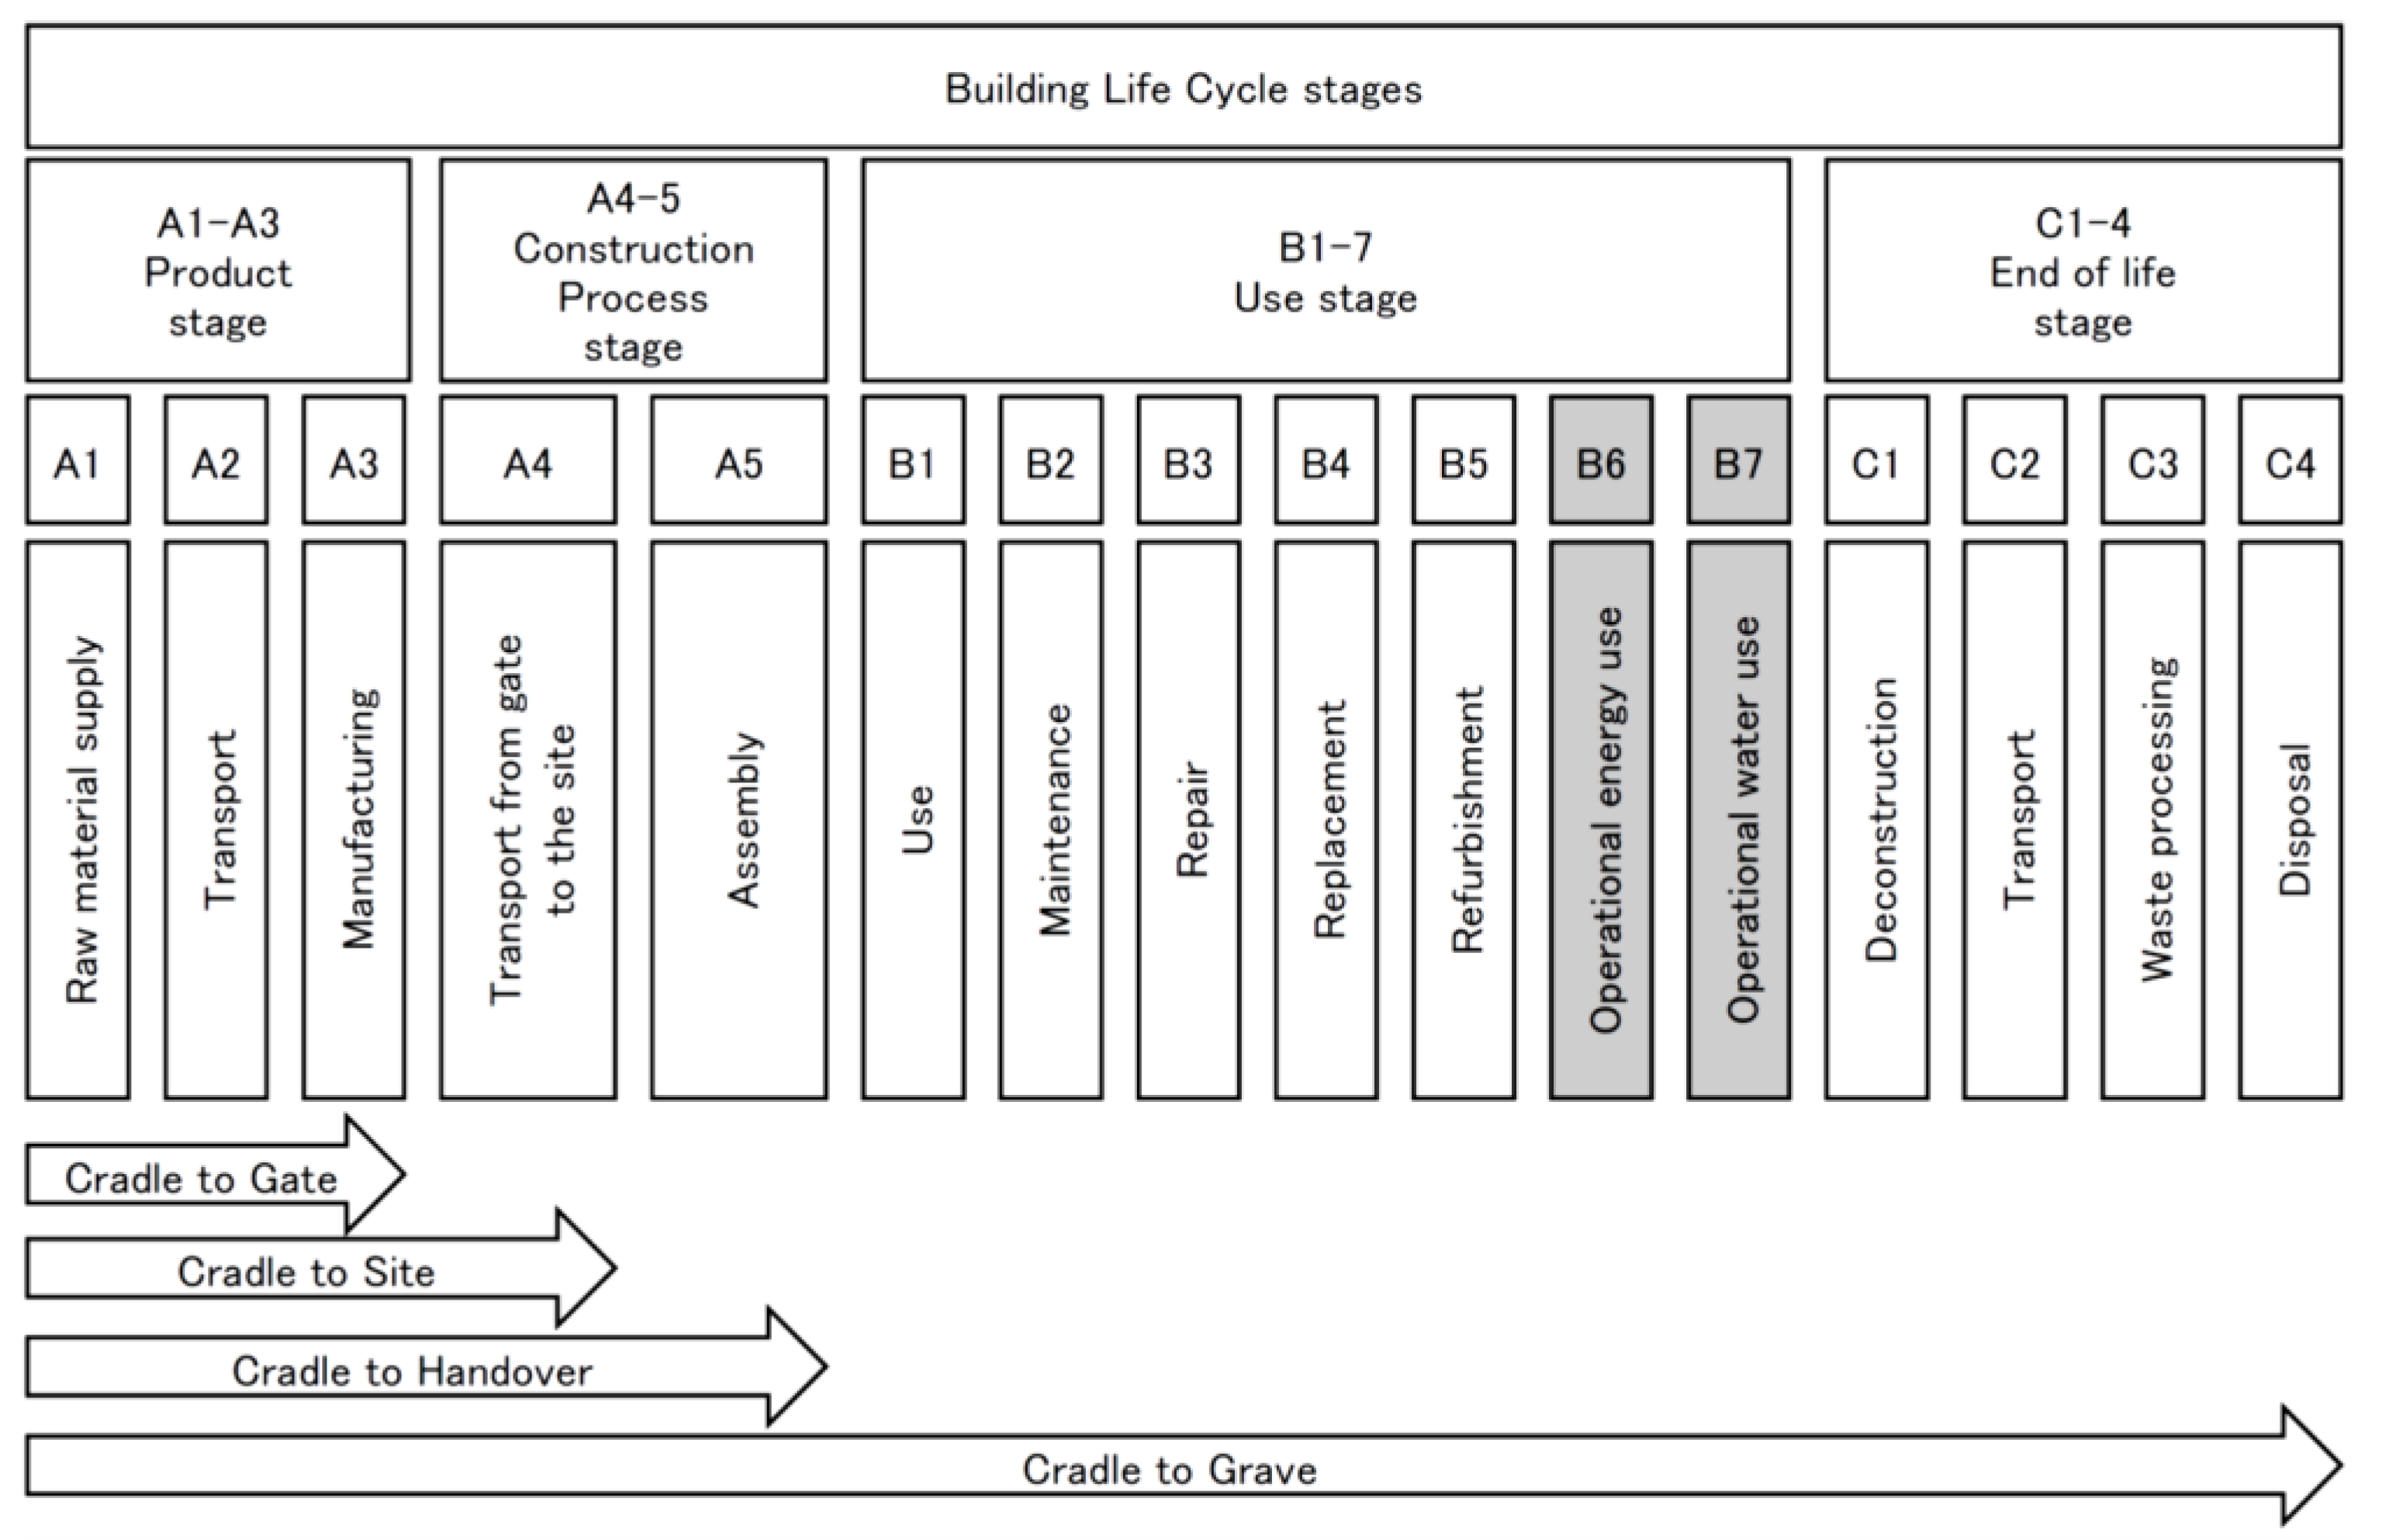
1.2. Embodied Impact
- Pef: Primary energy from fossil fuels only;
- Penr: Primary energy from fossil fuels and nuclear power;
- Pet: Total primary energy from fossil fuels, nuclear power, and renewable energy.
1.3. Previous Research Using WIOD
2. Materials and Methods
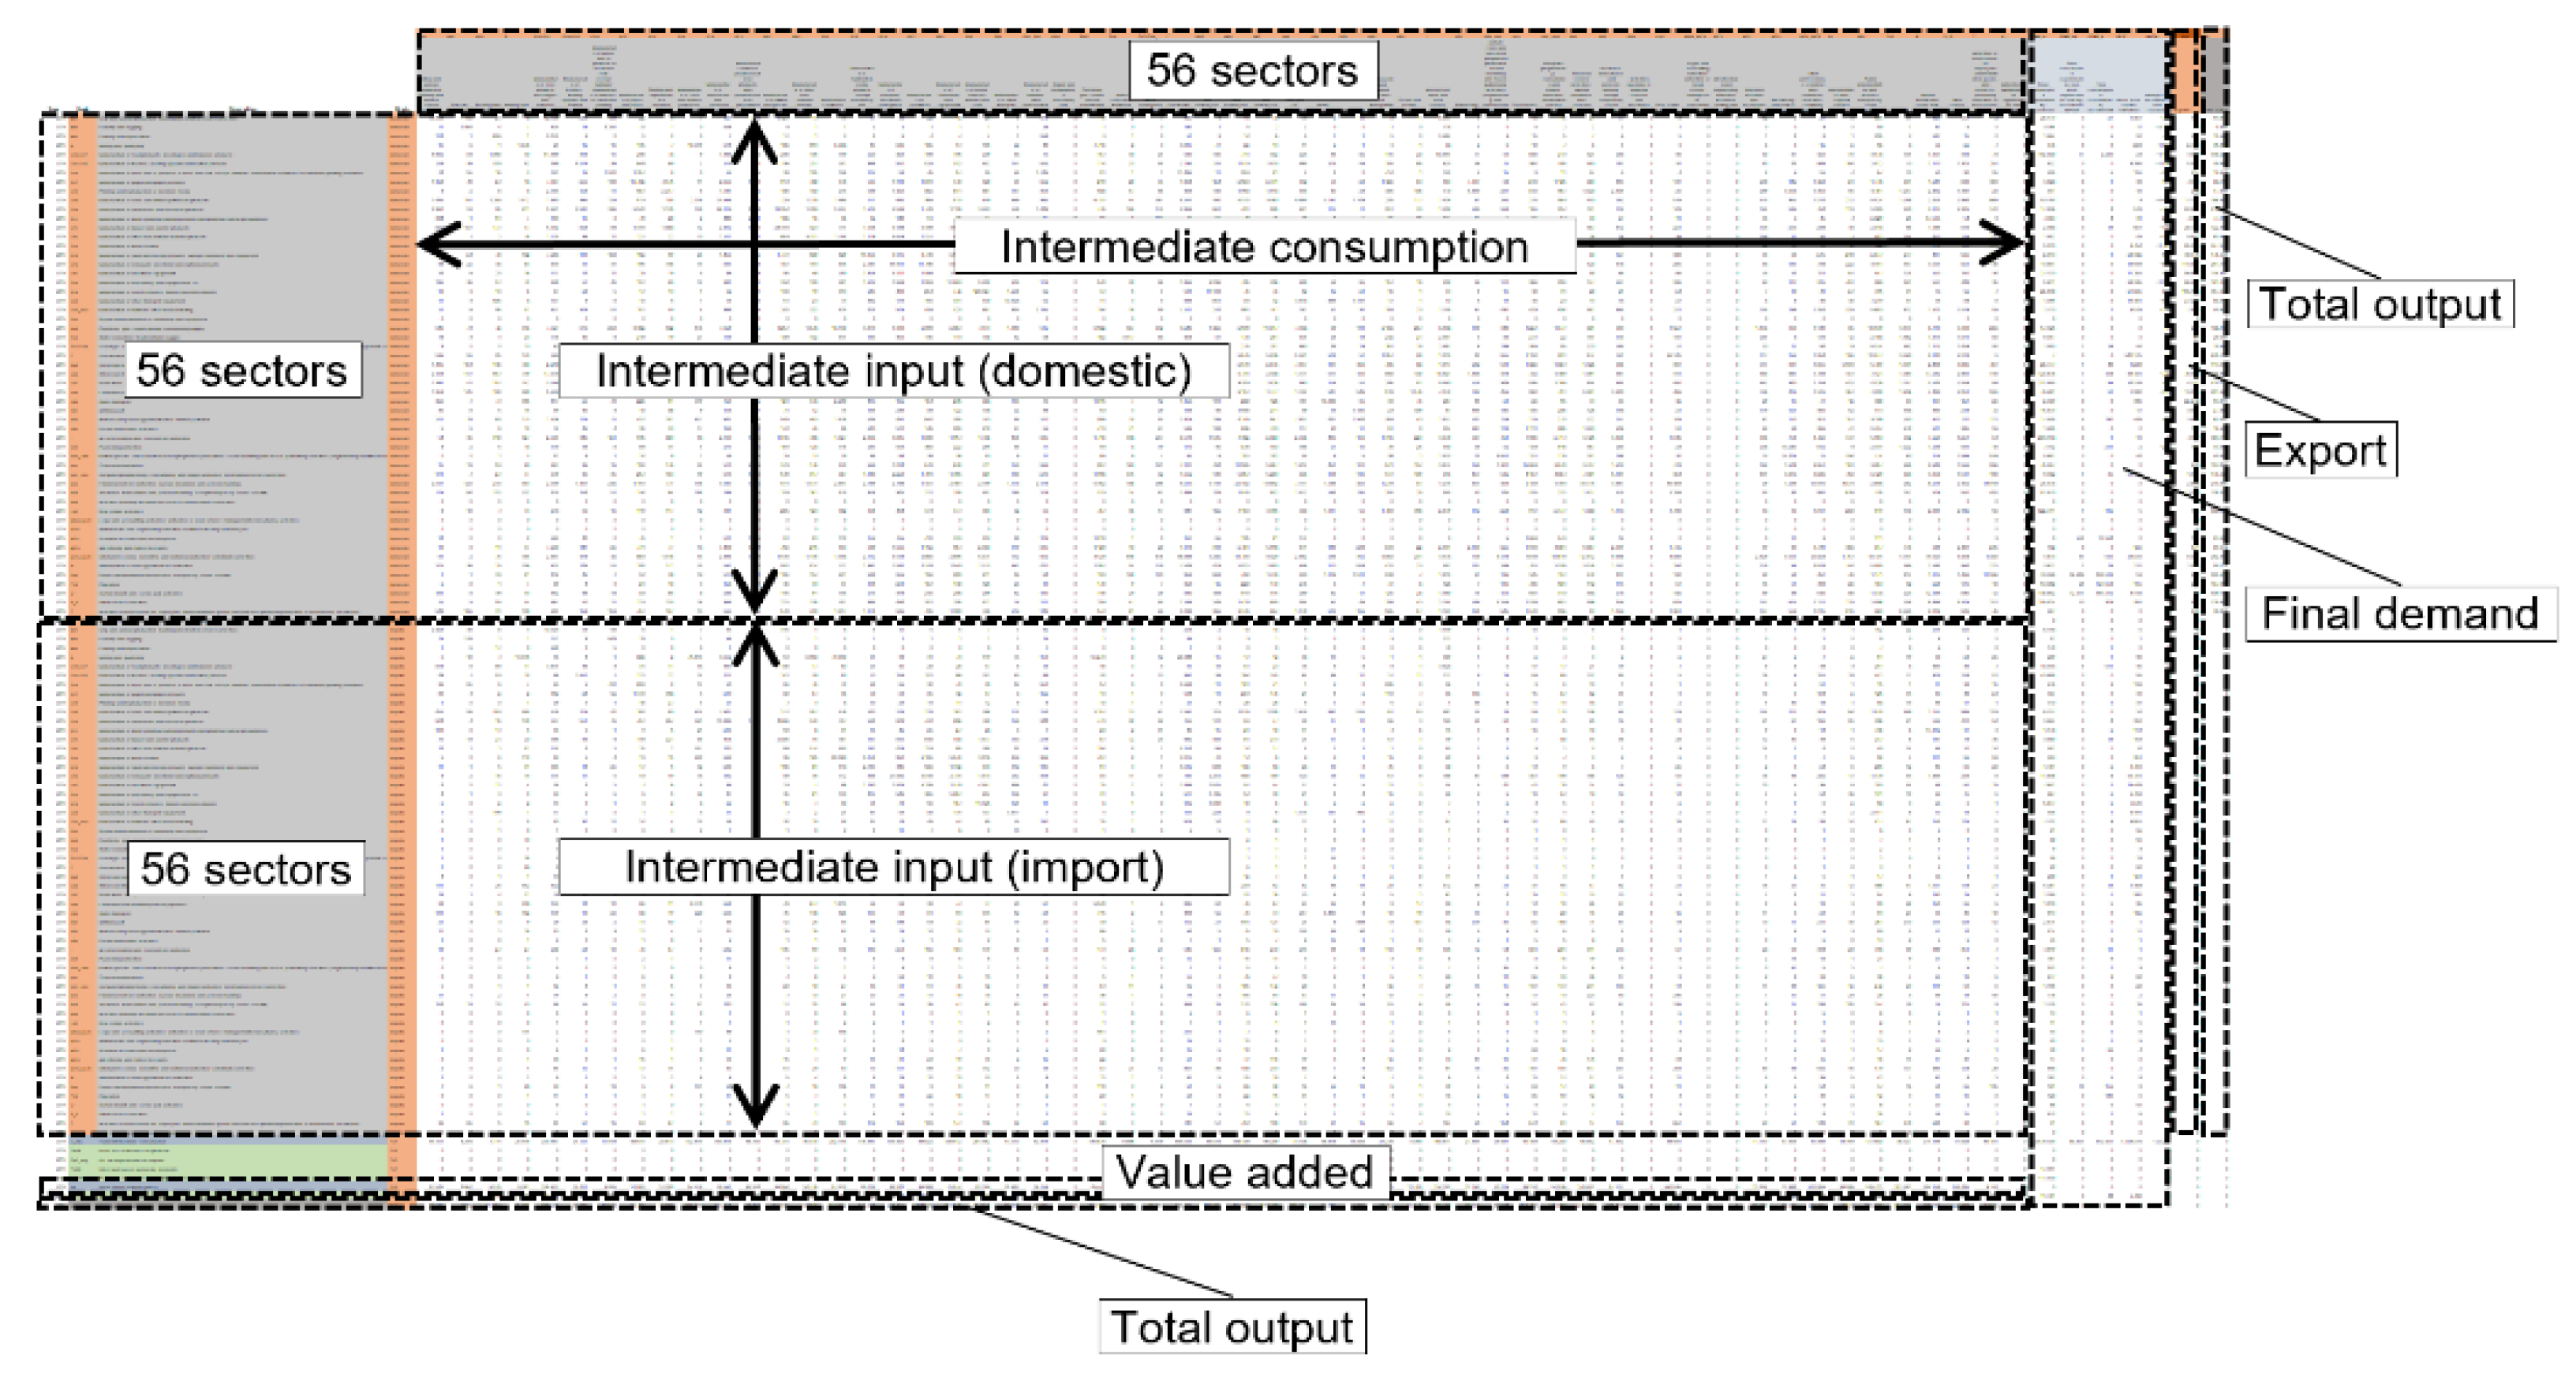
2.1. Overview of the WIOD (2016)
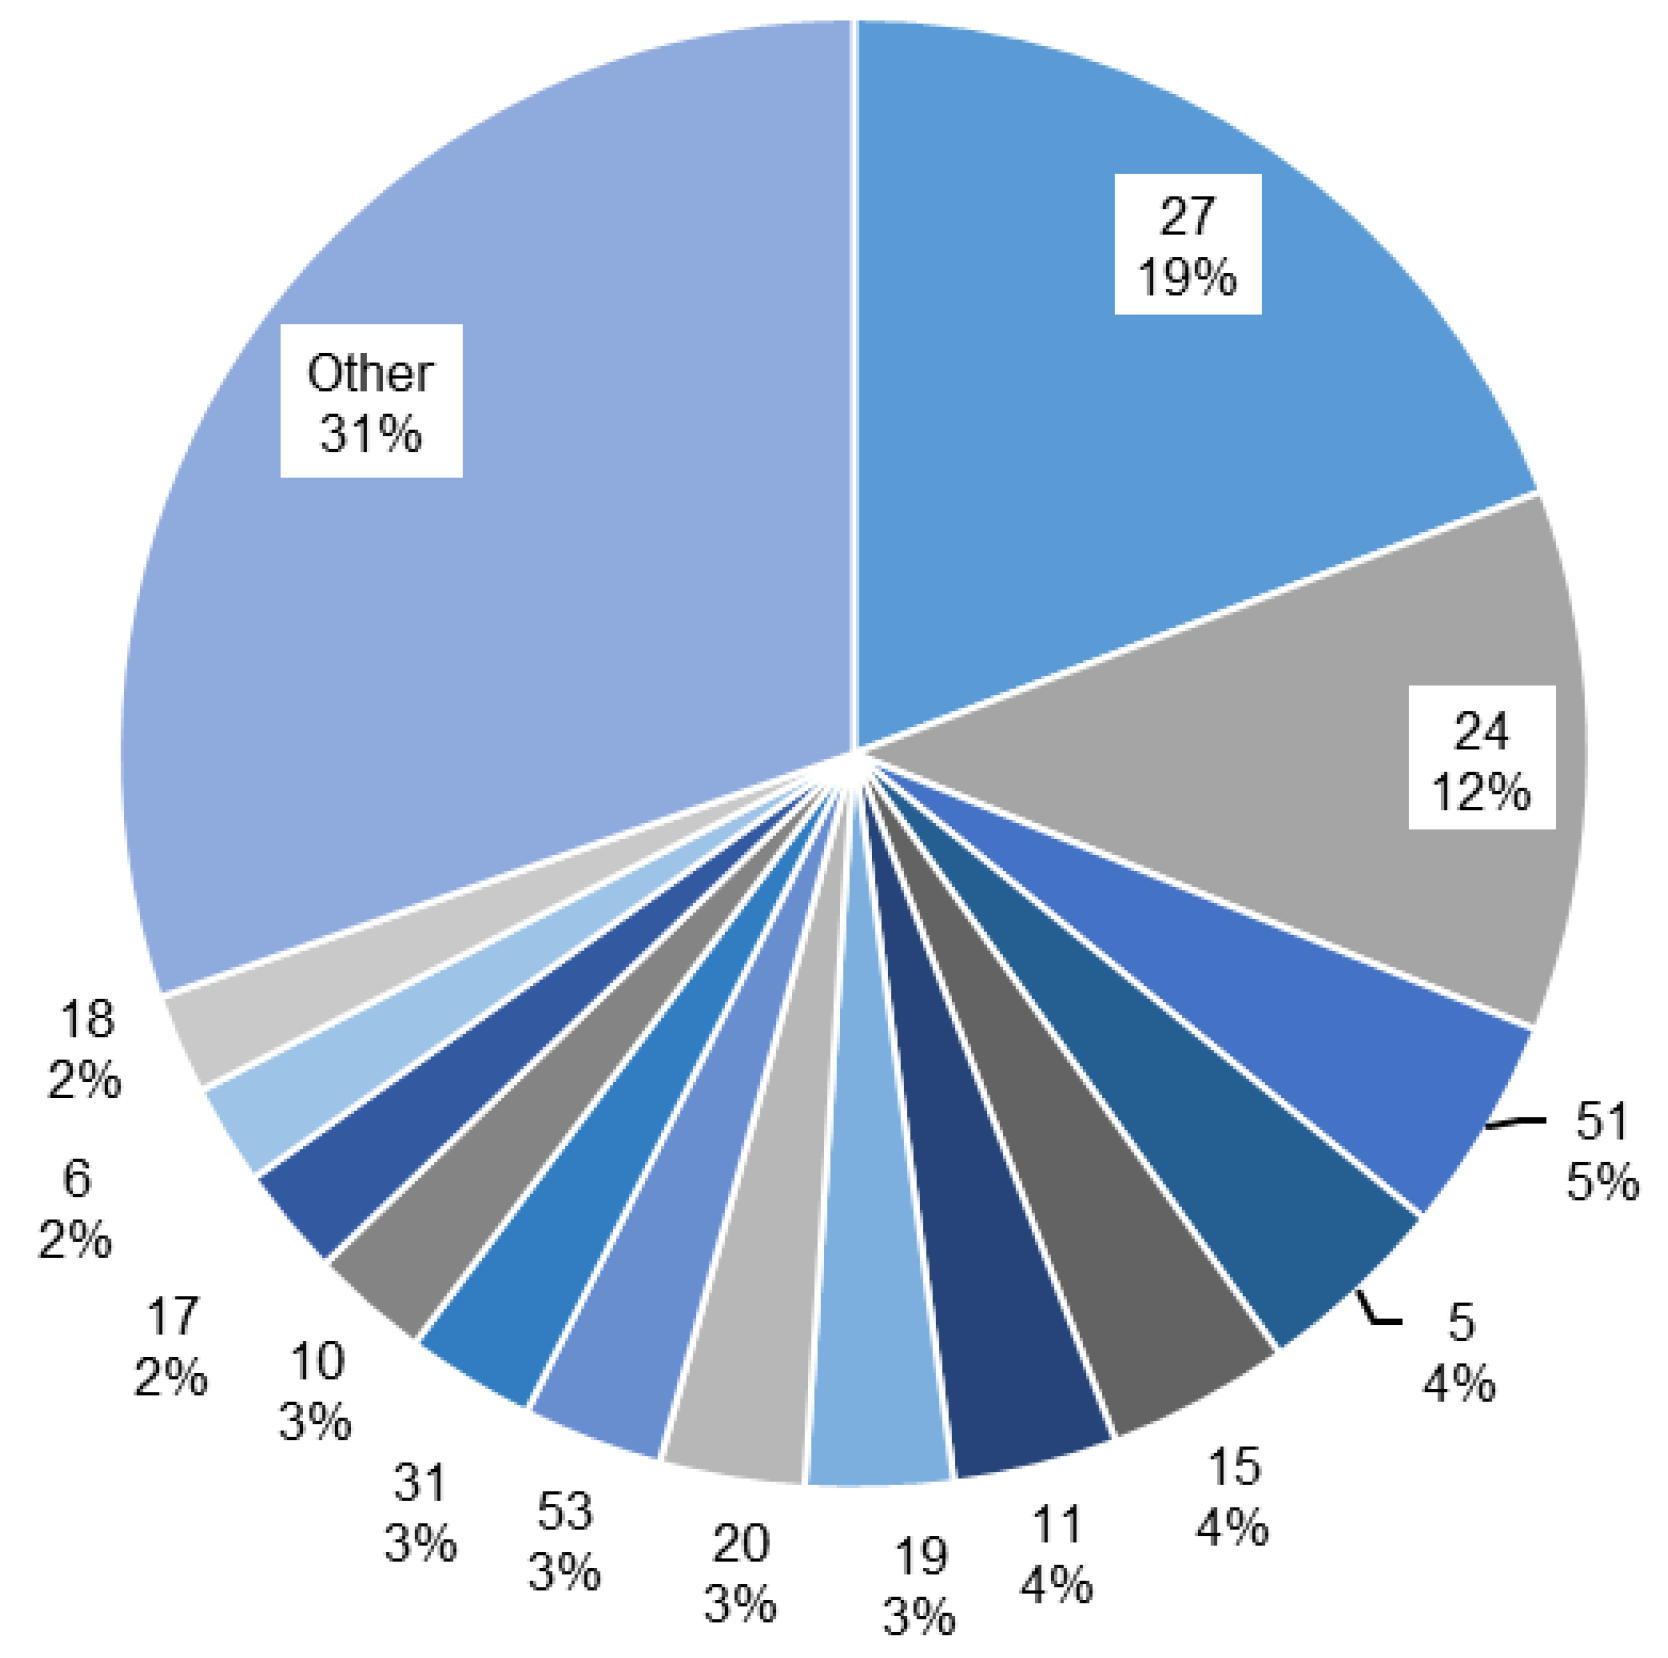
2.2. Overview of Target Countries
2.3. Calculation of CO2 Emission Intensities
2.3.1. Summary of Calculation
2.3.2. Calculation of CO2 Emission Intensities
3. Results
3.1. CO2 Emission Intensity and CO2 Emissions by Sector
3.2. Impact by Sectors
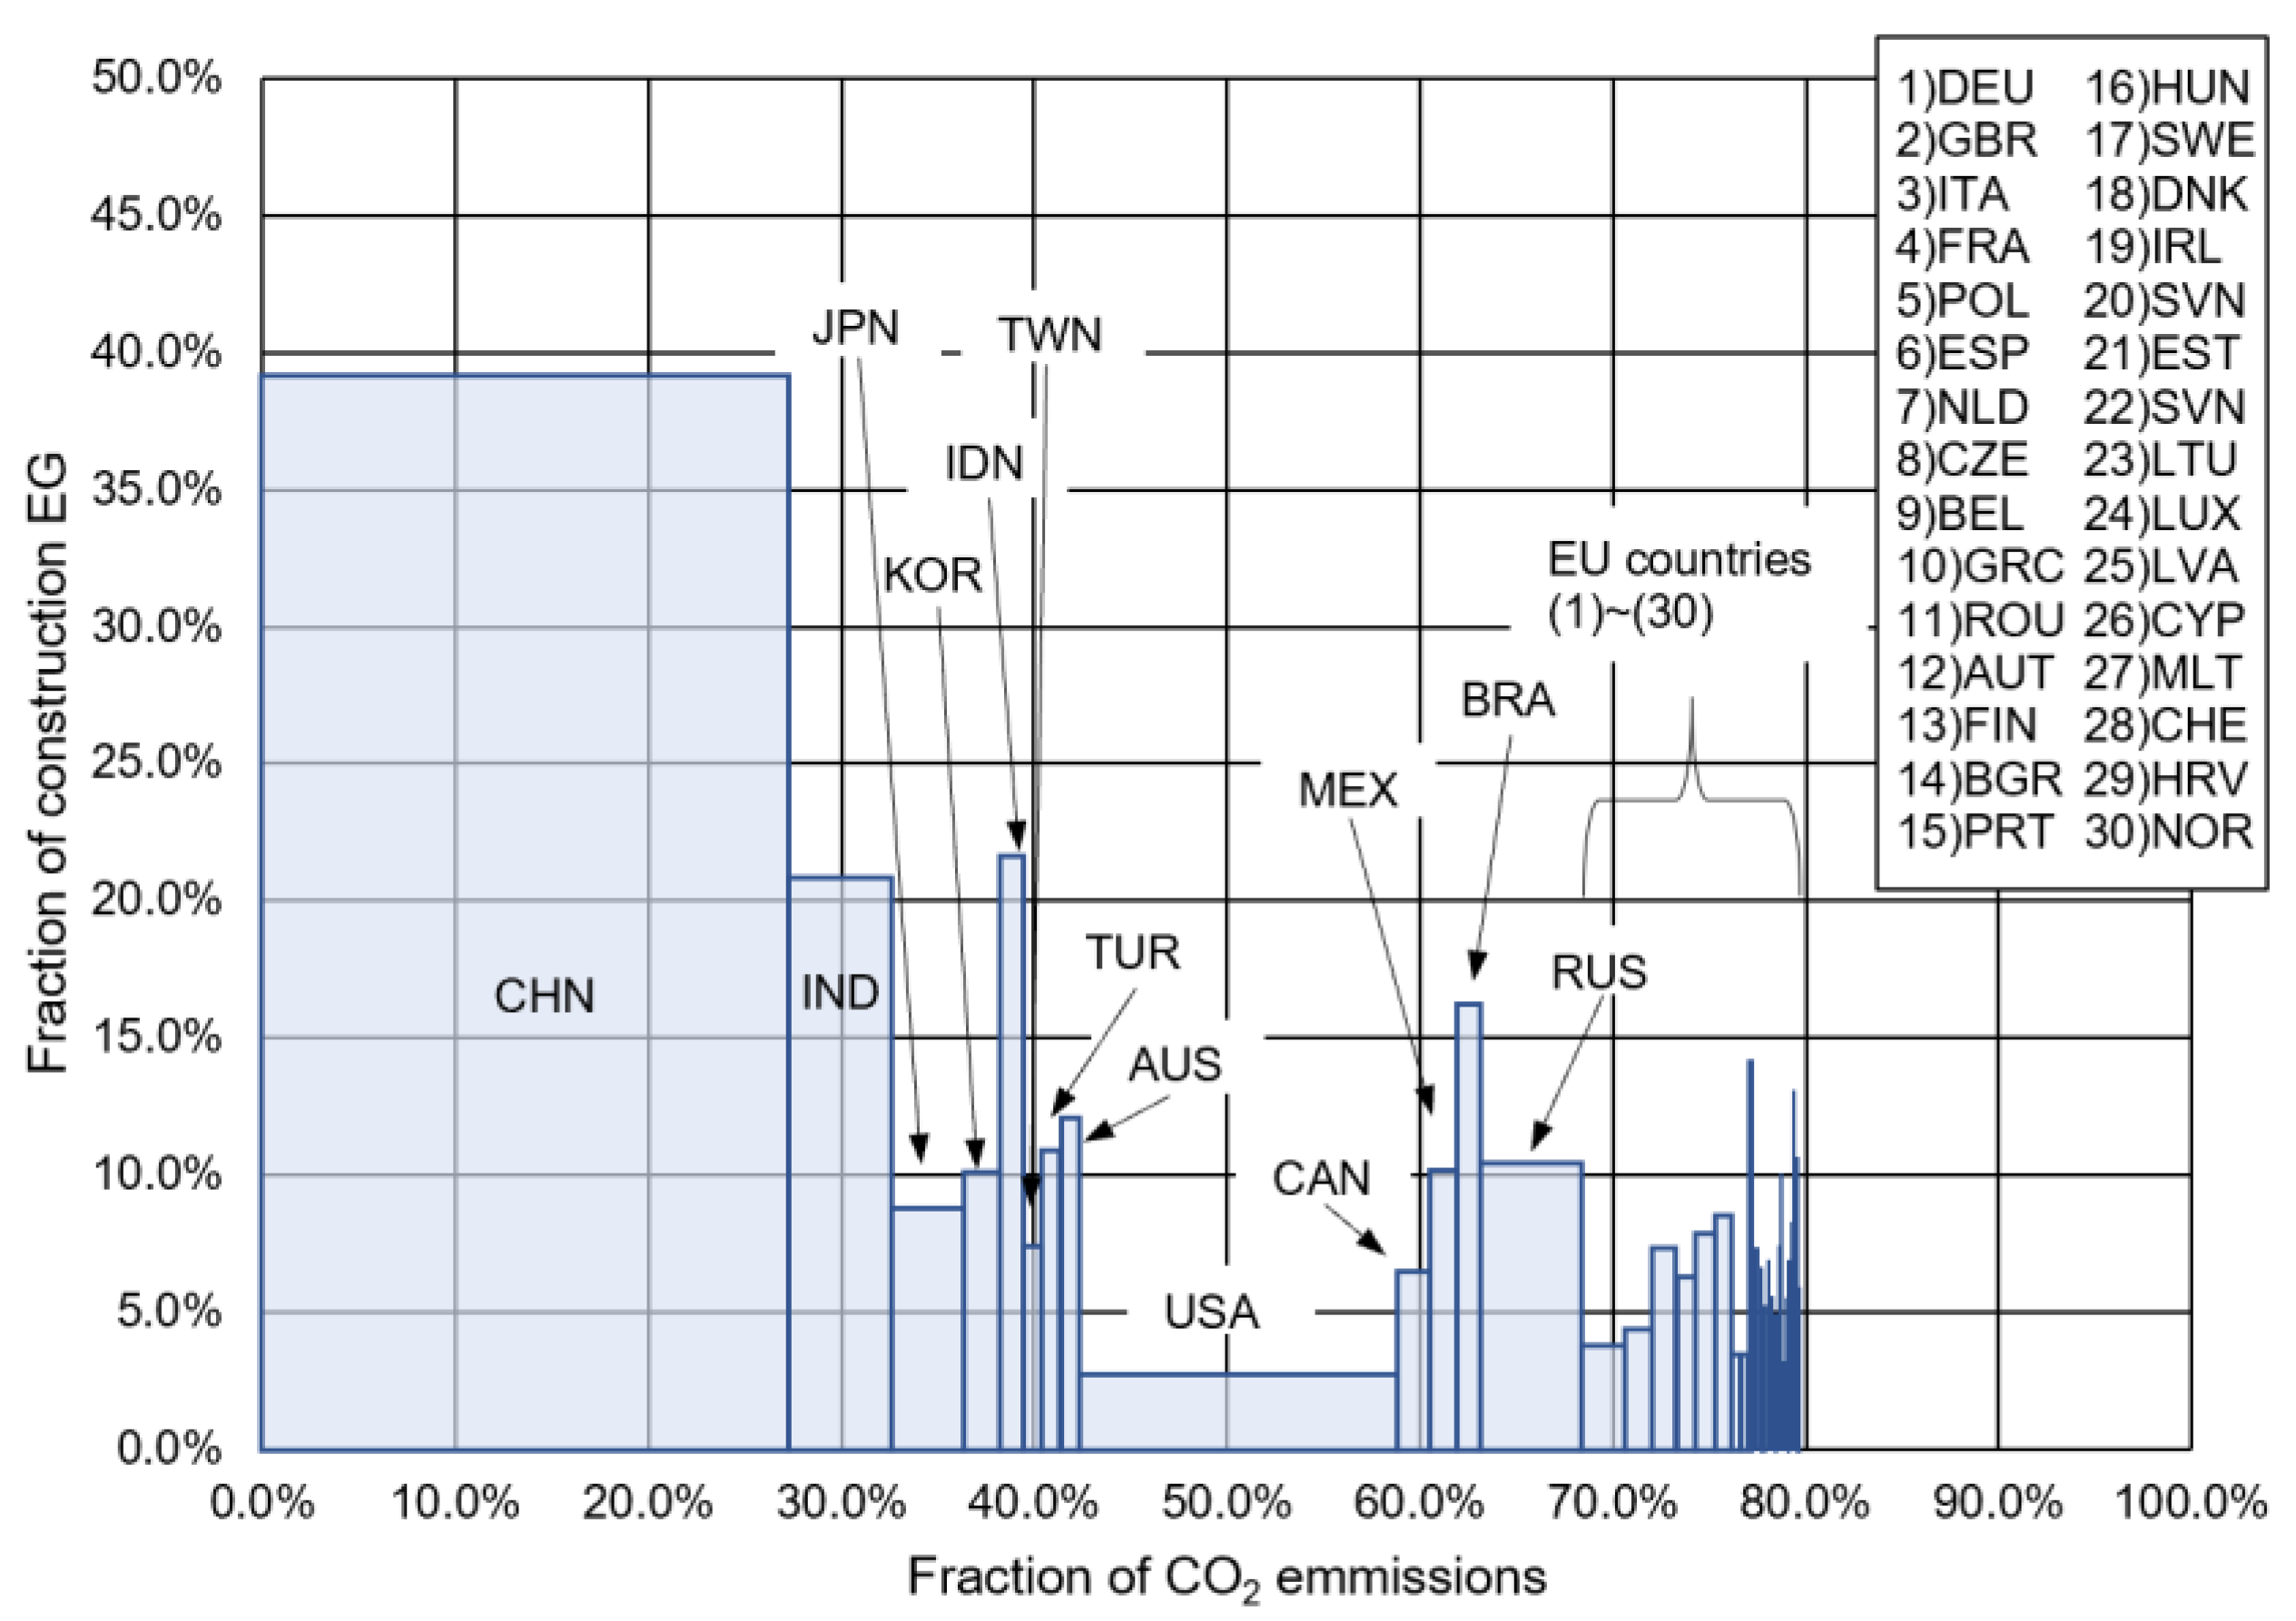
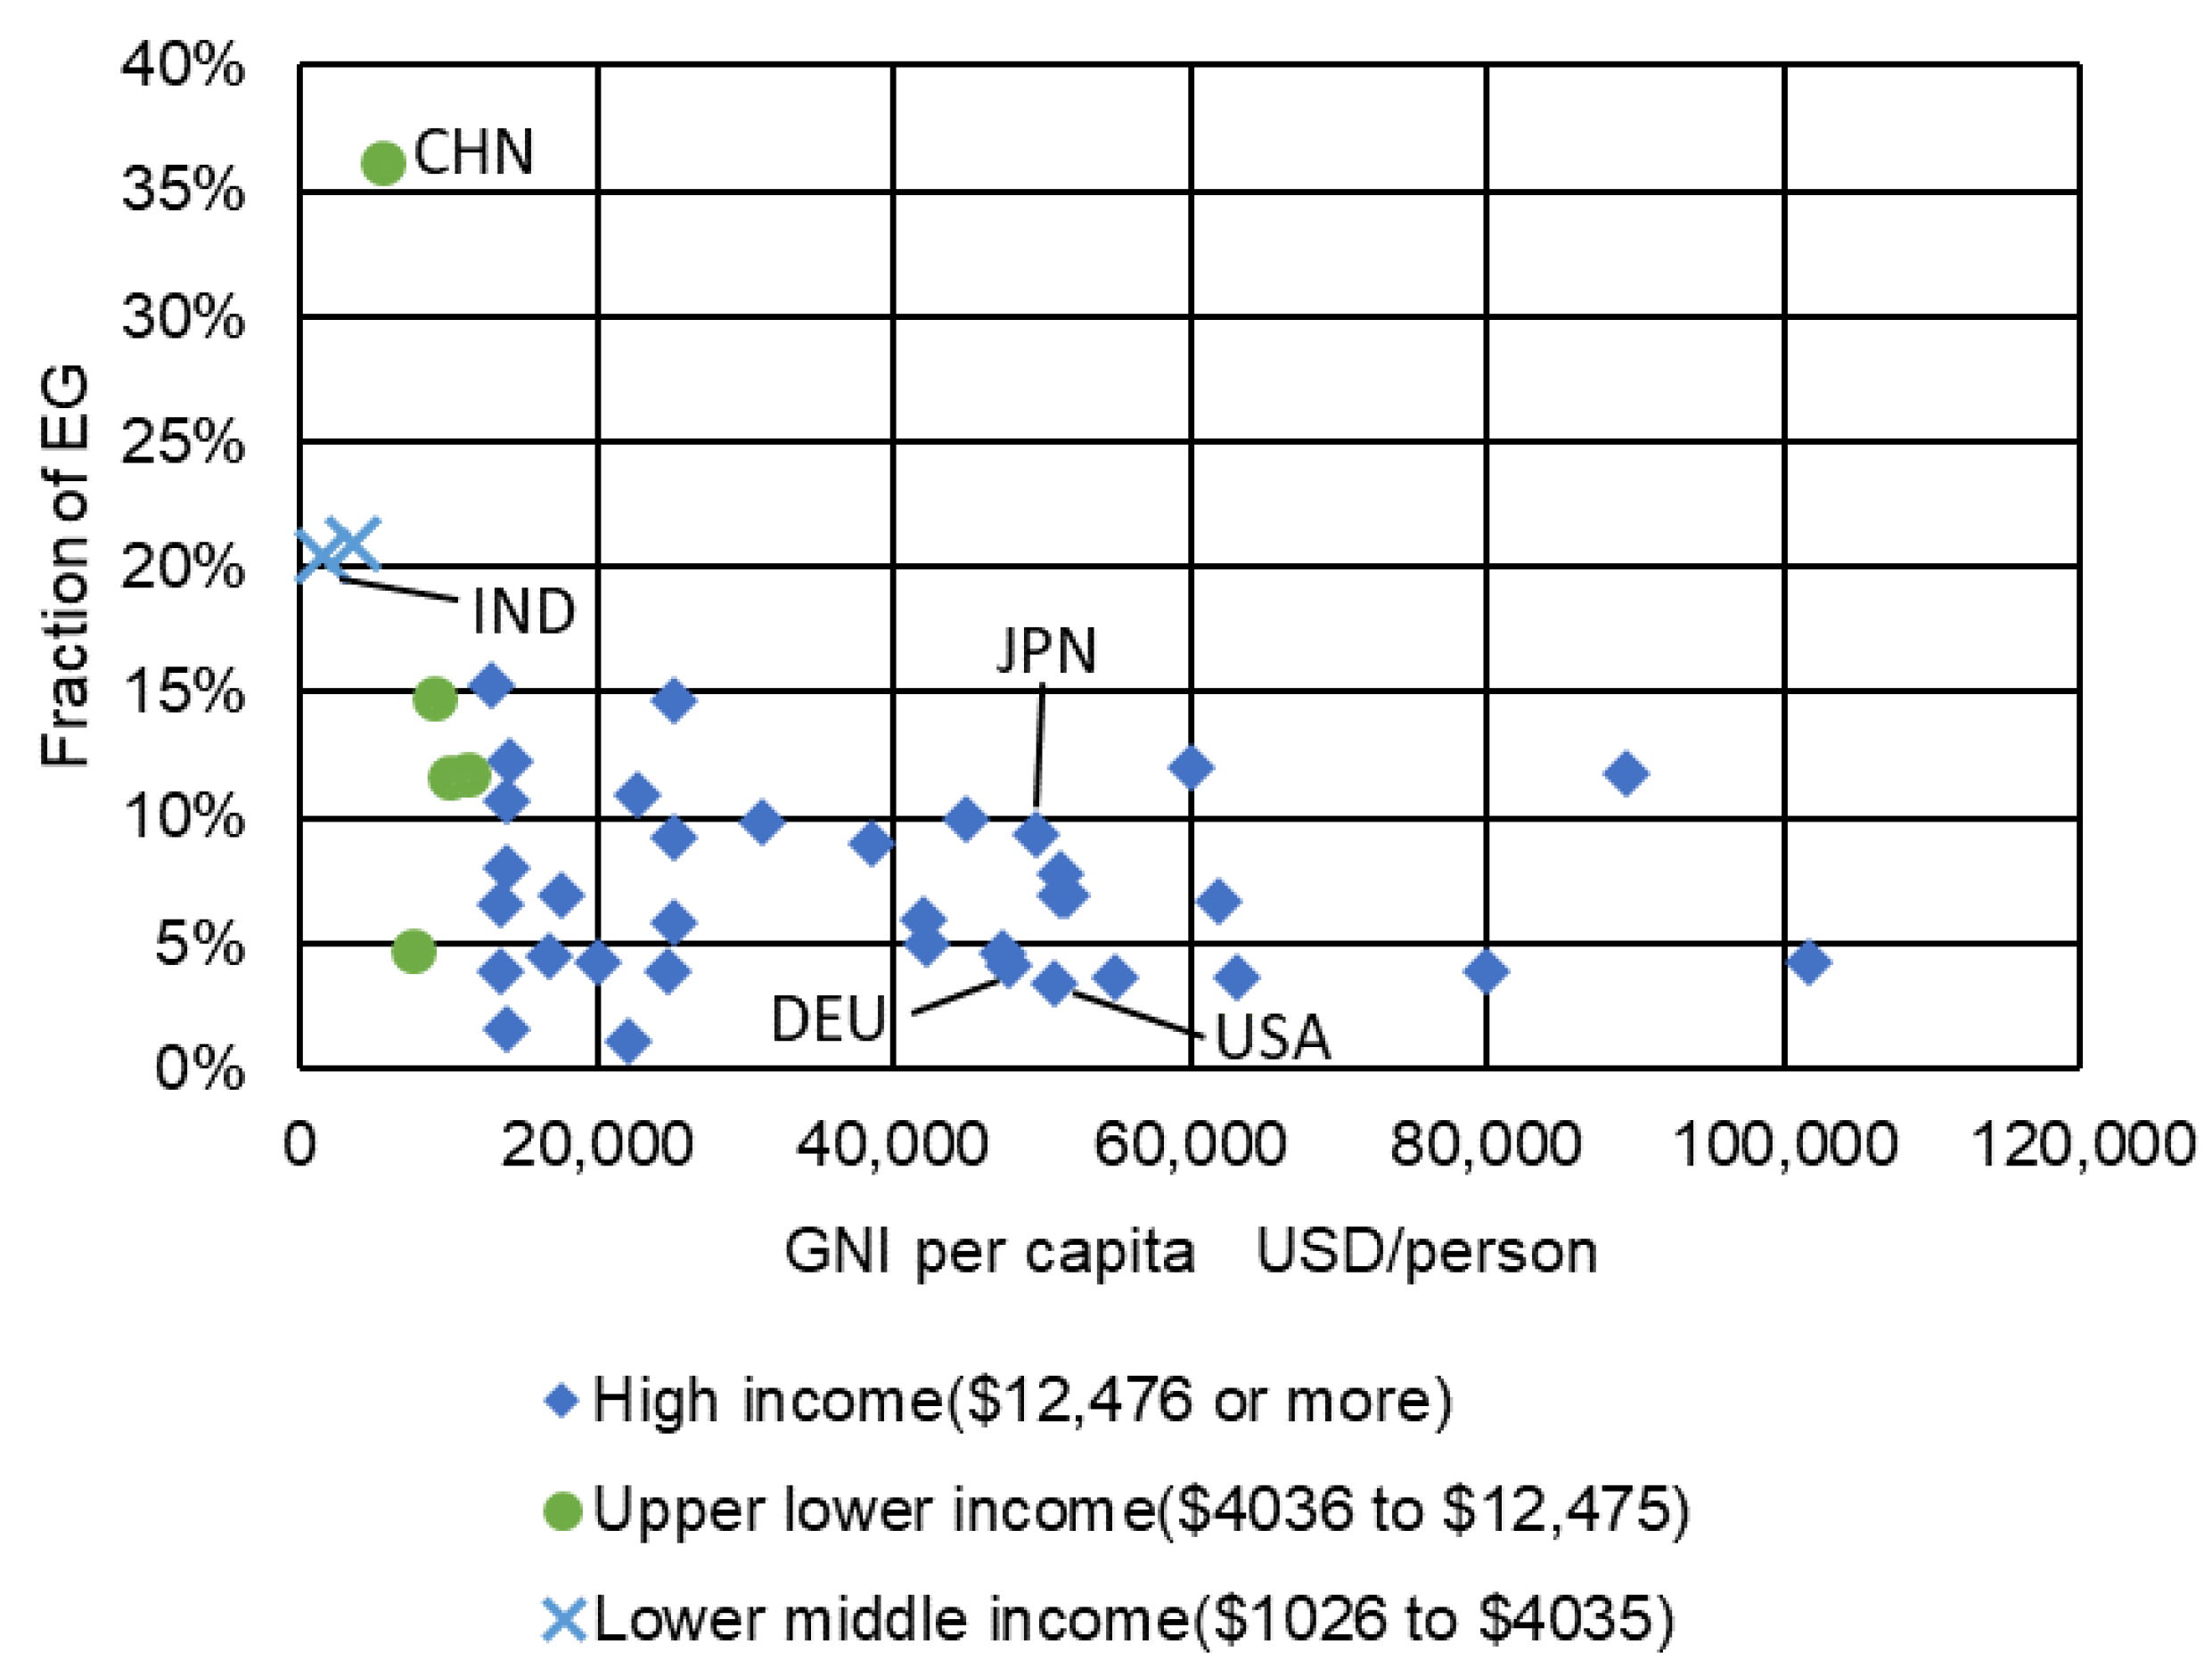
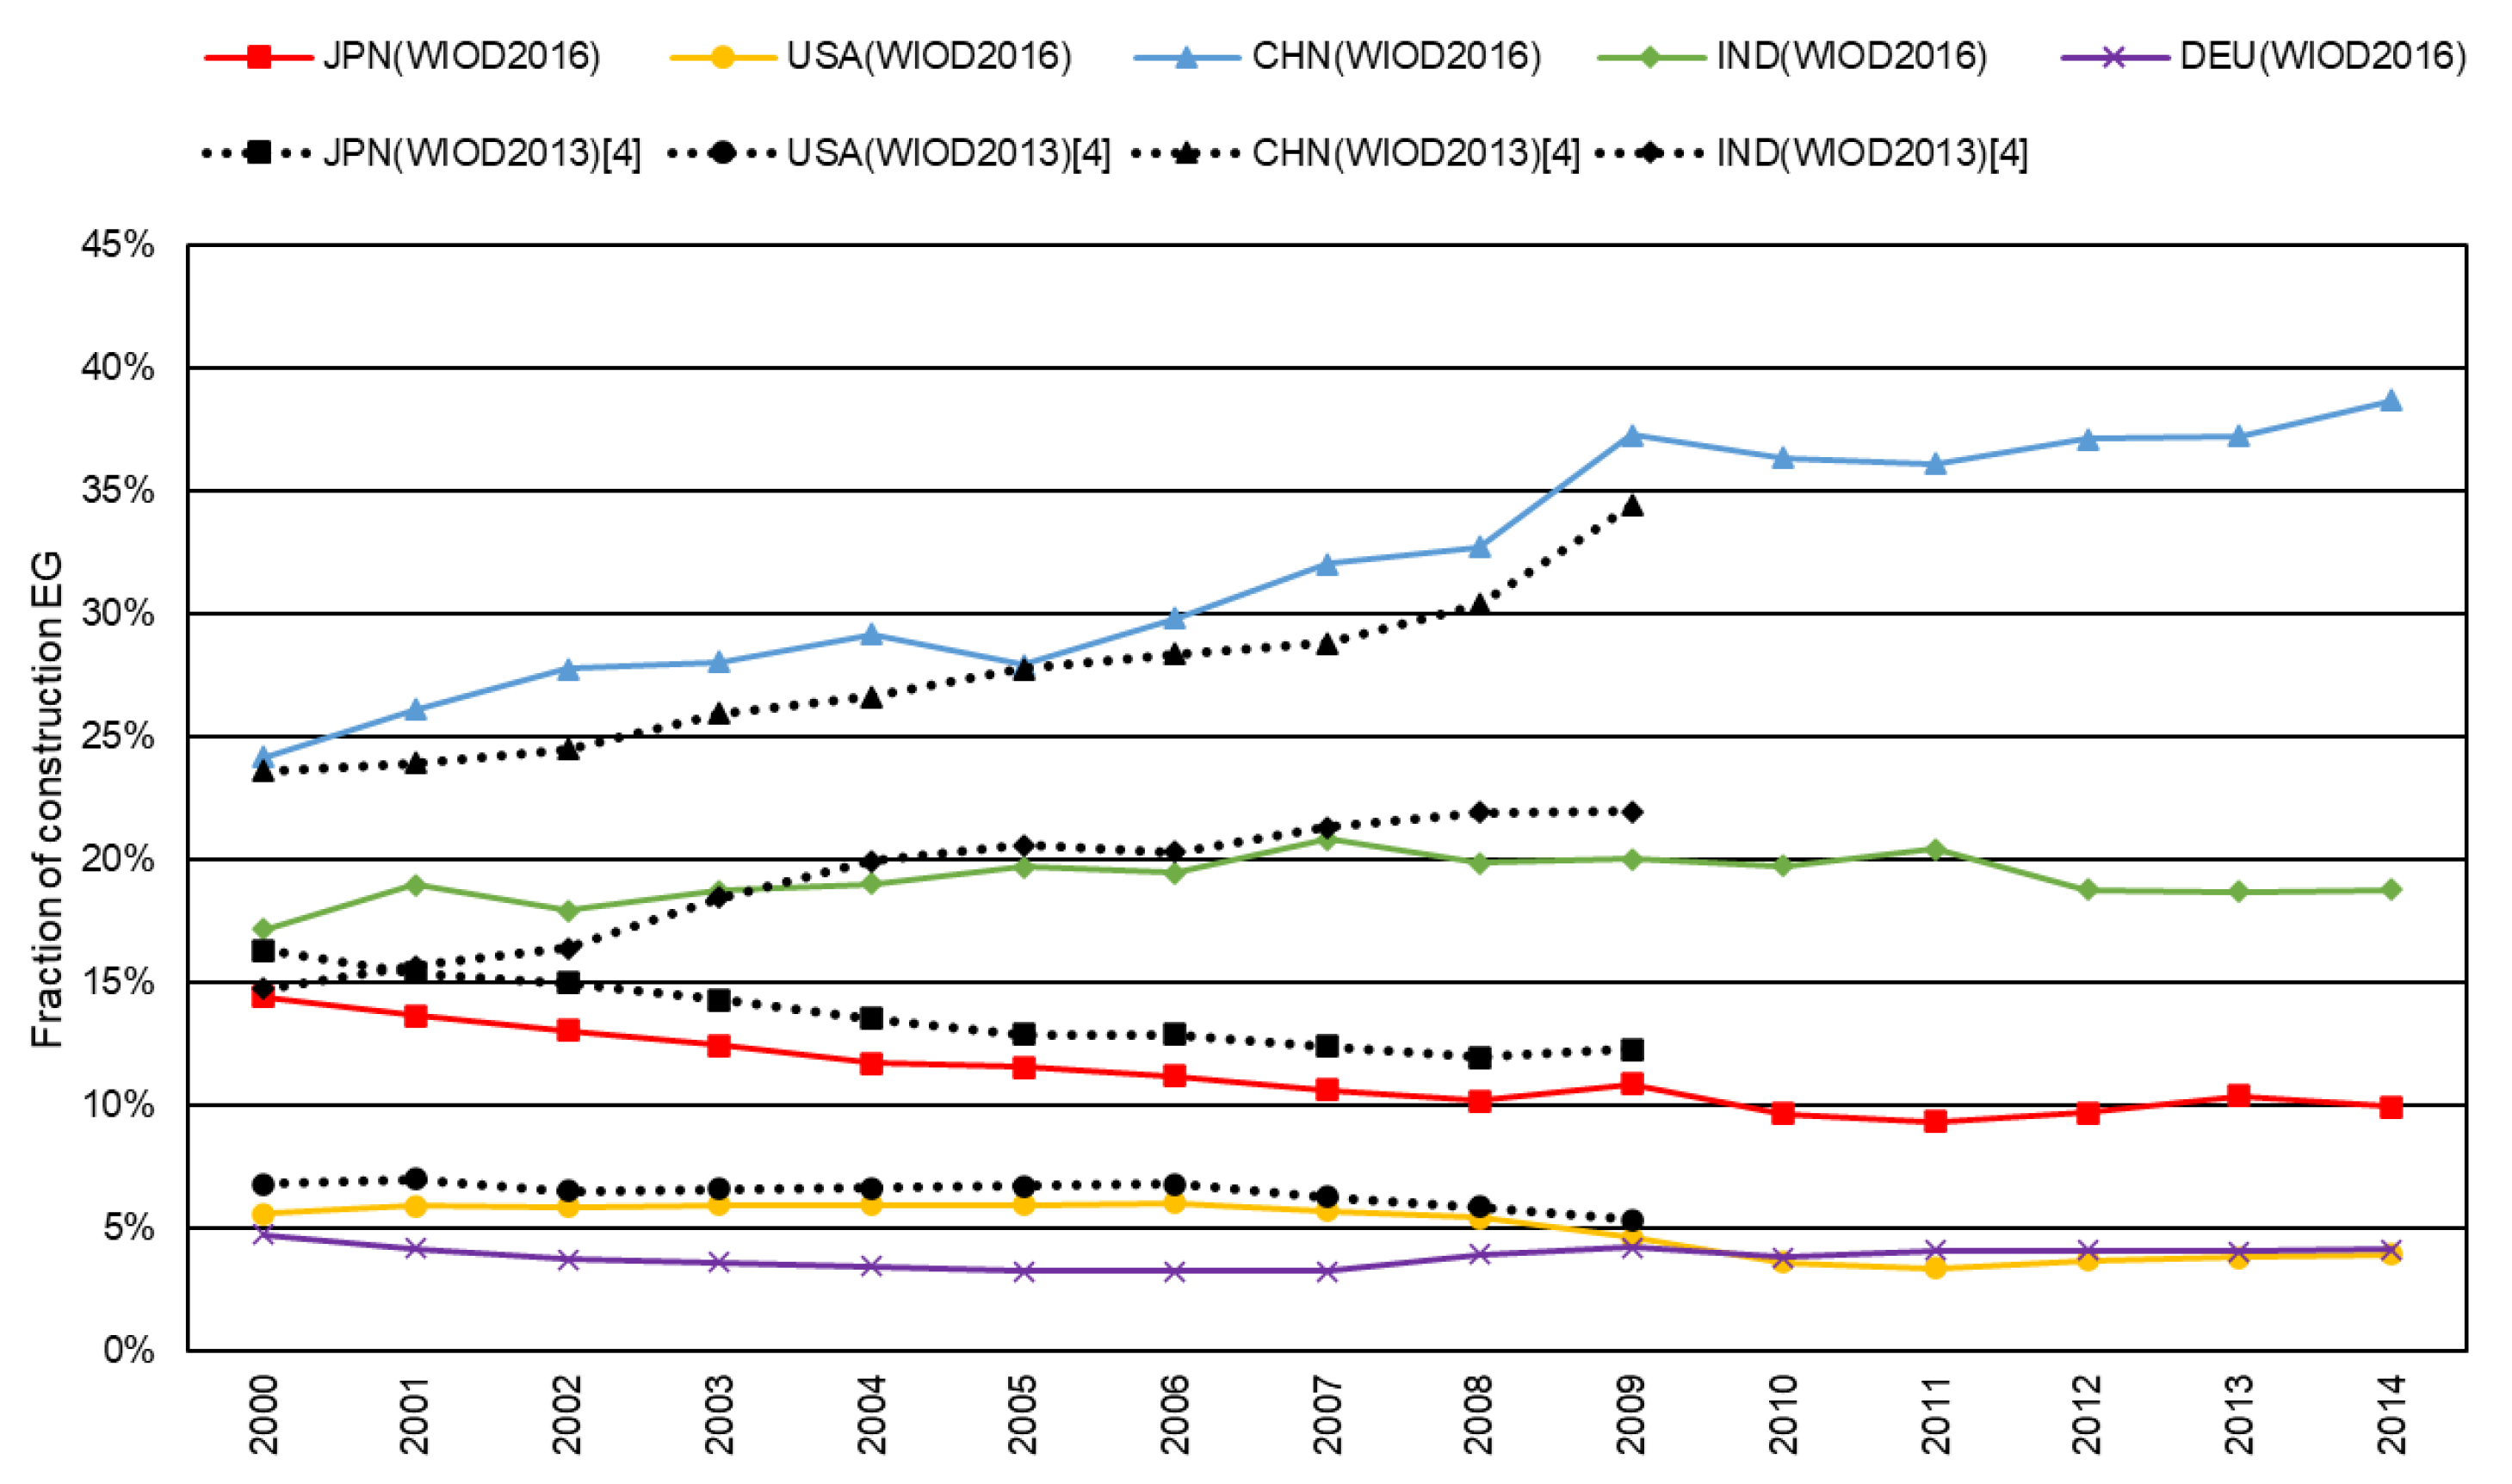
3.3. Construction EGs
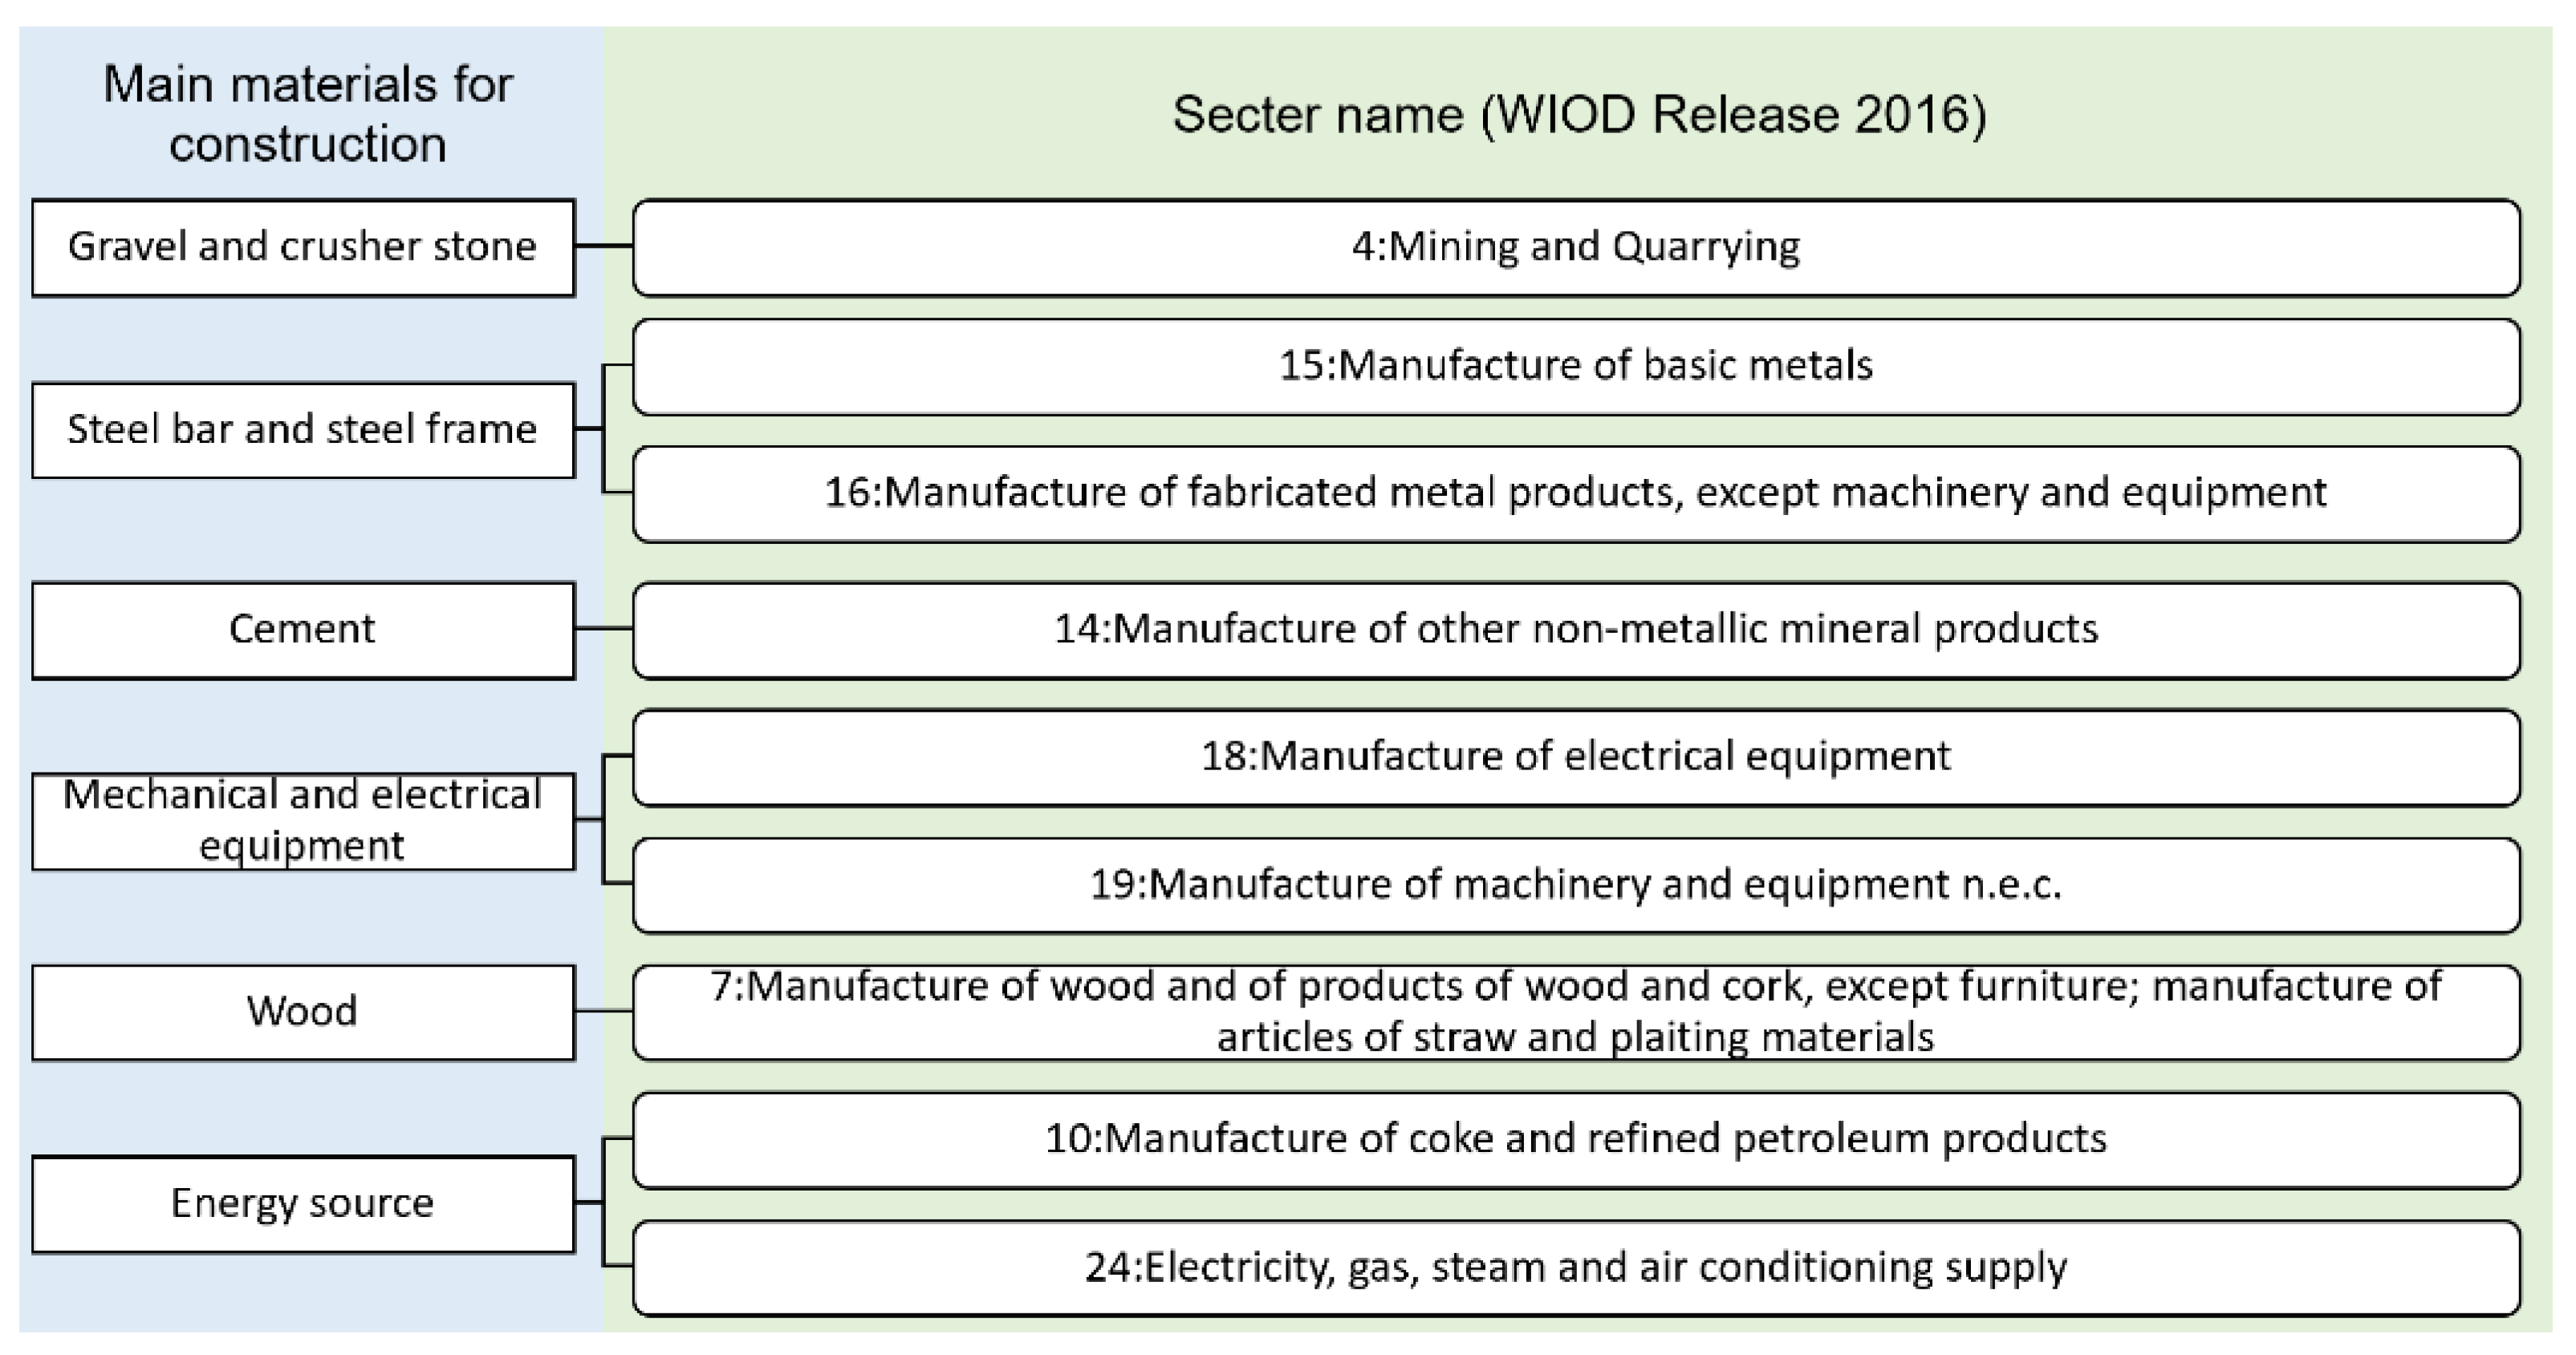
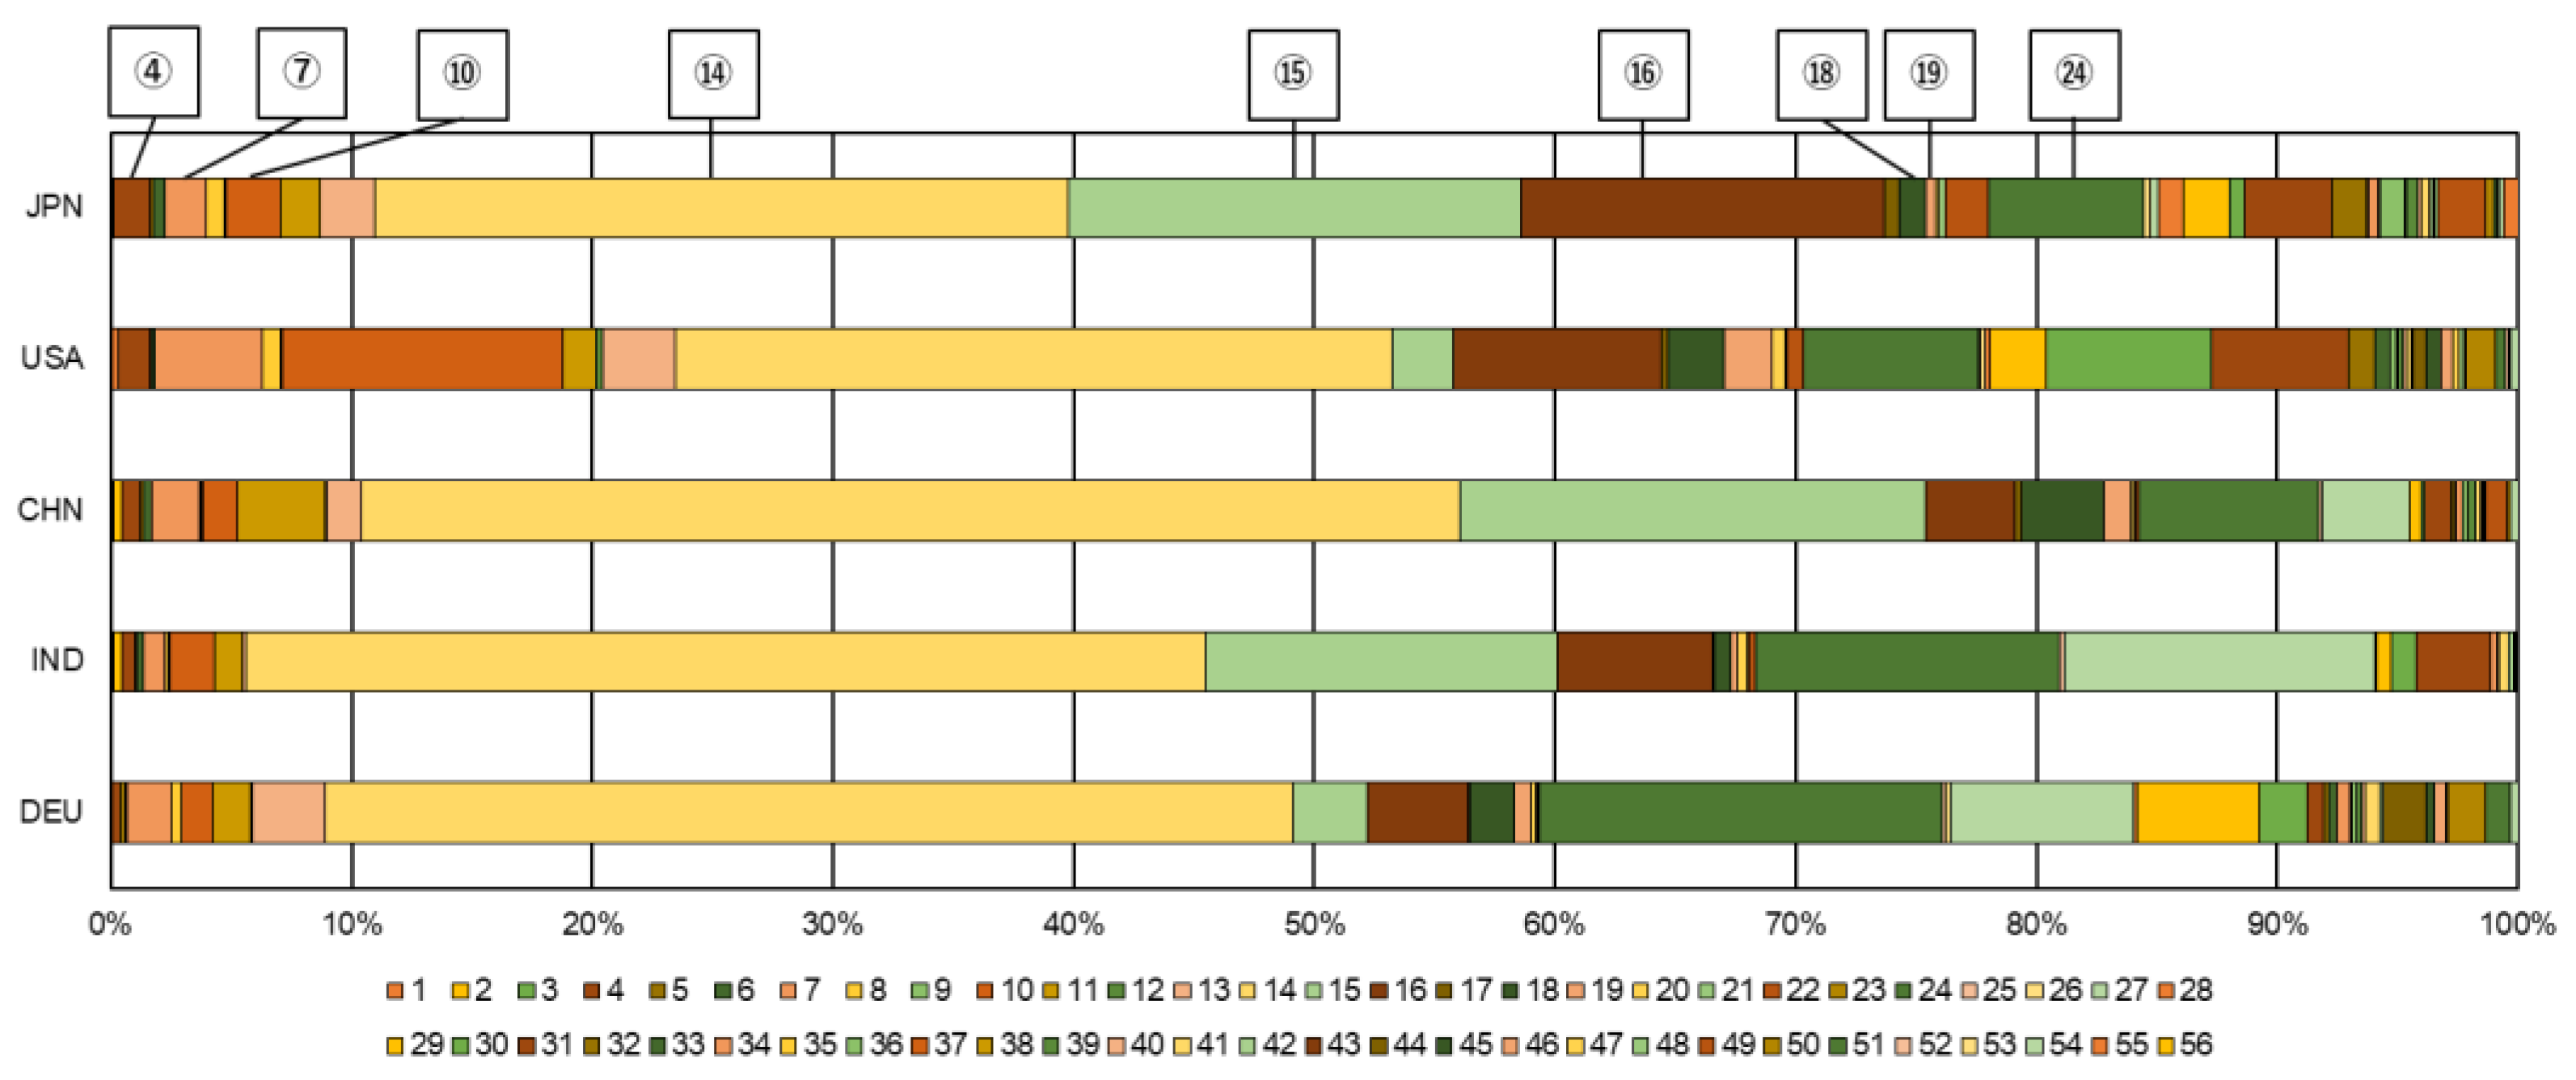
3.4. Composition of Construction EGs
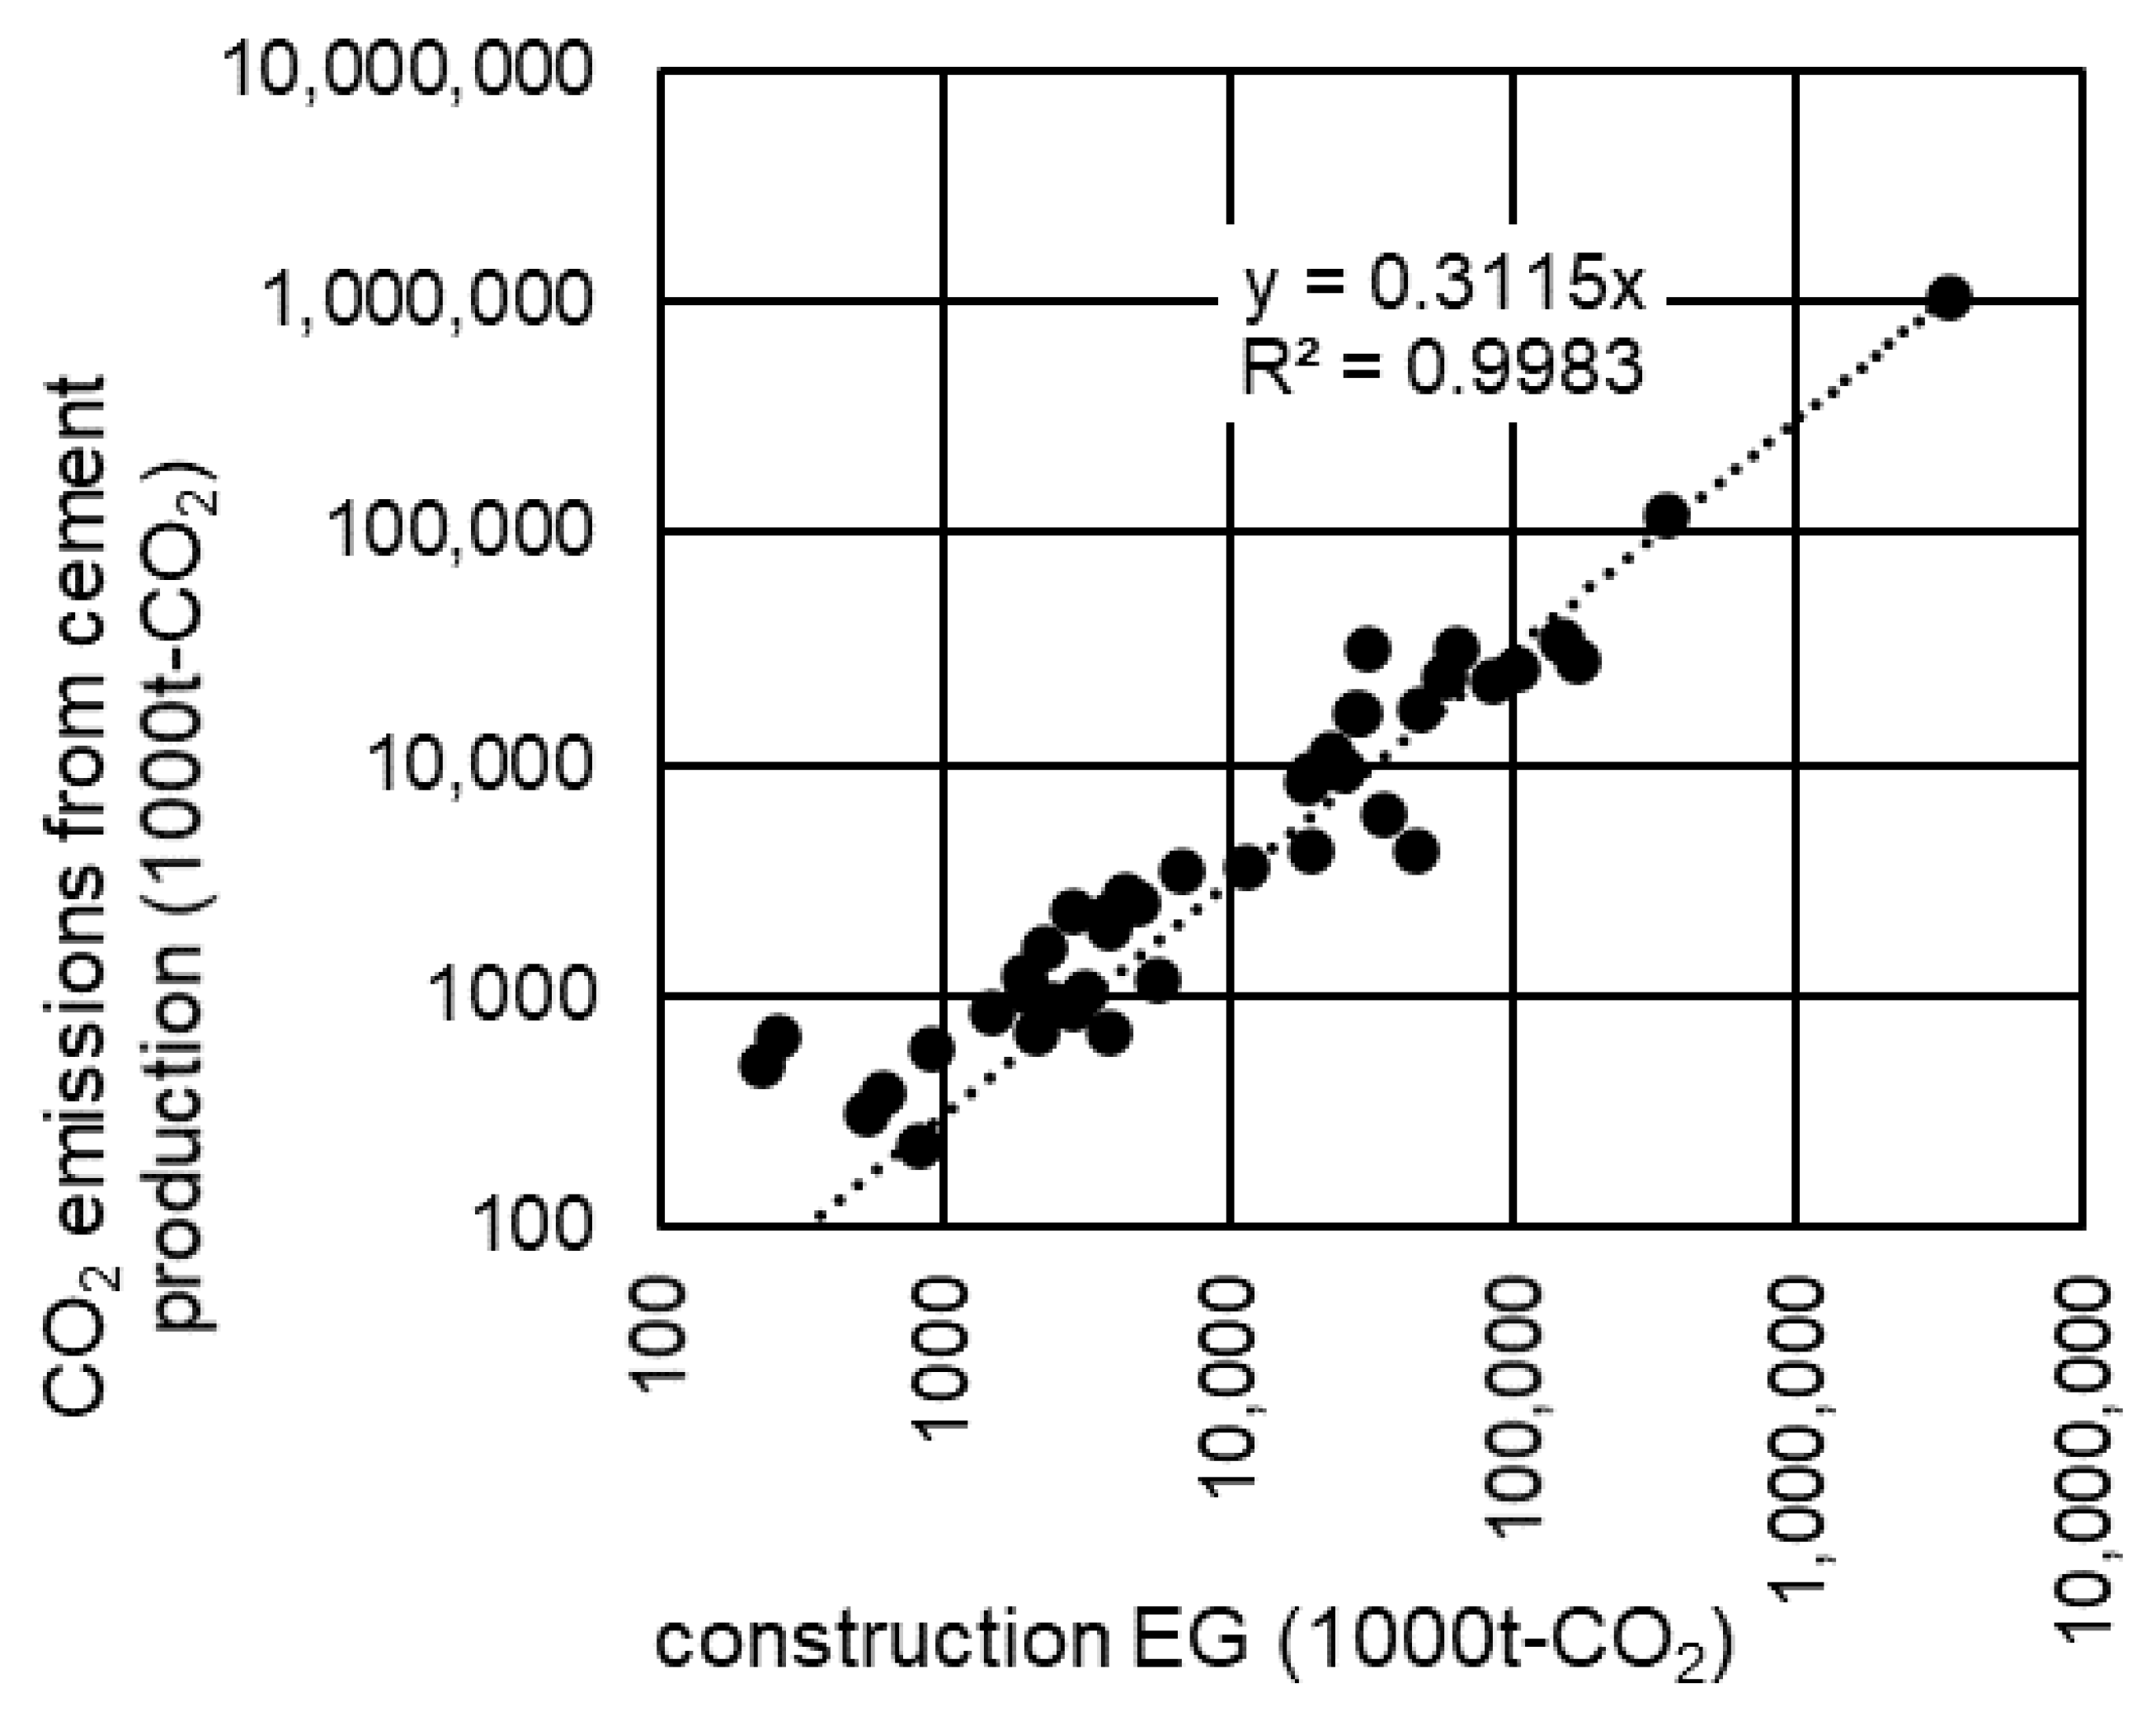
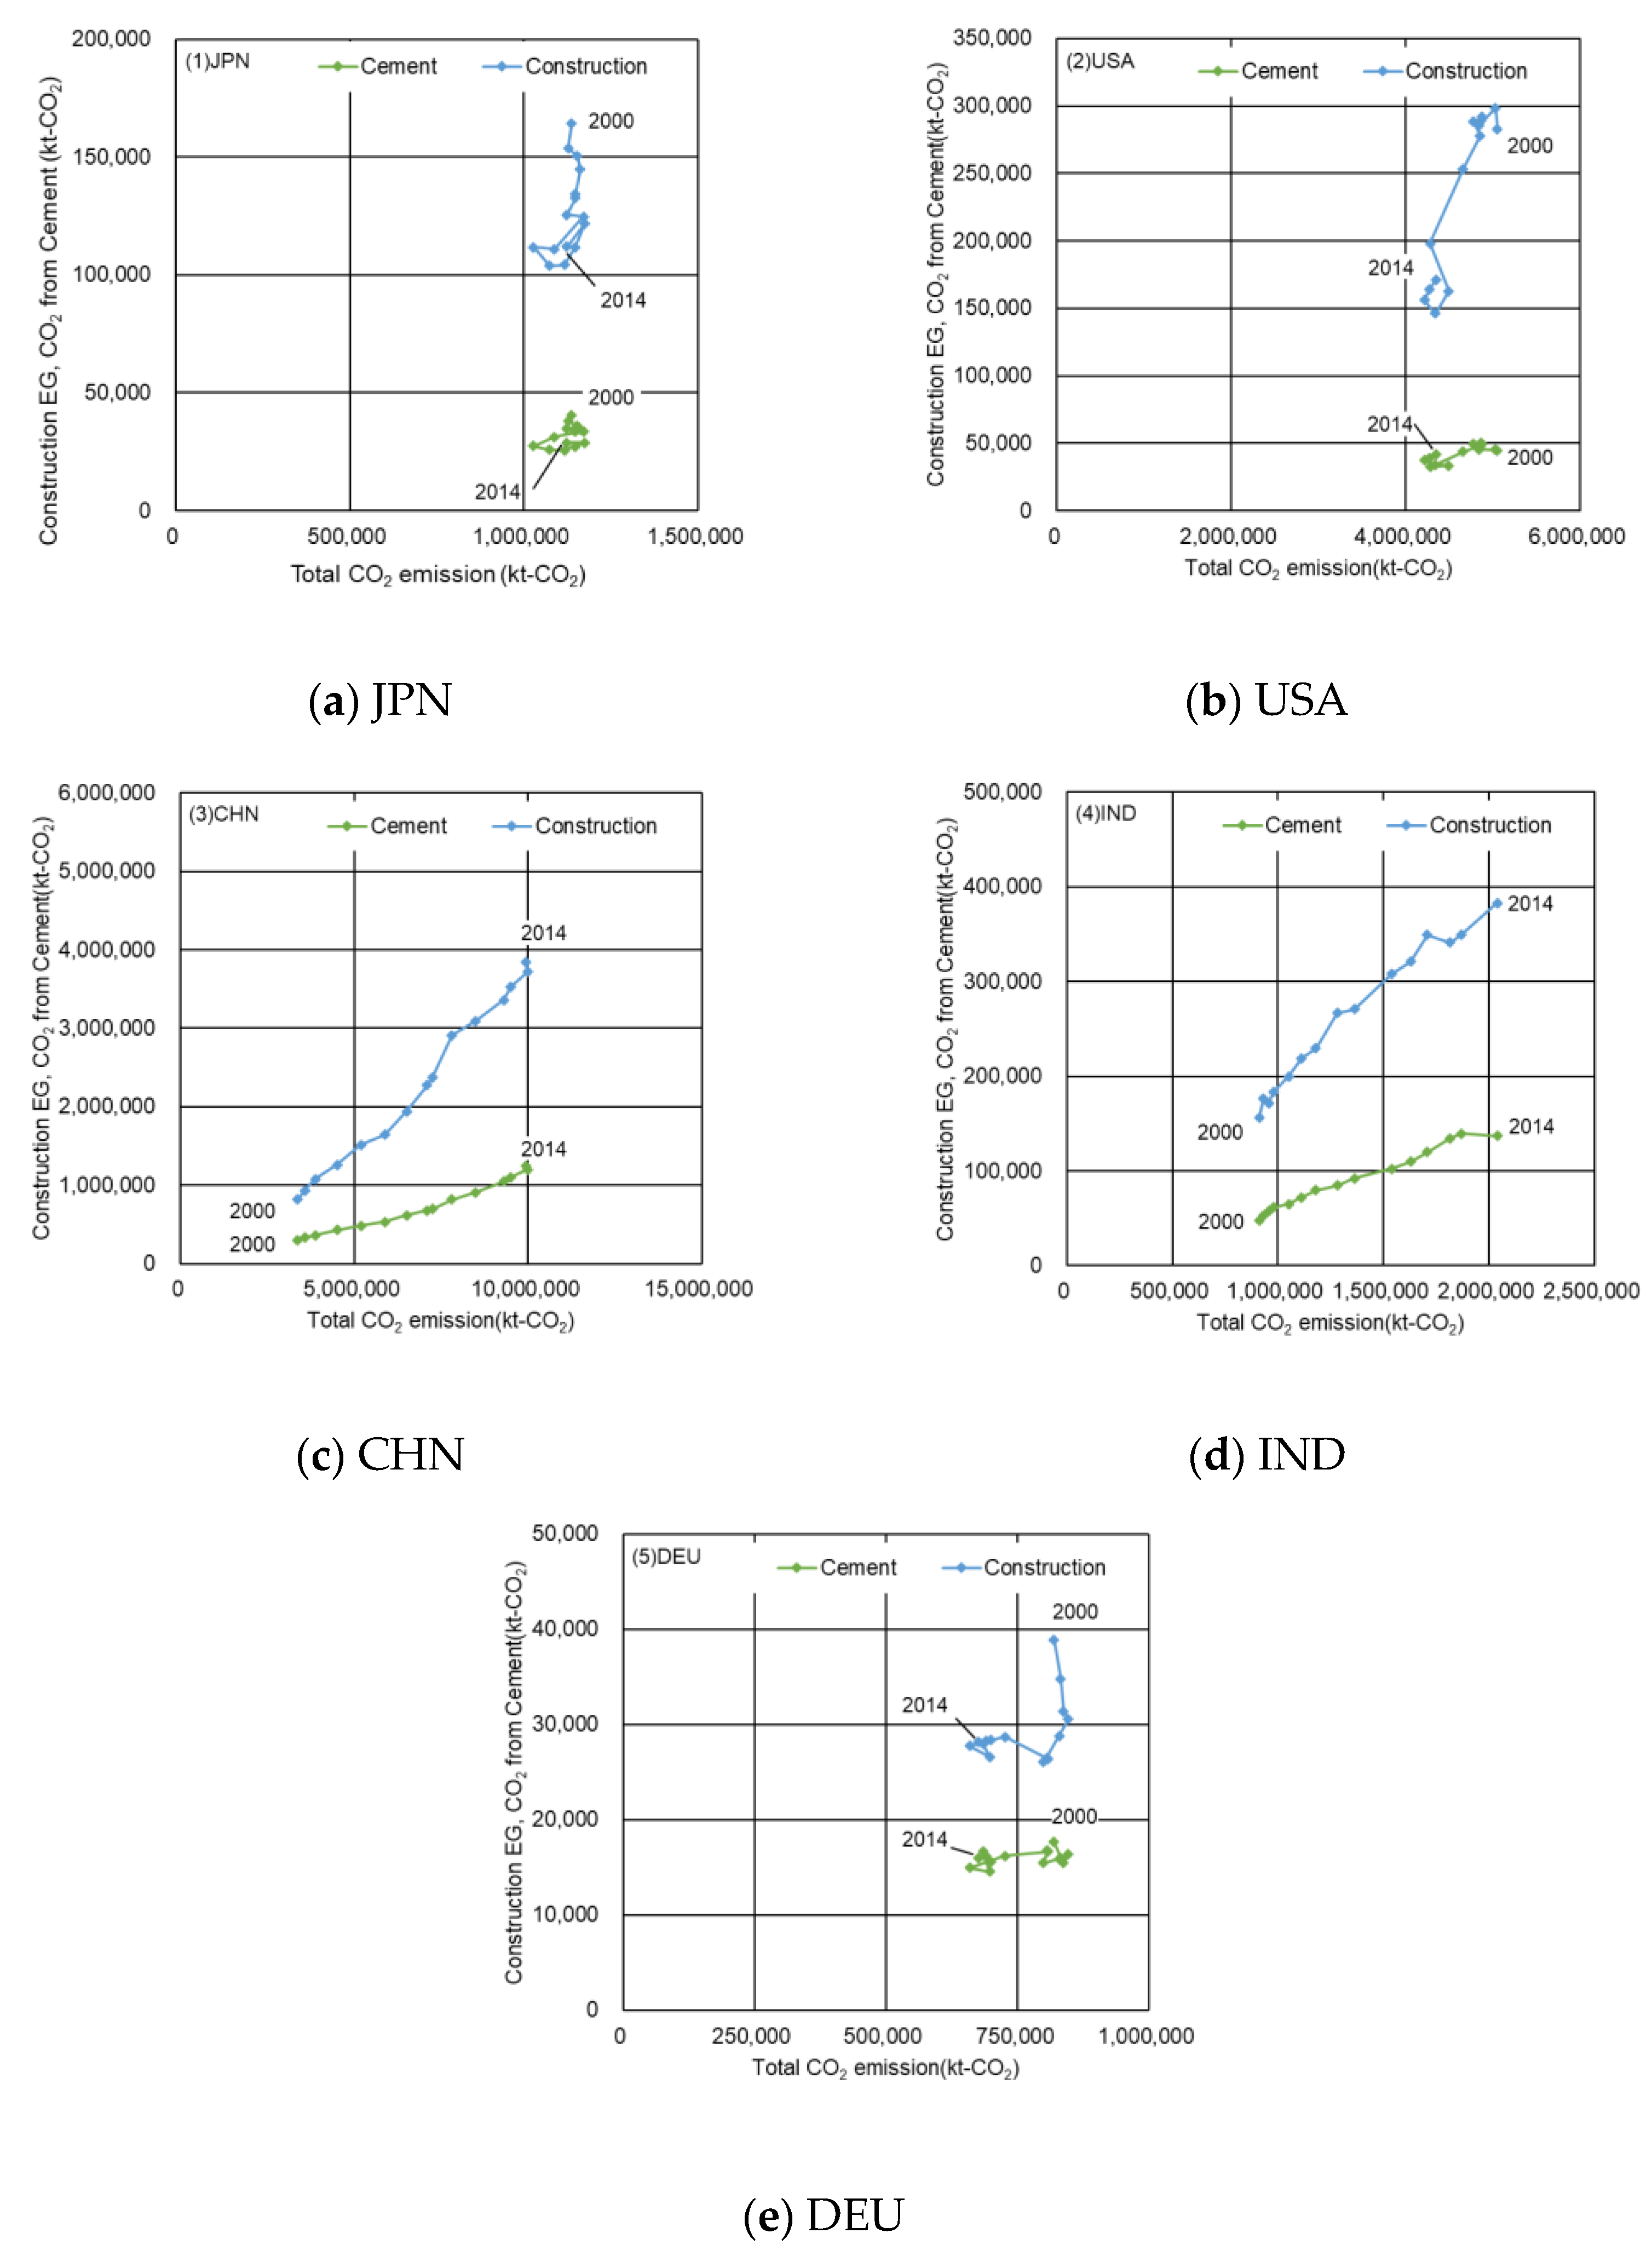
3.5. Relationship with Cement Production
3.6. Annual Variation of Construction EGs
4. Discussion
Author Contributions
Funding
Conflicts of Interest
Nomenclature
| Abbreviations | |
| ZEBs | net-zero-energy buildings |
| ZEHs | net-zero-energy houses |
| EU | European Union |
| GNI | Gross National Product |
| GHG | greenhouse gas |
| EE | embodied energy |
| EGs | embodied GHG emissions |
| EEGs | embodied energy and GHG emissions |
| WIOD | World Input-Output Database |
| IEA | International Energy Agency |
| EBC | Energy in Building and Communities |
| PEf | primary energy from fossil fuels only |
| PEnr | primary energy from fossil fuels and nuclear power |
| PEt | total primary energy from fossil fuels, nuclear power, and renewable energy |
| WIOT | world IO table |
| NIOT | national IO tables |
| USD | US dollars |
| Symbols | |
| the input coefficient for domestic goods | |
| the domestic product from sector j to sector i, million USD/year | |
| the gross domestic product (total output), million USD/year | |
| X | the gross domestic product vector, million USD/year |
| (I − Ad)−1 | the Leontief inverse matrix |
| I | the unit matrix |
| Ad | the activity matrix of the gross domestic product with as an element |
| Fd | the final demand vector of domestic goods, million USD/year |
| FE | the export vector, million USD/year |
| ICO2 | the CO2 emission basic unit vector with spillover effects per manufacturer price of 1 million USD in each industry, kg-CO2/million USD |
| CO2 | the direct CO2 emission row vector per manufacturer price of 1 million USD in each industry, kg-CO2/million USD |
| CO2i | the direct CO2 emissions per manufacturer price of 1 million USD in sector i, kg–CO2/million USD |
| SCO2i | the induced CO2 emissions from the final demand of sector i, kg–CO2/year |
| ICO2i | the CO2 emission intensity of sector i, kg-CO2/million USD |
| Fi | the final demand of sector i, million USD/year |
| Subscripts | |
| d | domestic |
| E | export |
| i | sector numbers of row |
| j | sector numbers of column |
References
- Ministry of Foreign Affairs of Japan, Paris Agreement. Available online: https://www.mofa.go.jp/mofaj/files/000197313.pdf (accessed on 8 April 2021).
- Birgisdottir, H.; Moncaster, M.; Wiberg, A.H.; Chae, C.; Yokoyama, K.; Balouktsi, M.; Seo, S.; Oka, T.; Lützkendorf, T.; Malmqvist, T. IEA EBC annex 57 ‘evaluation of embodied energy and CO2eq for building construction’. Energy Build. 2017, 154, 72–80. [Google Scholar] [CrossRef]
- Timmer, M.P.; Dietzenbacher, E.; Los, B.; Stehrer, R.; de Vries, G.J. An Illustrated User Guide to the World Input–Output Database: The Case of Global Automotive Production. Rev. Int. Econ. 2015, 23, 575–605. [Google Scholar] [CrossRef]
- Yokoyama, K. Study on worldwide embodied impacts of construction. J. Environ. Eng. 2021, 779, 101–109. (In Japanese) [Google Scholar] [CrossRef]
- IEA EBC Annex57. Available online: http://www.annex57.org/ (accessed on 7 July 2018).
- Cruz, L.; Dias, J. Energy and CO2 intensity changes in the EU-27: Decomposition into explanatory effects. Sustain. Cities Soc. 2016, 26, 486–495. [Google Scholar] [CrossRef]
- Zhang, Z.; Xi, L.; Bin, S.; Yuhuan, Z.; Song, W.; Ya, L.; Hao, L.; Yongfeng, Z.; Ashfaq, A.; Guang, S. Energy, CO2 emissions, and value added flows embodied in the international trade of the BRICS group: A comprehensive assessment. Renew. Sustain. Energy Rev. 2019, 116, 109432. [Google Scholar] [CrossRef]
- Magnus, J.; Viktoras, K.; Astrid, K. Consumption versus Technology Drivers of Global Carbon Emissions 2000–2014. Energies 2020, 13, 339. [Google Scholar]
- Fan, J.-L.; Hou, Y.-B.; Wang, Q.; Wang, C.; Wei, Y.-M. Exploring the characteristics of production-based and consumption-based carbon emissions of major economies: A multiple-dimension comparison. Appl. Energy 2016, 184, 790–799. [Google Scholar] [CrossRef]
- Zhang, L.; Liu, B.; Du, J.; Liu, C.; Wang, S. Energy, CO2 emission linkage analysis in global construction sectors: Alarming trends from 1995 to 2009 and possible repercussions. Renew Sustain. Energy Rev. 2019, 221, 863–877. [Google Scholar]
- Corsatea, T.D.; Lindner, S.; Arto, I.; Román, M.V.; Rueda-Cantuche, J.M.; Velázquez Afonso, A.; Amores, A.F.; Neuwahl, F. World Input-Output Database Environmental Accounts. In Update 2000–2016; Publications Office of the European Union: Luxembourg, 2019; JRC116234; ISBN 978-92-79-64439-9. [Google Scholar] [CrossRef]
- WORLD BANK, GNI (Current US$) Data, Last Updated Date 1 July 2020. Available online: https://data.worldbank.org/indicator/NY.GNP.MKTP.CD (accessed on 6 September 2020).
- WORLD BANK, Population, Total Data, Last Updated Date 1 July 2020. Available online: https://data.worldbank.org/indicator/SP.POP.TOTL (accessed on 6 September 2020).
- IEA, CO2 Emissions from Fuel Combustion. 2019. Available online: https://www.iea.org/subscribe-to-data-services/co2-emissions-statistics (accessed on 18 April 2020).
- Ministry of Internal Affairs and Communications Japan, 2011 Input-Output Tables for Japan. 2016. Available online: https://www.soumu.go.jp/main_content/000443188.pdf (accessed on 10 May 2021).
- WORLD BANK, Newest Country Classifications Released. 2012. Available online: https://blogs.worldbank.org/opendata/newest-country-classifications-released (accessed on 8 April 2021).
- Erik, D.; Van Der Linden, J.A. Sectoral and spatial linkages in the EC production structure. J. Reg. Sci. 1997, 37, 235–257. [Google Scholar]
- National CO2 Emissions from Fossil-Fuel Burning, Cement Manufacture, and Gas Flaring, 1751–2014. 2017. Available online: https://cdiac.ess-dive.lbl.gov/ftp/ndp030/nation.1751_2014.ems (accessed on 8 April 2021).


| No. | Item | Sectors |
|---|---|---|
| 1 | A01 | Crop and animal production, hunting and related service activities |
| 2 | A02 | Forestry and logging |
| 3 | A03 | Fishing and aquaculture |
| 4 | B | Mining and quarrying |
| 5 | C10–C12 | Manufacture of food products, beverages and tobacco products |
| 6 | C13–C15 | Manufacture of textiles, wearing apparel and leather products |
| 7 | C16 | Manufacture of wood and of products of wood and cork, except furniture; manufacture of articles of straw and plaiting materials |
| 8 | C17 | Manufacture of paper and paper products |
| 9 | C18 | Printing and reproduction of recorded media |
| 10 | C19 | Manufacture of coke and refined petroleum products |
| 11 | C20 | Manufacture of chemicals and chemical products |
| 12 | C21 | Manufacture of basic pharmaceutical products and pharmaceutical preparations |
| 13 | C22 | Manufacture of rubber and plastic products |
| 14 | C23 | Manufacture of other non-metallic mineral products |
| 15 | C24 | Manufacture of basic metals |
| 16 | C25 | Manufacture of fabricated metal products, except machinery and equipment |
| 17 | C26 | Manufacture of computer, electronic and optical products |
| 18 | C27 | Manufacture of electrical equipment |
| 19 | C28 | Manufacture of machinery and equipment n.e.c. |
| 20 | C29 | Manufacture of motor vehicles, trailers and semi-trailers |
| 21 | C30 | Manufacture of other transport equipment |
| 22 | C31–C32 | Manufacture of furniture; other manufacturing |
| 23 | C33 | Repair and installation of machinery and equipment |
| 24 | D35 | Electricity, gas, steam and air conditioning supply |
| 25 | E36 | Water collection, treatment and supply |
| 26 | E37–E39 | Sewerage; waste collection, treatment and disposal activities; materials recovery; remediation activities and other waste management services |
| 27 | F | Construction |
| 28 | G45 | Wholesale and retail trade and repair of motor vehicles and motorcycles |
| 29 | G46 | Wholesale trade, except of motor vehicles and motorcycles |
| 30 | G47 | Retail trade, except of motor vehicles and motorcycles |
| 31 | H49 | Land transport and transport via pipelines |
| 32 | H50 | Water transport |
| 33 | H51 | Air transport |
| 34 | H52 | Warehousing and support activities for transportation |
| 35 | H53 | Postal and courier activities |
| 36 | I | Accommodation and food service activities |
| 37 | J58 | Publishing activities |
| 38 | J59–J60 | Motion picture, video and television programme production, sound recording and music publishing activities; programming and broadcasting activities |
| 39 | J61 | Telecommunications |
| 40 | J62–J63 | Computer programming, consultancy and related activities; information service activities |
| 41 | K64 | Financial service activities, except insurance and pension funding |
| 42 | K65 | Insurance, reinsurance and pension funding, except compulsory social security |
| 43 | K66 | Activities auxiliary to financial services and insurance activities |
| 44 | L68 | Real estate activities |
| 45 | M69–M70 | Legal and accounting activities; activities of head offices; management consultancy activities |
| 46 | M71 | Architectural and engineering activities; technical testing and analysis |
| 47 | M72 | Scientific research and development |
| 48 | M73 | Advertising and market research |
| 49 | M74–M75 | Other professional, scientific and technical activities; veterinary activities |
| 50 | N | Administrative and support service activities |
| 51 | O84 | Public administration and defence; compulsory social security |
| 52 | P85 | Education |
| 53 | Q | Human health and social work activities |
| 54 | R–S | Other service activities |
| 55 | T | Activities of households as employers; undifferentiated goods- and services-producing activities of households for own use |
| 56 | U | Activities of extraterritorial organizations and bodies |
| No. | Country Code | GNI (Billion USD) | GNI per Capita (USD) | CO2 Emission (×106 t-CO2) | Ratio (%) |
|---|---|---|---|---|---|
| 1 | CHN | 7481.12 | 5565.77 | 8570.93 | 27.3 |
| 2 | USA | 15,832.21 | 50,816.43 | 5128.18 | 16.3 |
| 3 | IND | 1807.02 | 1445.28 | 1667.76 | 5.3 |
| 4 | RUS | 1985.53 | 13,888.60 | 1607.95 | 5.1 |
| 5 | JPN | 6331.88 | 49,532.44 | 1183.49 | 3.8 |
| 6 | DEU | 3840.29 | 47,839.23 | 731.22 | 2.3 |
| 7 | KOR | 1260.98 | 25,251.61 | 573.76 | 1.8 |
| 8 | CAN | 1758.97 | 51,223.17 | 541.16 | 1.7 |
| 9 | MEX | 1161.74 | 10,041.39 | 456.46 | 1.5 |
| 10 | GBR | 2669.89 | 42,205.76 | 439.18 | 1.4 |
| 11 | BRA | 2548.97 | 12,905.24 | 391.09 | 1.2 |
| 12 | IDN | 868.24 | 3542.15 | 390.32 | 1.2 |
| 13 | ITA | 2286.19 | 38,501.44 | 384.11 | 1.2 |
| 14 | AUS | 1340.59 | 60,008.33 | 382.11 | 1.2 |
| 15 | FRA | 2937.48 | 44,954.91 | 322.27 | 1.0 |
| 16 | POL | 511.68 | 13,442.95 | 303.19 | 1.0 |
| 17 | TUR | 825.27 | 11,236.81 | 287.20 | 0.9 |
| 18 | ESP | 1452.68 | 31,078.16 | 264.87 | 0.8 |
| 19 | TWN | - | - | 255.46 | 0.8 |
| 20 | NLD | 916.73 | 54,917.08 | 158.41 | 0.5 |
| 21 | CZE | 210.69 | 20,072.81 | 109.32 | 0.3 |
| 22 | BEL | 523.48 | 47,424.28 | 92.81 | 0.3 |
| 23 | GRC | 279.94 | 25,208.71 | 82.12 | 0.3 |
| 24 | ROU | 181.11 | 8989.08 | 80.86 | 0.3 |
| 25 | AUT | 432.57 | 51,548.18 | 67.01 | 0.2 |
| 26 | FIN | 276.30 | 51,277.56 | 54.56 | 0.2 |
| 27 | BGR | 55.56 | 7560.80 | 49.17 | 0.2 |
| 28 | PRT | 240.83 | 22,811.21 | 47.05 | 0.1 |
| 29 | HUN | 134.32 | 13,470.15 | 46.34 | 0.1 |
| 30 | SWE | 584.48 | 61,855.31 | 42.35 | 0.1 |
| 31 | DNK | 351.26 | 63,055.84 | 42.06 | 0.1 |
| 32 | CHE | 707.65 | 89,435.44 | 39.23 | 0.1 |
| 33 | NOR | 503.52 | 101,657.40 | 36.22 | 0.1 |
| 34 | IRL | 192.53 | 42,036.42 | 35.38 | 0.1 |
| 35 | SVK | 95.59 | 17,706.25 | 32.85 | 0.1 |
| 36 | HRV | 60.31 | 14,089.97 | 17.95 | 0.1 |
| 37 | EST | 22.21 | 16,732.11 | 17.63 | 0.1 |
| 38 | SVN | 50.82 | 24,754.46 | 15.43 | 0.0 |
| 39 | LTU | 42.19 | 13,933.23 | 11.53 | 0.0 |
| 40 | LUX | 41.43 | 79,927.99 | 10.51 | 0.0 |
| 41 | LVA | 28.46 | 13,818.00 | 7.34 | 0.0 |
| 42 | CYP | 28.29 | 25,151.79 | 7.00 | 0.0 |
| 43 | MLT | 9.21 | 22,117.24 | 2.57 | 0.0 |
| Other countries | 6406.16 | 20.4 | |||
| All of the world | 31,392.58 | 100.0 | |||
| No. | Sectors | CO2 Emission Intensity (t-CO2/Million USD) | CO2 Emission by Sector (t-CO2) | Ratio (%) |
|---|---|---|---|---|
| 1 | Crop and animal production, hunting and related service activities | 135 | 4,919,168 | 0.44 |
| 2 | Forestry and logging | 107 | 116,275 | 0.01 |
| 3 | Fishing and aquaculture | 213 | 541,109 | 0.05 |
| 4 | Mining and quarrying | 651 | 444,719 | 0.04 |
| 5 | Manufacture of food products, beverages and tobacco products | 157 | 40,997,531 | 3.67 |
| 6 | Manufacture of textiles, wearing apparel and leather products | 268 | 4,162,533 | 0.37 |
| 7 | Manufacture of wood and of products of wood and cork, except furniture; manufacture of articles of straw and plaiting materials | 135 | 32,947 | 0.00 |
| 8 | Manufacture of paper and paper products | 393 | 3,158,788 | 0.28 |
| 9 | Printing and reproduction of recorded media | 152 | 207,932 | 0.02 |
| 10 | Manufacture of coke and refined petroleum products | 269 | 21,557,835 | 1.93 |
| 11 | Manufacture of chemicals and chemical products | 497 | 42,722,640 | 3.83 |
| 12 | Manufacture of basic pharmaceutical products and pharmaceutical preparations | 131 | 1,406,607 | 0.13 |
| 13 | Manufacture of rubber and plastic products | 274 | 9,628,872 | 0.86 |
| 14 | Manufacture of other non-metallic mineral products | 982 | 14,135,752 | 1.27 |
| 15 | Manufacture of basic metals | 895 | 70,290,173 | 6.30 |
| 16 | Manufacture of fabricated metal products, except machinery and equipment | 323 | 26,602,346 | 2.38 |
| 17 | Manufacture of computer, electronic and optical products | 178 | 31,547,894 | 2.83 |
| 18 | Manufacture of electrical equipment | 248 | 30,793,610 | 2.76 |
| 19 | Manufacture of machinery and equipment n.e.c. | 198 | 34,171,918 | 3.06 |
| 20 | Manufacture of motor vehicles, trailers and semi-trailers | 211 | 50,125,125 | 4.49 |
| 21 | Manufacture of other transport equipment | 230 | 11,692,167 | 1.05 |
| 22 | Manufacture of furniture; other manufacturing | 248 | 5,639,812 | 0.51 |
| 23 | Repair and installation of machinery and equipment | 0 | 0 | 0.00 |
| 24 | Electricity, gas, steam and air conditioning supply | 2009 | 151,250,059 | 13.55 |
| 25 | Water collection, treatment and supply | 91 | 1,100,709 | 0.10 |
| 26 | Sewerage; waste collection, treatment and disposal activities; materials recovery; remediation activities and other waste management services | 398 | 770,038 | 0.07 |
| 27 | Construction | 167 | 104,337,632 | 9.35 |
| 28 | Wholesale and retail trade and repair of motor vehicles and motorcycles | 137 | 5,022,185 | 0.45 |
| 29 | Wholesale trade, except of motor vehicles and motorcycles | 68 | 22,968,291 | 2.06 |
| 30 | Retail trade, except of motor vehicles and motorcycles | 142 | 48,340,521 | 4.33 |
| 31 | Land transport and transport via pipelines | 228 | 29,826,951 | 2.67 |
| 32 | Water transport | 1569 | 58,658,307 | 5.26 |
| 33 | Air transport | 409 | 10,734,638 | 0.96 |
| 34 | Warehousing and support activities for transportation | 142 | 4,134,704 | 0.37 |
| 35 | Postal and courier activities | 120 | 334,482 | 0.03 |
| 36 | Accommodation and food service activities | 159 | 43,740,026 | 3.92 |
| 37 | Publishing activities | 131 | 1,275,492 | 0.11 |
| 38 | Motion picture, video and television programme production, sound recording and music publishing activities; programming and broadcasting activities | 87 | 1,028,811 | 0.09 |
| 39 | Telecommunications | 65 | 6,364,287 | 0.57 |
| 40 | Computer programming, consultancy and related activities; information service activities | 67 | 6,104,915 | 0.55 |
| 41 | Financial service activities, except insurance and pension funding | 42 | 1,658,484 | 0.15 |
| 42 | Insurance, reinsurance and pension funding, except compulsory social security | 64 | 6,951,031 | 0.62 |
| 43 | Activities auxiliary to financial services and insurance activities | 0 | 0 | 0.00 |
| 44 | Real estate activities | 19 | 15,207,451 | 1.36 |
| 45 | Legal and accounting activities; activities of head offices; management consultancy activities | 0 | 0 | 0.00 |
| 46 | Architectural and engineering activities; technical testing and analysis | 0 | 0 | 0.00 |
| 47 | Scientific research and development | 225 | 4,224,921 | 0.38 |
| 48 | Advertising and market research | 105 | 139,685 | 0.01 |
| 49 | Other professional, scientific and technical activities; veterinary activities | 51 | 2,537,592 | 0.23 |
| 50 | Administrative and support service activities | 47 | 409,931 | 0.04 |
| 51 | Public administration and defence; compulsory social security | 106 | 74,165,062 | 6.65 |
| 52 | Education | 75 | 17,767,389 | 1.59 |
| 53 | Human health and social work activities | 93 | 59,202,423 | 5.31 |
| 54 | Other service activities | 130 | 32,583,913 | 2.92 |
| 55 | Activities of households as employers; undifferentiated goods- and services-producing activities of households for own use | 113 | 144,863 | 0.01 |
| 56 | Activities of extraterritorial organizations and bodies | 0 | 0 | 0.00 |
| Total | 1,115,880,548 | 100.00 |
Publisher’s Note: MDPI stays neutral with regard to jurisdictional claims in published maps and institutional affiliations. |
© 2021 by the authors. Licensee MDPI, Basel, Switzerland. This article is an open access article distributed under the terms and conditions of the Creative Commons Attribution (CC BY) license (https://creativecommons.org/licenses/by/4.0/).
Share and Cite
Mishina, Y.; Sasaki, Y.; Yokoyama, K. Study on Worldwide Embodied Impacts of Construction: Analysis of WIOD Release 2016. Energies 2021, 14, 3172. https://doi.org/10.3390/en14113172
Mishina Y, Sasaki Y, Yokoyama K. Study on Worldwide Embodied Impacts of Construction: Analysis of WIOD Release 2016. Energies. 2021; 14(11):3172. https://doi.org/10.3390/en14113172
Chicago/Turabian StyleMishina, Yu, Yosuke Sasaki, and Keizo Yokoyama. 2021. "Study on Worldwide Embodied Impacts of Construction: Analysis of WIOD Release 2016" Energies 14, no. 11: 3172. https://doi.org/10.3390/en14113172
APA StyleMishina, Y., Sasaki, Y., & Yokoyama, K. (2021). Study on Worldwide Embodied Impacts of Construction: Analysis of WIOD Release 2016. Energies, 14(11), 3172. https://doi.org/10.3390/en14113172