Article

Observation of the Main Natural Parameters Influencing the Formation of Gas Hydrates

by
Alberto Maria Gambelli
1,*,
Umberta Tinivella
2,*,
Rita Giovannetti
3,*,
Beatrice Castellani
1,
Michela Giustiniani
2,
Andrea Rossi
3,
Marco Zannotti
3 and
Federico Rossi
1
1
Engineering Department, University of Perugia, Via G. Duranti 93, 06125 Perugia, Italy
2
Istituto Nazionale di Oceanografia e di Geofisica Sperimentale—OGS, Borgo Grotta Gigante 42C, 34010 Trieste, Italy
3
Chemistry Division, School of Science and Technology, University of Camerino, Via S. Agostino 1, 62032 Camerino, Italy
*
Authors to whom correspondence should be addressed.
Energies 2021, 14(7), 1803; https://doi.org/10.3390/en14071803
Submission received: 21 January 2021 / Revised: 15 March 2021 / Accepted: 17 March 2021 / Published: 24 March 2021
(This article belongs to the Special Issue Volume II: Energy Resource Potential of Gas Hydrates)

Abstract

:
Chemical composition in seawater of marine sediments, as well as the physical properties and chemical composition of soils, influence the phase behavior of natural gas hydrate by disturbing the hydrogen bond network in the water-rich phase before hydrate formation. In this article, some marine sediments samples, collected in National Antarctic Museum in Trieste, were analyzed and properties such as pH, conductivity, salinity, and concentration of main elements of water present in the sediments are reported. The results, obtained by inductively coupled plasma-mass spectrometry (ICP-MS) and ion chromatography (IC) analysis, show that the more abundant cation is sodium and, present in smaller quantities, but not negligible, are calcium, potassium, and magnesium, while the more abundant anion is chloride and sulfate is also appreciable. These results were successively used to determine the thermodynamic parameters and the effect on salinity of water on hydrates’ formation. Then, hydrate formation was experimentally tested using a small-scale apparatus, in the presence of two different porous media: a pure silica sand and a silica-based natural sand, coming from the Mediterranean seafloor. The results proved how the presence of further compounds, rather than silicon, as well as the heterogeneous grainsize and porosity, made this sand a weak thermodynamic and a strong kinetic inhibitor for the hydrate formation process.

Graphical Abstract

1. Introduction

Natural gas hydrates (NGHs) are ice-like crystalline solids that consist of a hydrogen bonded, three-dimensional network of water molecules stabilized by included cages that host gas molecules [1]. In this case, interactions with the guest molecules occur with van der Waals forces by forming the hydrate lattice [2]. NGHs are present in permafrost regions of sedimentary deposits and under the sea in outer continental margins. They are generally present in oceanic sediments, in deep-water sediments of inland lakes and seas, and in polar sediment of continents and continental shelves [3]. The energy concentrated in natural gas hydrates represents a very important energy source [4].
The formation of gas hydrates is mainly determined by the availability of gas and water molecules at specific temperature and pressure conditions, but the presence of impurities can influence the processes. Moreover, several variables and environmental parameters may intervene in gas hydrate formation; its formation is mainly governed by thermodynamic conditions and gases and water availability, while its distribution on the local sediments mainly depends by sand or rock pores and, in general, morphological characteristics of the sediment.
Hydrate formation is a time-dependent crystallization process including three stages: dissolution, nucleation, and growing. The dissolution phase consists of the migration of the guest molecule from the gas phase into the liquid phase. Nucleation is a microscopic and stochastic process, in which liquid water molecules cluster around a gas molecule, forming small hydrate nuclei called clusters. Hydrate nuclei remain unstable until they reach the critical nucleation size necessary to overcome the free energy barrier and enter into the growth process. The nucleation process is free energy driven, and occurs randomly statistically. A variety of substances, called inhibitors, affect their formation by thermodynamic inhibition, preventing the formation of gas hydrates; this occurs by altering the hydrogen bond network in the water-rich phase before the hydrate formation [5]. In this case, the result is a shift to higher pressures and lower temperatures in the hydrate formation equilibrium conditions. Thus, the inhibition of hydrate formation by the solvation of salt in the liquid water-rich phase is obtained by an increase in competition between “water−salt Coulombic forces” and “water−water hydrogen bond forces”. The inhibition mechanism has a colligative property: the more salt dissolved, the larger the shift of the equilibrium curve. In this contest, salts inhibit the hydrate formation because they ionize in solution, ions are not found as guests, and thus they interact with the dipoles of the water molecules with a stronger Coulombic bond. This behavior causes cluster formation in which water is more attracted to ions with respect to the hydrate structure [6]. In addition, during the hydrate formation process, ions can compete with guest molecules [7], with a decrease in the number of hydrogen bonds between water molecules due to ions’ solvation [8].
A secondary effect of this clustering is a decrease in the solubility of potential hydrate guest molecules in water by salting-out. Both effects can combine to require substantially more subcooling to overcome the structural changes and cause the formation of the hydrates [7].
For this purpose, in this study, in the frame of the 2017 Italian PRIN Project entitled “Methane recovery and carbon dioxide sequestration in methane hydrate reservoirs”, natural sediments containing NGH were studied in order to obtain an indication of the synthetic reproduction of gas hydrate in a laboratory. Some marine sediment samples that contained NGH, sampled in the Antarctic Peninsula during the summer of 2003–2004 by Italian National Antarctic Research Program [9] and collected on National Antarctic Museum in Trieste, were thus chemically analyzed. Properties such as pH, conductivity, salinity, and concentration of the main ions on water present in the sediments are reported. The obtained results will be used in order to determine the “thermodynamic parameters and the effect of salinity on water and hydrates formation”. The chemical physical water properties are thus important for predicting and characterizing the hydrate bearing sediments by permitting to obtain information to optimize methane extraction from hydrate containing sediments or for sequestering carbon dioxide in gas hydrate.

1.1. Antarctic Natural Gas Hydrate Reservoir

The presence of gas hydrate in the South Shetland margin (off the Antarctic Peninsula) has been well documented in the last decades [10,11,12,13]. Three Antarctic expeditions have taken place in this area, in order to characterize the gas hydrate reservoir and to understand its relationship with the tectonic setting of the margin. The presence of gas hydrate was discovered during the Italian Antarctic cruses of 1989–1990 and studied during two Antarctic cruises of 1996/1997 and 2004–2005 [9,10,12,14] through the acquisition of different types of geophysical data, such as multichannel seismic, ocean bottom seismometer, multibeam, CHIRP, and gravity core data. In addition, the bathymetric data allowed identifying four mud volcanoes in proximity of the hydrate presence [9].
The seismic data acquired in this area were analyzed in order to obtain seismic velocity distributions that were translated in terms of concentrations of gas hydrate and free gas in the pore space using the Tinivella method [11,12,13,15]. This approach allowed estimating a total volume of hydrate equal to 16 × 109 m3 with an error of about ±25%, and a total amount of free gas trapped in the reservoir varying between 1.68 × 10¹² and 2.8 × 10¹² m3, considering that 1 m3 of gas hydrate corresponds to 140 m3 of free gas in standard conditions [13].
The campaign performed in the summer of 2003–2004 had the main purpose to increase existing information on the gas hydrate reservoir, notably in terms of regional bathymetry as well as gas levels/composition, as well as its relationship with regional tectonic features.

1.2. Porous Media

It has been established that the size of particles of porous media strongly intervenes on gas hydrate formation [16]. Differences in size mean variations in pore size, with a consequent formation of a different hydrate formation environment [17]. Hydrates are mainly formed in coarser, sandy, turbidite interlayers, which is proved by the results of deep-sea drilling projects in the areas of hydrate distribution. However, hydrates in near-bottom sediments (in seeps, mud volcanoes, and vents), as a rule, form in fine-grained sediments, as deep-water sediments are predominantly of silty-clayey composition. In addition, several further characteristics of the sediment matrix are able to influence hydrate formation, accumulation, and dissociation properties [18]. For instance, stability conditions for methane hydrate in presence of nano fossil-rich sediments moved to temperatures lower by about 0.5 °C than that in pure water [19,20]. In addition, hydrate saturation in sediments was found to be particularly affected by particles’ size [21,22,23,24]. The reason for this mainly lies in the complexity natural sediments usually have; the contemporary presence of mineral particles, organic debris, remnants of fossils, and so on make the determination of the specific effects of each component extremely difficult.
Sediments are commonly classified into different types as a function of sand particles’ size. Some examples of these latter classifications are silt, gravel, sand, and so on. Grains’ dimensions and pores’ size also affect the physical and chemical properties of water confined in porous media [25,26]. From pores’ dimensions, the capillary forces, which have a fundamental role in gas hydrate stability, deepen. Fine-grained sediments increase capillary forces, thus hindering the flow of gas and other fluids. Starting from this latter aspect, several researchers proved that gas hydrate formation and growth is faster in the presence of pure silica sand [27]. Hachikubo and colleagues explained that particles’ size assumes a key role in hydrate dissociation processes [28]. He proved how the hydrate dissociation rate is higher in coarse glass sand compared with fine silica sand. This is mainly because of the higher tendency of water molecules to create a thin layer on grains of fine silica sand.
Experiments and simulations on the methane hydrate growth process revealed that the hydroxylated silica surfaces may act as adsorbing locations for methane and are consequently able to improve methane hydrate formation near the surface [29]. Riestenberg and coworkers investigated methane hydrate formation and dissociation in the presence of colloidal suspensions containing bentonite [30]. In the presence of colloidal suspensions of bentonite (200 mg/L), the authors observed a reduction in pressure necessary for hydrate formation compared with hydrate formation in pure water. The further addition of silica suspensions, rather than bentonite, with solid concentrations up to 34 g/L, was found to not produce significant differences in hydrate formation and dissociation conditions from that of water.
On the basis of the above considerations, two different types of sand were tested for methane hydrate formation and dissociation in shallow water using near-bottom sediments and were then compared among each other. The first sand used consists of an artificial pure quartz sand, whose grains have the same dimensions (200 μm) and porosity (34% of the total volume). The second type directly originated from the Mediterranean seafloor, characterized by shallow water, and presents a heterogeneous composition both in terms of compounds and in terms of particles’ size and porosity. Thermodynamic and kinetic parameters were considered to compare the performances and capability of these two sands to affect methane hydrate formation and dissociation characteristics.

2. Materials and Methods

2.1. Methods Adopted to Study Effects Related to Water Salinity

Two Gravity Cores (GC) of 1.07 m (GC01) and 2.98 m (GC02) in length were recovered at a water depth of 2332 m and 2360 m, respectively, and in proximity of two mud volcanoes, in which gas hydrate was identified through the seismic method (i.e., [12,13]). Laboratory measurements were carried out on the collected sediments before and after cutting the cores. In particular, data on computer-aided tomography (CAT) and interstitial fluid analyses are described here [9]. The CAT allowed imaging the pore space (vugs and voids) every 5 mm downcore. This approach facilitated gas extraction before cutting the cores. A significant heterogeneity was recognized on the sediments in both cores through CAT three-dimensional images (see Figure 1).
Particularly interesting structures were recognized including inclined and irregular boundaries between lithologies, rocks fragments, possible flow structures, and voids with an average width exceeding 1 cm, partly gas-saturated, also confirmed by fluid analyses. The cores are composed of stiff silty mud [9]. Note that silt–particle agglomerates maintain the relative permeability of the sediments, which promotes the formation of gas hydrate in silt-rich sediments [31].
Before cutting the cores, the fluid in the pore space revealed by the CAT analysis was extracted after heating the cores at 60 °C for 30 min. Several types of hydrocarbon gases were recognized through the fluid analysis, suggesting a thermogenic origin of the gas present in this area; in fact, it is important to underline that the cores were analyzed one year after their collection. Moreover, the GC02 core was split on board in three parts; during this operation, gases were probably dispersed, justifying the absence of methane and propane in this core. Thus, only the qualitative results should be considered (see Table 1).
The core GC01 shows a higher content in gas (about three times) with respect to core GC02 that cannot be justified only due to the GC02 cutting. Moreover, the core GC01 reveals a uniform distribution and concentration of the analyzed gas along the entire core, while the gas content is variable along the core GC02. The difference in gas distribution and content suggests a difference in permeability in the two cores. It is likely that the core CG01 is characterized by lower permeability of the sediments, as supported by a higher sediment stiffness in core GC01 than that of core GC02. Moreover, we hypothesize that the gas hydrate reservoir could be characterized by the same gas content and distribution measured along the two cores because the thermogenic origin of the gas confirmed and gas supplied by deep sediments [9].
Additional measurements were performed on sampled parts of these two cores, collected in the National Antarctic Museum in Trieste (Italy), as described in the next section.

2.1.1. Samples’ Preparation by Leaching Test

Sediment samples, collected in the National Antarctic Museum in Trieste, were treated by ultrapure water (generated by Advantage A10 Millipore instrument) as a leaching agent. The ratio between sediment weight and volume of ultrapure water was 1:5 and the test was conducted for a total of 18 h; after sediments’ deposition, the supernatant solutions were collected. Samples were successively filtered with 0.22 µM filters before the analysis. Conductivity and pH values of eluates were measured by HQ40d HACH instrument.

2.1.2. Multi-Elements’ Determination

Inductively coupled plasma-mass spectrometry (ICP-MS) (Agilent Technologies Santa Chiara, California, 7500 cx series) was used in order to evaluate the concentration of the elements contained in the leaching solutions of sediments. The main used parameters were as follows: power 1550 W, carrier gas 1.03 L/min, make-up gas 0.00 L/min, sample depth 8 mm, nebulizer pump 0.1 r.p.s., and spray chamber temperature 2 °C. In order to control the polyatomic interference by the collision cell, the ICP was operated in He mode; the typical performance test was as follows: He flux 3.1 mL/min, solution containing 10 ppb of 9Be (9000 cps), 45Sc (30,000 cps), 56ArO (300 cps), 115In (30,000 cps), 140Ce (40,000 cps), and 209Bi (12,000 cps). An internal standard was prepared without 9Be and used in the measurements. Aqueous standard solutions (1% nitric acid) were obtained with appropriate dilution of stock standards (Sigma Aldrich) in order to obtain the calibration curves; ChemStation System Software for ICP-MS (version B.03.07, Agilent Technologies, Inc. 2008, Tokyo, Japan) permitted the evaluation of the elements’ concentration. Limit of detection (LOD) was calculated as three times the standard deviation (SD) of the element concentration in the calibration blanks and the ICP-MS raw counts were monitored to assure a signal/noise ratio >3 (data not shown). Three replicates were performed per each sample.

2.1.3. Total Anionic Composition

Anionic composition of leaching solutions was evaluated using ion chromatography (IC). IC apparatus (Dionex ICS-1000) was equipped with Dionex Reagent-free Controller 30 (RFC 30) as gradient elution system, AS50 auto sampler, conductimetric detector, Dionex AERS 500 4 mm ionic suppressor, and Chromeleon software as data acquisition software. IC separations were performed with Dionex IonPac AG11-HC Guard (4 × 50 mm) pre-column and Dionex IonPac AS11-HC Analytical (4 × 250 mm) column. KOH was used as mobile phase with a flow rate of 1.0 mL/min and the gradient IC method was used for the analysis. The initial mobile phase composition was 20 mM and changed linearly to 45 mM from 2 to 14 min, followed by a return to the initial conditions within 4 min. The mobile phase was filtered through a 0.45 m PTFE (LabService Analytical s.r.l) filter. The injection volume was 25 L.
Identification of analytes was carried out by comparing the retention times in the sample with those of a standard mixture for IC (1000 mg L−1, Sigma-Aldrich TraceCERT). Three replicates were performed for each sample; for the quantification, a calibration curve was obtained for each analyte by plotting peak areas versus their concentrations.

2.2. Methods Adopted to Study Sand Effects on Hydrate Formation

2.2.1. Experimental Apparatus

The lab-scale experimental apparatus, used to produce experimental results and shown in the following section, has already been involved in previous research, and a detailed description of it is available elsewhere in the literature [32,33,34]. Here, a brief illustration of its main characteristics is provided. The reactor consists of a 316 stainless steel tank, having an internal cylindrical volume equal to 949 cm3 (7.3 cm diameter and 22.1 cm height). Two flanges were used to close the upper and the lower sections. Figure 2 shows a picture of the reactor (a) and a scheme of the completely assembled experimental apparatus (b).
The experimental setup is thought to produce both methane and carbon dioxide hydrate and, in particular, to carry out CO2/CH4 exchange tests. However, in this work, only methane hydrate formation was tested. Methane is injected inside the reactor from the lower section, with the aim of perfect diffusion in pores of sand, present inside the reactor, as well as to bring gaseous methane to the same temperature as the internal volume before introducing it. A fluximeter (FM) was used to continuously control the gas flow. Four type K thermocouples (T), having class accuracy 1, were installed at different depths, in order to verify any temperature variation. In particular, thermocouples were positioned at depths of 2, 7, 11, and 16 cm, respectively, from the top. Figure 3 shows how thermocouples were positioned.
Pressure (P) was monitored with a digital manometer. To regulate temperature, the reactor was inserted in a thermostatic bath, equipped with a double copper coil, where a refrigerant fluid was continuously circulated by a chiller (Model GC-LT). On the top flange, an ejection valve was installed to reduce pressure (if necessary) and for gas ejection.

2.2.2. Materials

The reactor was filled with 0.236 L of water and 0.744 L of sand. About this latter compound, two different typologies were used: the first consists of a pure quartz sand, named PQ, commonly used to study hydrate formation in laboratories, while the second is a natural silica-based sand, coming from the Mediterranean seafloor and named TS. The average porosity of sand was measured with a porosimeter, model Thermo Scientific Pascal 140, and is equal to 34% for PQ, while it ranges from 30% to 35% for TS. Grains forming sand PQ assume a spherical shape, with 200 μm. Conversely, grains belonging to sand TS assume different shapes and dimensions. In addition, this latter sand contains a mixture of different compounds, rather than SiO2, present in small quantities. Table 2 describes the chemical composition of sand TS, while Figure 4 shows a diagram indicating its grainsize distribution.
Finally, the two different porous media are shown in Figure 5.

2.2.3. Methods

Firstly, a weak gas stream was provided inside the reactor to completely remove air (if present). The gas stream is performed with the same gas that will form hydrate. Contemporarily, temperature was decreased from the current environmental value to 1–3 °C. After that initial cleaning step, the ejection valve was closed and methane was injected inside the reactor till reaching the desired value; then, the reactor was completely isolated from the external and started operating in batch conditions. Once thermodynamic conditions made hydrate formation feasible, the reaction occurred, with a consequent heat production due to the exothermicity of the reaction. Hydrate formation obviously generated a decrease in pressure, due to the entrapment of methane molecules in solid water cages. As soon as pressure stopped decreasing and stabilized, hydrate formation was considered finished. Immediately after, the chiller was switched-off and temperature was left to increase freely, in order to cause hydrate generation and thus identify equilibrium values. In each test, five specific points were selected to provide a well-deepened description. The first point, named PT1, exactly represents the triggering of hydrate formation. The second point (named PT2) is located at the end of the temperature increase associated with the reaction triggering. Comparing the trend observed in each test with that present in the literature, it is possible to conclude that the present point represents the finish of the nucleation phase and the consequent beginning of the hydrate massive growth phase. The third point (named PT3) indicates the ending of hydrate formation; it corresponds to the lowest pressure value registered during the experiment. Equilibrium values for hydrate are commonly defined during hydrate dissociation and not during its formation, because of possible deviations from the ideal trend, associated with several possible causes, which may occur during this latter phase. Moreover, in those experiments, such an aspect was observed and described. To do that, a specific point, indicated as PT3*, was defined. It describes the point during hydrate formation at which thermodynamic conditions assume the most distant values from the ideal equilibrium conditions. Once hydrate formation finished, temperature was left to rise freely, in order to generate a partial dissociation of previously formed hydrate. The purpose of this latter aspect was to compare the trend of hydrate dissociation with that observed during its formation and with the ideal trend, in order to verify whether or not the specific sand used during experiment affected the hydrate equilibrium trend. The last point described, named PT4, indicates the ending of this last phase.
All points were evaluated by directly measuring or calculating some parameters of interest, which will be shown in the next section.
The letters “P” and “T” clearly represent pressure and temperature, respectively, while time was expressed with the letter “t”. Moles of hydrate formed were indicated with “nHYD”. This last parameter was calculated according to the following equation:
n HYD =   V PORE P i Z f P f Z i Z f RT P f ρ HYD
In this equation, VPORE represents the portion of sand pores’ volume feasible for hydrate formation. This was evaluated by considering the average porosity of sand grains and the total volume they occupied. The gas constant was indicated with the letter “R” and the compressibility factor, calculated with the Peng–Robinson equation, with the letter “Z”. Subscript “f” indicates the specific time for which nHYD is being calculated, while subscript “i” may represent conditions at PT1 or conditions related to the immediately previous point (the two possibilities have been clearly indicated in the text). Finally, parameter ρ HYD is the ideal molar density of hydrate; according to the literature [35,36], it was calculated assuming 100% cage occupancy.
Considering thermodynamic conditions established to produce hydrate and the type of guest involved in the process, as well as taking into account previous works carried out with similar conditions, the exclusive formation of sI hydrate was assumed, with the hydration number equal to 6. With those assumptions, moles of water and methane involved in hydrate formation were evaluated. Parameter H2OinHYD was used to indicate moles of water that contributed to form hydrate structures, while H2Oliq represents the quantity of water remaining in the liquid phase. It is equal to 7 moles (the total quantity present inside the reactor) minus H2OinHYD. Conversely, with CH4g, moles of methane, which did not contribute to hydrate formation, were described. Parameter [CH4g] represents the percentage of gaseous methane as a function of liquid water present inside the reactor and is expressed in molCH4gas/molH2Oliq. The gas uptake was called GU% and was calculated with the following equation:
GU % =   CH 4 inj CH 4 g CH 4 inj × 100
where CH4inj coincides with CH4g at PT1.
The rate of hydrate formation was calculated by assuming the first-order reaction kinetics of hydrate formation, thus using the following equations:
k = 1 t ln CH 4 g CH 4 g 0
d CH 4 g dt =   CH 4 g 0 ke kt
The rate constant was expressed in (mol−1), and the rate of hydrate formation in mol/min. In particular, the kinetic rate constant is a crucial parameter for hydrate growth, especially for mass transfer properties [37].
In Equation (4), k denotes the rate constant of the reaction. Subscript “0” indicates PT1, if the absolute value is calculated, or the previous point, if the relative k value is desired.
Finally, the moisture content of sand pores was evaluated. As previously indicated, 0.236 L of water was inserted inside the reactor. Sand PQ has porosity equal to 34%, while sand TS has about 30–35% porosity and an average value of 32.5% was considered. The free volume of sand pores is thus equal to 0.253 and 0.242 L, respectively. The amount of water inserted was calculated in order to fill 55% of pores’ volume—the initial moisture content of sand pores. This means that, in tests made with sand PQ, 0.139 L of water was initially present inside sand pores, while in the presence of sand TS, the same parameter was equal to 0.133 L. The remaining quantity, 0.097 and 0.103 L, respectively, remained out of sand pores. However, the lowest section of the reactor is equipped with a steel sieve, having a square grid (1 mm × 1 mm), used to avoid sand deposition over the methane injection channel [38]. The quantity of water needed to fill the space between that membrane and the gas injection channel is 0.108 L. Consequently, 0.031 and 0.025 L of water remained between sand grains. Considering a hydration number equal to 6, the maximum quantity of hydrate that can be formed outside sand pores is equal to 0.005 in sand PQ and to 0.004 in sand TS. This value was used to calculate the maximum and minimum quantity of hydrate that formed inside pores. Considering the little amount of water present outside sand grains, the difference between those two values is particularly limited, and the average values were used to determine water involved in hydrate formation into sand pores. The difference between this latter value and the initial quantity of water present into sand pores allowed to determine the water content in sand pores after hydrate formation.

3. Results and Discussion

3.1. Effects Related to Seawater Composition

According to the experimental plan, in order to define the chemical physical characteristics of water inside sediments samples, after the leaching treatment with ultrapure water, measurements were performed on the obtained water solutions. All the results were calculated by considering averages of humidity % values for each carrot (30.89% for the GC01 and 31.64% for the GC02 series) [39] obtained by the previous characterization of the sentiments. The identification and quantification of all analytes were carried out using specific standard mixtures of elements or anions.
The measured pH and conductivity values (mS/cm) of the obtained eluates samples are reported in the Table 3.
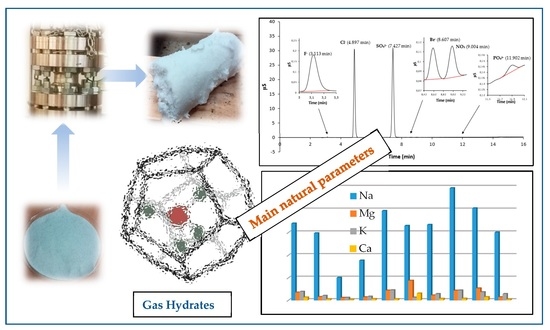
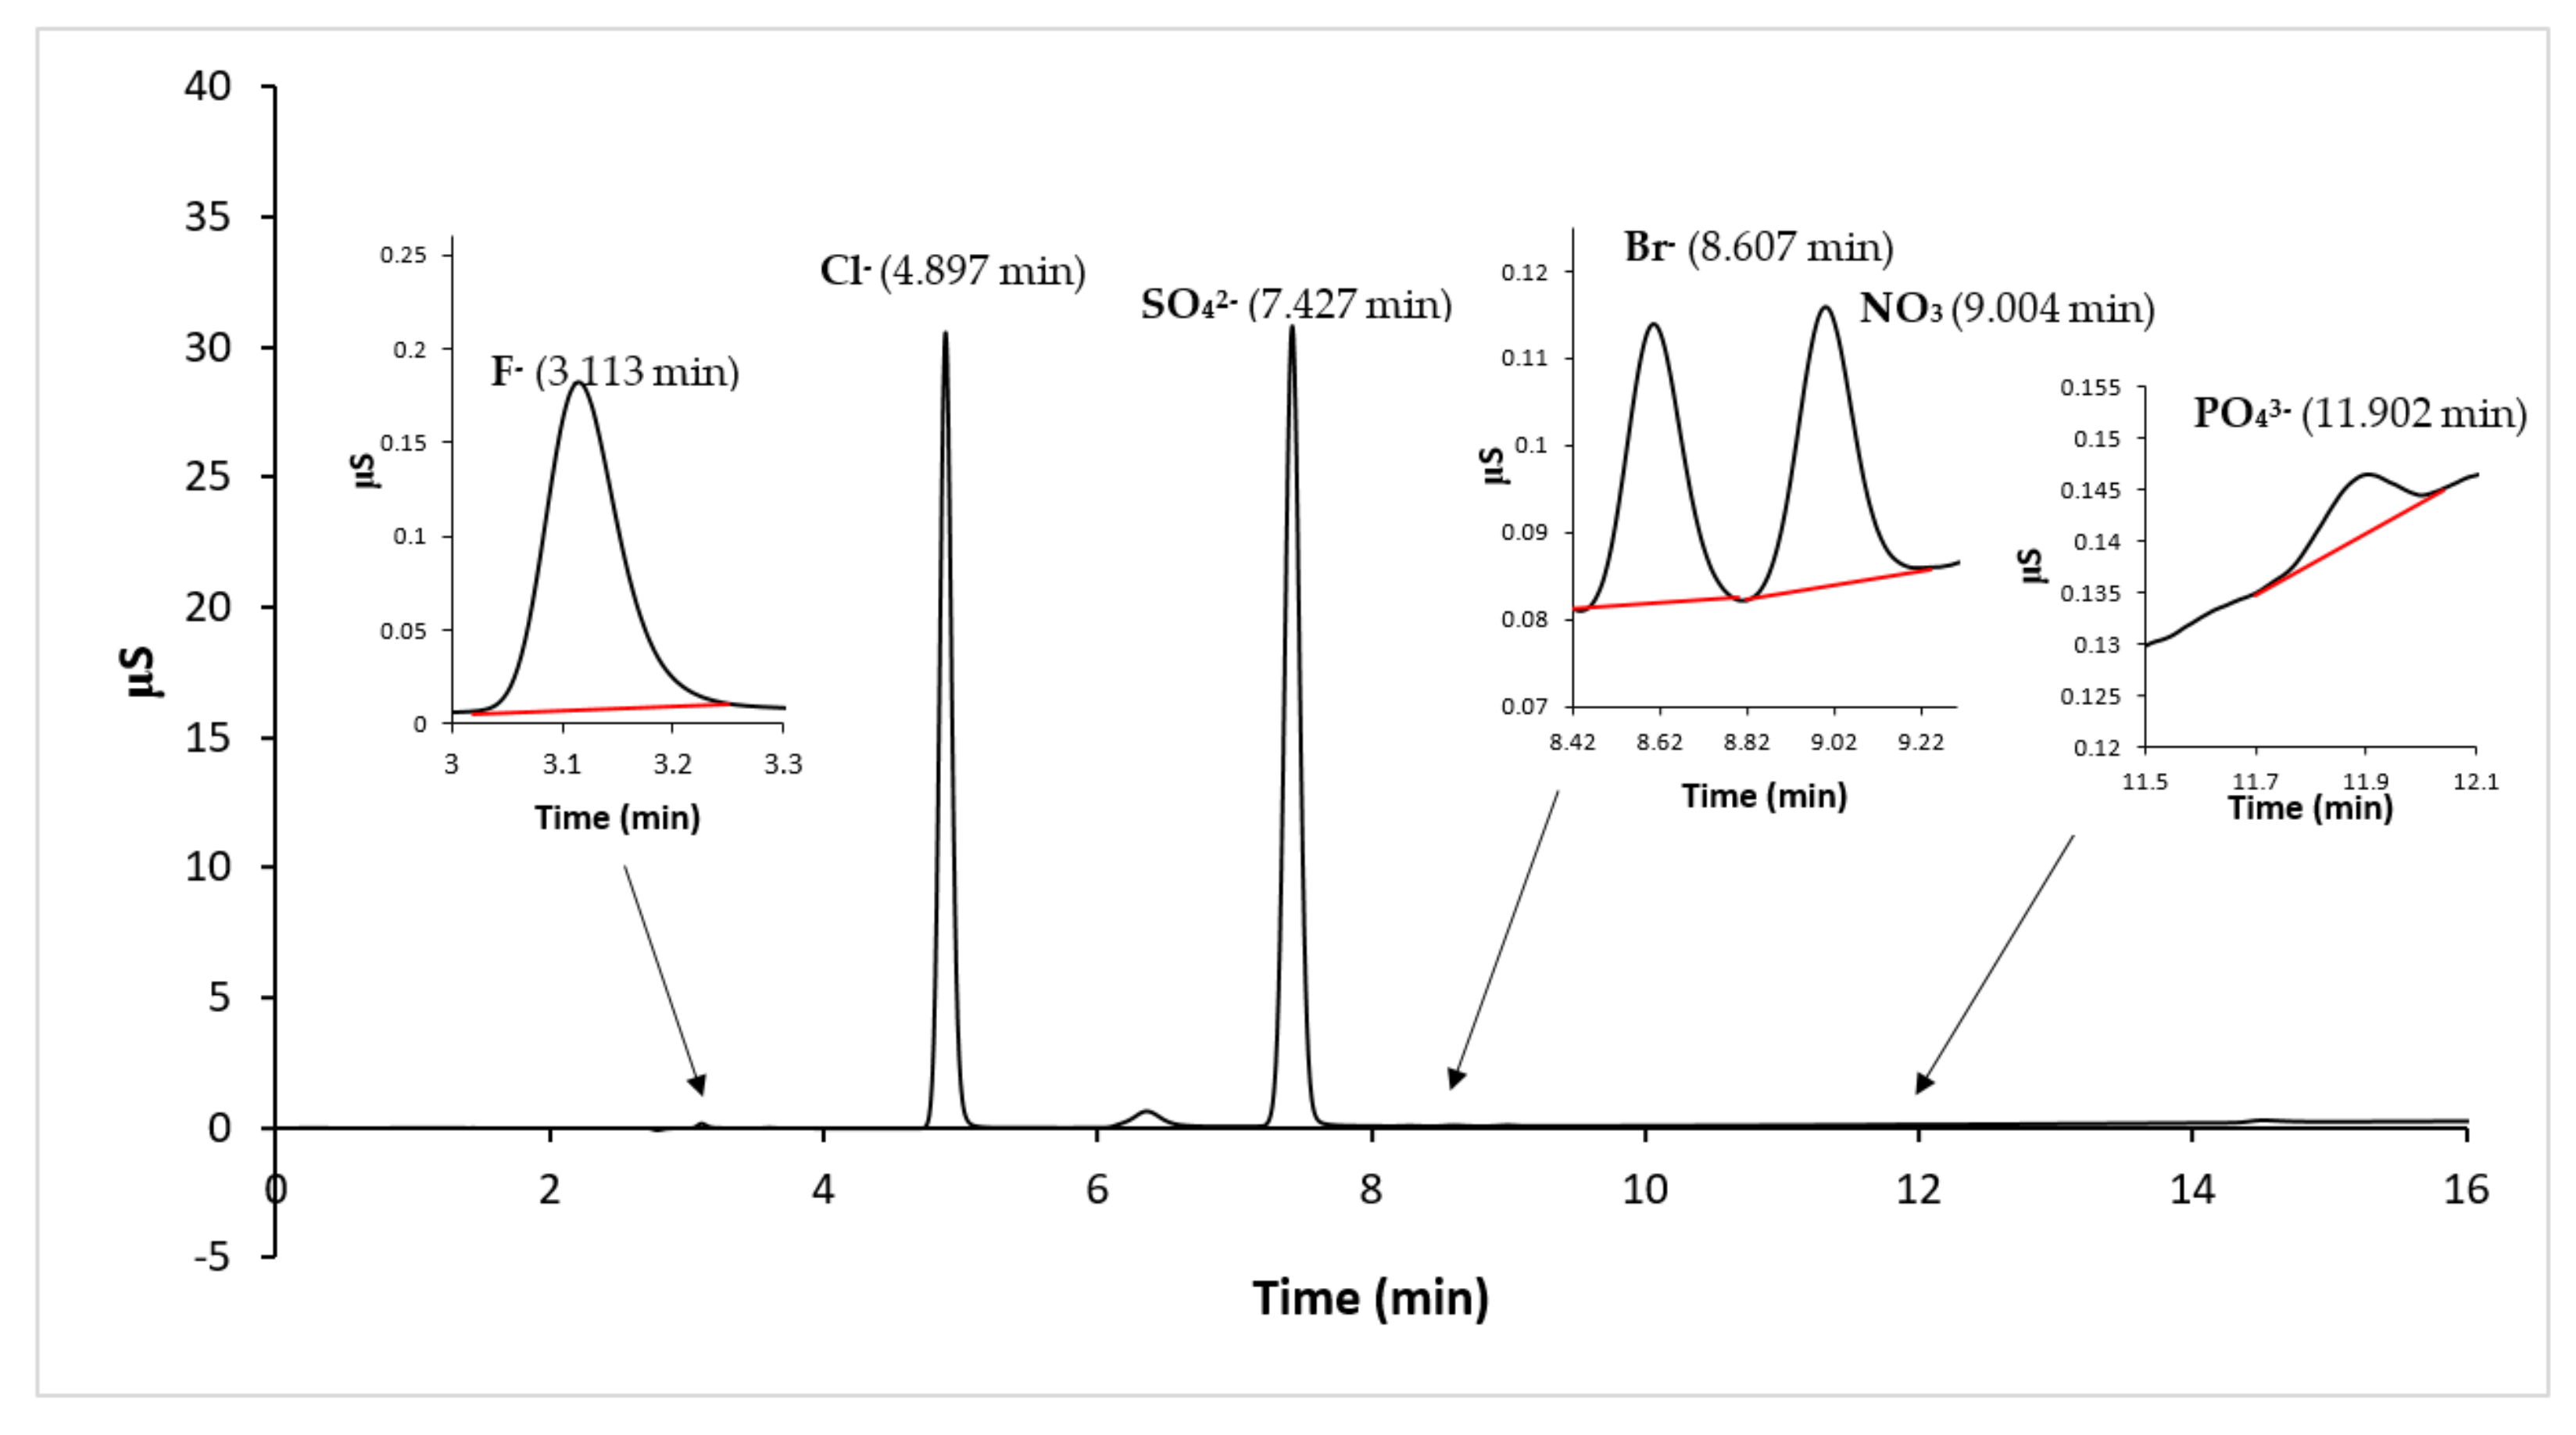
The anionic composition of the sample solutions, related to the water eluate samples obtained by the leaching test, were determined by IC analysis, using KOH as eluent, with the gradient method and conductimetric detection. A typical obtained chromatogram is reported in Figure 6, where it is possible to observe that the major anionic compounds are chlorides and sulfates.
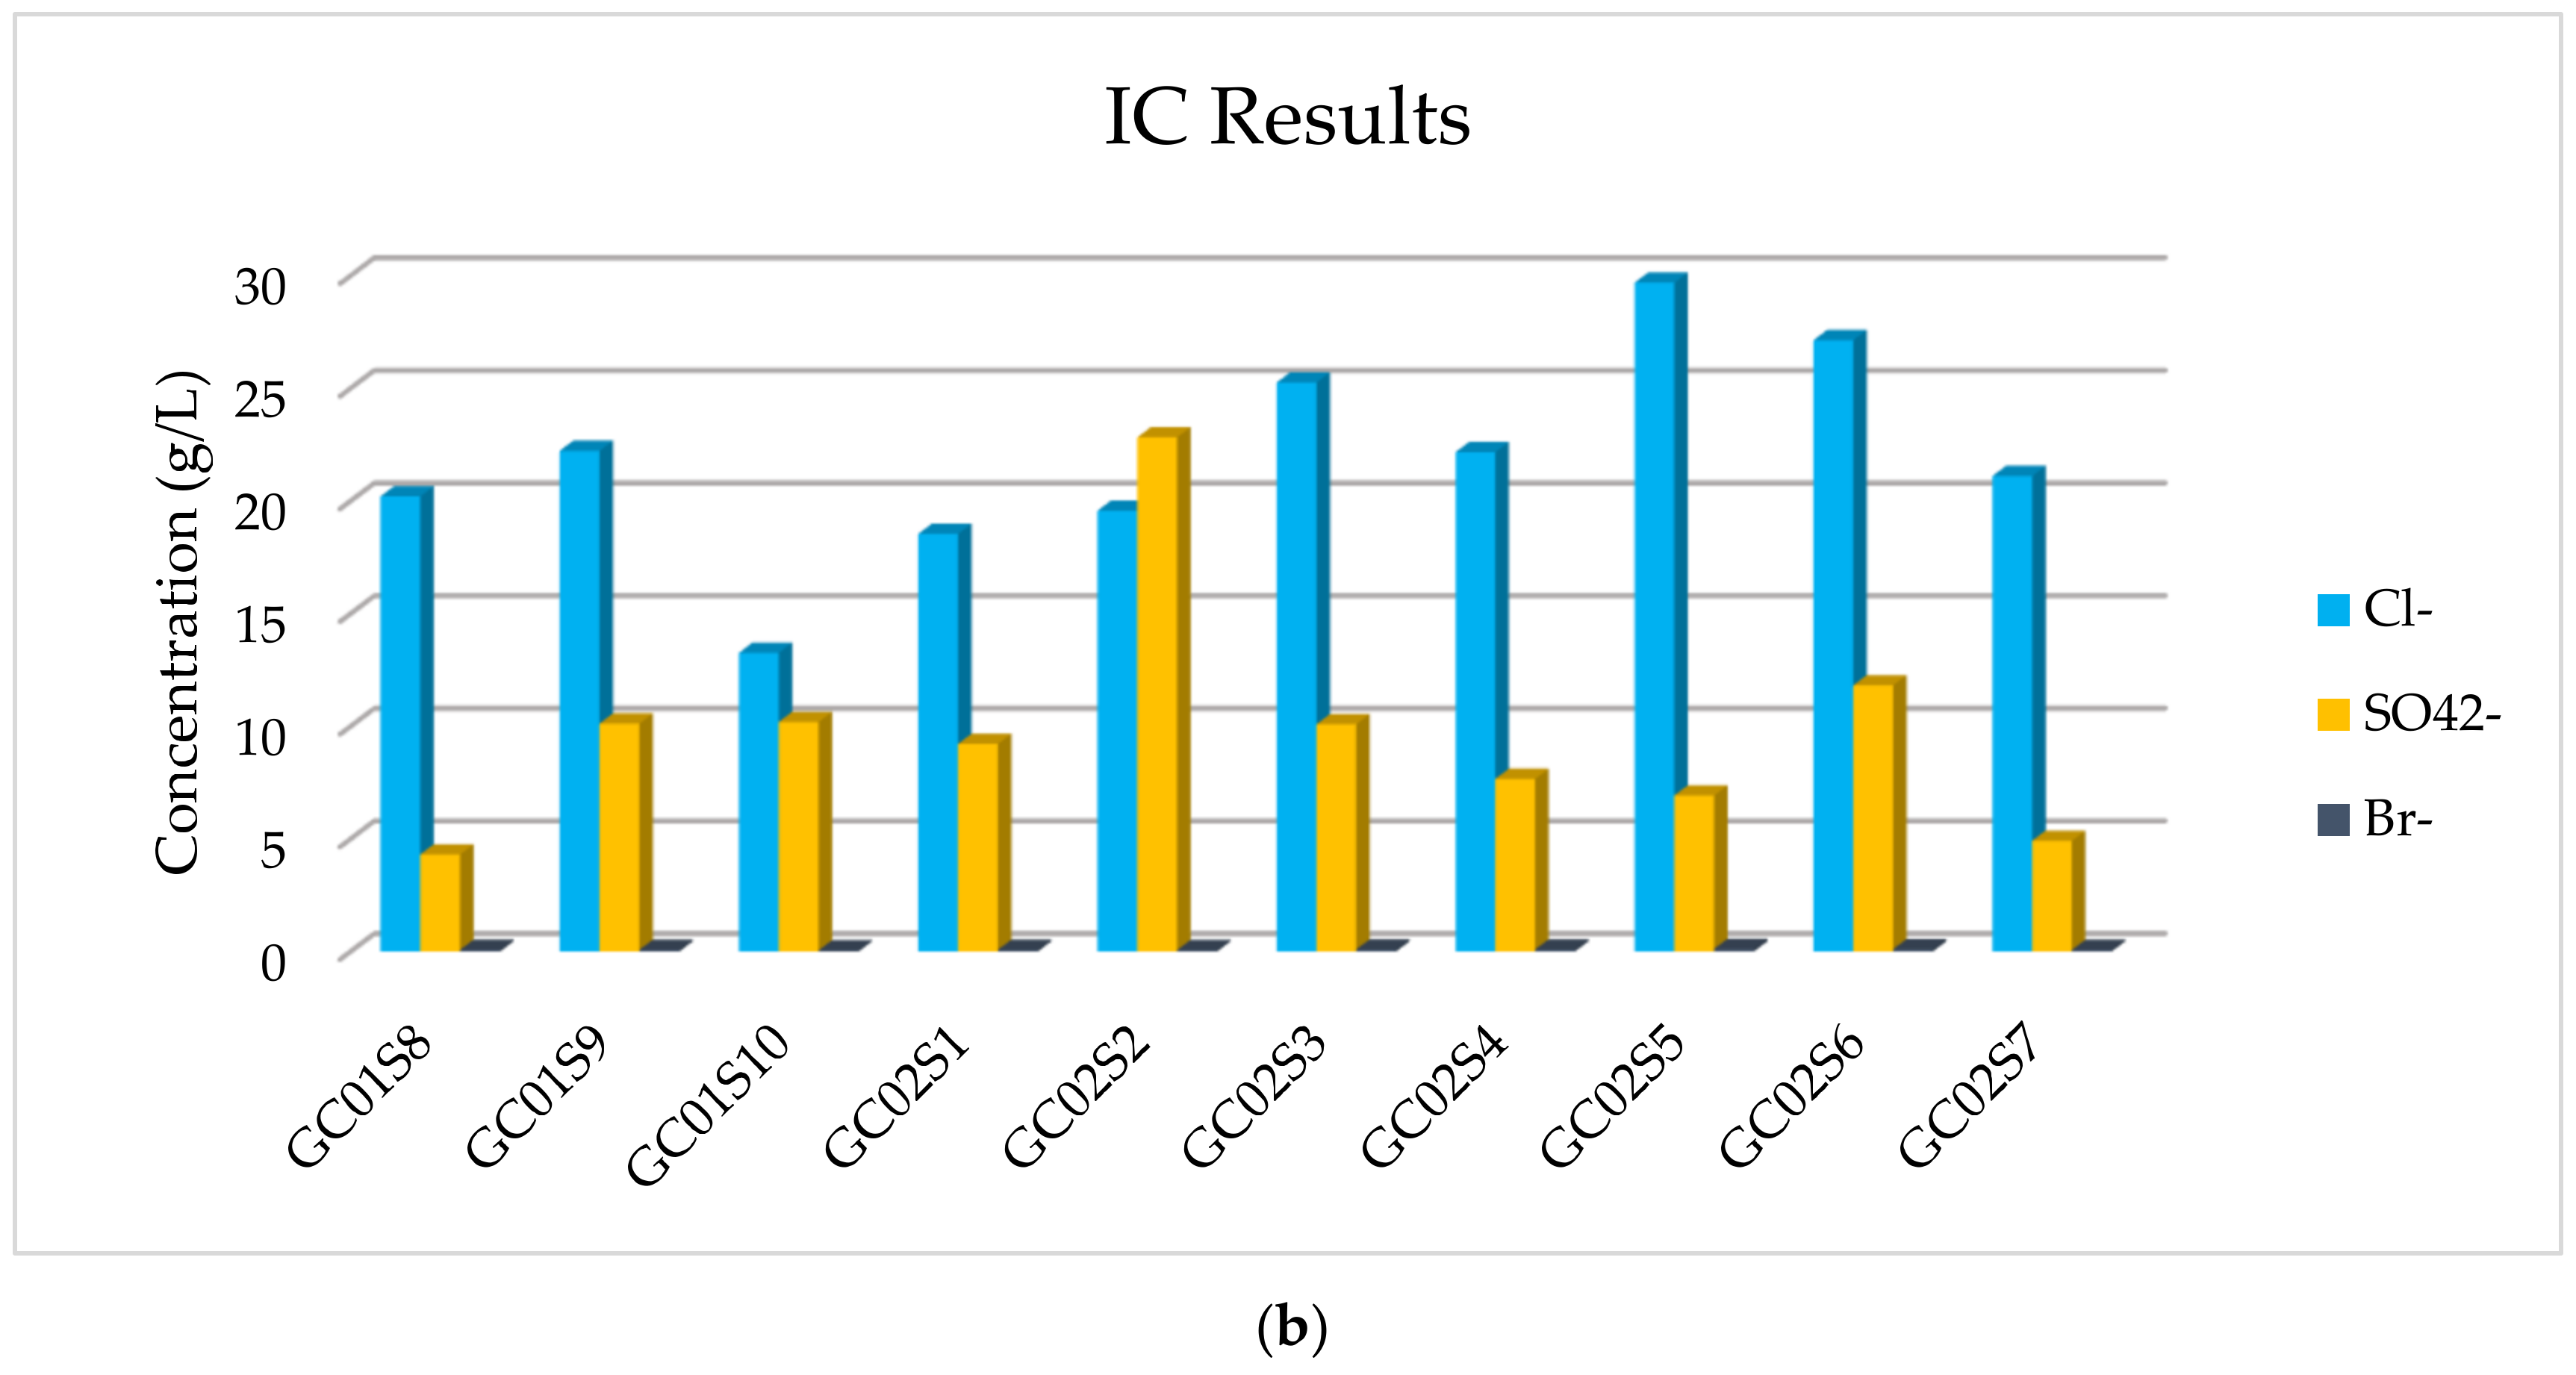
The results of the IC analysis related to the anions’ concentration of all samples are listed in Table 4, in which it is possible to observe that the major anions are Cl and SO42− and a very low concentration of Br is detected. The more abundant anion is Cl, but appreciable, and in one sediment comparable, is SO42−.
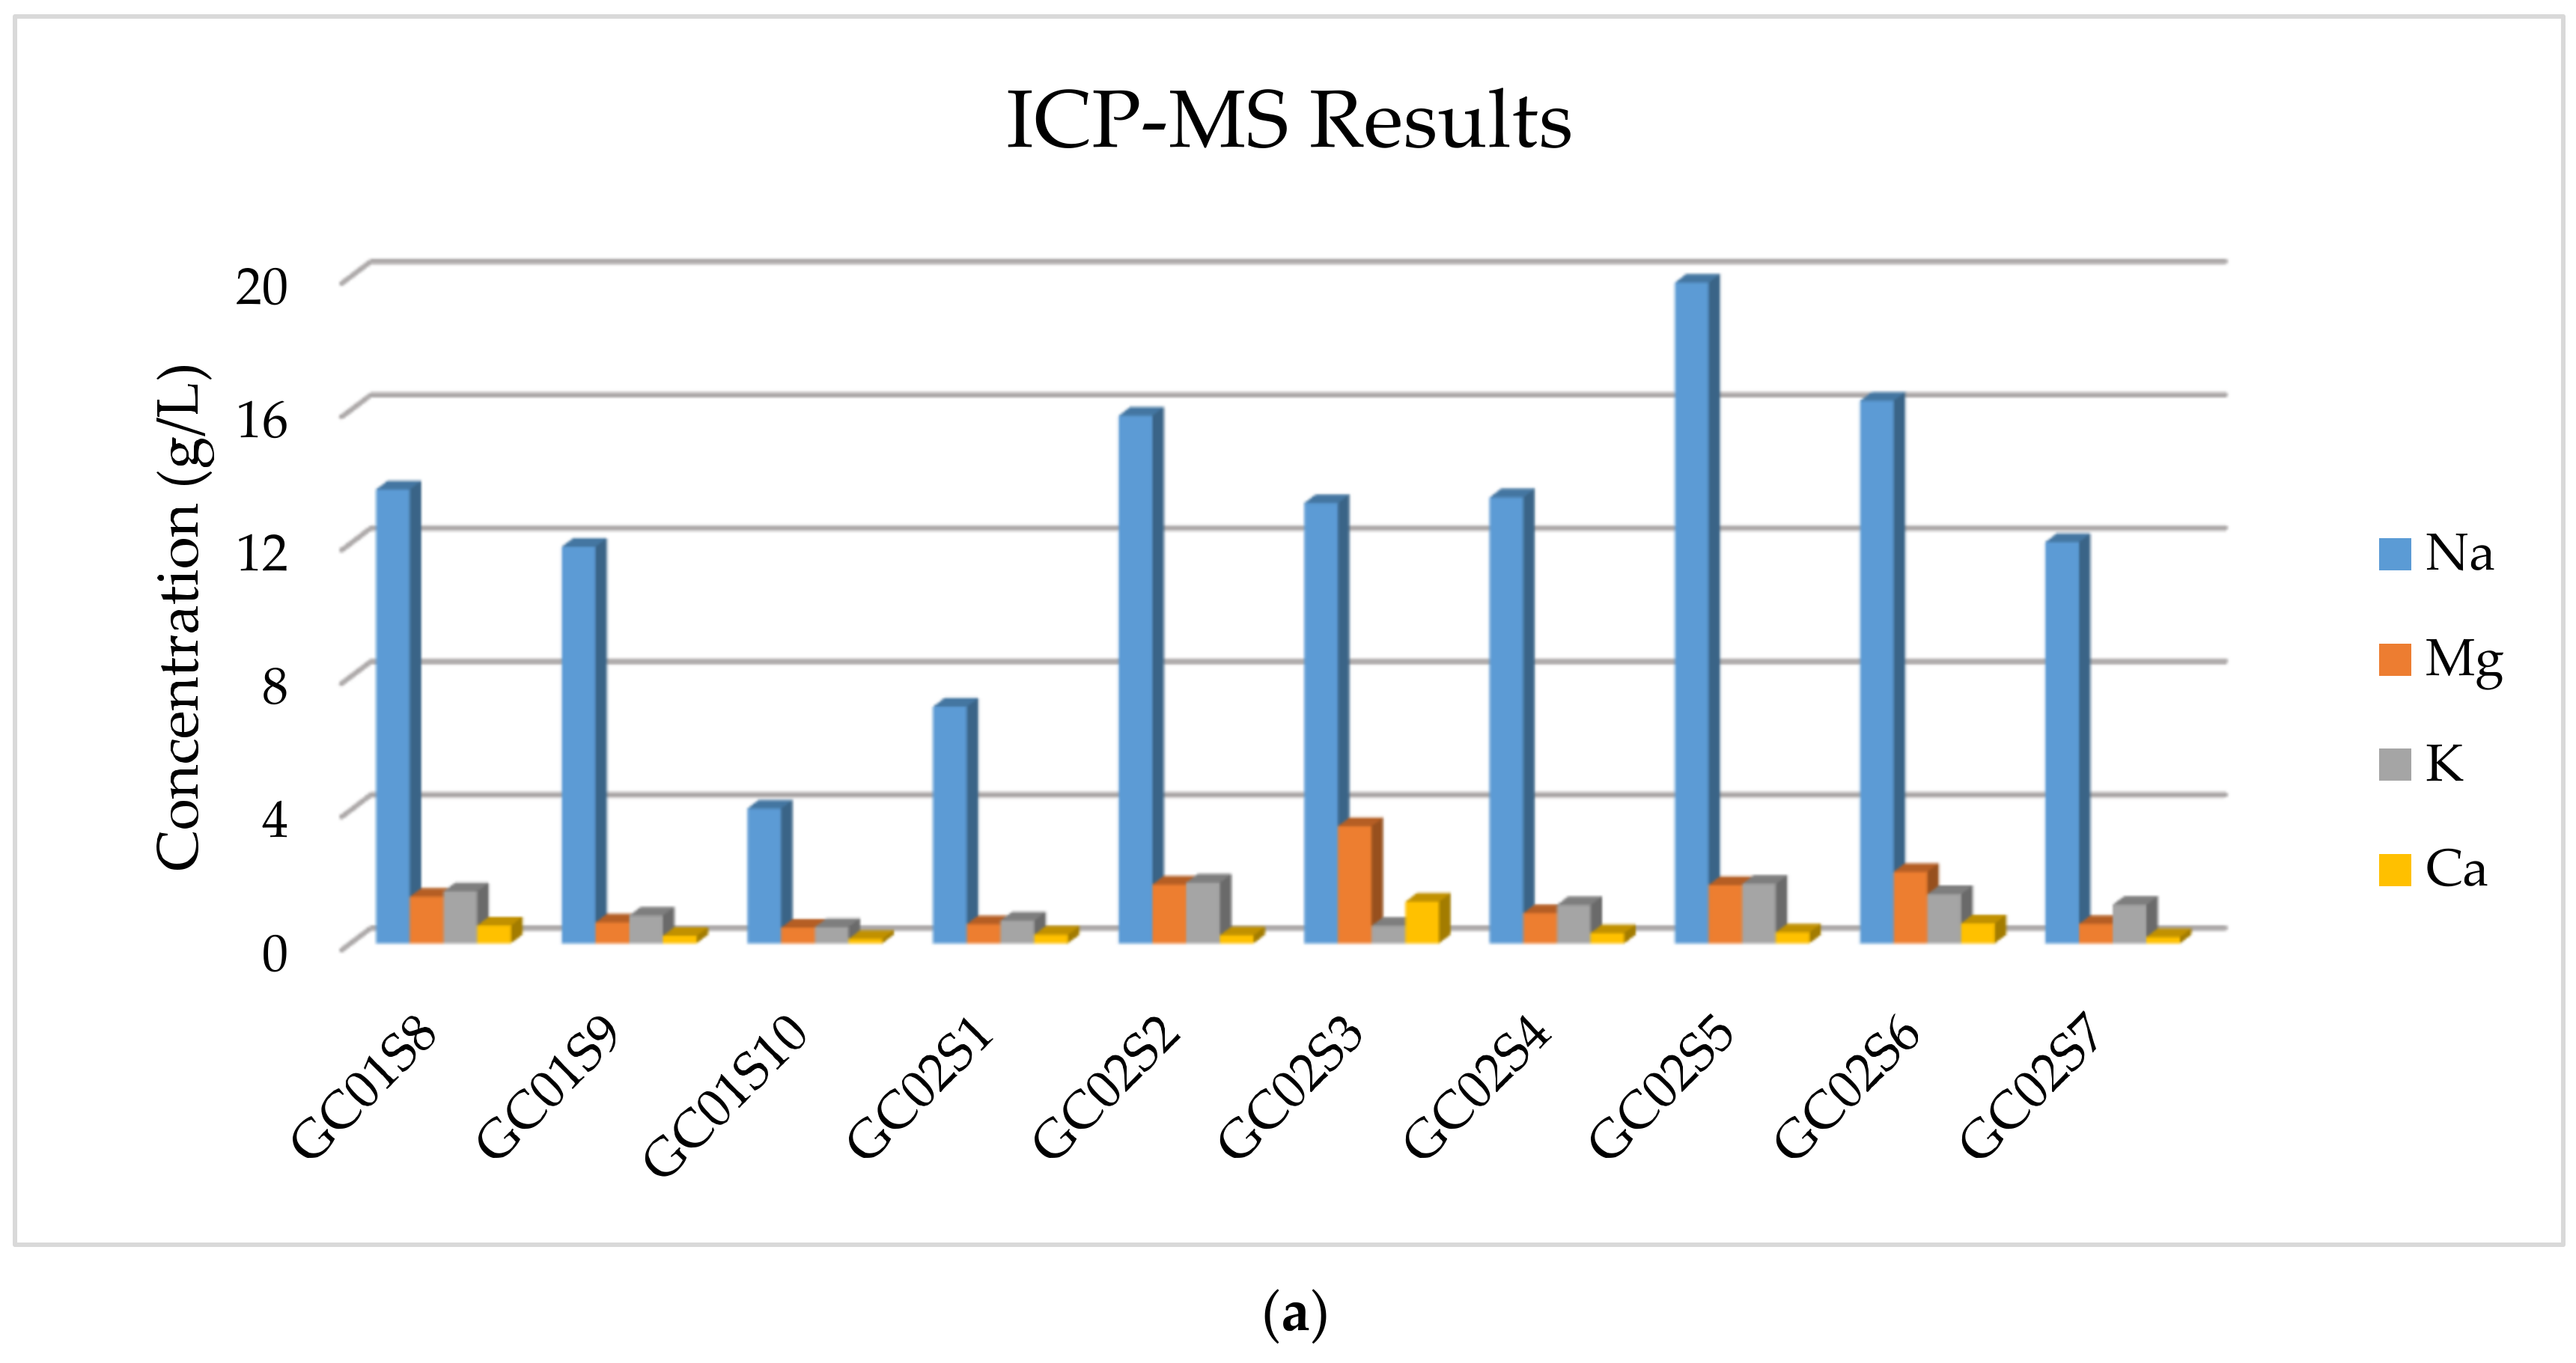
The results of the multi-element ICP-MS analysis are reported in Table 5, showing that the more abundant element is Na and those in smaller quantities, but not negligible, are Ca, K, and Mg.
In addition, in Figure 7, the concentration of majority elements and anionic compounds is graphically expressed.
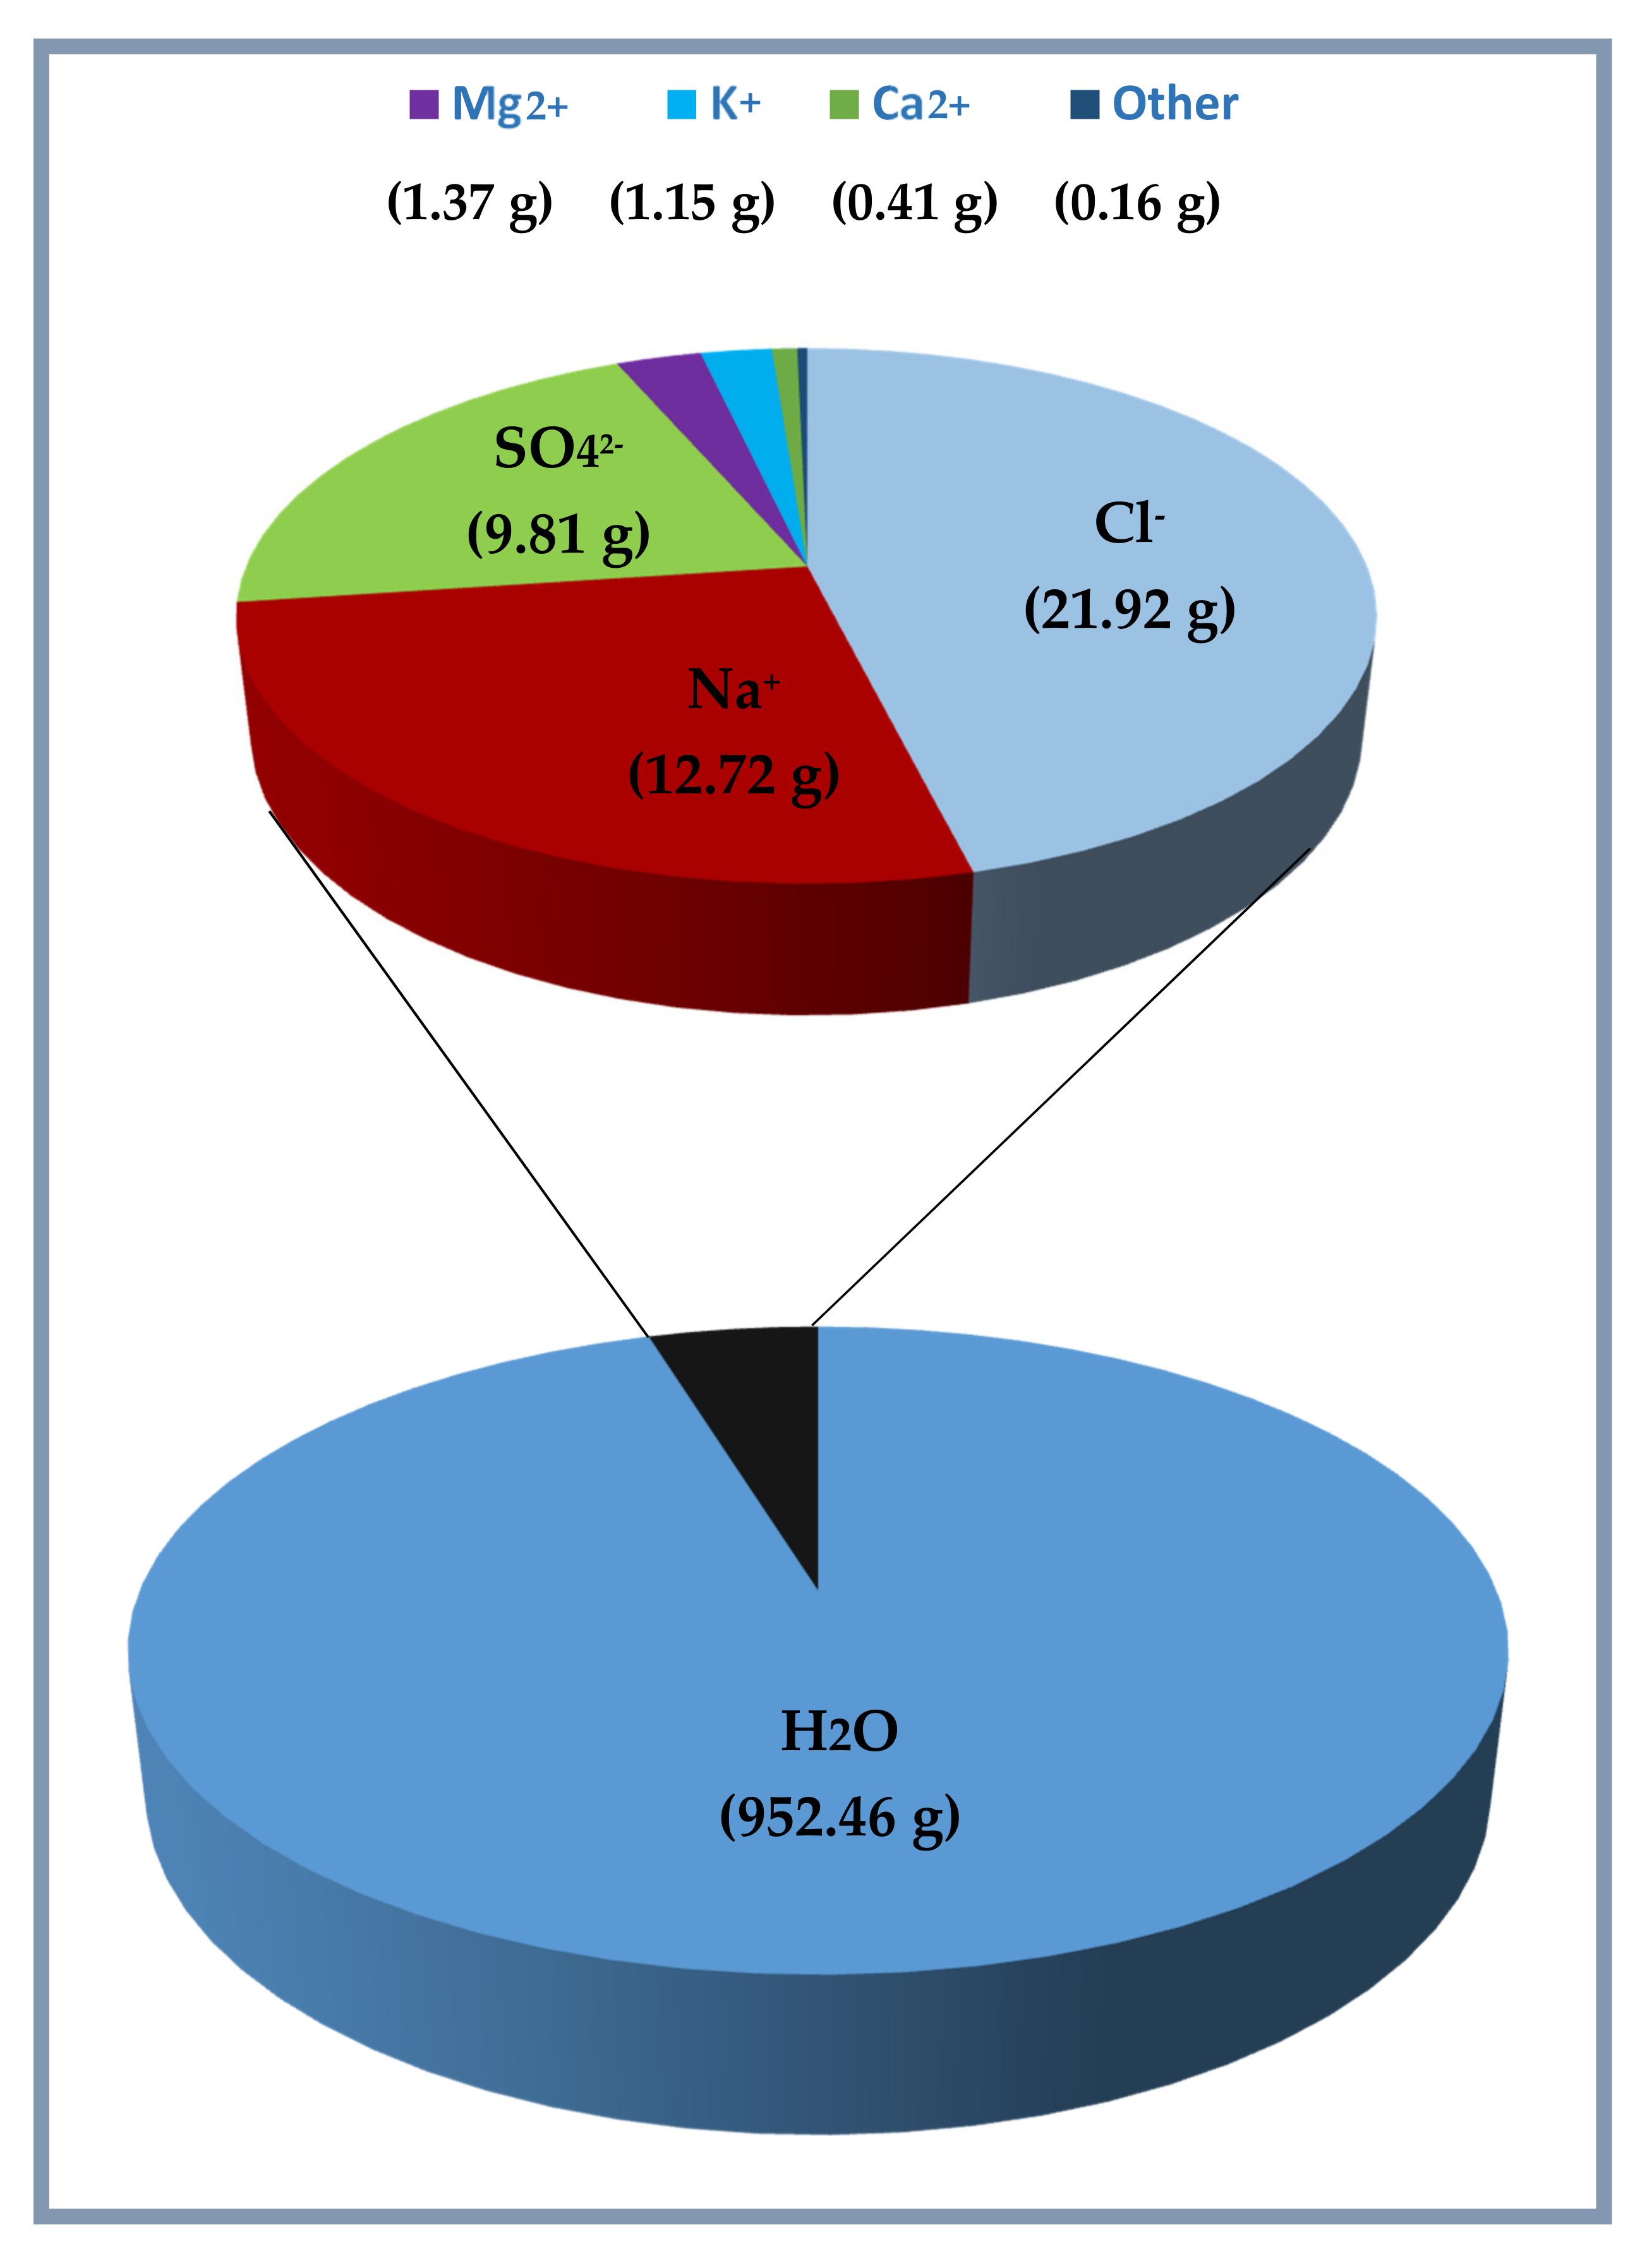
By its chemical composition, the water contained in the analyzed sediment samples represents, therefore, a solution consisting of about 95.2% of water, where dissolved salts are about 4.7%. In Figure 8, the results reported in Table 4 and Table 5 are summarized in relation to chemical composition of 1 kg of water contained in the sediment samples. The obtained results demonstrate that the salinity obtained by the mean of different sediment samples is 47.54‰, and it can be converted as a function of the chlorinity Cl (‰) (mass of halides in a given mass of sea water) that, for the results reported here, is defined by the relationship S (‰) = 2.18 CI (‰).
The obtained results are in agreement with those related to other studies about the composition of the major components of sea water. The oscillation referred to single ion concentration is not largely relevant, and demonstrated that the contained major cations and anions are constant and that they contribute to physical chemical properties, permitting to treat ocean waters as an electrolyte solution. However, the obtained mean of salinity is higher when compared with that of marine water, which is about 35‰; this is because of the fact that, in sediments, the dissolution/precipitation processes, which can happen in different manners at different depths, can change the relative composition of dissolved ions. In addition, it was reported that the cations (Na+, Mg2+, K+, Sr2+) concentration is independent of the depth, with the exception of Ca2+, which increases with the depth as a result of the dissolution of CaCO3, like in deep ocean waters, where the high pressure can affect the solubility [40].

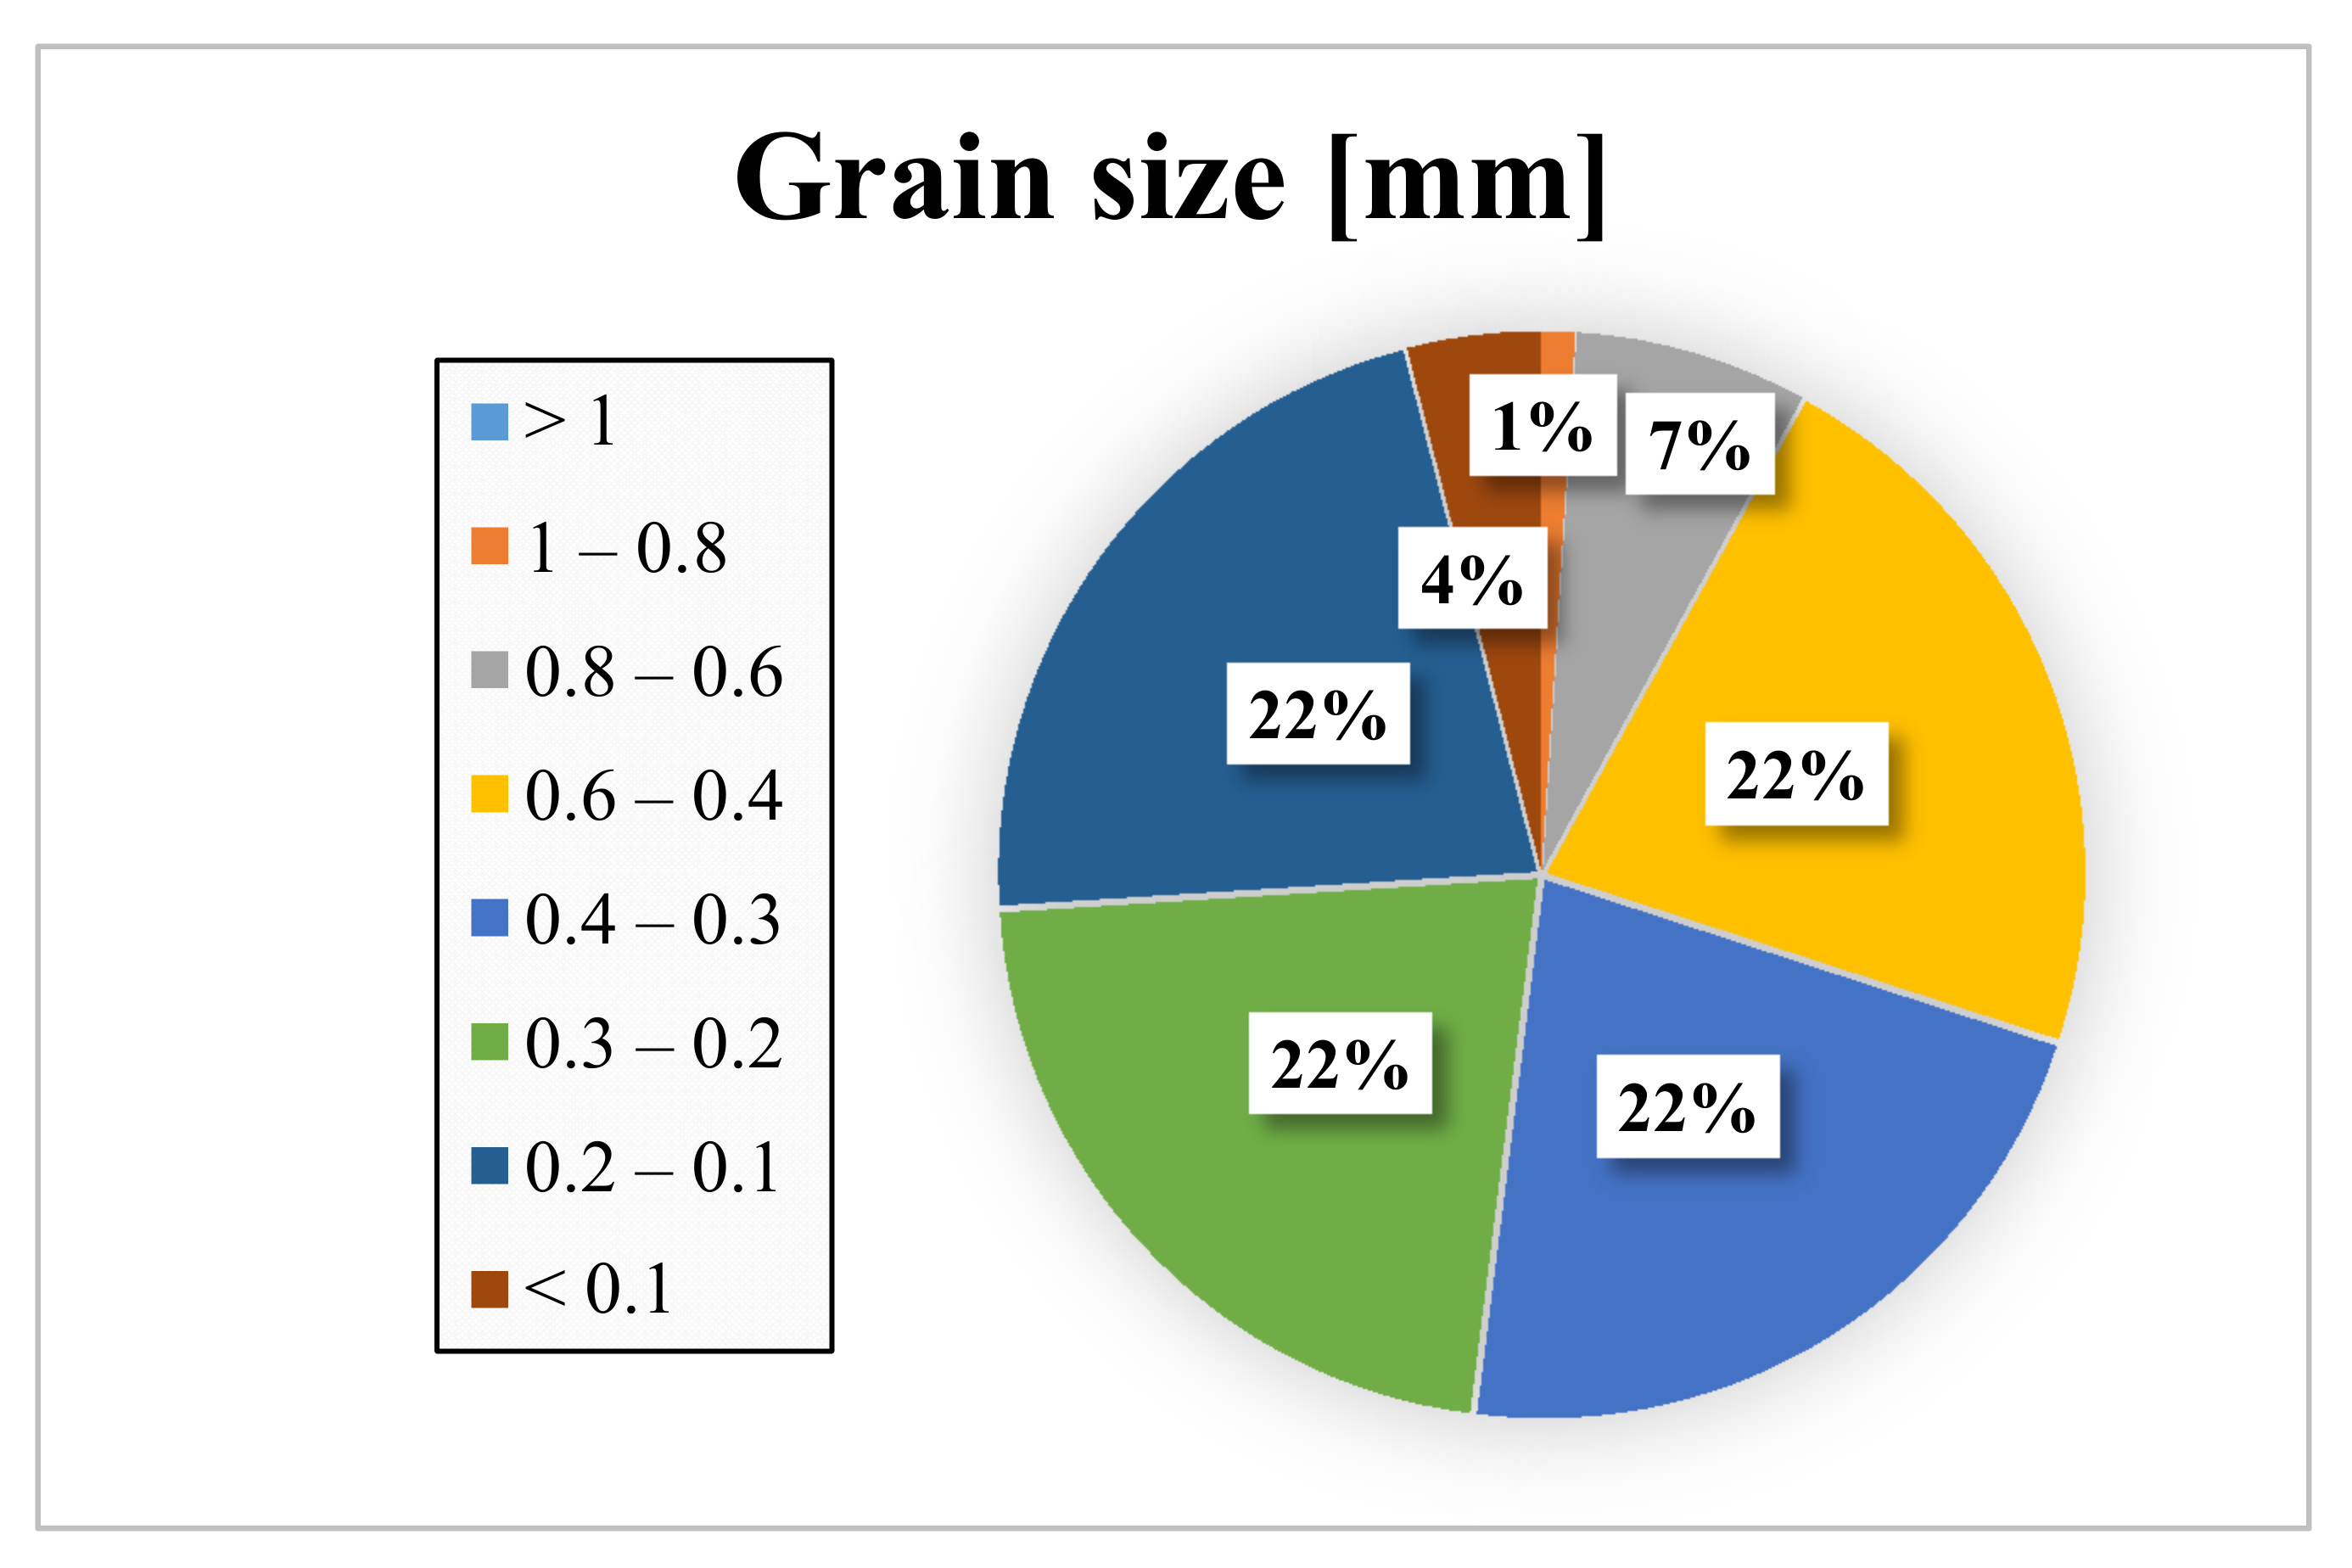
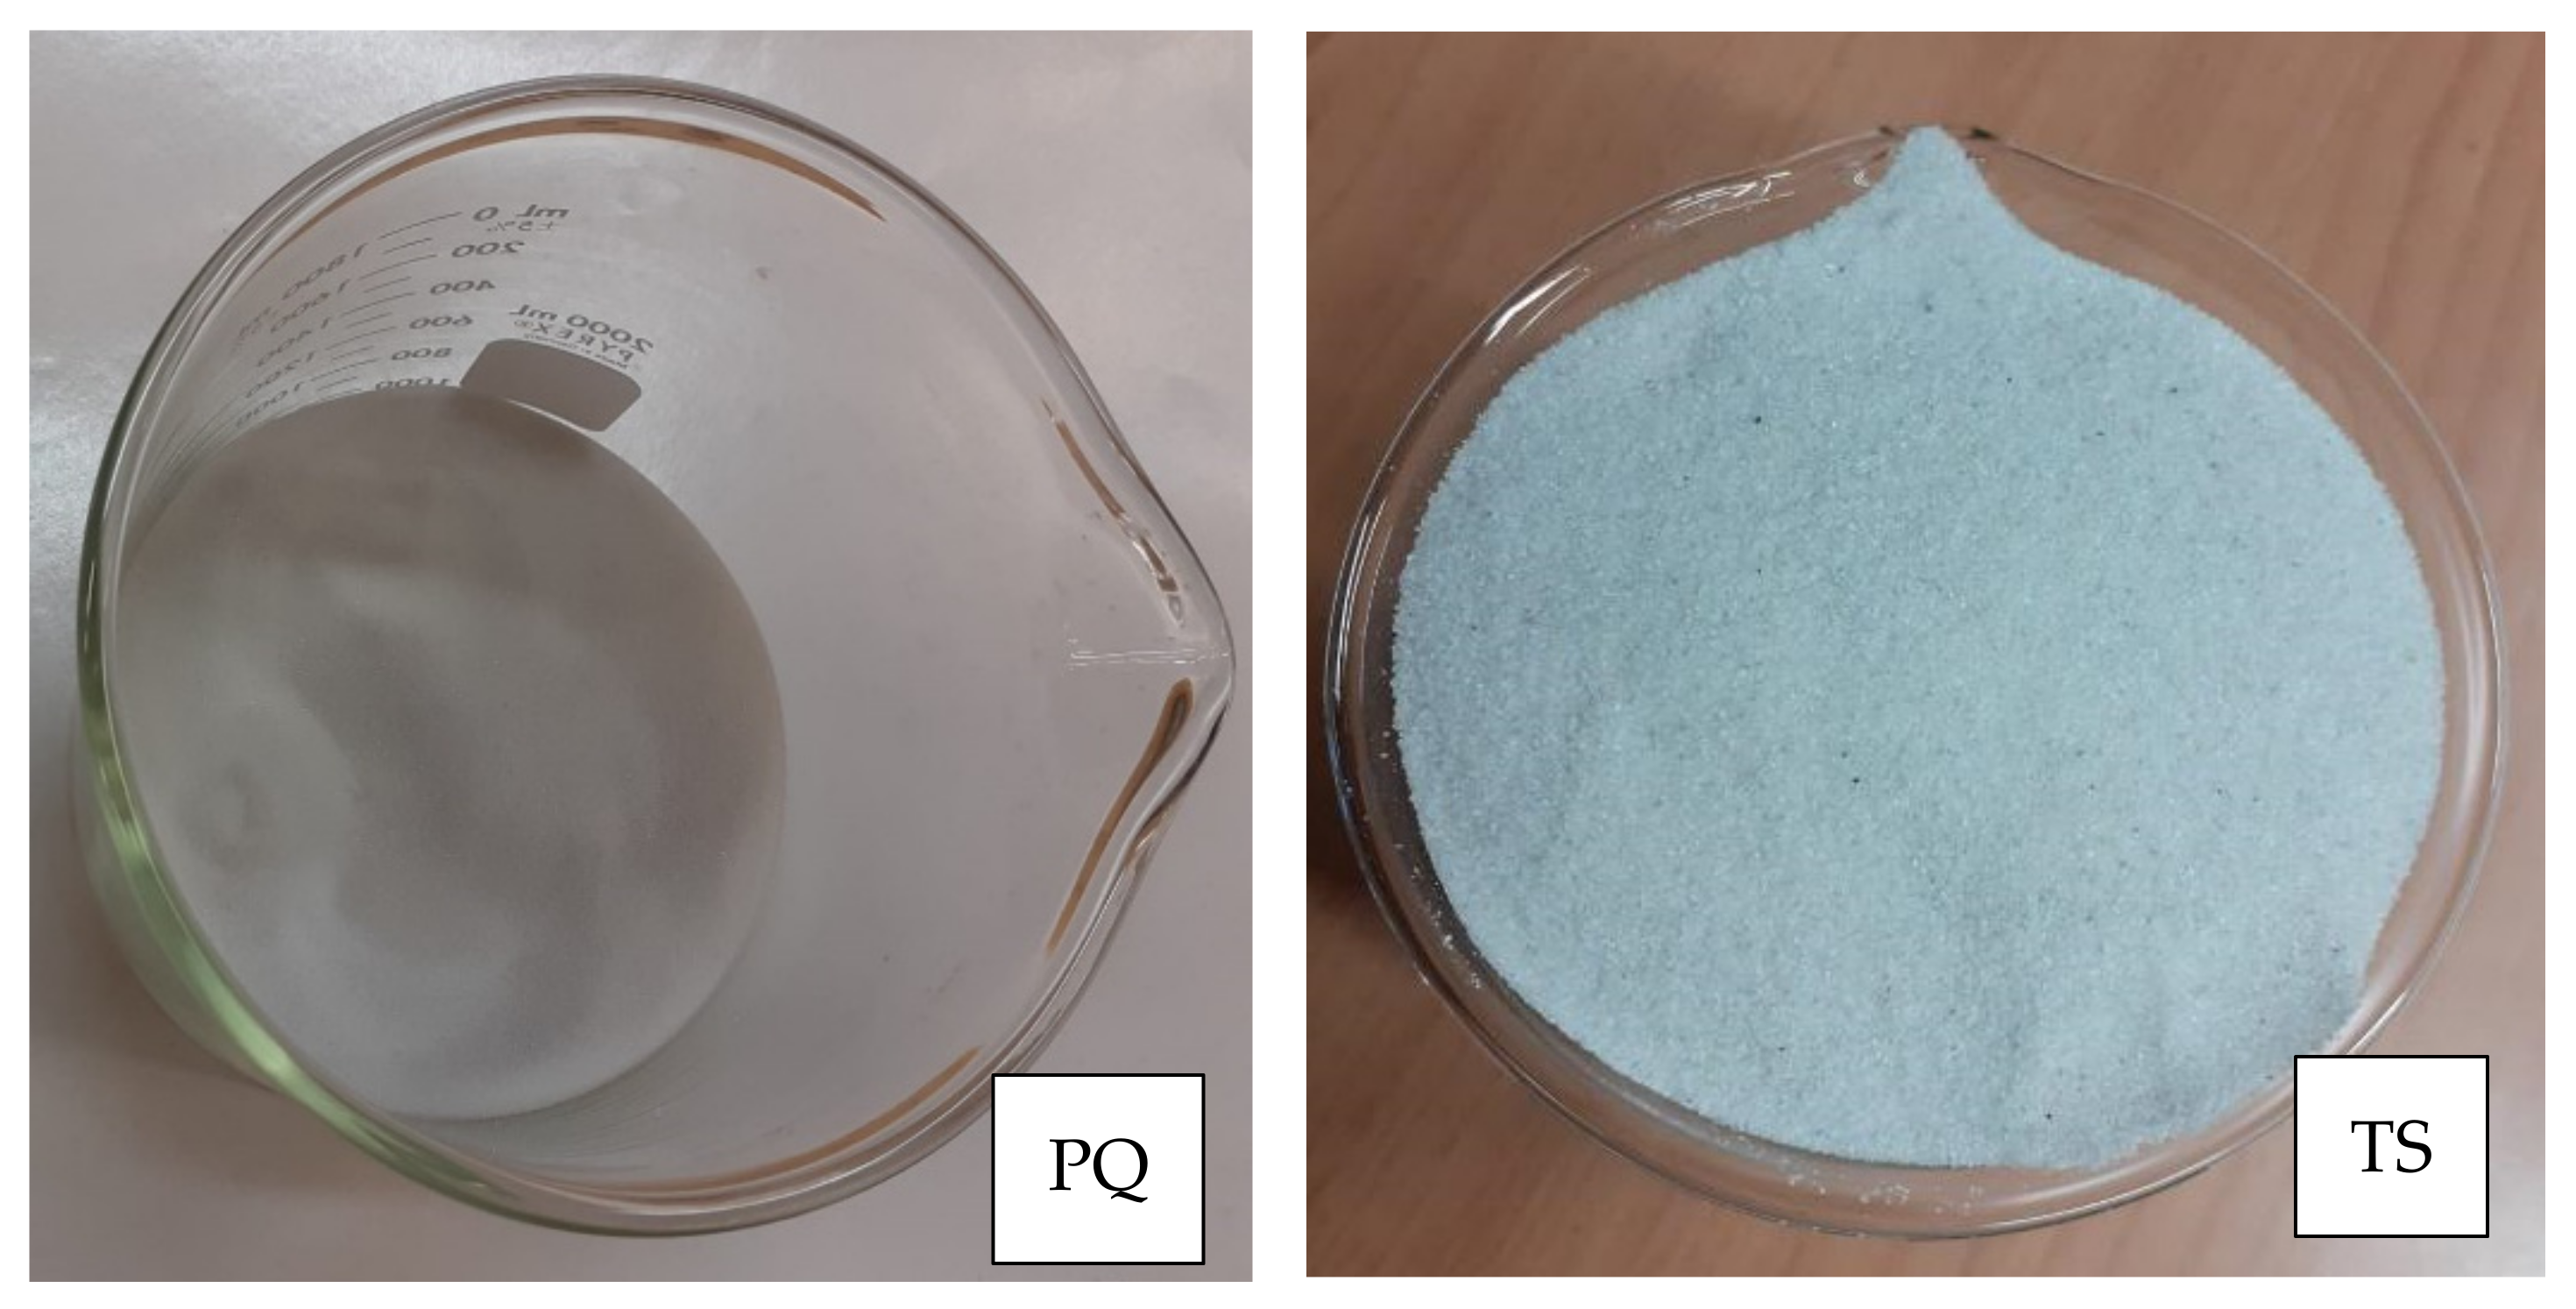
3.2. Effects Related to Sand Composition and Its Grainsize

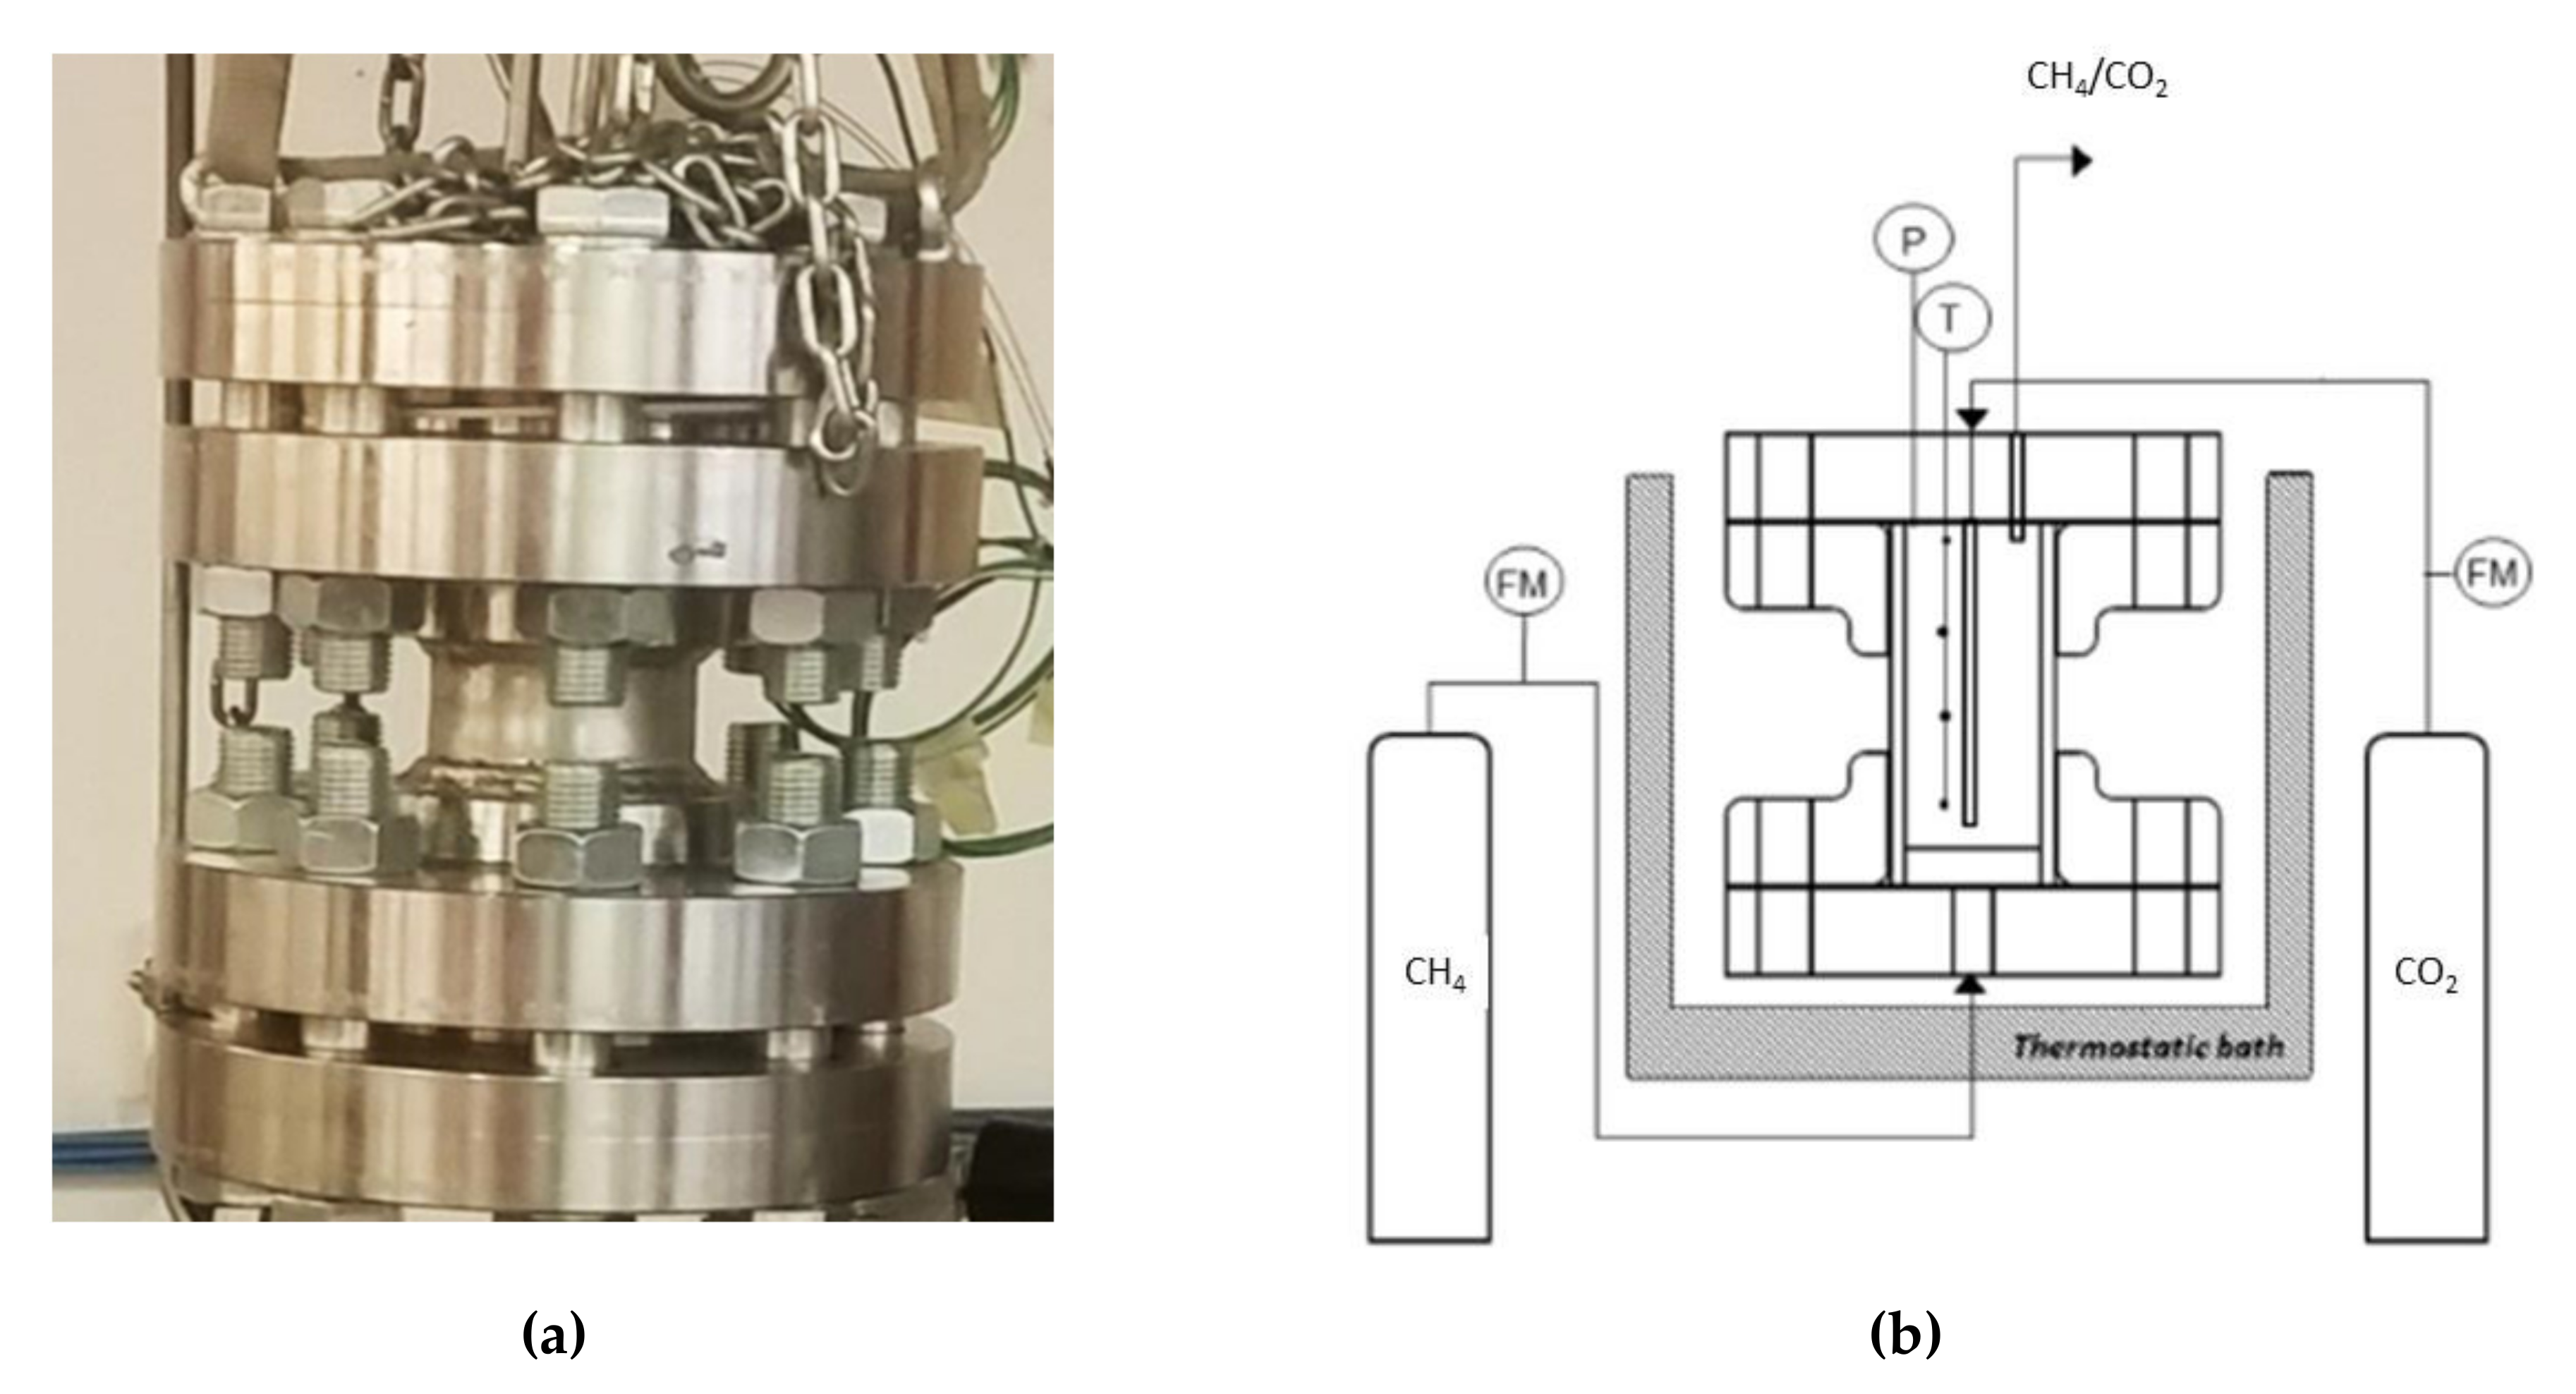
As explained before, two types of experiments were made. In both cases, pure methane hydrate formation was performed, and the difference stayed in the type of sand used. All tests were described by showing the pressure and temperature trend over time as well as the pressure trend as a function of temperature. Table 6 and Table 7 contain the most significant parameters related to tests carried out in pure quartz sand, while Table 8 and Table 9 are referred to tests made with sand TS.
The parameters described in those tables reveal substantial differences between these two types of test. First of all, pressure required to trigger hydrate formation was considerably higher in tests made in sand TS. In this latter case, a pressure about 58.27–60.05 bar was needed, while in the presence of sand PQ, pressure ranged from 47.56 to 48.18 bar. Considering that the same quantity of liquid water was inserted inside the reactor in both cases, such a difference in pressure led to higher values of parameter CH4g and [CH4g] in Tests 3 and 4. This difference is visible in all points. Concerning time, hydrate formation was completed in 1617–1878 min in pure quartz sand (see PT3, absolute values); conversely, 2157–4642 min was necessary for sand TS. This means that the natural silica-based sand tested in this work acted as a kinetic inhibitor for hydrate formation, thus requiring more time to reach results similar to those produced in sand PQ. This difference in time required was observed mainly in PT3* and PT3, while PT2 did not provide meaningful information in this sense, because even the corresponding time lapse measured is extremely limited. Concerning kinetic, a small difference was also noticed when analyzing parameter dCH4/dt. Considering its absolute value, in Tests 1 and 2, this parameter increased with time. In particular, the pressure reduction due to hydrate formation did not cause a process deceleration; on the contrary, the reaction seemed to proceed faster in the last phase of hydrate formation, during which pressure obviously assumed the lowest values. In Test 1, dCH4/dt started from −4.91 × 10⁻⁴ mol/min and reached −9.78 × 10⁻⁴ mol/min in PT3, even if in PT3*, it slightly decreased compared with its previous value registered in PT2. In the same way, in Test 2, it was equal to −2.71 × 10⁻⁴ mol/min in PT 2, −3.15 × 10⁻⁴ mol/min in PT3*, and −3.39 × 10⁻⁴ mol/min in PT3. Conversely, in Tests 3 and 4, it constantly decreased with the ongoing process; in Test 3, it moved from −1.85 × 10⁻³ to −1.11 × 10⁻⁴ mol/min, and in Test 4, it moved from −2.59 × 10⁻⁴ to −4.05 × 10⁻⁵ mol/min. Finally, a slightly higher number of formed hydrae was measured in the presence of TS. Here, 0.297–0.366 moles of hydrate were observed, rather than 0.21–0.217 moles measured in Tests 1 and 2. This means that, even if this second type of sand clearly acted as a kinetic inhibitor for hydrate formation, it did not prevent reaching similar or even better results than those in sand PQ in terms of hydrate formation. This last aspect was also highlighted with parameter GU%, which proved how the gas uptake was higher in Tests 3 and 4.
Starting from an initial sand pores’ saturation with water equal to 55%, Table 10 shows how that parameter varied due to hydrate formation.
Figure 9, Figure 10, Figure 11, Figure 12, Figure 13, Figure 14, Figure 15 and Figure 16 show both the pressure and temperature trend over time and the pressure trend as a function of temperature for all experiments; Figure 9, Figure 10, Figure 11 and Figure 12 describe tests made with sand PQ, while the remaining describe tests made with sand TS.
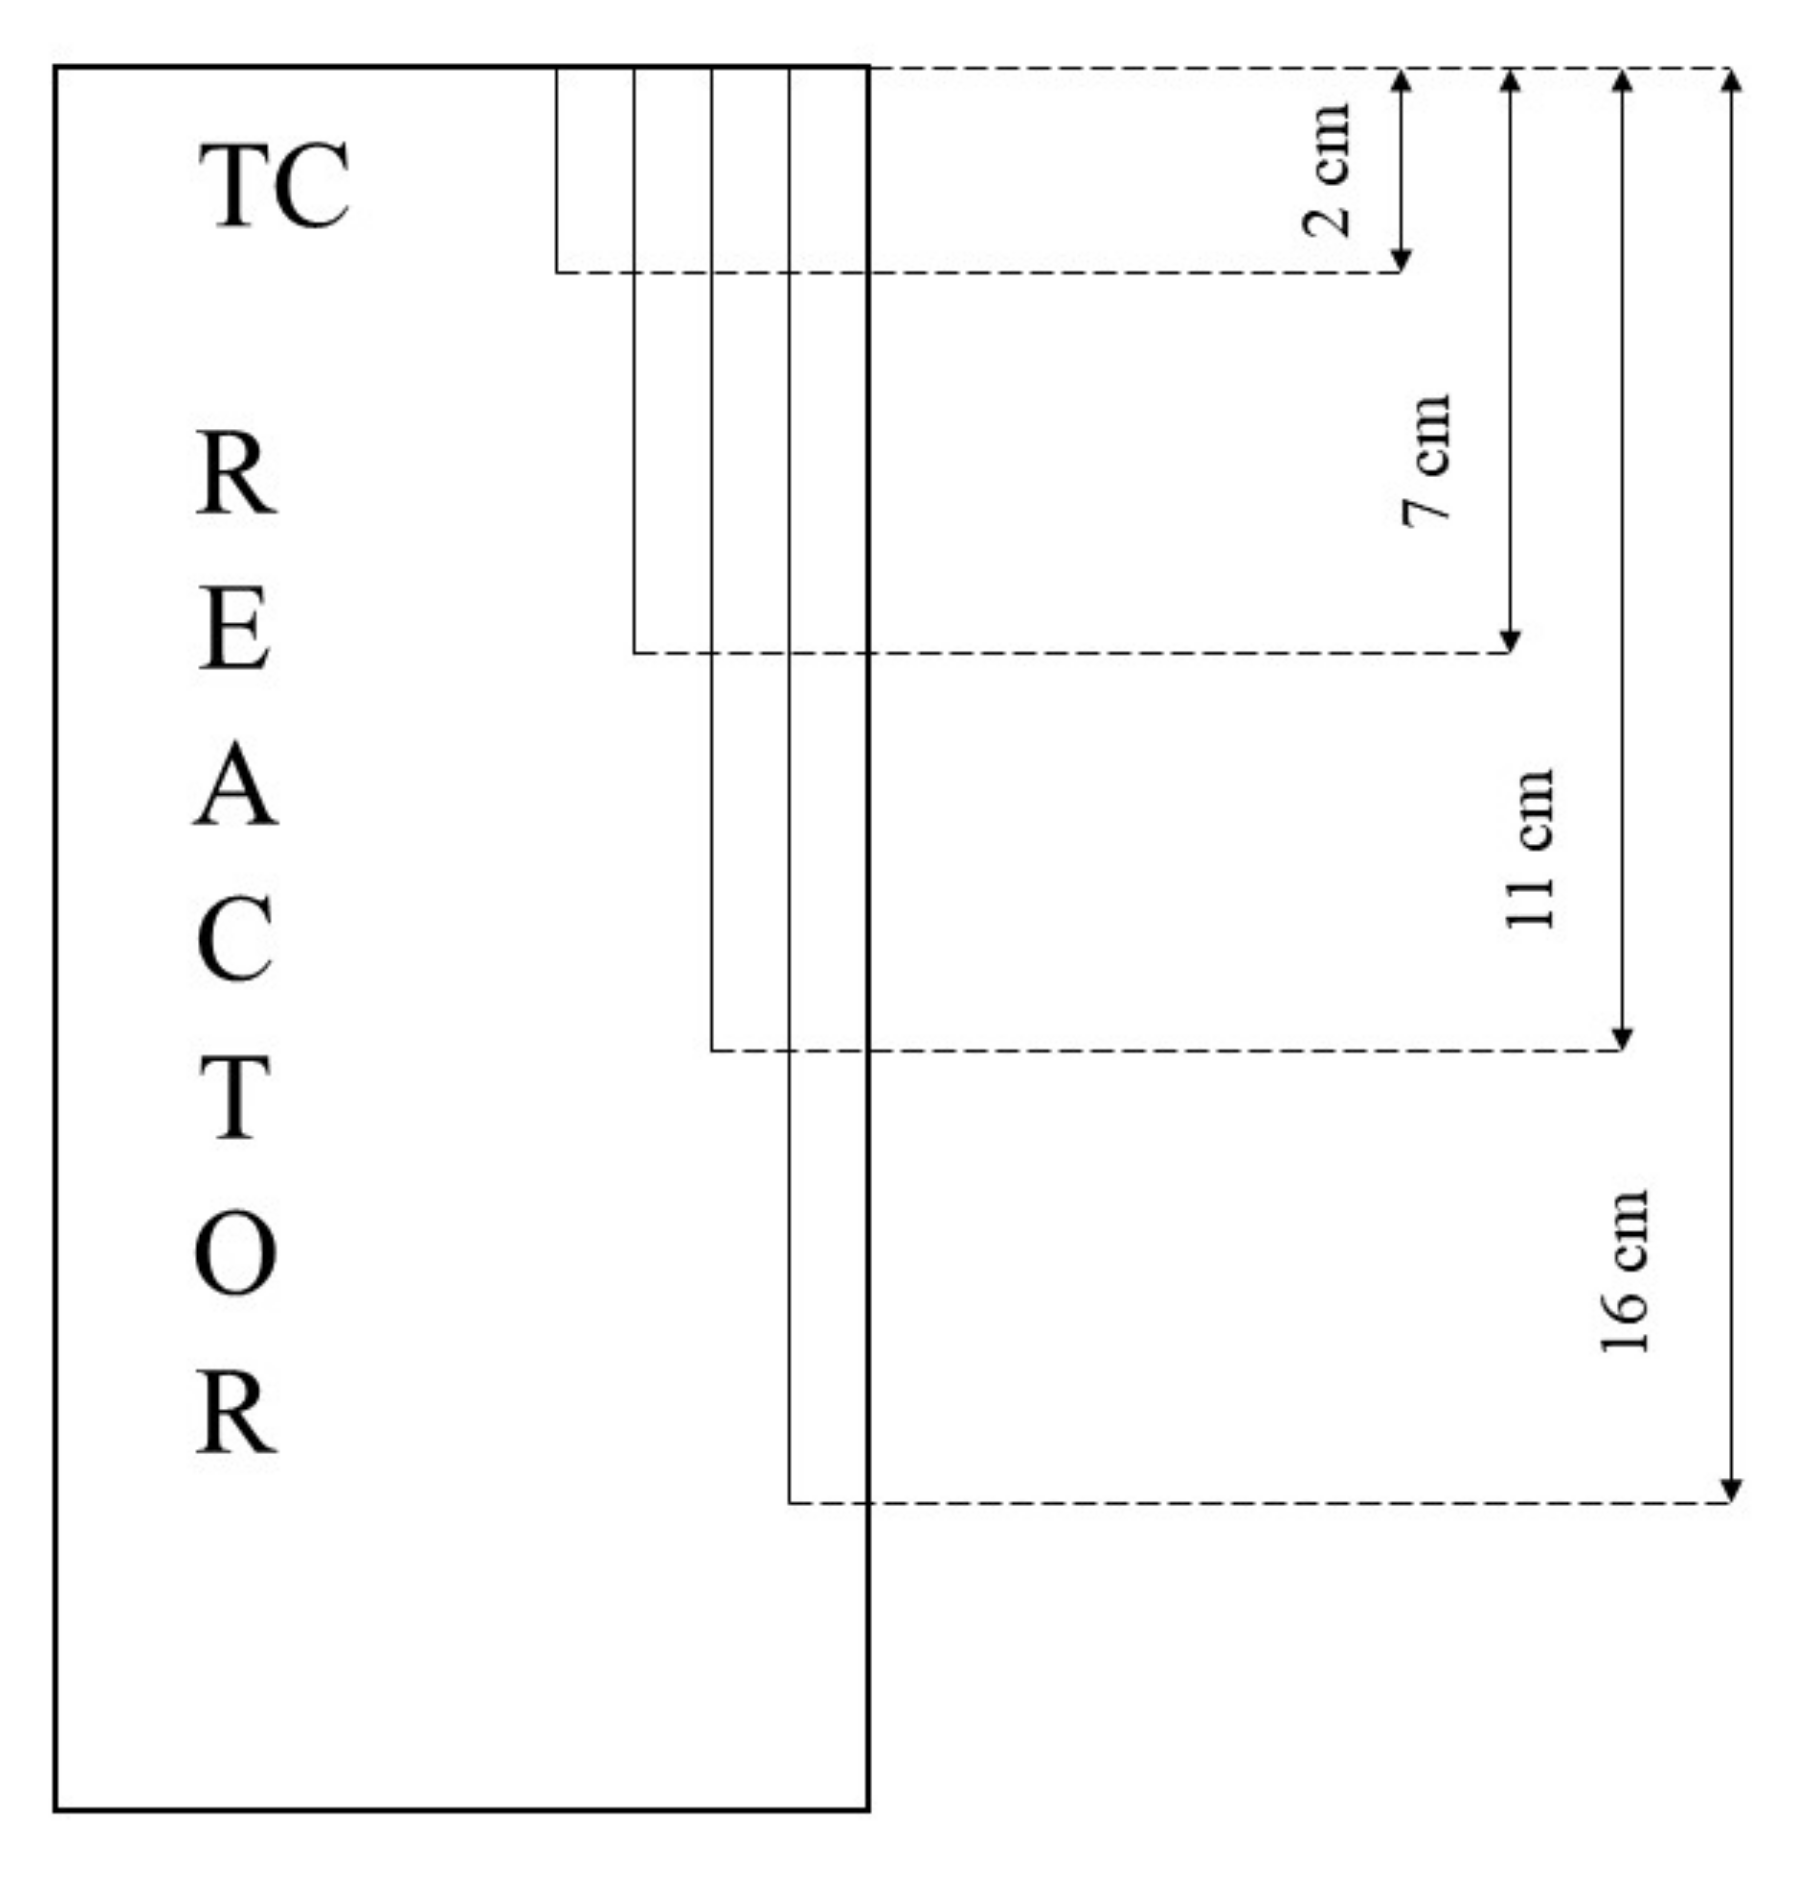
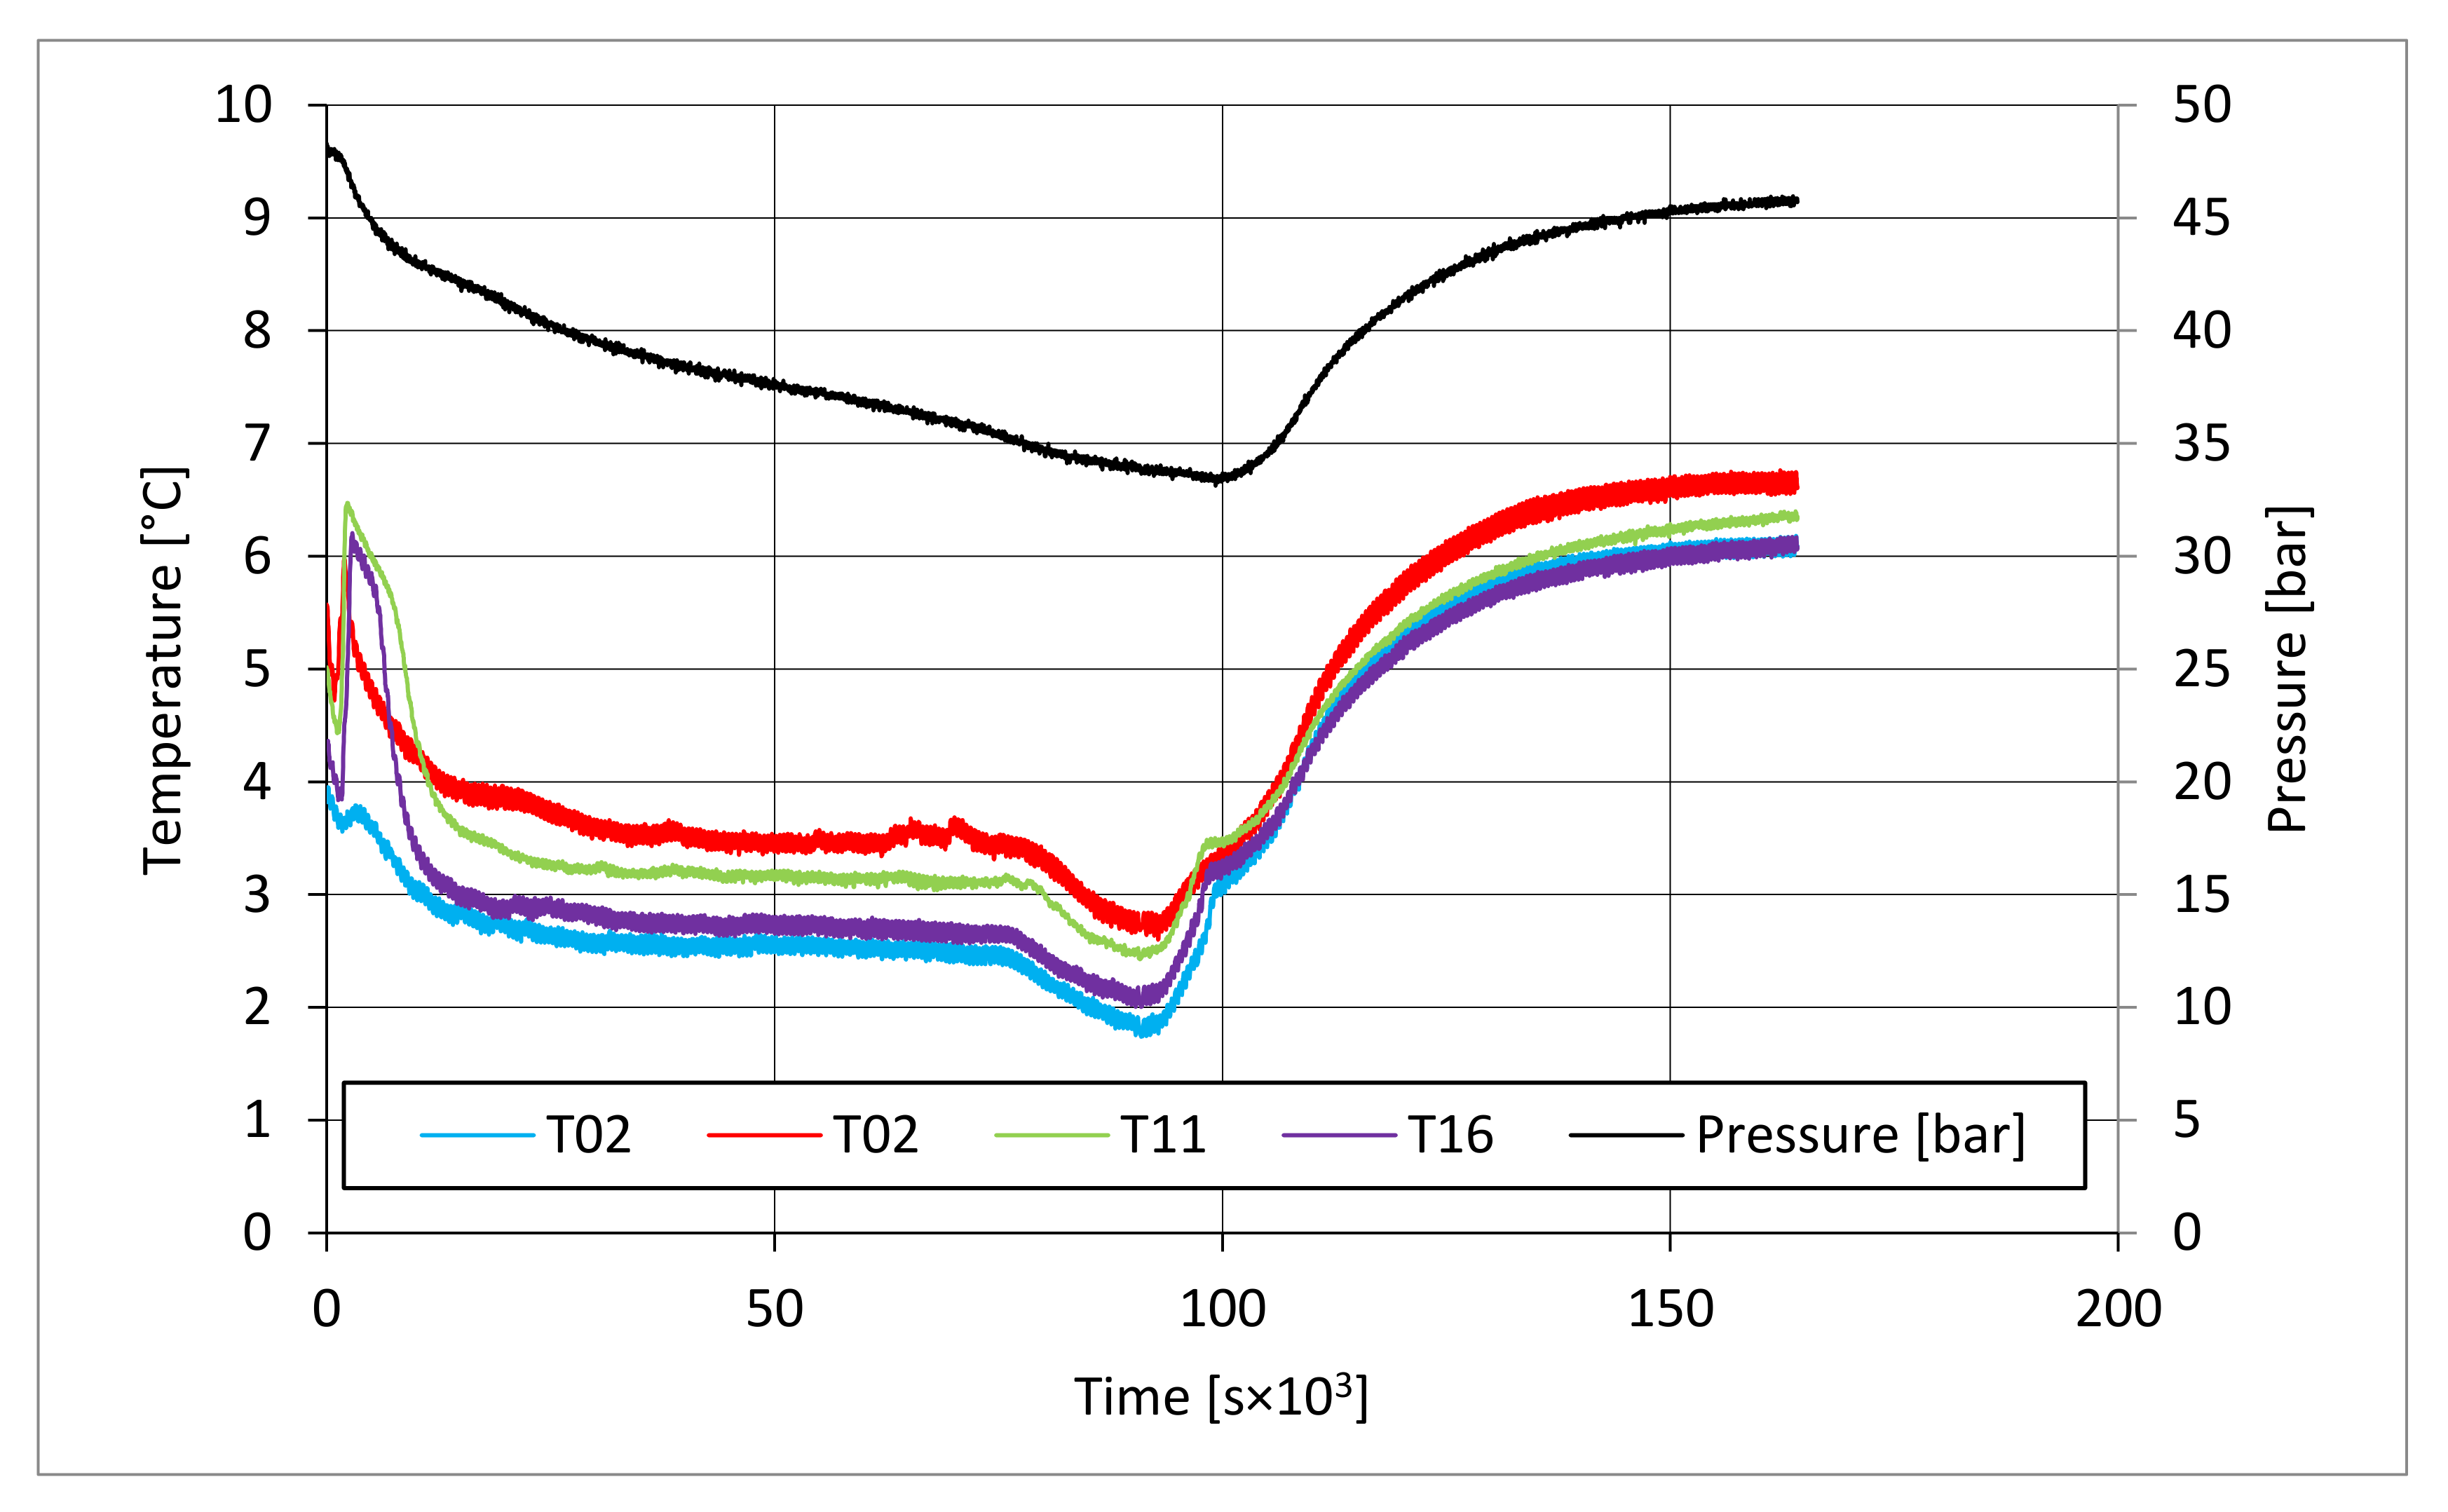
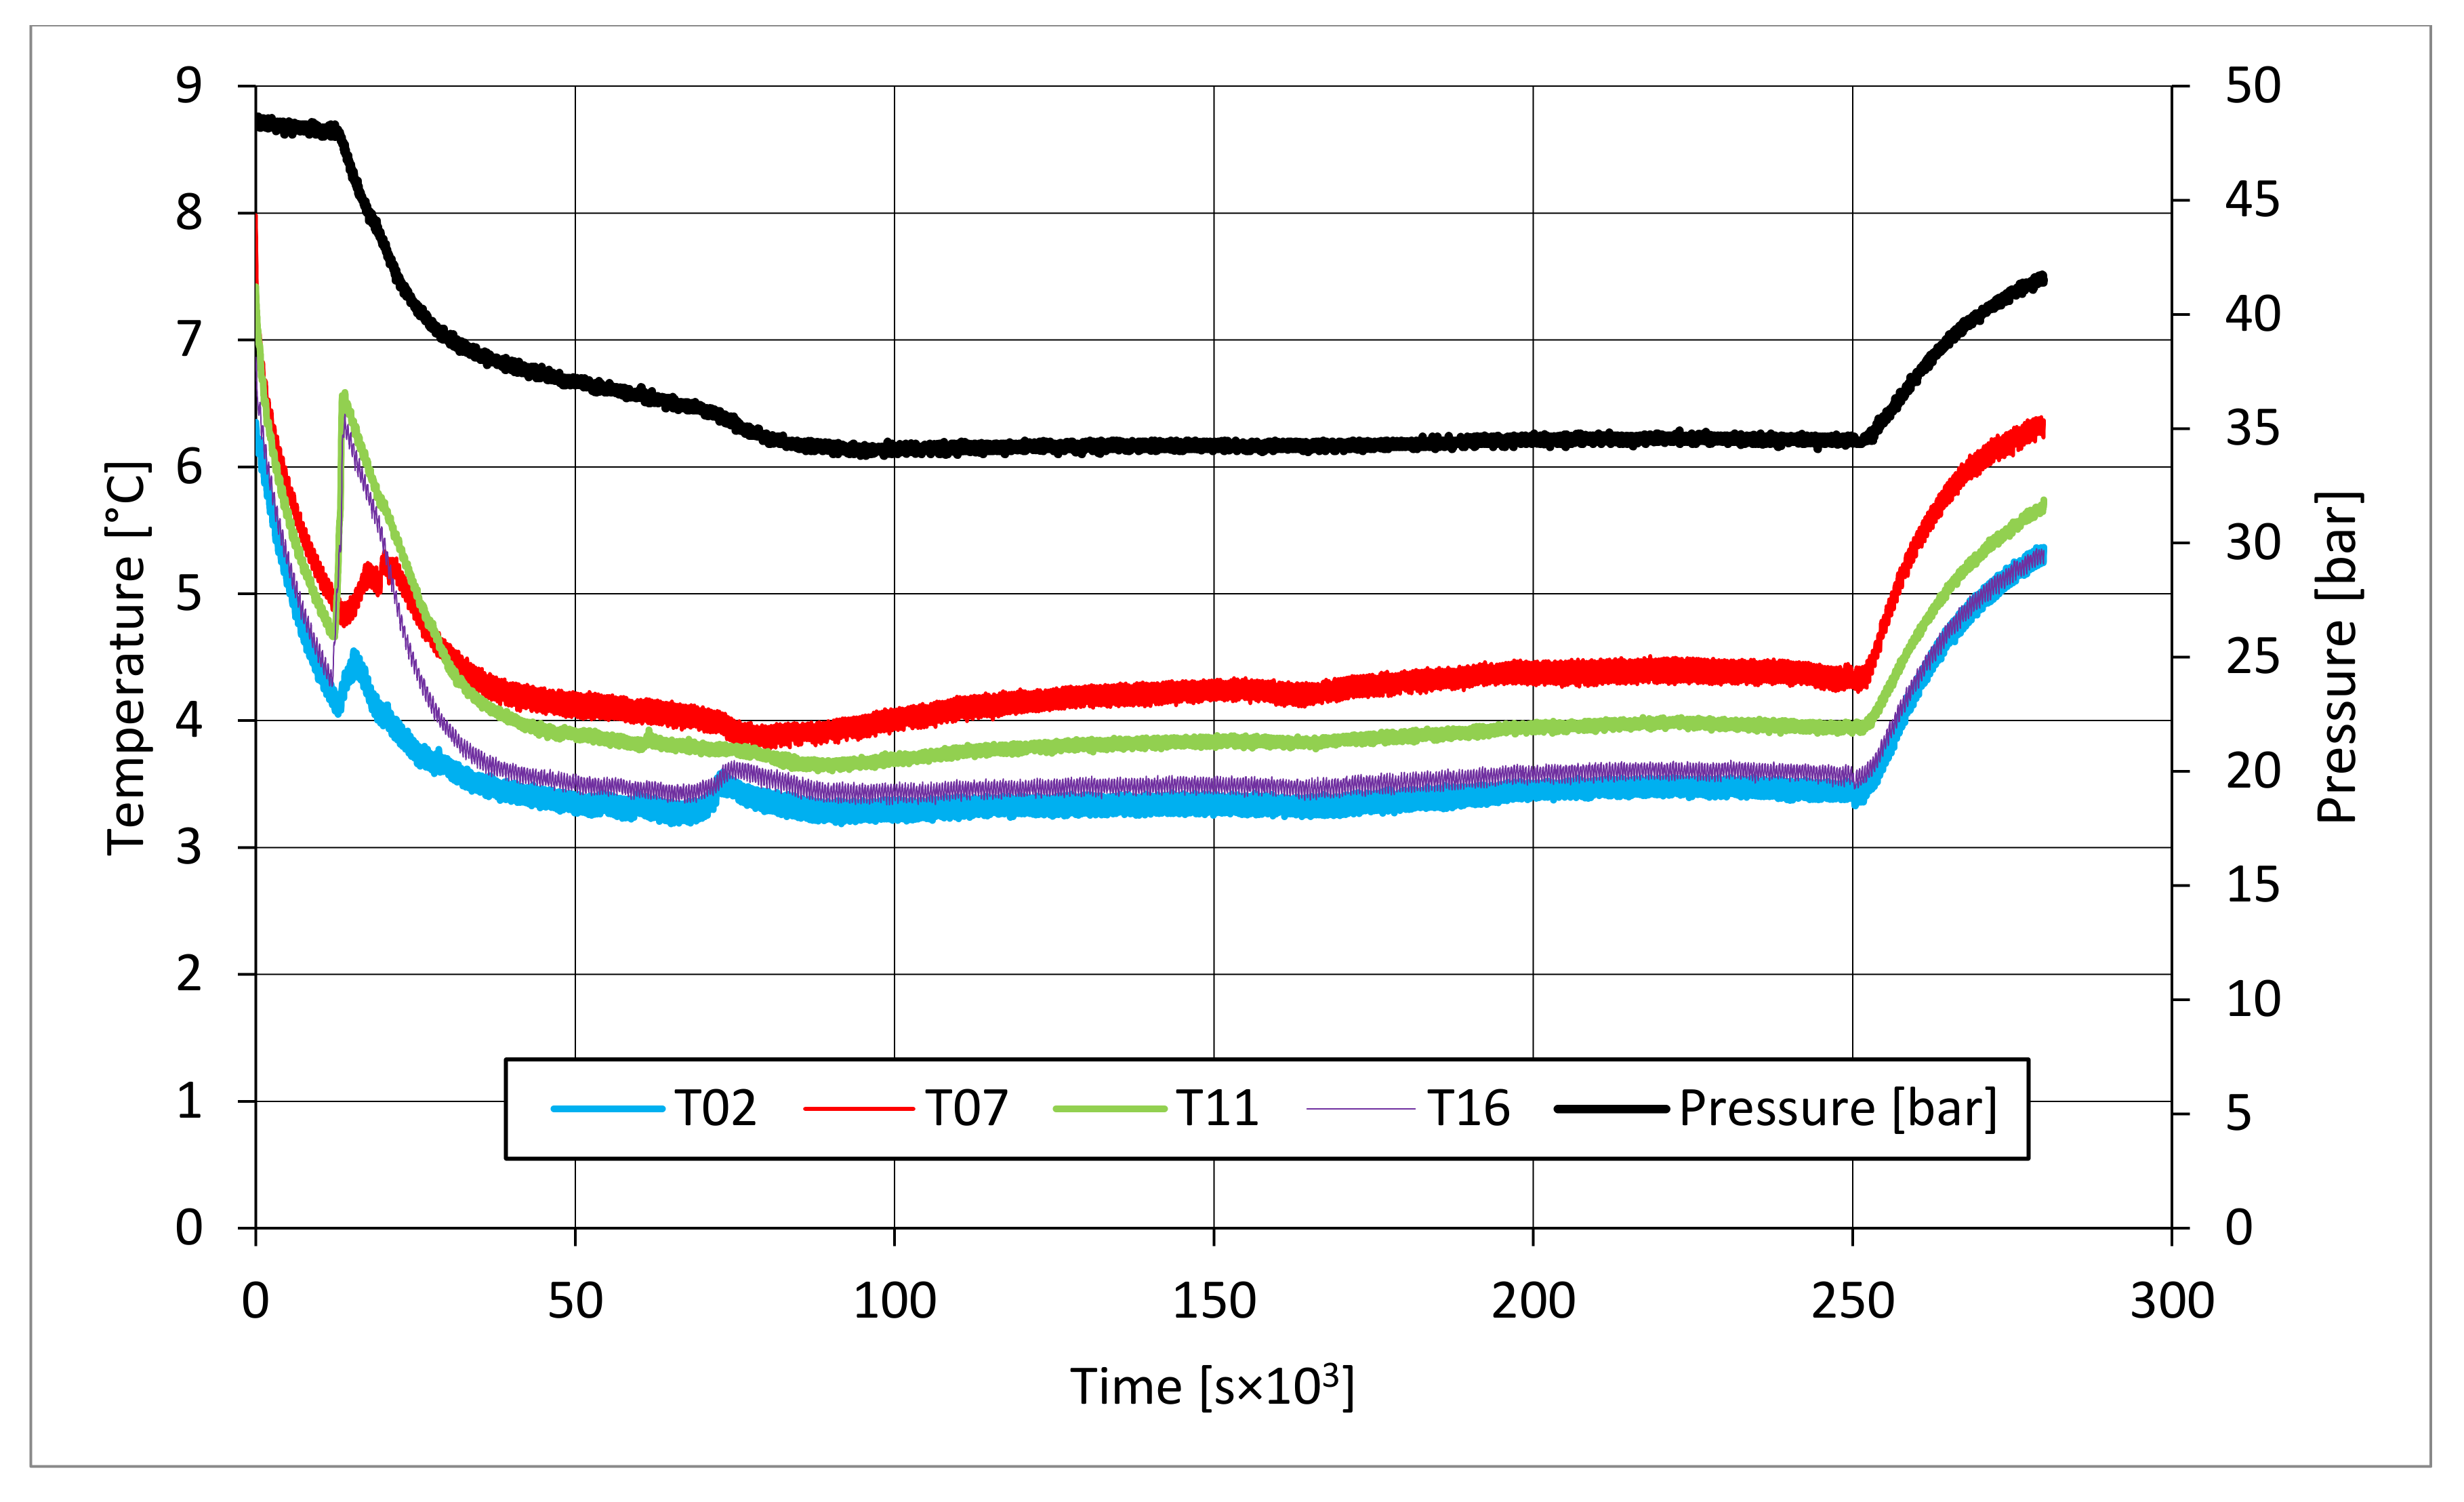
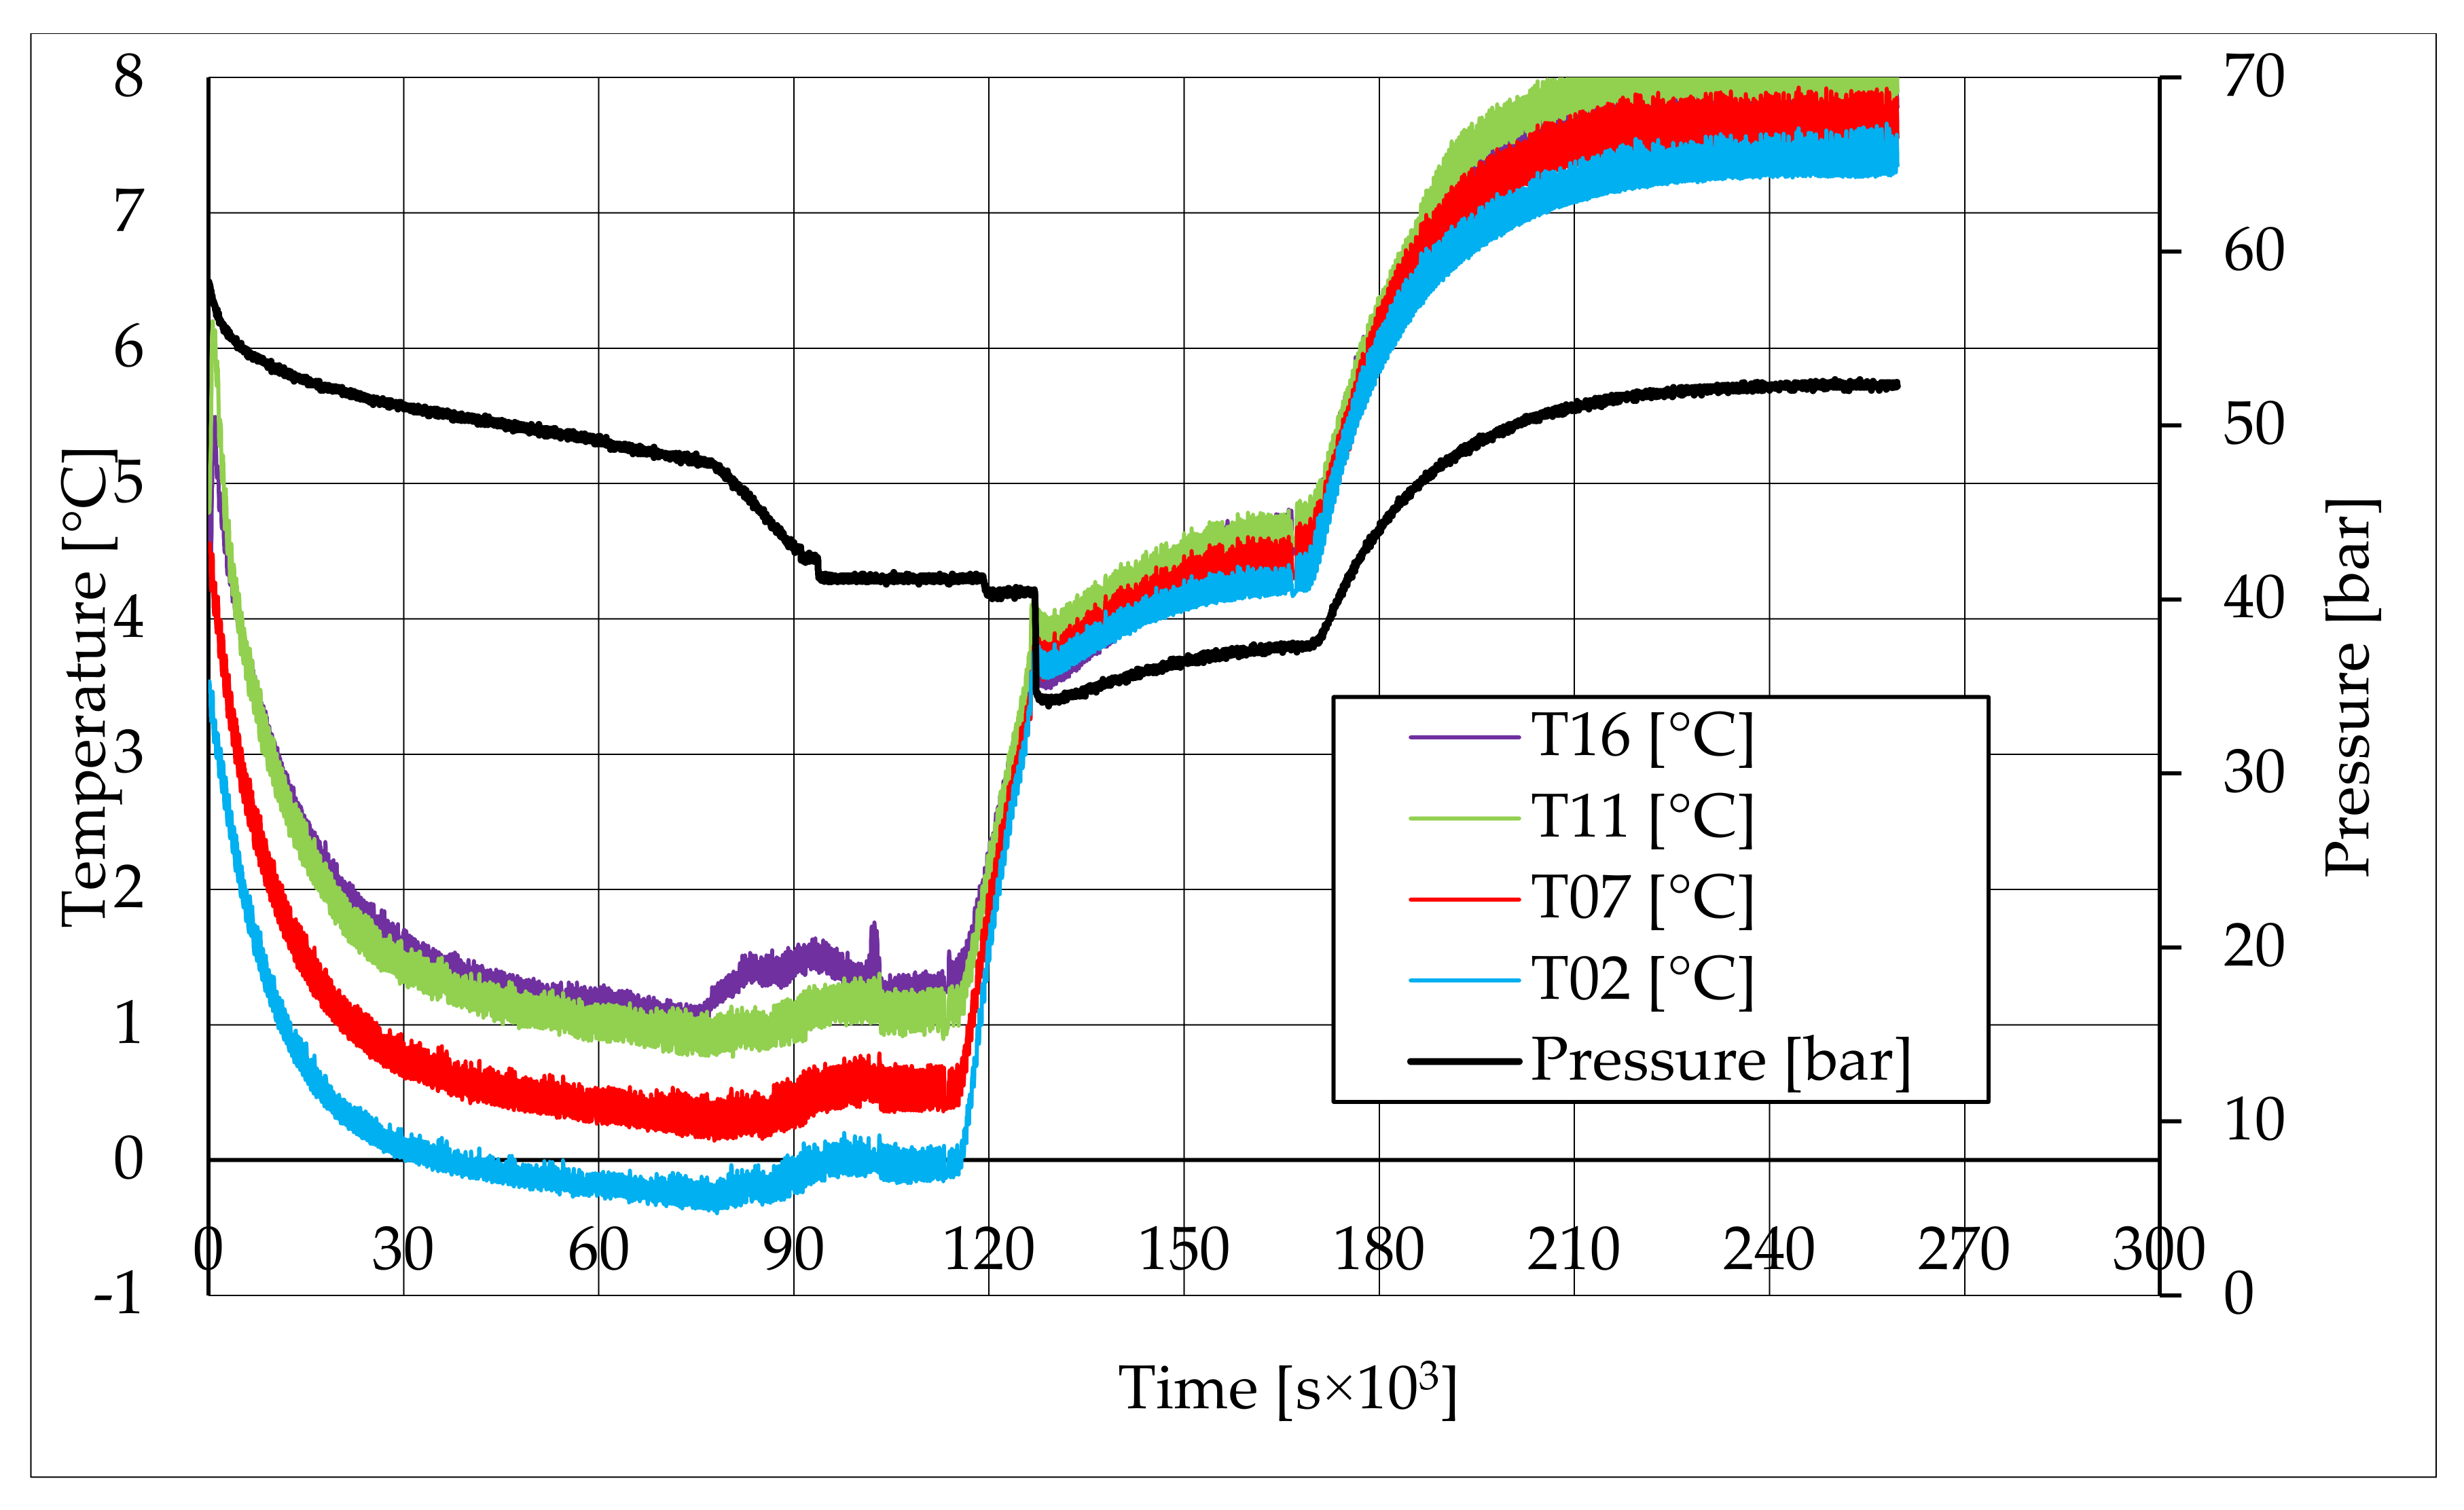
In all tests, the temperature trend over time revealed the exothermic nature of hydrate formation; in all cases, an initial temperature peak was observed, then temperature decreased till the whole system again established the thermal balance. In Test 1 and Test 2, this temperature peak did not occur immediately, or as soon as pressure was kept to its maximum value, it showed a slight delay. This mainly depended on the stochastic nature of hydrate, which may not occur immediately when thermodynamic conditions are feasible for its formation. Such a delay was useful to well highlight the triggering of hydrate formation. Once temperature quickly increased, pressure started decreasing significantly. This aspect occurred in all experiments; however, the slight delay present in Test 1 and Test 2 allowed to clearly identify the difference between the pressure trend when only a sporadic hydrate formation occurred and when the reaction concerned the whole reactor. The temperature trend over time also proved how methane hydrate formation mainly concerned the lower region of the internal volume. In contrast to the others, thermocouple T02 did not measure any relevant temperature variation. It is the only device positioned above the water–sand mixture, where only gaseous methane is present immediately before beginning the experiment. Its trend proved that, in this region, hydrate formation did not occur or, more in general, it was negligible, as already proved in previous works [41]. For instance, in Test 2, thermocouple T02 registered a small temperature peak; however, it was an order of magnitude lower than those measured by other thermocouples. Thermocouple T07 is positioned immediately below the free surface of the water–sand mixture, and registered a consistent temperature variation, proving that massive hydrate formation occurred in the corresponding region. In particular, it was noticed during Test 1 that the most abundant hydrate formation was observed in correspondence of T11 and T16, or in the lower portion of the internal volume. Both thermocouples registered the maximum temperature values during all tests. Even if they are positioned at different depths inside the reactor, at 11 and 16 cm, respectively, from the upper surface, both of them are situated in a similar environment; they are immersed in the water–sand mixture and are far from the water free surface. This is the reason their trend was found to be extremely similar in all experiments. A moderate difference was observed in Test 3 (see 
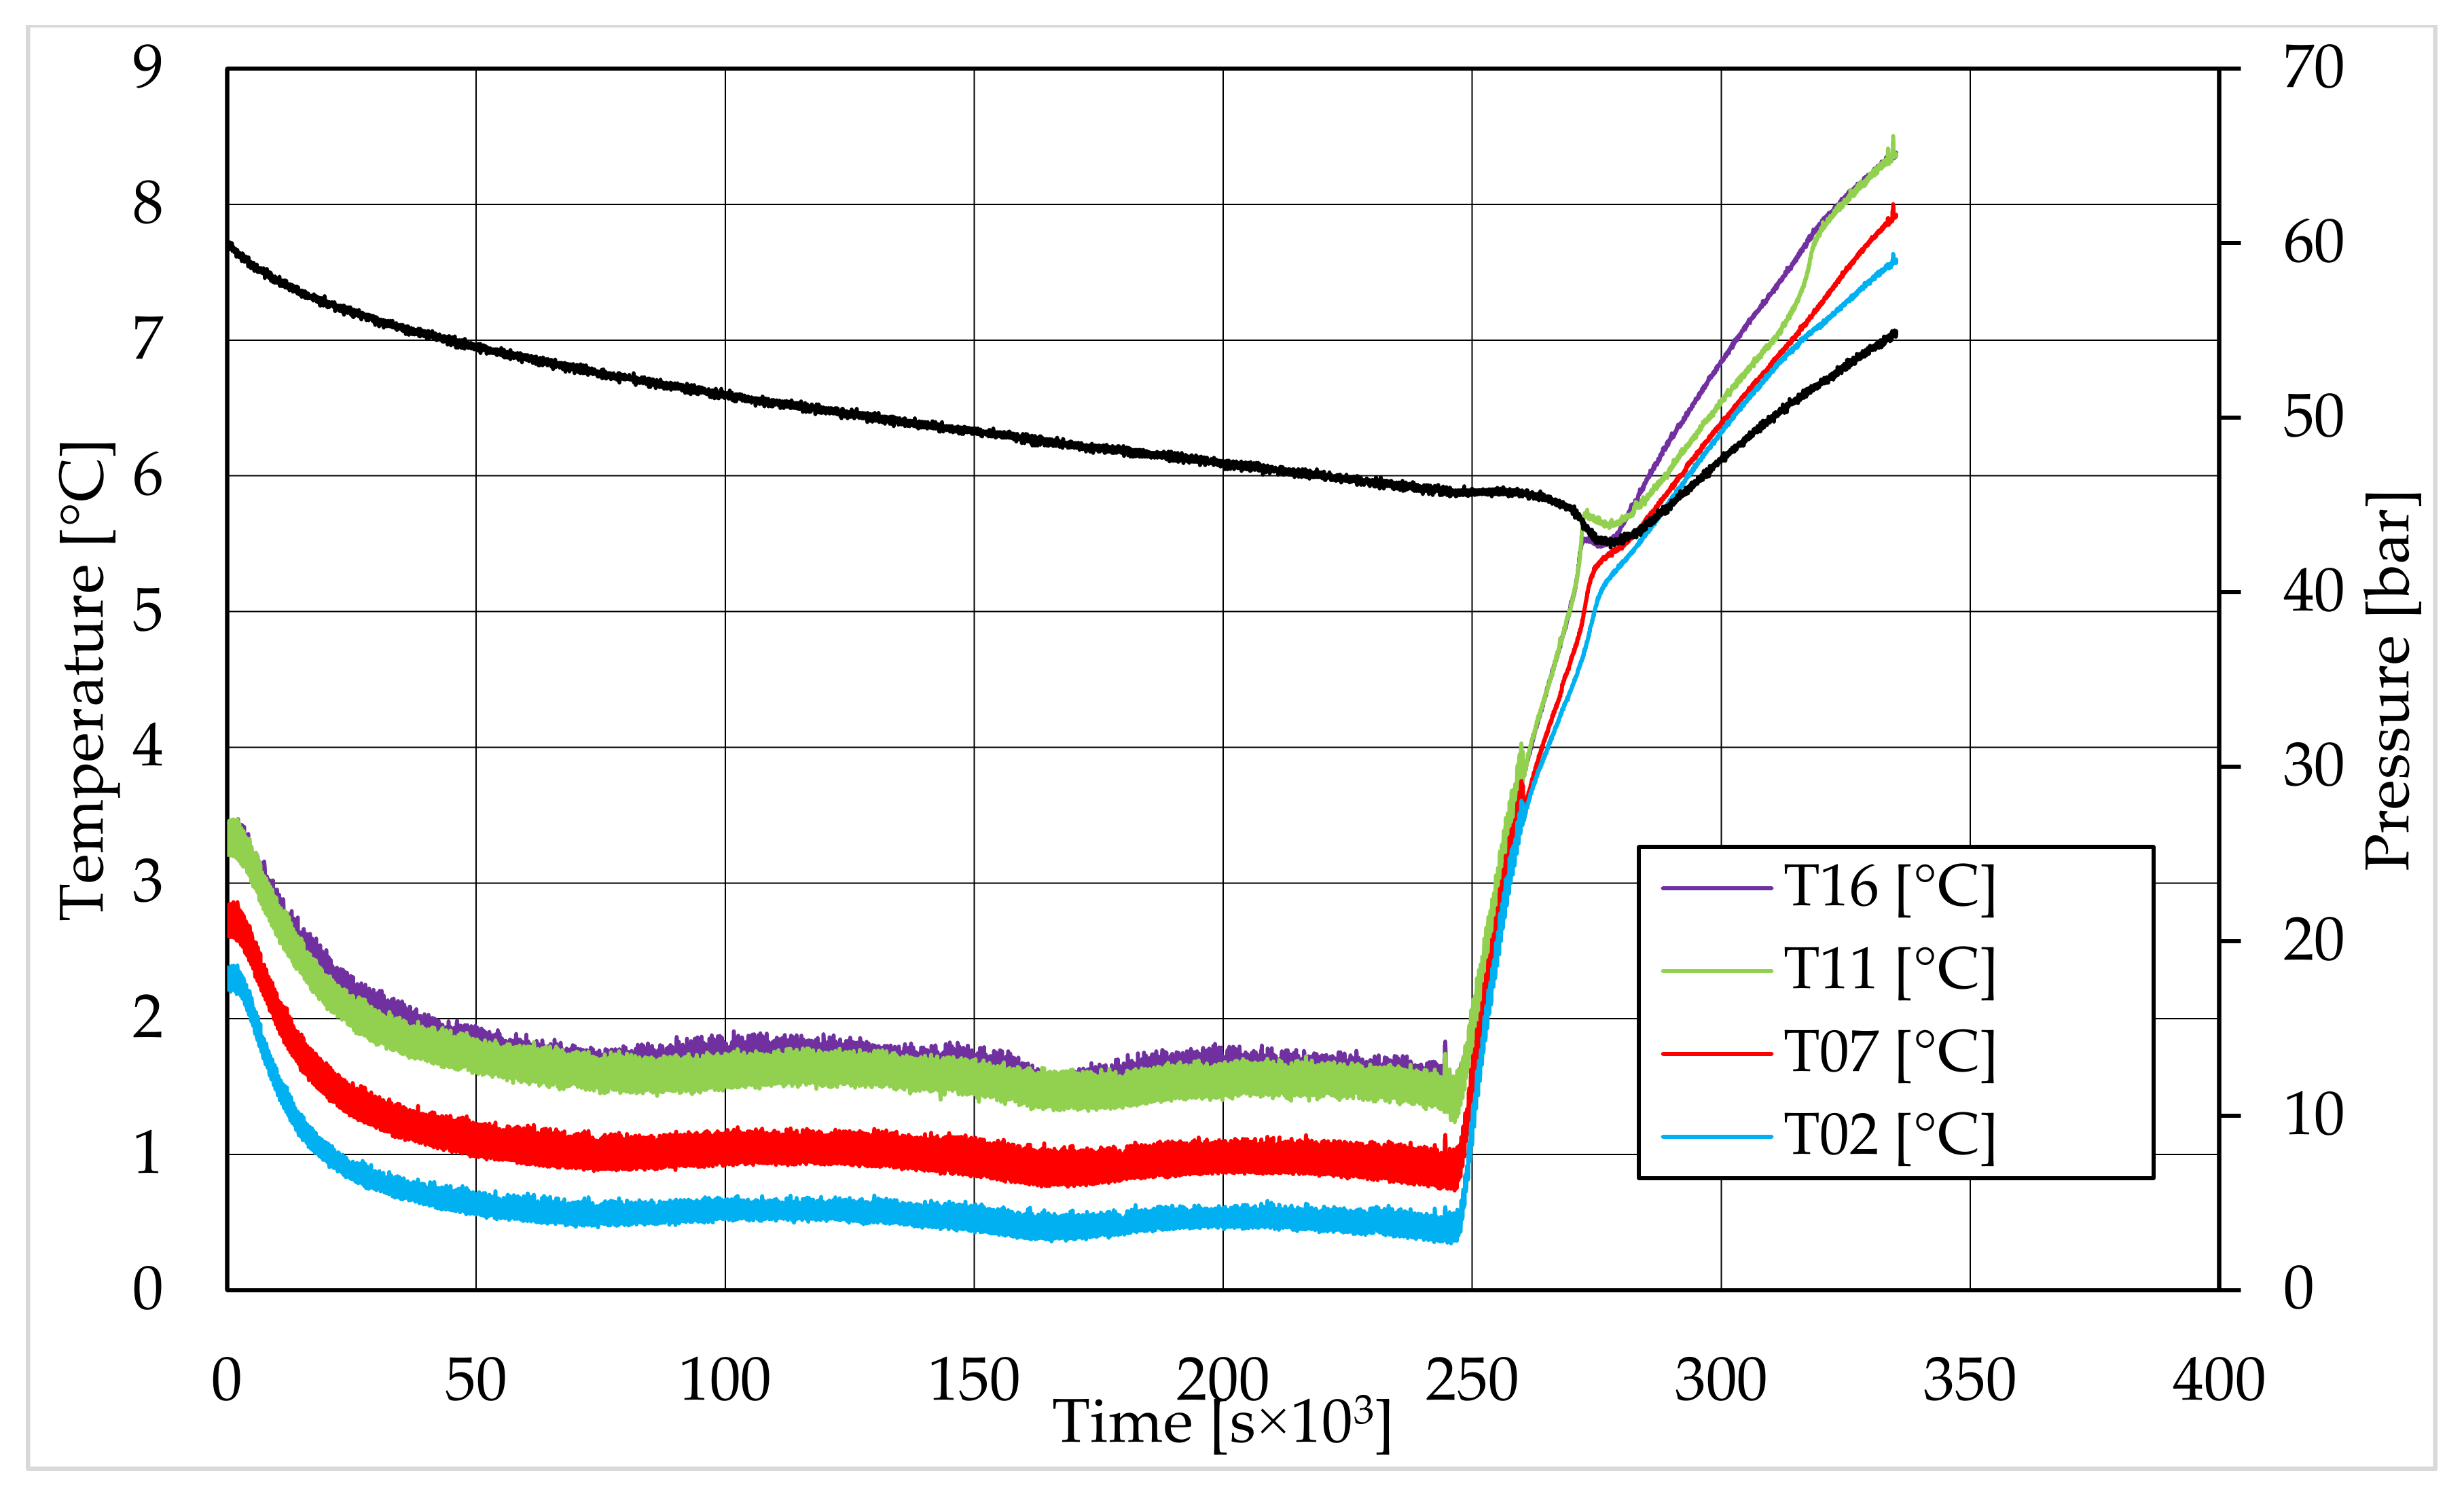
Figure 13), where T16 measured a secondary temperature peak, while, in correspondence with T11, any variation occurred. Such a temperature increase denoted the formation of further hydrate nuclei in the lower region; at the same time, the pressure trend also varied and, in particular, it started decreasing more intensively for the whole duration of the temperature peak.
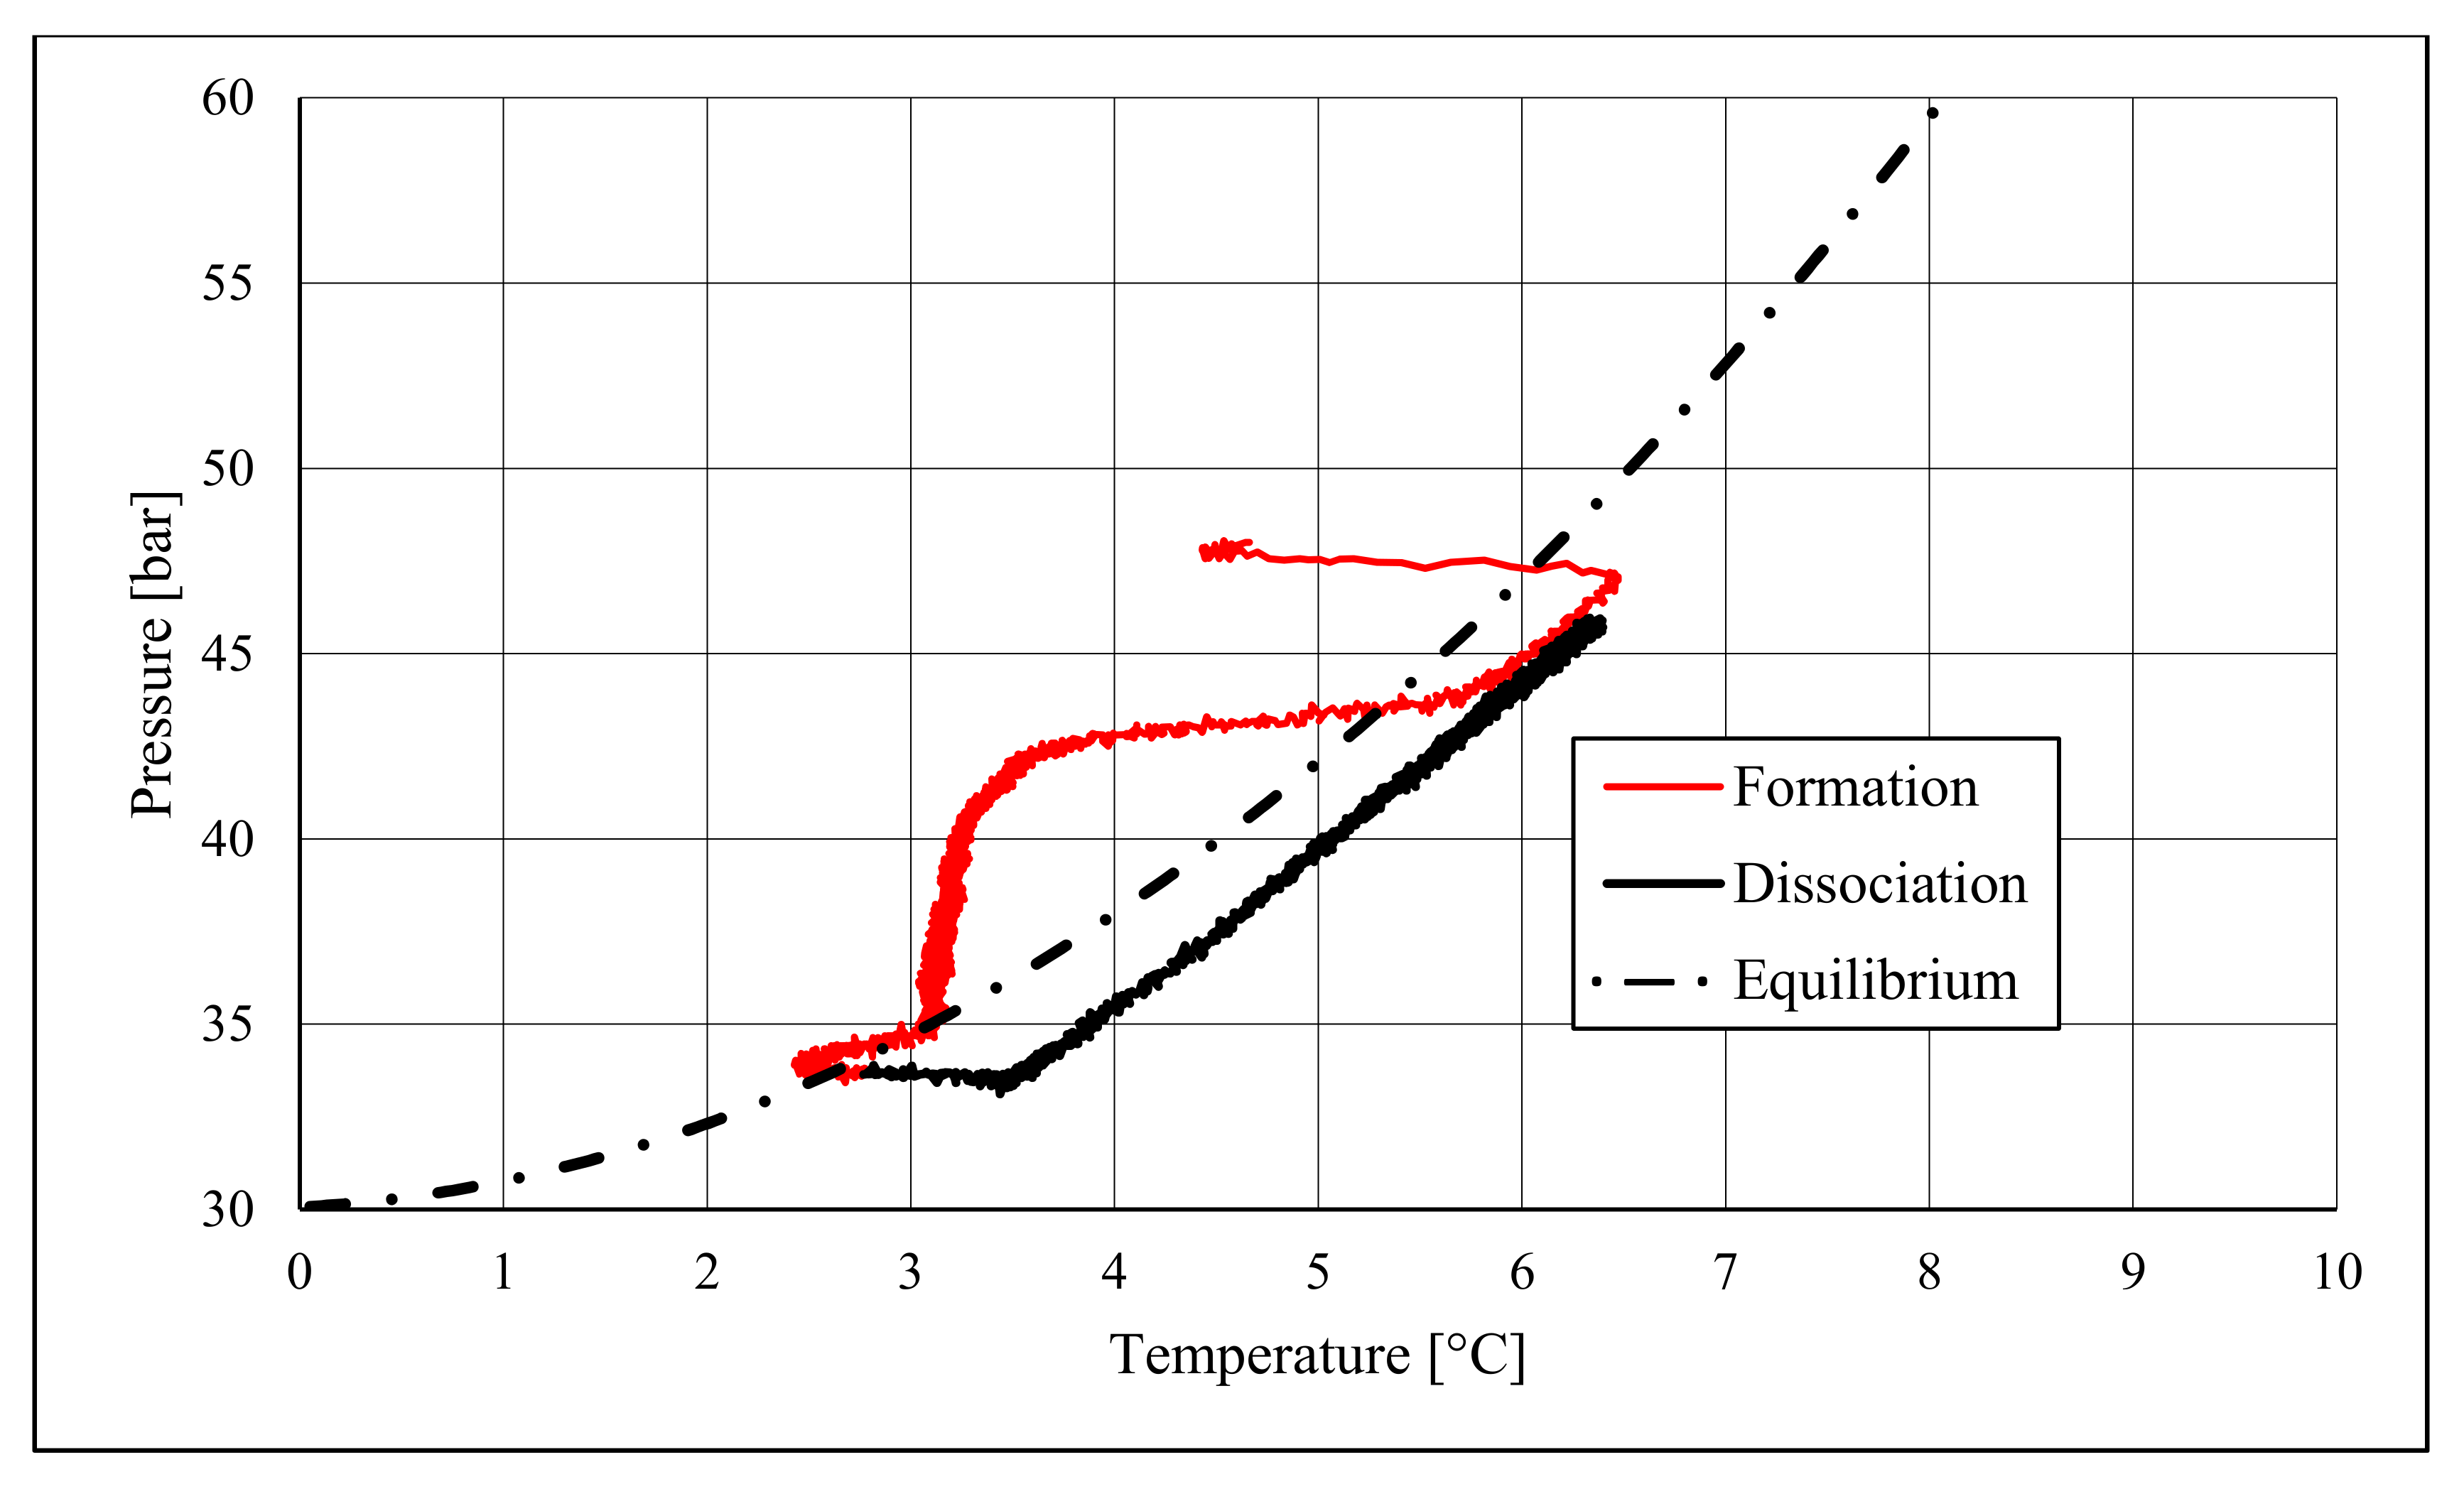
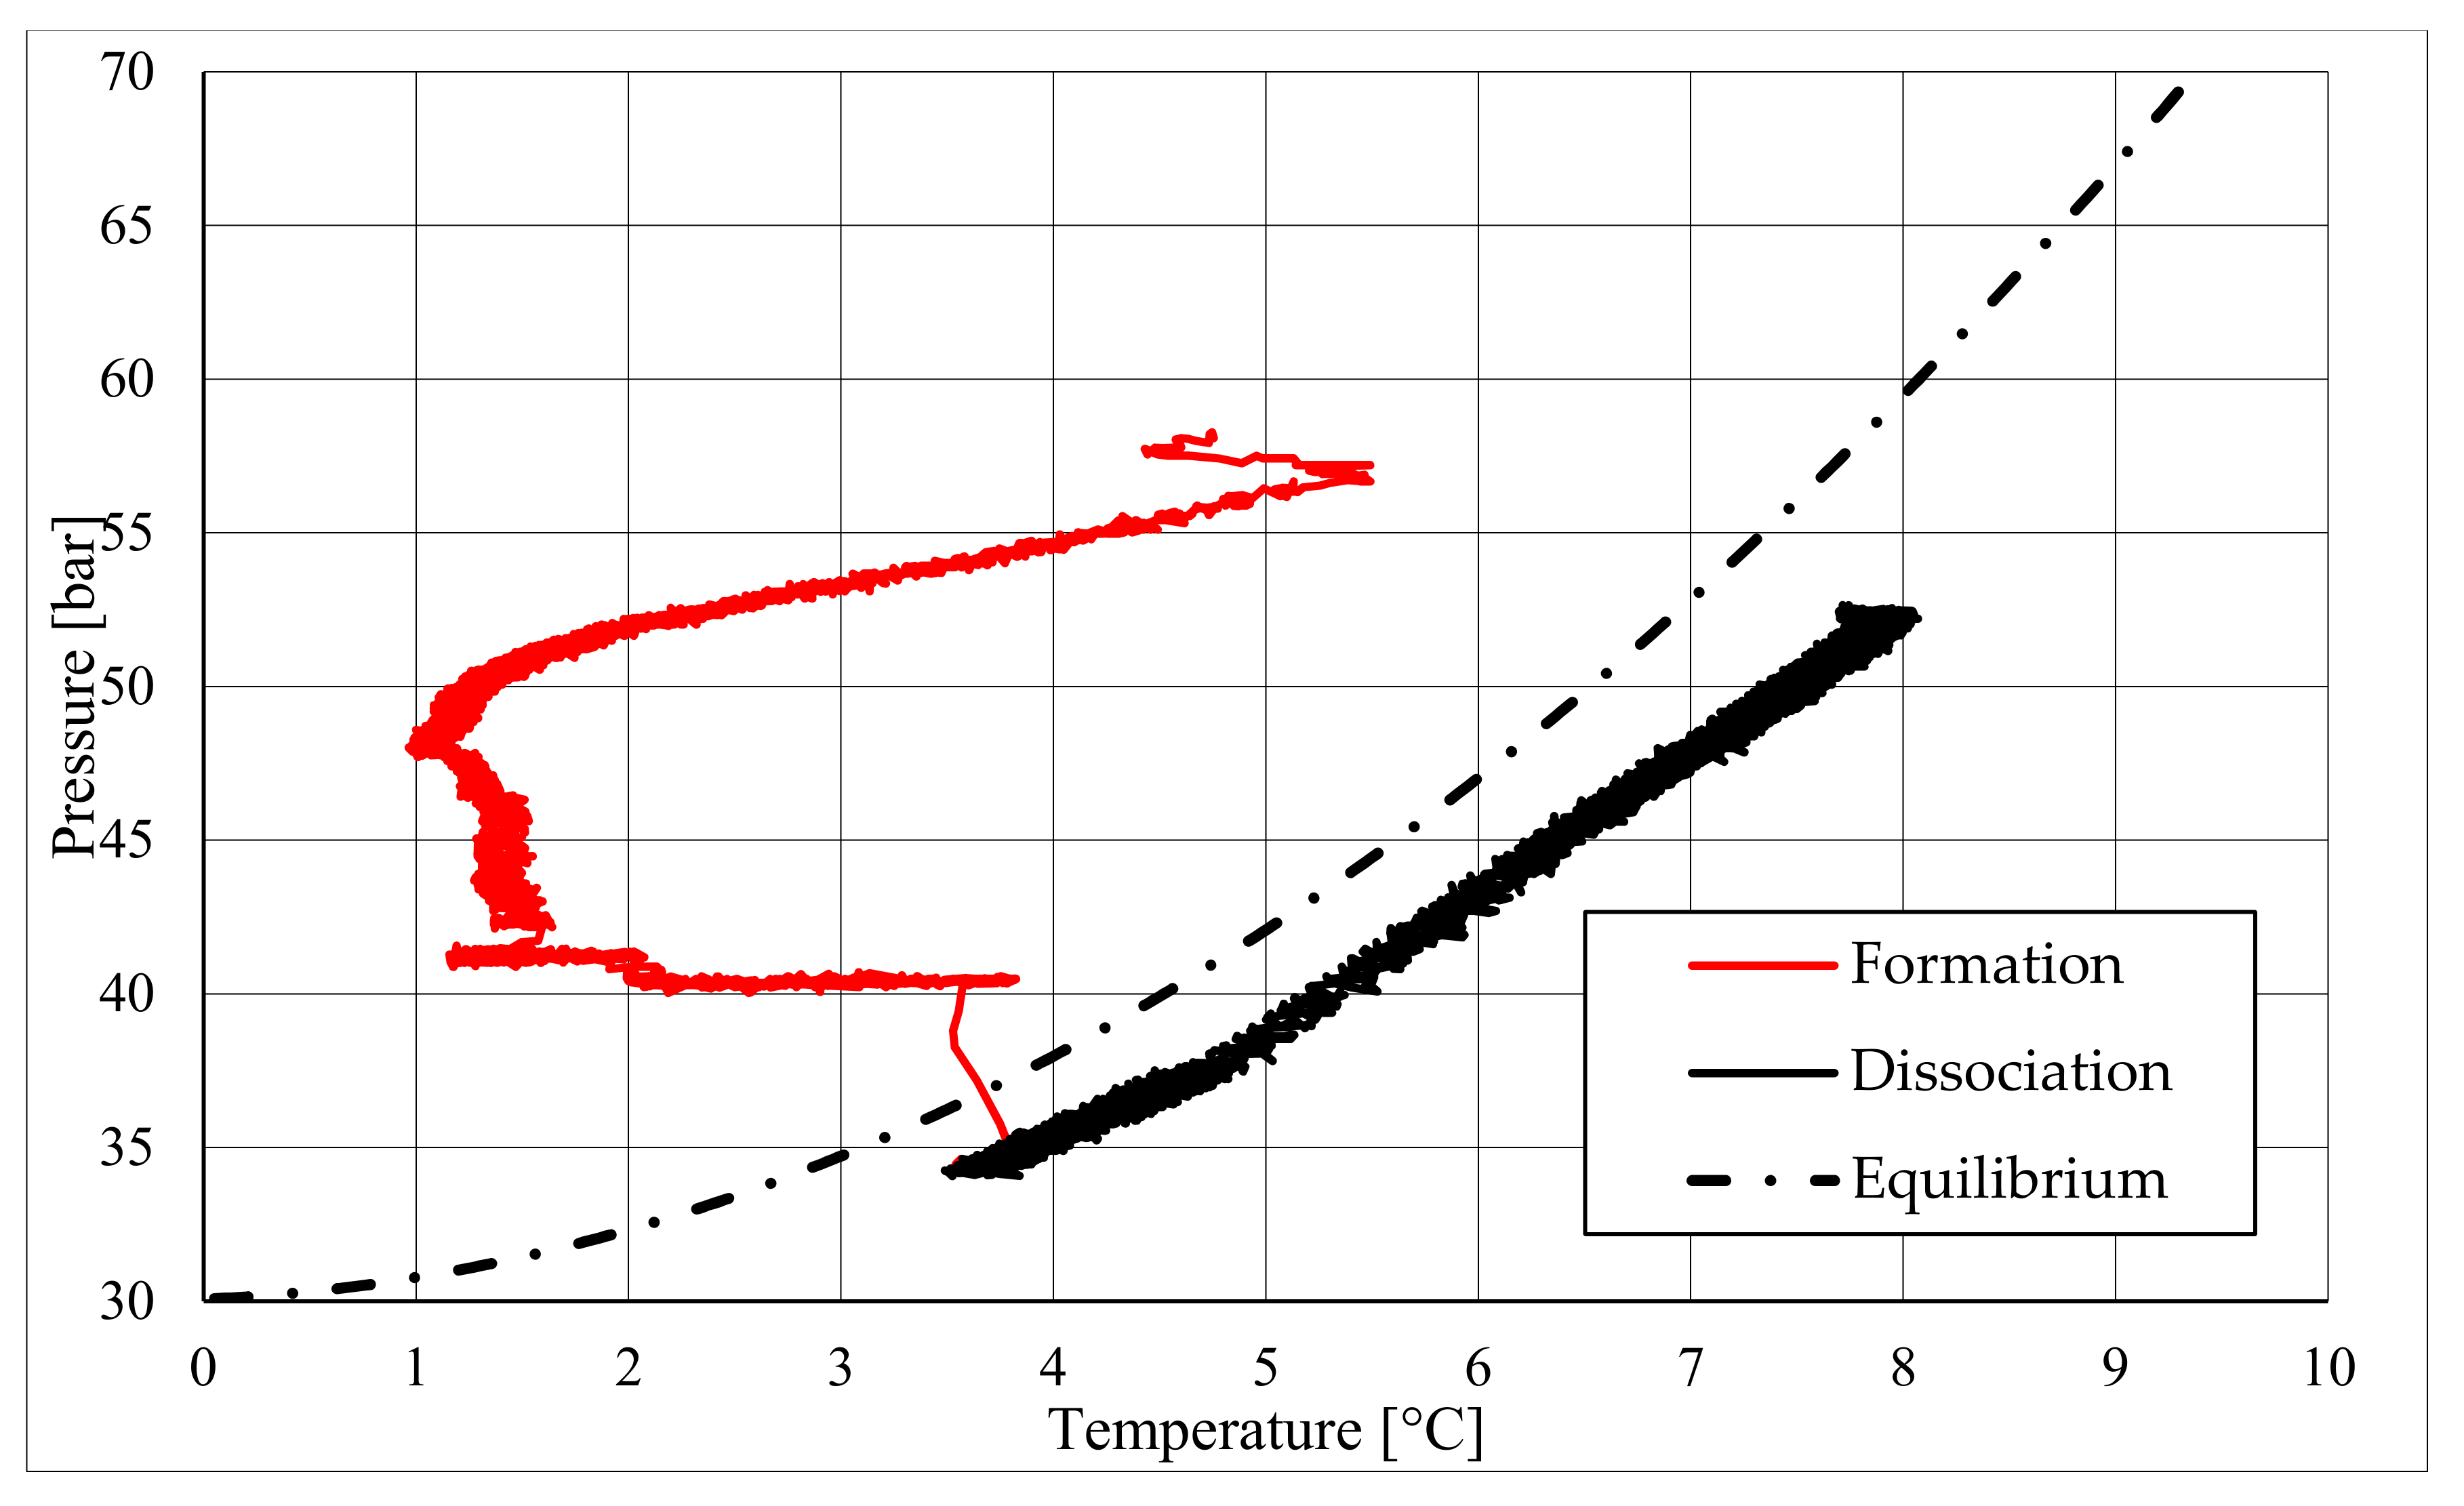
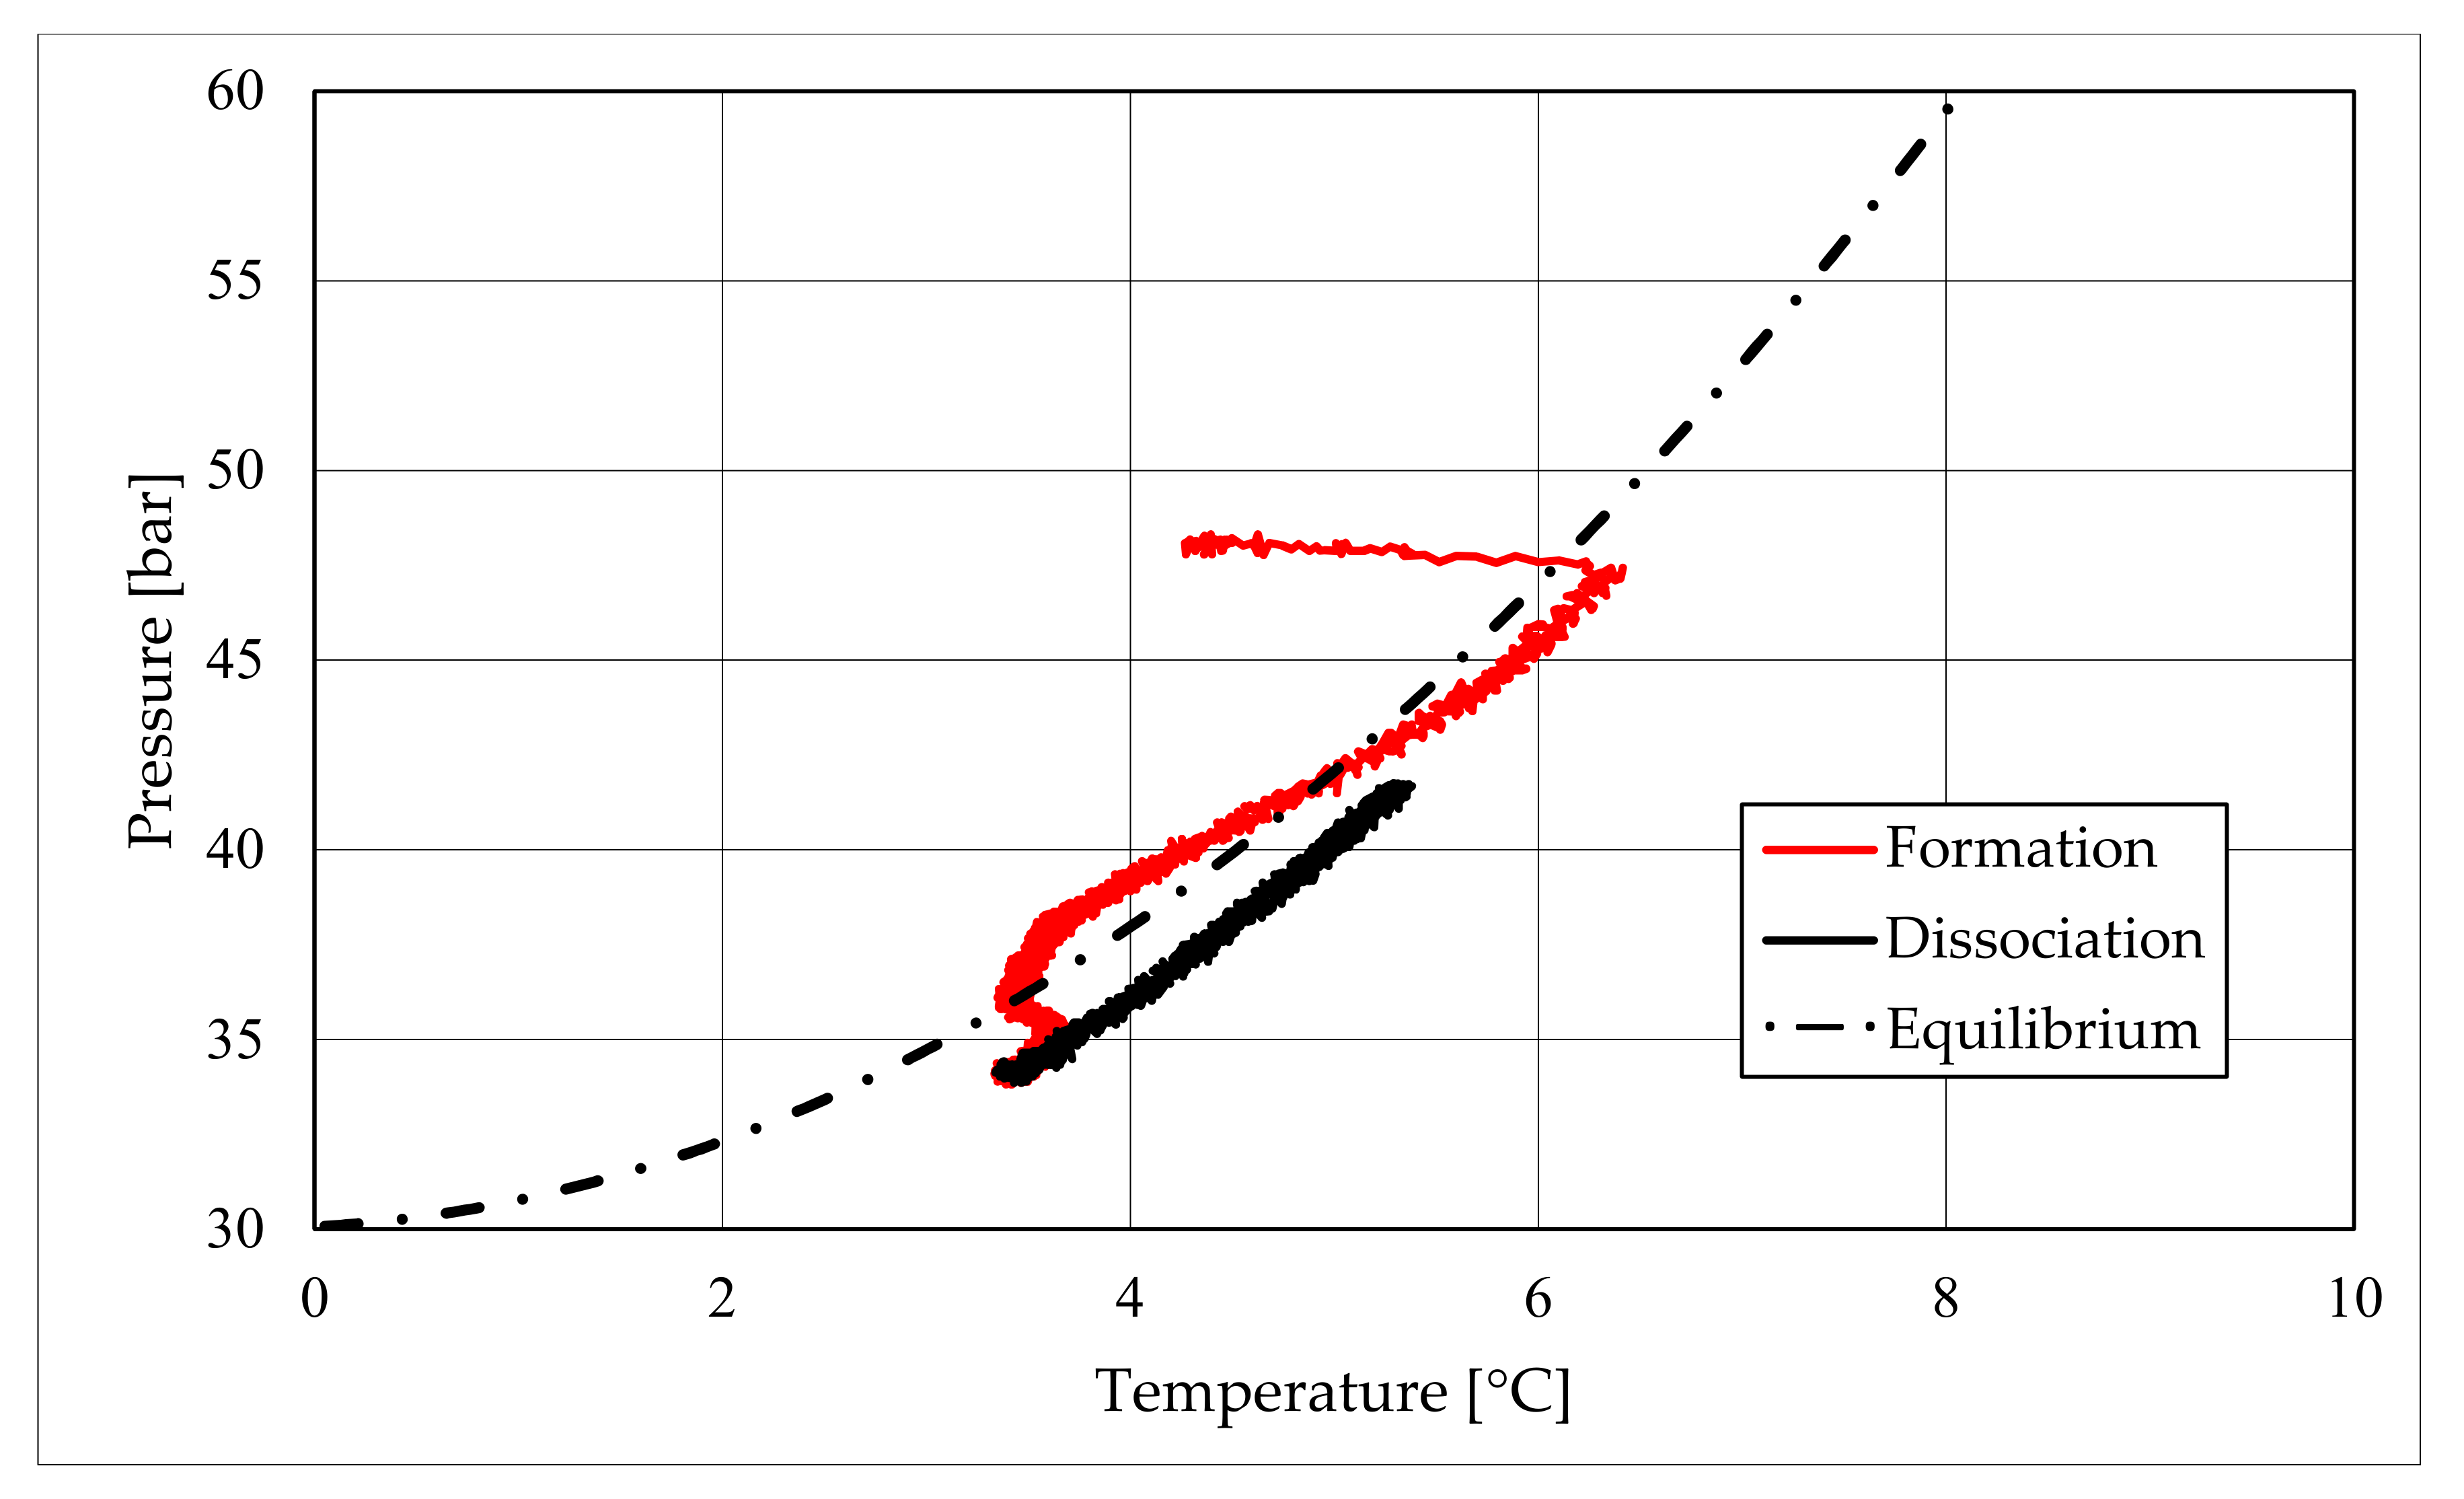
The right side of those diagrams describe the partial hydrate dissociation phase. In Test 1 and Test 2, where pure quartz sand was present inside the reactor, the dissociation was massive and occurred as soon as temperature started increasing, proving that, when hydrate formation finished, the internal thermodynamic conditions precisely corresponded to the equilibrium values. This latter aspect is well visible in 
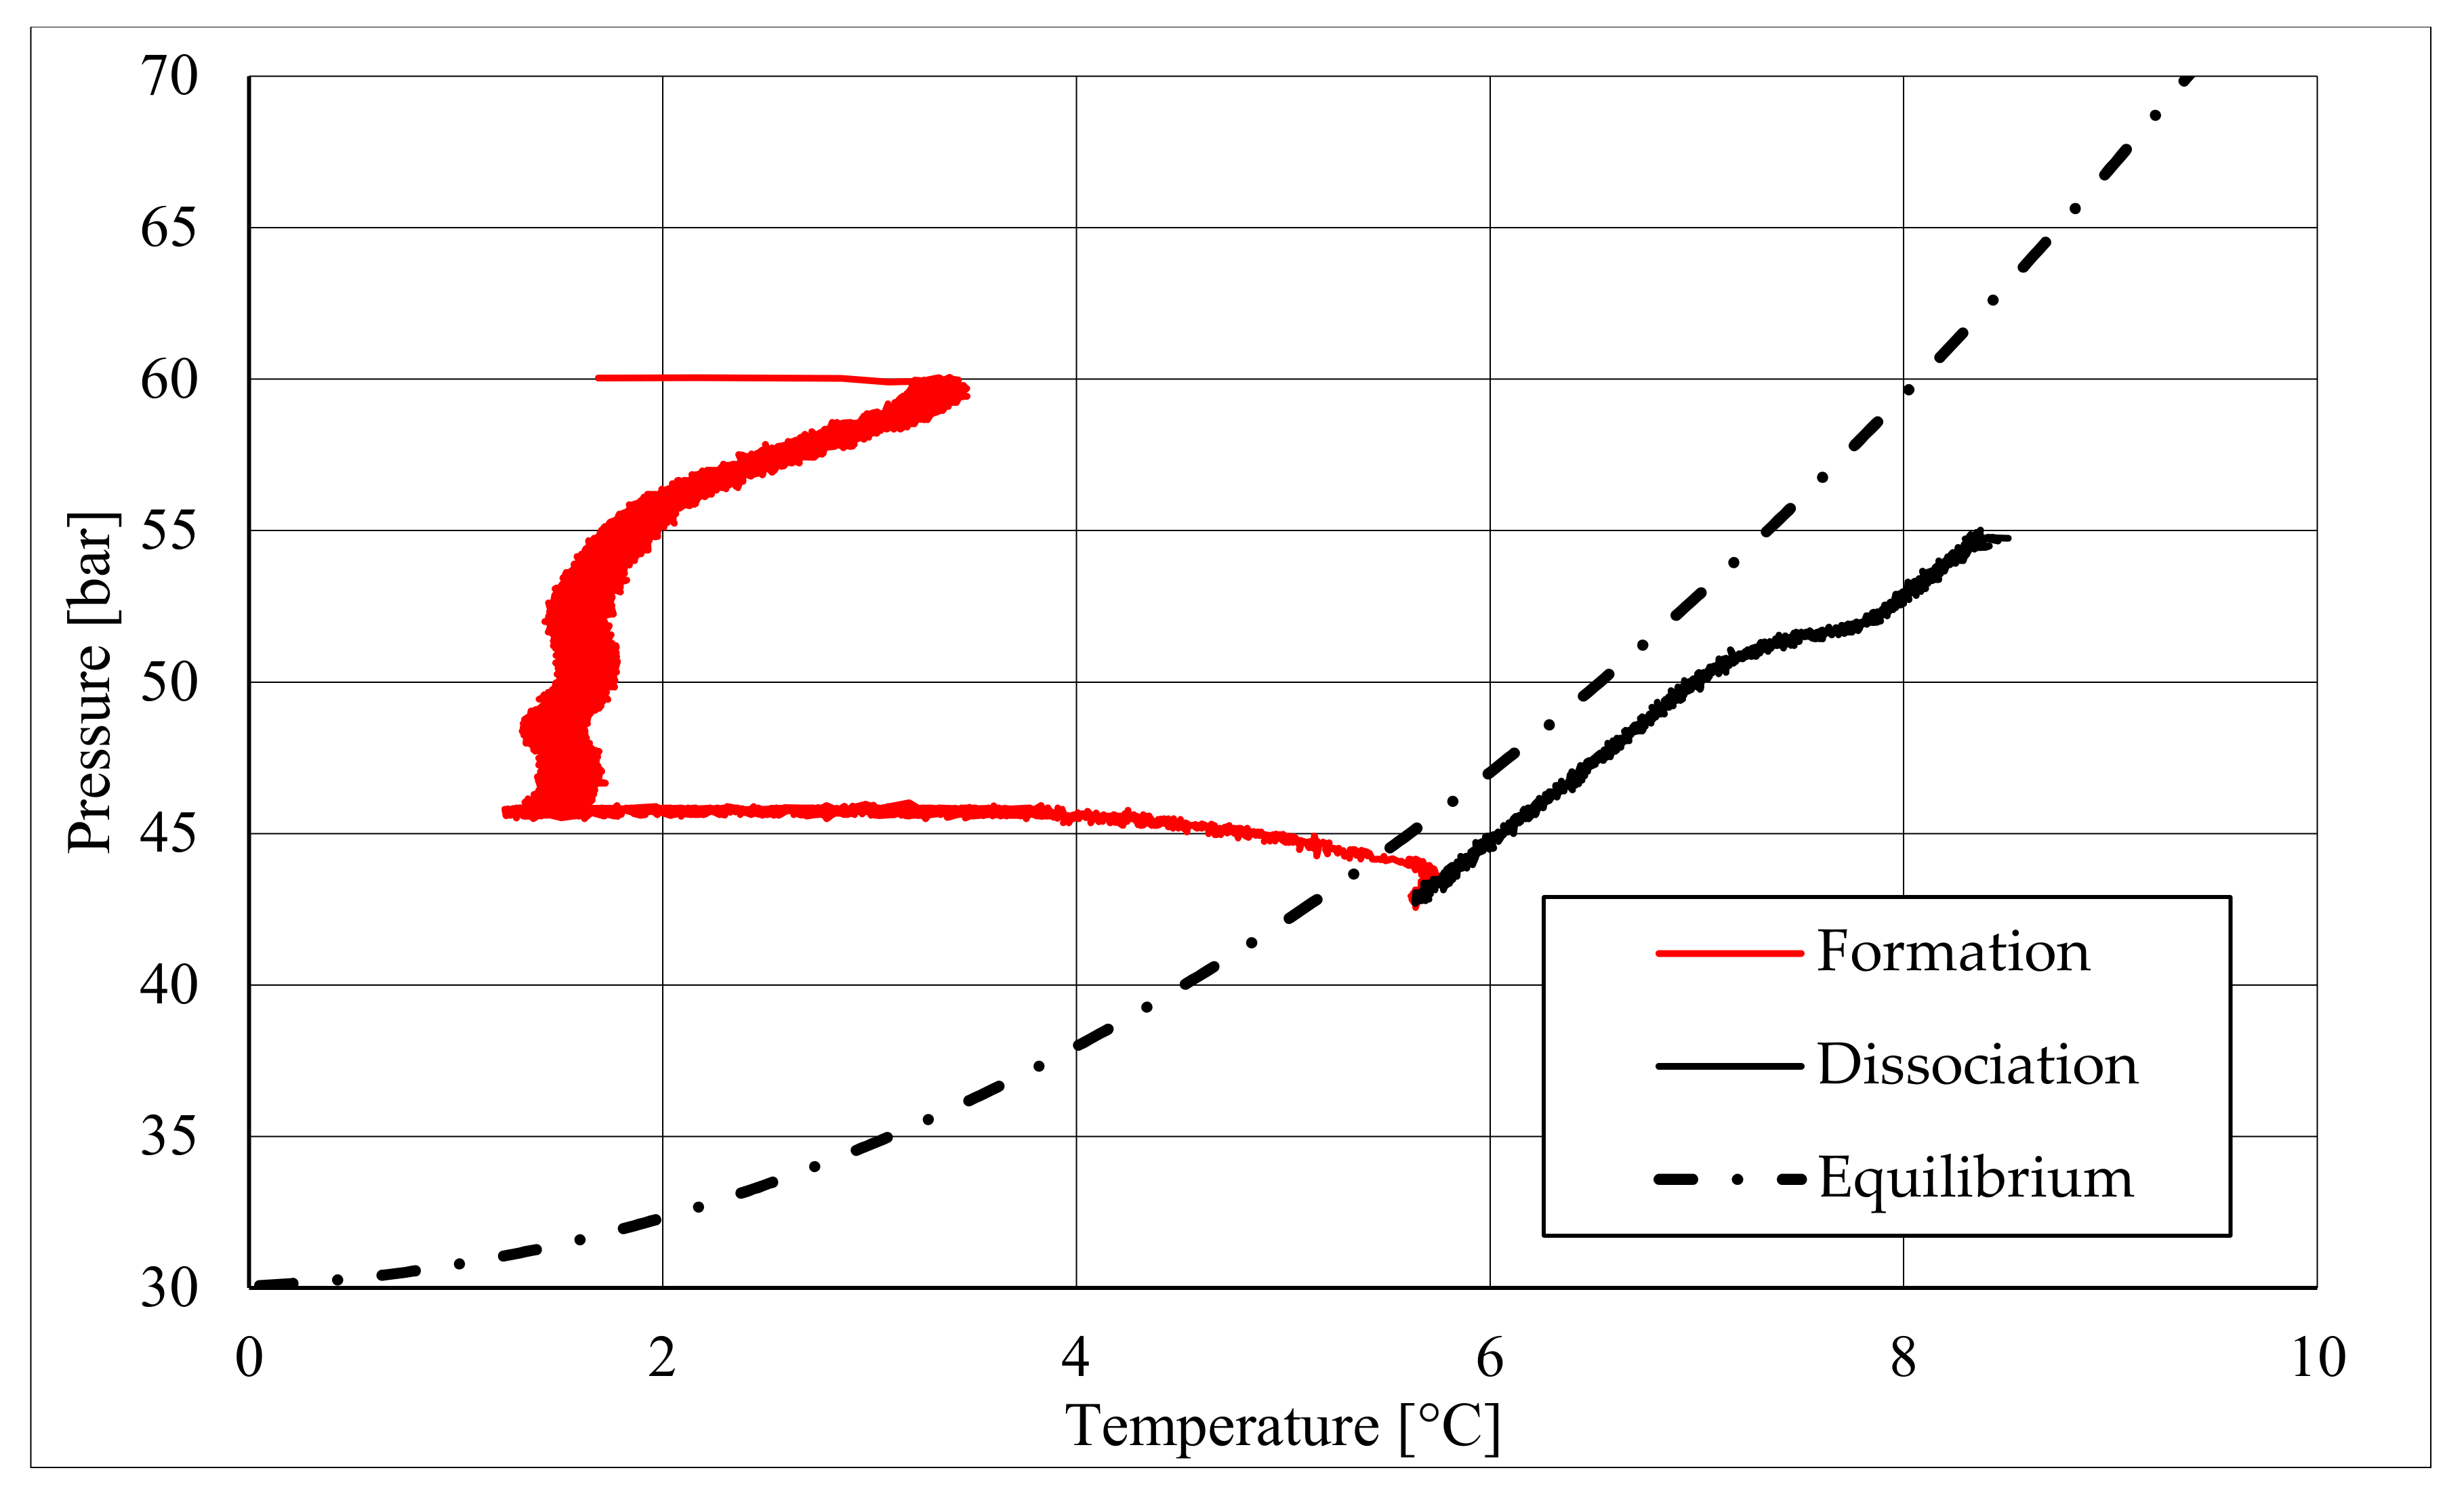
Figure 10, or the pressure–temperature diagram related to the same test. Here, it is possible to see that the start point of hydrate dissociation is completely superimposed on the equilibrium curve. On the contrary, when sand TS was used, the pressure increased due to hydrate dissociation had a remarkable delay compared with the temperature increase, proving in this latter case that, when the hydrate formation finished, the internal thermodynamic conditions were considerably above the equilibrium curve for methane hydrate, thus favoring hydrate stability for a prolonged period of time. About dissociation temperature, the two different types of experiments showed significantly different behaviors. In the first group of experiments, temperature increased constantly and slowed down only at the end of the dissociation phase, when the internal temperature was close to the external temperature, fixed with the chiller. Conversely, in tests performed with the natural sand TS, temperatures assumed two different velocities during dissociation. In the first part, it was extremely elevated and, in the corresponding diagrams, it seems to assume an almost vertical diagram. Then, it continued increasing, but following a lower gradient, close to that observed in Test 1 and Test 2. This aspect is mainly associated to hydrate dissociation, which is an endothermic process, and thus lowers the temperature in the surrounding environment. In Test 1 and Test 2, hydrate dissociation occurred immediately and temperature rose slowly compared with the second group of experiments. In this latter case, because of the initial pressure and temperature values present inside the reactor, hydrate formation did not occur immediately and temperature increased drastically, till hydrate dissociation started and the temperature trend become completely similar to that observed in Test 1 and Test 2.
Rather than experimental values, in all diagrams describing the pressure–temperature trend during the experiments, a black dotted line was inserted to represent methane hydrate equilibrium. This line was drawn with data present elsewhere in the literature [42,43,44,45,46,47,48,49,50]. While the tables well indicated the effect of TS sand on the process kinetic, in those diagrams, the thermodynamics of concern are clearly shown. In the presence of sand PQ, methane hydrate formation occurred at conditions close to equilibrium values. In Test 1, during the last part of the hydrate formation phase, the two curves were completely overlapped. Conversely, with sand TS, the P–T formation values were extremely far from the black dotted line. In this latter situation, hydrate required higher pressures (the reaction started at 58–60 bar, instead of 47–48 bar) and/or lower temperature values. However, the pressure drop present in Figure 7 and in Figure 8 proves that massive hydrate formation occurred. While the hydrate formation phase was completely different as a function of the type of porous medium involved in the process, the hydrate dissociation phase was extremely similar. In both cases, the experimental hydrate dissociation denoted behavior equal to the ideal trend extrapolated from the literature, with the only difference that experimental values are slightly shifted at the right of the equilibrium curve. This slight deviation is associated with the presence of sand, whose grains are able to hinder and decelerate the dissociation process [51].
During hydrate formation, in tests made with sand PQ, a “hump” is clearly visible. In Tests 3 and 4, it is also present; however, the greater distance from the equilibrium of the whole curve made it less observable. Such a temporary deviation from the current trend was usually observed and reported in the literature; moreover, it might be useful to develop a more in-depth understanding of the process. In the present work, that specific point was called PT3* and, as for other points, all kinetic and thermodynamic parameters were evaluated and reported in the respective tables.

4. Conclusions

Because the salts inhibit the formation of natural gas hydrate and it is well known that hydrate nucleation occurs preferentially in a region with low ion concentration, the investigation about the chemical composition of seawater containing NGHs is very important to obtain useful information for the comprehension of their formation mechanisms in the natural environment.
In order to obtain this information, we studied the chemical physical characteristics of sea water present in some marine sediment samples that contained NGH.
The obtained results show that 1 kg of water contained about 4.7% of salts; these results show an enrichment of ions with respect to the seawater because of the fact that the sediments, sampled at different depths, can accumulate different quantities of salts during the formation. The composition of seawater deduced from the obtained results is most important for understanding the environmental conditions under which NGHs are formed and could be used to reproduce the marine environment for the production of laboratory GHs and for the study of their formation under specific experimental conditions.
Finally, experiments carried out in this work have been helpful to reach two important conclusions. Firstly, they proved that the classical pure quartz sand, commonly used in laboratories to study gas hydrate, has a very limited impact on the process and its influence may be entirely associated with its physical properties as porous medium. Then, the analyses of the natural sand TS denoted it as both a kinetic inhibitor, because of the higher time required to carry out the process and the significant reduction of hydrate formation rate with the decrease of pressure, and a thermodynamic inhibitor, considering the higher pressure and lower temperature values required. Analyses and hydrate formation experiments described in this work confirmed and illustrated how characteristics and properties of offshore hydrate sediments are strongly affected by the water and sand respective composition. Obviously, each specific site has its own characteristics and that motivated the need for more information and scientific investigations on the effects associated with the presence of certain elements or physical properties. Till now, a very limited amount of scientific works describing both the water and sediment influence on hydrate formation have been produced; the present work aims to contribute increasing the degree of knowledge in this sense. An accurate knowledge of those parameters and their specific effect on hydrate formation might be extremely useful to define in advance the best modalities to intervene on a specific hydrate reservoir. Further works will be focused on defining performances of the CO2/CH4 exchange process into hydrate in this latter type of porous medium, with the aim to define the process efficiency and then compare it again with results previously obtained in the presence of pure quartz sand.

Author Contributions

U.T., B.C., M.G., A.R. and M.Z. contributed to the Introduction, Materials and Methods, and Conclusions. A.M.G. leaded the Methodology. A.M.G. and R.G. led the Results and Discussion. F.R. supervised the entire work. All authors have read and agreed to the published version of the manuscript.

Funding

The present experimental research was funded by the PRIN Project entitled: “Methane recovery and carbon dioxide disposal in natural gas hydrate reservoirs”.

Institutional Review Board Statement

Not applicable.

Informed Consent Statement

Informed consent was obtained from all subjects involved in the study.”

Data Availability Statement

Gravity core data are available at the “Museo nazionale dell’Antardide” (http://www.mna.it/ (accessed on 23 March 2021)).

Acknowledgments

The authors would like to acknowledge the Italian Ministry of University and Scientific Research for financially supporting the PRIN project.

Conflicts of Interest

The authors declare no conflict of interest. The funders had no role in the design of the study; in the collection, analyses, or interpretation of data; in the writing of the manuscript; or in the decision to publish the results.

References

  1. Sloan, E.D. Fundamental principles and applications of natural gas hydrates. Nat. Cell Biol. 2003, 426, 353–359. [Google Scholar] [CrossRef]
  2. Kumar, P.; Sathyamurthy, N. Theoretical Studies of Host–Guest Interaction in Gas Hydrates. J. Phys. Chem. A 2011, 115, 14276–14281. [Google Scholar] [CrossRef]
  3. Tinivella, U.; Giustiniani, M. An Overview of Mud Volcanoes Associated to Gas Hydrate System. In Updates in Volcanology New Advances in Understanding Volcanic Systems; IntechOpen: London, UK, 2012; p. 51270. [Google Scholar]
  4. Yin, Z.; Linga, P. Methane hydrates: A future clean energy resource. Chin. J. Chem. Eng. 2019, 27, 2026–2036. [Google Scholar] [CrossRef]
  5. Holzammer, C.; Schicks, J.M.; Will, S.; Braeuer, A.S. Influence of Sodium Chloride on the Formation and Dissociation Behavior of CO2 Gas Hydrates. J. Phys. Chem. B 2017, 121, 8330–8337. [Google Scholar] [CrossRef] [Green Version]
  6. Holzammer, C.; Finckenstein, A.; Will, S.; Braeuer, A.S. How Sodium Chloride Salt Inhibits the Formation of CO2 Gas Hydrates. J. Phys. Chem. B 2016, 120, 2452–2459. [Google Scholar] [CrossRef] [PubMed] [Green Version]
  7. Sloan, E.D.; Koh, C.A. Clathrate Hydrates of Natural Gases, 3rd ed.; CRC Press Taylor and Francis Group: Boca Raton, FL, USA, 2008. [Google Scholar]
  8. Bai, D.; Wu, Z.; Lin, C.; Zhou, D. The effect of aqueous NaCl solution on methane hydrate nucleation and growth. Fluid Phase Equilibria 2019, 487, 76–82. [Google Scholar] [CrossRef]
  9. Tinivella, U.; Accaino, F.; Della-Vedova, B. Gas hydrates and active mud volcanism on the South Shetland continental margin, Antarctic Peninsula. Geo-Mar. Lett. 2008, 28, 97–106. [Google Scholar] [CrossRef]
  10. Tinivella, U.; Accaino, F. Compressional velocity structure and Poisson’s ratio in marine sediments with gas hydrate and free gas by inversion of reflected and refracted seismic data (South Shetland Islands, Antarctica). Mar. Geol. 2000, 164, 13–27. [Google Scholar] [CrossRef]
  11. Tinivella, U. The seismic response to overpressure versus gas hydrate and free gas concentration. J. Seism. Explor. 2002, 11, 283–305. [Google Scholar]
  12. Tinivella, U.; Loreto, M.F.; Accaino, F. Regional versus detailed velocity analysis to quantify hydrate and free gas in marine sediments: The South Shetland Margin case study. Geol. Soc. Lond. Spéc. Publ. 2009, 319, 103–119. [Google Scholar] [CrossRef] [Green Version]
  13. Loreto, M.F.; Tinivella, U.; Accaino, F.; Giustiniani, M. Offshore Antarctic Peninsula gas hydrate reservoir characterization by geophysical data analysis. Energies 2011, 4, 39–56. [Google Scholar] [CrossRef]
  14. Song, S.; Tinivella, U.; Giustiniani, M.; Singhroha, S.; Bunz, S.; Cassiani, G. OBS data analysis to quantify gas hydrate and free gas in the South Shetland margin (Antarctica). Energies 2018, 12, 3290. [Google Scholar] [CrossRef] [Green Version]
  15. Tinivella, U. A method to estimate gas hydrate and free gas concentrations in marine sediments. Boll. Geofis. Teor. Appl. 1999, 40, 19–30. [Google Scholar]
  16. Gambelli, A.M.; Filipponi, M.; Nicolini, A.; Rossi, F. Proceedings of the International Multidisciplinary GeoConference: SGEM, Surveying Geology & Mining Ecology Managment (SGEM), Sofia, Bulgaria, 26 June–5 July 2021; Volume 4, pp. 333–343. [CrossRef]
  17. Ge, B.-B.; Zhong, D.-L.; Lu, Y.-Y. Influence of water saturation and particle size on methane hydrate formation and dissociation in a fixed bed of silica sand. Energy Procedia 2019, 158, 5402–5407. [Google Scholar] [CrossRef]
  18. Max, M.D. Natural Gas Hydrates in Oceanic and Permafrost Environments; Kluwer Academic Publishers: Amsterdam, The Netherlands, 2000. [Google Scholar]
  19. Lu, H.; Matsumoto, R. Preliminary experimental results of the stable P-T conditions of methane hydrate in a nannofossil-rich claystone column. Geochem. J. 2002, 36, 21–30. [Google Scholar] [CrossRef] [Green Version]
  20. Di Profio, P.; Arca, S.; Savelli, G. Novel Nanostructured Media for Gas Storage and Transport: Clathrate Hydrates of Me-thane and Hydrogen. J. Fuel Cell Sci. Technol. 2007, 4, 49–55. [Google Scholar] [CrossRef]
  21. Guanli, J.; Qingbai, W.; Jing, Z. Effect of cooling rate on methane hydrate formation in media. Fluid Phase Equilibria 2010, 298, 225–230. [Google Scholar]
  22. Benmesbah, F.D.; Ruffine, L.; Clain, P.; Osswald, V.; Fandino, O.; Fournaison, L.; Delahaye, A. Methane Hydrate Formation and Dissociation in Sand Media: Effect of Water Saturation, Gas Flowrate and Particle Size. Energies 2020, 13, 5200. [Google Scholar] [CrossRef]
  23. Lu, H.; Kawasaki, T.; Ukita, T.; Moudrakovski, I.; Fujii, T.; Noguchi, S.; Shimada, T.; Nakamizu, M.; Ripmeester, J.; Ratcliffe, C. Par-ticle size effect on the saturation of methane hydrate in sediments—Constrained from experimental results. Mar. Pet. Geol. 2011, 28, 1801–1805. [Google Scholar] [CrossRef] [Green Version]
  24. Ginsburg, G.; Soloviev, V.; Matveeva, T.; Andreeva, I. Sediment grain-size control on gas hydrate presence, Sites 994, 995, and 997. In Proceedings of the Ocean Drilling Program, 111 Scientific Reports; International Ocean Discovery Program (IODP): College Station, TX, USA, 2000; Volume 164, p. 237. [Google Scholar]
  25. Findenegg, G.H.; Jähnert, S.; Akcakayiran, D.; Schreiber, A. Freezing and Melting of Water Confined in Silica Nanopores. ChemPhysChem 2008, 9, 2651–2659. [Google Scholar] [CrossRef] [PubMed]
  26. Jain, A.K.; Juanes, R. Preferential Mode of gas invasion in sediments: Grain-scale mechanistic model of coupled multiphase fluid flow and sediment mechanics. J. Geophys. Res. Space Phys. 2009, 114, 1–19. [Google Scholar] [CrossRef]
  27. Linga, P.; Haligva, C.; Nam, S.C.; Ripmeester, J.A.; Englezos, P. Gas Hydrate Formation in a Variable Volume Bed of Silica Sand Particles. Energy Fuels 2009, 23, 5496–5507. [Google Scholar] [CrossRef]
  28. Hachikubo, A.; Takeya, S.; Chuvilin, E.; Istomin, V. Preservation phenomena of methane hydrate in pore spaces. Phys. Chem. Chem. Phys. 2011, 13, 17449–17452. [Google Scholar] [CrossRef] [PubMed]
  29. Liang, S.; Rozmanov, D.; Kusalik, P.G. Crystal growth simulations of methane hydrates in the presence of silica surfaces. Phys. Chem. Chem. Phys. 2011, 13, 19856–19864. [Google Scholar] [CrossRef] [PubMed]
  30. Riestenberg, D.; West, O.; Lee, S.; McCallum, S.; Phelps, T. Sediment surface effects on methane hydrate formation and disso-ciation. J. Marine Geol. 2003, 198, 181–190. [Google Scholar] [CrossRef]
  31. Vargas-Cordero, I.; Tinivella, U.; Villar-Muñoz, L.; Bento, J.P.; Cárcamo, C.; López-Acevedo, D.; Fernandoy, F.; Rivero, A.; Juan, M.S. Gas hydrate versus seabed morphology offshore Lebu (Chilean margin). Sci. Rep. 2020, 10, 1–13. [Google Scholar] [CrossRef]
  32. Gambelli, A.M.; Rossi, F. The use of sodium chloride as strategy for improving CO2/CH4 replacement in natural gas hy-drates promoted with depressurization methods. Arab. J. Geosci. 2020, 13, 898. [Google Scholar] [CrossRef]
  33. Castellani, B.; Gambelli, A.M.; Nicolini, A.; Rossi, F. Energy and Environmental Analysis of Membrane-Based CH4-CO2 Re-placement Processes in Natural Gas Hydrates. Energies 2019, 12, 850. [Google Scholar] [CrossRef] [Green Version]
  34. Gambelli, A.M.; Castellani, B.; Nicolini, A.; Rossi, F. Water Salinity as Potential Aid for Improving the Carbon Dioxide Re-placement Process’ Effectiveness in Natural Gas Hydrate Reservoirs. Processes 2020, 8, 1298. [Google Scholar] [CrossRef]
  35. Takeya, S.; Kida, M.; Minami, H.; Sakagami, H.; Hachikubo, A.; Takahashi, N.; Shoji, H.; Soloviev, V.; Wallmann, K.; Biebow, N.; et al. Structure and thermal expansion of natural gas clathrate hydrates. Chem. Eng. Sci. 2006, 61, 2670–2674. [Google Scholar] [CrossRef]
  36. Aregbe, A.G. Gas Hydrate—Properties, Formation and Benefits. Open J. Yangtze Oil Gas. 2017, 2, 27–44. [Google Scholar] [CrossRef] [Green Version]
  37. Englezos, P.; Kalogerakis, N.; Dholabhai, P.; Bishnoi, P. Kinetics of formation of methane and ethane gas hydrates. Chem. Eng. Sci. 1987, 42, 2647–2658. [Google Scholar] [CrossRef]
  38. Rossi, F.; Gambelli, A.M.; Sharma, D.K.; Castellani, B.; Nicolini, A.; Castaldi, M.J. Experiments on methane hydrates formation in seabed deposits and gas recovery adopting carbon dioxide replacement strategies. Appl. Therm. Eng. 2019, 148, 371–381. [Google Scholar] [CrossRef]
  39. Tinivella, U.; de Vittor, S.P.C.; Esposito, A.; Tomberlich, F.; Falomo, J.; Acquavita, A.; del Negro, P.; Fabbro, C.; Cataletto, B. Studio sulle caratteristiche biogeochimiche di sedimenti prelevati da vulcani di fango antartici in aree interessate da gas metano idrato. Progetto BSP 2006, Report 2/2006 OGS – 2 – 2006 GDL, pp.24.
  40. Gianguzza, A.; Pelizzetti, E.; Sammartano, S. Chemistry of Marine Water and Sediments; Springer: Berlin/Heidelberg, Germany, 2002. [Google Scholar]
  41. Gambelli, A.M. An experimental description of the double positive effect of CO2 injection in methane hydrate deposits in terms of climate change mitigation. Chem. Eng. Sci. 2021, 233, 116430. [Google Scholar] [CrossRef]
  42. Bavoh, C.B.; Partoon, B.; Lal, B.; Keong, L.K. Methane hydrate-liquid-vapor-equilibrium phase condition measurements in the presence of natural amino acids. J. Nat. Gas Sci. Eng. 2017, 37, 425–434. [Google Scholar] [CrossRef]
  43. Bottger, A.; Kamps, A.P.S.; Maurer, G. An experimental investigation on the phase equilibrium of the binary system (me-thane + water) at low temperatures: Solubility of methane in water and three-phase (vapour + liquid + hydrate) equilib-rium. Fluid Phase Equilibria 2016, 407, 209–216. [Google Scholar] [CrossRef]
  44. Nema, Y.; Ohmura, R.; Senaha, I.; Yasuda, K. Quadruple point determination in carbon dioxide hydrate forming system. Fluid Phase Equilibria 2017, 441, 49–53. [Google Scholar] [CrossRef]
  45. Nagashima, H.D.; Ohmura, R. Phase equilibrium condition measurements in methane clathrate hydrate forming system from 197.3 K to 238.7 K. J. Chem. Thermodyn. 2016, 102, 252–256. [Google Scholar] [CrossRef]
  46. Nagashima, H.D.; Fukushima, N.; Ohmura, R. Phase equilibrium condition measurements in carbon dioxide clathrate hy-drate forming system from 199.1 K to 247.1 K. Fluid Phase Equilibria 2016, 413, 53–56. [Google Scholar] [CrossRef]
  47. Kassim, Z.; Khan, M.S.; Lal, B. Thermodynamic modelling on methane hydrate equilibrium condition in the presence of elec-trolyte inhibitor. Mater. Today Preceedings 2019, 19, 1395–1402. [Google Scholar] [CrossRef]
  48. Khan, M.S.; Partoon, B.; Bavoh, C.B.; Lal, B.; Mellon, B.M. Influence of tetramethylammonium hydroxide on methane and car-bon dioxide gas hydrate phase equilibrium conditions. Fluid Phase Equilibria 2017, 440, 1–8. [Google Scholar] [CrossRef]
  49. Khan, M.S.; Bavoh, C.B.; Partoon, B.; Lal, B.; Bustam, M.A.; Shariff, A.M. Thermodynamic effect of ammonium based ionic liquids on CO2 hydrates phase boundary. J. Mol. Liq. 2017, 238, 533–539. [Google Scholar] [CrossRef]
  50. Ohmura, R.; Uchida, T.; Takeya, S.; Nagao, J.; Minagawa, H.; Ebinuma, T.; Narita, H. Clathrate hydrate formation in (methane+water+methylcyclohexanone) systems: The first phase equilibrium data. J. Chem. Thermodyn. 2003, 35, 2045–2054. [Google Scholar] [CrossRef]
  51. Gambelli, A.M. Natural gas recovery from hydrate compounds using CO2 replacement strategies: Experimental study on thermal stimulation. Energy Procedia 2018, 148, 647–654. [Google Scholar]
Figure 1. Computer-aided tomography images every 5 mm for the core GC02.
Energies 14 01803 g001
Figure 2. Image of the small-scale reactor used for hydrate formation (a) and scheme of the completely assembled experimental apparatus (b). FM, fluximeter.
Energies 14 01803 g002
Figure 3. Thermocouples’ (TCs) positioning inside the reactor.
Energies 14 01803 g003
Figure 4. Grainsize distribution of sand TS.
Energies 14 01803 g004
Figure 5. Image of the pure quartz sand (PQ) and the natural silica-based sand (TS).
Energies 14 01803 g005
Figure 6. Representative ion chromatography (IC) chromatogram for anions detection in water eluate samples.
Energies 14 01803 g006
Figure 7. Effective concentration of major elements (a) and anions (b) present in water samples around sediments. ICP-MS, inductively coupled plasma-mass spectrometry.
Energies 14 01803 g007aEnergies 14 01803 g007b
Figure 8. Chemical composition of 1 kg of water contained in the sediment samples.
Energies 14 01803 g008
Figure 9. Pressure and temperature trend over time measured in Test 1.
Energies 14 01803 g009
Figure 10. Pressure–temperature trend measured in Test 1.
Energies 14 01803 g010
Figure 11. Pressure and temperature trend over time measured in Test 2.
Energies 14 01803 g011
Figure 12. Pressure–temperature trend measured in Test 2.
Energies 14 01803 g012
Figure 13. Pressure and temperature trend over time in Test 3.
Energies 14 01803 g013
Figure 14. Pressure–temperature trend measured in Test 3.
Energies 14 01803 g014
Figure 15. Pressure and temperature trend over time in Test 4.
Energies 14 01803 g015
Figure 16. Pressure–temperature trend measured in Test 4.
Energies 14 01803 g016
Table 1. Gas content measurements along the Antarctic cores (modified after [9]).
SampleDepth from Top [m]Methane [μg/kg]Pentane [μg/kg]Ethane [μg/kg]Propane [μg/kg]Hexane [μg/kg]Butane [μg/kg]Total Gases [μg/kg]
GC010.30–0.3129.7945.1819.8323.41 118.21
0.50–0.5131.1132.1828.5024.73 116.52
0.63–0.742.8544.3035.0034.38 27.92184.45
0.90–0.91 43.5725.6629.6723.1324.86146.89
0.105–0.10645.6438.1221.7825.6028.8126.69186.64
GC020.0–0.01 32.6722.00 21.15 75.82
0.12–0.13 30.0420.78 19.62 70.44
0.22–0.23 34.9415.07 27.26 77.27
0.32–0.33 31.00 20.81 51.81
0.42–0.43 44.94 26.5123.8595.30
0.52–0.53 38.10 38.10
0.61–0.62 25.71 25.71
0.75–0.76 42.5217.23 25.2585.00
0.90–0.91 38.8914.59 24.0722.2899.83
0.103–0.104 33.31 33.31
0.118–0.119 39.05 39.05
0.133–0.134 42.66 42.66
0.149–0.150 37.33 37.33
0.165–0.166 40.06 40.06
0.194–0.195 34.02 34.02
0.202–0.203 29.85 29.85
0.205–0.206 40.79 40.79
0.219–0.220 29.2912.87 42.16
0.251–0.252 26.27 26.27
0.265–0.266 25.3311.36 36.69
0.281–0.282 31.89 31.89
0.297–0.298 31.27 31.27
Table 2. Chemical composition of sand TS.
CompoundConcentration [%]
SiO299.1
Al2O30.25
Fe2O30.045
TiO20.03
CaO0.06
MgO0.05
K2O0.11
Na2O0.05
Table 3. Conductivity and pH values of the eluate samples measured at 20 °C.
SamplepHConductivity *
mS/cm
Conductivity °
S/m
GC01S87.494.296.94
GC01S97.085.138.30
GC01S105.73.665.79
GC02S17.074.496.91
GC02S27.045.059.26
GC02S37.045.057.80
GC02S47.135.248.19
GC02S57.125.378.44
GC02S65.816.099.47
GC02S77.514.46.93
* Diluted samples; ° calculated values related to samples’ dilution.
Table 4. Anions (g/L) in the eluate samples obtained by ion chromatography (IC) analysis.
AnionsGC01S8GC01S9GC01S10GC02S1GC02S2GC02S3GC02S4GC02S5GC02S6GC02S7
Cl20.211622.230413.260518.541119.567525.259022.169629.695527.140321.1107
±0.45180.42270.39610.36290.21660.46290.50510.46160.41940.4770
SO424.313410.123610.18879.218022.825210.09387.66856.929811.81894.9152
±0.27180.39000.38590.35370.52200.38200.35090.17350.34770.3799
Br0.08020.08550.05710.07690.07650.09750.09270.11720.10700.0826
±0.00380.00460.00620.00270.00250.00470.00900.00550.00960.0046
NO30.00280.00260.00110.00100.00290.00280.00110.00120.00120.0011
±0.00050.00020.00030.00030.00040.00020.00030.00030.00040.0003
F<0.0003<0.0003<0.0003<0.00030.0337<0.0003<0.0003<0.0003<0.0003<0.0003
± 0.0026
PO43<0.0020<0.0020<0.0020<0.0020<0.0020<0.0020<0.0020<0.0020<0.0020<0.0020
-
Table 5. Major elements (g/L) in the eluate samples obtained by inductively coupled plasma-mass spectrometry (ICP-MS) analysis.
ElementsGC01S8GC01S9GC01S10GC02S1GC02S2GC02S3GC02S4GC02S5GC02S6GC02S7
B0.01730.01090.00510.00570.01970.01800.01200.01610.01570.0153
±0.00940.00330.00180.00290.00600.01790.00790.01370.01620.0235
Na13.615011.89974.04337.100015.830213.210113.383819.826916.283912.0388
±1.34890.54480.94750.99682.01030.48230.53372.87141.88461.2166
Mg1.40000.62980.47080.57371.76593.51450.90091.74682.14470.5826
±0.12520.05720.05500.15350.15570.23320.11860.18790.33540.0508
Al0.00130.00090.00170.00020.00070.17620.00150.00070.00160.0025
±0.00020.00030.00080.00020.00020.03120.00150.00020.00200.0020
K1.55870.83510.48710.68601.82270.52591.15161.78461.47661.1568
±0.10520.13400.06240.07930.12840.04160.07680.13500.06670.0911
Ca0.53570.22690.13270.26070.24081.24980.30600.32860.59930.1891
±0.04970.02450.02450.04760.04470.15150.09570.04110.06610.0126
Mn0.00020.00010.00740.00110.01640.17120.00040.00100.01750.0002
±0.00050.00020.00630.00300.02180.15330.00070.00140.02580.0002
Fe0.00020.0004--0.00030.09030.00020.00060.00130.0006
±0.00030.0001--0.00040.01580.00030.00020.00060.0001
Ni0.00010.00010.00060.00010.00030.00930.00020.00030.00330.0002
±0.00000.00010.00030.00000.00030.00300.00010.00020.00170.0007
Zn0.00070.00030.00080.00020.00040.00970.00020.00010.00100.0001
±0.00050.00010.00030.00030.00050.00050.00030.00010.00050.0002
Sr0.00640.00350.00170.00270.00590.00820.00420.00660.00780.0028
±0.00270.00110.00130.00120.00020.00430.00250.00200.00210.0018
Table 6. Main parameters describing Test 1, carried out in sand PQ.
TitleTest 1
PT1 PT2 PT3* PT3 PT4
Parameters Abs. Abs. Abs. Rel. Abs. Rel. Abs. Rel.
P [bar]47.5647.0142.34 33.69 45.6
T [°C]4.456.473.59 2.53 6.37
nHYD [mol]00.0120.0860.0740.210.1980.005
H2OinHYD [mol]00.0740.517 1.743 0.032
H2Oliq [mol]76.9266.483 5.257 6.968
CH4g [mol]0.5670.5530.492 0.368 0.56
[CH4g] [%]8.087.997.586 7.0 8.042
GU% [%]02.1713.063 34.948 0.955
t [min]027.08233.75206.671617.921590.832566.67975.83
k [L/min]-8.12 × 10−45.99 × 10−45.71 × 10−42.66 × 10−42.57 × 10⁻⁴ −4.31 × 10⁻⁴
dCH4/dt [mol/min]-−4.91 × 10−4−2.95 × 10⁻⁴−2.81 × 10⁻⁴−9.78 × 10⁻⁴−9.44 × 10⁻⁴ 2.41 × 10⁻⁴
Table 7. Main parameters describing Test 2, carried out in sand PQ.
TitleTest 2
PT1 PT2 PT3* PT3 PT4
Parameters Abs. Abs. Abs. Rel. Abs. Rel. Abs. Rel.
P [bar]48.1847.337.93 34.11 41.52
T [°C]4.696.593.99 3.61 5.74
nHYD [mol]00.0190.1620.1450.2170.0580.092
H2OinHYD [mol]00.1070.972 1.282 0.554
H2Oliq [mol]76.8936.028 5.718 6.446
CH4g [mol]0.5740.5560.412 0.36 0.481
[CH4g] [%]8.1938.0626.827 6.294 7.465
GU% [%]03.10428.258 37.245 7.465
t [min]064.58457.08392.51878.331421.254498.752620.42
k [L/min]-4.88 × 10−47.26 × 10−47.65 × 10−42.48 × 10−49.43 × 10⁻⁴ −1.11 × 10⁻⁴
dCH4/dt [mol/min]-−2.71 × 10−4−2.99 × 10⁻⁴−3.15 × 10⁻⁴−8.93 × 10⁻⁴−3.39 × 10⁻⁴ 5.33 × 10⁻⁵
Table 8. Main parameters describing Test 3, carried out in sand TS.
TitleTest 3
PT1 PT2 PT3* PT3 PT4
Parameters Abs. Abs. Abs. Rel. Abs. Rel. Abs. Rel.
P [bar]58.2756.6650.94 34.2 52.2
T [°C]4.495.491.42 3.59 8.07
nHYD [mol]00.0330.1290.0970.3660.2370.036
H2OinHYD [mol]00.1990.773 2.194 0.213
H2Oliq [mol]76.8016.227 4.809 6.787
CH4g [mol]0.720.680.585 0.348 0.678
[CH4g] [%]10.1910.0059.39 7.239 9.991
GU% [%]04.65318.063 51.247 4.975
t [min]017.5536.25518.752157.921621.674326.662168.75
k [L/min]-2.72 × 10−33.72 × 10−42.92 × 10−43.3 × 10−43.2 × 10⁻⁴ −3.08 × 10⁻⁴
dCH4/dt [mol/min]-−1.85 × 10−3−2.17 × 10⁻⁴−1.71 × 10⁻⁴−1.16 × 10⁻⁴−1.11 × 10⁻⁴ 2.09 × 10⁻⁴
Table 9. Main parameters describing Test 4, carried out in sand TS.
TitleTest 4
PT1 PT2 PT3* PT3 PT4
Parameters Abs. Abs. Abs. Rel. Abs. Rel. Abs. Rel.
P [bar]60.0559.8455.02 42.83 54.75
T [°C]1.693.41.7 5.7 8.5
nHYD [mol]00.0090.0980.090.2970.1980.075
H2OinHYD [mol]00.0530.589 1.779 0.452
H2Oliq [mol]76.9476.41 5.221 6.547
CH4g [mol]0.7570.7480.659 0.46 0.682
[CH4g] [%]10.81310.76810.274 8.818 10.408
GU% [%]01.17612.987 39.173 0.1
t [min]034.17606.67572.54642.084035.425584.58942.5
k [L/min]-3.46 × 10−42.29 × 10−42.22 × 10−41.07 × 10−48.87 × 10⁻⁵ −4.16 × 10⁻⁴
dCH4/dt [mol/min]-−2.59 × 10−4−1.51 × 10⁻⁴−1.46 × 10⁻⁴−4.95 × 10⁻⁵−4.05 × 10⁻⁵ 2.84 × 10⁻⁴
Table 10. Variation of water content into sand pores due to hydrate formation.
ParametersTest 1Test 2Test 3Test 4
Min Hyd in pores [mol]0.2050.2120.3620.293
Max Hyd in pores [mol]0.210.2170.3660.297
H2O involved in Hyd [mol]1.2481.292.1841.77
H2O liq in pores [mol]2.8752.8331.7612.175
Pores occupied with H2O liq. [%]38.3537.7924.5530.32
Publisher’s Note: MDPI stays neutral with regard to jurisdictional claims in published maps and institutional affiliations.

