Article

Europeanization Processes of the EU Energy Policy in Visegrad Countries in the Years 2005–2018

1
Department of International Trade, Cracow University of Economics, ul. Rakowicka 27, 31-510 Kraków, Poland
2
Department of Entrepreneurship and Family Firms, University of Social Sciences in Łódź, ul. Sienkiewicza 9, 90-113 Łódź, Poland
3
Department of Automatics and Informatics, Faculty of Electrical and Computer Engineering, Cracow University of Technology, ul. Warszawska 24, 31-155 Kraków, Poland
*
Author to whom correspondence should be addressed.
Energies 2021, 14(7), 1802; https://doi.org/10.3390/en14071802
Submission received: 1 March 2021 / Revised: 19 March 2021 / Accepted: 22 March 2021 / Published: 24 March 2021
(This article belongs to the Special Issue Sustainable Energy & Society)

Abstract

:
Energy issues are sensitive for the four Visegrad countries as European Union (EU) member states; thus, this area’s convergence might be problematic for these countries. There is a clear research gap concerning the processes of Europeanization of the energy policy in the Visegrad countries. This article aims to identify and evaluate the progress of four Visegrad countries (V4) in implementing the EU energy goals in the context of the Europeanization. The article uses three main methods: Hellwig’s method, Kendall’s rank concordance coefficient, and k-means clustering. These calculations will allow one to study the Europeanization processes, which means checking the gamma convergence. For calculations, we use the available statistical data from Eurostat for the years 2005–2018. Poland and other Central European countries, including Czechia, and Hungary, largely depend on coal for their energy needs. The empirical results have shown that there have been no significant changes in the classification of EU countries in terms of their fulfillment of the EU climate and energy targets in the analyzed period. This is the case in all EU member states, including the Visegrad Group countries, but except for Poland. This means that the level of Europeanization of the energy policy and its effectiveness is similar in all member states except for Poland, which is becoming a kind of the exception. Throughout the investigating period, the Czech Republic, Hungary, and Slovakia were close to meeting the set targets and could be rated high compared to the EU countries. Poland, especially since 2015, has been noticeably and increasingly distanced from the other V4 countries. It can be perceived as a gradual drift away from Europeanization of the EU climate and energy policy in Poland.

1. Introduction

Energy as such and the EU energy policy is not only one of the most critical issues in the economic policy of this supranational organization, but also a significant challenge for all its member countries, and in particular in the ongoing context of regional or global energy wars [1]. These issues will become increasingly important in the coming years for several reasons. Firstly, the energy consumption in the EU, as indeed worldwide, is projected to increase mainly in the next decade (up to 2030). Secondly, the EU does not have its own fossil fuels, and this means that it is highly dependent on external suppliers of energy resources (such as Russia). Thirdly, currently in the world economy, especially in highly developed countries, there is a shift from the use of fossil fuel towards green energy [2,3], what per se is very challenging for some countries in terms of implementation of EU policies [4,5,6] and still growing importance of the solar photovoltaic sector in the EU [7]. Fourth, the economic interests and the raison d’etre, and the geopolitical circumstances of individual member states are divergent and sometimes even mutually exclusive [8]. Fifth, the European energy policy crosses EU borders, with Europeanization processes of energy policy affecting other countries, such as Georgia [9], or Morocco and Algeria [10]. Sixth, such factors as energy, energy policy, and international trade of energy affect particular economies’ international competitiveness [11]. Eventually, seventh, energy issues are sensitive for the four Visegrad countries as EU member states, as the transformation of energy policies in these countries started much later than in Western Europe.
There are many studies on energy in the “new” member states, especially the Visegrad Group countries (In the literature the phrase “old” and “new” member states is still in use. New EU member states include 13 countries, and 10 of them accessed the EU in 2004 (Cyprus, Czechia, Estonia, Hungary, Latvia, Lithuania, Malta, Poland, Slovakia, and Slovenia), 2 more in 2007 (Bulgaria, Romania), and Croatia in 2013). These studies are mainly concerned with energy commodity prices [12], their consumption [13,14], distribution and its cost efficiency [15], energy poverty [16,17,18], environmental standards [19], and more recently the implementation of EU energy policy and the green energy [20]. Few publications deal with the Europeanization of EU energy policy in “new” member states, and if any, preferably from the theoretical than empirical perspective [21,22,23,24]. Therefore, there is a clear research gap concerning the processes of Europeanization of energy policy in the Visegrad countries. This article is to contribute to this identified research gap. Furthermore, this article’s original contribution lies in applying Europeanization theories (EU studies) and international political economy (international economics) to the energy policy. Another novelty of this article lies in the fact that the comparative capitalisms literature has recently placed renewed emphasis on explaining market dynamics, including as Allen et al. [25] underscore the comparison of the impact of the energy policy on environment protection, which makes this study up to date.
Therefore, this article’s objective is to identify and evaluate the progress of four Visegrad countries (V4) in implementing the EU energy goals in the context of the Europeanization. The climate and energy policy targets were set and adopted to the given level of economic development of individual countries. By adopting more liberal targets for Central European countries, their economic possibilities and the still ongoing process of convergence of their economies with countries that have been in the EU for much longer were taken into account.
This article’s added value is to determine the effectiveness of the process of Europeanization in the field of climate and energy policy, especially in relation to the efforts made in this process by individual member states. Thus, it seems reasonable to determine the extent to which individual countries achieve the targets dedicated to them, especially against the other EU countries. This will make it possible to determine the effectiveness of the process of Europeanization in the field of climate and energy policy, especially in relation to the efforts made in this process by individual member states. Our approach differs from those found in the literature. Previous studies have focused separately on selective indicators representing energy policy [21,26]. In our case, we present an aggregated (synthetic) measure. We, therefore, show the progress of energy policy, taking into account its multidimensional nature. For this purpose, we use available variables of the different dimensions of energy policy and create an aggregate index that preserves the individual variables’ informative value. On this basis, we can position, hierarchize, and group respective European countries. In our opinion, this gives a more complete and comprehensive picture of the progress of the Europeanization of energy policy.
This article will seek answers to the following research questions:
RQ1—What is the level of implementation of the current energy policy goals by four Visegrad countries?
RQ2—What are the results of the Europeanization of the energy policy in four Visegrad countries?
We use three main methods: Hellwig’s method, Kendall’s rank concordance coefficient, and k-means clustering. These calculations will allow us to study the Europeanization processes, which means to check the gamma (γ) type of convergence [27]. For calculations, we use the available statistical data from Eurostat for the years 2005–2018.
After introducing the research topic and its novelty in Section 1, Section 2 of this article presents the theoretical foundations of the energy policy convergence and, what is more important, the theoretical framework this article refers to, namely Europeanization. At first, we focus on the Europeanization processes of this issue from the conceptual perspective. Then, we discuss the general historical overview of the energy policy of the EU. Section 3 introduces the research methodology and applied research methods aiming to meet the established goals. Section 4 includes our empirical results, which put some new light into the Europeanization of the EU energy policy by the Czech Republic, Hungary, Poland, and Slovakia. This is followed by the scientific discussion of the findings and this article’s contribution in Section 5. In the last part of this article, Section 6, we discuss the final summary of results, conclusions, policy implications, and research limitations.

2. Theoretical Framework: Europeanization Processes of the EU Energy Policy

This article uses three theoretical frameworks, (i) EU studies and its Europeanization stream, (ii) economic policy as the intersection of economics and political studies, which lied the foundations for the energy policy as a part of numerous economic policies, and (iii) international relations as the research domain at the crossroads of international economics and political sciences, rooted deeply in the international or global political economy, but on the other hand being also a part of the broad and rich EU studies. Many researchers support the opinion that the EU energy policy is rooted in the EU studies, so will we. To make this article different from the extant literature, we will consider the EU energy policy through the Europeanization processes’ prism as there is a noticeable lack of such publications.
Europeanization research dates back to the 1970s, although Exadaktylos and Radaelli [28] note that its heyday was in the last decade of the 20th century and continues today. Moravcsik [29], Sandholtz [30] and Kohler-Koch [31] are widely recognized as pioneers and precursors of Europeanization research. Dyson [32] emphasizes that the literature lacks a scientifically rigorous definition of Europeanization. Currently, the concept of Europeanization increasingly refers to the European Union itself, although as Wallance [33] points out, it definitely goes beyond the EU institutional framework. Bulmer and Lequesne [34] argue, based on their own analysis of the academic discourse addressing the topic of Europeanization, which the term currently refers mainly to the study of the impact of the European Union on its member states, noting that a much better term would be EU-ization. Wach [35] underscores that certainly Europeanization is an ambiguous concept, variously perceived and analyzed from different points of view. Flockhart [36] defines Europeanization as a dynamic, multiform process of diffusion of European thoughts, procedures and customs over time and space. Ladrech [37] treats Europeanization as an incremental process of reorganizing policy directions and shapes to the point where the European Union’s political-economic dynamics become part of national politics and policymakers’ organizational logic. Similarly, Börzel [38] interprets this phenomenon as a process whereby national administrative policy areas are increasingly susceptible to EU policy-making.
Holzhacker and Haverland [39] highlight three waves in the study of the Europeanization process, which de facto constitutes three generations of European studies (European integration studies). Moravcsik [40] introduced the bottom-up or the downloading approach towards Europeanization (being cultivated since the 1970s). This approach explains the impact of the EU and its policies on individual countries. Moravcsik firmly believed that the European Union strengthens national countries, with European integration viewed through the lens of Coase’s transaction cost theory.
Sandholtz [30], as an opponent to this view, believed in the top-down or the uploading approach (since the 1990s). In his view, the integration creates new opportunities for national actors, resulting in both institutional changes and changes in the design and scope of particular EU policies. Börzel and Risse [41] accentuate that Europeanization processes are an essential effect of domestic change in three dimensions: domestic politics, domestic policy, and domestic polity. The top-down approach treats European integration as an independent variable, with the Europeanization of member states acting as the dependent variable. Integration processes are explicative factors for understanding changes taking place at the national level. Research adopting such an approach concerned, using the terminology of statistical methods as defined in the literature, the goodness of fit between EU and national systems. Therefore, it is implicit that there must be a misfit in order to speak of compliance with the European Union’s requirements at all.
Kohler-Koch [31] argued that integration not only contributes to a multilevel distribution of power but also to the removal of boundaries between public and private spheres, and an evolutionary transformation takes place as a result of these changes. Wach [42] points out that currently, horizontal linkages, in line with the integrated (bipolar) approach, play an essential role in the process of Europeanization of individual member states. Although the so-called hard instruments of Europeanization (this is mainly about legislation) are still in use, the so-called soft instruments, typical of vertical cooperation, are increasingly used. These include the open method of coordinating (OMC), benchmarking and best practice, and the exchange of professionals.
Some researchers study the causes of Europeanization and the process by which Europeanization occurs. In examining the mechanism of Europeanization, Radaelli [43] considers it from six different perspectives. In areas where EU legislation is provided for, which he calls the European model, member states have to make efforts to make the required adaptation, where EU legislation creates adaptive pressure that generates the phenomenon of positive integration. In situations where the legislation is mandatory (e.g., consumer protection and energy policy), adaptation occurs through coercion, whereas in situations where the legislation may or may not be implemented (e.g., tax competition), mutualism occurs, as the EU legislation and the attitudes of other member states constitute a critical mass, which implicitly, as if by gravitational force, forces adaptation. On the other hand, when there is no European model, negative integration occurs, triggered by the market mechanism. Adaptation occurs under the influence of international regulatory competition, as a result of which new development opportunities appear on the domestic market. Still another way of thinking about areas where the influence of the European Union is weak and at the same time, the market mechanism does not force changes, i.e., member countries are not exposed to adaptive pressure. In such situations, the European Union institutions formulate the basic directions of specific policies, as a rule issuing recommendations in which specific solutions are proposed. As a result of pressure from national public opinion, expectations of change result in adaptation and change. The last, sixth mechanism occurs when the EU does not even issue recommendations, but there is spontaneous dissemination of the style of governance. The member states, seeing and understanding the EU’s attitude and mainly its style of action, adapt their own behavior.
Other researchers investigate the effects of Europeanization and the process by which it occurs. Nicolaides [44] analyses the benefits and costs of the process of Europeanization depending on the positive (convergence) and negative (non-convergence) effects achieved, as the effect of Europeanization in a given country is related to the benefits it can achieve. At the same time, achieving the assumed effect of Europeanization inevitably involves incurring certain costs. National governments change their behavior and implement successive solutions as a result, but only if their costs are decreasing. National governments learn the correct behavior only in the form of recommendations but do not transform this knowledge into action due to a lack of compulsion, which does not affect the cost curve. National governments may also opt for non-compliance and convergence when tolerance from the European Union is high.
Wach [42] made a specific classification of areas where the impact of Europeanization is prominent and identified 12 dimensions of Europeanization consisting of 7 non-economic and five economic dimensions of Europeanization, while the latter include (i) external macroeconomic, (ii) internal macroeconomic, (iii) mesoeconomic, (iv) microeconomic, and (v) managerial Europeanization.
Europeanization of the energy policy is at the intersection of the internal macroeconomic and mesoeconomic Europeanization. It means, on the one hand, the creation of favorable conditions for the development of industries (including the energy industry) and businesses (including energy companies) in the territory of the European Union, and on the other hand, the convergence of the macroeconomic systems of individual EU member states, and the convergence of the industries and sectoral policies (including the energy policy). The regulatory function of the European Union plays an important role. The European Union currently performs all three essential economic functions of the state, i.e., allocative, redistributive, and stabilizing, although the EU shares these competencies with member states. Due to the division of competences, the energy policy belongs to the shared competences between the EU and its member states as one of the sectoral policies. The importance of sectoral policies in the European Union’s economic policy has been growing, especially over the last decade. Agranoff and Ballart [45] show that the number of EU acts for a given sectoral policy indicates a high degree of Europeanization of the policy in question.
Boscheck et al. [46] ask at which level the energy policy is realized: regional, national, or European? Strunz, Gawel, and Lechmann [47] underline that the energy policy in the EU, on the whole, is diverse; some aspects are decentralized (e.g., nuclear policy), whilst some very Europeanized. Various researchers treat the energy policy Europeanization as the internal process within the EU [21,22], whilst some researchers try to focus on its external dimensions regarding non-EU member states. Samkharadze [9] observed that Georgia is affected by the EU energy policy. Katsaris [10] noticed that Europeanization processes of the energy policy affect or Morocco and Algeria. Escribano [8] argue that the EU energy policy can be treated as the external macroeconomic Europeanization (geopolitics, especially in the context of Russia) and the internal macroeconomic Europeanization (market needs and the competitive, regulatory framework within the EU). Before evaluating the Europeanization processes of the EU energy policy, we need first to see how this policy has been shaped. Nonetheless, Solorio and Jörgens [21] noticed that its climate and energy policies have become highly politicized and contested during the crises in the European Union. The energy sector in the European Union is currently undergoing one of the greatest modernizations in its short history since the 1950s. There is a complete shift towards sustainable, clean energy while ensuring diversification of supply and energy security [48,49].
This section has shown the theoretical foundations of Europeanization and their grounding in the literature. An attempt was also made to show emerging research on the energy policy Europeanization. The following section will take a chronological look at the EU’s activities in shaping, evolving, and developing the EU energy policy. These two sections together (theoretical framework and policy framework) will provide a basis for our own empirical study. Eventually, we will present a detailed analysis, evaluation, and discussion of the progress in the energy policy Europeanization.

3. Policy Framework: Past and Present Background of the EU Energy Policy

Although the origins of EU energy policy can be traced back to the 1950s, its contemporary face dates nearly four decades later, to the late-1980s. Historically, from a retrospective perspective, we can distinguish several periods in developing the common energy policy. It is not the sole purpose of this article to give an overview and diagnosis of the EU’s historical activities in the field of the energy sector and energy-related policies; therefore, we will only discuss a selection of the most important activities and actions of the European Union aimed at realizing a European energy union. As a complement to our broader analysis, the detailed results we will not discuss in this article, which is the most important milestones in the EU energy policy, are shown in Table 1 as a more detailed overview.
The genesis of the EU energy policy had come to light together with the creation of the European Coal and Steel Community (ECSC), which was a European integration organization formally established in 1951 by the Treaty of Paris [23] and the European Atomic Energy Community (Euratom) in 1957 by the Treaty of Rome [24]. The policy in the first period, in the years 1952–1973, was dominated by the issues of coal mining. “Further orientation for a common energy policy” as the notification from the Commission to the Council of 18 December 1986 was the first document concerning the energy sector in Europe and the common energy policy. The second period of the policy (years 1973–1988) is marked by the first oil crisis 1973–1974 and the second wave of the oil shock 1979–1982. Energy security dominated the whole energy policy during these years. This energy crisis triggered the start of a transformation of the energy sector in European countries, from a policy based on cheap fossil energy towards energy saving and improved efficiency of its use. The turning point for the EU energy policy came in 1988 with the publication of an essential document entitled “The Internal Energy Market 1988” [50]. The third period, 1988–2000, was basically confined to the administrative regulation of the energy market in Europe. Earlier predictions about replacing coal as the primary energy source by fissile materials did not materialize apart from some exceptions like France [51], as the green movements gained importance. The change in the EU policy was brought about by the first of three crucial energy directives. Therefore, the European single market in electricity has been promoted vigorously by the European Commission since 1996 [52]. The very first essential directive 96/92/EC opened the energy market in the European Union, and the first country to do so was the UK in 1999. The whole 1990s changed politicians and societies’ awareness towards energy and electricity; many documents were created, so from the historical perspective, it was a beneficial period, despite the low efficiency in deep integration.
The fourth period, 2000–2015, sought to liberalize the EU energy market and transform the European Union countries into low-carbon, renewable economies. The 2000 Lisbon Strategy underscores the role of energy in Europe and postulates the further integration of the single energy market; however, due to individual states’ diverging interests, no compromise was reached on many issues, leaving them still unresolved. Since 2005, the EU has also used the Emissions Trading Scheme (ETS). This system uses the principle of “cap and trade” to reduce harmful emissions [25]. The system allows emissions allowances to be traded, i.e., those who no longer have the right to emit pollution to buy them from those who still have available limits. Laing et al. [53] found that the ETS-based policy has led to a decrease in greenhouse gas emissions. It was the Lisbon Treaty, signed in 2007 and entered in force on 1 December 2009, that included the energy policy among the areas of shared competence between the EU and particular member states.
Nonetheless, the Lisbon Treaty referred to energy solidarity, which should be seen as an attempt to establish a unique mode of interaction and cooperation within the EU [24]. The next two above mentioned basic directives towards setting out a pan-European policy was introduced in 2003 and 2009 [52]. The 2003 directive (03/54/EC) introduced third-party access (TPA) and unbounding, separating vertically integrated undertakings. The 2009 directive (09/72/EC) established a EU regulatory agency for electricity and gas (Agency for the Cooperation of Energy Regulators. ACER) [50]. In its Climate and Energy Package, the EU introduced “20-20-20” targets to be reached by 2020, including (i) 20% increase in energy efficiency, (ii) 20% reduction of CO2 emissions, and (iii) 20% renewables [20]. We will elaborate on these goals more in details in the research methodology section of this article, as these indicators will be applied in our empirical study. In 2009, the EU also introduced energy poverty monitoring [54]. Due to the cost needs to transform the economies, especially for “new” member states and the wealthy of countries, which is measured in GDP per capita, the EU decided to establish individual targets for particular member states (Figure 1). Van de Graaf and Colgan [55] observed that the 2014 Russian–Ukrainian conflict revealed the problems that energy dependency and energy security can cause.
The present day energy policy, which can be referred to as the fifth period, from 2015+, has attempted to put forward the energy integration within the EU. While the previous climate and energy policy was primarily aimed at climate protection, its contemporary scope is much broader [56]. The present day energy policy, announced in 2015 in “The Energy Union Strategy”, is based on five interrelated and closely related areas—key priorities, namely: (i) security, solidarity, and trust between EU countries, (ii) a fully integrated internal energy market, (iii) energy efficiency—reduced dependence on importing energy imports and increased lower emissions, (iv) climate action by decarbonizing the economy, and (v) research, innovation, and competitiveness—supporting breakthroughs in low-carbon and clean energy technologies. A noticeable effect of the Europeanization of the energy sector is the creation of the Energy Union. It aims to ensure the energy security of the EU and at the same time to improve its competitiveness and make it a world leader in the field of energy from renewable sources. The evaluation of the Europeanization process can be assessed by the progress of the Energy Union implementation. In the cyclical reports of the European Commission (EC) to the European Parliament, the Council, the European Economic and Social Committee, and the Committee of the Regions, the progress made and recommendations for further work requiring special attention in the coming years are presented [57].
In 2019, a new comprehensive strategy of the EU was introduced in the “Clean Energy for All Europeans” package. This is a current EU energy policy framework to achieve carbon neutrality by 2050 by facilitating the transition away from fossil fuels and replacing them with cleaner energy [25]. This is a package of eight legislatives, and the EU member states have up to 2 years to transpose these new directives into their national law. The 2030 strategy postulates five key actions: (i) improving energy performance in buildings in order to reduce energy consumption and CO2 emissions, (ii) increasing renewable energy with the target of 32% by 2030 in order to be the global leader, (iii) improving energy efficiency by energy savings and reducing greenhouse gas emissions, (iv) establishing integrated 10-year national energy and climate plans by all member states for the years 2021–2030, and last but not least (v) designing a modern and more flexible electricity market. In the updated and current Climate and Energy Framework, the EU introduced “40-32-32.5” targets to be reached by 2030, including (i) 40% reduction of CO2 emissions, (ii) 32% renewables, and (iii) 32.5% increase in energy efficiency (Figure 1). National targets are based on the relative wealth of a country (in GDP per capita). This means that less wealthy countries are assigned less ambitious targets. These targets are based on the effort sharing legislation, which establishes binding annual greenhouse gas emission targets for individual countries in the periods 2013–2020 (2020 target) and 2021–2030 (2030 target).

4. Research Methodology

4.1. Variables and Data

Our study assumed that implementing the EU climate and energy package’s objectives would promote the efficiency of energy production and use and reduce their negative impact on the environment. It will be done by increasing the share of renewable energy in gross final energy consumption, reducing primary and final energy consumption, and reducing greenhouse gas emissions (GHG). The EU set the three fundamental targets of a 20% cut in greenhouse gas emissions (from 1990 levels), 20% of the EU energy from renewables, and 20% improvement in energy efficiency.
To reduce greenhouse gas emission, the EU takes actions in several areas, e.g.,
(a)
Emissions trading system (ETS). The ETS covers around 45% of all EU greenhouse gas emissions. The EU emissions trading system is the EU’s key instrument for reducing greenhouse gas emissions from large-scale facilities in the power and industry sectors and the aviation sector. In 2020, emissions from these sectors were to be reduced by 21% compared to 2005;
(b)
Greenhouse gas emissions in the effort sharing decision (ESD) sectors. The ESD covers around 55% of all EU greenhouse gas emissions. The ESD sets national annual binding targets for emissions not covered under the EU emission trading scheme. These sectors include, for example, housing, agriculture, waste, and transport (excluding aviation). EU countries took on binding annual targets until 2020 for reducing emissions in these sectors (compared to 2005), under the “effort sharing decision”. The national targets were to allow for an overall reduction of EU emissions from ESD sectors of around 9% by 2020. The national targets level depended on a country’s wealth, investment capacity, and higher potential economic growth carrying the risk of higher emissions [58]. National emission targets for 2020 ranged from a 20% reduction by 2020 for the wealthiest member states (Denmark, Luxembourg) to a 20% increase for the least wealthy country (Bulgaria). All Visegrad countries could increase their GHG emissions by 2020 compared to 2005—Czechia by 9%, Hungary by 10%, Slovakia by 13%, and Poland by 14%.
Under the Renewable Energy Directive [59], EU countries have set binding national targets for increasing the share of renewable energy in total energy consumption by 2020. These national targets are consistent with the objective of a 20% share of renewable energy in the EU’s gross final consumption of energy in 2020. National targets vary according to countries’ starting position regarding renewable energy production and capacity to increase it, ranging from 10% in Malta to 49% in Sweden. The targets for V4 countries for 2020 are Czechia—13%, Hungary—13%, Slovakia—14%, and Poland—15%.
The 20% improvement of the energy efficiency target was enacted in legislation to adopt the Energy Efficiency Directive [60]. It meant lowering the EU’s final energy consumption to no more than 1086 million tonnes of oil equivalent (Mtoe) or primary energy consumption to no more than 1483 Mtoe. To reach the energy efficiency target (20%) by 2020, individual EU countries must set their own indicative national energy efficiency targets and publish 3-year national energy efficiency action plans (NEEAPs) and annual progress reports. In the study, we will use the original targets notified in 2013 and the updated targets as declared in the NEEAPs 2014, Annual Reports, or separate notifications to the European Commission in 2015 and 2016 [61]. V4 countries committed to reducing primary energy consumption to the following levels: Slovakia—16.4 Mtoe, Hungary—24.1 Mtoe, Czechia—39.6 Mtoe, and Poland—96.4 Mtoe.
Our study focused on analyzing the degree of implementation of the adopted targets by the V4 countries compared to the EU countries (EU28).
Based on the current energy policy indicators, we selected the following variables (Table 2):
  • Change in greenhouse gas emissions in effort sharing decision (ESD) sectors (2005 as the base year, in%). We treated this variable as a destimulant because an increase in its value results in a downgrading of the country’s rating;
  • Share of renewable energy sources (RESs) in gross final energy consumption (in %). We treat this variable as a stimulant because the EU is moving towards an increase in renewable energy;
  • Primary energy consumption (in Mtoe). We treat this variable as a destimulant because the EU’s objective is to reduce energy consumption.

4.2. Method

The values that were the subject of our study were the relationship of these variables’ level in the analyzed years to the target set for 2020 for individual countries. To compare the degree of implementation of these goals by the V4 countries and other EU countries, we used the multivariate comparative analysis method, which allows the assessment of objects and phenomena, the state of which was affected by many variables at the same time. The comparative analysis is enabled by linear ordering, which leads to determining the order of objects due to one aggregated synthetic variable. We used two linear ordering methods: the Hellwig method [63] and the TOPSIS method [64,65]. In Hellwig’s method, the reference point for objects is the pattern, while in the TOPSIS method, two reference points are determined—the pattern and the antipattern. Both methods consist of determining the distance of particular objects from such defined reference points. The procedure of synthetic measures construction in both methods is presented in Table 3.
We used the results of linear ordering and the ranks assigned to countries to determine whether there is a gamma (γ) type of convergence between EU countries during the period under analysis. This type of convergence was popularized in the literature by Boyle and McCarthy [66]. The γ convergence occurs when countries change their rankings over time. The absence of convergence will indicate no significant changes in the ranking of countries due to the level of achievement of EU climate and energy targets.
Table 3. Applied variables.
Criteria Hellwig MethodTOPSIS Method
Standardization formula z i j   =   x i j x ¯ j s j
z i j —value of standardized variable
x i j —value of j variable of i country
x ¯ j —arithmetic mean of j variable
s j —standard deviation of j variable
z i j   =   x i j i = 1 n x i j 2
z i j —value of standardized variable
x i j —value of j variable of i country
Pattern (+) and antipattern (−) z 0 j +   =   max i { z i j } for stimulant
z 0 j +   =   min i { z i j }
for destimulant
z 0 j +   =   max i { z i j } for stimulant
z 0 j   =   min i { z i j } for stimulant
z 0 j +   =   min i { z i j } for destimulant
z 0 j   =   max i { z i j } for destimulant
Distance of objects from pattern and antipattern d i 0 +   =   j = 1 m ( z i j z 0 j + ) 2
m —number of variables
d i 0 +   =   j = 1 m ( z i j z 0 j + ) 2
d i 0   =   j = 1 m ( z i j z 0 j ) 2
m —number of variables
The synthetic variable q i   =   1 d i 0 + d 0 +
d 0 +   =   d ¯ 0 + + 2 s d 0 +
d ¯ 0 + —arithmetic mean of distances form pattern
s d 0 + —standard deviation of distances from pattern
q i = d i 0 d i 0 + + d i 0
Result and interpretation q i ϵ [ 0 ; 1 ]
max i { q i } —best object
min i { q i } —worst object
Source: Own elaboration based on [67,68].
Kendall’s rank concordance coefficient can be used to verify the γ-convergence hypothesis [27]. Its form taking into account changes occurring in individual years of the analyzed period looks as follows:
γ t = v a r ( t = 0 T R i t ) v a r ( ( T + 1 ) · R i 0 )
where:
R i t —rank of i-th country in year t;
R i 0 —rank of i-th country in year 0 (first period of analysis);
T —interval between the first and last year of the survey (T + 1—number of years analyzed).
Kendall’s rank concordance coefficient takes values in the range [0;1]. The closer its value is to zero, the more significant the change of places of the countries in the ranking in particular years, which indicates the occurrence of convergence. The value of the coefficient equal to 1 means no change at all.
Considering the analyzed variables, we also conducted a cluster analysis for the last year of the study period. In the first step, we used tree clustering analysis by assuming Ward’s method as the amalgamation rule and Euclidean distances as the distance measure. The tree diagram and graph of the amalgamation schedule led us to determine the number of country groups. In the second step, we used k-means clustering to determine the groups’ composition and the level of significance of the variables as a differentiating factor between the groups.

5. Empirical Findings

V4 countries differ in the level of implementation of EU climate and energy targets. Our analysis of GHG targets’ level of implementation refers to the national limits set for effort sharing decision (ESD) sectors (Table 4), i.e., those not covered by the ETS. They refer to the permissible percentage increase (for less developed countries) or mandatory reduction (for more developed countries) of GHG emissions by 2020 in relation to 2005. This was one element of the EU’s commitment to reduce greenhouse gas emissions by 20% compared to 1990.
In pursuit of this goal (to reduce GHG by 20% in the EU), all V4 countries were allowed to increase (and not to reduce as in general) their greenhouse gas emissions. This mechanism concerned Poland the most, which in 2020 could increase emissions by 14% compared to 2005. Only Poland exceeded its limit. In each of the years of the analyzed period, Poland’s GHG emissions were higher than in 2005, but the exceedance of the 2020 limit was only in 2017 and 2018. In 2018, Poland’s GHG emissions were 106.2% of the 2020 limit. Additionally, in the Czech Republic, in selected years of the analyzed period, GHG emissions were higher than in 2005, but in none of these years, the 2020 limit was exceeded, and in 2018 GHG emissions in the Czech Republic accounted for 95.4% of the 2020 limit. In Slovakia, 2005 emissions were only slightly exceeded in 2010, while in Hungary GHG emissions were lower than in 2005 every year of the analyzed period. In 2018, GHG emissions in Hungary and Slovakia were below the 2020 limit, at levels of 82% and 84.5% of these limits, respectively. For the EU28 countries as a whole, below the 2020 limit was already achieved from 2011 onwards. In 2018, EU28 GHG emissions from the ESD sector were 97.8% of the 2020 limit.
Table 5 shows the targets’ implementation relating to the countries’ commitments to achieving a certain minimum level of renewable energy share in gross final energy consumption. Among the V4 countries, the set target was sustainably achieved only by the Czech Republic, which exceeded its commitment of 13% for 2020 already from 2013. In 2018, they met their 2020 target of 116.6%.
Hungary also exceeded its 2020 commitment between 2011 and 2017. In 2018, however, the country’s renewable energy share declined and fell below its 2020 target to 96.4% of its value. Poland and Slovakia did not meet their 2020 targets in any of the years of the analysis period. In 2018, Poland met its target of 76.5% and Slovakia of 85%. The situation is similar for the EU28 countries as a whole, which failed to achieve their target share of renewable energy in gross final energy consumption by 2018. In 2018, the EU28 countries met their target by only 90.1%.
Table 6 shows the primary energy consumption of the V4 countries. Targets refer to the limit of primary energy consumption in 2020 (in Mtoe). Among the V4 countries, only Slovakia managed to permanently go below the limit, which had not exceeded the 2020 limit since 2011. In 2018, the primary energy consumption in Slovakia was 96.3% of the 2020 limit.
Poland did not exceed the limit until 2009 and in the years 2012–2016, however, in subsequent years, primary energy consumption increased, and in 2018 it accounted for 104.8% of the limit set for 2020. The situation was similar in Hungary. In 2012–2016, the primary energy consumption did not exceed the limit, but there was an increase in subsequent years’ primary energy consumption. In 2018, it accounted for 101.7% of the limit set for 2020. In the Czech Republic, primary energy consumption exceeded the 2020 limit in each of the years of the analyzed period. In 2018, the Czech Republic’s primary energy consumption was 102% of the limit set for 2020. The EU28 countries as a whole also failed to meet the 2020 fixed limit for primary energy consumption by 2018. In 2018 this limit was exhausted in 104.7%.
To determine the position of the V4 countries in meeting climate and energy targets compared with all EU countries, we conducted the multivariate comparative analysis using Hellwig’s method and the TOPSIS method. They gave comparable results, and the correlation coefficient between the values of synthetic measures obtained by both methods ranged for individual years from 0.881 (for 2007) to 0.949 (for 2014). Table 7 presents the ranking of countries using Hellwig’s method, according to the 2018 classification.
We marked the rankings with different colors in the ranges 1–7, 8–14, 15–21, and 22–28. This makes it easier to conclude that the rankings’ changes for individual years are not significant, and this applies mainly to the group of countries ranked highest and at the bottom of the rankings.
This is also confirmed by the results of Kendall’s rank concordance coefficient, which for the period 2005–2018 amounted to 0.892, indicating the absence of gamma convergence, and therefore a relatively permanent arrangement of the rankings in the individual years of the analyzed period.
Throughout the analyzed period, Croatia and Romania were on the highest ranks, other new EU member states were also highly ranked, especially the Baltic states: Lithuania, Latvia, and Estonia. Among the V4 countries, Hungary remained highest in the rankings until 2016; however, it lost this position in 2017–2018 and took place comparable to the Czech Republic and Slovakia. On the other hand, Poland saw a steady decline in the rankings from the 6th place in 2005 to the 22nd place in 2019. We also showed this in Figure 2, which includes the synthetic measure values for the V4 countries only.
Figure 2 shows that at the beginning of the analyzed period Poland was the leader of the V4 countries; in later years, especially starting from 2015, Poland’s position against the V4 countries clearly started to deteriorate. In the years 2008–2015, Hungary stood out positively compared to the V4 countries, but now it is on the same level as the Czech Republic and Slovakia.
We also used the values of the relations of the analyzed variables in 2018 to the targets set for 2020 to perform cluster analysis. Tree diagram and graph of the amalgamation schedule decided to divide the countries into three groups in the k-means method. The variance analysis test results (ANOVA) showed that all analyzed variables were differentiated between clusters (Table 8). This was least true for primary energy consumption (p = 0.018). The level of target achievement in relation to this variable is the most similar in all clusters.
Table 8 shows that the countries in Cluster 1, which includes Poland, recorded the worst performance in terms of each variable analyzed. In 2018, on average, these countries exceeded their 2020 targets by 6% in relation to greenhouse gas emissions and by 5.6% in relation to primary energy consumption. At the same time, they met their commitment to sharing renewable energy in only 75.7%. These countries are at the bottom of the classification in ranking using the Hellwig method.
Cluster 2, in which the Czech Republic is located, had an average of the highest rate of achievement of the target for renewable energy share (114.7%). On average, countries in Cluster 2 on average also did not exceed their limits for greenhouse gas emissions (98.7% of the limit) and primary energy consumption (99% of the limit).
In contrast, countries in Cluster 3, which include Hungary and Slovakia, on average failed to meet their targets for the share of renewable energy in 2018 (94.9%) but performed best in reducing greenhouse gas emissions (84% of the limit) and primary energy consumption (92.1% of the limit).

6. Discussion and Contribution

6.1. Overall Progress in the EU Energy Policy Implementation

Based on the available data and analytical reports, we can observe positive changes in the implementation of energy policy in the European countries [57]. It is evident particularly in the creation of the energy union and realization of its dimensions. The most significant progress has been made in the decarbonization of the economy. Over the years, EU economies have significantly reduced greenhouse gas emissions and increased renewable energy share. Positive changes are also visible in the fully integrated internal energy market [70]. In recent years, slight changes have taken place in energy security, solidarity and trust, and energy efficiency. The European Union is still quite strongly dependent on external energy supplies. Ten EU economies saw a decrease in the dependency ratio in 2018 compared to 2005. Among these economies were Hungary and Slovakia, while the Czech Republic and Poland saw an increase in energy dependency. Relatively small changes also occurred in the energy efficiency dimension. Only a few countries saw a decrease in final energy consumption (France, Germany, Spain, and Greece). Unsatisfactory effects were realized in the research, innovation, and competitiveness, particularly in recent years. From the available data, in 2017, only Belgium and Germany increased public spending on energy research compared to 2005 [69].
There were significant differences in the implementation of the different dimensions of the Energy Union for individual European countries. A more considerable variation was observed in all countries (EU28), while the Visegrad Group was more homogeneous in relation to the EU as a whole. It can be noted that the highest level of integration was achieved in the area of decarbonization of the economy. On the other hand, a significant variation of indicators is visible in the final energy consumption, energy infrastructure, and public spending on Energy Union research and development priorities. When analyzing the available data, most of the observed variables are below the EU average. It means that the infrastructure level expressed by the electricity interconnection indicator in most countries is below the EU28 average value. The same phenomenon occurs for final energy consumption, public expenditure on R&D in energy, the share of renewable energy consumption, and greenhouse gas emission reductions. However, when interpreting these values, it is crucial to bear in mind the individual indicators’ nature. While in the case of the common market, the decarbonization of the economy or energy research, these results are unfavorable for energy integration and the Union, in the case of energy efficiency, results below the average for most European countries indicate positive developments. In energy efficiency, the lowest possible values for the indicator under consideration are desirable [69]. The Visegrad Group achieves lower average values of indicators representing the energy union’s dimensions than the EU28. It means that the level of energy dependence is lower in the Visegrad Group than in the EU28 as a whole, even though the indicator of net import dependence has increased in the Czech Republic and Poland. The level of energy infrastructure is also at a lower level than in the EU28. Final energy consumption is relatively lower than in the EU countries. There is also a noticeable disparity in energy use from renewable sources by more than 10pp on average [69].
In terms of meeting the targets set for 2020, the EU28 distance in the dimension of energy efficiency (final energy consumption) was 2.6% in 2019 [69]; in the dimension of decarbonization of the economy (greenhouse gas emission) already in 2019 a reduction of 24% compared to 1990 was achieved, i.e., above the target; while in the case of renewable energy in 2019 it was 19.7% means 0.3 p.p. less than the required target in 2020 [69].

6.2. Europeanization of the Energy Policy in Visegrad Countries and Its Effectiveness

This article is one of the first empirical attempts to show the Europeanization processes of the EU energy policy, as research have seldom undertaken this topic and there has been only few publications so far [21,22,23,24]. Without any doubts, the EU energy policy is one of the best examples of the Europeanization processes [46,47], despite the fact it is still underexplored. It is challenging to assess the effects of the Europeanization of energy policy in the European Union unequivocally. On the one hand, some areas (those concerning the internal market) are firmly Europeanized, while others are entirely decentralized and fall within individual member states’ competence [21,22]. Dyduch [24] praises the Europeanization of energy policy mainly because of the improvement in energy efficiency and its proenvironmental and proecological approach. Unfortunately, national interests still influence energy policy, which is set by the large member states, while the voice and views of the “new” member states from Central and Eastern Europe are not heard. As Dyduch [24] notices, “when speaking of failures of the energy policy Europeanization, one should mention the Nord Stream and the South Stream pipelines” (p. 211) as both projects clearly contradict the energy security policy and the diversification goal.
The advancement of the EU energy policy implementation in Visegrad countries is not easy to evaluate. The results of the multidimensional comparative analysis do not provide clear conclusions. The Europeanization of energy policy in the V4 countries is diverse and varied, and the group itself is quite heterogeneous. Considering the synthetic measure, it can be noted that at the beginning of the analyzed period, the Visegrad countries were at a similar level of energy policy implementation. Subsequent years are characterized by increasing diversification and de facto worsening situation of all Visegrad countries. The level of implementation of the European energy policy in the last year of analysis was relatively lower than at the beginning of the analyzed period. Against this background, Poland’s worsening situation regarding the advancement of the implementation of the EU energy policy is highlighted. Similar conclusions, although more moderate, are drawn by Pach-Gurgul and Ulbrych [20], analyzing the V4 between 2005 and 2016. The authors conclude that “the V4 economies record an average rating in the implementation of the energy and climate framework” [20]. According to this study, Slovakia and Hungary of the V4 group implement energy policy best, while the other two economies: Poland and the Czech Republic, the worst. Our study shows that in the period 2009–2014, by far the highest degree of implementation of the EU energy policy was seen in Hungary. This country’s synthetic indicator significantly exceeded the other economies. In the last years of analysis, Hungary’s situation has worsened, and the level of energy policy implementation has leveled off to Slovakia and Czech Republic level. In 2017–2018, the three economies were at a similar level of implementation of the 20/20/20/objectives. As in the study of Pach-Gurgul and Ulbrych [20], Poland’s situation is the worst, especially since 2015, a downward trend of the synthetic measure is visible.
Poland and other Eastern countries, including the Czech Republic, and Hungary, largely depend on coal for their energy needs. What is more, in 2019, Poland did not commit to the 2050 climate neutrality goal, and Poland claims the Emissions Trading System to be revamped. The Czech Republic and Poland base their energy balance on their natural fossil fuels; in Poland, its share accounts for 52% of the country’s energy mix, while in the Czech Republic, 38% [71].
Against the background of the above results, it is worth referring to the observations that Mišík [72] noted based on the V4 positions on energy policy analysis. At the stage of the Energy Union constitution, he pointed out that the Visegrad countries have a de facto common interest in active participation in the EU energy policy (especially in the field of energy security). However, they show divergent attitudes. On the one hand, they support the project but differ in specific aspects. It is difficult for them to position themselves against guidelines that consider all member states’ positions on energy policy integration [72]. On the other hand, according to Mišík [72], this may also be determined by the internal energy policies of the V4 countries.
This, in turn, is consistent with the recent findings of Zapletalova and Komínkova [73]. They examined V4 members of the European Parliament’s voting behavior on EU energy and climate policy from 2014 to 2019. The authors noted that there was significant heterogeneity in voting behavior and proximity of V4 state positions on energy and climate issues at the decision-making level. Clearly, these are different levels of analysis. However, they suggest a V4 differentiation both at the decision-making and executive level, and, consequently, the process of Europeanization of energy policy is not sufficient enough.
Dyduch and Skorek [26] discuss the V4 countries’ energy policy diversification strategies, especially in the area of the energy mix. However, the authors note some important common features of the V4 economies. The study confirms that these countries favor liberalizing the energy market to strengthen their energy security. Thus, it is apparent that the EU’s energy policy goals overlap primarily with the diversification and liberalization goals of the V4. Undoubtedly, issues of clarity regarding the cost–benefit calculations and sustainability of some energy projects initiated by the EU are still problematic for the V4 (e.g., integration of the energy infrastructure) [74].
We should evaluate the lagged and backward situation of four Visegrad countries in the context of all EU member states through the prism of the economic development. Central Europe’s economies are not so wealthy compared to Western Europe economies measured in both absolute GDP and especially relative GDP per capita. These economies’ structure is more dependent on coal, and new, renewable sources of energy are not so popular. These were the reasons why Visegrad countries started the energy convergence process with much more liberal targets than their Western counterparts. This is why we should look at the current state-of-the-art in the context of the implementation of the EU energy policy and the convergence of the energy targets and energy sources, which is the value-added of this article.

6.3. Contribution and Value Added

The EU climate and energy policy targets have been adapted to the particular member states’ level of economic development and capabilities. This is reflected in the differentiated levels of targets. They take into account the process of economic convergence of the EU countries, which requires relatively faster economic growth of the less developed countries. Therefore, the EU policy accepts that this accelerated growth cannot remain environmentally neutral. The individual member states’ energy resources and their potential for using renewable energy sources were also taken into account when setting the targets.
The study shows that there have been no significant changes in the ranking of EU countries in terms of their compliance with climate and energy targets during the period under investigation (2005–2018). This also applies to the Visegrad Group countries, except for Poland. Czech Republic, Hungary, and Slovakia were close to meeting the set targets and could be ranked highly compared to the EU countries. Poland, especially since 2015, is clearly and increasingly diverging from the other V4 countries in this respect, which can be read as a gradual departure from the idea of Europeanization in the EU climate and energy policy.
This article’s contribution to extant literature is the replication of research within the discussed scope, but with the updated analyzing period and developed methodology, as discussed in the methodology section. It enriches quantitative research on the effectiveness of energy policy, of which there is very limited research of. Moreover, we show the problem by capturing its multidimensionality. This study is one of few publications dealing with the Europeanization of EU energy policy in “new” member states, which is a visible contribution to the literature.

7. Conclusions

7.1. Results Summary

Energy policy is one of the most critical and sensitive areas of Europeanization. In this area, the local interests of individual countries and the efforts and goals of the EU as a whole often clash. The divergence of positions is often conditioned by geographical location, historical baggage, or other endogenous factors of individual economies. This is also true for the Visegrad countries, as shown by research and studies on their EU energy policy positions [26,73,75]. However, it is more difficult to assess the actual progress of energy policy implementation in the V4 countries due to the limited number of quantitative studies on this topic. An example of such an approach is our research showing the Europeanization of energy policy on V4. It turns out that the V4 countries are implementing the EU energy policy at different speeds and with different results. The level of implementation of energy and climate objectives varies across the geographical scope of V4 and over time. This means that individual Visegrad countries’ positions have changed over time, as has the intensity of implementation of the 20/20/20 targets. Among the V4 countries, Czech Republic and Slovakia are the most similar in terms of energy policy implementation during the entire period. Poland’s position, which was the leader among the V4 countries at the beginning of the analyzed period, has changed dramatically, whereas, since 2015, its situation has significantly deteriorated. Hungary between 2008 and 2013 also stood out from the group, but this was due to the observed positive changes in implementing the EU energy policy. The synthetic measure of the 20/20/20 targets in Hungary during this period was significantly higher than in the other V4 countries. The observed differential trend in V4 countries is consistent with the general trend in the EU. The EU, as a whole, is also very heterogeneous in terms of the implementation of energy policy objectives. The cluster analysis has shown that the EU’s diversification is somewhat different in energy terms than in other aspects of integration, where there is usually a division into “old” and “new” EU countries. The selected clusters bring together both the new, old, northern, and southern countries in one segment. This provides interesting conclusions, but above all, it intrigues us to undertake further research to explain the reasons for such a significant diversification in energy policy implementation. It is recommended to conduct quantitative research on the effectiveness of energy policies in V4 countries and the EU as a whole.
Our empirical research results showed that there were no significant changes in the classification of EU countries in terms of their fulfillment of the EU climate and energy targets in the analyzed period. This is basically in all EU member states, including the Visegrad Group countries, but except for Poland. This means that the level of Europeanization of the energy policy and its effectiveness is similar in all member states except for Poland, which is becoming a kind of exception. Throughout the investigating period, Czech Republic, Hungary, and Slovakia were close to meeting the set targets and could be rated high compared to the EU countries. Poland, especially since 2015, was noticeably and increasingly distanced from the other V4 countries. It can be perceived as a gradual drift away from the Europeanization of the EU climate and energy policy in Poland.

7.2. Policy Implications

The undertaken problem seems to be very promising in terms of possibilities for scientific explanation. It is all more critical that it also carries an excellent utilitarian meaning. Our study provides essential information that can be a starting point for policymakers dealing with energy policy. In this context, we can refer to the level of individual V4 countries, the whole regional grouping, and the supranational—EU level.
It may be noted that the objectives of the EU energy policy coincide with the energy intentions of individual countries, especially in terms of liberalization and diversification of the energy market. Therefore, it is worth striving for a consensus at both the decision-making and executive levels in the implementation of common goals. It, in turn, may determine the financial and legal conditions of the EU’s common energy policy, which is of crucial importance for the Visegrad countries. Additionally, it may also decrease tensions between the countries and the EU institutions, which has been visible recently. The Visegrad countries have already spoken out more than once in discussing EU energy policy from the grouping level. However, our study shows that this policy’s implementation is not entirely coherent in these countries, with Poland standing out from the group. However, many energy issues link these economies (reliance on coal, nuclear power, energy dependence, etc.), and they should not be forgotten. Therefore, consideration should be given to working out a common position and creating a kind of platform for shaping at least partly regionally determined interests. Recently, the issue of technological innovation in the field of energy has received particular attention. It is also one of the dimensions of the energy union. It would therefore appear that joint action by the Visegrad countries in this area is very welcome and promising. Consequently, we should create appropriate conditions for collaborative research and development cooperation by Visegrad countries, bringing multidimensional benefits.

7.3. Research Limitations

As every research study, also, this study is not free from limitations. The applied research methods made it possible to achieve the article’s aim, which was to indicate the degree of implementation of climate and energy targets of selected EU countries compared with other member states. We are aware of the limitations of the method used. The linear ranking does not give a complete picture of the degree of implementation of the adopted targets. It allows only it to indicate the relative position of countries in relation to the benchmark and other member states. We tried to solve this problem by using the cluster analysis method, however, limiting ourselves only to 2018, regarding the transparency of the presented results. The limited access to complete data was also a limitation, which resulted in narrowing our analysis to 2018, i.e., two years before the target date (2020 was a target year, but currently, the data for 2019–2020 is still not available). We are aware of the need to consider the changes in the achievement of the targets after 2018 and to indicate the causes and effects of individual countries meeting them at a given level.

7.4. Suggestions for Further Studies

It is worth extending the area of analysis as soon as the data is available, which will undoubtedly contribute to deepening the knowledge on the Europeanization of the energy policy. It would also be valuable to carry out studies verifying cause–effect relations, i.e., considering the energy policy implementation level and the factors that determine it. Undoubtedly, there is a need for research linking the analysis of progress in the performance of energy and climate objectives with the economic growth of the V4 countries because such research will show the truth about declining the economy from the problematic aspects of energy. This would show the actual effectiveness of energy policy and orientate towards building competitive advantage of countries based on clean technologies. The Covid-19 pandemic impacted many aspects of social and economic life [76,77,78,79,80], included the energy policy. Until the Covid-19 pandemic outbreak, industrial emissions had the highest decrease, but aviation emissions had increased [57]. It is obvious there will be a need to investigate the impact of Covid-19 on the Europeanization of the EU energy policy and obtaining its current targets. It is also interesting to investigate how the common energy policy will impact the competitiveness of the EU [81], especially under the conditions of the modern entrepreneurial economy [82].

Author Contributions

Conceptualization, K.W., A.G. and M.S.; methodology, M.M.; software, M.M.; validation, A.G., M.S. and K.W.; formal analysis, M.M.; investigation, K.W., M.M. and A.G.; resources, A.G. and M.M.; data curation, M.M.; writing—original draft preparation, K.W., A.G., M.M. and M.S.; writing—review and editing, K.W., M.M., A.G. and M.S.; visualization, M.S. and M.M.; supervision, K.W.; project administration, K.W.; funding acquisition, A.G. and M.S. All authors have read and agreed to the published version of the manuscript.

Funding

The publication was co-financed from the subsidy granted to Cracow University of Economics.

Data Availability Statement

We used publicly available statistical data provided by Eurostat (T2020_31; T2020_35; SGD_07_10).

Acknowledgments

We would like to thank three anonymous reviewers and the guest editor for their valuable comments.

Conflicts of Interest

The authors declare no conflict of interest.

References

  1. Hajiyev, N.; Smoląg, K.; Abbasov, A.; Prasolov, V. Energy War Strategies: The 21st Century Experience. Energies 2020, 13, 5797. [Google Scholar] [CrossRef]
  2. Frodyma, K.; Papież, M.; Śmiech, S. Decoupling Economic Growth from Fossil Fuel Use—Evidence from 141 Countries in the 25-Year Perspective. Energies 2020, 13, 6671. [Google Scholar] [CrossRef]
  3. Ateba, B.B.; Prinsloo, J.J.; Gawlik, R. The significance of electricity supply sustainability to industrial growth in South Africa. Energy Rep. 2019, 5, 1324–1338. [Google Scholar] [CrossRef]
  4. Frodyma, K.; Papież, M.; Śmiech, S. Efficiency of investments in solar power in the EU countries. In Socio-Economic Model Forecast; Papież, M., Śmiech, S., Eds.; Foundation of Cracow University of Economics: Kraków, Poland, 2018; pp. 140–149. [Google Scholar] [CrossRef]
  5. Papież, M.; Śmiech, S.; Frodyma, K. Effects of renewable energy sector development on electricity consumption–Growth nexus in the European Union. Renew. Sustain. Energy Rev. 2019, 113, 109276. [Google Scholar] [CrossRef]
  6. Papież, M.; Śmiech, S.; Frodyma, K. Factors Affecting the Efficiency of Wind Power in the European Union Countries. Energy Policy 2019, 132, 965–977. [Google Scholar] [CrossRef]
  7. Hajdukiewicz, A.; Pera, B. International Trade Disputes over Renewable Energy—The Case of the Solar Photovoltaic Sector. Energies 2020, 13, 500. [Google Scholar] [CrossRef] [Green Version]
  8. Francés, G.E. Market or geopolitics? The Europeanization of EU’s energy corridors. Int. J. Energy Sect. Manag. 2011, 5, 39–59. [Google Scholar] [CrossRef]
  9. Samkharadze, I. Europeanization of energy law and policy beyond the Member States: The case of Georgia. Energy Policy 2019, 130, 1–6. [Google Scholar] [CrossRef]
  10. Katsaris, A. Europeanization through Policy Networks in the Southern Neighbourhood: Advancing Renewable Energy Rules in Morocco and Algeria. JCMS J. Common Mark. Stud. 2015, 54, 656–673. [Google Scholar] [CrossRef]
  11. Nyga-Łukaszewska, H.; Chilimoniuk-Przeździecka, E. Modelling Energy Security and International Competitiveness: The Export Perspective. Entrep. Bus. Econ. Rev. 2017, 5, 71–84. [Google Scholar] [CrossRef] [Green Version]
  12. Pach-Gurgul, A.; Śmiech, S.; Ulbrych, M. The effect of energy prices on energy intensity improvement–the case of the chemical industry in the V4 countries. Post-Communist Econ. 2020, 1–15. [Google Scholar] [CrossRef]
  13. Piekut, M. Patterns of Energy Consumption in Polish One-Person Households. Energies 2020, 13, 5699. [Google Scholar] [CrossRef]
  14. Streimikiene, D.; Simionescu, M.; Bilan, Y. The impact of biodiesel consumption by transport on economic growth in the European Union. Eng. Econ. 2019, 30, 50–58. [Google Scholar] [CrossRef] [Green Version]
  15. Makieła, K.; Osiewalski, J. Cost Efficiency Analysis of Electricity Distribution Sector under Model Uncertainty. Energy J. 2018, 39, 31–56. [Google Scholar] [CrossRef]
  16. Karpinska, L.; Śmiech, S. Conceptualising Housing Costs: The Hidden Face of Energy Poverty in Poland. Energy Policy 2020, 147, 1–20. [Google Scholar] [CrossRef]
  17. Karpinska, L.; Śmiech, S. Invisible Energy Poverty? Analysing Housing Costs in Central and Eastern Europe. Energy Res. Soc. Sci. 2020, 70, 1–15. [Google Scholar] [CrossRef]
  18. Karpinska, L.; Śmiech, S. Breaking the Cycle of Energy Poverty: Will Poland Make It? Energy Econ. 2021, 94, 1–15. [Google Scholar] [CrossRef]
  19. Urbaniec, M. Implementation of International Standards for Environmental Management in Visegrad Countries: A Comparative Analysis. Entrep. Bus. Econ. Rev. 2014, 2, 65–76. [Google Scholar] [CrossRef] [Green Version]
  20. Pach-Gurgul, A.; Ulbrych, M. Progress of the V4 Countries towards the EU’s Energy and Climate Targets in the Context of Energy Security Improvement. Entrep. Bus. Econ. Rev. 2019, 7, 175–197. [Google Scholar] [CrossRef]
  21. Solorio, I.; Jörgens, H. Contested energy transition? Europeanization and authority turns in EU renewable energy policy. J. Eur. Integr. 2020, 42, 77–93. [Google Scholar] [CrossRef]
  22. Tews, K. Europeanization of Energy and Climate Policy: The Struggle between Competing Ideas of Coordinating Energy Transitions. J. Environ. Dev. 2015, 24, 267–291. [Google Scholar] [CrossRef] [Green Version]
  23. Pach-Gurgul, A. Europeanisation of Energy Policy: Progress in Spite of Divergent Interests (Chapter 8). In Macro-, Meso-, and Microeconomic Dimensions of Europeanisation; Stanek, P., Wach, K., Eds.; PWN: Warsaw, Poland, 2016; pp. 141–165. [Google Scholar]
  24. Dyduch, J. Europeanization of the Energy Policy within the European Union’s System of Governance (Chapter 10). In Europeanization Processes from the Mesoeconomic Perspective: Industries and Policies; Stanek, P., Wach, K., Eds.; Cracow University of Economics: Kraków, Poland, 2015; pp. 193–219. [Google Scholar]
  25. Allen, M.L.; Allen, M.M.C.; Cumming, D.; Johan, S. Comparative Capitalisms and Energy Transitions: Renewable Energy in the European Union. Br. J. Manag. 2020. [Google Scholar] [CrossRef]
  26. Dyduch, J.; Skorek, A. Go South! Southern dimension of the V4 states’ energy policy strategies–An assessment of viability and prospects. Energy Policy 2020, 140, 111372. [Google Scholar] [CrossRef]
  27. Głodowska, A.; Pera, B. On the Relationship between Economic Integration, Business Environment and Real Convergence: The Experience of the CEE Countries. Economies 2019, 7, 54. [Google Scholar] [CrossRef] [Green Version]
  28. Exadaktylos, T.; Radaelli, C.M. Research Design in European Studies: The Case of Europeanization. J. Common Mark. Stud. 2009, 47, 507–530. [Google Scholar] [CrossRef]
  29. Moravcsik, A. Why the European Community Strengthens the State: Domestic Politics and International Co-Operation, Working Papers No. 52; Centre For European Studies–Harvard University: Cambridge, UK, 1994. [Google Scholar]
  30. Sandoholtz, W. Membership Matters: Limits of the Functional Approach to European Institutions. J. Common Mark. Stud. 1996, 34, 403–430. [Google Scholar]
  31. Kohler-Koch, B. Catching up with change: The transformation of governance in the European Union. J. Eur. Public Policy 1996, 3, 359–380. [Google Scholar] [CrossRef]
  32. Dyson, K. Introduction: EMU as Integration, Europeanization, and Convergence. In European States and the Euro; Oxford University Press: Oxford, UK, 2002; pp. 1–28. [Google Scholar]
  33. Wallance, H. Europeanization and Globalization: Complementary or Contradictory Trends. New Political Econ. 2000, 5, 369–382. [Google Scholar] [CrossRef]
  34. Bulmer, S.; Burch, M. The Europeanisation of Central Government: The UK and Germany in Historical Institutionalist Perspective. In The Rules of Integration: Institutionalist Approaches to the Study of Europe; Schneider, G., Aspinwall, M., Eds.; Manchester University Press: Manchester, UK, 2001. [Google Scholar]
  35. Wach, K. Conceptualising Europeanization: Theoretical Approaches and Research Designs (Chapter 1). In Europeanization Processes from the Mesoeconomic Perspective: Industries and Policies; Stanek, P., Wach, K., Eds.; Cracow University of Economics: Kraków, Poland, 2015; pp. 11–23. [Google Scholar]
  36. Flockhart, T. Europeanization or EU-ization? The Transfer of European Norms across Time and Space. J. Common Mark. Stud. 2010, 48, 787–810. [Google Scholar] [CrossRef]
  37. Ladrech, R. Europeanization of Domestic Politics and Institutions: The Case of France. JCMS: J. Common Mark. Stud. 1994, 32, 69–88. [Google Scholar] [CrossRef]
  38. Börzel, T. Towards Convergence in Europe? Institutional Adaptation to Europeanization in Germany and Spain. J. Common Mark. Stud. 1999, 39, 389–403. [Google Scholar] [CrossRef]
  39. Holzhacker, R.; Haverland, M. Introduction: Cooperation and Integration among Europeanized States. In European Research Reloaded: Cooperation and Integration among Europeanized States; Holzhacker, R., Haverland, M., Eds.; Spinger: Berlin/Heidelberg, Germany, 2006. [Google Scholar]
  40. Moravcsik, A. Preferences and Power in the European Community: A Liberal Intergovernmentalist Approach. J. Common Mark. Stud. 1993, 31, 507–508. [Google Scholar] [CrossRef]
  41. Börzel, T.A.; Risse, T. When Europe Hits Home: Europeanization and Domestic Change. SSRN Electron. J. 2002, 56. [Google Scholar] [CrossRef] [Green Version]
  42. Wach, K. Europeanisation: Its Definition, Research Approaches and Dimensions (Chapter 1). In Macro-, Meso- and Microeconomic Dimensions of Europeanisation; Stanek, P., Wach, K., Eds.; PWN: Warsaw, Poland, 2016; pp. 15–31. [Google Scholar]
  43. Radaelli, C.M. Whither Europeanization? Concept Stretching and Substantive Change. SSRN Electron. J. 2002, 4. [Google Scholar] [CrossRef] [Green Version]
  44. Nicolaides, P. A Model of Europeanisation with and without Convergence. Inter Econ. 2010, 45, 114–121. [Google Scholar] [CrossRef] [Green Version]
  45. Agranoff, R.; Ballart, X. The Effects on Domestic versus Europeanization Influences on Intergovernmental Relations: The Case of Spain; Instituto Universitario Ortega y Gasset: Madrid, Spain, 2009; pp. 1–46. [Google Scholar]
  46. Strunz, S.; Gawel, E.; Lehmann, P.; Ribera, T.; Rüfcdinger, A.; Boscheck, R.; Egenhofer, C.; De Jong, J. Energy policy: European, national, regional? Intereconomics 2014, 49, 244–267. [Google Scholar] [CrossRef] [Green Version]
  47. Strunz, S.; Gawel, E.; Lehmann, P. Towards a general “Europeanization” of EU Member States energy policies? Econ. Energy Environ. Policy 2015, 4. [Google Scholar] [CrossRef] [Green Version]
  48. Chester, L. Conceptualising energy security and making explicit its polysemic nature. Energy Policy 2010, 38, 887–895. [Google Scholar] [CrossRef]
  49. Stavytskyy, A.; Kharlamova, G.; Giedraitis, V.; Šumskis, V. Estimating the interrelation between energy security and macroeconomic factors in European countries. J. Int. Stud. 2018, 11, 217–238. [Google Scholar] [CrossRef]
  50. Vasconcelos, J. Towards the internal energy market, how to bridge a regulatory gap and build a regulatory framework. Eur. Rev. Energy Mark 2005, 1, 81–103. [Google Scholar]
  51. Cross, E.D. Electric Utility Regulation in the European Union: A Country by Country Guide; Wiley: London, UK, 1996. [Google Scholar]
  52. Pollitt, M.G. The European Single Market in Electricity: An Economic Assessment. Rev. Ind. Organ. 2019, 55, 63–87. [Google Scholar] [CrossRef] [Green Version]
  53. Laing, T.; Sato, M.; Grubb, M.; Comberti, C. Assessing the Effectiveness of the EU Emissions Trading System. Center for Climate Change Economics and Policy. Working Paper 126. 2013. Available online: https://www.lse.ac.uk/granthaminstitute/wp-content/uploads/2014/02/WP106-effectiveness-eu-emissions-trading-system.pdf (accessed on 15 February 2021).
  54. Bouzarovski, S.; Petrova, S.; Sarlamanov, R. Energy poverty policies in the EU: A critical perspective. Energy Policy 2012, 49, 76–82. [Google Scholar] [CrossRef]
  55. Van de Graaf, T.; Colgan, J.D. Russian gas games or well-oiled conflict? Energy security and the 2014 Ukraine crisis. Energy Res. Soc. Sci. 2017, 24, 59–64. [Google Scholar] [CrossRef] [Green Version]
  56. Zajączkowska, M. The Eastern Partnership energy flagship initiative and its consequences for EU energy security. Studii Europene 2017, 9, 47–57. [Google Scholar]
  57. COM. Fifth Report on the State of the Energy Union. 2020. Available online: https://eur-lex.europa.eu/resource.html?uri=cellar:c006a13f-0e04-11eb-bc07-01aa75ed71a1.0001.02/DOC_1&format=PDF (accessed on 11 January 2021).
  58. Rabe, M.; Streimikiene, D.; Bilan, Y. The Concept of Risk and Possibilities of Application of Mathematical Methods in Supporting Decision Making for Sustainable Energy Development. Sustainability 2019, 11, 1018. [Google Scholar] [CrossRef] [Green Version]
  59. Directive 2009/28/EC. Promotion of the Use of Energy from Renewable Sources and Amending and Subsequently Repealing Directives 2001/77/EC and 2003/30/EC. European Parliament, Council of the European Union. Available online: http://data.europa.eu/eli/dir/2009/28/oj (accessed on 15 February 2021).
  60. Directive 2012/27/EU. Energy Efficiency, Amending Directives 2009/125/EC and 2010/30/EU and Repealing Directives 2004/8/EC and 2006/32/EC. European Parliament, Council of the European Union. Available online: http://data.europa.eu/eli/dir/2012/27/oj (accessed on 15 February 2021).
  61. COM. Evolution of Indicative National Energy Efficiency Targets for 2020 Expressed in Primary Energy Consumption. European Commission, 2017. Available online: https://ec.europa.eu/energy/sites/default/files/documents/article_3_eed_indicative_national_energy_efficiency_targets_2020_january_2017.pdf (accessed on 15 February 2021).
  62. Simionescu, M.; Bilan, Y.; Gędek, S.; Streimikiene, D. The Effects of Greenhouse Gas Emissions on Cereal Production in the European Union. Sustainability 2019, 11, 3433. [Google Scholar] [CrossRef] [Green Version]
  63. Hellwig, Z. Zastosowanie metody taksonomicznej do typologicznego podziału krajów ze względu na poziom ich rozwoju oraz zasoby i strukturę wykwalifikowanych kadr. Przegląd Stat. 1968, 4, 307–327. [Google Scholar]
  64. Hwang, C.L.; Yoon, K. Multiple Attribute Decision Making: Methods and Applications; Springer: New York, NY, USA, 1981. [Google Scholar]
  65. Yoon, K.; Hwang, C.L. Multiple Attribute Decision Making: An Introduction; SAGE Publications: Thousand Oaks, CA, USA, 1995. [Google Scholar]
  66. Boyle, G.E.; McCarthy, T.E. A Simple Measure of β-Convergence. Oxf. Bull. Econ. Stat. 1997, 59, 257–264. [Google Scholar] [CrossRef]
  67. Bąk, A. Zastosowanie metod wielowymiarowej analizy porównawczej do oceny stanu środowiska w województwie dolnośląskim. Wiadomości Stat. 2018, 1, 7–20. [Google Scholar]
  68. Głodowska, A. Level of Education and Economic Growth in the Member States of the European Union: A Comparative Analysis. Horyz. Wych. 2017, 16, 105–118. [Google Scholar] [CrossRef]
  69. Eurostat. Energy Statistics. Available online: https://ec.europa.eu/eurostat/web/energy (accessed on 11 February 2021).
  70. Hnatyshyn, M. Decomposition analysis of the impact of economic growth on ammonia and nitrogen oxides emissions in the European Union. J. Int. Stud. 2018, 11, 201–209. [Google Scholar] [CrossRef] [PubMed] [Green Version]
  71. Zajączkowska, M. The Energy Union and European Union energy security. Èkon. i Prawo 2018, 17, 319–328. [Google Scholar] [CrossRef]
  72. Mišík, M. Energy Union and the Visegrad four countries: Blurred unity? Int. Issues Slovak Foreign Policy Aff. 2016, 25, 68–80. [Google Scholar]
  73. Zapletalová, V.; Komínková, M. Who is fighting against the EU’s energy and climate policy in the European Parliament? The contribution of the Visegrad Group. Energy Policy 2020, 139, 111326. [Google Scholar] [CrossRef]
  74. Osička, J.; Lehotský, L.; Zapletalová, V.; Černoch, F.; Dančák, B. Natural gas market integration in the Visegrad 4 region: An example to follow or to avoid? Energy Policy 2018, 112, 184–197. [Google Scholar] [CrossRef]
  75. Bauerová, H.; Vošta, M. Multi-level Governance and Energy Specifics of the V4 Countries within the Context of European Integration. Politi-Cent. Eur. 2020, 16, 525–546. [Google Scholar] [CrossRef]
  76. Żak, M.; Garncarz, J. Economic policy towards the challenges of the COVID-19 pandemic in selected European Union countries. Int. Entrep. Rev. 2020, 6, 21–34. [Google Scholar] [CrossRef]
  77. Marona, B.; Tomal, M. The COVID-19 pandemic impact upon housing brokers’ workflow and their clients’ attitude: Real estate market in Krakow. Entrep. Bus. Econ. Rev. 2020, 8, 221–232. [Google Scholar] [CrossRef]
  78. Kaszowska-Mojsa, J. Innovation strategies of manufacturing companies during expansions and slowdowns. Entrep. Bus. Econ. Rev. 2020, 8, 47–66. [Google Scholar] [CrossRef]
  79. Lipkind, T.; Kitrar, L. The impact of aggregate business and household behaviour on economic growth: An emphasis on the corona crisis. Entrep. Bus. Econ. Rev. 2021, 9, 7–29. [Google Scholar] [CrossRef]
  80. Kinnunen, J.; Georgescu, I.; Hosseini, Z.; Androniceanu, A.-M. Dynamic indexing and clustering of government strategies to mitigate Covid-19. Entrep. Bus. Econ. Rev. 2021, 9. ahead-of-print. [Google Scholar]
  81. Wach, K. From European Integration to Europeanisation: Towards Increasing Competitiveness of the European Union (Chapter 1) In Growth, Competitiveness and International Trade from the European Perspective; Lazibat, T., Wach, K., Knežević, B., Eds.; University of Zagreb: Zagreb, Croatia, 2017; pp. 7–28. [Google Scholar]
  82. Sieja, M.; Wach, K. The Use of Evolutionary Algorithms for Optimization in the Modern Entrepreneurial Economy: Interdisciplinary Perspective. Entrep. Bus. Econ. Rev. 2019, 7, 117–130. [Google Scholar] [CrossRef]
Figure 1. The current EU energy policy framework and targets by 2030 and 2050. Source: own compilation based on the EU documents and strategies.
Energies 14 01802 g001
Figure 2. Value of the synthetic measure of the V4 countries in the years 2005–2018. Source: own calculations on the statistical data of Eurostat [69].
Energies 14 01802 g002
Table 1. Milestones in the development of the EU energy policy.
YearDocumentPostulates or Effects
1952Treaty of ParisEstablishing the European Coal and Steel Community (ECSC)
1958Euratom Treaty of RomeEstablishing the European Atomic Energy Community (Euratom)
1988Internal Energy MarketThe very first document presenting the objectives for the liberalisation of the energy market.
1992The Maastricht Treaty Introducing the postulate of Trans-European Networks (TEN) in energy infrastructure.
1991European Energy CharterLegal framework for the long term cooperation (EU, Europe, non-European countries).
1994Energy Charter Treaty
1994Green Paper on an EU energy policyWorking out a consensus in reaching a coherent EU energy policy.
1995White Paper on an EU energy policyDetails for the forthcoming energy sector reform in the EU.
1996Electricity Directive Principles of the internal market in energy production. The gradual opening of national markets.
1998Gas Directive
2000Lisbon Strategy The EU growth and competitiveness strategy for 2000–2010. Underscoring the role of energy and the single energy market.
2005Emission Trading Scheme Introducing the Emission Trading Scheme (ETS) in order to reduce the emissions on the whole.
2006Green Paper on sustainable energyStrengthening the EU energy policy. Postulating low-carbon energy production and decreasing energy consumption.
2007The Lisbon Treaty Complementing the EU primary law with a separate part on the common energy policy. Obligating the EU to introduce Trans-European Networks (TEN) in energy infrastructures.
2009Climate and Energy Package (Third Energy Package)Establishing the Agency for the Cooperation of Energy Regulators (ACER). Introducing the third-party access (TPA) and undoubling principles. Introducing two transmission regulations. The EU’s 20-20-20 goals. Introducing energy poverty monitoring.
2010The Commissioner for EnergyIntroducing the Directorate-General for Energy and the Commissioner for Energy
2010Europe 2020 Strategy The EU smart, sustainable, inclusive growth strategy for 2010–2020. A curb in greenhouse gas emissions, and an increase in renewable energy production and consumption.
2015Energy Union StrategyA key EU policy priority aims at building an energy union based on security, sustainability and energy competitiveness.
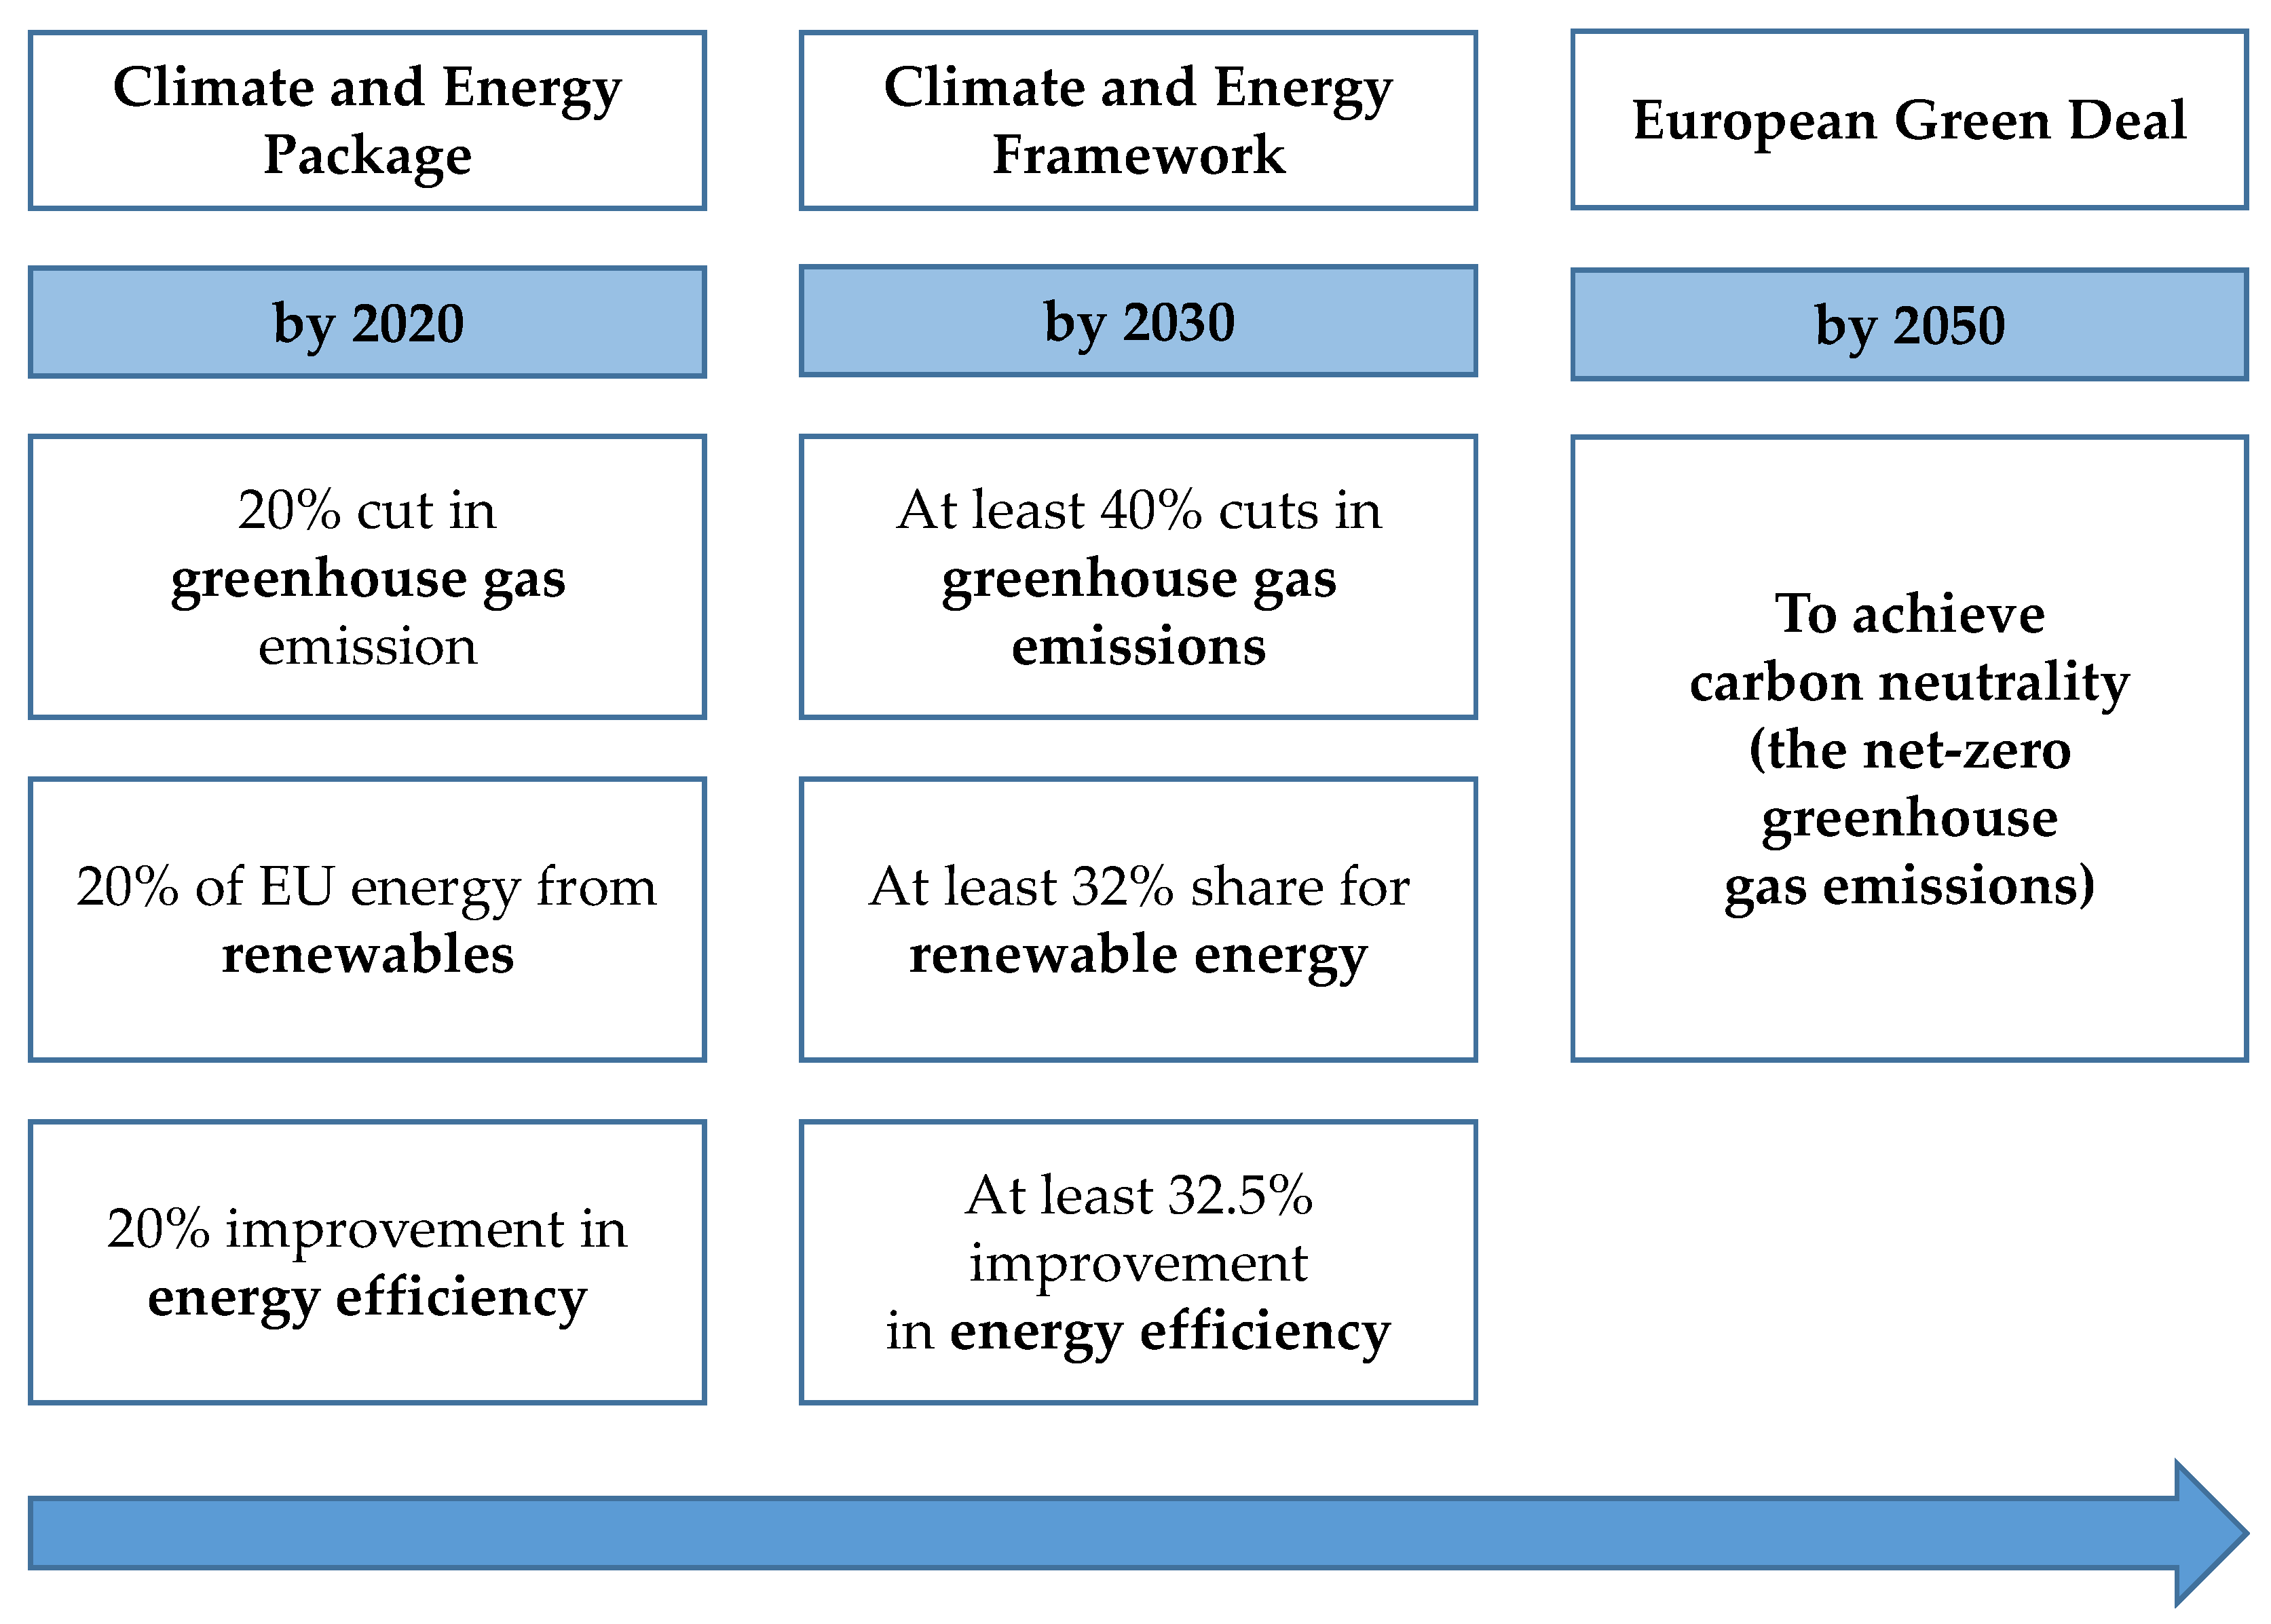
2019Clean Energy for All Europeans Package and European Green DealA comprehensive EU energy policy framework to achieve carbon neutrality by 2050 facilitates the transition away from fossil fuels and replacing them with cleaner energy.
Source: own study based on the EU documents, acts, policies, and strategies.
Table 2. Applied variables.
Variable NameMeasuresCategory of VariableSource of DataUse by Other Researchers
Change in greenhouse gas emissions in ESD sectors%continuous variableEurostatSimionescu et al. [62]
Share of renewable sources of energy in gross final energy consumption%continuous variableEurostatPach-Gurgul and Ulbrych [20]
Primary energy consumptionMtoecontinuous variableEurostatPach-Gurgul and Ulbrych [20]
Source: own study.
Table 4. Greenhouse gas emissions in effort sharing decision (ESD) sectors in V4 countries in the years 2006–2018 (the base year 2005).
Countries200620092012201520182005–2018Target 20202018/Target 2020
MinMaxMeanSD
(in %)p.p.(in %)(in %)
EU2898.793.290.287.388.785.899.492.14.39197.8
Czechia101.499.5101.399.4104.093.5104.0100.32.410995.4
Hungary94.787.879.986.390.279.995.487.54.811082.0
Poland105.8107.3110.1103.8121.1100.9121.1108.55.6114106.2
Slovakia93.096.092.087.595.586.0100.192.94.211384.5
Source: own calculations based on Eurostat (T2020_35) [69].
Table 5. Share of renewable energy in gross final energy consumption in V4 countries in the years 2006–2018.
Countries200620092012201520182005–2018Target 20202018/Target 2020
MinMaxMeanSD
(in %)p.p.(in %)(in %)
EU289.712.614.716.718.09.118.014.02.92090.1
Czechia7.410.012.815.115.17.115.111.73.013116.4
Hungary7.411.715.514.512.56.916.212.23.01396.4
Poland6.98.711.011.911.56.911.99.81.91576.5
Slovakia6.69.410.512.911.96.412.99.82.01485.0
Source: own calculations based on Eurostat (T2020_31) [69].
Table 6. Primary energy consumption in V4 countries in the years 2006–2018.
Countries200620092012201520182005–2018Target 20202018/Target 2020
MinMaxMeanSD
(in Mtoe)(in %)
EU281731.11599.71592.21536.01552.81511.81731.11614.172.31483.0104.7
Czechia43.540.240.439.440.439.043.741.11.539.6102.0
Hungary26.024.023.123.324.522.026.324.21.224.1101.7
Poland92.389.592.890.1101.088.0101.093.53.796.4104.8
Slovakia17.215.515.615.215.814.817.416.10.816.496.3
Source: own calculations based on Eurostat (SGD_07_10) [69].
Table 7. Ranking of EU28 countries according to the Hellwig method in years 2005–2018.
Countries20052006200720082009201020112012201320142015201620172018
Croatia11112211111111
Romania33221122222222
Greece181818181917171281110843
Latvia22333534544334
Italy171616151514141111911665
Lithuania1312131614345453456
Estonia5410679913101281177
Slovenia4541066887761088
Finland111315131618161816161316129
Portugal106641076696971010
Czechia81097911109131012121111
Hungary785544533355912
Denmark1922222121202019191816171413
Slovakia997851077128791314
Sweden1514121213161817171914131515
Bulgaria1215141488111061318151616
Austria1411111112131215181719191917
Spain1617201717151516151517141718
United Kingdom2828262523232225232221201819
Germany2120171918191920222122232320
Luxembourg2624212222242627272723212121
Poland678911121314141415182022
France2219192020212324242626242223
Belgium2525242425262422252324272524
Cyprus2021252627252723202020222425
Netherlands2323232324272526262425262626
Ireland2426272726222121212527282727
Malta2727282828282828282828252828
Notes: Ranking was based on quartiles: Energies 14 01802 i001 1–7; Energies 14 01802 i002 8–14; Energies 14 01802 i003 15–21; Energies 14 01802 i004 22–28; Source: own calculations based on the statistical data of Eurostat [69].
Table 8. Results of k-means clustering in 2018.
ClusterCountriesMean
Greenhouse Gas EmissionShare of Renewable EnergyPrimary Energy Consumption
1Belgium, France, Germany, Ireland, Luxembourg, Malta, Netherlands, Poland, Spain, United Kingdom106.075.7105.6
2Austria, Bulgaria, Croatia, Cyprus, Czechia, Denmark, Estonia, Finland, Italy, Lithuania, Sweden98.7114.799.0
3Greece, Hungary, Latvia, Portugal, Romania, Slovakia, Slovenia84.094.992.1
F15.23836.0884.738
p0.0000.0000.018
Source: own calculations on the statistical data of Eurostat [69].
Publisher’s Note: MDPI stays neutral with regard to jurisdictional claims in published maps and institutional affiliations.

