Article

Price-Response Matrices Design Methodology for Electrical Energy Management Systems Based on DC Bus Signalling

1
Post-Graduate Program in Electrical Engineering (PPGEE), Department of Electrical Engineering, Federal University of Santa Maria (UFSM), Santa Maria 97105-900, RS, Brazil
2
Post-Graduate Program in Electrical Engineering (PPGEE), Department of Electrical Engineering, Universidade Tecnológica Federal do Paraná (UTFPR), Pato Branco 85503-390, PR, Brazil
*
Author to whom correspondence should be addressed.
Energies 2021, 14(6), 1787; https://doi.org/10.3390/en14061787
Submission received: 3 March 2021 / Revised: 16 March 2021 / Accepted: 17 March 2021 / Published: 23 March 2021
(This article belongs to the Special Issue Smart Power Management of Renewable Power System)

Abstract

:
Prosumers’ electrical installations (PEIs), as nanogrids and low-voltage microgrids, have gained importance in recent years following the development of standards such as the IEC 60364-8 series. In these systems, all distributed energy resources (DERs) are usually integrated using dc bus coupling. The IEC 60364-8-3 predicts an electrical energy management system (EEMS) for power-sharing. The overall research framework of this paper is the nanogrid power management, where complex algorithms are required, as well as the conventional state machines and hierarchical controls. However, the addition of new DERs in such systems is not straightforward due to the complicated parameter settings for energy usage optimization. A different control strategy, named price-based power management, has been conceived to make the EEMS scalable to include new sources and simplify parameterization. Since it is analogous to economic markets, most users understand the concepts and feel comfortable tuning parameters according to their own cost/benefits goals. This paper proposes a price-based power management algorithm for EEMS to automatically design the price-response matrices (PRMs). The PRMs are a way to organize power management, considering new DERs and variable price of energy. The main contribution is the methodology to design the PRMs. Experimental results are carried out to demonstrate the effectiveness of the proposed strategy. The results were obtained with a 1.5 kW prototype composed of a PV generator, battery energy storage, loads, and grid connection.

1. Introduction

Prosumers’ electrical installations (PEIs) are usually defined as systems with more than one power source and managed loads [1,2,3]. In these systems, the energy is interchanged between sources, energy storage, and loads using ac links, dc, or both [4,5,6,7,8]. AC links are commonly used in microgrids, where the system is distributed in some places, and higher power levels are required [9,10]. However, when the system is concentrated in a single area for individual prosumers, the dc coupling reduces the power processing losses [8,11,12,13]. It is understandable since, in hybrid power generation systems with battery energy storage (BESS) and photovoltaic (PV) generation, some power processing stages can be suppressed with dc coupling [8]. Examples of individual PEIs with dc bus energy coupling are the dc nanogrids installed in a single building and in households and commercial buildings [3,14,15,16,17].
Individual prosumer’s low-voltage electrical installations are standardized by the IEC 60364-8 series, where in addition to the installation requirements, the power management is predicted [2]. The automation of PEIs can be split into some layers [18,19,20,21]. One common approach is to consider at least three layers: layer zero is the dynamic control of power converters; layer one is the power management, and layer two is the energy management [22]. In the IEC 60364-8-3, these control layers are called electrical energy management (EEMS) [2].
Energy management is commonly employed for long-term energy optimization. Therefore, power management and energy management are different concerning their objectives. While energy management is related to user goals, power management ensures instantaneous power balance [23,24,25]. The focus of this paper is dc nanogrids power management because this control layer is responsible for system stability. Also, for the DERs, power-sharing, complex algorithms, conventional state machines, and hierarchical controls are necessary.
Power management of PEIs with dc bus energy coupling can be centralized or decentralized [8]. According to the energy available, one central controller commands all power converters in a centralized approach, defining their operation modes or power references according to the energy available [22]. This approach is usually based on state machines because one single power element must control the dc bus voltage [26]. In this case, the system flexibility is reduced since state machines must be redesigned to add new sources, energy storages, or loads [27,28,29,30,31]. In decentralized power management, a power balance strategy is necessary to ensure the system’s stability without a centralized controller. The most commonly power-sharing approach, in this case, is the droop controllers [10,27].
In droop control, the converters act as controlled voltage sources in series with virtual impedances. Independent reference currents are set for each power element, stabilizing the dc bus voltage. However, there is a compromise between power-sharing and dc bus voltage regulation. When the virtual impedances are increased, better power-sharing can be achieved since the voltage regulation is reduced [28,32].
One way to reduce the dc bus voltage deviation with droop control is to use a communication link in the hierarchical control approaches. In these cases, another control layer is added to improve the dc bus voltage regulation [19,21]. On the other hand, for concentrated installations, such as hybrid PV systems and single nanogrids, low-cost local power management is interesting.
A low-cost and simple communication strategy among different energy resources in small and concentrated PEIs is the dc bus signaling (DBS) [31,33,34]. No communication link is required in DBS because the power management is based on a local voltage measurement [30,31,32,33]. In this case, different operation modes can be defined for the power converters [30,31]. For example, PV systems can operate with maximum or limited power point tracking; bidirectional dc-dc converters manage the battery charging or discharging process, and dc-ac converters can act as an inverter or as rectifier [30]. In the DBS, the instantaneous dc bus voltage defines the operation modes of the power converters. Consequently, it is possible to specify the instantaneous voltage controller without a droop strategy [23,30,31].
The main drawbacks of this strategy are the dependency of the power management performance on: (i) a fast and accurate voltage measurement system, and (ii) low voltage drop in the cables that interconnect different energy resources [8,22]. Moreover, the DBS is inversely related to energy scarcity: when the dc bus voltage increases, this means the consumption shall be increased, or the power generation be reduced, and when the dc bus voltage reduces, more energy shall be produced, or the consumption must be reduced. It is analogous to an economic market, where power-sharing is related to the buying and selling transactions [30,35,36,37].
The use of state-machines is proposed in [28,29] to control the dc bus voltage without a droop control. It improves the control system performance. However, when new power elements are added, all the system must be remodeled since all possible situations need revision to ensure stable operation [28,29].
In [30], a fictitious internal price was proposed to describe a price-based DBS (PBDBS) to control an off-grid PV system. In this case, a hybrid centralized/decentralized power management system is used. It is a hybrid system because the fictitious price is centrally calculated and sent to all power elements such as sources and loads. These power elements then independently respond to the price, “selling” and “buying” energy, analogous to an energy market. This approach has successfully achieved power balance without a complex state machine.
When compared to strategies based on state-machines [28,29], PBDBS [30] shows improved results. Moreover, no complex model is required because the power converters’ operation modes are simplified due to the internal price idea. On the other hand, in [30] the operation modes are predefined arbitrarily for each power converter (DERs). Without a systematic approach, power management based on PBDBS cannot be scaled to add new sources or new loads. In [30] only one PV generator, a battery bank, and a single load are evaluated in an islanded PV system. Considering the addition of new DERs, in PBDBS [30] cannot reconfigure the power management. Also, no user presets can be used since the power management design is made for a specialized engineer.
The main contribution of this paper is the price-response matrices (PRMs) method. The PRMs are proposed to automatically design the power management of PEIs with a centralized dc bus coupling. It results in a methodology to adapt the PBDSB for any system architecture, considering the price-based power management (PBPM). It is similar to a state-machine. However, no complex modeling is required since the PRMs unifies the state-machines and PBDBS idea. In this proposal, the price-response matrices are automatically calculated from user data inputs such as the loads’ priority levels and energy selling and buying prices. It allows the user, instead of a specialized engineer, to configure the system. Also, the proposed methodology is systematic and can be automatically designed by a computational algorithm. It allows adapting the power management for architectures with more elements, which is not possible in [30]. It simplifies the power management design and provides control of larger systems. Therefore, this paper has clear advantages compared to [30]. While [30] presented the general concept of the PBDBS, this manuscript presents the basis for making it useful for industrial applications.
Experimental results are carried out to demonstrate the effectiveness of the proposed strategy. The experimental setup includes a PV generator, battery bank, three loads with different priorities (high, medium, and low), and a dc-ac converter for the grid interface. In addition, the results include off-grid and grid-tied operation modes, and the power balancing is achieved for all system operating modes. The proposed price-based power management (PBPM) algorithm is fully provided in the Supplementary Material available at 10.5281/zenodo.4576565.

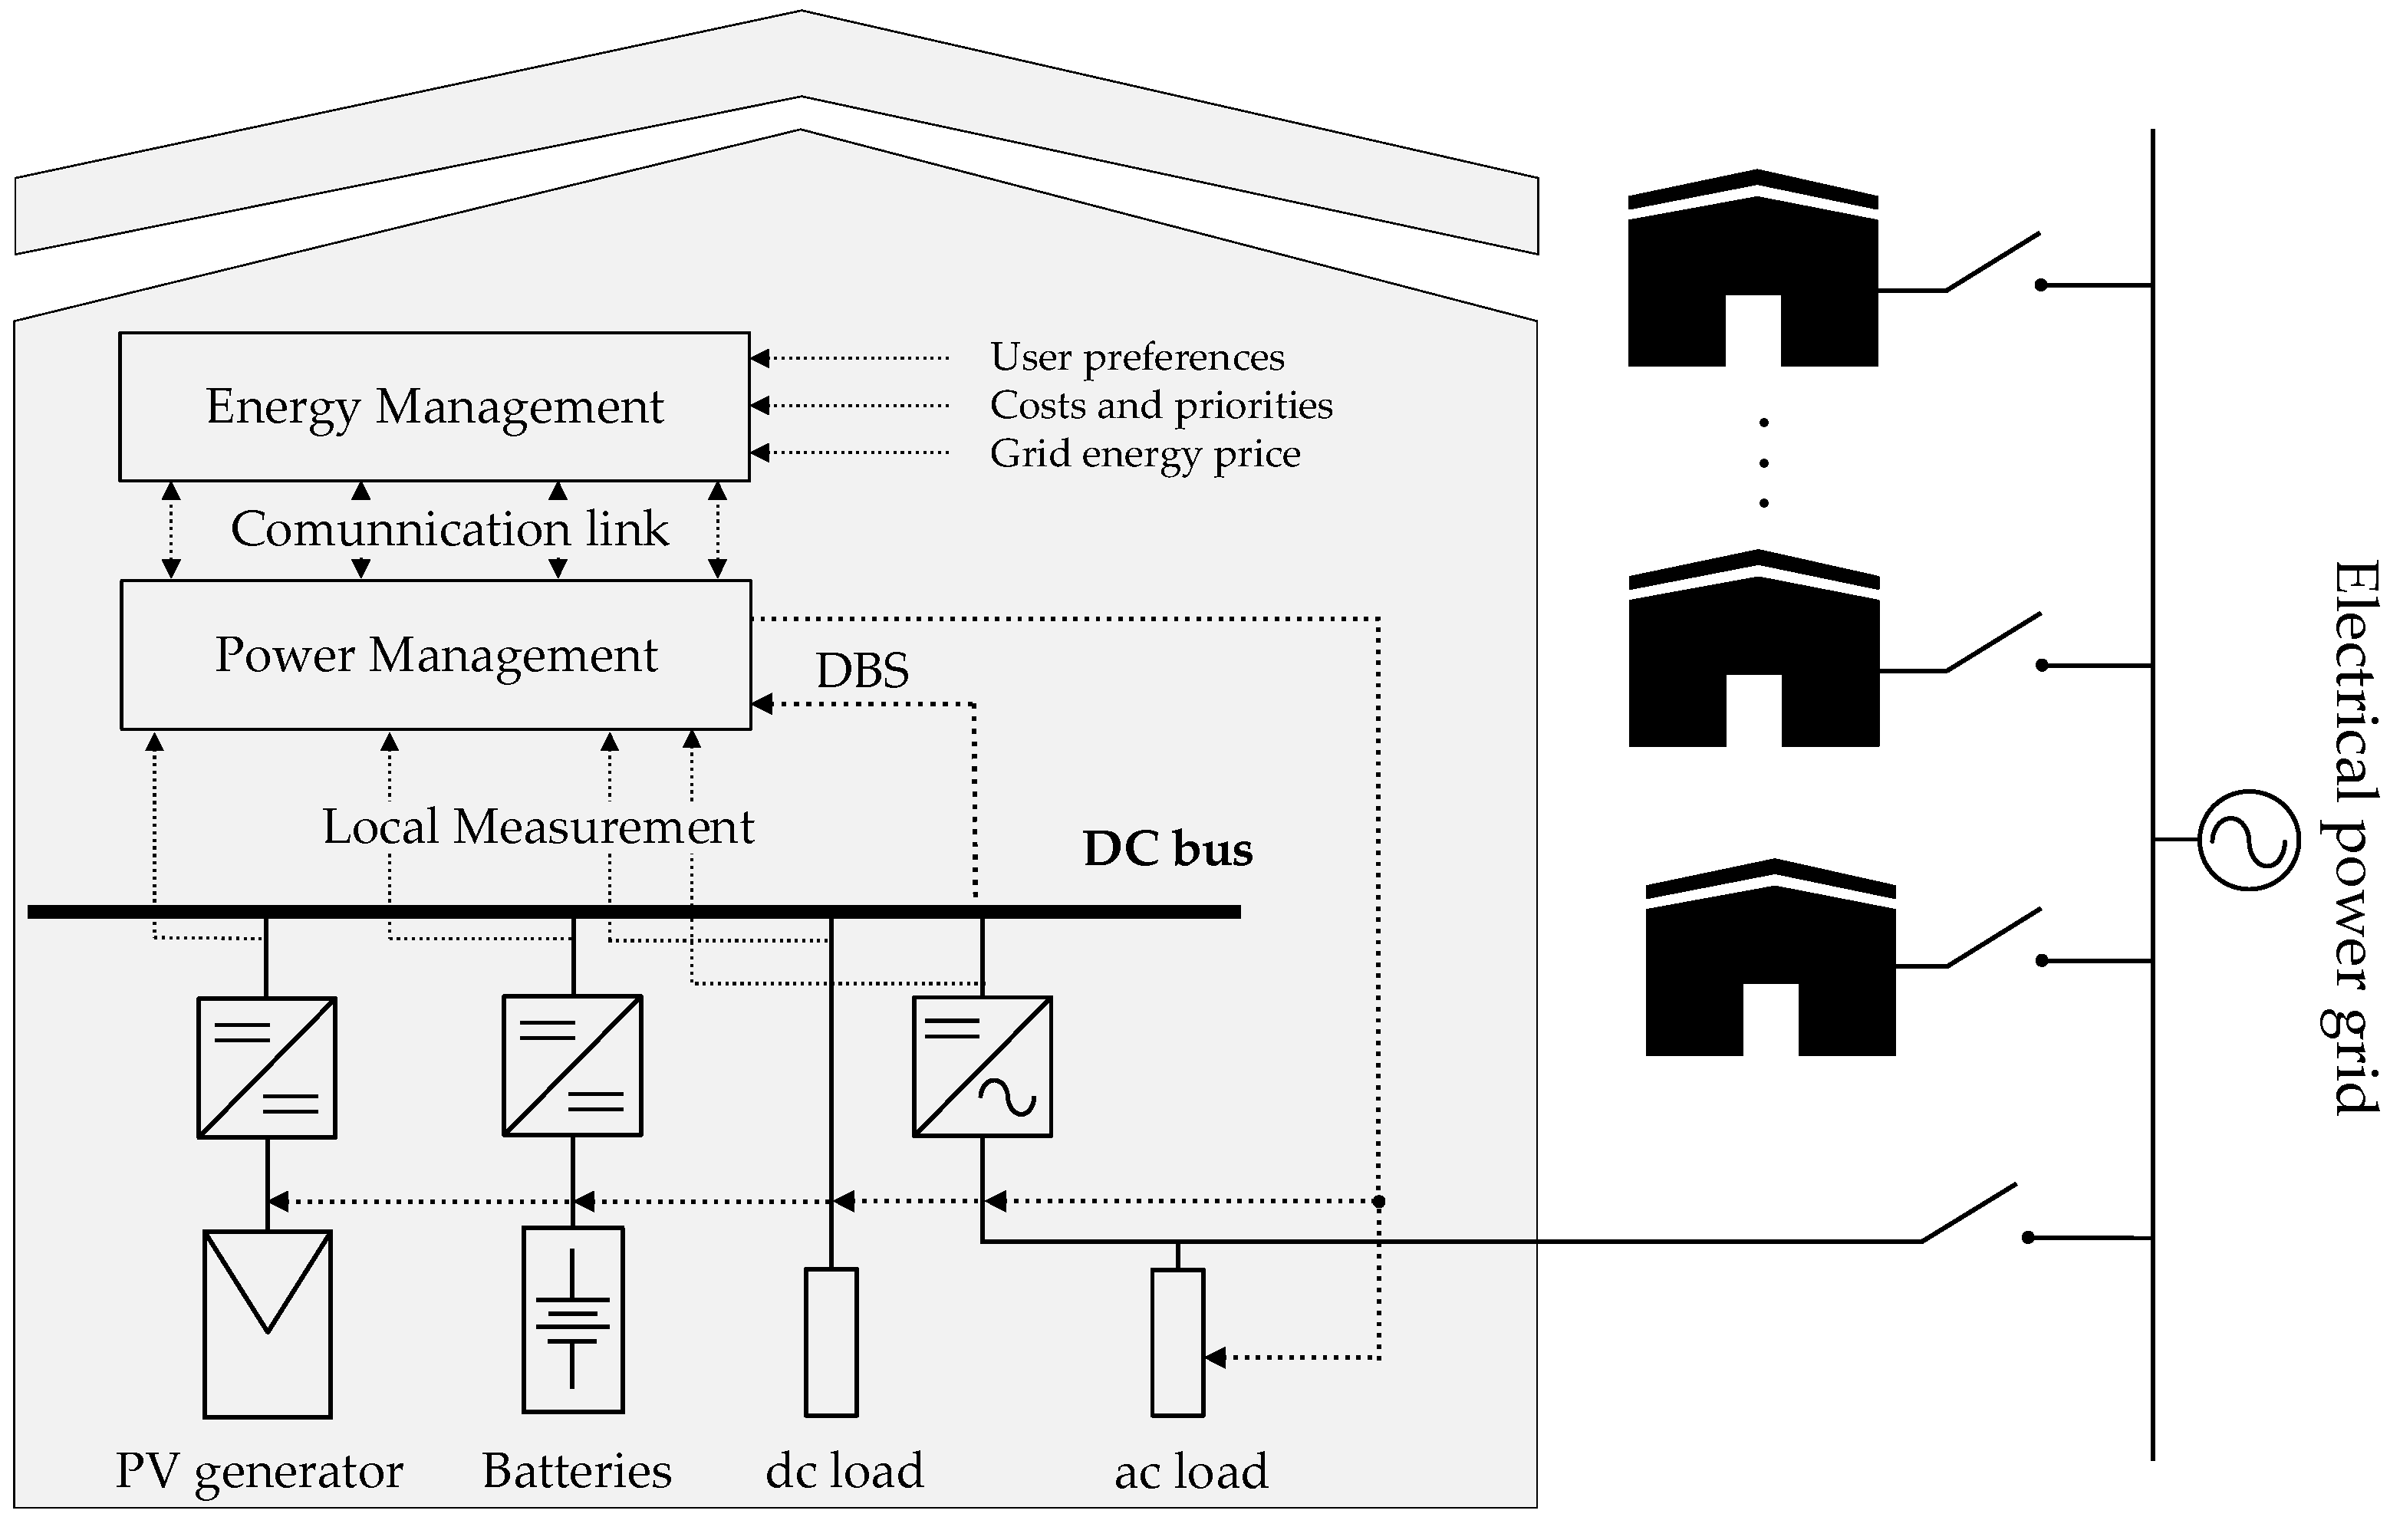
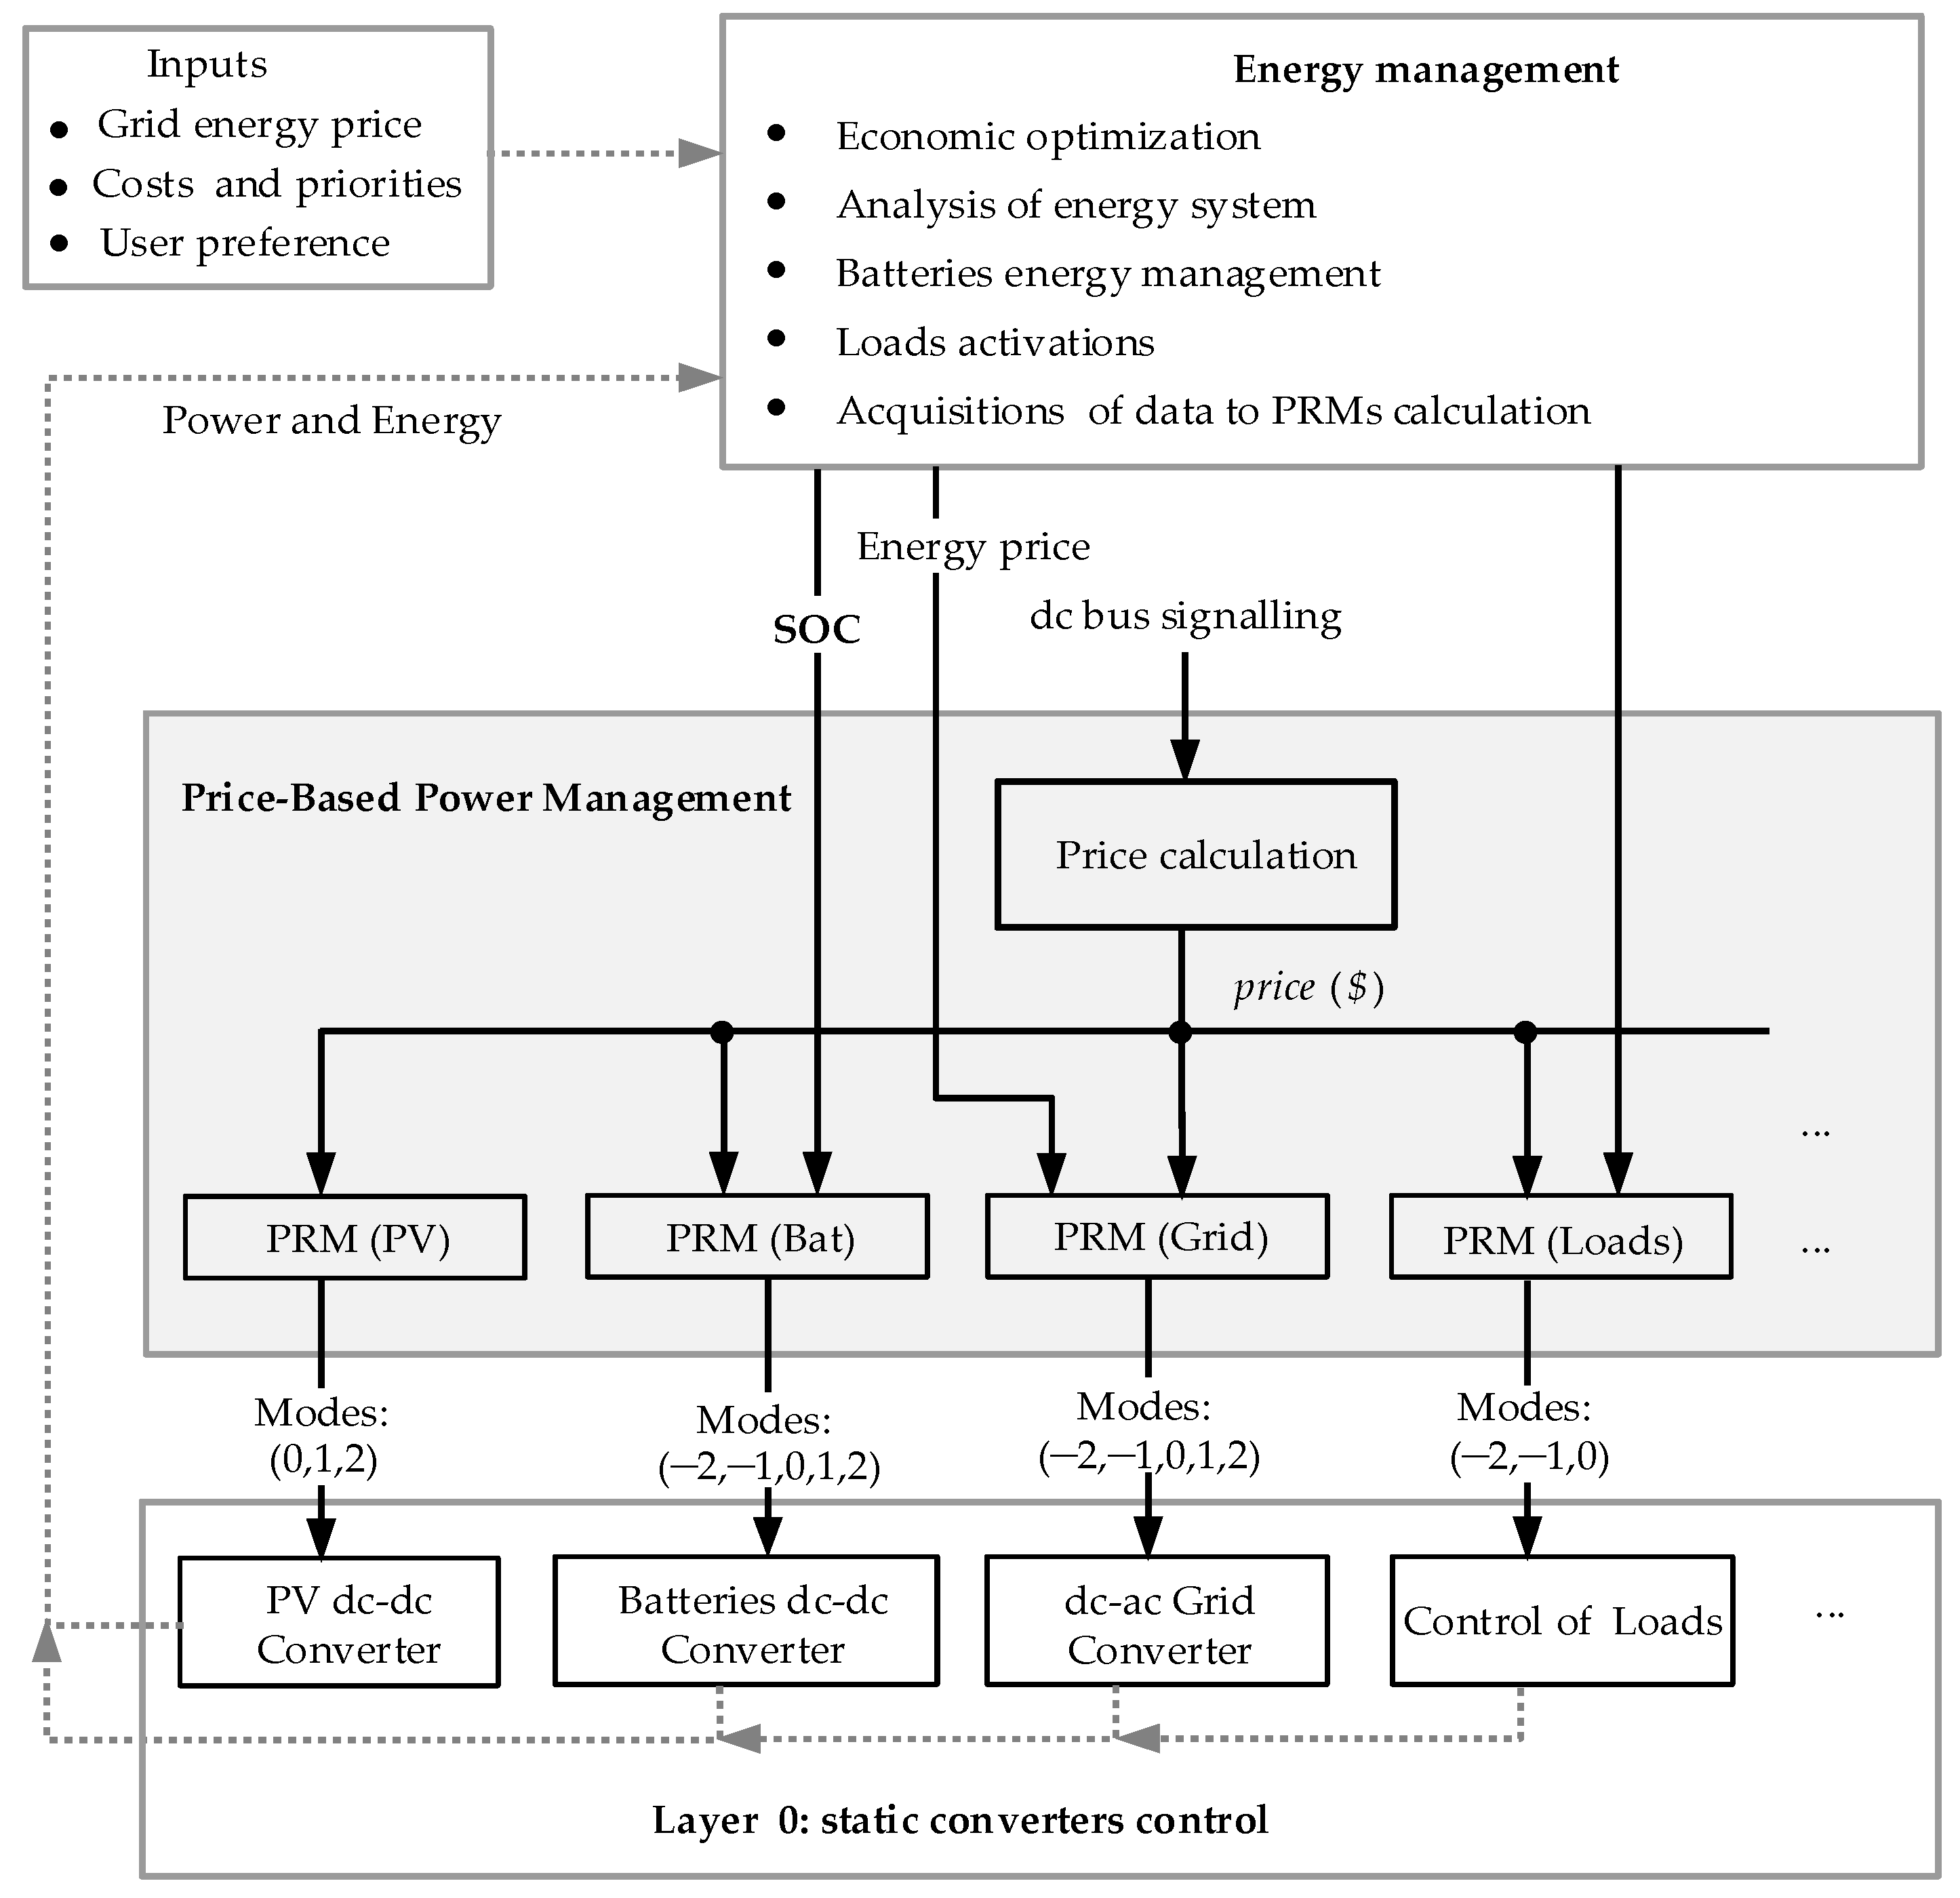
2. Price-Based Power Management

Figure 1 shows an example of PEI when the dc bus is an intermediate energy storage that allows the interaction between all power elements: electrical power grid, loads (ac or dc), power generators, and energy storage systems. The power elements connected to the dc bus can be classified according to their interaction with the dc bus:
(i)
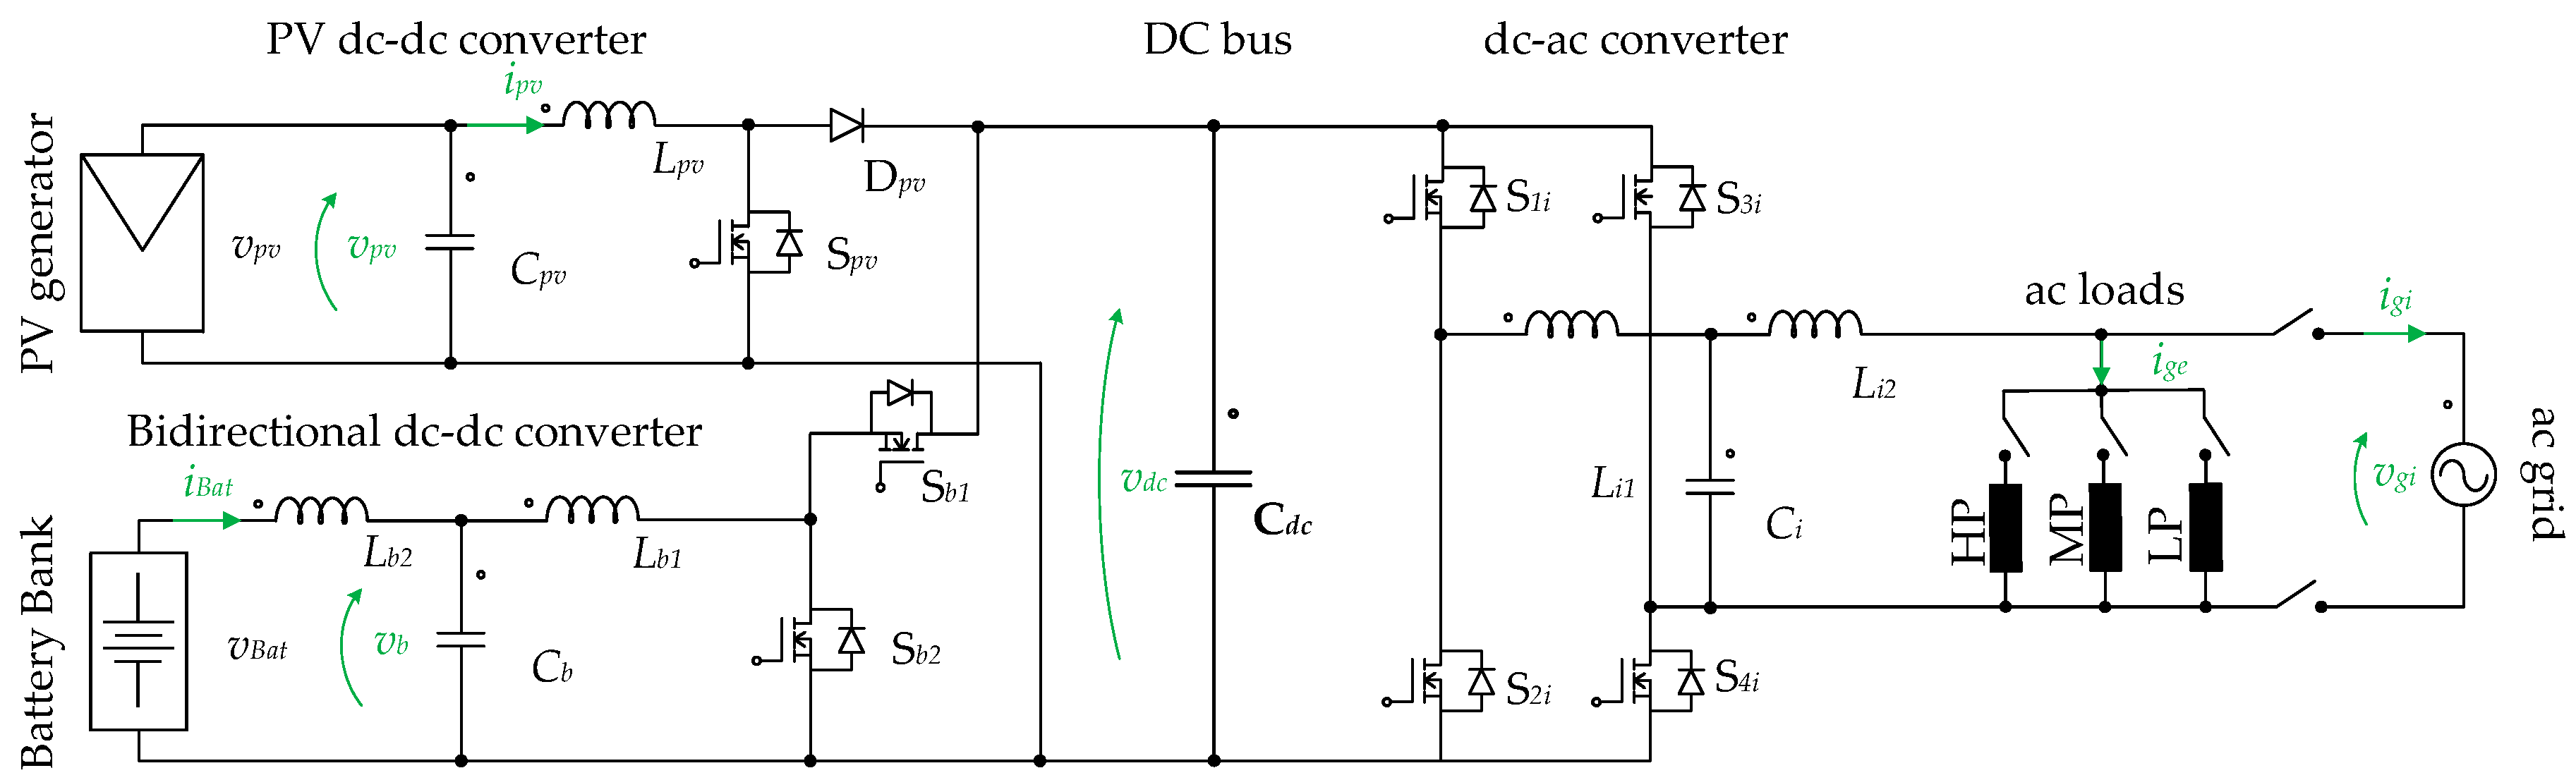
Regulator elements: can act controlling the dc bus voltage in a specific reference when it is necessary.
(ii)
Non-regulator elements: can be only connected or disconnected and cannot control the dc bus voltage.
Also, considering the power flow, the system elements can be classified into:
(i)
Sources: supply positive power to the dc bus. Sources can operate in three possible operation modes: 0 (off), +1 (regulating dc bus), and +2 (not regulating dc bus voltage).
(ii)
Loads: demand power from the dc bus, defined as negative power. Loads can operate in three possible operation modes: 0 (off), −1 (regulating dc bus), and −2 (not regulating dc bus voltage).
(iii)
Bidirectional elements: may operate both as source or load. They can operate in all operation modes (−2, −1, 0, +1, +2). An example of a bidirectional element is the battery energy storage system (BESS). The utility grid also is a bidirectional element when the dc-ac converter can operate as a rectifier (source) or inverter (load to dc bus).
According to their specifications, Table 1 shows the most common power elements founded in household applications and their possible operation modes. A personal computer, e.g., operates turned-off or turned-on. However, an air conditioner can operate with limited power if the available energy is low. Also, alternative sources can be connected in the nanogrid, such as fuel-cels, battery banks, and others. A supercapacitor, for example, can be connected directly to the dc bus. It is a bidirectional element, which cannot control the dc bus voltage. On the other hand, a battery connected with a bidirectional dc-dc converter can act in many operation modes, including their charging/discharging operation and dc bus voltage regulation [16,38,39,40,41,42].
In the proposed power management, the dc bus is considered a market environment where all elements interact. A fictitious price variable is calculated according to the dc bus signaling. This internal price is an integer variable ($0, $1, $2, …) not directly related to real prices, but it is a control signal employed in the power management algorithm.
The internal price is increased only when the dc bus voltage drops below comparison setpoints vl1, vl2, …, lower than the reference voltage vdc*. On the other hand, the internal price is reduced only when the dc bus voltage exceeds setpoints vh1, vh2, …, higher than the reference voltage. Therefore, the price becomes inversely related to the dc bus voltage variation.
Also, it is necessary to mention that the dc bus variations occur when the power management must signal an event. These events are related to power balancing and system operation conditions. For example, when a load is connected to the dc bus, the dc bus voltage is reduced. On the contrary, when a source increases its power generation level, the dc bus voltage increases. As an example, Figure 2 depicts how the price is increased or reduced when the dc bus voltage changes.
Figure 3 shows how the internal price is integrated into the hybrid system control and automation. The price is sent to all elements, which individually respond to this price, switching between possible operation modes (−2, −1, 0, +1, +2).
In this proposal, the power management can be classified as centralized/decentralized because the price is calculated (centralized) according to the dc bus signaling. However, each power converter has its own primary controllers. It increases the system flexibility because no centralized controller is needed. The main drawbacks of this strategy are the dependency on a fast and accurate voltage measurement system because it is based on the DBS strategy.
Each power element has its price response matrix to define its operation mode. In this power management approach, no power reference is specified to the converters because the power balance is achieved at an internal price that leads a converter to regulate the dc bus within its power limits, with no power saturation. When a power saturation occurs on the dc bus voltage controller, the voltage variation signaled a change of the nanogrid operation mode because a new voltage controller must be defined.
The instantaneous operation mode of each element is obtained by accessing the Price Response Matrices (PRM) at the column index related to the current price. The PRM is a matrix that relates prices to operation modes. The PRM of a PV generator, e.g., can be represented by a vector where each column is related to a different price, as shown in Figure 4a. In this case, when the price signalized by the dc bus is $0, the PV generator is in operation mode 0 (off). The PV generator controls the dc bus on mode 1 when the price is equal to $1 and operates in Maximum Power Point Tracking (MPPT) on mode 2 when the price is equal to or higher than $2.
When the power element has different operation conditions (OC) with different energy values, the PRM has more than one row. For instance, the energy of a discharged battery is considered more valuable than a completely charged battery due to the relation between value and energy scarcity. Therefore, a BESS PRM can have different OCs (rows) depending on its state of charge (SoC), as depicted in Figure 4b. For example, the battery OCs can be defined in the High SoC, Intermedium SoC, and Low SoC, resulting in a three-row PRM.
In the following, a methodology is presented to determine the PRMs from user data input systematically. The data inputs are simple parameters related to the real energy price. The maximum energy buying price is defined to the loads, while the minimum energy selling price is defined to the sources.
This is a simple way to allow a user interface because the nanogrid owner can reset the power management parameters when necessary, without specialized knowledge in power electronics/management.

3. Price Response Matrices Determination Method

System users are usually not specialized in power management and programming languages. However, they are generally familiar with market prices, buying, and selling concepts. In this sense, the proposed algorithm to calculate the Price Response Matrices starts from user input. Figure 5 shows a hybrid system example with a PV generator, diesel generator, load, and a battery bank with three operating conditions.
In Figure 5, the first horizontal axis is the real price (US$/kWh), which is the default currency used for the user parameterization. The input data for the PRM determination is the user definition of maximum buying price and minimum selling prices with real currency (US$/kWh). For example, the maximum buying prices are defined to loads and the minimum selling prices to sources.
In this paper, the power-based power management relates the real price (US$/kWh) with a discrete fictitious price ($/kWh) represented in the second horizontal axis of Figure 5, which are used as indexes of the PRMs. The third row is the PRMs indices related to the prices. The following steps are applied to define the PRMs and will be detailed in what follows:
(i)
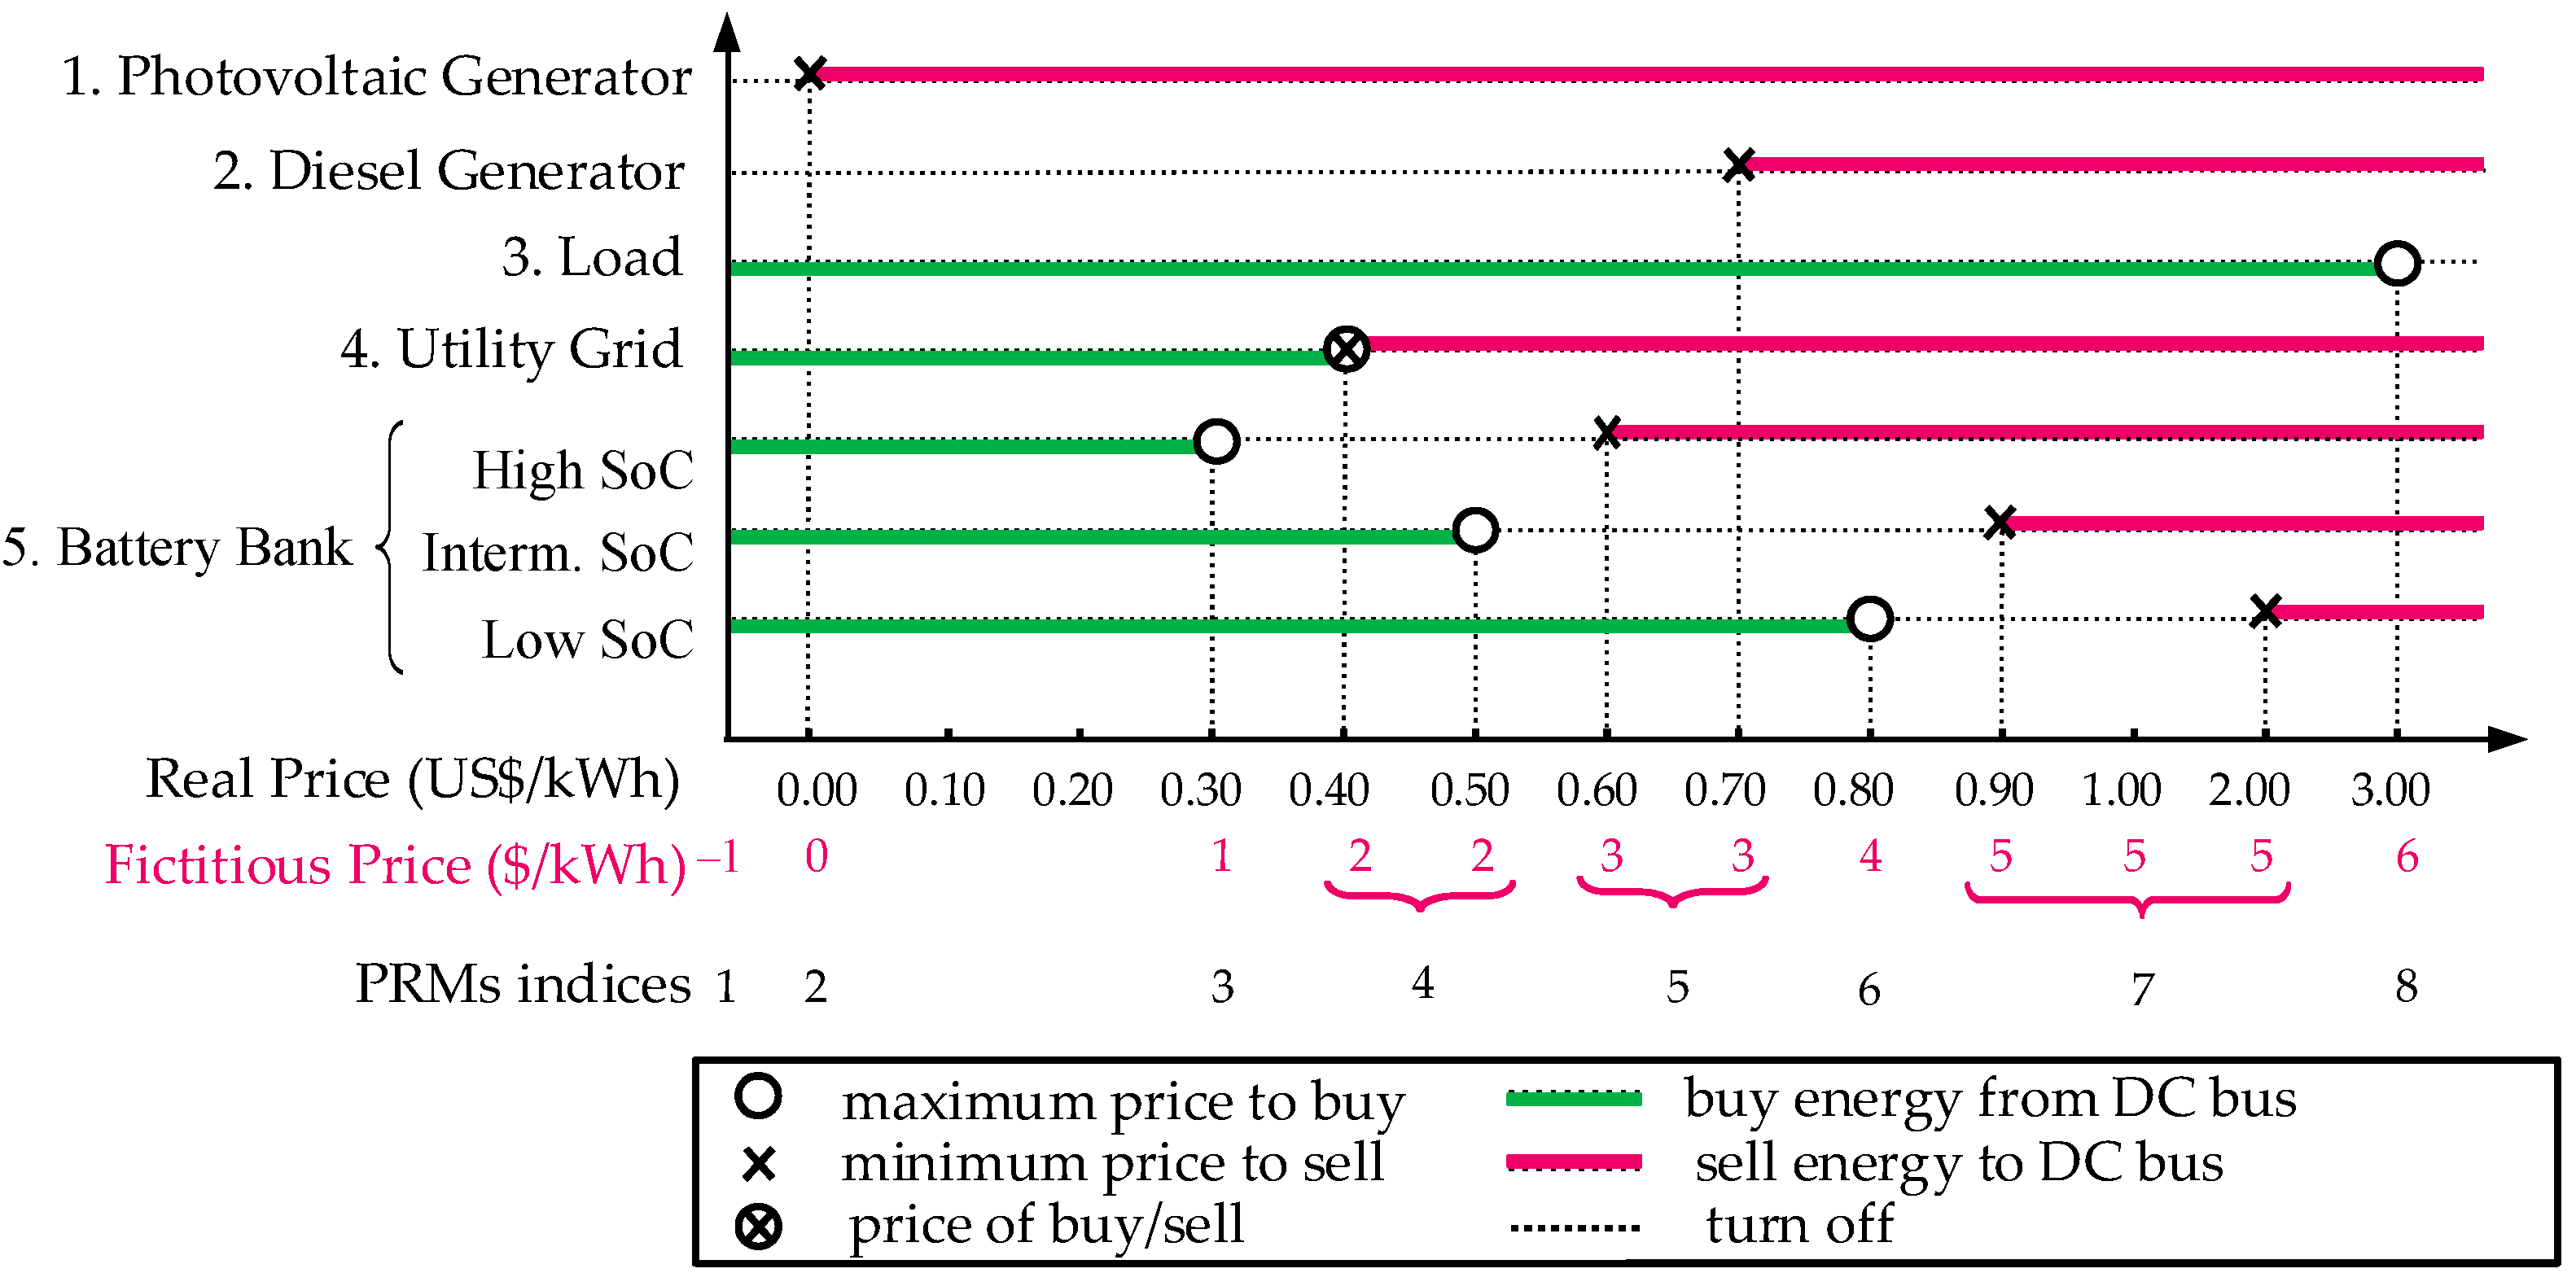
Definition of the fictitious price range, according to the real prices relevant to the power management.
(ii)
Definition of trigger prices for each element and their operation modes.
(iii)
Completion of the PRMs with other operation modes.

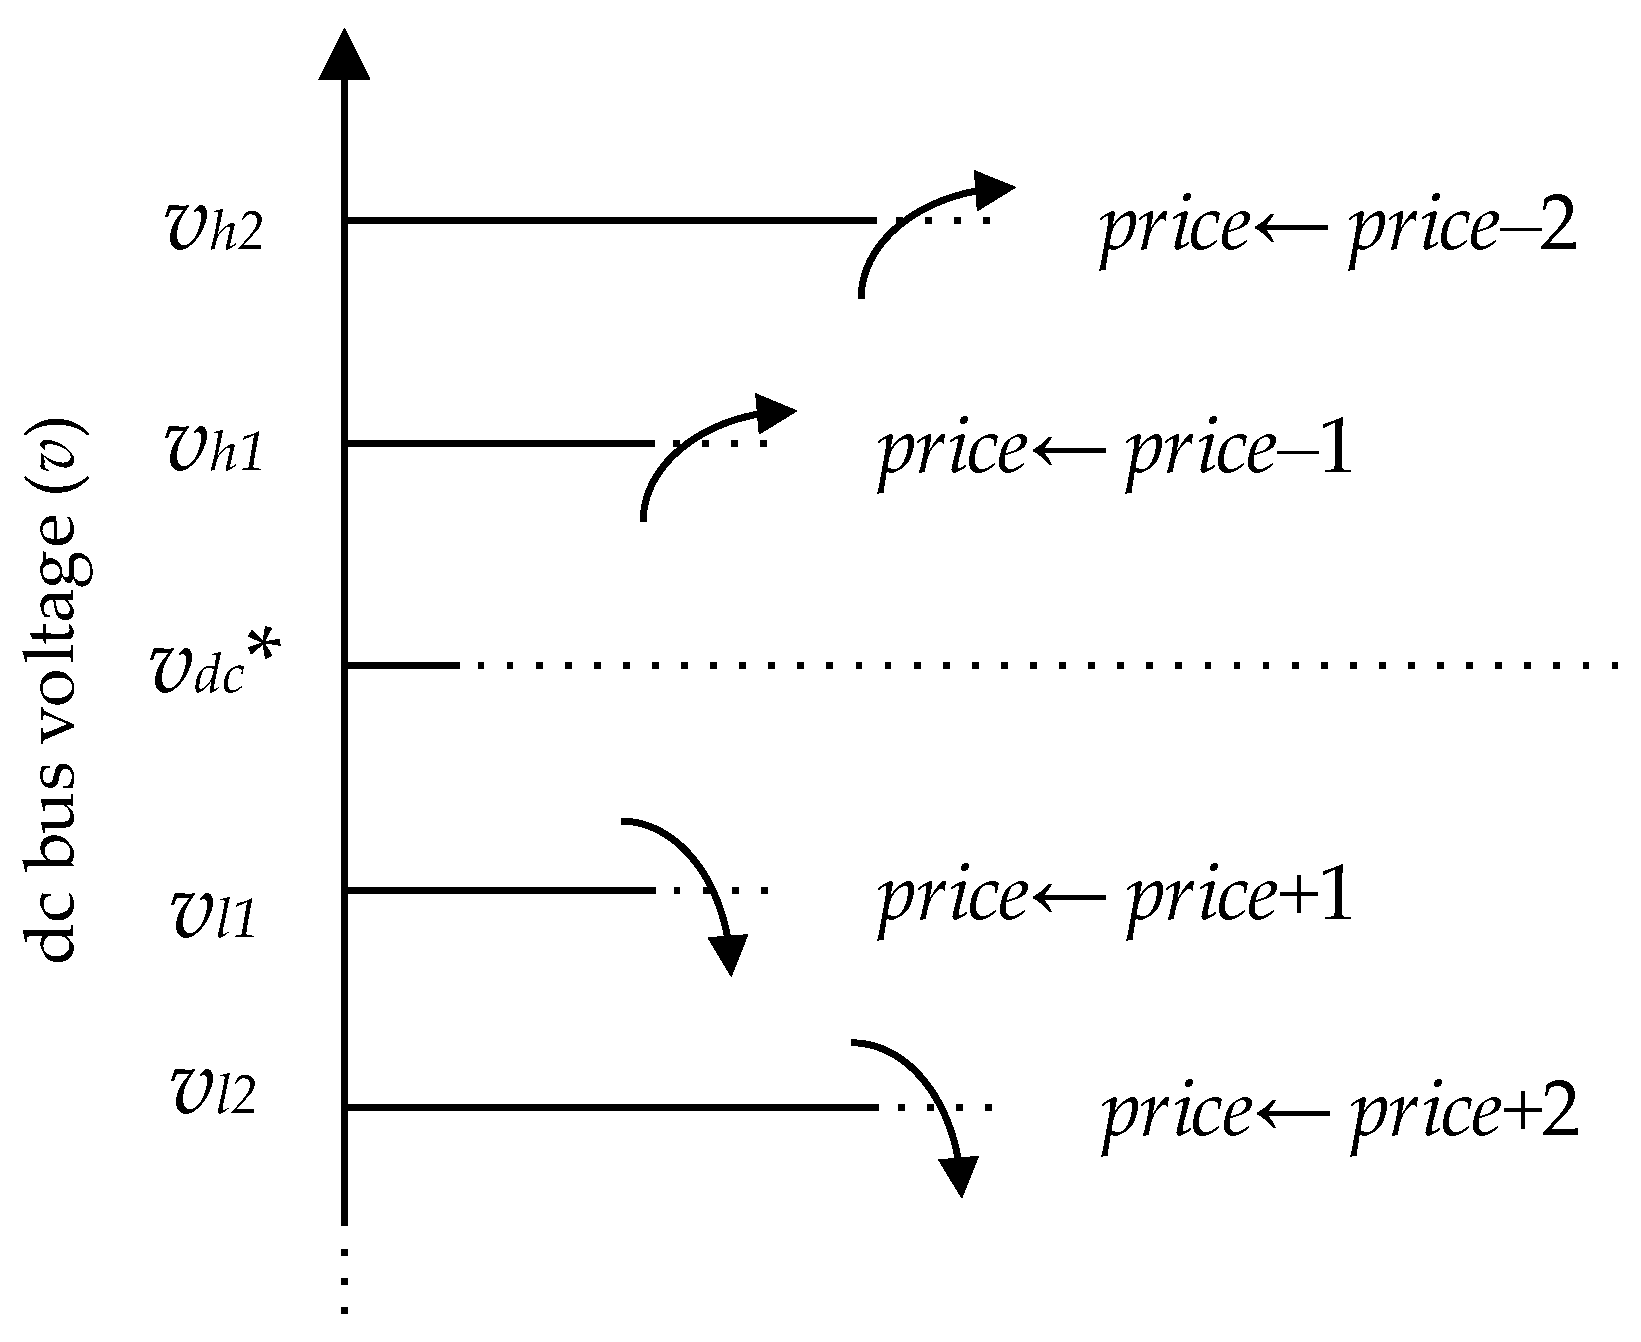
3.1. Fictitious Price Range Definition

First, the fictitious price range is defined, as shown in the highlights in Figure 5. The following steps are applied to express the price range:
(i)
The fictitious price $0 is defined as the real price 0 US$/kWh.
(ii)
When a fictitious price 0$ is the minimum selling price for renewable generator with production costs zero, it is necessary to include the fictitious price of $1 as a protection measure to allow all generators to turn off.
(iii)
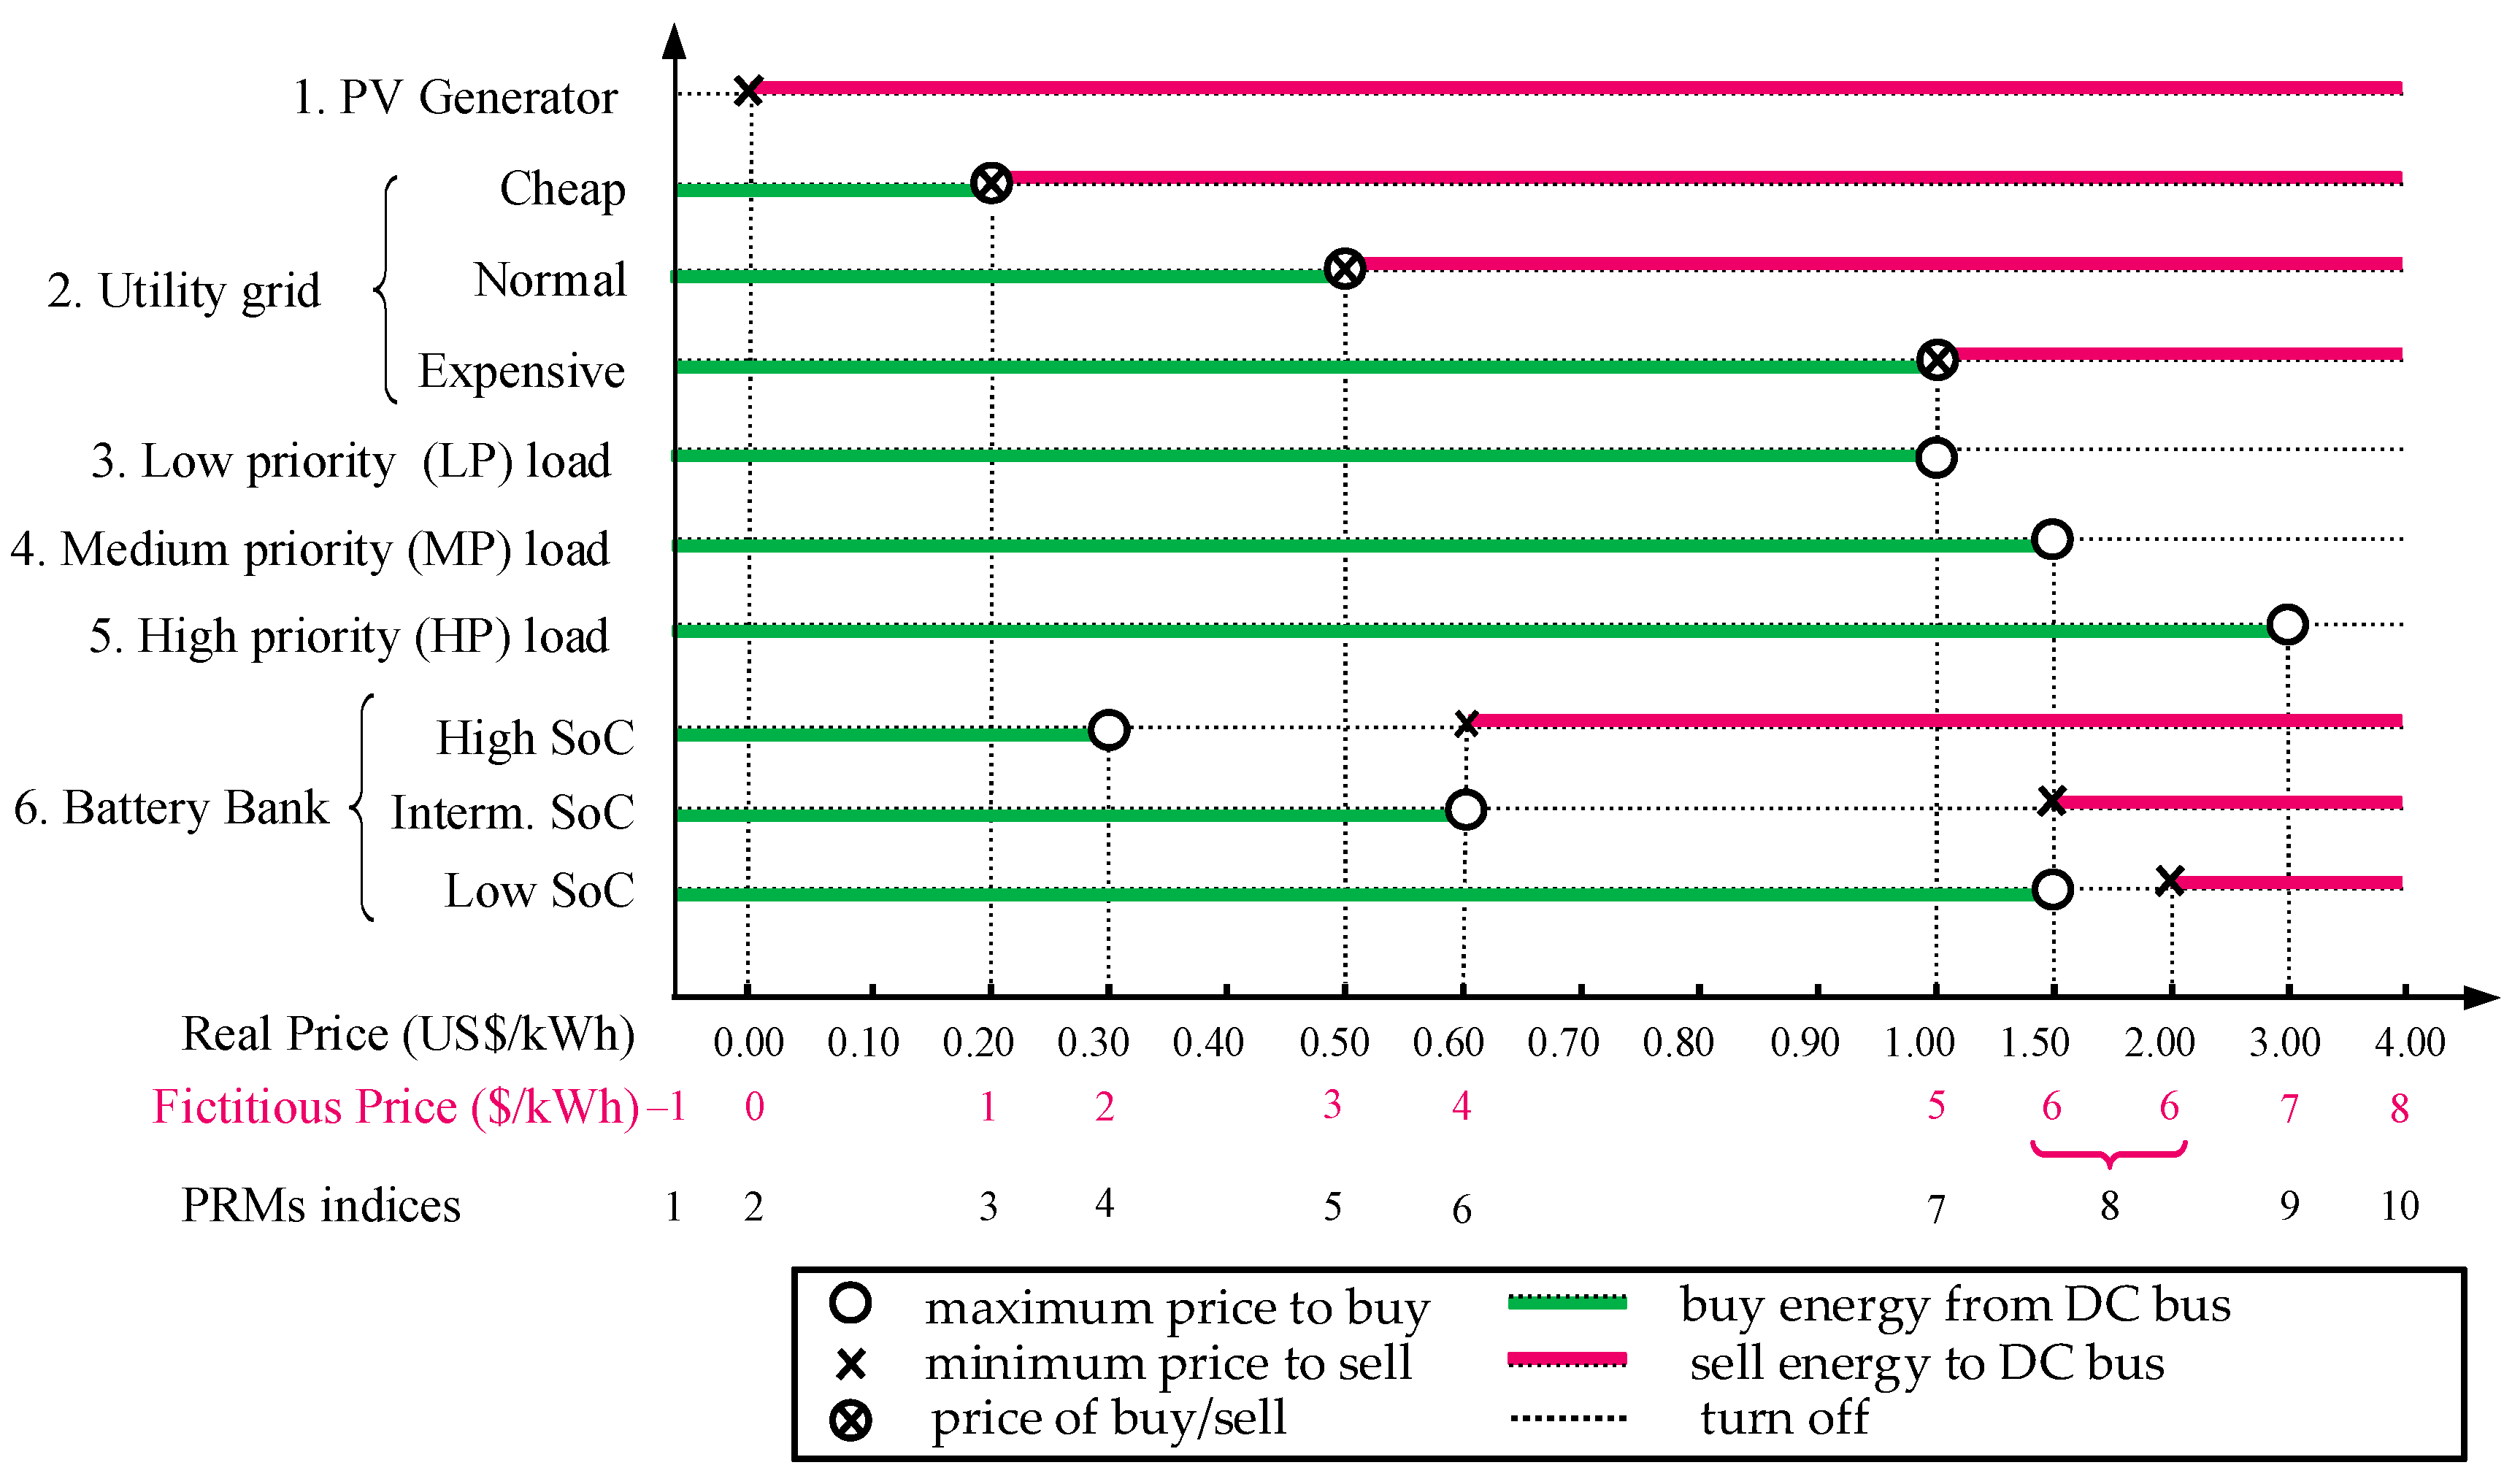
Usually, different real prices are defined as different fictitious prices, but real prices can be grouped or split into different internal prices:
  • Real price grouped: price groups are defined when certain situations never occur or are not relevant to power management. For example, in Figure 5, the battery cannot have low and intermediate SoC at the same time. So, one can group prices 0.9–2.0 US$/kWh into a single fictitious price without interfering with other power elements. Now, the fictitious price of $5 is the minimum selling value for both cases.
  • Real price splitting: this situation can be defined when more than one regulator element is supposed to regulate the dc bus at the same real price. One real price can be split into more fictitious prices to avoid a power-sharing strategy. So, only one element regulates the dc bus voltage.
The price vector (pvec) is a row vector with all possible fictitious prices in ascending order:
pvec = [$−1 $0 $1 $2 $3 … $pmax− 1 $pmax]

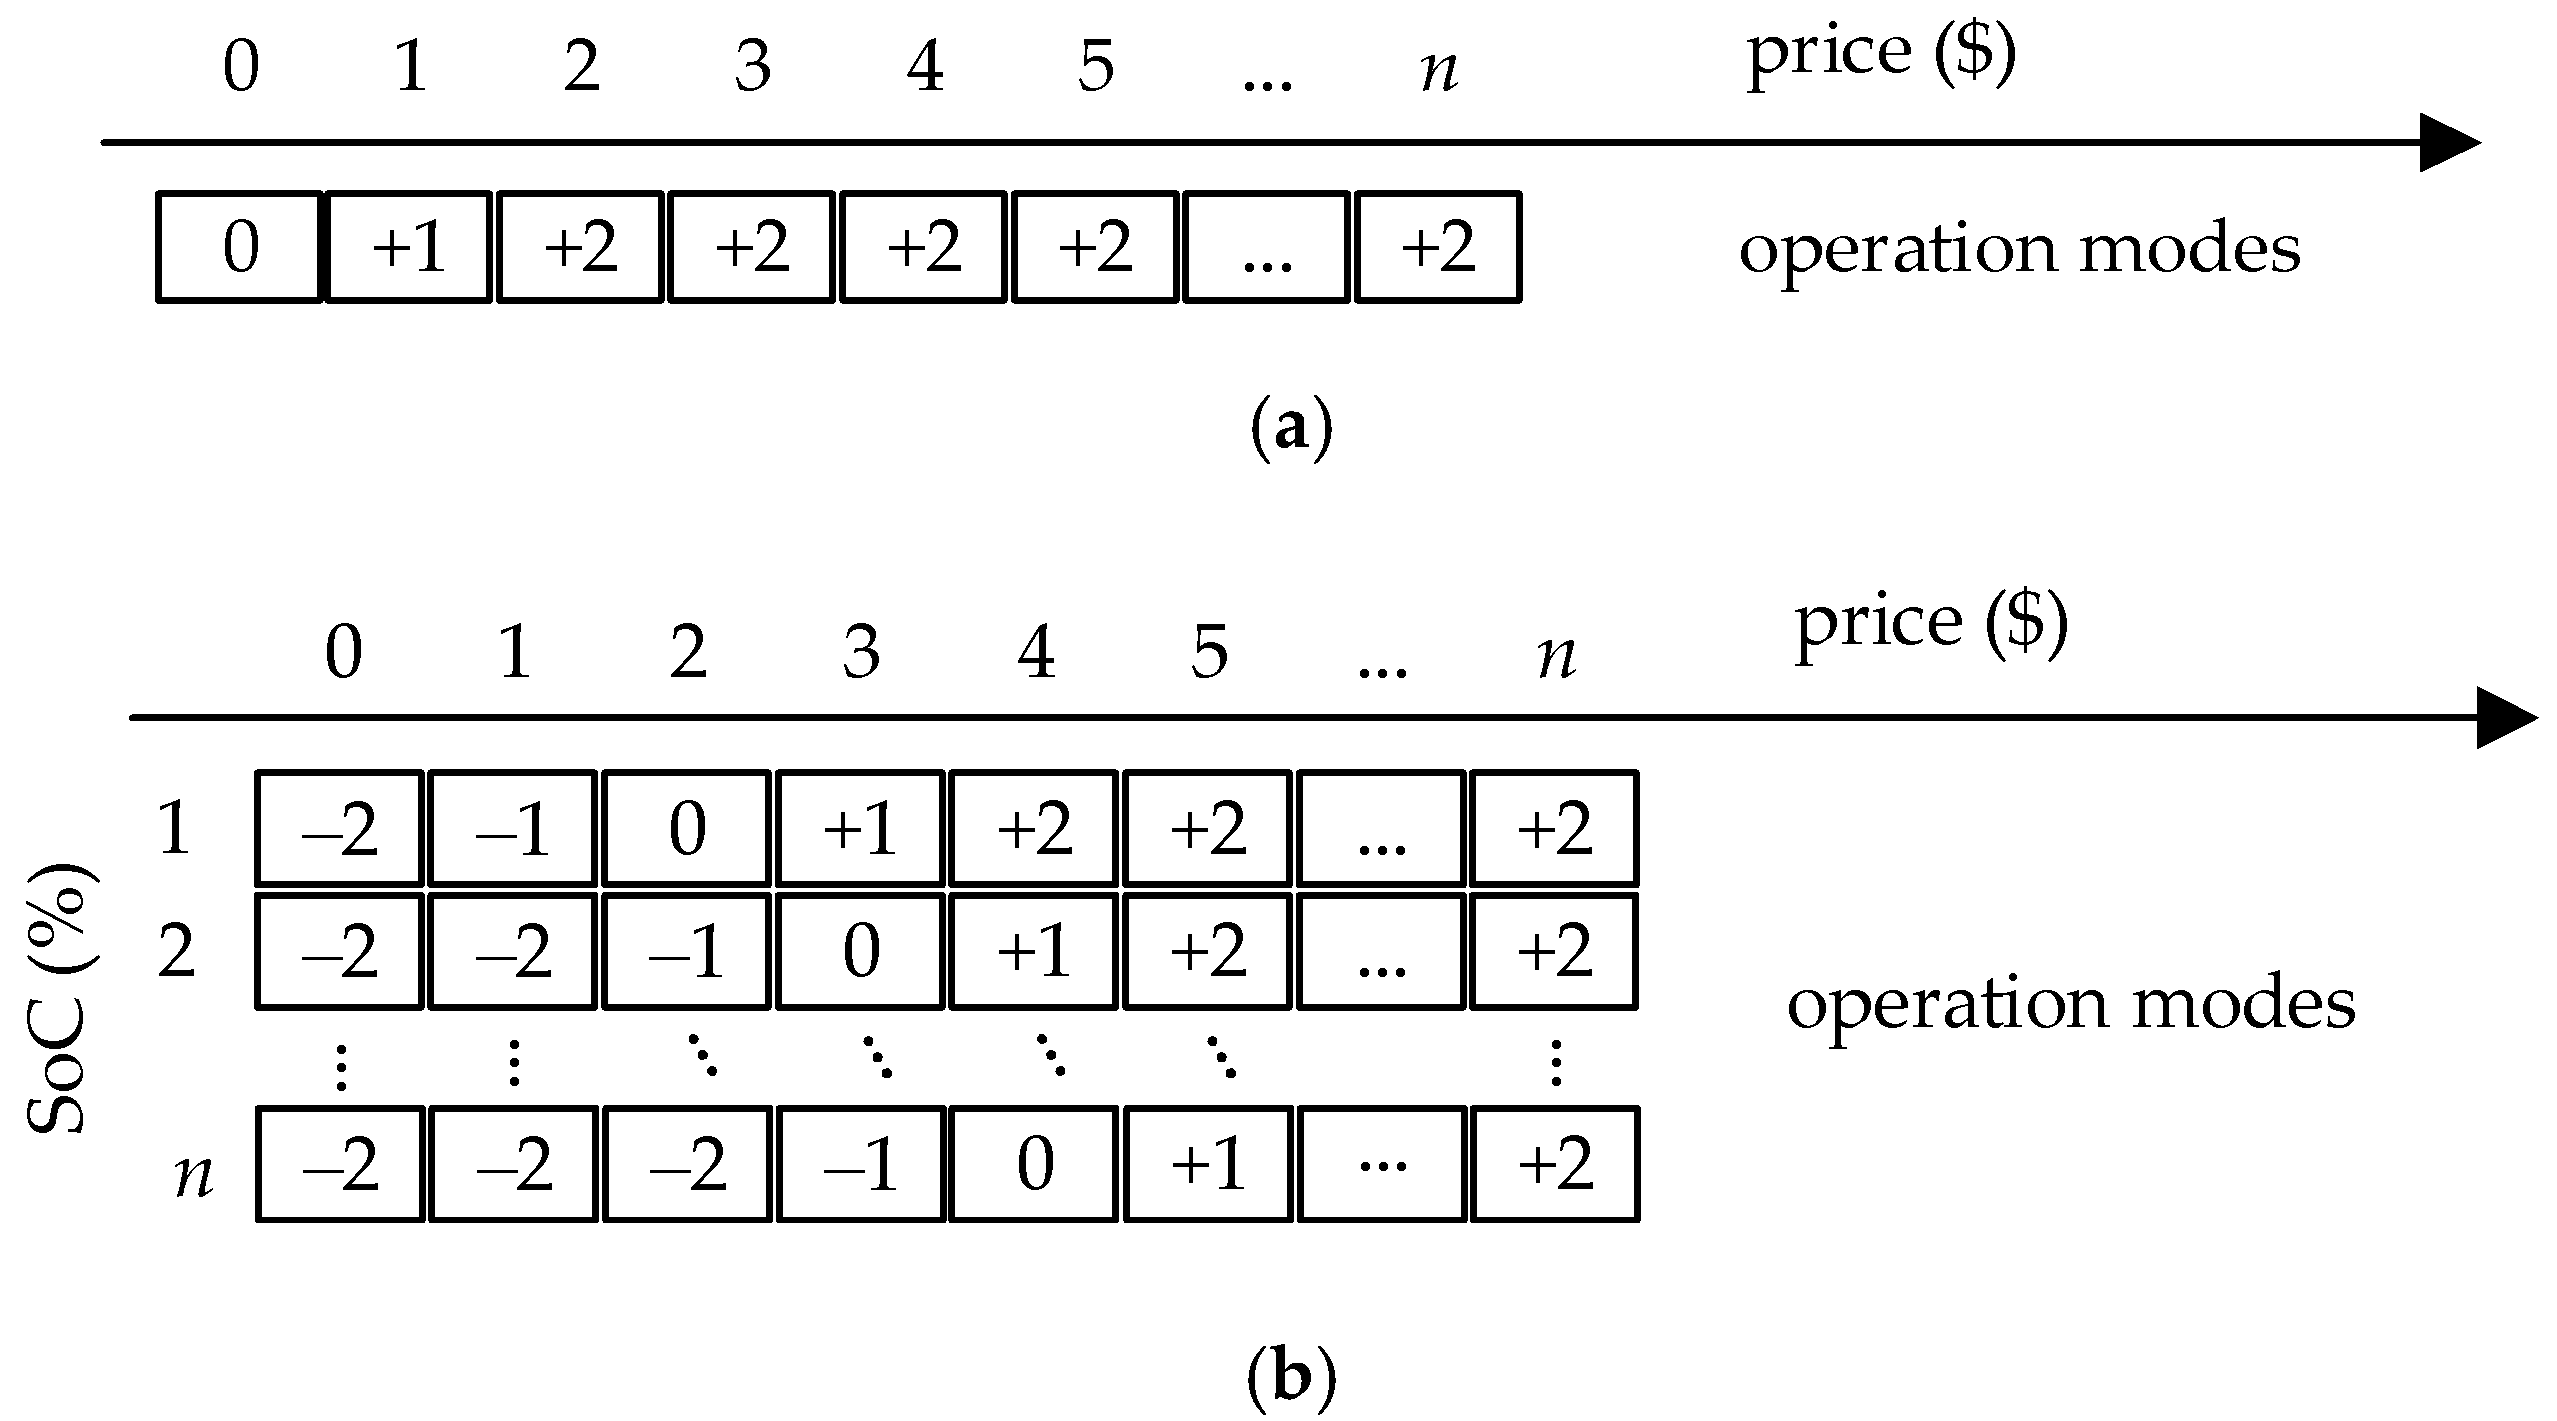
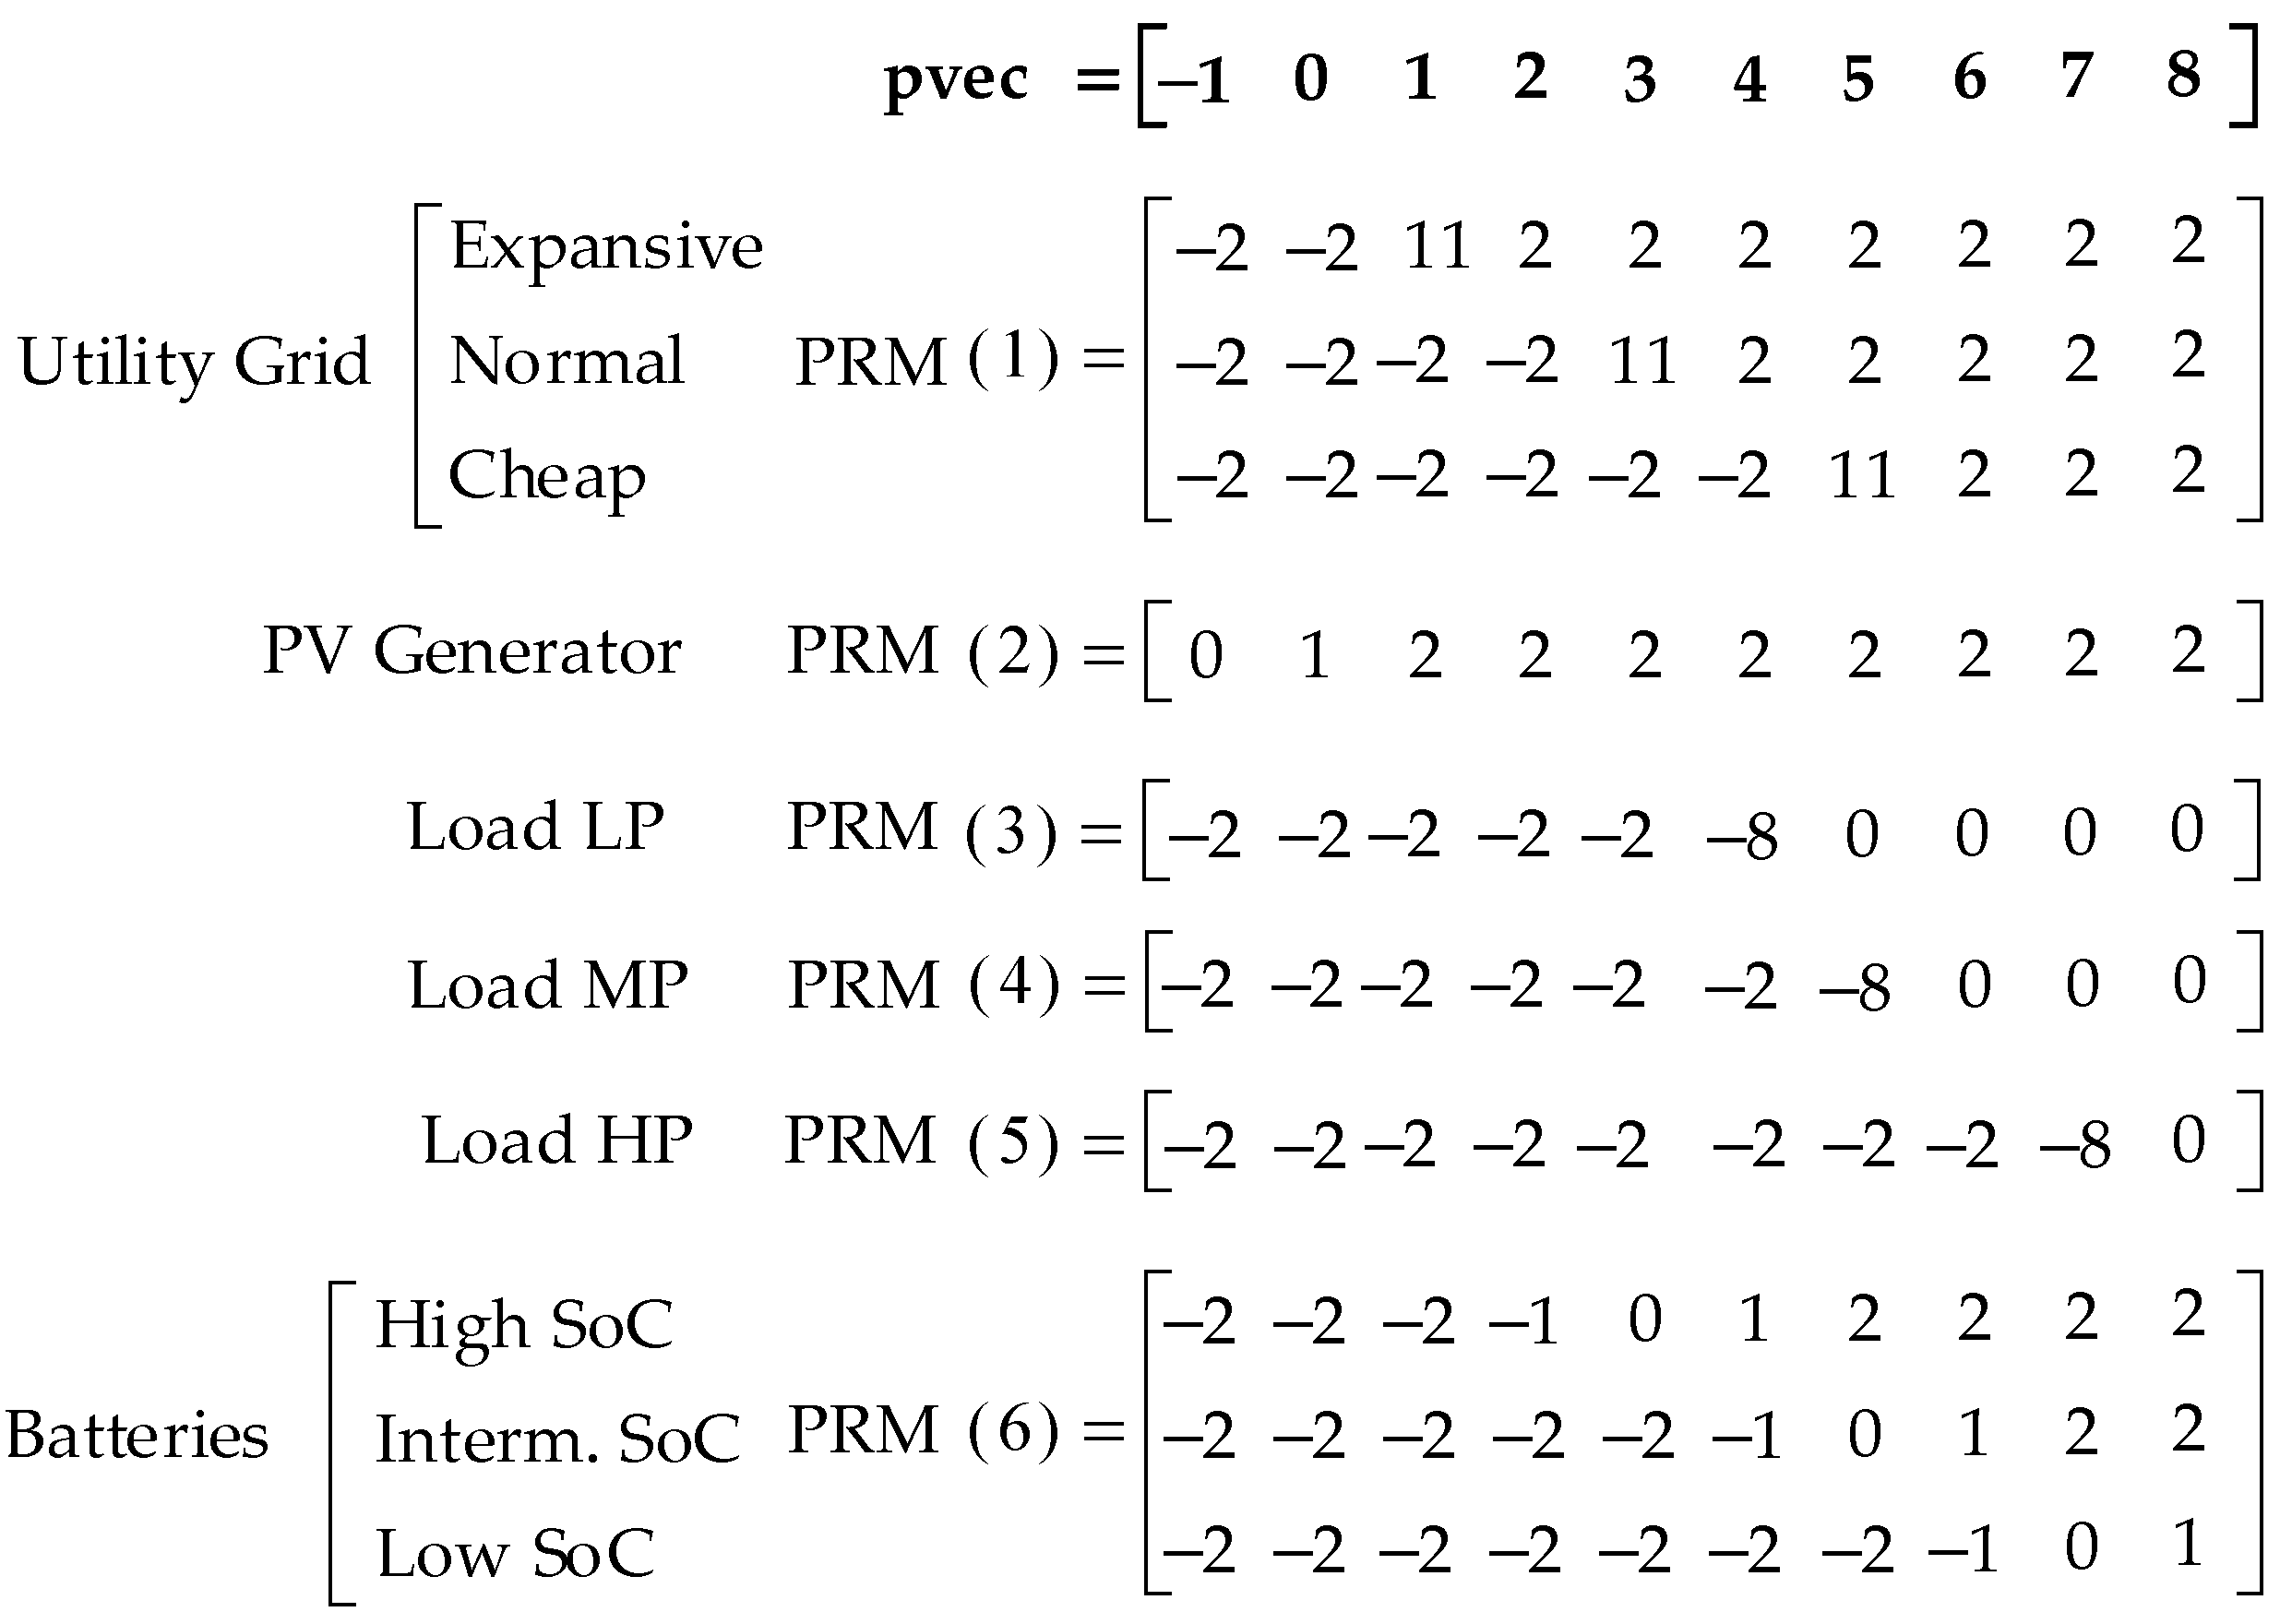
3.2. Definition of Price Response Matrices Dimensions

Each element has its PRM. The number of columns of all PRMs is the length of the pvec. The number of rows of each PRM is the quantity of OCs of the respective power element. In the example of Figure 5, the PV generator PRM has one row, and the battery PRM has three rows.

3.3. Trigger Price and Assignment of Operation Modes

A PRM has information about the operation mode that the element shall operate at a given OC (row) and price (column). The possible power elements modes are −2, −1, 0, +1 and +2.
These numbers are assigned inside the PRMs, and three other numbers define specific situations:
11: This number means a bidirectional operation (−1/1) of a Regulator element at a given fictitious price. For example, a bidirectional dc-ac converter connected to the utility grid can operate on this mode when the consumption and injection prices are the same.
−8/+8: These numbers signalize to latch the current operation mode (0 or −2/+2), being applied to Not Regulator elements. Number 8 is used for sources, while −8 is used for loads. The energy management system user, which is at an upper automation layer, may send a command to change this operation mode. This latching is essential to avoid cyclical switching of not regulator elements when the system available energy is not low enough to turn on sources or not high enough to turn on loads.
Number assignment inside the PRMs is done for each OC, which is the PRM row. The first number assigned is in the column related to the Trigger Prices (TP), which are the maximum buying (TPb) and/or minimum selling (TPs) fictitious prices. In Figure 5, the PV generator has TPs (selling) = $0. On the other hand, the battery of Figure 5 has a TPb and a TPs for each Operation Condition. For the OC of High SoC, we have TPb = $1 and TPs = $3, related to the PRM column indexes 3 and 5. The operation modes at the TPs depend on element features:
(i)
Regulator elements: the numbers assigned inside the PRM at the TP are −1 (TPb—buying) or +1 (TPs—selling). When TPb and TPs are the same, number 11 is assigned.
(ii)
Non-regulator elements: the numbers assigned inside the PRM at the TPs are 0 (TPb—buying) or +8 (TPs—selling). When TPb and TPs are the same, number 0 is assigned.
The numbers assigned for prices lower and higher than TPb and TPs are shown in Table 2. It illustrates the PRMs completion in the intervals different from the TPb and TPs.
In Table 2, it is important to highlight that Non-Regulator elements are not assigned to turn on (−2 or +2) within the PRM. These numbers could be inserted inside the PRMs with other power and energy analyses to avoid cyclical switching. Also, this can be performed by the energy management.

4. Example of Price Response Matrices Applied in a DC Nanogrid

A single-bus dc nanogrid is used to evaluate the Price Response Matrices method in a real system. This system includes a battery bank, a PV system, dc-ac converter as the interface to the utility grid, and three loads, divided according to their priority level: high priority load, medium priority, and low priority load. Moreover, the utility grid and batteries have three operating conditions. Table 3 presents all the system elements and their specifications.
Initially, the PRMs determination begins with system parameterization. Therefore, the nanogrid user/owner must define the trigger prices for the sources and loads. For the loads, the maximum buying energy price is determined according to their priority levels, e.g., the highest priority load must buy energy with the highest price. In contrast, the lower priority load can buy energy at the lowest price. For the sources, the minimum selling trigger price is defined, as shown in Figure 6.
The fictitious prices must be selected from the trigger prices definition as previously explained in Section 3.1. For this example, the price vector is
pvec = [$−1 $0 $1 $2 $3 $4 $5 $6 $7 $8].
Considering the price vector (2), the proposed method results in PRMs presented in Figure 7.
The numbers assigned within PRMs rows are in accordance with Table 2. Also, the PRMs (3) can be obtained from the Supplementary Material.
In Figure 8, the nanogrid power converters scheme is presented. The loads can be connected to the dc or ac side. In this paper, the ac loads are considered because they are most commonly used in the current residential applications. However, this is not significant to the power management.
In this proposal, each power converter has its own voltage and current controllers as well as its own specifications related to the rated power and control layers. In the following, the experimental setup is detailed.

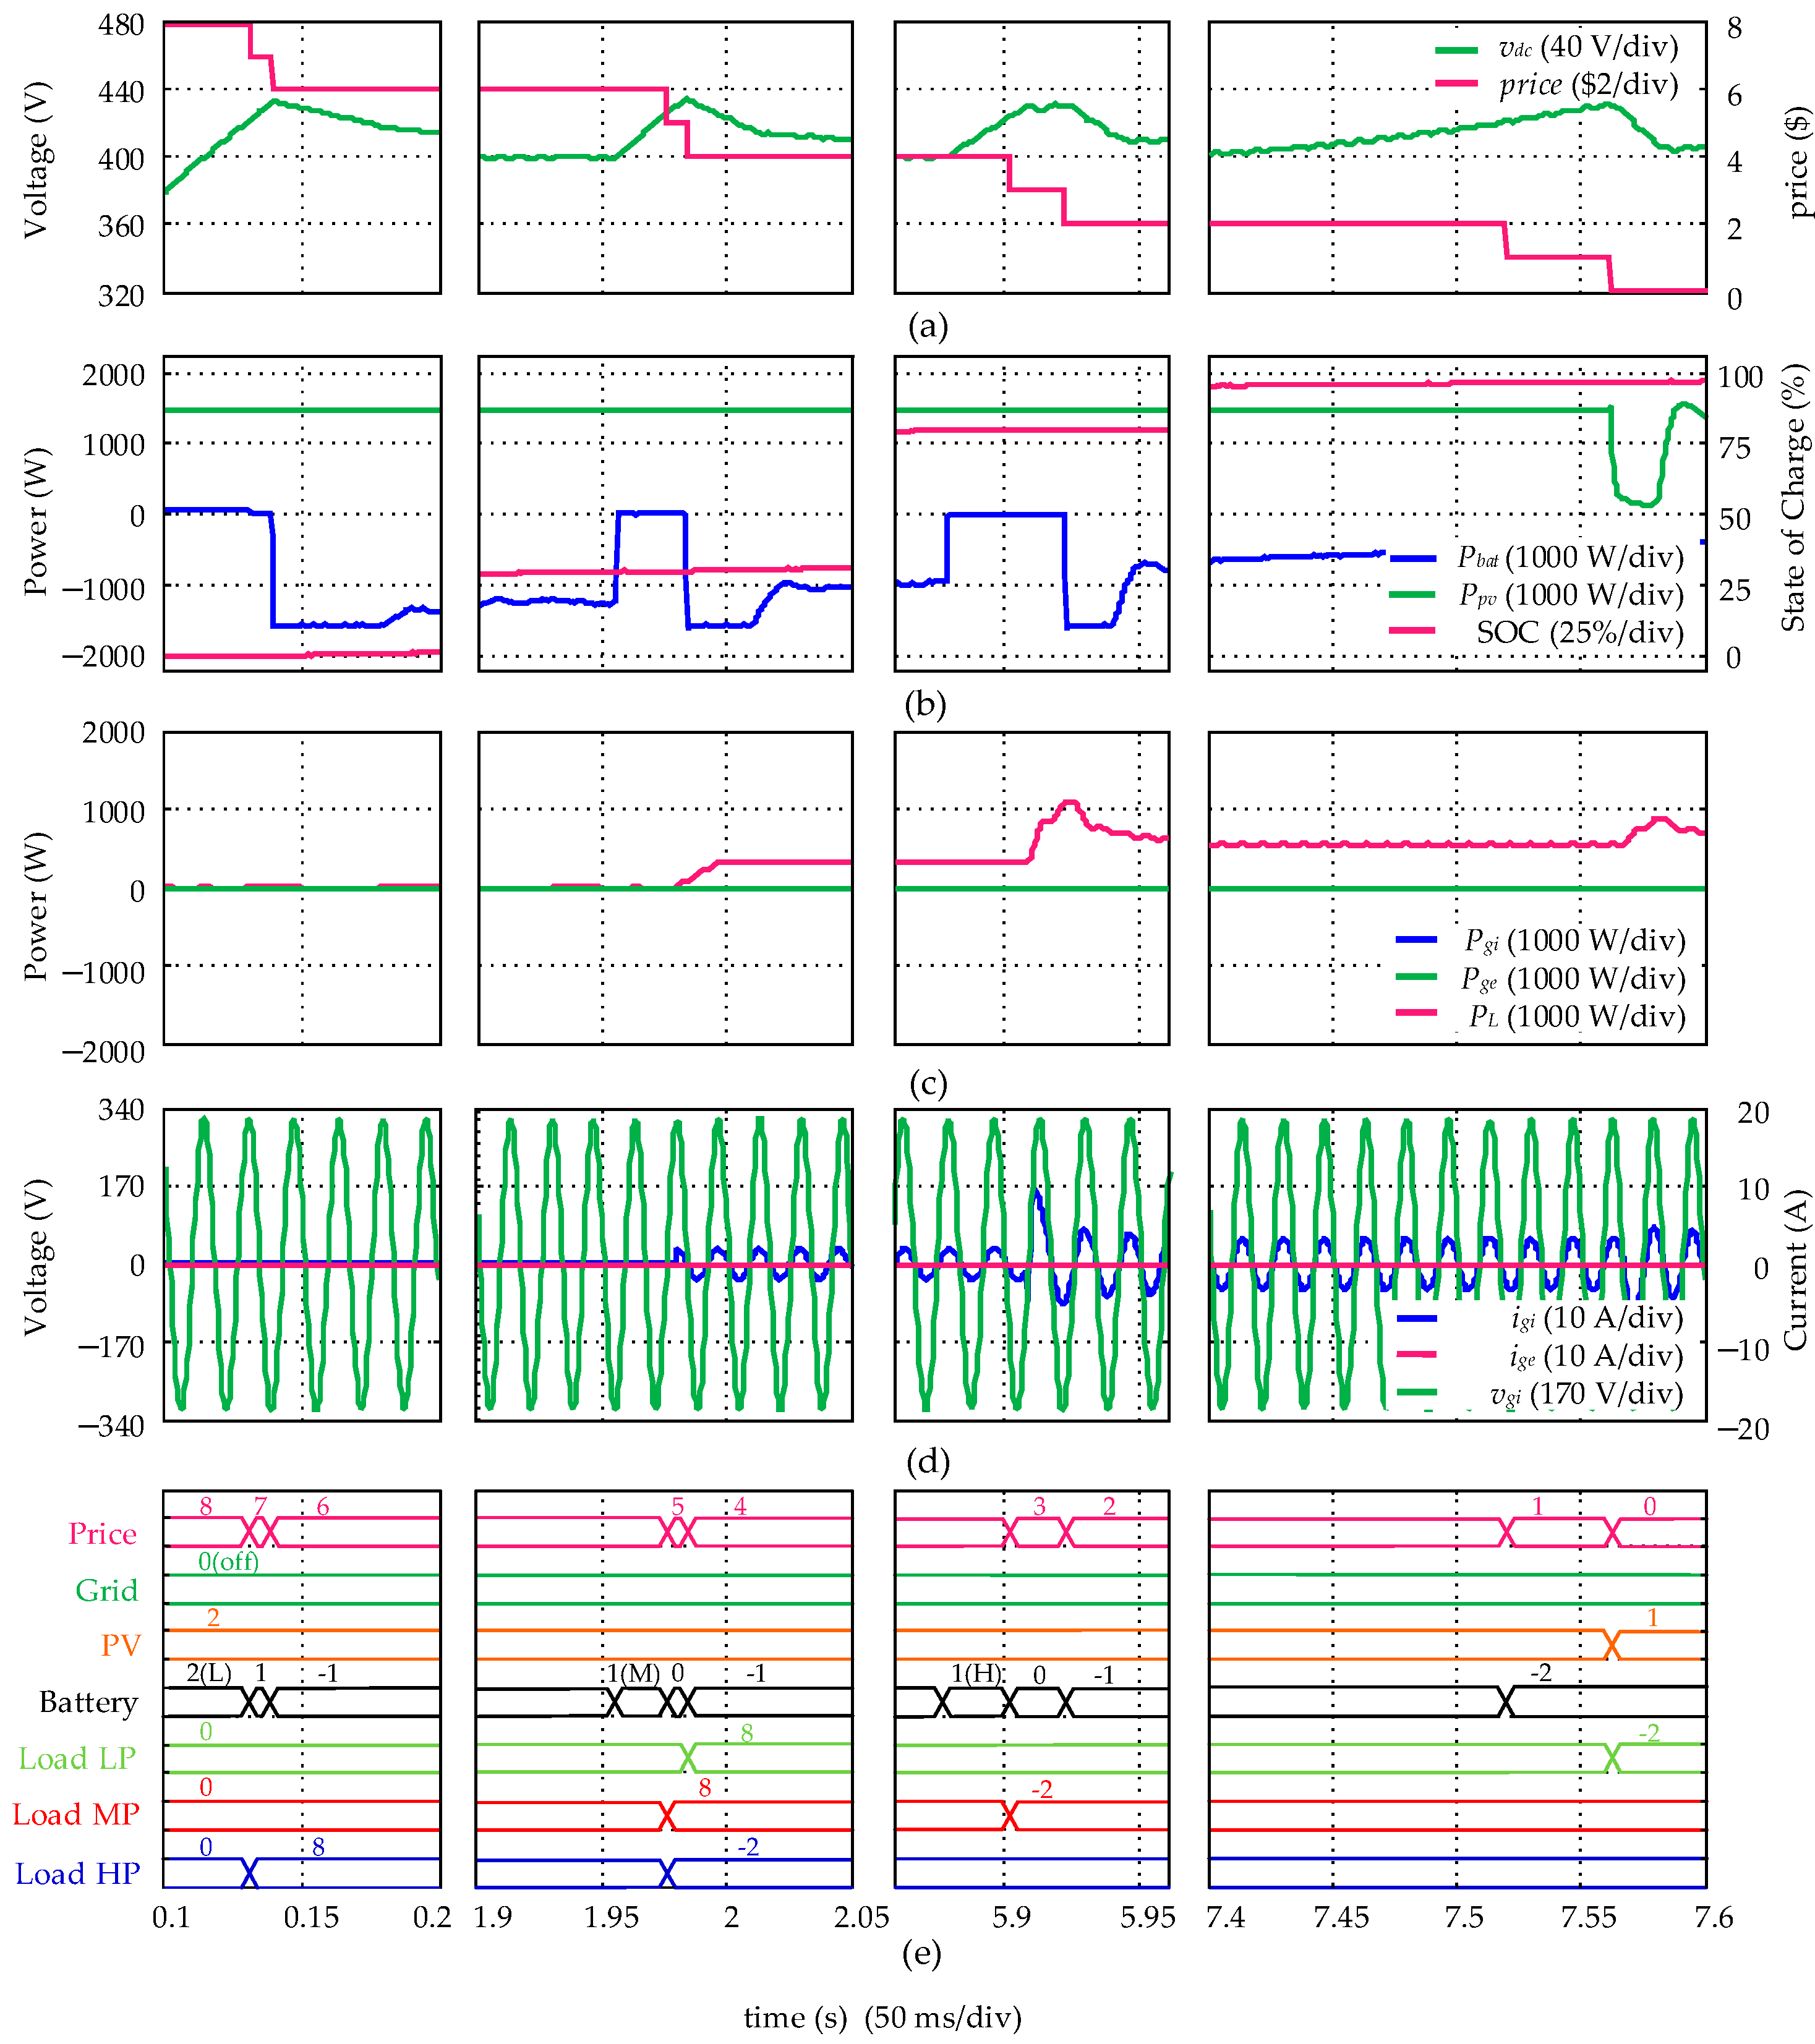
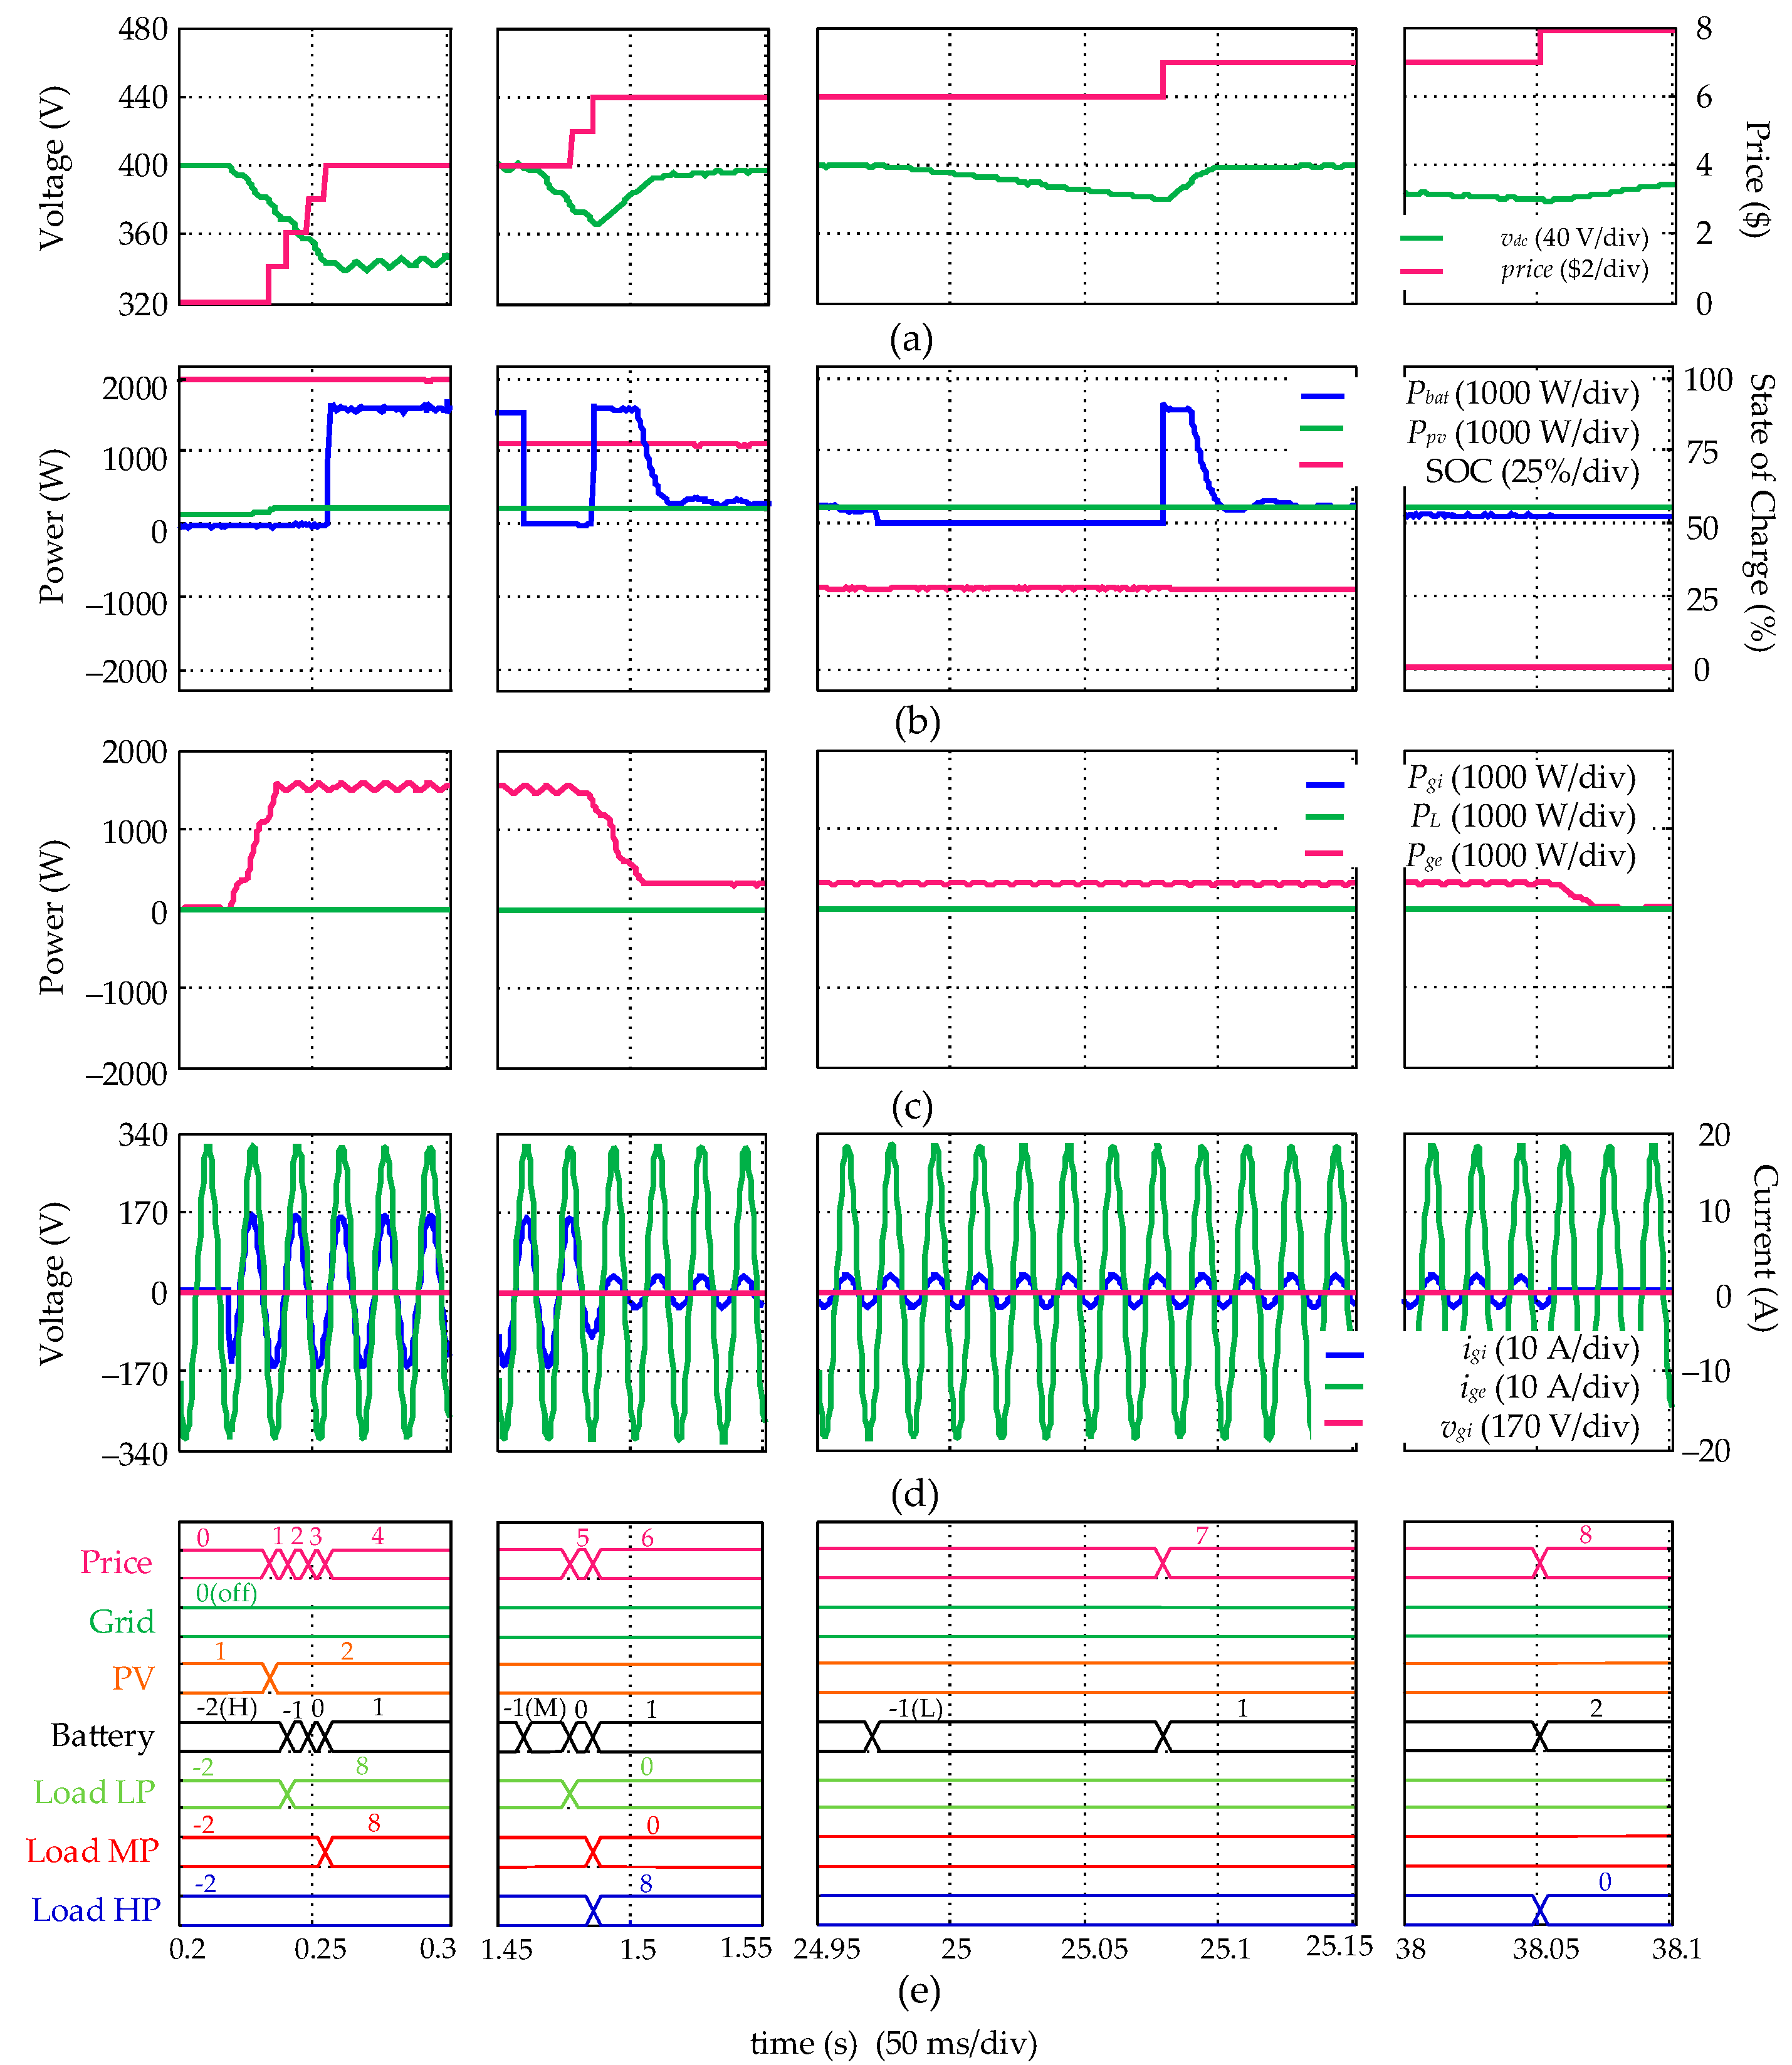
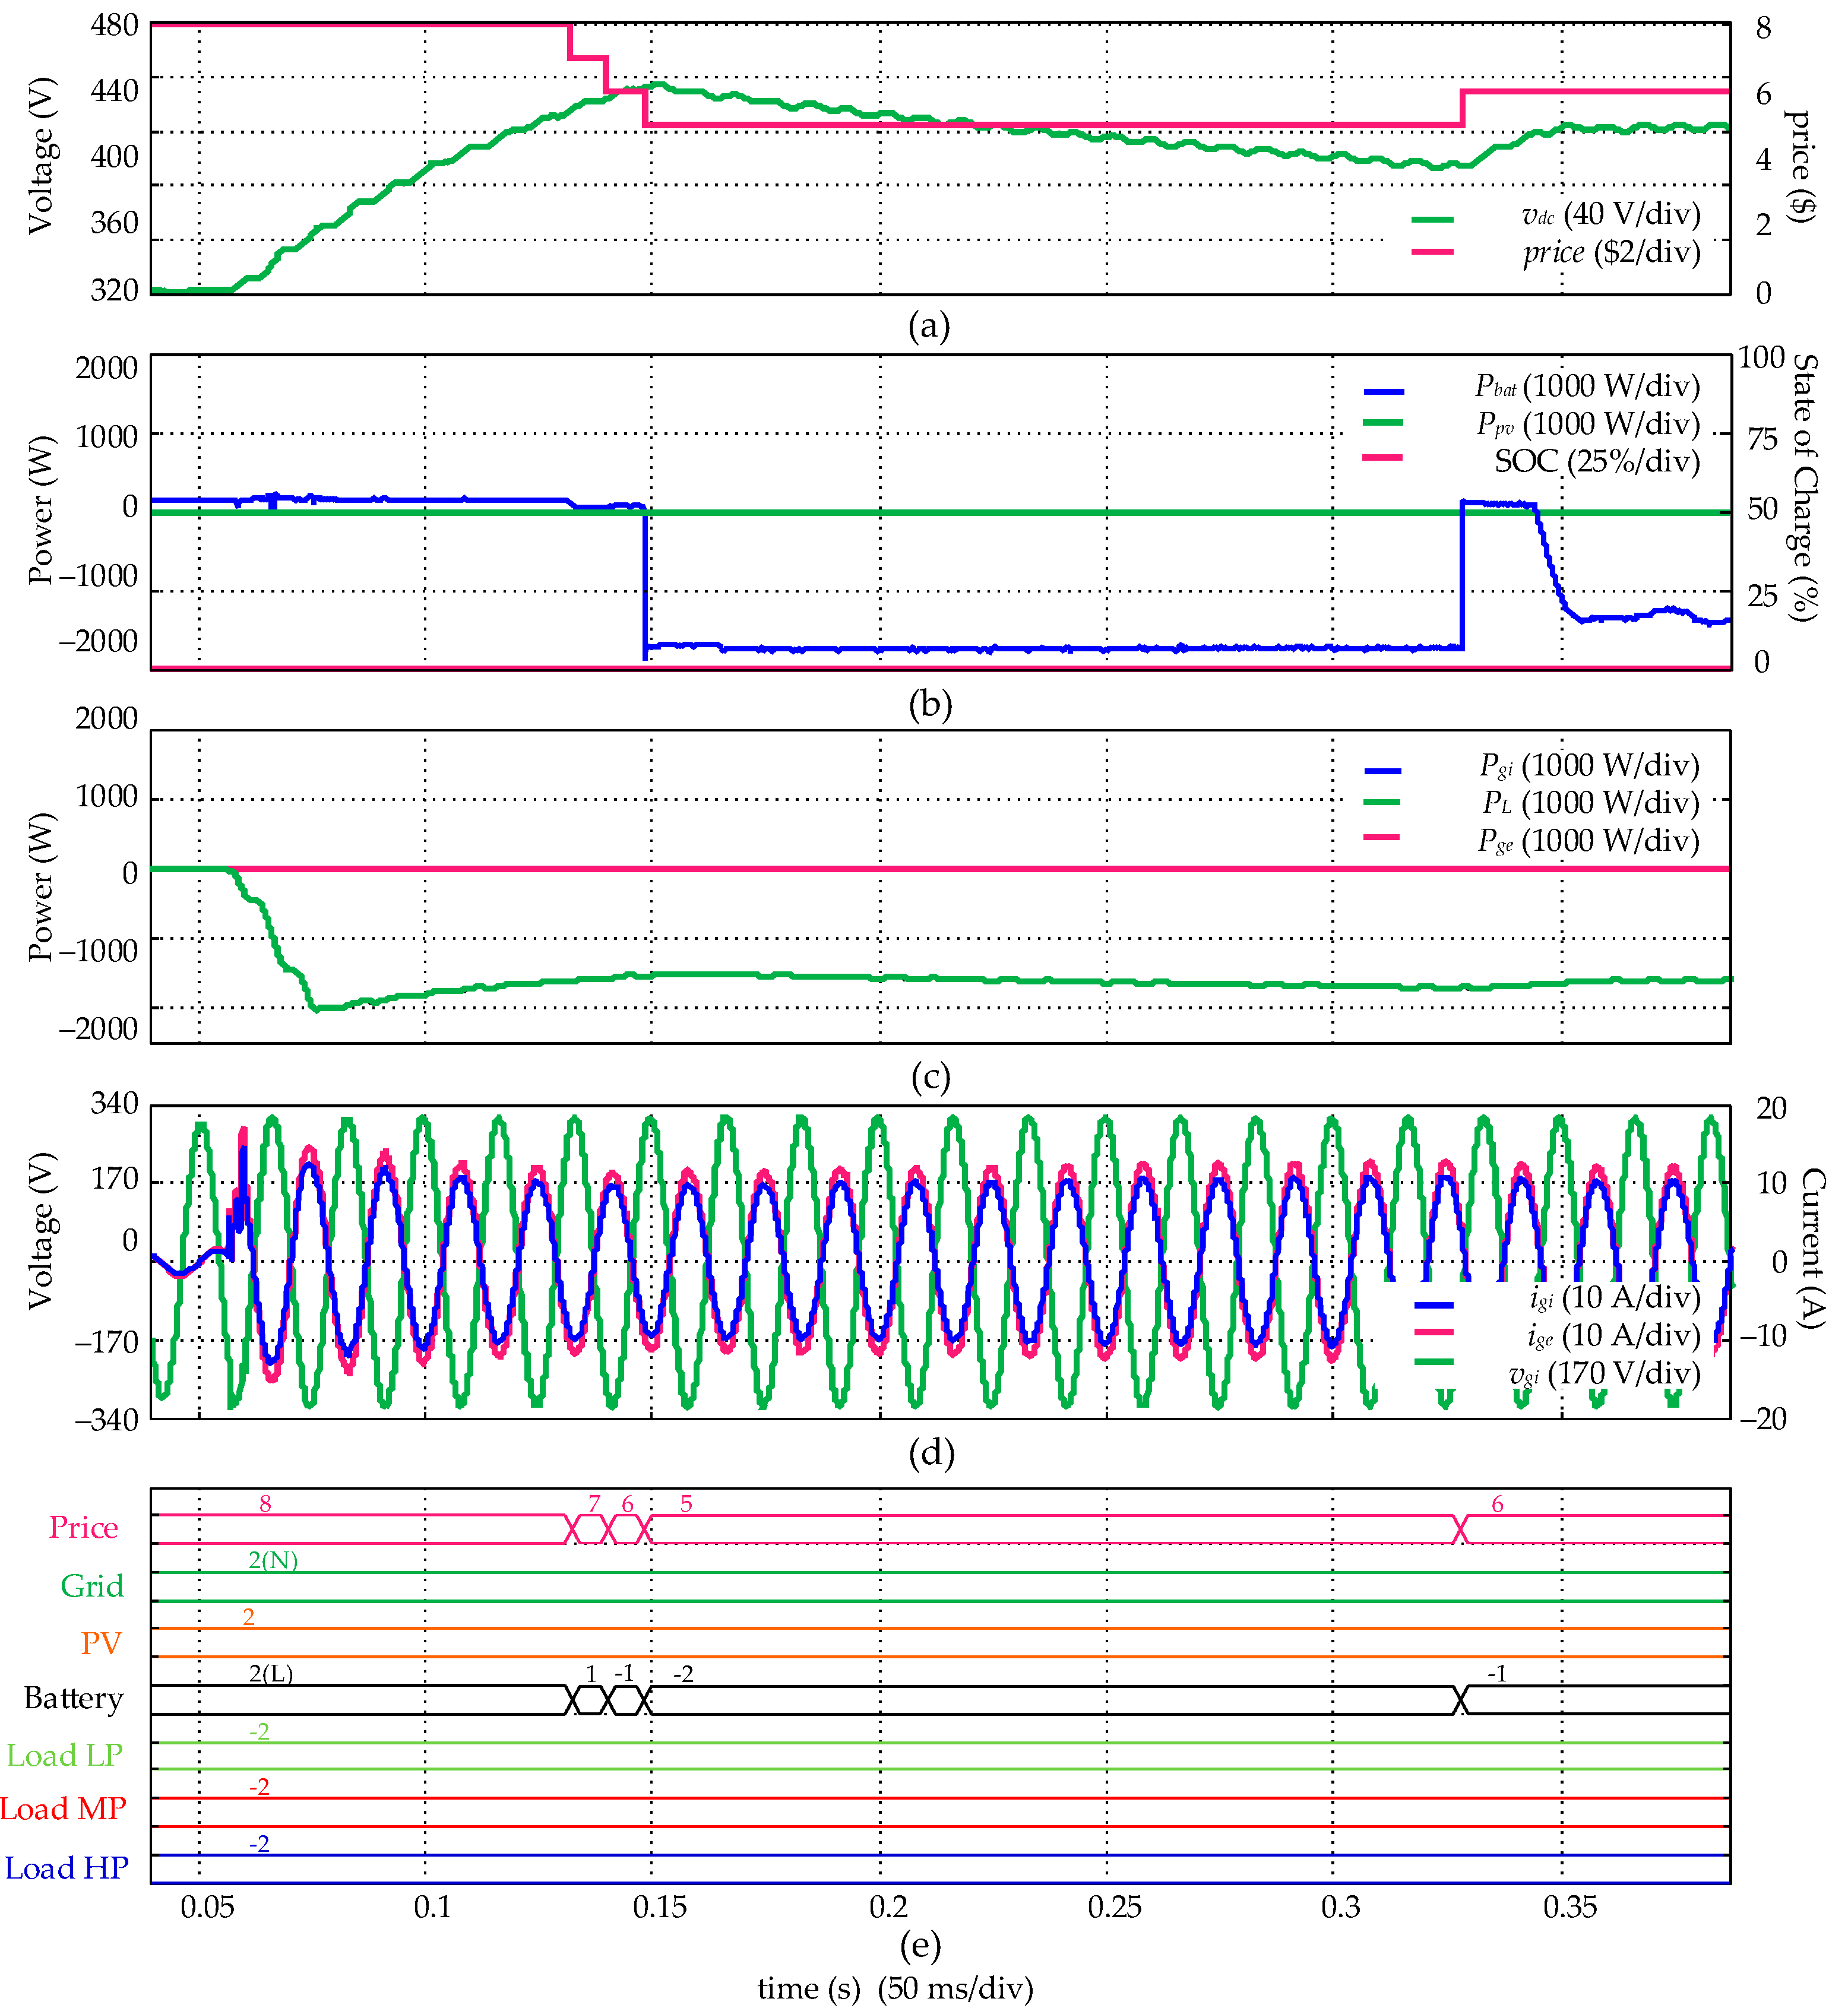
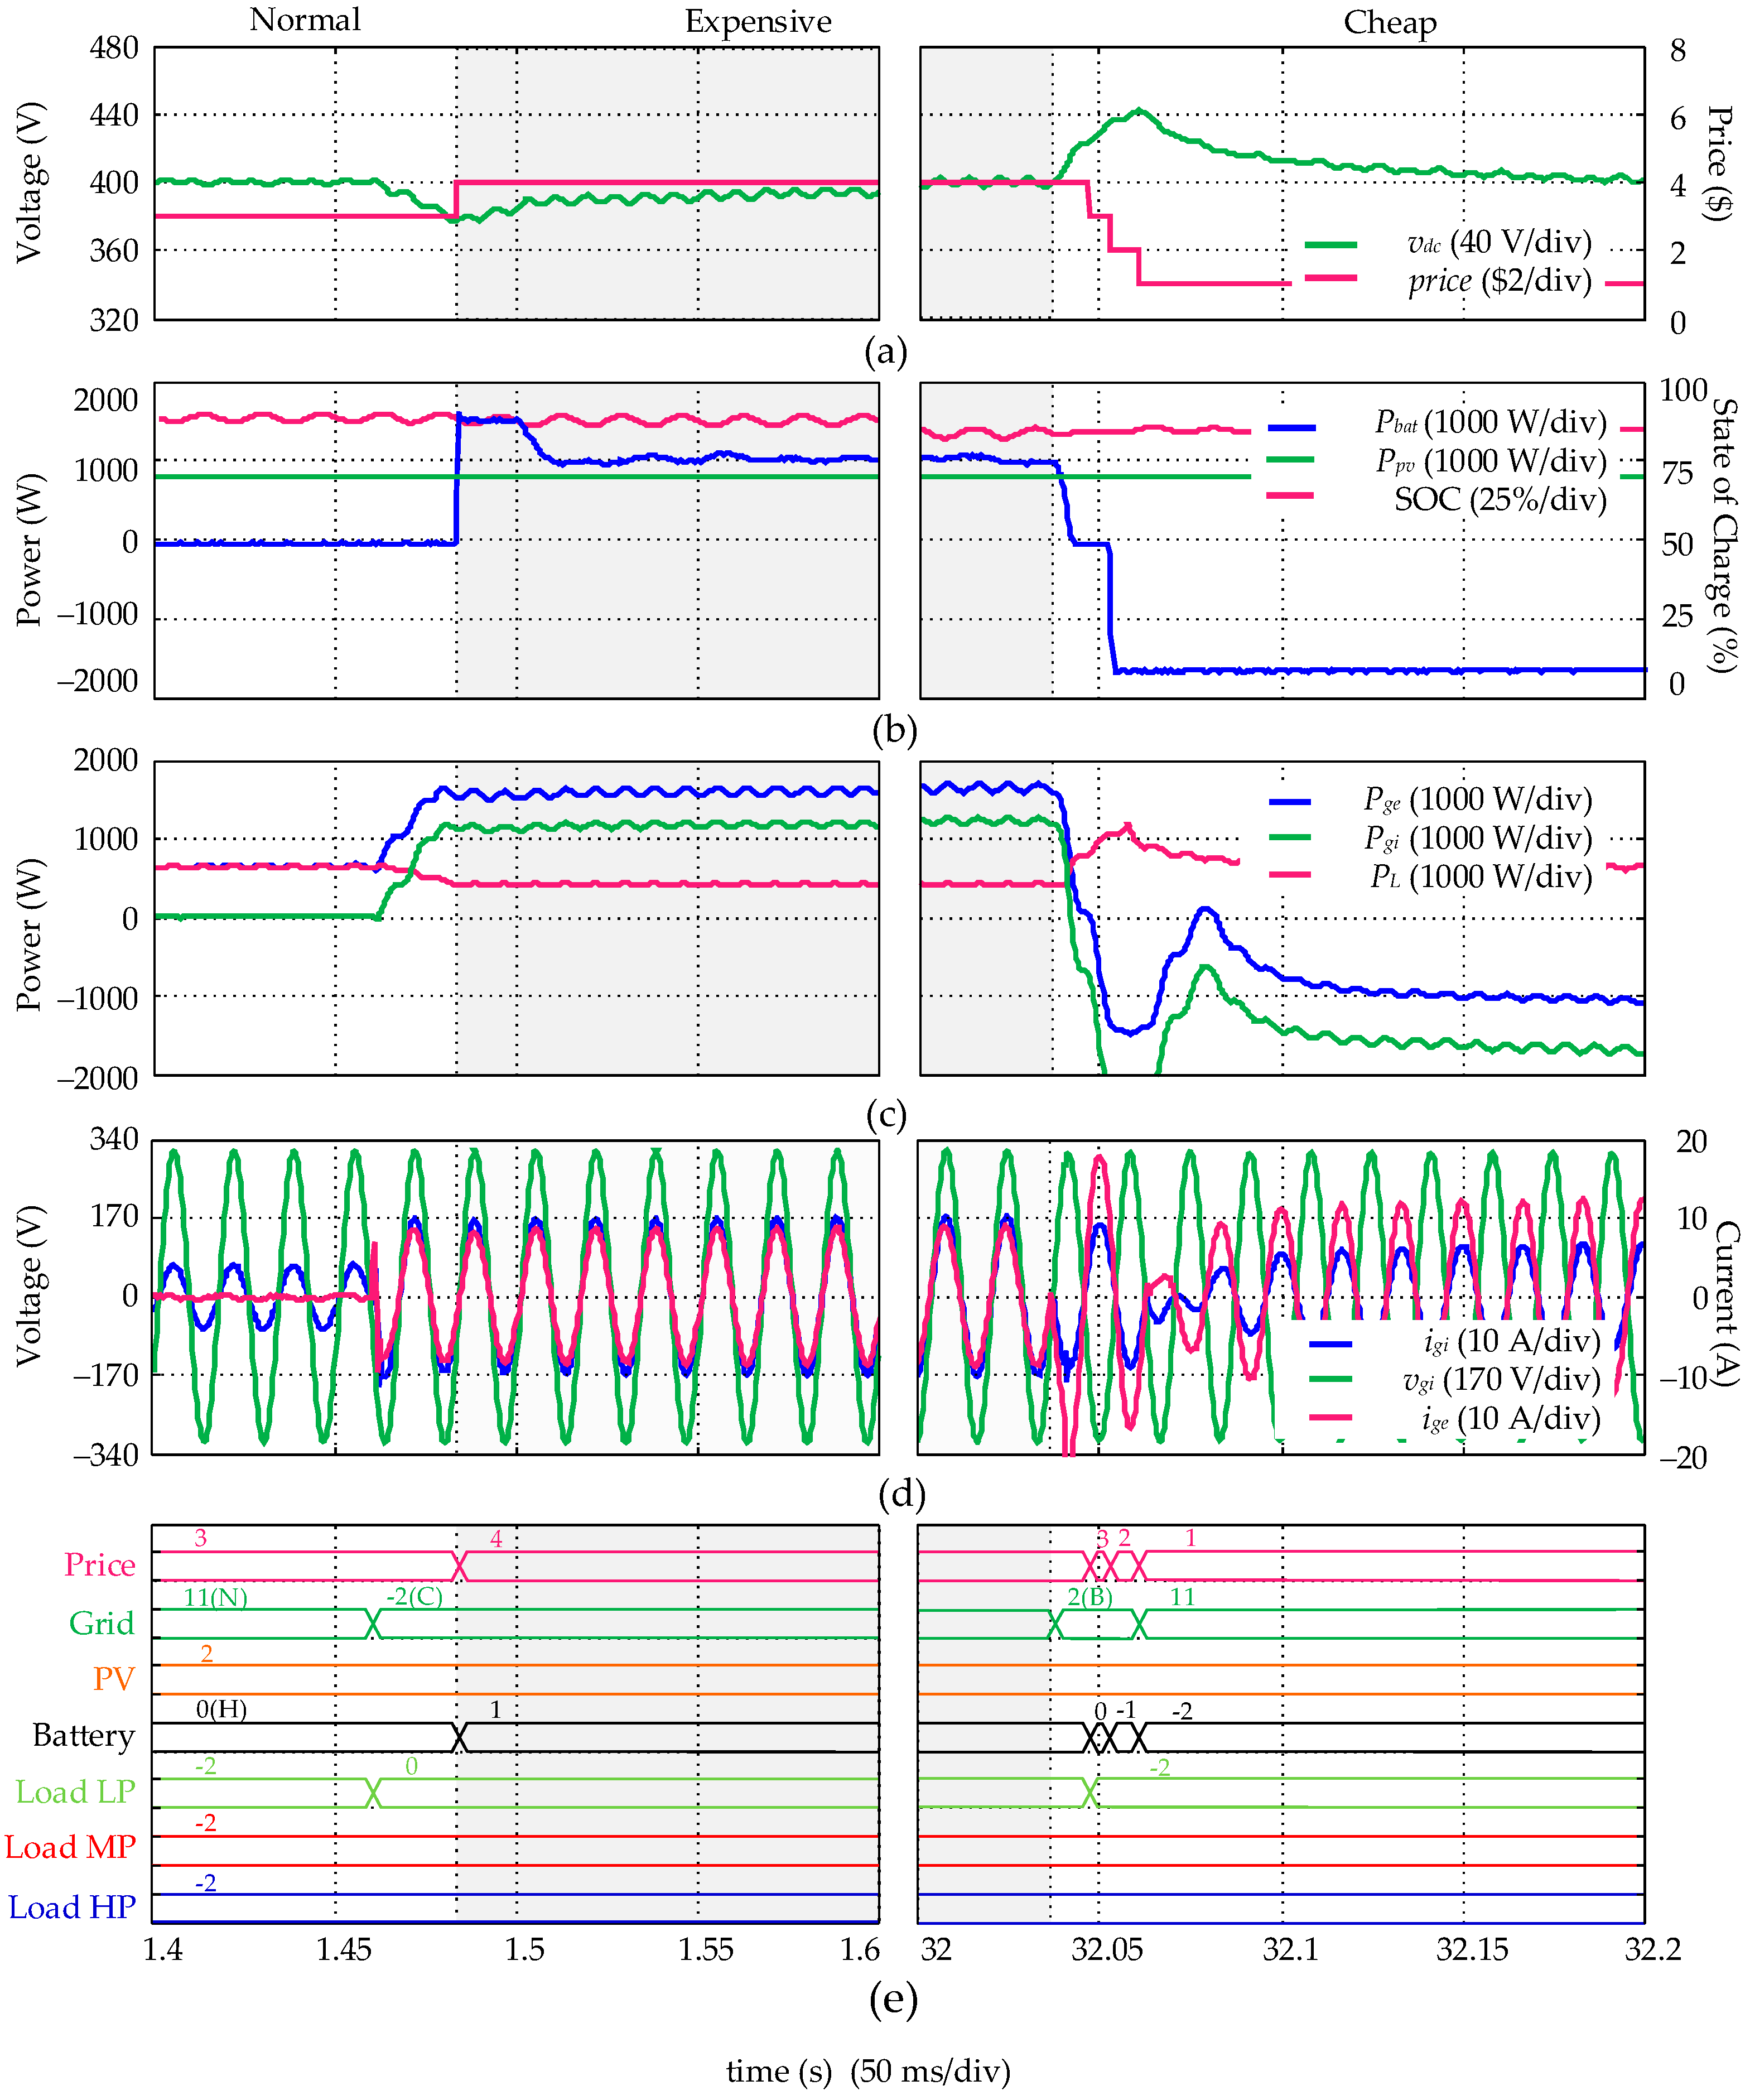
5. Experimental Results and Discussions

Experimental results have been obtained with a setup implemented according to Figure 7 to corroborate the power management strategy proposal with the PRMs. The static converters control (automation layer 0) and the price-based power management system (automation layer 1) were implemented in a Texas Instruments DSP TMS320F28335.
The main prototype parameters concerning the Power Management System are shown in Table 4. Table 5 shows the main specification for the power converters control layers. In the first layer, all current loops have the same cut-off frequency and the voltage loops to simplify the control analysis. Since only one power converter controls the dc bus voltage, the nanogrid stability analysis depends on only one control loop.
The adopted dc bus voltage comparison values to calculate the internal price are shown in Table 6. The comparison voltages are not discussed in this paper because it is similar to other DBS strategies described in [28,29,30].
Four significant scenarios have been chosen to demonstrate here the efficacy of the power management approach. These results are shown in Figure 9, Figure 10, Figure 11 and Figure 12. The figures depict the most important variables, that is:
  • Subfigure (a) shows dc bus voltage and the internal price signal, which was measured as an analog signal.
  • Subfigure (b) shows PV generator power (Ppv), battery power (Pbat), and battery SoC.
  • Subfigure (c) shows dc-ac converter power (Pgi), grid power (Pge), and total loads’ power (PL).
  • Subfigure (d) shows the main ac side waveforms: ac voltage (vgi), dc-ac converter output current (igi), and the current injected into the grid (ige).
  • Subfigure (e) shows the Power Management Algorithm’s main digital signals, including the internal price and the operation modes of all power elements.
All presented results are obtained from two oscilloscopes Tektronix DPO 4034. However, considering the vast number of results, the obtained data were imported by Matlab for a better organization and to include information that it is not possible to verify in the oscilloscope, such as the operation mode (−2, −1, 0, 1, 2), price, comparison voltages, and other information.
a. 
Scenario 1—Battery charging on the off-grid operation
The purpose of this result is to demonstrate the relation between the battery SoC and the stable price. It also shows loads’ turn on according to the PRMs. The low priority (LP) load consumes 100 W, medium priority (MP) load consumes 200 W, and high priority (HP) load consumes 300 W. The result is shown in Figure 9 and is subdivided into four-time intervals.
In the first interval (0.1–0.2 s), the battery is initially discharged, so its operation condition is low (L) SoC, and the price is initialized at $8. So, the loads are off. Because the system is not connected to the grid, the energy is scarce, and the price remains stable at $6. The battery is charged, controlling the dc bus (mode −1). At $6, the PV system operates in MPPT mode.
In the second interval (1.9–2.05 s), the battery’s SoC becomes intermediate (M) at 1.95 s. Initially, the battery bank with intermediate SoC cannot control the dc bus voltage at $6. This transient event causes a variation in the dc bus that modifies the price. The new stable price becomes $4, and the batteries control the dc bus again. At this price, the Load HP is turned on. In the third time interval (5.85–5.95 s), the battery’s SoC becomes high (H), so the new stable price becomes $2, and the Load MP is turned on. Finally, the battery becomes fully charged (7.4–7.6 s). So, the excess energy makes the stable price become $0. The Load LP is turned on, and the PV generator controls the dc bus.
b. 
Scenario 2—Battery discharging on the off-grid operation
This result aims to demonstrate how price increases when the battery is discharged during a power outage. The Loads’ total power is 1500 W, and maximum PV power is close to zero, emulating system operation during the night when the ac grid is off. The result is shown in Figure 10 and is divided into four subintervals.
In the first interval (0.2–0.3 s), the price is initially $0, loads are disconnected, and the batteries are fully charged. Price increases after the user turn on the loads, and the battery starts to control the dc bus while discharging (+1).
In the second interval (1.45–1.55 s), the battery’s OC changes to intermediate (M). The price increases to $6 during the transient period due to the dc bus voltage variations and loads LP and MP are disconnected. In the third interval (24.95–24.15 s), the battery’s OC changes to low (L) and no longer control the dc bus during the transient. The price increases to $7 with the voltage variation. Finally, at (38–38.1 s), the battery is fully discharged, the price increases to $8, and the high priority load is turned off.
c. 
Scenario 3—System initialization on the on-grid operation
This scenario emulates the utility grid’s return after a power outage of a long duration occurring at night, in which the battery has been discharged. PV power is zero, the loads are off, and the grid’s OC is Normal (N). Figure 11 shows the experimental results.
The initial price is $8. At 0.051 s, the grid is connected, and dc bus voltage increases, reducing the price to $5. At this price, no power element regulates the dc bus. The dc bus voltage reduces because the battery charging power is higher than the dc-ac converter’s power that operates as a rectifier.
When the dc bus voltage crosses the first comparison voltage (vl1), the price increases to $6. The battery begins to regulate dc bus voltage while charging, ensuring power balance. It is important to notice that the final price would be different from $6 if the maximum dc-ac converter power is higher than the maximum battery power. In this case, the final price would be $3, which is the price that the dc-ac converter operates in mode 11, regulating the dc bus.
d. 
Scenario 4—Grid-tied operation with high SoC battery
This scenario shows how the internal price behaves when utility grid electricity OC changes. The batteries are fully charged, and PV power is 900 W. This result is shown in Figure 12 and is divided into two subintervals.
In the first interval (1.4–1.6 s), the price is initially $3, and the dc-ac converter regulates the dc bus. The utility electricity price is changed from Normal (N) to Expensive (E). At this moment, the dc-ac converter no longer controls the dc bus, and the bus voltage is reduced during the transient period. The stable internal price becomes $4. So, the batteries’ energy is injected into the utility grid. The battery regulates the dc bus because its power is higher than the maximum dc-ac converter power.
In the second interval (30–32.2 s), utility electricity price is changed from expensive to cheap. The new stable internal price becomes $1. The dc-ac converter starts to operate as a rectifier. The dc-ac converter regulates the dc bus because its maximum power summed with the PV power exceeds the battery charging power. Therefore, the power management finds a stable price to achieve power balance without having any information about elements’ power.

6. Comparison with Other DC Bus Signaling Strategies

Table 7 shows a comparison of four different DBS power management strategies considering the number of power elements, control, communication links, and modularity. Other approaches based on conventional droop controls and complex communication links are not considered to provide fair comparison criteria.
No communication link is required by Li et al. [21] due to a proposed dual window DBS. Therefore, a high-frequency disturbance is needed in the dc bus voltage. The droop control of [21] is associated with a master-slave strategy to reduce the voltage variations.
An off-grid PV system is evaluated by Schwertner et al. [29] to model an optimal state machine. This system includes a single load, a PV generator, and a battery bank. In this proposal, all possible operation modes are analyzed, considering different battery SoC conditions. The model reduces the state machine, which facilitates the implementation of power management. On the other hand, the optimal state machine of Schwertner el al. [29] requires a complex model, which becomes this proposal non-scalable to larger systems.
Bellinaso et al. [30] proposes the Price Response dc bus signaling (PBDBS), where the power converters operation modes are previously defined. The idea of PBDBS simplifies the operation modes definition. However, in PBDBS arbitrarily predefine the converters’ operation modes. As a result, it is impossible to extend this power management for other architectures since it did not provide any design methodology. Clearly, without a systematic approach, a new system’s design depends on the engineer’s experience and intuition for a practical application of the proposal presented by Bellinaso et al. [30].
This manuscript proposes a methodology for designing any system architecture, considering the priced-based power management method. The proposed approach is systematic, and a computational algorithm can automatically create the PRMs. It easily adapts the power management for larger systems that include different elements, which is not possible in references [29,30].
Compared to Li et al. [21], the state machine of Schwertner et al. [29] and the PBDBS [30] show an improved performance to control the dc bus voltage since only one element must control the bus. On the other hand, the proposed PRMs show similar results without complex models. This paper’s proposal demands little experience by the user or designer because the price-response matrices (PRMs) are automatically designed.
In the current paper, the prototype for testing the power management included a PV system, a battery bank, a dc-ac converter, and loads with different priority levels (high priority load, medium priority load, and low priority load). The computational algorithm for designing the power management, which is the main contribution of this manuscript, is fully provided in the Supplementary Material. Moreover, as previously shown, a user interface helps to define the maximum energy buying price and minimum energy selling price in the PRMs’ proposal.

7. Conclusions

The Price-Based Power Management strategy has been experimentally applied to a single PEI with three priority loads, battery energy storage, and a dc-ac converter connected to the ac grid. The experimental results showed a power balance without any knowledge of the power of each element. Even though this strategy is more sensitive to the dc bus voltage measurement, it is interesting because it demonstrates an alternative to the conventional droop controllers (decentralized) and state machines (centralized).
In the PBPM, the internal price stabilizes when a converter regulates the dc bus within its power limits. When a power disturbance occurs, this converter may saturate its power, so the stable internal price changes, and another converter starts regulating the dc bus.
This manuscript’s main contribution is a methodology to calculate the price response matrices (PRMs) of the Price-Based management applied to a dc system with DBS. A comparison with other DBS strategies showed advantages when considering system modularity and dc bus voltage regulation since no droop control is required. Without specialized knowledge, the user can set up a system with different loads or sources to automatically generate and implement the power management algorithm.

Supplementary Materials

The Price-based Power Management (PBPM) algorithm is fully provided in the Supplementary Material available at doi:10.5281/zenodo.4576565.

Author Contributions

Conceptualization, E.L.C. and L.V.B.; formal analysis, E.L.C., L.V.B., and R.C.; funding acquisition, L.M. investigation, E.L.C., L.V.B., and L.M.; methodology, E.L.C. and L.V.B.; resources, L.V.B. and L.M.; supervision, R.C. and L.M.; validation, L.V.B.; writing—original draft, E.L.C. and L.V.B.; writing—review & editing, E.L.C., L.V.B., R.C., and L.M. All authors have read and agreed to the published version of the manuscript.

Funding

This study was financed in part by the Coordenação de Aperfeiçoamento de Pessoal de Nível Superior—Brasil (CAPES)—Finance Code 001.

Institutional Review Board Statement

Not applicable.

Informed Consent Statement

Not applicable.

Data Availability Statement

Data is contained within the article or Supplementary Material.

Acknowledgments

The authors thank INCT-GD, CAPES, CNPq, and FAPERGS for the financial support received to develop this work. L. Michels was supported by a research grant of CNPq—Brasil. The present work was carried out with the support of the INCT-GD and the financing agencies (CNPq process 465640/2014-1, CAPES process No. 23038.000776/2017-54 and FAPERGS 17/2551-0000517-1) and CAPES-PROEX.

Conflicts of Interest

The authors declare no conflict of interest.

References

  1. Kitamura, N.; Tanaka, K. Conceptual Study for Open Energy Systems: Distributed Energy Network Using Interconnected DC Nanogrids. IEEE Trans. Smart Grid 2015, 6, 1621–1630. [Google Scholar]
  2. IEC Low-Voltage Electrical Installations—Part 8-3: Functional Aspects—Operation of Prosumer’s Electrical Installations, IEC Standard 60364-8-2. 2018.
  3. Dafalla, Y.; Liu, B.; Hahn, D.A.; Wu, H.; Ahmadi, R.; Bardas, A.G. Prosumer Nanogrids: A Cybersecurity Assessment. IEEE Access 2020, 8, 131150–131164. [Google Scholar] [CrossRef]
  4. Kumar, D.; Zare, F.; Gosh, A. DC Microgrid Technology: System Architectures, AC Grid Interfaces, Grounding Schemes, Power Quality, Communication Networks, Applications, and Standardizations Aspects. IEEE Access 2016, 5, 12230–12256. [Google Scholar] [CrossRef]
  5. Faisal, M.; Hannan, M.A.; Ker, P.J.; Hussain, A.; Mansor, M.B.; Blaabjerg, F. Review of Energy Storage System Technologies in Microgrid Applications: Issues and Challenges. IEEE Access 2018, 6, 35143–35164. [Google Scholar] [CrossRef]
  6. Han, Y.; Li, H.; Shen, P.; Coelho, E.A.A.; Guerrero, J.M. Review of Active and Reactive Power Sharing Strategies in Hierarchical Controlled Microgrids. IEEE Trans. Power Electron. 2017, 32, 2427–2451. [Google Scholar] [CrossRef] [Green Version]
  7. Nejabatkhah, F.; Li, Y.W.; Tian, H. Power Quality Control of Smart Hybrid AC/DC Microgrids: An Overview. IEEE Access 2019, 7, 52295–52318. [Google Scholar] [CrossRef]
  8. Meng, L.; Shafiee, Q.; Trecate, G.F.; Karimi, H.; Fulwani, D.; Lu, X.; Guerrero, J.M. Review on Control of DC Microgrids and Multiple Clusters. IEEE J. Emerg. Sel. Topics Power Electron. 2017, 5, 928–948. [Google Scholar]
  9. Dutta, S.; Chatterjee, K. An AC-DC Hybrid Nanogrid System for PV and Battery Storage Based Futuristic Buildings. IEEE J. Emerg. Selec. Topics Ind. Electron. 2021. [Google Scholar] [CrossRef]
  10. Roncero-Clemente, C.; Gonzalez-Romera, E.; Barrero-González, F.; Milanés-Montero, M.I.; Romero-Cadaval, E. Power-Flow-Based Secondary Control for Autonomous Droop-Controlled AC Nanogrids with Peer-to-Peer Energy Trading. IEEE Access 2021, 9, 22339–22350. [Google Scholar] [CrossRef]
  11. Kumar, S.; Krishnasamy, V.; Kaur, R.; Kandasamy, N.K. Virtual Energy Storage-Based Energy Management Algorithm for Optimally Sized DC Nanogrid. IEEE Syst. J. 2021. [Google Scholar] [CrossRef]
  12. Skouros, I.; Karlis, A. A Study on the V2G Technology Incorporation in a DC Nanogrid and on the Provision of Voltage Regulation to the Power Grid. Energies 2020, 13, 2655. [Google Scholar] [CrossRef]
  13. Vazquez, A.; Martin, K.; Arias, M.; Sebastian, J. On Bidirectional DC Nano-Grids: Design Considerations and an Architecture Proposal. Energies 2019, 12, 3715. [Google Scholar] [CrossRef] [Green Version]
  14. Garrido-Zafra, J.; Moreno-Munoz, A.; Gil-de-Castro, A.; Palacios-Garcia, E.J.; Moreno-Moreno, C.D.; Morales-Leal, T. A Novel Direct Load Control Testbed for Smart Appliances. Energies 2019, 12, 3336. [Google Scholar] [CrossRef] [Green Version]
  15. González-Romera, E.; Ruiz-Cortés, M.; Milanés-Montero, M.-I.; Barrero-González, F.; Romero-Cadaval, E.; Lopes, R.A.; Martins, J. Advantages of Minimizing Energy Exchange Instead of Energy Cost in Prosumer Microgrids. Energies 2019, 12, 719. [Google Scholar] [CrossRef] [Green Version]
  16. Arbab-Zavar, B.; Palacios-Garcia, E.J.; Vasquez, J.C.; Guerrero, J.M. Smart Inverters for Microgrid Applications: A Review. Energies 2019, 12, 840. [Google Scholar] [CrossRef] [Green Version]
  17. Nömm, J.; Rönnberg, S.K.; Bollen, M.H.J. An Analysis of Voltage Quality in a Nanogrid during Islanded Operation. Energies 2019, 12, 614. [Google Scholar] [CrossRef] [Green Version]
  18. Zamora, R.; Srivastava, A.K. Multi-Layer Architecture for Voltage and Frequency Control in Networked Microgrids. IEEE Trans. Smart Grids 2019, 9, 2076–2085. [Google Scholar] [CrossRef]
  19. Andreotti, A.; Caiazzo, B.; Petrillo, A.; Santini, S.; Vaccaro, A. Hierarchical Two-Layer Distributed Control Architecture for Voltage Regulation in Multiple Microgrids in the Presence of Time-Varying Delays. Energies 2020, 13, 6507. [Google Scholar] [CrossRef]
  20. Nasir, M.; Jin, Z.; Khan, H.A.; Zaffar, N.A.; Vasquez, J.C.; Guerrero, J.M. A Decentralized Control Architecture Applied to DC Nanogrid Clusters for Rural Electrification in Developing Regions. IEEE Trans. Power Electron. 2019, 34, 1773–1785. [Google Scholar] [CrossRef] [Green Version]
  21. Li, F.; Lin, Z.; Qian, Z.; Wu, J.; Jiang, W. A Dual-Window DC Bus Interacting Method for DC Microgrids Hierarchical Control Scheme. IEEE Trans. Sustain. Energy 2020, 11, 652–661. [Google Scholar] [CrossRef] [Green Version]
  22. Burmester, D.; Rayudu, R.; Seah, W.; Akyinyele, D. A Review of Nanogrid Topologies and Technologies. Renew. Sustain. Energy Rev. 2017, 67, 760–775. [Google Scholar] [CrossRef]
  23. Babazadeh-Dizaji, R.; Hamzeh, M. Distributed Hierarchical Control for Optimal Power Dispatch in Multiple DC Microgrids. IEEE Syst. J. 2020, 14, 1015–1023. [Google Scholar] [CrossRef]
  24. Salvati, G.A.; Carati, E.G.; Cardoso, R.; da Costa, J.P.; Stein, C.M.O. Electric Vehicles Energy Management with V2G/G2V Multifactor Optimization of Smart Grids. Energies 2020, 13, 1–22. [Google Scholar] [CrossRef] [Green Version]
  25. Magni, C.; Arteconi, A.; Kavvadias, K.; Quoilin, S. Modelling the Integration of Residential Heat Demand and Demand Response in Power Systems with High Shares of Renewables. Energies 2020, 13, 6628. [Google Scholar] [CrossRef]
  26. Kajanova, M.; Bracinik, P.; Roch, M. Utilization of finite state machine approach for microgrid modeling. Electr. Eng. 2020, 102, 53–63. [Google Scholar] [CrossRef]
  27. Kaviri, S.M.; Hajebrahimi, H.; Poorali, B.; Pahlevani, M.; Jain, P.K.; Bakhshai, A. A Supervisory Control System for Nanogrids Operating in the Stand-Alone Mode. IEEE Trans. Power Electron. 2021, 36, 2914–2931. [Google Scholar] [CrossRef]
  28. Dragičević, T.; Guerrero, J.M.; Vasquez, J.C.; Škrlec, D. Supervisory Control of an Adaptive-Droop Regulated DC Microgrid With Battery Management Capability. IEEE Trans. Power Electron. 2014, 29, 695–706. [Google Scholar] [CrossRef] [Green Version]
  29. Schwertner, C.D.; Bellinaso, L.V.; Hey, H.L.; Michels, L. Supervisory Control for Stand-Alone Photovoltaic Systems. In Proceedings of the IEEE 12th Brazilian Power Electronics Conference 2013, Gramado, Brazil, 27–31 October 2013. [Google Scholar]
  30. Bellinaso, L.V.; Schwertner, C.D.; Michels, L. Price-Based Power Management of off-grid Photovoltaic Systems with Centralised DC Bus. IET Renew. Power Gener. 2016, 10, 1132–1139. [Google Scholar] [CrossRef]
  31. Schonbergerschonberger, J.; Duke, R.; Round, S.D. DC-Bus Signaling: A Distributed Control Strategy for a Hybrid Renewable Nanogrid. IEEE Trans. Ind. Electron. 2006, 53, 1453–1460. [Google Scholar] [CrossRef]
  32. Fan, B.; Guo, S.; Peng, J.; Yang, Q.; Liu, W.; Liu, L. A Consensus-Based Algorithm for Power Sharing and Voltage Regulation in DC Microgrids. IEEE Trans. Ind. Inform. 2020, 16, 3987–3996. [Google Scholar] [CrossRef]
  33. Sun, K.; Zhang, L.; Xing, Y.; Guerrero, J.M. A Distributed Control Strategy Based on DC Bus Signaling for Modular Photovoltaic Generation Systems with Battery Energy Storage. IEEE Trans. Power Electron. 2011, 26, 3032–3045. [Google Scholar] [CrossRef] [Green Version]
  34. Wu, D.; Tang, F.; Dragicevic, T.; Guerrero, J.M.; Vasquez, J.C. Coordinated Control Based on Bus-Signaling and Virtual Inertia for Islanded DC Microgrids. IEEE Trans. Smart Grid 2015, 6, 2627–2638. [Google Scholar] [CrossRef] [Green Version]
  35. Nguyen, T.L.; Guerrero, J.M.; Griepentrog, G. A Self-Sustained and Flexible Control Strategy for Islanded DC Nanogrids Without Communication Links. IEEE J. Emerg. Sel. Top. Power Electron. 2020, 8, 877–892. [Google Scholar] [CrossRef]
  36. Sandgani, M.R.; Sirouspour, S. Energy Management in a Network of Grid-Connected Microgrids/Nanogrids Using Compromise Programing. IEEE Trans. Smart Grid 2018, 9, 2180–2191. [Google Scholar]
  37. Dehghanpour, K.; Nehrir, H. An Agent-Based Hierarchical Bargaining Framework for Power Management of Multiple Cooperative Microgrids. IEEE Trans. Smart Grid 2019, 10, 512–514. [Google Scholar] [CrossRef] [Green Version]
  38. Papari, B.; Edrigton, C.S.; Bhattacharya, I.; Radman, G. Effective Energy Management of Hybrid AC–DC Microgrids with Storage Devices. IEEE Trans. Smart Grid 2019, 10, 93–203. [Google Scholar] [CrossRef]
  39. Carvalho, E.L.; Meneghetti, L.H.; Carati, E.G.; Costa, J.P.D.; Stein, C.M.D.O.; Cardoso, R. Asymmetrical Pulse-Width Modulation Strategy for Current-Fed Dual Active Bridge Bidirectional Isolated Converter Applied to Energy Storage Systems. Energies 2020, 13, 3475. [Google Scholar] [CrossRef]
  40. Deotti, L.; Guedes, W.; Dias, B.; Soares, T. Technical and Economic Analysis of Battery Storage for Residential Solar Photovoltaic Systems in the Brazilian Regulatory Context. Energies 2020, 13, 6517. [Google Scholar] [CrossRef]
  41. Haroun, R.; El Aroudi, A.; Cid-Pastor, A.; Vidal-Idiarte, E.; Valderrama-Blavi, H.; Martinez-Salamero, L. Modelling and Control of Modular DC-Nanogrids Based on Loss-Free Resistors. IEEE Access 2020, 8, 33305–33317. [Google Scholar] [CrossRef]
  42. Yoomak, S.; Ngaopitakkul, A. Development of Sustainable Nanogrid Road Lighting Systems. IEEE Trans. Intell. Transp. Syst. 2021. [Google Scholar] [CrossRef]
Figure 1. The electrical energy management system of a single prosumer installation.
Energies 14 01787 g001
Figure 2. The dc bus voltage levels and price definition scheme.
Energies 14 01787 g002
Figure 3. Proposed Price-Based Power Management, in which the price is generated in the dc bus and communicated to all system elements.
Energies 14 01787 g003
Figure 4. Example of Price Response Matrices: (a) PV generator; (b) BEES with three SoC operation conditions.
Energies 14 01787 g004
Figure 5. Example of system parameterization for the price response matrices determination.
Energies 14 01787 g005
Figure 6. User parameterization for the price response matrices determination.
Energies 14 01787 g006
Figure 7. Resulted PRMs.
Energies 14 01787 g007
Figure 8. Power converters scheme for the proposed nanogrid.
Energies 14 01787 g008
Figure 9. Experimental result considering the process of battery charging: (a) dc bus voltage and internal price; (b) photovoltaic power and batteries SoC and power; (c) grid power; (d) ac loads voltage and current; (e) operation modes.
Energies 14 01787 g009
Figure 10. Complete discharge of batteries on off-grid mode. (a) dc bus voltage and internal price; (b) photovoltaic power and batteries SoC and power; (c) ac loads power; (d) grid voltage and current; (e) operation modes.
Energies 14 01787 g010
Figure 11. Initialization of on-grid mode with low energy available: (a) dc bus voltage and internal price; (b) photovoltaic power and batteries SoC and power; (c) grid power; (d) grid voltage and current; (e) operation modes.
Energies 14 01787 g011
Figure 12. Initialization of on-grid mode with low energy available: (a) dc bus voltage and internal price; (b) photovoltaic power and batteries SoC and power; (c) grid power; (d) grid voltage and current; (e) operation modes.
Energies 14 01787 g012
Table 1. Examples of power elements and their interactions with the nanogrid in the PBPM.
Power ElementPower FlowDCBVR TypeOperation Mode
LED lightingLoadNon-Regulator0 (off)/−2 (on)
Air conditionersLoadRegulator0 (off)/−1 (DCBVR)/−2(NC *)
Electronic loads (TV sets, modems, computers, etc.)LoadNon-Regulator0 (off)/−2 (on)
PV GeneratorSourceRegulator0 (off)/+1 (DCBVR) +2 (MPPT)
Battery bankBidirectionalRegulator−2 (Charging NC)/−1 (DCBVR)/0 (off)/+1 (DCBVR) +2 (Discharging NC)
Utility grid (dc-ac converter)BidirectionalRegulator−2 (Inverter NC)/−1 (DCBVR)/0 (off)/+1 (DCBVR) +2 (Rectifier NC)
SupercapacitorBidirectionalNon-Regulator0 (off)/+2 (on)
Diesel generatorSourceRegulator0 (off)/+1 (DCBVR)/+2(NC)
* NC: nominal condition.
Table 2. The number assigned within PRMs rows.
Price Related to PRM ColumnBuyingSelling
<TPbTPb≥TPb≤TPsTPs>TPs
RegulatorLoad−2−10---
Source---0+1+2
Bidirectional−2−100+1+2
Bidirectional
(TPb = TPs)
−211111111+2
Non-RegulatorLoad−2−800--
Source--00+8+8
Bidirectional−8000+8+8
Bidirectional
(TPb = TPs)
−80000+8
Table 3. Elements connected to the nanogrid.
Power ElementPower FlowDCBVR Type *Number of OCs
(1) Utility GridBidirectionalRegulator3
(2) PV GeneratorSourceRegulator1
(3) Load LPLoadNon-Regulator1
(4) Load MPLoadNon-Regulator1
(5) Load HPLoadNon-Regulator1
(6) BatteriesBidirectionalRegulator3
* DCBVR: dc bus voltage regulation.
Table 4. Experimental setup parameters.
ParameterDescriptionValue
dc bus
Cdcdc bus capacitance2.5 mF
vdc*dc bus voltage reference400 V
fsSwitching frequency of all power converters24 kHz
PV converter parameters
PpvPV maximum power1.5 kW
ipv,maxPV maximum current8 A
CpvPV converter input capacitor100 µF
LpvPV converter inductor1.5 mH
Bidirectional dc-dc converter
PbatBattery bank nominal power1.5 kW
ibatBattery nominal current8 A
vbatBattery bank nominal voltage190 V
Lb1Bidirectional converter inductor1.5 mH
Lb2Bidirectional converter inductor15 µH
CbBidirectional converter capacitor100 µF
dc-ac converter parameters
Pacdc-ac converter nominal power2.0 kW
vgdc-ac converter output voltage220 Vrms
fgac grid frequency60 Hz
Li1dc-ac converter inductor400 µH
Li2dc-ac converter inductor15 µH
Cidc-ac converter capacitor5 µF
Loads
HPHigh priority load300 W
MPMedium priority load600 W
LPLow priority load600 W
Table 5. Nanogrid control design specifications.
ParameterDescriptionValue
fsvSample frequency of voltage loops2.4 kHz
fsiSample frequency of current loops24 kHz
fmpptSample frequency of MPPT2.4 Hz
fcvCut-off frequency of voltage loops24 Hz
fciCut-off frequency of current loops240 Hz
PMMinimum phase margin of controllers80°
Table 6. Comparison voltages to dc bus signaling.
High comparisonvh1vh2vh3vh4vh5vh6vh7vh8
Voltage (V)420430439448457466475484
Low comparisonvl1vl2vl3vl4vl5vl6vl7vl8
Voltage (V)380370359348337326314302
Table 7. Comparison of different DBS power managements and the proposed PRMs.
ParametersPrice Based DBS [30]Hierarchical Droop Contol [21]Optimal State Machine [29]Proposed PRMs
Compassion voltages levels84816
DCBVR *High performanceLow performanceHigh performanceHigh performance
Number of power elements4 (only off-grid operation)44 (only off-grid operation)6
Control specificationsNeeds an accurate and fast voltage detectionResults in high-frequency variation in the dc bus voltageAn off-line optimization is needed to reduce the state machineOnly the user preferences are needed to design the PRMs
Communication linksHigh bandwidth-High bandwidthHigh bandwidth
Transmitted variablesOnly the internal price-vdc and converter power levelsOnly the internal price
Degrees of modularityIntermediate (no methodology to define the operation modes)Intermediate (master-slave control is needed)Low (the system must be redesign to add new power elements)High (only the PRMs must be increases to add new elements)
* dc bus voltage regulation.
Publisher’s Note: MDPI stays neutral with regard to jurisdictional claims in published maps and institutional affiliations.

