Article

The Degradation Behavior of LiFePO4/C Batteries during Long-Term Calendar Aging

1
Department of Energy Technology, Aalborg University, 9220 Aalborg, Denmark
2
Lithium Balance A/S, 2765 Smørum, Denmark
*
Author to whom correspondence should be addressed.
Energies 2021, 14(6), 1732; https://doi.org/10.3390/en14061732
Submission received: 21 January 2021 / Revised: 23 February 2021 / Accepted: 16 March 2021 / Published: 20 March 2021
(This article belongs to the Special Issue Testing and Management of Lithium-Ion Batteries)

Abstract

:
With widespread applications for lithium-ion batteries in energy storage systems, the performance degradation of the battery attracts more and more attention. Understanding the battery’s long-term aging characteristics is essential for the extension of the service lifetime of the battery and the safe operation of the system. In this paper, lithium iron phosphate (LiFePO4) batteries were subjected to long-term (i.e., 27–43 months) calendar aging under consideration of three stress factors (i.e., time, temperature and state-of-charge (SOC) level) impact. By means of capacity measurements and resistance calculation, the battery’s long-term degradation behaviors were tracked over time. Battery aging models were established by a simple but accurate two-step nonlinear regression approach. Based on the established model, the effect of the aging temperature and SOC level on the long-term capacity fade and internal resistance increase of the battery is analyzed. Furthermore, the storage life of the battery with respect to different stress factors is predicted. The analysis results can hopefully provide suggestions for optimizing the storage condition, thereby prolonging the lifetime of batteries.

1. Introduction

Lithium-ion (Li-ion) batteries are electrochemical energy storage devices that work based on the intercalation/deintercalation process. Over the past three decades, Li-ion batteries have become an integral part of daily routines, and nowadays, they show the highest growth and the major proportion of investments in the battery market in a world still dominated by lead-acid batteries [1]. Due to their high power and energy density, their high energy efficiency, and also their relatively long cycle life, Li-ion batteries play an important role in a wide range of applications from powering portable electronic devices to more advanced applications (e.g., electric vehicles, grid storage and satellites) [2]. However, the batteries’ performance is subject to degradation (i.e., capacity fade and power decrease) during long-term operation [3]. Because the lithium ions intercalate in the layered structure of the anode (i.e., graphite) and deintercalate from the cathode’s (i.e., LiFePO4) active material when in the charging and discharging processes of the battery, the amount of active materials and available lithium ions will determine the battery capacity directly. Therefore, according to the research, the degradation modes of the battery can be summarized as the loss of lithium-ion inventory (LII) and loss of anode/cathode active materials (LAM) [4,5,6]. Those degradation modes are caused by some complicated and coupled physical and/or chemical side reactions inside of the battery, such as graphite exfoliation, loss of electrolytes, solid electrolyte interface (SEI) film formation and continuous thickening, lithium plating, etc. [4]. As a result, at the macroscopic level, the aging of the battery is most intuitively manifested in two aspects: capacity fade and power decrease [7]. Due to the difficulty in studying power fade, the internal resistance is usually investigated by many researchers [6,8].
Generally, depending on different modes of operation, battery aging in real life applications is composed of cyclic and calendar aging. The aging during cycling of the Li-ion batteries is assigned to the kinetic induced effects [7]. As observed during the cycling process of the Li-ion battery, the degradation of active materials, reversibility at the cathode side and lithium plating at the anode are the main aging mechanisms [9]. On the contrary, all the aging processes comprised in calendar aging that cause degradation are independent of cycling operation. The parasitic side reactions at the electrode-electrolyte interfaces are considered to be the predominant degradation processes, which lead to electrolyte reduction at the negative electrode and electrolyte oxidation at the positive electrode [9]. In many applications of Li-ion batteries where the operation periods are substantially shorter than the idle intervals, calendar aging could be the main contributor to battery degradation. For example, laptops are only used at most 50% of the time, while for the electric vehicles, more than 90% of the time is spent parking [10]. Furthermore, battery degradation due to calendar aging can also be predominant under cycling conditions, especially when cycle depths and current rates are relatively low [11]. That is because in such cases, the main aging mechanism is considered to be the formation and growth of the SEI interface, while the typical cycling aging mechanisms such as lithium plating or particle cracking can be neglected [9]. Also, in order to separate usage-dependent and usage-independent aging, it is necessary to study degradation behavior in calendar aging individually and establish corresponding models.
Various lifetime models have been widely proposed in the literature with varying levels of complexity, accuracy and representativeness of the internal physics and chemical processes in the battery [12,13]. These aging models can be grouped into three main approaches: the pure-lifetime, the physics-based, and the mathematical models. The pure-lifetime models simply count the amount of charge (Ah-throughput), or energy (Wh-throughput) passed through the battery and compare these values to a predefined (Ah/Wh-throughput) value that the battery cell can withstand until the end-of-lifetime (EOL) criterion is reached. This approach has high computational speed but provides information only about the remaining useful lifetime (RUL) of the batteries without information about the degradation of the performance parameters [14]. Some physics-based models such as the electrochemical model, empirical model and equivalent electrical circuit model (EECM) have been proposed to explain battery calendar aging behaviors [15,16,17,18,19,20,21,22,23,24]. Electrochemical models that include aging mechanisms provide a good mathematical representation of the internal variables of the battery, such as the thickness and conductivity of the SEI [15]. This method has good flexibility because it does not depend on the type of aging test. However, the detailed mathematical representation implies increased levels of complexity and computational cost [12]. Instead, purely empirical models can be parameterized without knowledge of internal cell setup through extensive testing. Curve fitting based on the tested aging data is a commonly used method, and many studies suggest that calendar aging fade follows a power law with time [10,16,17]. By considering the Arrhenius law [18], the Eyring law [19] or the initial SEI growth caused by cell formation [20], semi-empirical modes are proposed for analyzing the effect of stress factors (e.g., temperature and state of charge (SOC)) on the degradation behavior of Li-ion batteries. The EECM-based lifetime models are obtained by adding the “aging-dimension” to EEC-based performance models. Thus, the values of the parameters of the EECM are updated during the aging process [21]. With the development of intelligent techniques, mathematical models are gaining increasing attention in the battery lifetime diagnosis. For example, fuzzy entropy of the voltage response is proposed as an effective health indicator, and the support vector machine is used to track the battery capacity in different aging temperature conditions. In [23], a Gaussian process regression-based framework was proposed to effectively capture the underlying mapping among future capacities and key influential factors during storage.
Because the 20% capacity fade and/or 100% internal resistance increase are considered to be the EOL criterion which are widely accepted, almost all of the tests performed in the aforementioned literature are carried out within this battery life span. There are few studies on aging behavior outside this range. Thus, this paper conducted an accelerated calendar aging test on a commercial lithium iron phosphate (LiFePO4) battery over at least 27 months. By considering the storage temperature and SOC level as the stress factors, an aging test matrix was designed such that the tested batteries were subjected to the aging test under five different conditions. Based on the aging results, the impact of storage temperature and SOC level on the long-term performance degradation behavior of fifteen LiFePO4 battery cells was analyzed. Next, a two-step nonlinear regression method is proposed for the accurate modeling of the battery cells’ capacity fade and internal resistance behavior. Subsequently, the established performance degradation models can be generalized to predict the performance degradation of a battery subjected to different storage conditions. Finally, the storage lifetime of the battery with respect to the different stress factors is predicted.
The reminder of the paper is organized as follows: An overview of the experimental setup is introduced in Section 2. In Section 3, the experimental results, including the long-term degradation behavior of capacity fade and of internal resistance, are then presented, followed by the respective aging model. Section 4 gives the conclusion of this work.

2. Experimental Setup

2.1. LiFePO4/C under Test

In this work, 15 high-power, cylindrical LiFePO4/C (with LiFePO4 and graphite as positive and negative active materials, respectively) battery cells were used. The main parameters of the cells are summarized in Table 1.

2.2. Calendar Aging Test

The calendar degradation of Li-ion batteries is influenced by the storage time, SOC, and temperature. Therefore, all these stress factors were considered when the calendar aging tests were designed. Furthermore, as it is well known, the values of the stress factors have a non-linear effect on the degradation of the performance parameters of Li-ion batteries. Consequently, when designing a test matrix, at least three stress levels should be considered for each stress factor. In this work, we considered three stress levels for both the SOC (i.e., 10%, 50% and 90%) and temperature (i.e., 40 °C, 47.5 °C and 55 °C), as illustrated in Figure 1. Because the expected lifetime of the tested LiFePO4/C battery cells is in the range of years, elevated temperatures were considered in order to reduce the time in which the degradation behavior was obtained. Finally, to obtain statistical relevance and reduce the influence of possible outliers, three LiFePO4/C battery cells were tested at all five aging conditions presented in Figure 1.
The calendar aging tests were performed for a period of 43 months for Case 1, Case 2, and Case 3 and 27 months for Case 4 and Case 5. Thus, this long-term testing period allowed us to also observe the degradation behavior of battery performance parameters (i.e., capacity, internal resistance, self-discharge) after the battery cells have reached 20% capacity fade, which is traditionally considered as the EOL criterion.

2.3. Reference Measurements

In order to quantify the incremental degradation of the performance parameters of the LiFePO4/C battery cells, the calendar aging tests were stopped after every 30 days and reference measurements were performed at different conditions, as illustrated in Figure 2. During the reference measurements, the capacity, internal resistance and the small-signal AC impedance were measured at 25 °C. The capacity of the cells was measured at 2.5 A (1C-rate) and 10 A (4C-rate) following a constant current procedure during charging and constant current during discharging. The internal resistance of the battery was measured using the current pulse train profile, presented in Figure 3, which was applied at 20%, 50%, and 80% SOC. Furthermore, during the last step of the reference measurements, the cells were charged to the SOC levels mentioned in Figure 1, recording the number of charged Ah. Then, after 30 days of calendar aging, during the first step of the reference measurements, the cells were fully discharged, recording the number of discharged Ah. Thus, the self-discharge of the battery cells at different calendar aging conditions was also analyzed. An exemplification of the current and voltage profiles of the LiFePO4/C cells during the reference measurements is presented in Figure 4.

3. Calendar Aging Modeling

As described in Section 2.2, in addition to the storage time, the temperature and SOC were considered as stress factors for the calendar aging tests. In this section, the obtained calendar aging results are analyzed and the effects of storage time, SOC and temperature on the degradation of the LiFePO4/C battery cells’ performance are quantified. Generally, the health state of the battery cell could be measured by the capacity fade or the internal resistance increase. Subsequently, lifetime models that could estimate the capacity fade and the internal resistance increases were developed.

3.1. The Degradation Behavior of the Capacity

3.1.1. The Capacity Fade

The capacity of the LiFePO4/C battery cells was measured during the reference measurements for both charging and discharging conditions with 1C-rate and 4C-rate; nevertheless, in this work, for analyzing the degradation behavior of this parameter, only the measurements carried out during discharging with 1C-rate current (2.5 A) were considered. Based on the obtained capacity values after each one-month aging, the decrease of capacity can be calculated as
C f a d e = C p r e s e n t C i n i C i n i × 100 %
where Cfade represents the capacity fade of the battery cell and Cini and Cpresent represent the capacity value at the beginning of life and after each reference measurement, respectively. The capacity fade behavior of the LiFePO4 cells obtained for all the considered calendar aging conditions is presented in Figure 5a. As previously mentioned, three cells were tested at each of the five idling conditions mentioned in Section 2.2. Thus, the results presented in this section (see Figure 5a) were obtained by choosing the median value of three batteries. The capacity fade standard deviation was used to measure the variability across the capacity fade data between cells, and the standard deviation was expressed using (2). It can be seen from Figure 5b that, for each case, as the aging process advanced, σ tended to increase and eventually became constant. A similar trend was presented for NMC-based Li-ion cells by Baumhöfer et al. in [25]. This behavior was attributed to the inherent tolerances during the manufacturing process; nevertheless, in the case of the tested LiFePO4 battery cells, a maximum standard deviation of 2% was observed, which indicated a good consistency between cells.
σ = ( X μ ) 2 N
where σ is the capacity fade standard deviation, is the sum, X is the capacity fade value of each battery cell, µ is the mean of all capacity fade values, N is the number of values in the data set (i.e., N = 3).
It has been observed that knee points occur under cycling aging conditions and can appear before or after the pre-defined EOL criterion is reached. A knee point is usually related to the change in the dominant aging mechanism and marks an abrupt capacity fade trend such that the battery cell will experience a sudden drop near the EOL [5,26,27]. However, the degradation behavior in calendar aging is different from that in cyclic progress, and knee points do not appear [24]. It can be seen from Figure 5 that the capacity faded steadily during long-term calendar aging, even in the case of the cells aged under Case 1 and Case 2 conditions, which reached 50% and 35% capacity fade, respectively. Furthermore, it can be seen that the degradation of battery cells tended to slow down while the aging process advanced. That is because calendar aging is mainly caused by the growth of the SEI at the anode over the life of the battery [9]. With increasing thickness of the lithium trapping layer and thus capacity loss, the growth decreases due to self-inhibited slowdown of the reaction.

3.1.2. Modeling of the Capacity Fade

In order to analyze the capacity fade behavior of the tested LiFePO4/C battery cells, a two-step nonlinear regression method was followed. In the first step, the dependence of the capacity fade on the storage time for each considered test condition was modeled, while in the second step, the dependence of the capacity fade on the storage temperature and SOC level was obtained. Figure 6 shows the structure of nonlinear regression for battery capacity fade modeling. For a set of N battery capacity fade data pairs DN = {(ti, yi), i = 1, 2,…, N}, the vector ω of the parameter can be optimized by the nonlinear least squares method such that the regression function f(t, w) best fits the given data. The goal is to minimize the sum of squared errors between the model and the output as follows:
E w = i = 1 N ( y i y ^ i ) 2
where yi and y ^ i are the real and the estimated capacity fade values, respectively. When minimizing Equation (3), the weights are optimized by solving the following equations:
E w w j = 0 ,   j = 0 , 1 , , d
where w j is the estimated value of j-th weight. Then, the gradient descent method can be used to update the parameters iteratively using the direction of the gradients seen in (4) as follows:
w j = w j α E w w j ,   j = 0 , 1 , , d
where w j is initialized randomly, and α is called the learning rate. Equation (5) is repeatedly updated until E w converges to the desired local minimum. Finally, the quality of the fitting is evaluated using the coefficient of determination R2, which is calculated as given in (6), and a R2 value closer to 1 indicates a better fit.
R 2 = 1 S S r e s S S t o t = i = 1 n ( y i y ^ i ) 2 i = 1 n ( y i y ¯ i ) 2
where SSres is the sum of squares of residuals that describes the deviation between the measured points y i and fitted curve y ^ i , SStot is the total sum of squares that describes the deviation between the measured points y i and their average value y ¯ i .
In the first step of battery degradation modeling, the relationship between the capacity fade and the storage time for each aging case was established. Different functions were compared and evaluated for selecting the best fitting results. The fitting results of four types of functions are presented in Figure 7, and the corresponding accuracy values are summarized in Table 2. It can be seen that the best fitting accuracies come from the power function. By fixing the constant term c in the power function, the number of free parameters was reduced while the accuracy decreased marginally from 0.9980 to 0.9974. Taking into account the trade-off between the fitting accuracy and the model complexity, the power function with a fixed constant term was selected, and it was expressed as (7). It should be noted that when a constant term is added, an initial error (i.e., 0.7%) will be introduced into the model. However, the model (i.e., the read curve) converged to the real capacity fade value in the first month. Because the initial error was small and the overall performance of the model should be prioritized, the initial error could be ignored.
C f a d e ( t ) = a × t b + 0.7
In the second step, the dependences of the capacity fade on the storage temperature and SOC level were considered separately. For the aging tests Case 1, Case 2 and Case 3, the SOC level was fixed to 50%, and the storage temperature varied from 55 to 40 °C. Next, the influence of storage temperature and storage time on capacity fade could be determined, and the fitting function has the form of (8).
C f a d e ( t ) = a T × t b T + 0.7
The measured and the fitted capacity fade characteristics for the LiFePO4/C battery cells from these three cases are shown in Figure 8. Table 3 lists the obtained coefficients for each case, and it can be seen that both parameters aT and bT change with temperature. During long-term calendar aging, higher storage temperature led to a higher rate of capacity fade. The coefficient bT less than 1 also accorded with the aging characteristics of the battery, i.e., the rate of capacity fade decreases with time. As mentioned in the Introduction, the degradation of the battery is attributed to LII and LAM [6,28]. The formation and continuous thickening of the SEI film on the surface of the graphite anode is one of the main reasons for the LII. Furthermore, the LAM may be caused by electrolyte decomposition, graphite exfoliation or metal dissolution, etc. The reason for the aforementioned aging trend is that the growth of the SEI film is accelerated by increasing the temperature. However, the thickening of the SEI film will, in turn, prevent side reactions inside the battery, thereby leading to a lower aging rate of the battery.
In order to determine the dependence of the obtained coefficients on the storage temperature, a second round of curve fitting was required. The exponential function and the power function given in (9) and (10), respectively, were selected to describe the relationship between the aforementioned coefficients and the considered storage temperature values. The results of the second round of curve fitting are shown in Figure 9.
a T = 0.005768 × e 0.1099 × T
b T = 3.866 × 10 13 × T 6.635 + 0.9485
By combining the power function (8), which describes the dependence of the capacity fade on the storage time, with Equations (9) and (10), which describe the dependence of the capacity fade on the storage temperature, a general model that is able to predict the capacity fade during storage at SOC = 50% and different temperatures (mainly, higher than 25 °C) was obtained:
C f a d e ( t , T ) = 0.005768 × e 0.1099 × T × t 3.866 × 10 13 × T 6.635 + 0.9485 + 0.7
where t represents the storage time, expressed in months, and T represents the storage temperature, expressed in degrees Celsius.
A similar procedure was applied to model the dependence of the capacity fade on the SOC level at which the battery cells were stored. The first step in the two-step curve fitting was to find the dependence of the capacity fade on the storage time. Using the capacity fade data from Case 1, Case 4, and Case 5, the coefficients in the power function (12) were determined.
C f a d e ( t , SOC ) = a SOC × t b SOC + 0.7
The measured and the fitted capacity fade characteristics for the LiFePO4/C battery cells stored at 55 °C and three different SOC levels (i.e., 10%, 50% and 90%) are shown in Figure 10. Correspondingly, the coefficients for each case are listed in Table 4. It can be seen that the influence of the SOC level during storage was different at different time ranges. Before the battery cells reached the EOL (i.e., 20% capacity fade), higher SOC was also accompanied by a higher rate of capacity fade. The reason is similar to the effect of temperature. A higher SOC will accelerate the side reaction, causing the decomposition of the electrolyte and the increase of the SEI film. In addition, at higher SOC levels where the graphite anode is lithiated more than 50%, the low anode potential accelerates the loss of lithium ions [6,28]. On the contrary, from the perspective of very long-term aging (i.e., capacity fade higher than 20%), an SOC level in the mid-SOC range (i.e., around 50% SOC) will speed up the degradation rate of the battery. This may be because a SEI film with high stability is formed, which effectively prolongs the battery life stored at 90% SOC level [1].
According to the obtained results, the relationship between the coefficients and SOC level was developed in the second round of curving fitting. As shown in Figure 11, the coefficients aSOC and bSOC varied as an exponential function and a power function of the SOC level, respectively.
a SOC = 1.087 × e 0.0169 × SOC
b SOC = 4.853 × 10 12 × SOC 5.508 + 0.823
By combining (12)–(14), a general model that was able to predict the capacity fade during storage at 25 °C and different SOC levels was obtained:
C f a d e ( t , SOC ) = 1.087 · e 0.0169 · SOC · t 4.853 · 10 12 · SOC 5.508 + 0.823 + 0.7
where t represents the storage time expressed in months, and SOC represents the storage SOC level, expressed as a percentage.
As described until this point, the dependences of the capacity fade on the storage temperature and on the storage SOC level were fitted separately. In order to obtain a function which connected both contributions into a single figure of merit, a scaling of the two functions was used. Because possible interactions between the two stress factors were neglected, the scaling process was considered accurate enough. Consequently, the developed model, which is able to predict the calendar lifetime in terms of capacity fade, is given as
C f a d e ( t , T , SOC ) = 0.0025 × e 0.1099 × T × e 0.0169 × SOC × t ( 3.866 × 10 13 × T 6.635 4.853 × 10 12 × SOC 5.508 + 0.9595 ) + 0.7
As shown in Figure 12, the SOC levels at both ends (smaller than 20% SOC or larger than 80% SOC) and cooler temperatures preserved the Li-ion battery when not in use. The tested battery cells would be able to withstand approximately 45.1 years if stored at 10% SOC and 25 °C until they reached the EOL criterion. However, the lifetime will decrease dramatically to 23.8 years if the cells are stored at 50% SOC and 25 °C or to 8.7 years if the storage temperature is 40 °C.

3.2. The Increasing Behavior of the Internal Resistance

3.2.1. The Internal Resistance Ri Increase

As illustrated in Section 2.3, a set of 18 s current pulses at three SOC levels (i.e., 20% SOC, 50% SOC and 80% SOC) were applied to the battery. Based on the analysis in [27], a more effective state of the health indicator will be obtained when the SOC enters into the polarization zone (SOC larger than 0.8 or smaller than 20%). Hence, in this work, a discharge pulse at 80% SOC with an amplitude of 10 A (i.e., 4C-rate) was considered for calculating the internal resistance Ri. The effect of calendar aging on the voltage drop of the LiFePO4/C battery cells during the Ri measurements at different moments is presented in Figure 13. On the basis of measured voltage and current profiles, the Ri of the LiFePO4/C battery cells was calculated for the five considered aging cases as
R i = Δ V Δ I = V 0 s V 18 s I
where V0s is the voltage before applying the current pulse, V18s represents the voltage at the end of 18s pulse and I is the amplitude of the current. As the increase of Ri is an important parameter to quantify the degradation behavior of LiFePO4/C battery cells, it is calculated as
R i _ i n c r e a s e = R i _ p r e s e n t R i _ i n i R i _ i n i × 100 %
where Ri_increase represents the increase of the resistance and Ri_ini and Ri_now represent the resistance of the battery cell at the beginning of life and after each reference measurement, respectively.
The presented procedure was used to determine the discharging Ri and its aging behavior under the considered accelerated aging conditions, which are summarized in Figure 1. The discharge Ri values during the consecutive reference measurements throughout the accelerated calendar aging test are presented in Figure 14, and the median values are further used to analyze the aging behavior of Ri. As seen in Figure 14a, for Case 4 and Case 5, the consistency between the tested three battery cells was good. However, for the other three cases, the resistance increase between cells showed an obvious inconsistency at some points. In order to reduce the effect of inconsistency between cells on model accuracy, the median value of Ri was obtained for each calendar test condition.
As can be seen from Figure 5 and Figure 14, the internal resistances of the LiFePO4/C battery cells increased slowly relative to the rate of the capacity fade. Taking Case 4 (i.e., T = 55 °C, SOC = 50%) as an example, the LiFePO4/C battery cells reached 20% capacity fade after 27 months of aging. At that time, the battery cells were considered to reach their EOL criterion. However, it should be stressed that for the same aging condition, there was only a 40% Ri increase. Moreover, the Ri increase characteristics were similar to the capacity fade. On one hand, the Ri increased steadily during the lifetime of LiFePO4/C cells, and on the other hand, the rate of the increase tended to slow down as the aging time increased.

3.2.2. Modeling of Ri Increase

In this subsection, the dependence of the discharge Ri increase on the storage time, temperature and SOC level was analyzed for the values measured during the reference measurement at 80% SOC with a 4C-rate discharge pulse. The two-step fitting procedure was used as well for analyzing the aging behaviors of the LiFePO4/C cells in terms of the Ri increase. Thus, the dependence of the Ri increase on the storage time for each considered test condition was studied in the first step, while in the second step, the dependence on the storage temperature and SOC level was investigated. The power function, defined in (19), was used to fit with high accuracy the measured increase of Ri over the storage time.
R i ( t , T ) = p × t q
where p and q represent the coefficients of the power function, and t is the storage time, expressed in months.
The effects of the two stress factors on the Ri increase were considered separately in the second step. The influence of the storage temperature could be determined based on the aging tests of Case 1, Case 2, and Case 3. For these cases, the storage temperature varied from 55 °C to 40 °C, and the SOC level was fixed to 50%. Then, the fitting function has the form of
R i ( t , T ) = p T × t q T
Since the difference between the coefficients qT obtained by fitting was very small, in order to reduce the complexity of the model, the same qT value of 0.75 was selected at different temperatures. 
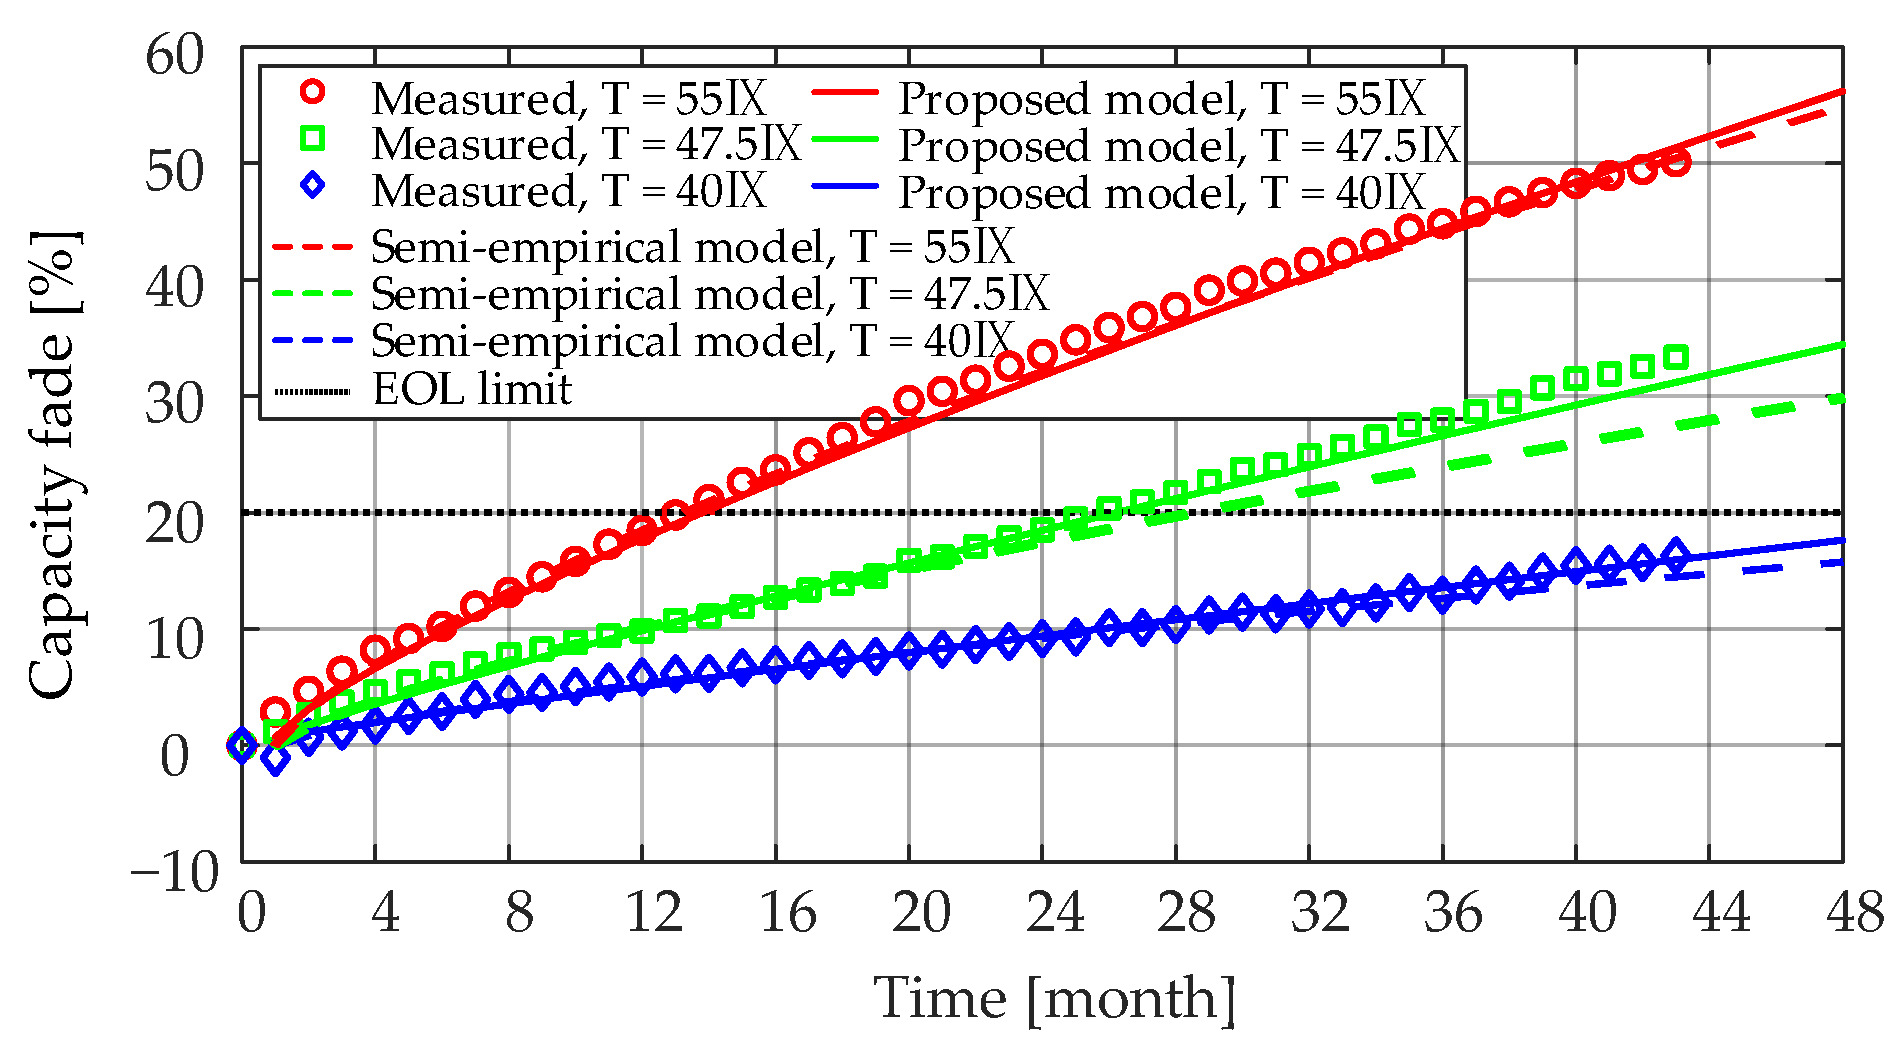
Figure 15 presents the measured and the fitted Ri increase characteristics for the LiFePO4/C battery cells that were aged at 50% SOC and three different temperatures (i.e., 55 °C, 47.5 °C, and 40 °C). The obtained coefficients for each case are listed in Table 5. As can be seen from the results, the lower the storage temperature, the lower the rate of Ri increase during the long-term calendar aging. This was due to the relatively lower rate of SEI formation and continued thickening at low SOC levels [6].
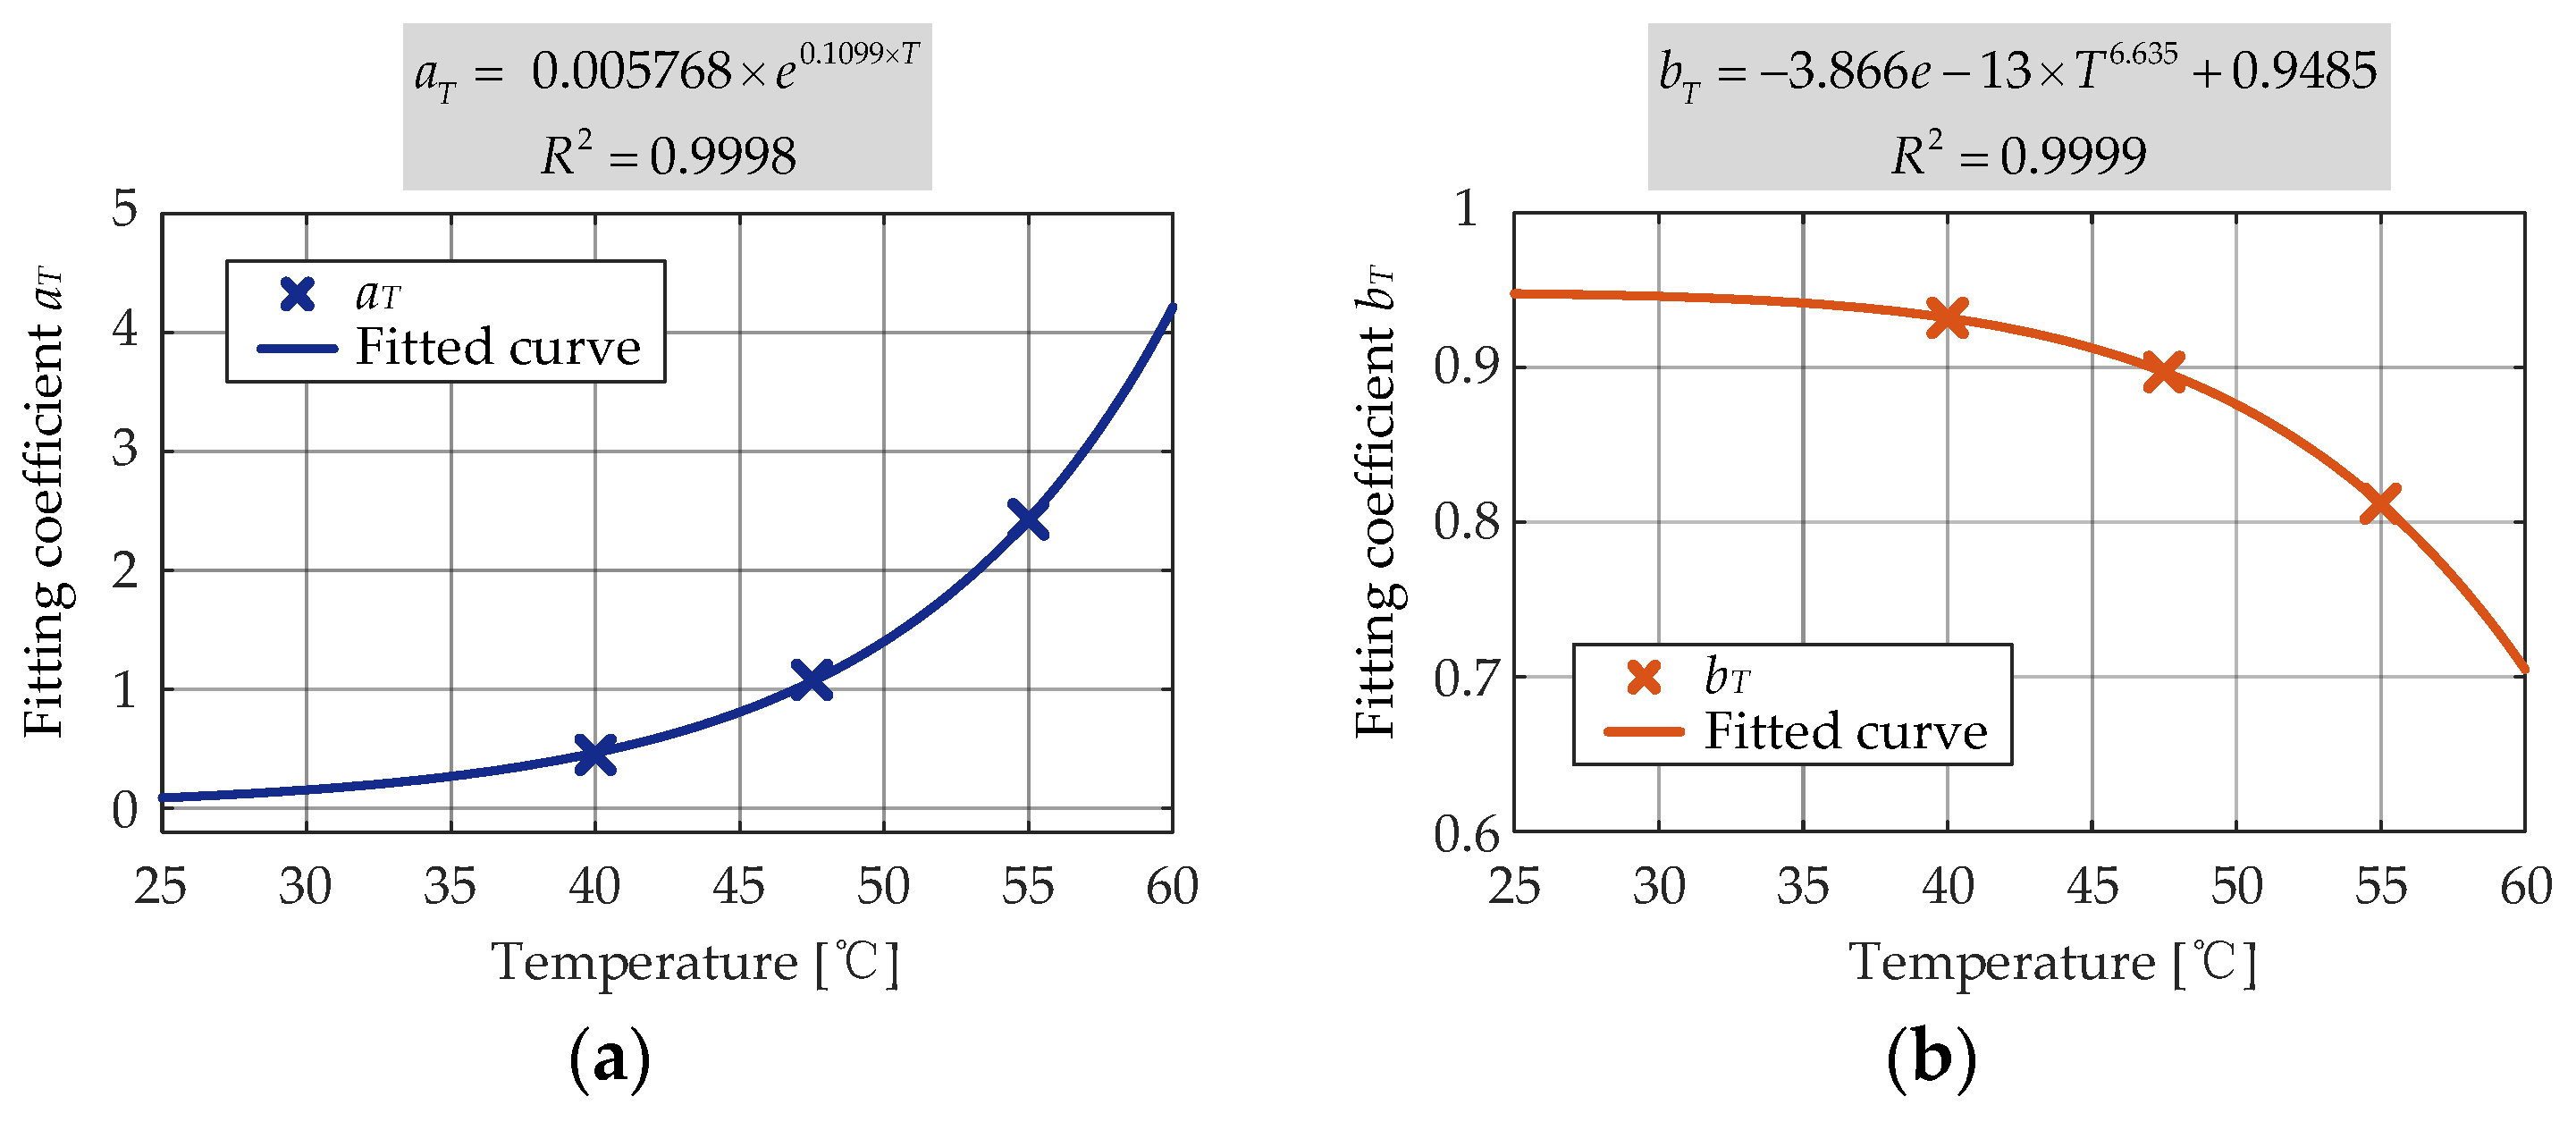
The second round of nonlinear regression was conducted to determine the dependence of pT on the storage temperature. The exponential function given in (18) was found to be accurately correlated (R2 = 0.9999) to the pT obtained during the first-round fitting and the storage temperature, and the second-round curve fitting result is shown in Figure 16.
p T = 0.1913 × e 0.05168 × T + 1.347
By combining (20) and (21), a model which is able to predict the Ri increase during storage at SOC = 50% and various temperatures (mainly, higher than 25 °C) was obtained:
R i _ i n c r e a s e ( t , T ) = p T × t 0.75 = ( 0.1913 × e 0.05168 × T + 1.347 ) × t 0.75
where t represents the storage time, expressed in months, and T represents the storage temperature, expressed in degrees Celsius.
Similarly, the dependence of the Ri increase on the SOC level at which the battery cells were stored could be modeled based on a two-step nonlinear regression procedure. First, Case 1, Case 4, and Case 5 were considered, and the objective function had the form of (23).
R i ( t , SOC ) = p SOC × t q SOC
Next, the coefficients could be determined, which are shown in Table 6. The measured and the fitted Ri increase characteristics for the LiFePO4/C battery cells stored at 55 °C and three different SOC levels (i.e., 20%, 50% and 90%) are shown in Figure 17. The effect of the storage SOC level on the Ri increase showed a staging behavior before Ri of the LiFePO4/C cells reached a 100% increase, and the doubled Ri was usually seen as another EOL criterion. In the first stage, when the increase of Ri is less than 30%, a higher storage SOC level made Ri increase faster. Moreover, in the second stage (i.e., the Ri increased by more than 30%), Ri increased more when the battery was stored in the mid-SOC level (i.e., around 50% SOC). As discussed in Section 3.1.2, during the first time range, the increase of the SEI film and the low anode potential will accelerate the loss of lithium ions, thereby increasing the internal resistance. After Ri increases by more than 30%, a stable SEI film is probably formed inside the battery stored at a 90% SOC level. In this case, Ri increased more and more slowly [29].
According to the results obtained in the second round of fitting, the relationship between the coefficients and SOC level was developed. As shown in Figure 18, the coefficients pSOC and qSOC varied as the exponential functions. It can be seen that the SOC level influenced in a bit different manner the calendar degradation of the internal resistance (both pSOC and qSOC showed an exponential dependence) than the capacity (aSOC showed an exponential dependence and bSOC showed a polynomial dependence).
p SOC = 9.006 × e 0.005033 × SOC 6.95
q SOC = 0.1104 × e 0.01399 × SOC + 0.9721
By combining (23)–(25), a general model that was able to predict the Ri increases during storage at 25 °C and different SOC levels was obtained:
R i _ i n c r e a s e ( t , SOC ) = ( 9.006 × e 0.005033 × SOC 6.95 ) × t ( 0.1104 × e 0.01399 × SOC + 0.9721 )
where t represents the storage time, expressed in months, and SOC represents the storage SOC level, expressed as a percentage.
Similarly to the capacity fade, the dependences of Ri increases to the storage temperature and to the storage SOC level were fitted separately. By combining all the considered stress factors and taking into account the interactions between them, the model that is able to predict the calendar lifetime in terms of Ri increases is given as
R i _ i n c r e a s e ( t , T , SOC ) = ( 0.3719 × e 0.05168 × T × e 0.005033 × SOC 0.287 × e 0.05168 × T + 2.618 × e 0.005033 × SOC 2.021 ) × t ( 0.1104 × e 0.01399 × SOC + 0.9721 )
Based on the developed lifetime model (27), the Ri increase of the LiFePO4/C battery cells can be extrapolated to storage temperatures close to ones encountered during normal operation. The predicted lifetime based on Ri increase model is shown in 
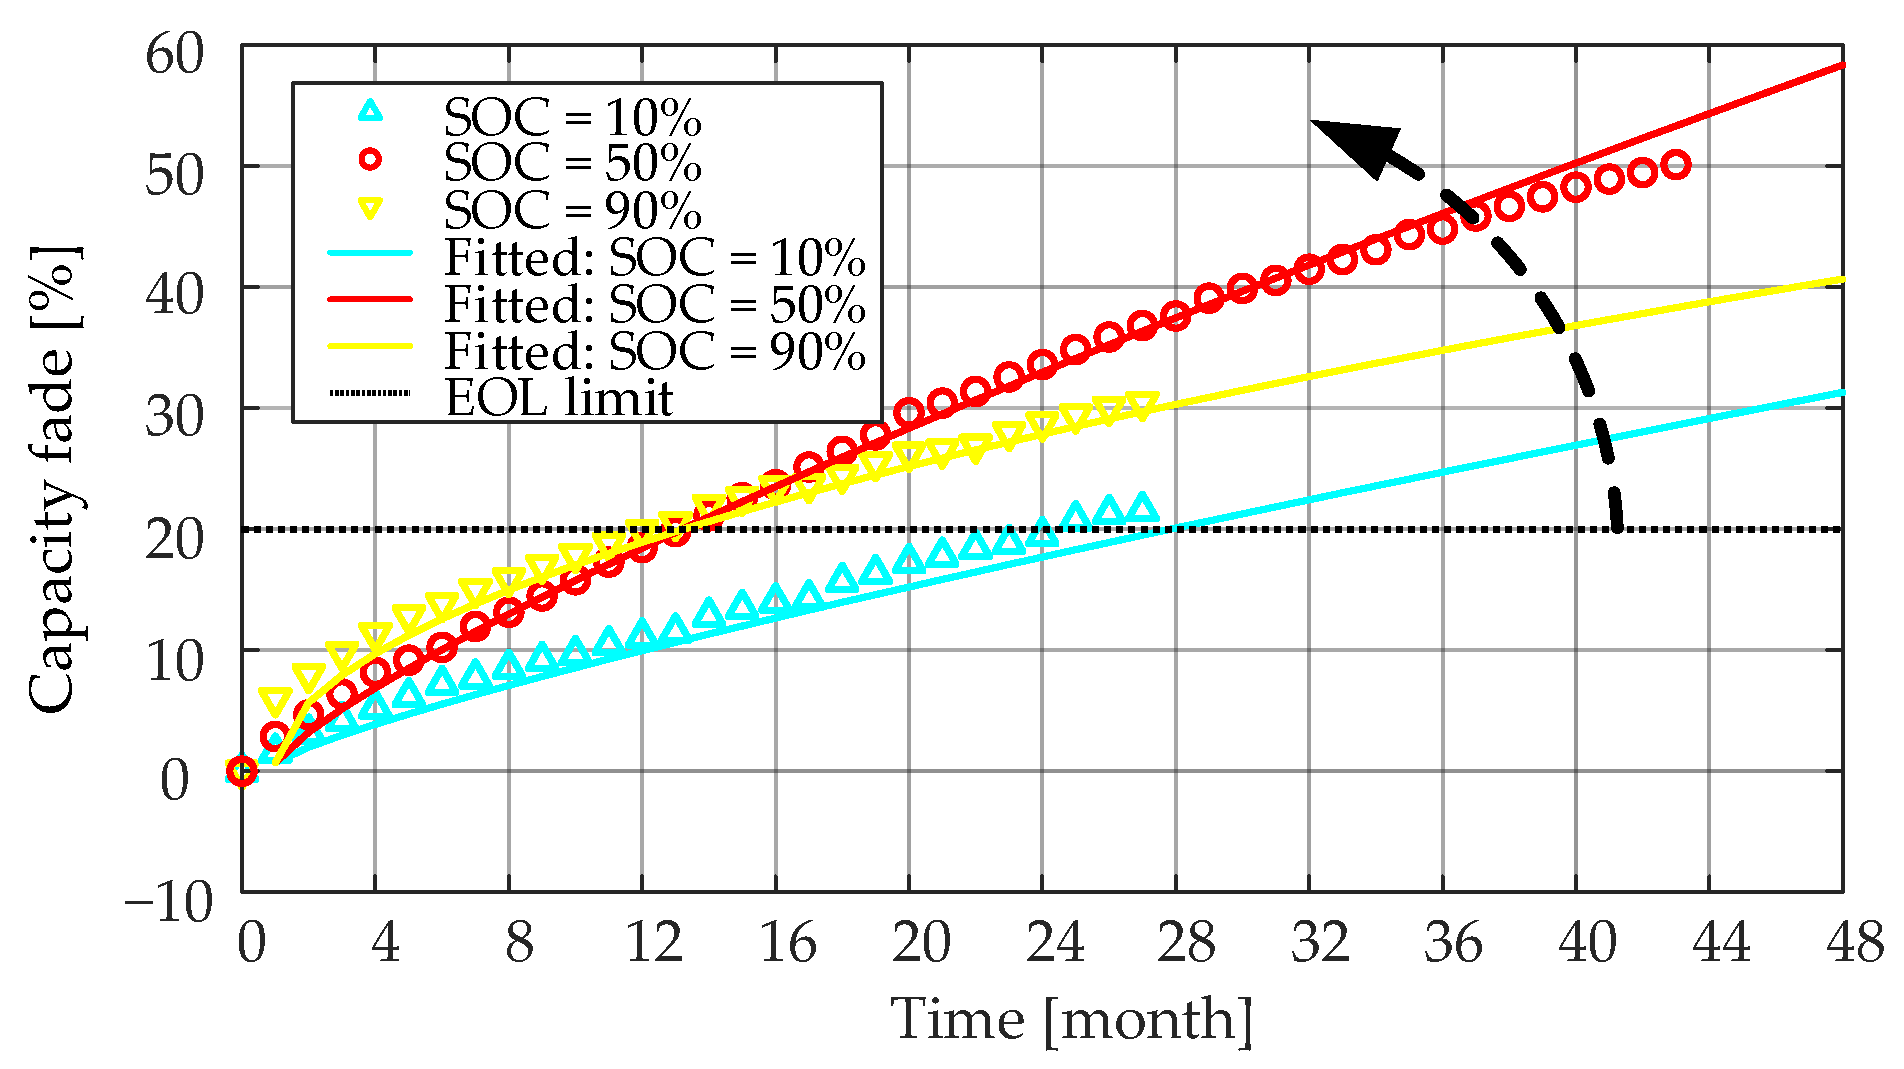
Figure 18. It can be seen that the SOC levels at both ends (smaller than 20% SOC or larger than 80% SOC) and cooler temperatures preserved the Li-ion battery when not in use, which followed the analysis results based on the capacity fade model. Compared with the lifetime prediction results shown in Figure 12 and Figure 19, it can be seen that the predicted lifetime based on the Ri increase model was longer than that based on the capacity fade model at a higher temperature (higher than 40 °C). For example, the tested battery cell can withstand approximately 5.0 years in terms of capacity if stored at 50% SOC and 55 °C. However, in terms of resistance, the batteries’ lifetimes only last for 1.1 years if they are stored under the same conditions. On the contrary, the Ri increase model gives a shorter lifetime when the temperature decreases to 25 °C as compared with the capacity fade model. For example, the tested battery cell can withstand approximately 14.9 years in terms of capacity if stored at 50% SOC and 25 °C. However, in terms of resistance, the batteries will have 23.8 years if they are stored under the same conditions. This is because when investigating the influence of the storage temperature, the coefficient qT in the Ri increase model is a constant 0.75 while the coefficient bT in the capacity fade model is an amount that varies with temperature. As the temperature decreases, the rate of capacity fate decreases exponentially, resulting in a longer predicted lifetime of the capacity-based model
In addition, by comparing the structure of models developed for predicting the calendar lifetime of the LiFePO4/C battery cells in terms of capacity (see (16)) and resistance (see (27)), it might be concluded that the degradation during storage of these two performance parameters is not caused by the same aging mechanisms. Moreover, it has to be stressed that the use of the aforementioned lifetime models for determining the aging behavior at temperatures below 25 °C might return erroneous results; this is because lifetime tests performed at lower temperatures (e.g., 15 °C, 10 °C or lower temperatures, etc.) were not considered when developing the test matrices, being outside of the scope of this paper.

3.3. Comparison with the Semi-Empirical Model

In order to verify the effectiveness of the proposed two-step nonlinear regression modeling method, a semi-empirical aging model was established for comparison. Because calendar aging was mainly attributed to the growth of the SEI at the anode of the battery, the decrease in capacity or the increase of the resistance over time could be described by the root dependence on time t, as given in (28).
C f a d e _ s e m i ( t ) = k × t B
Usually, B is set to 0.5~1 in existing models. In this paper, B was set to 0.75 to better fit the experimental data. k is a coefficient that describes the temperature dependence of the calendar aging. As used by other researchers [11,28], the calendar aging could be modeled through the Arrhenius equation, expressed as
ln k = ln k r e f + E a R g ( 1 T 1 T r e f )
where Ea is the activation energy of a reaction happening at a temperature T, T is the absolute temperature in Kelvin, kref is the obtained coefficient corresponding to the temperature Tref and Rg is the gas constant. It should be noted that during long-term calendar aging, the influence of the SOC level was different during different time ranges. The model established in this paper could describe this behavior well by introducing the variable exponent, as shown in (15) and (26). However, the Arrhenius equation describes the monotonic trend of the coefficient changing with the stress factor (i.e., the temperature). In the case of very long-term aging, the traditional semi-empirical model with the Arrhenius equation is not applicable to analyze the effect of SOC on battery degradation. Therefore, in this section, the proposed model and the traditional semi-empirical model are compared only in terms of temperature dependence.
Figure 20 shows the Arrhenius coefficients in the natural logarithm form at different temperatures. As described in Section 3.1.1, when only the stress factor of temperature is considered, the obtained model is given in (11). The comparison results of capacity fade modeling are shown in Figure 21, and the lifetime prediction results are listed in Table 7. It can be seen from Table 7 that the proposed model showed a higher prediction accuracy. In addition, the storage lifetime was overpredicted by the semi-empirical model, which was not good for predictive maintenance. Because only the batteries stored at 47.5 °C and 55 °C reached their EOL (i.e., 20% capacity fade) during the calendar aging, the measured lifetimes at lower temperatures were not available.
Similarly, the Arrhenius equation was applied to model the resistance-increasing behaviors under various temperature conditions. Figure 22 and Figure 23 show the obtained Arrhenius coefficients and the comparison results between two resistance models, respectively. As can be seen from Figure 23, the fitting results of the two methods (i.e., the proposed two-step regression method and the traditional semi-empirical method) on the data were almost the same because the target model obtained by both methods was expressed as R i ( t , T ) = p T × t 0.75 . As shown in Table 8, the compared two models provided the same results under the tested three temperatures. However, when the batteries were stored at lower temperatures such as 25 °C, the proposed model gave a much shorter predicted lifetime. Considering the risk of unexpected shutdowns in real applications, the underpredicted results indicate greater reliability of the proposed model.

4. Conclusions

This paper investigated the degradation behavior of fifteen LiFePO4/C batteries in terms of capacity fade and internal resistance increase during long-term calendar aging. Considering the storage temperature and SOC level as stress factors that characterized the storage condition, their effect on the rate of calendar degradations was also studied.
A simple and accurate two-step nonlinear regression method was proposed to establish the aging model that could capture the relationships between the degradation of the battery performance parameters (i.e., capacity and internal resistance) and the considered stress factors. During the long-term calendar aging, the battery degradation showed a very steady trend, and the rate of the capacity fade and internal resistance increase decreased as the aging advanced. The storage conditions, including aging time and stress factors, had a similar influence on capacity fade and internal resistance increase. On one hand, the low storage temperatures helped reduce the change rate of capacity and resistance, and the change rate increased exponentially as temperature increased from 25 °C to 55 °C. On the other hand, the SOC level had a piecewise effect on the rate of both capacity fade and resistance increase. Before the capacity fade reached 20%, which could be taken as the cutoff-point, higher SOC was accompanied by a higher rate of capacity fade. After the cutoff-point, the influence of mid-SOC increased, which led to the rapid loss of capacity. Meanwhile, the effect of SOC on the internal resistance was similar, except that the cutoff point turned out to be a 30% increase in resistance.
Based on the established capacity fade model and internal resistance increase model, calendar lifetime can be extrapolated under different storage conditions. However, a longer high-temperature and a longer low-temperature storage lifetime will be obtained based on the capacity fade model and the resistance model, respectively. That is because at higher temperatures (above 30 °C), the resistance increases slowly with time compared with the fast fade of capacity. On the contrary, lower temperatures (25 °C to 30 °C) can significantly reduce the rate of capacity loss, but it is not obvious for suppressing the resistance increase. Consequently, the capacity and internal resistance need to be considered comprehensively when optimizing storage conditions to prolong the lifetimes of batteries. Finally, by comparing the established model with the traditional semi-empirical model, it can be seen that the proposed method predicts the battery lifetime more reliably. Moreover, the established model can reflect the piecewise change of capacity fade and resistance increase in very long-term calendar aging.

Author Contributions

D.-I.S. and M.Ś. designed and performed the experiments; X.S. and D.-I.S. conceived the paper; X.S. analyzed the testing data and wrote the paper; D.-I.S. revised this paper; D.-I.S. and R.T. supervised the findings of this work. All authors have read and agreed to the published version of the manuscript.

Funding

This work has been partially supported by the “CloudBMS: The New Generation of Intelligent Battery Management Systems “research and development project, project number 64017-05167, funded by EUDP Denmark.

Institutional Review Board Statement

Not applicable.

Informed Consent Statement

Not applicable.

Data Availability Statement

Not applicable.

Conflicts of Interest

The authors declare no conflict of interest.

References

  1. Zubi, G.; Dufo-López, R.; Carvalho, M.; Pasaoglu, G. The lithium-ion battery: State of the art and future perspectives. Sust. Energy Rev. 2018, 89, 292–308. [Google Scholar] [CrossRef]
  2. Chen, T.; Jin, Y.; Lv, H.; Yang, A.; Liu, M.; Chen, B.; Xie, Y.; Chen, Q. Applications of lithium-ion batteries in grid-scale energy storage systems. Trans. Tianjin Univ. 2020, 26, 208–217. [Google Scholar] [CrossRef] [Green Version]
  3. Stroe, D.I.; Knap, V.; Swierczynski, M.; Stroe, A.I.; Teodorescu, R. Operation of a grid-connected lithium-ion battery energy storage system for primary frequency regulation: A battery lifetime perspective. IEEE Trans. Ind. Appl. 2017, 53, 430–438. [Google Scholar] [CrossRef]
  4. Dubarry, M.; Truchot, C.; Liaw, B.Y. Cell degradation in commercial LiFePO4 cells with high-power and high-energy designs. J. Power Sources 2014, 258, 408–419. [Google Scholar] [CrossRef]
  5. Sarasketa-Zabala, E.; Aguesse, F.; Villarreal, I.; Rodriguez-Martinez, L.M.; López, C.M.; Kubiak, P. Understanding lithium inventory loss and sudden performance fade in cylindrical cells during cycling with deep-discharge steps. J. Phys. Chem. C 2015, 119, 896–906. [Google Scholar] [CrossRef]
  6. Han, X.; Lu, L.; Zheng, Y.; Feng, X.; Li, Z.; Li, J.; Ouyang, M. A review on the key issues of the lithium ion battery degradation among the whole life cycle. ETransportation 2019, 1, 100005. [Google Scholar] [CrossRef]
  7. Broussely, M.; Biensan, P.; Bonhomme, F.; Blanchard, P.; Herreyre, S.; Nechev, K.; Staniewicz, R.J. Main aging mechanisms in Li ion batteries. J. Power Sources 2005, 146, 90–96. [Google Scholar] [CrossRef]
  8. Belt, J.; Utgikar, V.; Bloom, I. Calendar and PHEV cycle life aging of high-energy, lithium-ion cells containing blended spinel and layered-oxide cathodes. J. Power Sources 2011, 196, 10213–10221. [Google Scholar] [CrossRef]
  9. Vetter, J.; Novák, P.; Wagner, M.R.; Veit, C.; Möller, K.C.; Besenhard, J.O.; Winter, M.; Wohlfahrt-Mehrens, M.; Vogler, C.; Hammouche, A. Ageing mechanisms in lithium-ion batteries. J. Power Sources 2005, 147, 269–281. [Google Scholar] [CrossRef]
  10. Dubarry, M.; Qin, N.; Brooker, P. Calendar aging of commercial Li-ion cells of different chemistries–A review. Curr. Opin. Electrochem. 2018, 9, 106–113. [Google Scholar] [CrossRef]
  11. Käbitz, S.; Gerschler, J.B.; Ecker, M.; Yurdagel, Y.; Emmermacher, B.; André, D.; Mitsch, T.; Sauer, D.U. Cycle and calendar life study of a graphite| LiNi1/3Mn1/3Co1/3O2 Li-ion high energy system. Part A: Full cell characterization. J. Power Sources 2013, 239, 572–583. [Google Scholar] [CrossRef]
  12. Badey, Q.; Cherouvrier, G.; Reynier, Y.; Duffault, J.M.; Franger, S. Ageing forecast of lithium-ion batteries for electric and hybrid vehicles. Curr. Top. Electrochem. 2011, 16, 65–79. [Google Scholar]
  13. Reniers, J.M.; Mulder, G.; Ober-Blöbaum, S.; Howey, D.A. Improving optimal control of grid-connected lithium-ion batteries through more accurate battery and degradation modelling. J. Power Sources 2018, 379, 91–102. [Google Scholar] [CrossRef] [Green Version]
  14. Bindner, H.; Cronin, T.; Lundsager, P.; Manwell, J.F.; Abdulwahid, U.; Baring-Gould, I. Lifetime Modelling of Lead Acid Batteries; Risø Nat. Lab.: Roskilde, Denmark, 2005. [Google Scholar]
  15. Ashwin, T.R.; Barai, A.; Uddin, K.; Somerville, L.; McGordon, A.; Marco, J. Prediction of battery storage ageing and solid electrolyte interphase property estimation using an electrochemical model. J. Power Sources 2018, 385, 141–147. [Google Scholar] [CrossRef]
  16. Swierczynski, M.; Stroe, D.I.; Stan, A.I.; Teodorescu, R.; Kær, S.K. Lifetime estimation of the nanophosphate LiFePO4/C battery chemistry used in fully electric vehicles. IEEE Trans. Ind. Appl. 2015, 51, 3453–3461. [Google Scholar] [CrossRef]
  17. Redondo-Iglesias, E.; Venet, P.; Pelissier, S. Modelling lithium-ion battery ageing in electric vehicle applications—calendar and cycling ageing combination effects. Batteries 2020, 6, 14. [Google Scholar] [CrossRef] [Green Version]
  18. Schmalstieg, J.; Käbitz, S.; Ecker, M.; Sauer, D.U. A holistic aging model for Li(NiMnCo)O2 based 18650 lithium-ion batteries. J. Power Sources 2014, 257, 325–334. [Google Scholar] [CrossRef]
  19. Redondo-Iglesias, E.; Venet, P.; Pelissier, S. Eyring acceleration model for predicting calendar ageing of lithium-ion batteries. J. Energy Storage 2017, 13, 176–183. [Google Scholar] [CrossRef] [Green Version]
  20. Hahn, S.L.; Storch, M.; Swaminathan, R.; Obry, B.; Bandlow, J.; Birke, K.P. Quantitative validation of calendar aging models for lithium-ion batteries. J. Power Sources 2018, 400, 402–414. [Google Scholar] [CrossRef]
  21. Stroe, D.I.; Świerczyński, M.; Stan, A.I.; Teodorescu, R.; Andreasen, S.J. Accelerated lifetime testing methodology for lifetime estimation of lithium-ion batteries used in augmented wind power plants. IEEE Trans. Ind. Appl. 2014, 50, 4006–4017. [Google Scholar] [CrossRef]
  22. Sui, X.; He, S.; Meng, J.; Teodorescu, R.; Stroe, D.I. Fuzzy Entropy-based State of Health Estimation for Li-Ion Batteries. IEEE Trans. Emerg. Sel. Topics Power Electron. 2020. early access. [Google Scholar] [CrossRef]
  23. Liu, K.; Li, Y.; Hu, X.; Lucu, M.; Widanage, W.D. Gaussian process regression with automatic relevance determination kernel for calendar aging prediction of lithium-ion batteries. IEEE Trans. Ind. Inform. 2019, 16, 3767–3777. [Google Scholar] [CrossRef] [Green Version]
  24. Ecker, M.; Nieto, N.; Käbitz, S.; Schmalstieg, J.; Blanke, H.; Warnecke, A.; Sauer, D.U. Calendar and cycle life study of Li (NiMnCo)O2-based 18650 lithium-ion batteries. J. Power Sources 2014, 248, 839–851. [Google Scholar] [CrossRef]
  25. Baumhöfer, T.; Brühl, M.; Rothgang, S.; Sauer, D.U. Production caused variation in capacity aging trend and correlation to initial cell performance. J. Power Sources 2014, 247, 332–338. [Google Scholar] [CrossRef]
  26. Schuster, S.F.; Bach, T.; Fleder, E.; Müller, J.; Brand, M.; Sextl, G.; Jossen, A. Nonlinear aging characteristics of lithium-ion cells under different operational conditions. J. Energy Storage 2015, 1, 44–53. [Google Scholar] [CrossRef]
  27. Sui, X.; Stroe, D.I.; He, S.; Huang, X.; Meng, J.; Teodorescu, R. The effect of voltage dataset selection on the accuracy of entropy-based capacity estimation methods for lithium-ion batteries. Appl. Sci. 2019, 9, 4170. [Google Scholar] [CrossRef] [Green Version]
  28. Schimpe, M.; von Kuepach, M.E.; Naumann, M.; Hesse, H.C.; Smith, K.; Jossen, A. Comprehensive modeling of temperature-dependent degradation mechanisms in Lithium iron phosphate batteries. J. Electrochem. Soc. 2018, 165, A181. [Google Scholar] [CrossRef] [Green Version]
  29. Agubra, V.A.; Fergus, J.W. The formation and stability of the solid electrolyte interface on the graphite anode. J. Power Sources 2014, 268, 153–162. [Google Scholar] [CrossRef]
Figure 1. The test matrix for determining the calendar lifetime of the LiFePO4/C battery cells (possible interaction between stress factors is not considered.
Energies 14 01732 g001
Figure 2. Flowchart of the calendar aging and reference tests procedure.
Energies 14 01732 g002
Figure 3. Current pulse train profile applied to measure the internal resistance of the LiFePO4/C battery cells at 20%, 50% and 80% state of charge (SOC).
Energies 14 01732 g003
Figure 4. Current (a) and voltage (b) profiles during the reference measurements.
Energies 14 01732 g004
Figure 5. Capacity fade curves of calendar-aged cells under different conditions. (a) Boxplot of the capacity fade, (b) Standard deviation of the capacity fade.
Energies 14 01732 g005
Figure 6. The illustration of linear regression.
Energies 14 01732 g006
Figure 7. Fitting results between the capacity fade and storage time using different target functions. (Illustrated by the calendar aging test of Case 1).
Energies 14 01732 g007
Figure 8. Effect of storage time and temperature on the decrease of the capacity (at 50% SOC level).
Energies 14 01732 g008
Figure 9. The relationship between the curve fitting coefficients and the corresponding storage temperature. (a) Exponential relationship between aT and T, (b) Power relationship between bT and T.
Energies 14 01732 g009
Figure 10. Effect of storage time and SOC level on decrease of capacity (at 55 °C).
Energies 14 01732 g010
Figure 11. The relationship between the curve fitting coefficients and the corresponding storage SOC level. (a) Exponential relationship between aSOC and SOC, (b) Power relationship between bSOC and SOC.
Energies 14 01732 g011
Figure 12. Lifetime prediction results using the established capacity fade model (when 20% capacity fade EOL criterion has been reached).
Energies 14 01732 g012
Figure 13. The pulse voltage responses applied to measure the internal resistance of the LiFePO4/C battery cell.
Energies 14 01732 g013
Figure 14. Resistance increase curves of calendar-aged cells (Ri was calculated from 4C-rate discharging pulse at 80% SOC). (a) Boxplot of the resistance increase, (b) Standard deviation of the resistance increase.
Energies 14 01732 g014
Figure 15. Effects of storage time and temperature on the increase of the resistance (at 50% SOC level).
Energies 14 01732 g015
Figure 16. The exponential relationship between the curve fitting coefficients pT and the corresponding storage temperature T.
Energies 14 01732 g016
Figure 17. Effect of storage time and SOC level on the increase of the resistance (at 55 °C).
Energies 14 01732 g017
Figure 18. The relationship between the curve fitting coefficients and the corresponding storage temperature. (a) Exponential relationship between aSOC and SOC, (b) Exponential relationship between bSOC and SOC.
Energies 14 01732 g018
Figure 19. Lifetime prediction results using the established resistance increase model (when 100% resistance increase EOL criterion has been reached).
Energies 14 01732 g019
Figure 20. Arrhenius equation for determining the temperature dependence of capacity fade (at 50% SOC level).
Energies 14 01732 g020
Figure 21. Comparison of modeling results for temperature dependence of capacity fade (at 50% SOC level).
Energies 14 01732 g021
Figure 22. Arrhenius equation for determining the temperature dependence of resistance increase (at 50% SOC level).
Energies 14 01732 g022
Figure 23. Comparison of modeling results for temperature dependence of resistance increase (at 50% SOC level).
Energies 14 01732 g023
Table 1. Main electrical parameters of the tested LiFePO4/C battery cell.
ItemValue
Typecylindrical
DimensionsØ 26 × 65 mm
Weight76 g
Nominal capacity2.5 Ah
Nominal voltage3.3 V
Maximum voltage3.6 V
Minimum voltage2.0 V
Maximum-continuous charge current10 A (4C)
Maximum-continuous discharge current50 A (20C)
Operating temperature−30 °C to 55 °C
Storage temperature−40 °C to 60 °C
Table 2. The curve fitting coefficients of the capacity fade model considering temperature variation (SOC level is fixed to 50%).
Fitting Function TypeNumber of ParametersR2
Logarithmic function C f a d e ( t ) = a × ln ( b × t ) 20.9748
Polynomial function C f a d e ( t ) = a × t + b 20.9876
Power function with a variable constant term C f a d e ( t ) = a × t b + c 30.9980
Power function with a fixed constant term C f a d e ( t ) = a × t b + 0.7 20.9974
Table 3. The curve fitting coefficients of the capacity fade model considering the temperature variation (SOC level is fixed to 50%).
Test ConditionTemperature (°C)aTbTR2
Case 155 °C2.4280.8120.9974
Case 247.5 °C1.080.8970.9943
Case 340 °C0.4520.9320.9862
Table 4. The curve fitting coefficients of the capacity fade model considering the SOC level variation (temperature is fixed to 55 °C).
Test ConditionSOC (%)aSOCbSOCR2
Case 410%1.3870.8230.9973
Case 150%2.4280.8120.9974
Case 590%4.9990.5410.9990
Table 5. The curve fitting coefficients of the resistance increase model considering temperature variation (SOC level is fixed to 50%).
Test ConditionTemperature (°C)pTqTR2
Case 155 °C4.630.750.999
Case 247.5 °C3.5750.750.998
Case 340 °C2.8590.750.908
Table 6. The curve fitting coefficients of the resistance increase model considering SOC level variation (temperature is fixed to 55 °C).
Test ConditionSOC (%)pSOCqSOCR2
Case 410%2.5180.8450.975
Case 150%4.6300.7500.999
Case 590%7.2130.5830.985
Table 7. Comparison of the lifetime prediction results between the proposed capacity fade model and the semi-empirical model (Only the effects of storage time and temperature are considered; when 20% capacity fade EOL criterion has been reached, SOC level is fixed to 50%).
Temperature (°C)Predicted Lifetime Using the Proposed Model (Month)Predicted Lifetime Using Semi-Empirical Model (Month)Measured Lifetime (Month)
55 °C12.51213
47.5 °C2527.526
40 °C53.564.5/ 1
25 °C285.5400.5/
1 The value is not available because the test did not reach the EOL.
Table 8. Comparison of the lifetime prediction results between the proposed resistance increase model and the semi-empirical model (Only the effect of storage time and temperature is considered; when 20% capacity fade EOL criterion has been reached, SOC level is fixed to 50%).
Temperature (°C)Predicted Lifetime Using the Proposed Model (Month)Predicted Lifetime Using Semi-Empirical Model (Month)Measured Lifetime (Month)
55 °C6060/ 1
47.5 °C8284/
40 °C114114/
25 °C232179/
1 The value is not available because the test did not reach the EOL.
Publisher’s Note: MDPI stays neutral with regard to jurisdictional claims in published maps and institutional affiliations.

