
Assessment of Petrol and Natural Gas Vehicle Carbon Oxides Emissions in the Laboratory and On-Road Tests


 ,
,  ,
,  and
and 
Abstract
1. Introduction
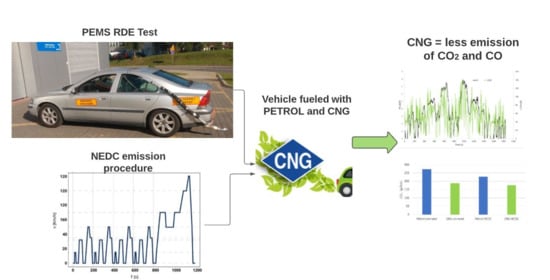
2. Description of the Research Methodology
3. Results and Discussion
3.1. Results of the Bench Tests of CO2 and CO Emission
3.2. On-Road Test Results of CO2 and CO Emission
3.3. Results of Fuel Consumption
4. Conclusions
- The conducted research confirms that adapting the engines of older cars with a Euro 3 emission class to run on natural gas allows for a significant reduction in CO2 and CO emissions.
- In relation to a petrol-fueled vehicle during laboratory tests, the CO2 emission for the natural gas supply was lower by approximately 23%.
- The reduction in CO emission with the use of natural gas in laboratory tests was approximately 70% in relation to petrol fueling.
- The average CO2 emission obtained in the on-road road tests was lower for natural gas-fueled vehicle by approximately 30% than for fueling with petrol.
- The average CO emission obtained in road tests was approximately three times higher when the vehicle was fueled with petrol as compared to natural gas.
- It should be borne in mind that the traffic flow for the on-road emission test with petrol supply was worse than for the test with natural gas supply.
- The research results show that, in order to reduce CO2 emissions, it is beneficial to adapt older cars to natural gas supply, which are characterized by relatively high fuel consumption and greenhouse gas emissions, compared to newly manufactured cars.
- As the results of tests for exhaust gas pollutant emissions and fuel consumption depend on the test cycle, during the comparative assessment of the influence of the fuel type on these parameters, it is beneficial to carry out not only road tests, but also on the chassis dyno test with repeated load conditions.
- The data collected during the research can be used to prepare a model of CO2 and CO emissions for passenger vehicles in the future, but there is still a need to collect more real emission measures for other types of vehicles that meet other exhaust emission standards. It is particularly important for countries where the number of CNG-fueled vehicles is increasing, while the generally used national emission models, e.g., COPERT [65,66], and models for the regional scale, e.g., Enviver Versit + [67,68], do not contain enough data for this type of calculation. This is particularly important for shaping the transport policy of a given region, which is characterized by a different structure of vehicles compared to, for example, European models, where there is a different share of vehicles powered by different fuels.
Author Contributions
Funding
Institutional Review Board Statement
Informed Consent Statement
Data Availability Statement
Conflicts of Interest
Abbreviations
| CLD | Chemi-luminescence detection |
| CH4 | Methane |
| CNG | Compressed natural gas |
| CO | Carbon monoxide |
| CO2 | Carbon dioxide |
| ECE 15 | Segment of Urban Driving Cycle |
| EEA | European Environmental Agency |
| EEV | Enhanced environmentally friendly vehicle |
| EU | European Union |
| EUDC | Extra Urban Driving Cycle |
| FID | Flame ionization detector |
| HC | Hydrocarbons |
| LPG | liquefied petroleum gas |
| NDIR | Non-dispersive infrared |
| NEDC | New European Driving Cycle |
| NOx | Nitrogen oxides |
| O3 | Ozone |
| OH | Hydroxyl |
| PEMS | Portable emissions measurement systems |
| RDE | Real driving emissions |
| THC | Total hydrocarbons |
| TWC | Three-way catalytic converter |
| UDC | Urban Driving Cycle |
References
- EEA Greenhouse Gas—Data Viewer. 2018. Available online: https://www.eea.europa.eu/data-and-maps/data/data-viewers/greenhouse-gases-viewer (accessed on 10 September 2020).
- EEA. Air Quality in Europe—Report; EEA: Copenhagen, Denmark, 2018. [Google Scholar]
- Jaworski, A.; Mądziel, M.; Lejda, K. Creating an emission model based on portable emission measurement system for the purpose of a roundabout. Environ. Sci. Pollut. Res. 2019, 26, 21641. [Google Scholar] [CrossRef] [PubMed]
- Merkisz, J.; Rymaniak, Ł. The assessment of vehicle exhaust emissions referred to CO2 based on the investigations of city buses under actual conditions of operation. Maint. Reliab. 2017, 19, 522–529. [Google Scholar] [CrossRef]
- Cubito, C.; Millo, F.; Boccardo, G.; Di Pierro, G.; Ciuffo, B.; Fontaras, G.; Serra, S.; Garcia, M.O.; Trentadue, G. Impact of Different Driving Cycles and Operating Conditions on CO2 Emissions and Energy Management Strategies of a Euro-6 Hybrid Electric Vehicle. Energies 2017, 10, 1590. [Google Scholar] [CrossRef]
- Andrych-Zalewska, M.; Chłopek, Z.; Merkisz, J.; Pielecha, J. Static internal combustion engine operating states in vehicle driving tests. Combust. Engines 2019, 177, 50–54. [Google Scholar] [CrossRef]
- Merkisz, J.; Pielecha, J.; Bielaczyc, P.; Woodburn, J.; Szalek, A. A Comparison of Tailpipe Gaseous Emissions from the RDE and WLTP Test Procedures on a Hybrid Passenger Car. In SAE Technical Papers; SAE: Warrendale, PA, USA, 2020; 2020-01-2217. [Google Scholar] [CrossRef]
- Alhindawi, R.; Abu Nahleh, Y.; Kumar, A.; Shiwakoti, N. Projection of Greenhouse Gas Emissions for the Road Transport Sector Based on Multivariate Regression and the Double Exponential Smoothing Model. Sustainability 2020, 12, 9152. [Google Scholar] [CrossRef]
- Jaworski, A.; Kuszewski, H.; Ustrzycki, A.; Balawender, K.; Lejda, K.; Woś, P. Analysis of the repeatability of exhaust pollutants emission research for cold and hot starts under controlled driving cycle conditions. Environ. Sci. Pollut. Res. 2018, 25, 17862–17877. [Google Scholar] [CrossRef]
- Zacharof, N.; Fontaras, G.; Ciuffo, B.; Tsiakmakis, S.; Anagnostopoulos, K.; Marotta, A.; Pavlovic, J. Review of in Use Factors Affecting the Fuel Consumption and CO2 Emissions of Passenger Cars; Euro Commission: Luxembourg, 2015. [Google Scholar]
- Zallinger, M.; Hausberger, S. Measurement of CO2 and Fuel Consumption from Cars in the NEDC and in Real World Cycles; Technical University of Graz: Graz, Austria, 2009. [Google Scholar]
- EEA. Monitoring of CO2 Emissions from Passenger Cars Regulation 443/2009; EEA: Copenhagen, Denmark, 2016. [Google Scholar]
- Jaffe, L.S. Ambient Carbon Monoxide and Its Fate in the Atmosphere. J. Air Pollut. Control Assoc. 1968, 18, 534–540. [Google Scholar] [CrossRef]
- Suga, T.; Muraishi, T.; Brachmann, T.; Yatabe, F. Potential of a Natural Gas Vehicle as EEV (Environmentally Enhanced Vehicle). In CEC/SAE International Spring Fuels & Lubricants Meeting; Paper No. 2000-01-1863; SAE: Warrendale, PA, USA, 2000. [Google Scholar]
- John, S.D.; Solomon, S. On the climate forcing of carbon monoxide. J. Geophys. Res. 1998, 103, 13249–13260. [Google Scholar]
- Chen, H.; He, J.; Zhong, X. Engine combustion and emission fuelled with natural gas: A review. J. Energy Inst. 2018, 92, 1123–1136. [Google Scholar] [CrossRef]
- Trivedi, S.; Prasad, R.; Mishra, A.; Kalam, A.; Yadav, P. Current scenario of CNG vehicular pollution and their possible abatement technologies: An overview. Environ. Sci. Pollut. Res. 2020, 27, 39977–40000. [Google Scholar] [CrossRef]
- EEA. Monitoring of CO2 Emissions from Passenger Cars—Regulation 443/2009; EEA: Copenhagen, Denmark, 2015. [Google Scholar]
- Mock, P.; German, J. The future of vehicle emissions testing and compliance. Int. Council Clean Transp. 2015, 49, 847129-102. [Google Scholar]
- Merkisz, J.; Bielaczyc, P.; Pielecha, J.; Woodburn, J. RDE Testing of Passenger Cars: The Effect of the Cold Start on the Emissions Results. In SAE Technical Papers; SAE: Warrendale, PA, USA, 2019; 2019-01-0747. [Google Scholar] [CrossRef]
- Bielaczyc, P.; Merkisz, J.; Pielecha, J.; Woodburn, J. RDE-Compliant PEMS Testing of a Gasoline Euro 6d-TEMP Passenger Car at Two Ambient Temperatures with a Focus on the Cold Start Effect. In SAE Technical Papers; SAE: Warrendale, PA, USA, 2020; 2020-01-0379. [Google Scholar] [CrossRef]
- Jamrozik, A.; Tutak, W.; Gruca, M.; Pyrc, M. Performance, emission and combustion characteristics of CI dual fuel engine powered by diesel/ethanol and diesel/gasoline fuels. J. Mech. Sci. Technol. 2018, 32, 2947–2957. [Google Scholar] [CrossRef]
- Veza, I.; Said, M.F.M.; Latiff, Z.A. Improved Performance, Combustion and Emissions of SI Engine Fuelled with Butanol: A Review. Int. J. Automot. Mech. Eng. 2020, 17, 7648–7666. [Google Scholar] [CrossRef]
- How, C.B.; Taib, N.M.; Mansor, M.R.A. Performance and Exhaust Gas Emission of Biodiesel Fuel with Palm Oil Based Additive in Direct Injection Compression Ignition Engine. Int. J. Automot. Mech. Eng. 2019, 16, 6173–6187. [Google Scholar] [CrossRef]
- Kim, H.J.; Lee, S.H.; Kwon, S.I.; Park, S.; Lee, J.; Keel, J.H.; Lee, J.T.; Park, S. Investigation of the Emission Characteristics of Light-Duty Diesel Vehicles in Korea Based on EURO-VI Standards According to Type of After-Treatment System. Energies 2020, 13, 4936. [Google Scholar] [CrossRef]
- Ko, S.; Park, J.; Kim, H.; Kang, G.; Lee, J.; Kim, J.; Lee, J. NOx Emissions from Euro 5 and Euro 6 Heavy-Duty Diesel Vehicles under Real Driving Conditions. Energies 2020, 13, 218. [Google Scholar] [CrossRef]
- Bodisco, T.; Zare, A. Practicalities and Driving Dynamics of a Real Driving Emissions (RDE) Euro 6 Regulation Homologation Test. Energies 2019, 12, 2306. [Google Scholar] [CrossRef]
- ECMT. Making Cars More Fuel Efficient. Technology for Real Improvements on the Road; International Energy Agency: Paris, France, 2015. [Google Scholar]
- Dings, J. Mind the gap! Why official car fuel economy figures don′t match up to reality. Transp. Environ. 2013. Available online: https://www.transportenvironment.org/sites/te/files/publications/Real%20World%20Fuel%20Consumption%20v15_final.pdf (accessed on 15 October 2020).
- Tietge, U.; Zacharof, N.; Mock, P.; Franco, V.; German, J.; Bandivadekar, A.; Ligterink, N.; Lambrecht, U. From laboratory to road—A 2015 update of official and “real-world” fuel consumption and CO2 values for passenger cars in Europe. Int. Counc. Clean Transp. 2015, 49, 847129-102. [Google Scholar]
- Weiss, M.; Bonnel, P.; Hummel, R.; Manfredi, U.; Colombo, R.; Lanappe, G.; Le Lijour, P.; Sculati, M. Analyzing On-Road Emissions of Light-Duty Vehicles with Portable Emission Measurements Systems (PEMS); Publications Office: Luxembourg, 2011. [Google Scholar]
- Shimizu, O.; Nagai, S.; Fujita, T.; Fujimoto, H. Potential for CO2 Reduction by Dynamic Wireless Power Transfer for Passenger Vehicles in Japan. Energies 2020, 13, 3342. [Google Scholar] [CrossRef]
- Mellios, G.; Hausberger, S.; Keller, M.; Samaras, C.; Ntziachristos, L. Parameterisation of Fuel Consumption and CO2 Emissions of Passenger Cars and Light Commercial Vehicles for Modelling Purposes; Publications Office: Luxembourg, 2011. [Google Scholar]
- Ligterink, N.E. Real World CO2 Emissions: Causes and Effects; TNO: Hague, The Netherlands, 2012. [Google Scholar]
- Kim, K.; Chung, W.; Kim, M.; Kim, C.; Myung, C.-L.; Park, S. Inspection of PN, CO2, and Regulated Gaseous Emissions Characteristics from a GDI Vehicle under Various Real-World Vehicle Test Modes. Energies 2020, 13, 2581. [Google Scholar] [CrossRef]
- Fontaras, G.; Dilara, P. The evolution of European passenger car characteristics 2000–2010 and its effects on real-world CO2 emissions and CO2 reduction policy. Energy Policy 2012, 49, 719–730. [Google Scholar] [CrossRef]
- Ligterink, N.; Kadijk, G.; Hausberger, S.; Rexeis, M. Investigations and Real World Emission Performance of Euro6 Light-Duty Vehicles; TNO Dutch Ministry of Infrastructure and the Environment: Hague, The Netherlands, 2013. [Google Scholar]
- Madziel, M.; Jaworski, A.; Savostin-Kosiak, D.; Lejda, K. The Impact of Exhaust Emission from Combustion Engines on the Environment: Modelling of Vehicle Movement at Roundabouts. Int. J. Automot. Mech. Eng. 2020, 17, 8360. [Google Scholar] [CrossRef]
- EEA Greenhouse Gas—Data Viewer. 2020. Available online: https://www.eea.europa.eu/highlights/average-co2-emissions-from-new-cars-vans-2019 (accessed on 11 September 2020).
- Checkel, D.; Dhaliwal, B. Tailpipe Emissions Comparison Between Propane and Natural Gas Forkfits. In CEC/SAE International Spring Fuels & Lubricants Meeting; Paper No. 2000-01-18654; SAE: Warrendale, PA, USA, 2000. [Google Scholar]
- Bielaczyc, P.; Szczotka, A.; Woodburn, J. A comparison of exhaust emissions from vehicles fuelled with petrol, LPG and CNG. IOP Conf. Ser. Mater. Sci. Eng. 2016, 148, 012060. [Google Scholar] [CrossRef]
- Pan, D.; Tao, L.; Sun, K.; Golston, L.M.; Miller, D.J.; Zhu, T.; Qin, Y.; Zhang, Y.; Mauzerall, D.L.; Zondlo, M.A. Methane emissions from natural gas vehicles in China. Nat. Commun. 2020, 11, 4588. [Google Scholar] [CrossRef]
- Lipman, T.E.; Delucchi, M.A. Emissions of Nitrous Oxide and Methane from Conventional and Alternative Fuel Motor Vehicles. Clim. Chang. 2002, 53, 477–516. [Google Scholar] [CrossRef]
- Sykes, R. Gas works. Engine Technol. Int. 1999, 4, 22–24. [Google Scholar]
- Gis, W.; Gis, M.; Pielecha, J. Comparative Studies of Exhaust Emissions from Three City Buses in Real Traffic Conditions, One with LNG, the Other with CI Engine and a Hybrid Bus. In SAE Technical Papers; SAE: Warrendale, PA, USA, 2020; 2020-01-2191. [Google Scholar] [CrossRef]
- Jaworski, A.; Mądziel, M.; Kuszewski, H.; Lejda, K.; Jaremcio, M.; Balawender, K.; Jakubowski, M.; Wos, P.; Lew, K. The Impact of Driving Resistances on the Emission of Exhaust Pollutants from Vehicles with the Spark Ignition Engine Fuelled with Petrol and LPG. In SAE Technical Papers; SAE: Warrendale, PA, USA, 2020. [Google Scholar] [CrossRef]
- Jaworski, A.; Mądziel, M.; Kuszewski, H.; Lejda, K.; Balawender, K.; Jaremcio, M.; Jakubowski, M.; Wojewoda, P.; Lew, K.; Ustrzycki, A. Analysis of Cold Start Emission from Light Duty Vehicles Fueled with Gasoline and LPG for Selected Ambient Temperatures. In SAE Technical Papers; SAE: Warrendale, PA, USA, 2020. [Google Scholar] [CrossRef]
- Tan, X.; Zhang, P.; Wang, J.; Hong, J. Research on Urban Bearing Capacity of Gas Supply Stations. Sustainability 2019, 11, 6971. [Google Scholar] [CrossRef]
- Čokorilo, O.; Ivković, I.; Kaplanović, S. Prediction of Exhaust Emission Costs in Air and Road Transportation. Sustainability 2019, 11, 4688. [Google Scholar] [CrossRef]
- Suarez-Bertoa, R.; Pechout, M.; Vojtíšek, M.; Astorga, C. Regulated and Non-Regulated Emissions from Euro 6 Diesel, Gasoline and CNG Vehicles under Real-World Driving Conditions. Atmosphere 2020, 11, 204. [Google Scholar] [CrossRef]
- Rivera-González, L.; Bolonio, D.; Mazadiego, L.F.; Naranjo-Silva, S.; Escobar-Segovia, K. Long-Term Forecast of Energy and Fuels Demand Towards a Sustainable Road Transport Sector in Ecuador (2016–2035): A LEAP Model Application. Sustainability 2020, 12, 472. [Google Scholar] [CrossRef]
- Statistics Poland. Transport and Communication. Vehicles by Age Groups. Available online: https://bdl.stat.gov.pl/BDL/dane/podgrup/temat/8/239/2825 (accessed on 8 June 2020).
- Rasic, D.; Opresnik, S.; Seljak, T.; Vihar, R.; Baškovič, U.Ž.; Wechtersbach, T.; Katrašnik, T. RDE-based assessment of a factory bi-fuel CNG/gasoline light-duty vehicle. Atmos. Environ. 2017, 167, 523–541. [Google Scholar] [CrossRef]
- Dimaratos, A.; Toumasatos, Z.; Triantafyllopoulos, G.; Kontses, A.; Samaras, Z. Real-world gaseous and particle emissions of a Bi-fuel gasoline/CNG Euro 6 passenger car. Transp. Res. Part D 2020, 82, 102307. [Google Scholar] [CrossRef]
- Van Basshuysen, R. Natural Gas and Renewable Methane for Powertrains—Future Strategies for a Climate-Neutral Mobility; Springer: Wiesbaden, Germany, 2015. [Google Scholar]
- Fontaras, G.; Martini, G. Assessment of on-road emissions of four Euro V diesel and CNG waste collection trucks for supporting air-quality improvement initiatives in the city of Milan. Sci. Total Environ. 2012, 426, 65–72. [Google Scholar] [CrossRef] [PubMed]
- Yao, Z.; Cao, X.; Shen, X.; Zhang, Y.; Wang, X.; He, K. On-road emission characteristics of CNG-fueled bi-fuel taxis. Atmos. Environ. 2014, 94, 198–204. [Google Scholar] [CrossRef]
- Merkisz, J.; Fuc, P.; Lijewski, P.; Pielecha, J. Actual emissions from urban buses powered with diesel and gas engines. Transp. Res. Procedia 2016, 14, 3070–3078. [Google Scholar] [CrossRef]
- Aslam, M.U.; Masjuki, H.H.; Kalam, M.; Abdesselam, H.; Mahlia, T.; Amalina, M. An experimental investigation of CNG as an alternative fuel for a retrofitted gasoline vehicle. Fuel 2006, 85, 717–724. [Google Scholar] [CrossRef]
- Suarez-Bertoa, R.; Valverde, V.; Clairotte, M.; Pavlovic, J.; Giechaskiel, B.; Franco, V.; Kregar, Z.; Astorga, C. On-road emissions of passenger cars beyond the boundary conditions of the real-driving emissions test. Environ. Res. 2019, 176, 108572. [Google Scholar] [CrossRef]
- Kontses, A.; Triantafyllopoulos, G.; Ntziachristos, L.; Samaras, Z. Particle number (PN) emissions from gasoline, diesel, LPG, CNG and hybrid-electric light-duty vehicles under real-world driving conditions. Atmos. Environ. 2020, 222, 117126. [Google Scholar] [CrossRef]
- Dimaratos, A.; Toumasatos, Z.; Doulgeris, S.; Triantafyllopoulos, G.; Kontses, A.; Samaras, Z. Assessment of CO2 and NOx Emissions of One Diesel and One Bi-Fuel Gasoline/CNG Euro 6 Vehicles During Real-World Driving and Laboratory Testing. Front. Mech. Eng. 2019, 5, 62. [Google Scholar] [CrossRef]
- Information Regarding the Number of the CNG Refueling Stations in Poland. Available online: https://cng.auto.pl/stacje-cng-w-polsce/ (accessed on 4 March 2021).
- Lijewski, P.; Fuć, P.; Markiewicz, F.; Dobrzański, M. Problems of exhaust emissions testing from machines and mobile devices in real operating conditions. Combust. Engines 2019, 179, 292–296. [Google Scholar]
- Ntziachristos, L.; Gkatzoflias, D.; Kouridis, C.; Samaras, Z. COPERT: A European Road Transport Emission Inventory Model. In Information Technologies in Environmental Engineering. Environmental Science and Engineering; Athanasiadis, I.N., Rizzoli, A.E., Mitkas, P.A., Gómez, J.M., Eds.; Springer: Berlin/Heidelberg, Germany, 2009. [Google Scholar] [CrossRef]
- Li, F.; Zhuang, J.; Cheng, X.; Li, M.; Wang, J.; Yan, Z. Investigation and Prediction of Heavy-Duty Diesel Passenger Bus Emissions in Hainan Using a COPERT Model. Atmosphere 2019, 10, 106. [Google Scholar] [CrossRef]
- Smit, R.; Smokers, R.; Rabe, E. A new modelling approach for road traffic emissions: VERSIT+. Transp. Res. Part D Transp. Environ. 2007, 12, 414–422. [Google Scholar] [CrossRef]
- Mądziel, M.; Campisi, T.; Jaworski, A.; Tesoriere, G. The Development of Strategies to Reduce Exhaust Emissions from Passenger Cars in Rzeszow City—Poland A Preliminary Assessment of the Results Produced by the Increase of E-Fleet. Energies 2021, 14, 1046. [Google Scholar] [CrossRef]


| Parameter | Data |
|---|---|
| Year of production | 2001 |
| Emission standard | Euro 3 |
| Engine capacity (cm3) | 2435 |
| Compression ratio | 10:1 |
| Engine working principle | Positive ignition/4 stroke |
| Fuel type | Petrol/CNG |
| Maximum net power (kW)/at (rpm) | 103/4500 |
| Maximum engine torque (Nm)/at (rpm) | 220/3750 |
| Odometer (km × 1000) | 265 |
| Transmission type/number of gears | Manual/5 |
| Fuel system—petrol | Multi-point indirect injection |
| Fuel system—CNG | Multi-point gaseous phase indirect injection |
| Aftertreatment system | TWC |
| Kerb weight (kg) | 1660 |
| Parameter | CNG | Petrol |
|---|---|---|
| Higher calorific value | 11.239 kWh/m3 | 47,300 kJ/kg |
| Lower calorific value | 10.137 kWh/m3 49,180 kJ/kg | 44,000 kJ/kg |
| Density under reference conditions (kg/m3) | 0.742 | 0.74 |
| Air–fuel ratio (AFR) for stoichiometric mixture (mass) | 17.2 | 14.6 |
| Octane number MON (RON) | 105 (110) | 85 (95) |
| Boiling temperature (°C) | 40–210 | −161 |
| Natural gas composition at a CNG refueling station in Rzeszow (% by volume): | ||
| Methane (%) | 97.012 | - |
| N2 (%) | 0.587 | - |
| CO2 (%) | 0.166 | - |
| Ethane (%) | 1.581 | - |
| Propane (%) | 0.481 | - |
| I-Butane (%) | 0.073 | - |
| N-Butane (%) | 0.069 | - |
| I-Pentane (%) | 0.014 | - |
| N-Pentane (%) | 0.009 | - |
| C6+ (%) | 0.007 | - |
| Data | Principle | Accuracy |
|---|---|---|
| CO | NDIR—non-dispersive infrared method; range 0–10% | ±2.5% |
| CO2 | NDIR—non-dispersive infrared method; range 0–5 vol% to 0–20 vol% | ±2.5% |
| THC | FID—flame ionization detection method; range 0–10,000 ppm | ±2.5% |
| NOx | CLD—chemi-luminescence detection method, range 0–100 to 0–3000 ppm | ±2.5% |
| Frequency counter | 1 Hz | ±2.5% |
| Warm-up time | Within 1 h | - |
| Exhaust flow | Pitot tube mass exhaust flow | Within ±1.5% of full scale or within ±2.5% of readings (whichever larger) |
| Parameter | Petrol | CNG |
|---|---|---|
| Total distance covered (km) | 32.9 | 32.9 |
| Urban portion distance (km) | 11.0 | 11.0 |
| Rural portion distance (km) | 10.1 | 10.1 |
| Motorway portion distance (km) | 11.8 | 11.8 |
| Average speed (km/h) | 49.6 | 58.0 |
| Urban portion average speed (km/h) | 27.5 | 33.8 |
| Rural portion average speed (km/h) | 74.1 | 76.4 |
| Motorway portion average speed (km/h) | 101 | 108.5 |
| Lowest route altitude (m) | 225 | 228 |
| Highest route altitude (m) | 273 | 273 |
| Route time (sec) | 2390 | 2042 |
| Pollutant | Phase | Emission Results (g/km) | Difference of Emissions | |
|---|---|---|---|---|
| Fuel Type: Petrol | Fuel Type: CNG | for CNG Compared to Petrol (%) | ||
| CO | UDC | 3.119 (0.213) | 1.056 (0.043) | 33.8 |
| EUDC | 1.57 (0.057) | 0.384 (0.071) | 24.4 | |
| NEDC | 2.145 (0.115) | 0.633 (0.06) | 29.5 | |
| CO2 | UDC | 280.3 (4.85) | 214.7 (8.19) | 76.6 |
| EUDC | 196.9 (4.55) | 152.6 (4.14) | 77.5 | |
| NEDC | 227.9 (4.55) | 175.6 (5.63) | 77 | |
Publisher’s Note: MDPI stays neutral with regard to jurisdictional claims in published maps and institutional affiliations. |
© 2021 by the authors. Licensee MDPI, Basel, Switzerland. This article is an open access article distributed under the terms and conditions of the Creative Commons Attribution (CC BY) license (http://creativecommons.org/licenses/by/4.0/).
Share and Cite
Lejda, K.; Jaworski, A.; Mądziel, M.; Balawender, K.; Ustrzycki, A.; Savostin-Kosiak, D. Assessment of Petrol and Natural Gas Vehicle Carbon Oxides Emissions in the Laboratory and On-Road Tests. Energies 2021, 14, 1631. https://doi.org/10.3390/en14061631
Lejda K, Jaworski A, Mądziel M, Balawender K, Ustrzycki A, Savostin-Kosiak D. Assessment of Petrol and Natural Gas Vehicle Carbon Oxides Emissions in the Laboratory and On-Road Tests. Energies. 2021; 14(6):1631. https://doi.org/10.3390/en14061631
Chicago/Turabian StyleLejda, Kazimierz, Artur Jaworski, Maksymilian Mądziel, Krzysztof Balawender, Adam Ustrzycki, and Danylo Savostin-Kosiak. 2021. "Assessment of Petrol and Natural Gas Vehicle Carbon Oxides Emissions in the Laboratory and On-Road Tests" Energies 14, no. 6: 1631. https://doi.org/10.3390/en14061631
APA StyleLejda, K., Jaworski, A., Mądziel, M., Balawender, K., Ustrzycki, A., & Savostin-Kosiak, D. (2021). Assessment of Petrol and Natural Gas Vehicle Carbon Oxides Emissions in the Laboratory and On-Road Tests. Energies, 14(6), 1631. https://doi.org/10.3390/en14061631