Article

Wind Turbine Generator Controller Signals Supervised Machine Learning for Shaft Misalignment Fault Detection: A Doubly Fed Induction Generator Practical Case Study

Department of Electrical and Electronic Engineering, University of Manchester, Manchester M1 9PL, UK
*
Author to whom correspondence should be addressed.
Energies 2021, 14(6), 1601; https://doi.org/10.3390/en14061601
Submission received: 18 February 2021 / Revised: 9 March 2021 / Accepted: 10 March 2021 / Published: 13 March 2021
(This article belongs to the Special Issue Intelligent Condition Monitoring of Wind Power Systems)

Abstract

:
With a continued strong increase in wind generator applications, the condition monitoring of wind turbine systems has become ever more important in ensuring the availability and reduced cost of produced power. One of the key turbine conditions requiring constant monitoring is the generator shaft alignment, which if compromised and untreated can lead to catastrophic system failures. This study explores the possibility of employing supervised machine learning methods on the readily available generator controller loop signals to achieve detection of shaft misalignment condition. This could provide a highly noninvasive and low-cost solution for misalignment monitoring in comparison with the current misalignment monitoring field practice that relies on invasive and costly drivetrain vibration analysis. The study utilises signal datasets measured on a dedicated doubly fed induction generator test rig to demonstrate that high consistency and accuracy recognition of shaft angular misalignment can be achieved through the application of supervised machine learning on controller loop signals. The average recognition accuracy rate of up to 98.8% is shown to be attainable through analysis of a key feature subset of the stator flux-oriented controller signals in a range of operating speeds and loads.

1. Introduction

Offshore wind generation is one of the fastest growing renewable sources in scale with an approximately 30% annual deployment increase since 2010 and is set to become the largest source of electricity in the European Union by 2040 [1]. In addition, the traditional onshore wind power market remains strong and keeps expanding at a steady pace [2]. Further success and the adoption of large-scale wind generation will be determined by its reliability and price. In this regard the high operation and maintenance (O&M) cost is one of the key challenges for modern wind turbines (WT), originating largely from their exposure to harsh ambient conditions in remote locations. This is especially pertinent to offshore WTs, where access is limited and maintenance costs high due to complicated repair infrastructure requirements imposed by the device location and scale. The O&M cost is estimated to account for up to 30% of entire offshore farm lifetime cost [3]. To mitigate this problem, condition monitoring techniques are continuously being developed to enable lower costs, pre-scheduled maintenance, and thus reduce the downtime losses and avoid the high unplanned maintenance expense through a predictive maintenance approach. The key WT subassemblies that require effective monitoring in this respect are its drivetrain elements (e.g., bearings, generator, gearbox), which are in modern WT systems normally equipped with dedicated and costly condition monitoring systems [4]. Improved monitoring of these components has thus attracted considerable research interest [5,6,7].
The generator shaft misalignment is one of most common problems in practical WT drivetrains; this condition relates to appropriate alignment of its critical components, i.e., the WT rotor, gearbox (where present) and generator shafts [8]. In general, shaft misalignment is characterised as a condition in which the shaft of the driving machine and that of the driven machine are not aligned with the same centerline. It is reported to be responsible for 50% of all rotating machinery problems [9] and can in WT drivetrains result in undesired forces leading to damage or destruction of bearings, seals, and couplings, and thus eventually the gearbox and the generator failure [8]. Therefore, the monitoring and diagnosis of shaft alignment is critical in WT drivetrains. This is especially pertinent to WTs located in harsh and remote environments, where effective misalignment monitoring could help reduce the associated downtime and repair cost implications [10,11].
The WT generator shaft alignment is typically inspected once a year utilizing costly laser alignment tools as part of a maintenance program to validate the existing misalignment levels and thus schedule the corresponding repair action [8]. Furthermore, the laser tools employed for inspection are only suitable for use when the generator is not operating. These, therefore, cannot be used to enable online alignment monitoring [12,13]. Consequently, online vibration monitoring using piezoelectric accelerometers is generally employed in WT drivetrains to identify mechanical faults, including shaft misalignment; this is typically achieved by observing the relevant spectral components of vibration signals at multiples of shaft rotational speed [9,14]. However, vibration sensing systems are generally costly and invasive, requiring sensors to be in physical contact with the monitored device structure, and while effective, the vibration analysis based diagnostic reliability can be affected by the generator transient operation and limitations in dynamic range [13]. Alternative approaches for shaft misalignment diagnosis are therefore constantly being investigated. These include methods based on the application of drivetrain thermal monitoring techniques [15,16,17], where, for example, infrared thermometers observing the coupling temperature were employed in [11] for misalignment detection; however, this was found to also be sensitive to other heat sources in the drivetrain. While the thermal monitoring methods can generally be effective in a known environment, they impose requirements for what can be costly and sensitive thermal monitoring devices and could be challenged in effective application in harsh and variable environmental conditions characteristic of WTs. A strain gauge was used in [18] to predict shaft misalignment via measuring displacement in the vicinity of couplings, but this approach was shown to be constrained by the sensor location requirements. The Fiber Bragg grating (FBG) strain sensing application on the generator frame was investigated in [19], where misalignment recognition was undertaken by observing different orientations of machine frame strain spectral components at multiples of shaft rotational speed; while promising, this method remains relatively invasive and relies on the usage of a costly FBG sensing system. The motor current signature analysis (MCSA) as a minimally sensor dependent and invasive diagnostic tool has been explored to diagnose shaft misalignment in conventional electric machines by investigating rotational speed related harmonic contents in the terminal current signals [20,21,22]. The available MCSA academic studies were however undertaken on small scale machinery, and larger test systems are needed to contribute better understanding of possible fault effects manifestation and its generality. An investigation on a 30 kW doubly fed induction generator (DFIG) was reported in [23], where terminal currents and controller loops signals were evaluated, but no significant or consistent signature at rotational speed sidebands, generally deemed characteristic of shaft misalignment, could be observed in the spectrum with the presence of fault. The general interest in development of noninvasive and competent condition monitoring methods for shaft misalignment in wind generator systems and other rotary electric machine applications remains strong but further research is needed to explore the potential of using electrical signal embedded changes for fault monitoring purposes.
Machine Learning (ML) is a method used to generalise data by learning from a set of features to find the underlying correlation between them and thus predict new labels. This offers new opportunities for classification and understanding of diagnostic information in electric machinery condition monitoring applications. A number of machine fault diagnosis applications reported in the literature applied unsupervised learning, such as successful fault detection using advanced AI clustering applied in [24] to detect rotor broken bars and bearing failures via MCSA at different operating conditions. Furthermore, a study in [25] applied successful clustering techniques on vibration data from different rolling bearing elements by using principal component analysis to detect the type of faults with respect to the change in rotational frequency. A further paper shown in [26] used unsupervised clustering technique to identify stator-winding short, rotor-winding short, and brush faults on a wound-rotor induction generator using stator and rotor current and voltage signatures. On the other hand, supervised learning has been used in [27]: regression and a non-linear artificial neural network (ANN) were applied to detect generator failures in wind turbines. It was established that the ANN performed better than the regression models. Furthermore, a novel methodology in [28] applied multi-label classification for diagnosing and classifying the severity of misalignment and imbalance via vibration and current signatures on an inverter-driven cage induction machine. The dataset was processed, and two models were developed to detect the type and severity of faults by using a decision tree, classifier chain, and K-Nearest Neighbor (KNN). It was found that the classifier chain and KNN performed better than the decision tree in fault diagnosis, achieving a 99% accuracy for predicting the severity of the faults.
Santos et al. [29] considered using a Support Vector Machine (SVM) and ANN classification to detect rotor misalignment and imbalance in variable speed and load conditions. Vibration, electrical torque and mechanical signals, including speed measurements, were acquired at two-levels of misalignment and four levels of imbalance introduced on a test system using an induction motor electrical drive and a parallel and planetary gearbox. It was determined that linear SVM performed better than ANN and other SVM’s kernels (e.g., Gaussian and Stamp) with an accuracy of 98%. In addition, ANN takes longer to train and tune compared to SVM, suggesting that it is computationally costly. Moreover, the SVM and decision tree were used in [30] for the diagnosis of mechanical faults related to bearing and shaft on a test system utilising a variable speed DC motor with a flexibly coupled shaft. The shaft is supported with two ball bearings at the end. It was noted that classifiers performed well in diagnosing faults associated with 12 different conditions and reported an accuracy between 93 and 99%; however, the findings need further validation in the transient state.
The study in [31] applied the ANN with the CSA framework to diagnose mechanical rotor eccentricity for variable speed conditions. It was discovered that the ANN performed well in diagnosing healthy and faulty conditions with an accuracy between 93 and 98%, although lower accuracy was reported when predicting increasing severity. However, validation of this method is required in real case data. Likewise, [32] proposed a methodology for detecting wear and misalignment in a journal bearing. It revealed that ANN performed well in diagnosing a faulty condition with further work planned on modelling with different parameters to distinguish between misalignment and bearing wear.
Conversely, various papers reported WT fault detection using existing data from the turbine’s Supervisory Control and Data Acquisition System (SCADA). For example, fault detection and diagnosis of excitation error, feeding fault, generator heating faults, and air cooling malfunction were examined in [33] on WTs in Ireland using generator SCADA data. Fault detection was based on two classes (healthy and faulty). The Support Vector Machine (SVM) was applied, and promising results obtained in relation to distinguishing between healthy and faulty conditions, with recall scores above 80% and advanced detection claimed of up to 24 h before the occurrence of failures. Furthermore, in [34], a study was conducted to develop generator brush fault diagnostic models based on boosting tree and ensemble models such as Random Forest. The data are extracted from the SCADA of 27 WTs with sampling performed every 10 min. Accuracy between 82 and 97% was observed and advanced detection of up to 12 h reported. These studies clearly indicate considerable interest exists in the intelligent application of ML methods for practical condition monitoring purposes in wind turbine systems.
While the reported literature confirms the potential of supervised and unsupervised learning application for analysis of diagnostic signals, and thus diagnosis of WT drivetrain and general electric machinery faults, considerable further work is needed to explore the full potential of this approach. Of particular interest is to advance the non-invasive nature of diagnosis through analysis of those diagnostic signals that are readily available in electric drives and require no additional sensing hardware for monitoring. In this regard the signals embedded in the WT generator controller loops provide an attractive opportunity for minimally invasive condition monitoring as they are already monitored and recorded by the controller hardware and logic. They hence require no further hardware nor impose extra expense to access for diagnostic purposes but can, in practical applications, be challenging to access due to manufacturer imposed logic restrictions on drive controller design, which has partly impaired research efforts on their diagnostic exploration. Furthermore, the diagnostic signatures in the controller signals require further understanding; while they have been explored for signature analysis-based electrical fault monitoring in widely used WT DFIGs [35,36,37], their application for misalignment fault detection remains largely unresearched. The existing limited research [23] demonstrates that conventional fault physics-based signature analysis in DFIG controller signals is of very restricted potential for effective misalignment fault diagnosis and that more advanced data analysis methods are needed to ascertain and explore their diagnostic potential.
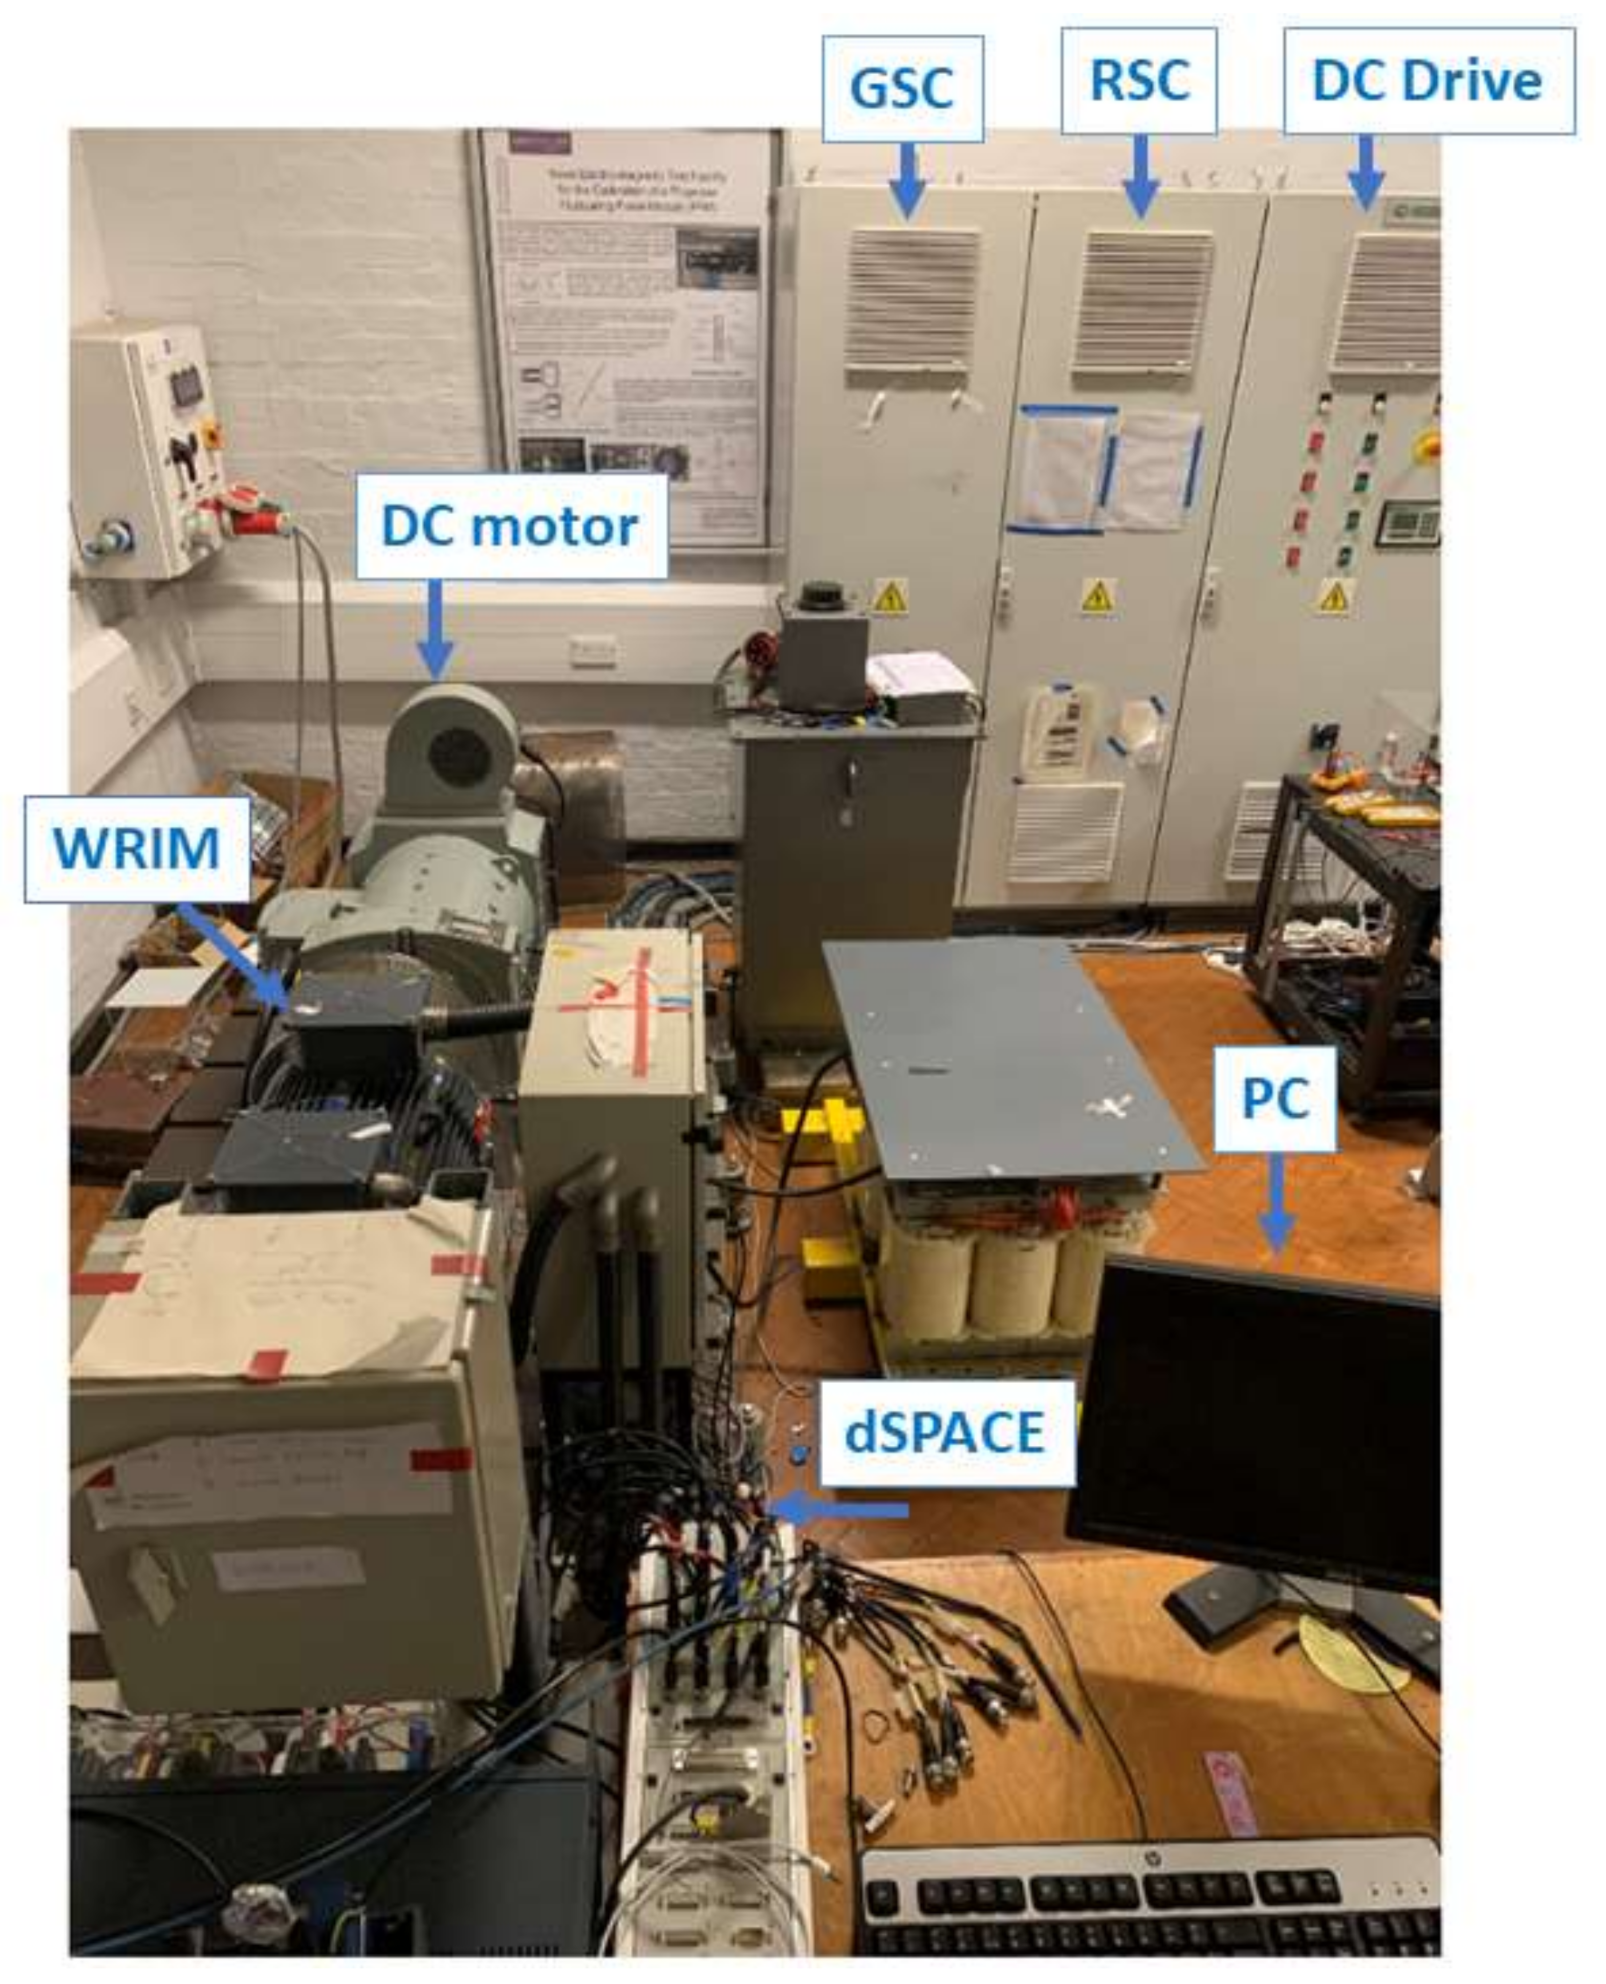
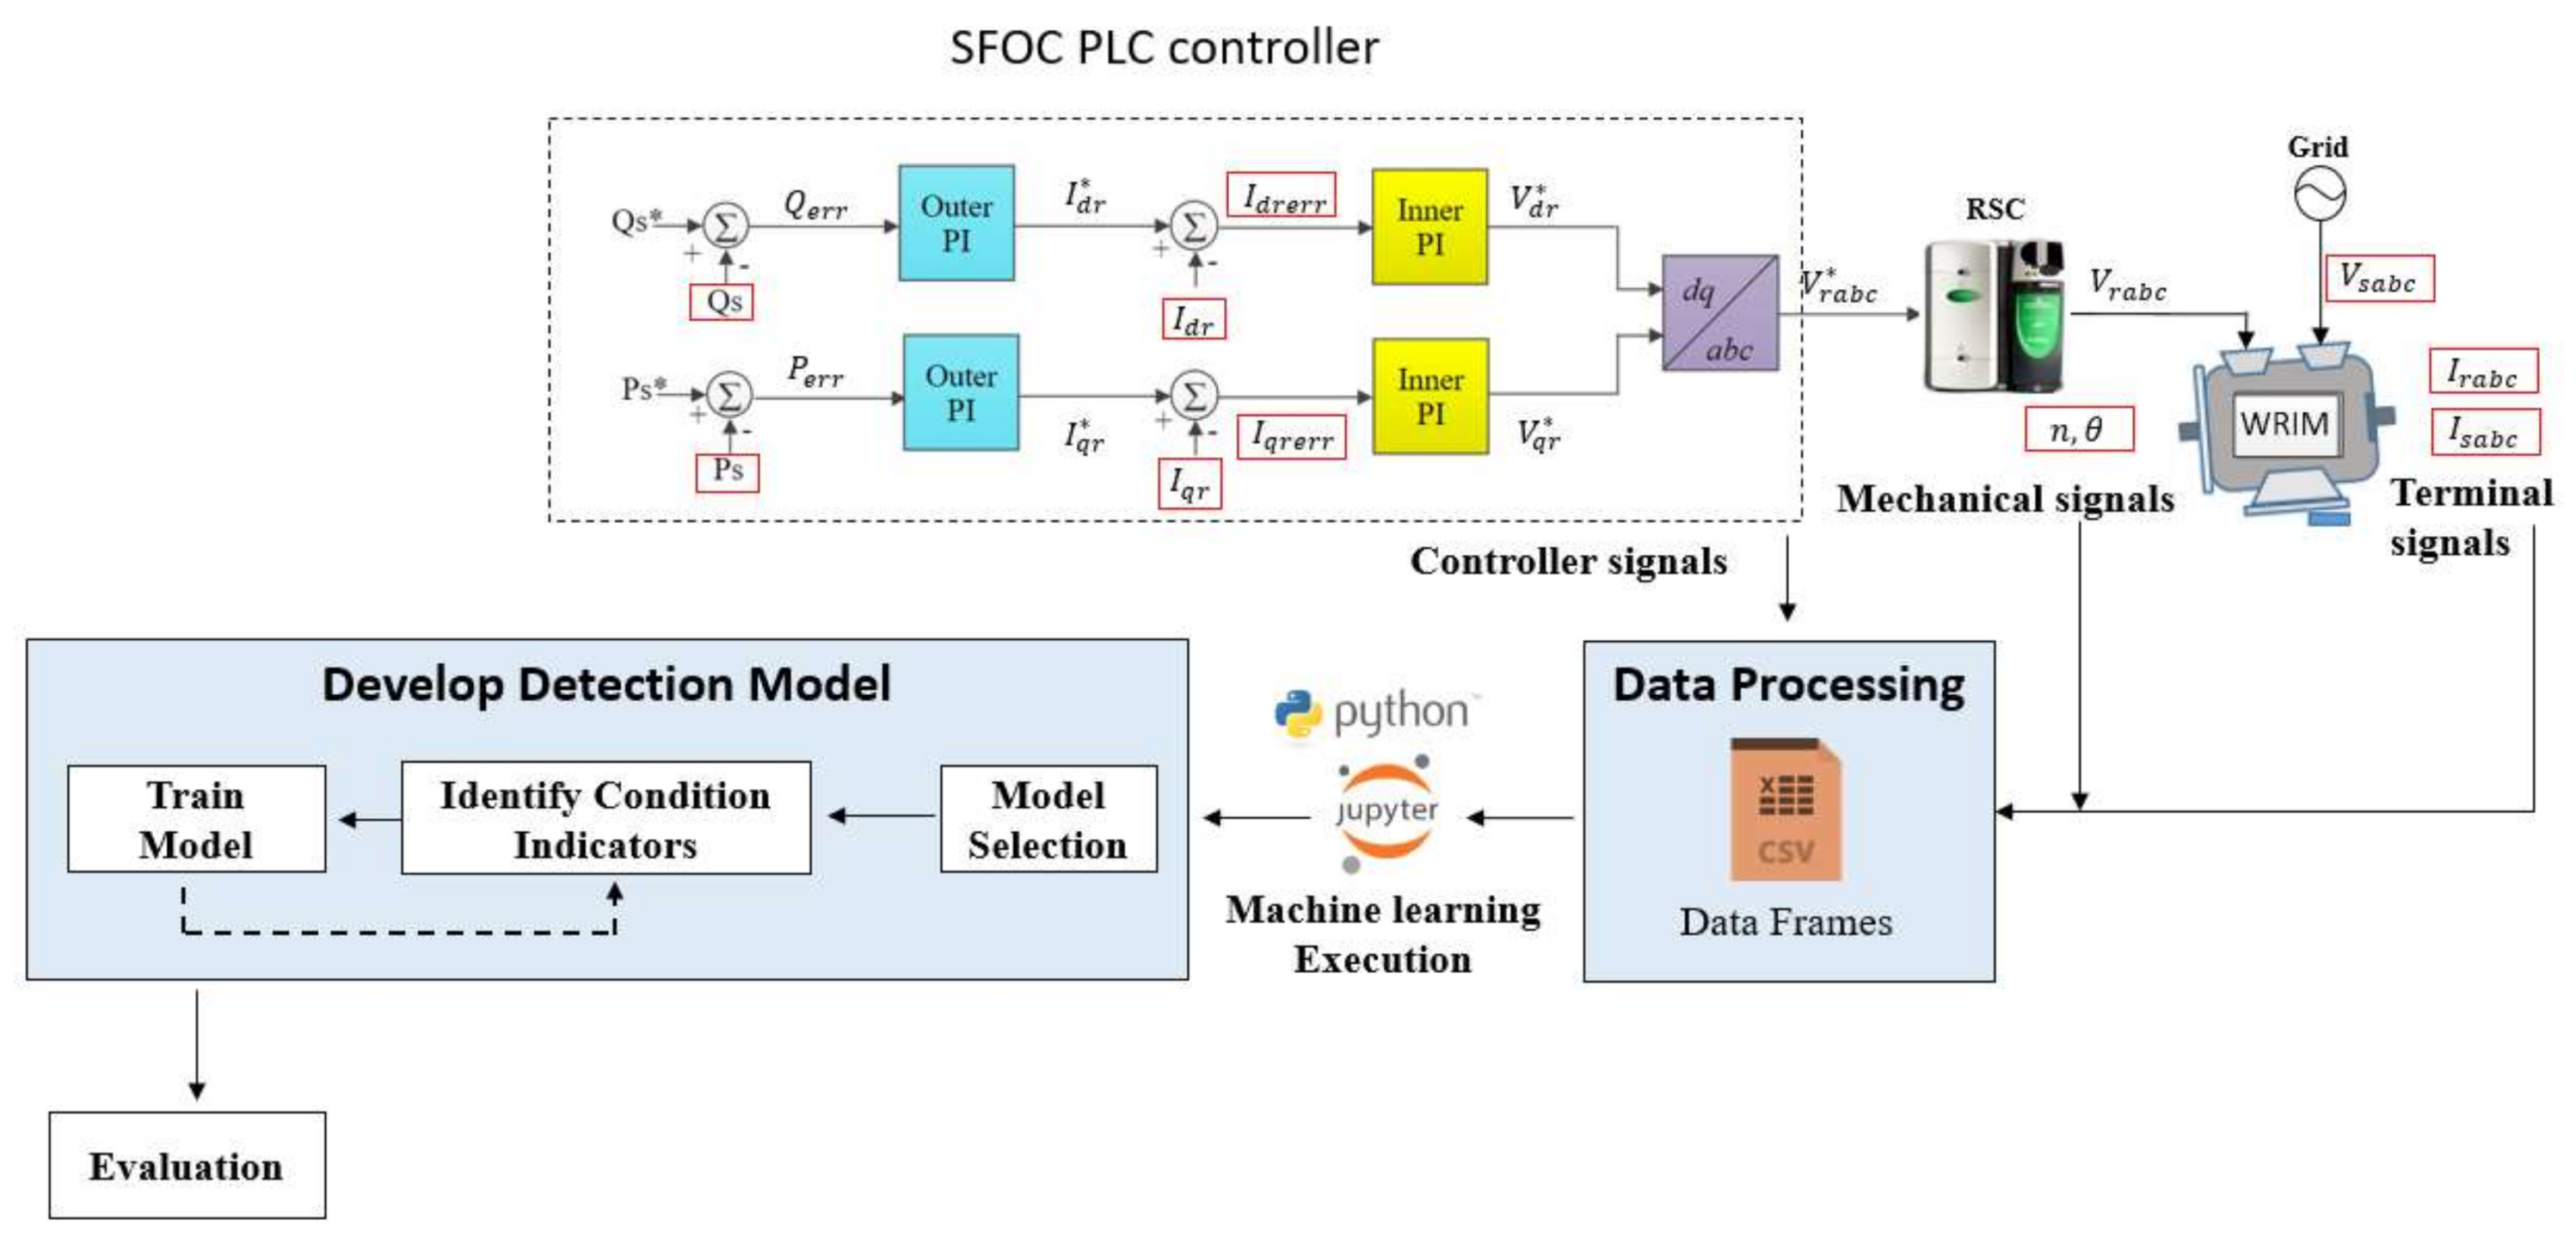
This study investigates the potential of supervised machine learning models’ application for identification of misalignment fault specific changes in WT DFIG controller loops’ signals and hence controller signal based misalignment fault diagnosis. To this end, a specialized purpose built DFIG experimental system that allows full access to controller signals and experimental emulation of the shaft angular misalignment fault is used in this work to obtain the datasets of healthy and faulty conditions signals in a range of typical operating points. These are then analyzed by a number of different supervised machine learning techniques to extract fault specific data classifiers that can be employed to enable misalignment fault diagnosis. The diagnostic performance of individual machine learning techniques is then compared to identify the best performing ones, and further analysis undertaken on training dataset volume requirements and diagnostic feature importance of controller signals for required dataset size reduction. The results demonstrate that an average misalignment fault recognition accuracy of up to 98.8% is possible through machine learning analysis of a key feature subset of DFIG controller signals in the current control loop.

2. Methodology

This section details the DFIG experimental apparatus employed in this study, the types of DFIG signals/data analysed, the data analysis methodologies consideration, and finally the general diagnostic algorithm and data modelling procedure followed in this work.

2.1. Experimental Test Rig Description

The DFIG test rig includes a three-phase, 415 V, four-pole 30 kW wound rotor induction machine (WRIM) whose rotor windings are interfaced to the grid via a back-to-back voltage source converter composed by two CT UNIDRIVE SP-4401 units [38]. A 40 kW DC load motor is directly coupled to the DFIG and operated by a DC drive as a prime mover to provide a desired speed and load profile in tests. To emulate the behavior of practical DFIG systems for wind power generation, a real-time vector control routine (i.e., stator flux-oriented control, SFOC) is implemented on the testing DFIG utilizing commercial converters manipulated in a purpose developed algorithm via a dSPACE 1103 real-time platform [39,40].
A suite of LEM LA 55P/SP1 current and LV 25-600 voltage Hall sensors are fitted to the WRIM to monitor the relevant stator and rotor electrical signals. The controller loop signals and other relevant terminal and mechanical signals are extracted via the dSPACE platform in tests and utilized for supervised machine learning. The rotor angular position and velocity is captured via a 1000 ppr stub shaft mounted incremental encoder. A simplified schematic diagram of the DFIG test rig is shown in Figure 1, and an image of the laboratory test system in Figure 2.
The test rig was mechanically modified to enable experimental emulation of the angular shaft misalignment condition. This was practically achieved by fitting appropriately dimensioned shims underneath the WRIM feet [19,41], sized from the test system geometry and the target amount of angular misalignment; using this approach enabled the one-degree angular shaft misalignment condition to be practically established. A commercial laser alignment tool (TKSA 51) was used to validate that the correct amount of misalignment had been achieved. The alignment tool was also used to ensure there was no offset alignment present in the system during tests.

2.2. Data Formatting

Three types of DFIG data were analyzed in this study: the controller loop signals, the terminal signals, and the mechanical signals. Subsequently, for each operating point, the machine health condition was defined with numeric labels denoting the nature of the operating state (i.e., healthy, faulty), as shown in Table 1.
Six controller loop signals from the DFIG SFOC controller were acquired using the dSPACE platform for the sake of data analysis. These include stator active power P (W), stator reactive power Q (Var), the dq-axis rotor current components Idr, Iqr[A], and the dq-axis error signals for the rotor current controllers Idrerr, Iqrerr (A). The mechanical signals dataset consists of two signals: the shaft mechanical speed and position angle (electrical radians). The terminal signals dataset includes the stator and rotor phase currents, Isa and Ira (A), respectively, and the stator voltage Vsa (V). The analyzed datasets are summarized per signal type in Table 2.
For illustration purposes, the time domain data of select analysed experimental signals are presented in Figure 3. It can be noted that that no apparent fault indicators can be identified through observation of the time domain signal data. In addition, the spectral analysis of the controller and terminal signals reported in [23] has shown that no consistent spectral signatures arising from angular misalignment can be identified in these signals.

2.3. Model Selection

It was demonstrated that SVM, ANN, and models based on tree structures are the most common algorithms used for CM and fault diagnosis in WTs [42]. This study will compare the diagnostic performance of data analysis performed by the following algorithms: the models based on a decision tree (single decision tree), the bagging models (Random Forest), the boosting algorithms (Catboost and XGBoost), the SVM, and the logistic classifier. The fundamentals of these and their fit to the application explored in this study are briefly reviewed in this section for the sake of clarity.
The decision tree is a common supervised learning algorithm used for both regression and classification tasks. The drivers for decision tree application in this work are its faster training time and capability to enable root cause analysis in fault diagnosis [43]. Here, the data split is based on a set of rules deduced from the best data feature (Root) according to the impurity, defined as the feature to maximise the information gain. The splitting continues until all of the leaves are pure classes [43].
Conversely, the Random Forest is constructed from multiple uncorrelated decision trees operating in parallel. The decision is based on the majority of trees’ votes providing improved data generalization compared to single decision tree methods: the greater the number of estimators (i.e., trees); however, the longer the training time and hence, the higher the computational cost [44,45]. Unlike Random Forest, the gradient boosting models are ensemble trees that operate in sequence. The process begins with training a single decision tree to obtain the predictions, and the residual error is then fed to the following tree for training. This cycle is repeated until the number of required trees is reached and the final decision based on the sum of all trees’ predictions. Currently, there are various gradient boosting algorithms, such as Catboost and XGBoost, which are commonly used in ML applications due to the high performance and lower training time demands compared to Random Forest [46,47]. Logistic regression is used to classify binary dependent variables by utilizing a logistic function [48]. Finally, the SVM essentially finds the best hyperplane to divide the data into two classes (i.e., true or false) [48].

2.4. Diagnostic Method and Modelling Technique

The idea explored in this work is that of application of ML methods on signals embedded within the DFIG controller loops to explore the possibility of extracting diagnostic classifiers from these that could enable the recognition of shaft angular misalignment fault. The study also evaluates the potential of ML application on DFIG terminal and mechanical signals for the same purpose and for cross-correlation with the diagnostic performance of controller signal-based data analysis. To this end, the signals from the test system, including primarily those residing in the DFIG drive programmable logic controller (PLC) embedded SFOC controller loops, but also the mechanical and terminals signals considered in the study, are measured and fed to a dedicated computer where ML processing and analysis took place. This consisted of the following general steps: the signals are exported as CSVs format, and then imported to Jupyter notebook to execute machine learning algorithms. The algorithms were selected and coded through Jupyter notebook using Python. Next, the algorithms are trained using 80% of the data and the remaining 20% used in the evaluation stage where accuracy was calculated. The fundamental steps used in the analysis and their integration with the employed experimental system are illustrated in Figure 4.
The experimental tests were performed under two different conditions: with the shaft with a 1° angular misalignment introduced by fitting shims underneath the WRIM frame. To capture the conditions in different regions of the operating range, the DFIG was driven at the following typical operating speeds in the sub- and super-synchronous range: 1340 RPM, 1440 RPM, 1550 RPM, and 1590 RPM. For each operating speed, the measurements of the analyzed signals (as specified in Section 2.2) were taken under three different loads (current), i.e., for a 25%, 50%, and a fully loaded machine (100%). All recordings were sampled at a sampling frequency of 5 kHz for approximately 14 s. Table 3 summarizes the operating conditions for which the measurements were taken.
A simplified flowchart of the data modelling process is shown in Figure 5. The overall process starts with setting the speed and load of each machine condition. The data are then labelled according to the numerical machine condition as showed in Table 1 (i.e., 0 for heathy and 1 for faulty data) and then combined and shuffled. Next, the X features and y labels are defined. The features are scaled using standard scaling to bring the data to the same level while maintaining the normal distribution, thus preventing prolonged training time. Subsequently, the features and labels are split for training (80% of the data) and testing (20% of the data). The X train and y train are then fed into the fitting stage where different classifiers are used, including decision tree, Random Forest, Catboost, XGBoost, SVM, and Logistic classifier. The algorithms are taken from the Scikit-learn, Catboost, and XGBoost libraries. Once the fitting step is completed, the classifier is used to predict the X_test’s labels and to compare them with true y_test in the evaluation stage. The results were evaluated using validation accuracy. The accuracy metric is the simplest and most common classification metric defined by the proportion of correct predictions to the total number of predictions. Accuracy is typically used when the classes are well balanced; although, in the case of unbalanced classes, other metrics (i.e., precision, recall, and F1-score) can become important. In this study, only the accuracy matrix was used because the data were equally balanced.

3. Results and Discussion

3.1. Controller Loop Signals

Firstly, the analysis was undertaken to confirm whether the presence of misalignment fault can be indicated clearly by analysis of controller loop signals. To this end, multiple recorded controller signals datasets were analysed as described in Section 2.4. The obtained results are presented in Table 4. The presented data illustrate that the algorithms give accurate results for most of the analysed load and speed conditions. The accuracy of misalignment fault condition recognition is seen to range from 94% to 99% across the board, with the exception of the 25% load at 1340 RPM operating point, where apart from the SVM and the boosting models, all other models exhibit a more significant accuracy drop to the 71–86% levels. Overall, the results of measured controller signal analysis indicate that it is possible to clearly distinguish between the healthy and faulty operating conditions, and thus achieve a reliable diagnosis of misalignment on the test system studied in this work. Here, the highest accuracy is attained using the SVM model (min accuracy 97%, average accuracy 98.8%), closely followed by Catboost (min accuracy 93%, average accuracy 97.4%) and XGBoost (min accuracy 91%, average accuracy 98%). It was noted that the DT, Logistic classifier, and boosting models took a relatively shorter training time compared to RF and SVM, which may bring a useful economical consideration when considering deployment.
It is crucial to analyse the different features selected for training as this can identify the most relevant feature that indicates the fault condition. Therefore, as an example, the decision tree model was used for 1340 RPM, 50% loaded machine to calculate the information gain (i.e., feature importance) for each data feature and the results shown in Figure 6. The data show that the Iqrerr and Iqr signals contribute the most to the decision process, with a slight contribution of the Idrerr and Idr and a minimal contribution by P and Q. Based on these findings, the dataset was tested with only Iqr and Iqrerr and the accuracy reported in Table 5. The obtained validation accuracy is seen to range from 97% to 99% across the board, with noticeable improvements in comparison to the results obtained by using all the six signals. The reason behind this is that the remaining signals are introducing noise to the data so that when they are removed, the model recognition is enhanced. The exception is the 25% load at 1340 RPM operating point, where some results exhibit a more significant drop in accuracy to the 77% levels. Here, the highest overall accuracy is attained using the Random Forest model (min accuracy 97%, average accuracy 98.8%), closely followed by the Decision Tree (min accuracy 96%, average accuracy 98.7%) and XGBoost (min accuracy 86%, average accuracy 97.9%).

3.2. Mechanical Signals

The mechanical signals consist of shaft rotational angular position and shaft speed. Data analysis was applied to these to explore whether fault presence can be indicated clearly using these signals. The results showed high validation accuracy ranging from 94% to 99% in the cases where the machine was operating at 1340 RPM, whereas for the other considered speeds, the performance was slightly lower with accuracy ranging from 75% to 85% and a considerable loss of accuracy obtained by the SVM and the logistic classifier. It was noted that models based on tree structures showed better performance compared to the SVM and logistic classifier. Generally, mechanical signals were able to detect the faulty points clearly at 1340 RPM. Table 6 shows a summary of validation accuracy in different operating conditions.

3.3. Terminal Signals

This sub-section analyses the terminal signal dataset. The results demonstrate a low validation accuracy in most of the cases, ranging from 50% to 63%, as shown in the results summarised for the different operating conditions analysed in Table 7. In general, the performance of models based on tree structures is seen to be stronger than the SVM and logistics classifiers in terms of validation accuracy. It can be seen that modest detection accuracy rates can be achieved from the analysis of terminal signals when compared to those attained from the controller and mechanical signals. The maximum accuracy observed is 63% (average 59.3%) and is obtained by the Random Forest algorithm, which is substantially lower than that obtained by this algorithm from mechanical signal analysis (min 75%, average 84.4%) and controller signal analysis (min 85%, average 96.1%).This illustrates a much lesser potential of terminal signals to be employed for misalignment diagnostic purpose based on machine learning.

3.4. Data Size

Finally, it is essential to estimate how many data are required to enable effective fault diagnosis from an implementation and operational perspective, as the more data required, the higher the computational cost would be. To evaluate the data requirements, the validation accuracy was computed for different testing portions of the available datasets using all the classifiers considered in this work for an illustrative arbitrary operating point (1340 RPM, 50% loaded), shown in Figure 7. It can be noted that, for example, the scores reduced from 97.8% to 94.5% and from 96.4% to 92.5% when percentage of training dataset was lowered from 90% to 10% using the Decision Tree and Random Forest, respectively. In addition, it can be noticed that the rest of the classifiers also exhibit an accuracy rate reduction with the reduction in the training dataset size; however, this is observed to be limited and lower than 1%. Overall, the models can still perform well with a smaller training dataset suggesting that their practical implementation would not be expected to impose significant training dataset requirements.

4. Conclusions

This study demonstrates the general feasibility of a highly noninvasive methodology for monitoring wind generator shaft misalignment through supervised machine learning analysis of the readily available generator controller signals. The study is undertaken on a medium scale doubly fed induction generator laboratory test rig allowing practical emulation of the angular shaft misalignment and full access to controller signals.
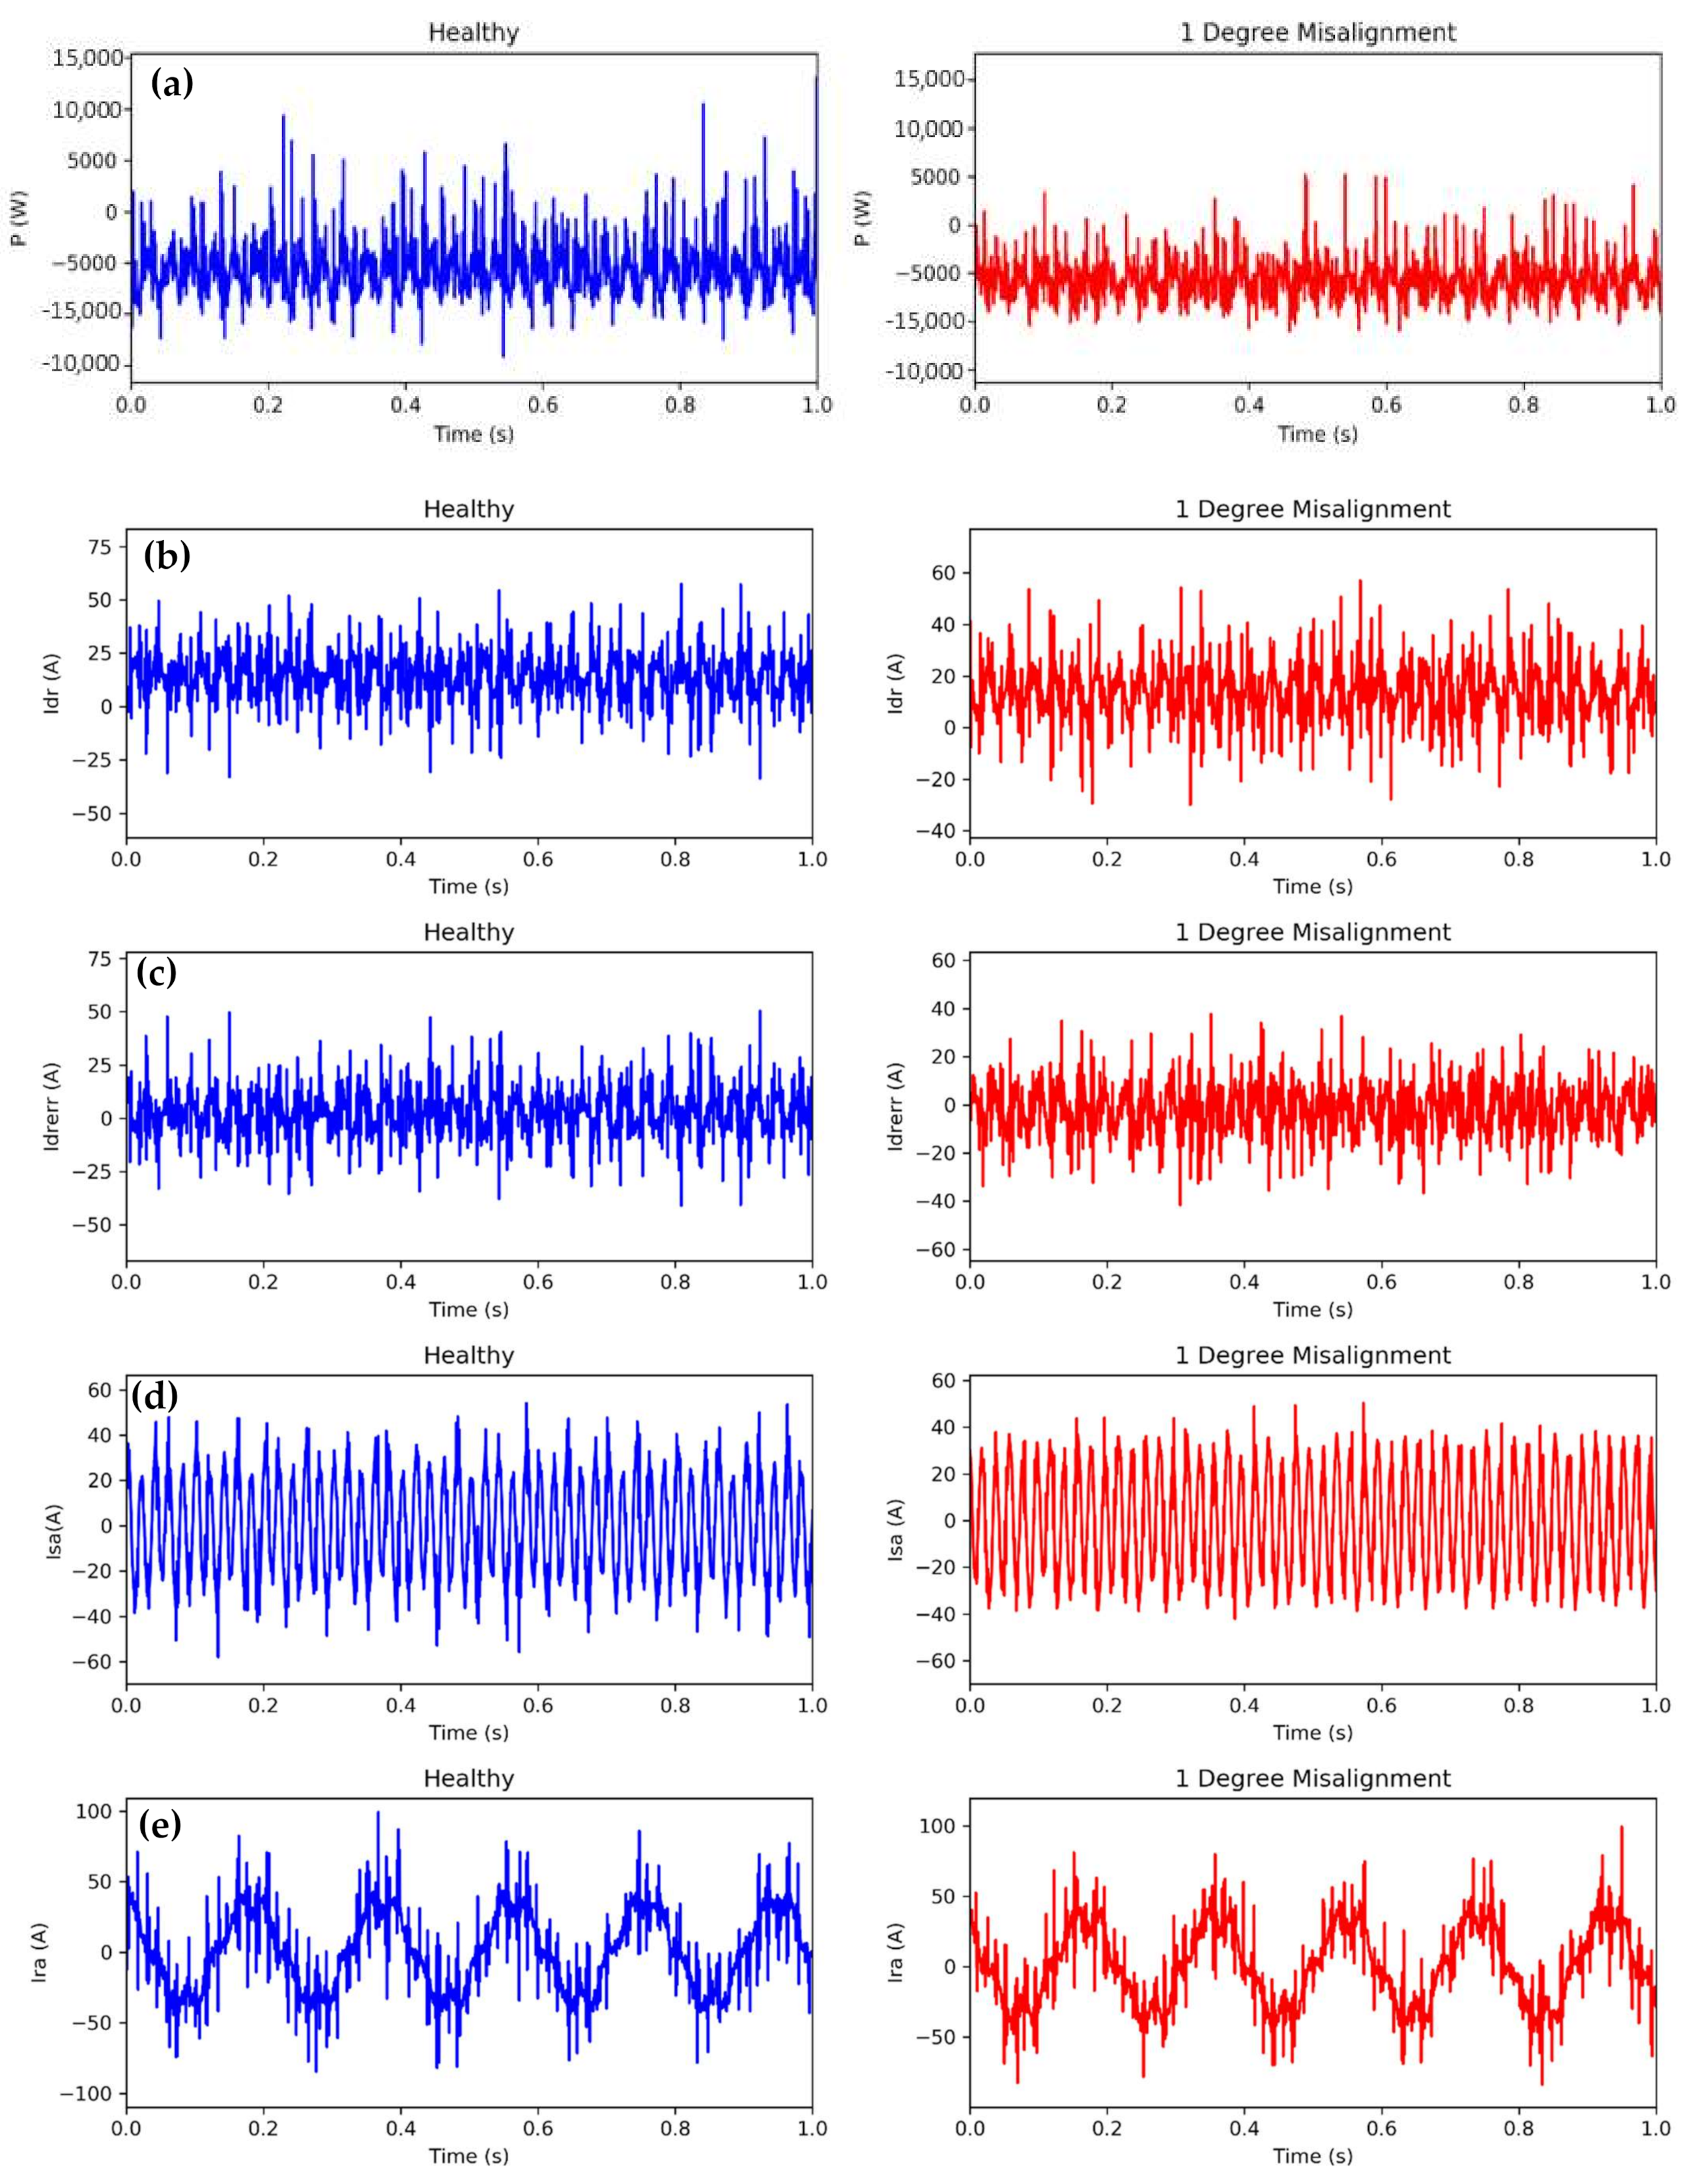
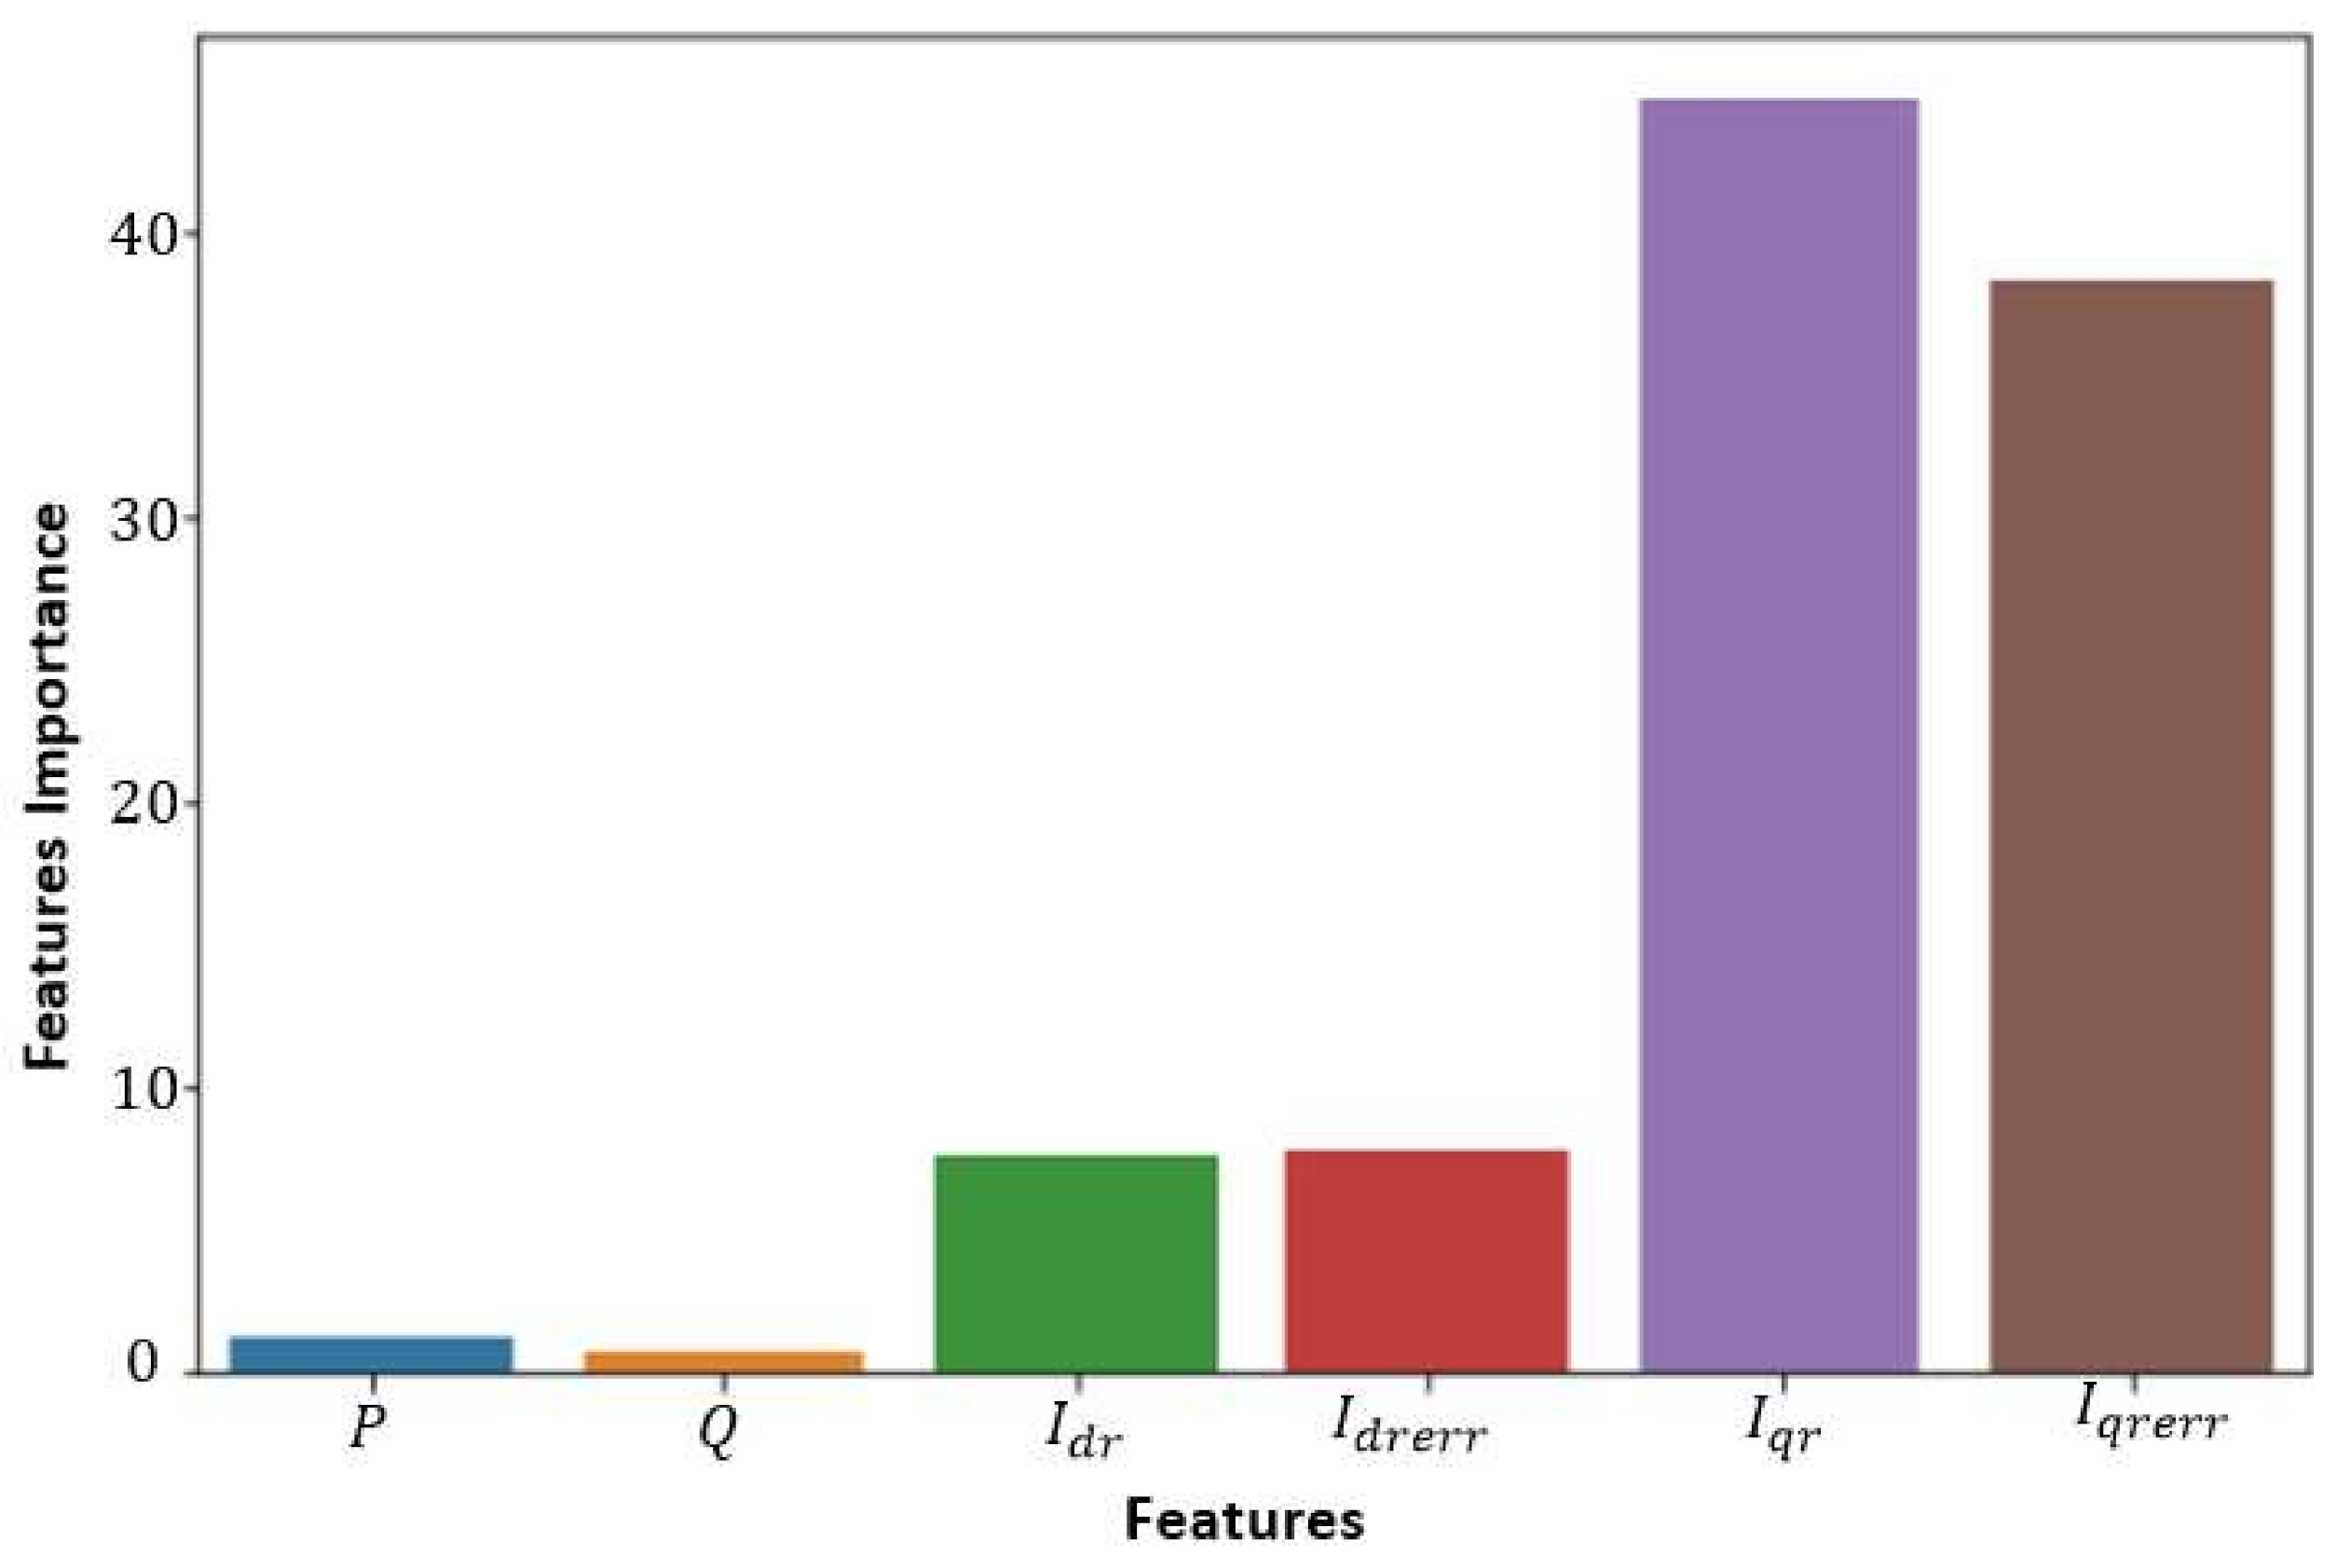
The paper utilizes the datasets of signals, measured in healthy and misalignment fault operating conditions in a number of operating points on the examined test system to classify the misalignment condition specific features in three generator signals group subsets, namely, the controller loops signals, the terminal signals, and the mechanical signals. The analysis employs a number of leading classifiers to evaluate the individual groups of signals diagnostic potential and cross compare it, with the main focus on diagnostic exploitation of the controller signals. It was found that, overall, misalignment condition detection using controller loop signals achieved by far the best validation accuracy, observed at a level of up to 98.8% average accuracy with consistent diagnosis. Moreover, using the embedded feature selection method to select the most appropriate set of features allowed consistent results to be achieved while maintaining high average accuracy levels by using only Iqr and Iqrerr controller loop signals for misalignment detection. This allows for a less computationally demanding establishment of the proposed diagnostic scheme. Conversely, machine learning analysis of neither the terminal nor mechanical signals was able to provide consistently high accuracy in recognition of misalignment fault and showed very limited potential for this application. In addition, it was noted that models can still perform well with a smaller training dataset, with an approximately 1% accuracy rate reduction observed for most of the classifiers with the reduction in the training dataset size. This suggests that their practical implementation would not be expected to impose significant training data requirements.
The findings of this study indicate that supervised machine learning application of DFIG controller loop signals may have potential to provide a reliable and highly non-invasive approach to monitoring shaft misalignment; the method would require no additional sensing to be established as it utilizes signals that are readily available within controller loops and necessitate no additional expense to capture. The practical application of the examined diagnostic scheme in a wind turbine system would be expected to impose a modest cost requirement. This would exclusively be related to the need for ensuring the availability of generator drive PLC computational capacity required to enable the ML based diagnostic analysis of the controller loop signals; these are already monitored and manipulated within the PLC registers for the purpose of achieving real time control. The extracted diagnostic information could effectively be integrated into the drive’s existing communication protocols and fed to an external wind turbine or farm level supervisory medium using existing hardware. The implementation expense of an ML based diagnostic scheme utilizing controller signals would thus be expected to compare very favorably to that of the current field practice that relies on utilization of dedicated and costly drivetrain acceleration monitoring and analysis platforms.
Future research needed to further explore the potential of this work in WT generators and establish its generality would involve the analysis of misalignment fault signals from a range of different practical DFIG system designs, including analysis of different levels and types of misalignment (e.g., offset misalignment) and generator dynamic operating regimes.

Author Contributions

Conceptualization, S.D.,Y.W., A.A.-A.; methodology, S.D.,Y.W., A.A.-A.; software A.A.-A.; data acquisition/experimental testing Y.W.; software development/analysis A.A.-A., investigation, Y.W., A.A.-A., supervision, S.D.; writing, S.D.,Y.W., A.A.-A.; funding acquisition, S.D. All authors have read and agreed to the published version of the manuscript.

Funding

This research was funded by the Engineering and Physical Sciences Research Council (EPSRC) grant numbers EP/P009743/1. The APC was funded by The University of Manchester Library.

Institutional Review Board Statement

Not applicable.

Informed Consent Statement

Not applicable.

Data Availability Statement

The data used in this study can be made available upon request.

Acknowledgments

This work was supported by the U.K. Engineering and Physical Sciences Research Council HOME-Offshore: Holistic Operation and Maintenance for Energy from Offshore Wind Farms Consortium under Grant EP/P009743/1.

Conflicts of Interest

The authors declare no conflict of interest.

References

  1. Offshore Wind Outlook 2019 Technology Report; International Energy Agency: Paris, France, 2019.
  2. IRENA. Future of Wind Technology Report; IRENA: Abu Dhabi, UAE, 2019. [Google Scholar]
  3. Martin, R.; Lazakis, I.; Barbouchi, S.; Johanning, L. Sensitivity analysis of offshore wind farm operation and maintenance cost and availability. Renew. Energy 2016, 85, 1226–1236. [Google Scholar] [CrossRef] [Green Version]
  4. Certification of Condition Monitoring. Service Specification, DNVGL-SE-0439-Edition June 2016. Available online: https://rules.dnvgl.com/docs/pdf/DNVGL/SE/2016-06/DNVGL-SE-0439.pdf (accessed on 5 July 2020).
  5. Crabtree, C.J.; Djurović, S.; Tavner, P.J.; Smith, A.C. Fault frequency tracking during transient operation of wind tur-bine generators. In Proceedings of the XIX International Conference on Electrical Machines—ICEM 2010, Rome, Italy, 6–8 September 2010; pp. 1–5. [Google Scholar] [CrossRef]
  6. Daneshi-Far, Z.; Capolino, G.A.; Henao, H. Review of Failures and Condition Monitoring in Wind Turbine Generators. In Proceedings of the XIX International Conference on Electrical Machines—ICEM 2010, Rome, Italy, 6–8 September 2010. [Google Scholar]
  7. Amirat, Y.; Benbouzid, M.E.H.; Al-Ahmar, E.; Bensaker, B.; Turri, S. A brief status on condition monitoring and fault diagnosis in wind energy conversion systems. Renew. Sustain. Energy Rev. 2009, 13, 2629–2636. [Google Scholar] [CrossRef] [Green Version]
  8. Knitz, G. A Guide to Wind Turbine Alignment. Wind System Magazine, 6 March 2012; 22–25. [Google Scholar]
  9. Vibration Diagnostic Guide. SKF Reliability Systems, CM5003. 2000. Available online: http://edge.rit.edu/edge/P14453/public/Research/SKF%20VibrationGuide.pdf (accessed on 5 July 2020).
  10. Up Wind-Design Limits and Solutions for Very Large Turbines; European Wind Energy Association: Brussele, Belgium, 2011.
  11. Tonks, O.; Wang, Q. The detection of wind turbine shaft misalignment using temperature monitoring. CIRP J. Manuf. Sci. Technol. 2009, 17, 71–79. [Google Scholar] [CrossRef] [Green Version]
  12. “SKF TKSA 31 & TKSA 41” Technology Report, Technology User Manual SKF August 2017. Available online: https://www.skf.com/binaries/pub12/Images/0901d1968039133d-MP5430EN_tcm_12-227821.pdf (accessed on 6 June 2020).
  13. Mankowsky, O.; Wang, Q. Real-time monitoring of wind turbine generator shaft alignment using laser measurement. Procedia CIRP 2013, 291–295. [Google Scholar] [CrossRef] [Green Version]
  14. Sheng, S.; Link, H.; LaCava, W.; van Dam, J.; McNiff, B.; Veers, P.; Keller, J.; Butterfield, S.; Oyague, F. Wind Turbine Drivetrain Condition Monitoring during GRC Phase 1 and Phase 2 Testing; National Renewable Energy Lab. (NREL): Golden, CO, USA, 2011. [Google Scholar]
  15. Li, Y.; Gu, J.X.; Zhen, D.; Xu, M.; Ball, A. An Evaluation of Gearbox Condition Monitoring Using Infrared Thermal Images Applied with Convolutional Neural Networks. Sensors 2019, 19, 2205. [Google Scholar] [CrossRef] [PubMed] [Green Version]
  16. Touret, T.; Changenet, C.; Ville, F.; Lalmi, M.; Becquerelle, S. On the use of temperature for online condition monitoring of geared systems—A review. Mech. Syst. Signal Process. 2018, 101, 197–210. [Google Scholar] [CrossRef]
  17. Glowacz, A. Fault diagnosis of electric impact drills using thermal imaging. Measurement 2021, 171, 108815. [Google Scholar] [CrossRef]
  18. Zhang, W.; Yang, J.; Li, C.; Dai, R.; Yang, A. Theoretical and experimental research on turbo-generator shaft alignment using strain gauge method. J. Vib. Control 2017, 23, 1183–1192. [Google Scholar] [CrossRef]
  19. Wang, Y.; Mohammed, A.; Sarma, N.; Djurovic, S. Double Fed Induction Generator Shaft Misalignment Monitoring by FBG Frame Strain Sensing. IEEE Sens. J. 2020, 20, 8541–8551. [Google Scholar] [CrossRef]
  20. Bossio, J.; Bossio, G.; Angelo, C. Angular Misalignment in Induction Motors with Flexible Coupling. In Proceedings of the 2009 35th Annual Conference of IEEE Industrial Electronics, Porto, Portugal, 3–5 November 2009. [Google Scholar]
  21. Obaid, R.; Habetler, T.; Tallam, R. Detecting load unbalance and shaft misalignment using stator current in inverter-driven induction motors. In Proceedings of the IEEE International Electric Machines and Drives Conference, Madison, WI, USA, 1–4 June 2003. [Google Scholar]
  22. Verucchi, C.; Bossio, J.; Bossio, G.; Acosta, G. Misalignment detection in induction motors with flexible coupling by means of estimated torque analysis and MCSA. Mech. Syst. Signal Process. 2016, 80, 570–581. [Google Scholar] [CrossRef]
  23. Wang, Y.; Sarma, N.; Mohammed, A.; Djurović, S. DFIG current and controller signals’ angular shaft misalignment signature’ an experimental case study. In Proceedings of the 2020 IEEE International Conference on Electrical Machines (ICEM), Gothenburg, Sweden, 23–26 August 2020; pp. 1321–1327. [Google Scholar] [CrossRef]
  24. Soualhi, A.; Clerc, G.; Razik, H. Detection and Diagnosis of Faults in Induction Motor Using an Improved Artificial Ant Clustering Technique. IEEE Trans. Ind. Electron. 2013, 60, 4053–4062. [Google Scholar] [CrossRef]
  25. Yusof, M.M.F.; Nizwan, C.K.E.; Ong, S.A.; Ridzuan, M.Q.M. Clustering of frequency spectrums from different bearing fault using principle component analysis. MATEC Web Conf. 2017, 90, 01006. [Google Scholar] [CrossRef] [Green Version]
  26. Swana, E.; Doorsamy, W. An Unsupervised Learning Approach to Condition Assessment on a Wound-Rotor Induction Generator. Energies 2021, 14, 602. [Google Scholar] [CrossRef]
  27. Schlechtingen, M.; Santos, I.F. Comparative analysis of neural network and regression based condition monitoring approaches for wind turbine fault detection. Mech. Syst. Signal Process. 2011, 25, 1849–1875. [Google Scholar] [CrossRef] [Green Version]
  28. Dineva, A.; Mosavi, A.; Gyimesi, M.; Vajda, I. Multi-label Classification for Fault Diagnosis of Rotating Electrical Machines. arXiv 2019, arXiv:1908.01078. [Google Scholar]
  29. Santos, P.; Villa, L.; Reñones, A.; Bustillo, A.; Maudes, J. An SVM-Based Solution for Fault Detection in Wind Turbines. Sensors 2015, 15, 5627–5648. [Google Scholar] [CrossRef] [Green Version]
  30. Saimurugan, M.; Ramachandran, K.; Sugumaran, V.; Sakthivel, N. Multi component fault diagnosis of rotational mechanical system based on decision tree and support vector machine. Expert Syst. Appl. 2011, 38, 3819–3826. [Google Scholar] [CrossRef]
  31. Ibrahim, R.K.; Tautz-Weinert, J.; Watson, S.J. Neural networks for wind turbine fault detection via current signature analysis. In Proceedings of the Wind Europe Summit, Hamburg, Germany, 27–29 September 2016. [Google Scholar]
  32. Saridakis, K.; Nikolakopoulos, P.; Papadopoulos, C.; Dentsoras, A. Identification of wear and misalignment on journal bearings using artificial neural networks. Proc. Inst. Mech. Eng. Part J J. Eng. Tribol. 2011, 226, 46–56. [Google Scholar] [CrossRef]
  33. Leahy, K.; Hu, R.L.; Konstantakopoulos, I.C.; Spanos, C.J.; Agogino, A.M.; O’Sullivan, D.T. Diagnosing and predicting wind turbine faults from SCADA data using support vector machines. Int. J. Progn. Health Manag. 2018, 9, 1–11. [Google Scholar]
  34. Verma, A.; Kusiak, A. Fault Monitoring of Wind Turbine Generator Brushes: A Data-Mining Approach. J. Sol. Energy Eng. 2012, 134, 021001. [Google Scholar] [CrossRef]
  35. Zaggout, M.; Tavner, P.; Crabtree, C.; Ran, L. Detection of rotor electrical asymmetry in wind turbine doubly-fed induction generators. IET Renew. Power Gener. 2014, 8, 878–886. [Google Scholar] [CrossRef] [Green Version]
  36. Abadi, M.B.; Cruz, S.M.A.; Gonçalves, A.P.; Mendes, A.M.S.; Ribeiro, A.; Silva, F. Inter-turn fault detection in doubly-fed induction generators for wind turbine applications using the stator reactive power analysis. In Proceedings of the 3rd Renewable Power Generation Conference, Naples, Italy, 24–25 September 2014; pp. 1–6. [Google Scholar]
  37. Stefani, A.; Yazidi, A.; Rossi, C.; Filippetti, F.; Casadei, D.; Capolino, G. Doubly fed induction machines diagnosis based on signature analysis of rotor modulating signals. IEEE Trans. Ind. Appl. 2008, 44, 1711–1721. [Google Scholar] [CrossRef]
  38. Djurovic, S.; Vilchis-Rodriguez, D.S.; Smith, A.C. Supply Induced Interharmonic Effects in Wound Rotor and Doubly-Fed Induction Generators. IEEE Trans. Energy Convers. 2015, 30, 1397–1408. [Google Scholar] [CrossRef]
  39. Sarma, N.; Tuohy, P.; Apsley, J.; Wang, Y.; Djurović, S. DFIG stator flux-oriented control scheme execution for test facilities utilising commercial converters. IET Renew. Power Gener. 2018, 12, 1366–1374. [Google Scholar] [CrossRef]
  40. Sarma, N.; Apsley, J.M.; Djurovic, S. Implementation of a conventional DFIG stator flux oriented control scheme using industrial converters. In Proceedings of the IEEE International Conference on Renewable Energy Research and Applications (ICRERA), Birmingham, UK, 20–23 November 2016. [Google Scholar]
  41. Fatemi, J.R.; Henao, H.; Capolino, G.A.; Sieg-Zieba, S. Load influence on induction machine torque and stator current in case of shaft misalignment. In Proceedings of the IECON Proceedings (Industrial Electronics Conference), Porto, Portugal, 3–5 November 2009. [Google Scholar]
  42. Stetco, A.; Dinmohammadi, F.; Zhao, X.; Robu, V.; Flynn, D.; Barnes, M.; Keanea, J.; Nenadica, G. Machine learning methods for wind turbine condition monitoring: A review. Renew. Energy 2019, 133, 620–635. [Google Scholar] [CrossRef]
  43. Abdallah, I.; Dertimanis, V.; Mylonas, H.; Tatsis, K.; Chatzi, E.; Dervilis, N.; Worden, K.; Maguire, E. Fault diagnosis of wind turbine structures using decision tree learning algorithms with big data. In Safety and Reliability—Safe Societies in a Changing World; CRC Press: Boca Raton, FL, USA, 2018; pp. 3053–3061. [Google Scholar]
  44. Supervised Learning Documentation. Scikit-learn.org. 2020. Available online: https://scikit-learn.org/stable/supervised_learning.html#supervised-learning (accessed on 28 August 2020).
  45. Liu, Y.; Wang, Y.; Zhang, J. New Machine Learning Algorithm: Random Forest. In Information Computing and Applications; Springer: Berlin/Heidelberg, Germany, 2012; pp. 246–252. [Google Scholar]
  46. Shalev-Shwartz, S.; Ben-David, S. Understanding Machine Learning: From Theory to Algorithms; Cambridge University Press: Cambridge, UK, 2014. [Google Scholar]
  47. Overview of CatBoost. Catboost.ai. 2020. Available online: https://catboost.ai/docs/ (accessed on 28 August 2020).
  48. James, G.; Witten, D.; Hastie, T.; Tibshirani, R. An Introduction to Statistical Learning, 1st ed.; Springer: New York, NY, USA, 2013. [Google Scholar]
Figure 1. Simplified schematic diagram of the laboratory test rig.
Energies 14 01601 g001
Figure 2. Overall picture of the laboratory test rig.
Energies 14 01601 g002
Figure 3. Healthy and one-degree misalignment time domain spectra: controller P (a), Idr (b), Idrerr (c), and terminal Isa (d), Ira (e) signals at @ 1340 RPM and 50% load.
Energies 14 01601 g003
Figure 4. Signals extraction on the doubly fed induction generator (DFIG) operation including controller loop, mechanical, and terminals signals.
Energies 14 01601 g004
Figure 5. Simplified modelling process flowchart.
Energies 14 01601 g005
Figure 6. Feature importance of Catboost classifier at 1340 RPM and 50% loaded machine.
Energies 14 01601 g006
Figure 7. The validation accuracy vs. training portion.
Energies 14 01601 g007
Table 1. Numeric labels in the dataset and their meanings.
MeaningNumeric Label
Healthy0
1° Misalignment1
Table 2. Summary of the data signals types.
TypeSignals
Controller loopP (W)Q (Var)Idr (A)Iqr (A)Idrerr (A)Iqrerr (A)
Mechanicaln (RPM)θ (rad)
TerminalIsa (A)Ira (A)Vsa (V)
Table 3. Summary of the machine operating conditions.
Operating ConditionSpeed RPMNominal Load (Current)
Healthy1340, 1440, 1550 and 159025%, 50%, and 100%
1° Misalignment1340, 1440, 1550 and 159025%, 50%, and 100%
Table 4. Validation accuracy of all six measured signals in different operating conditions.
Speed (RPM)1340 RPM1440 RPM1550 RPM1590 RPM
Load (%)25%50%100%25%50%100%25%50%100%25%50%100%
Decision Tree869899999999999999999999
Catboost939999969798979898989898
XGBoost919899979899999999999999
Random Forest859699949697979898989898
Linear SVM979999999999999999999999
Logistic Classifier719999989897999993969999
Table 5. Validation accuracy of using only Iqr and Iqrerr in different operating conditions.
Speed (RPM)1340 RPM1440 RPM1550 RPM1590 RPM
Load (%)25%50%100%25%50%100%25%50%100%25%50%100%
Decision Tree969999999999999999999999
Catboost779799979798979798979898
XGBoost899899989999989999999999
Random Forest979999999999999999999999
Linear SVM 769999999999999999999999
Logistic Classifier779999999999999999999999
Table 6. Summary of validation accuracy in different operating conditions using mechanical signals.
Speed (RPM)1340 RPM1440 RPM1550 RPM1590 RPM
Load (%)25%50%100%25%50%100%25%50%100%25%50%100%
Decision Tree959494757676787979828080
Catboost949494787776818282858484
XGBoost999594807878858585868585
Random Forest999493767675838484848283
Linear SVM 998383757574797979686766
Logistic Classifier998283727271787878666667
Table 7. Summary of the validation accuracy using terminal signals in different operating conditions.
Speed (RPM)1340 RPM1440 RPM1550 RPM1590 RPM
Load (%)25%50%100%25%50%100%25%50%100%25%50%100%
Decision Tree575656555454575854575655
Catboost595759585857606057605857
XGBoost585758575655595956605856
Random Forest605960595857616357615957
Linear SVM 505050505052505049515151
Logistic Classifier505050505050505050515150
Publisher’s Note: MDPI stays neutral with regard to jurisdictional claims in published maps and institutional affiliations.

