
Simulation of a Fast-Charging Porous Thermal Energy Storage System Saturated with a Nano-Enhanced Phase Change Material

 , , , , ,
  and
and
Abstract
:1. Introduction
2. Governing Equations and Boundary Conditions
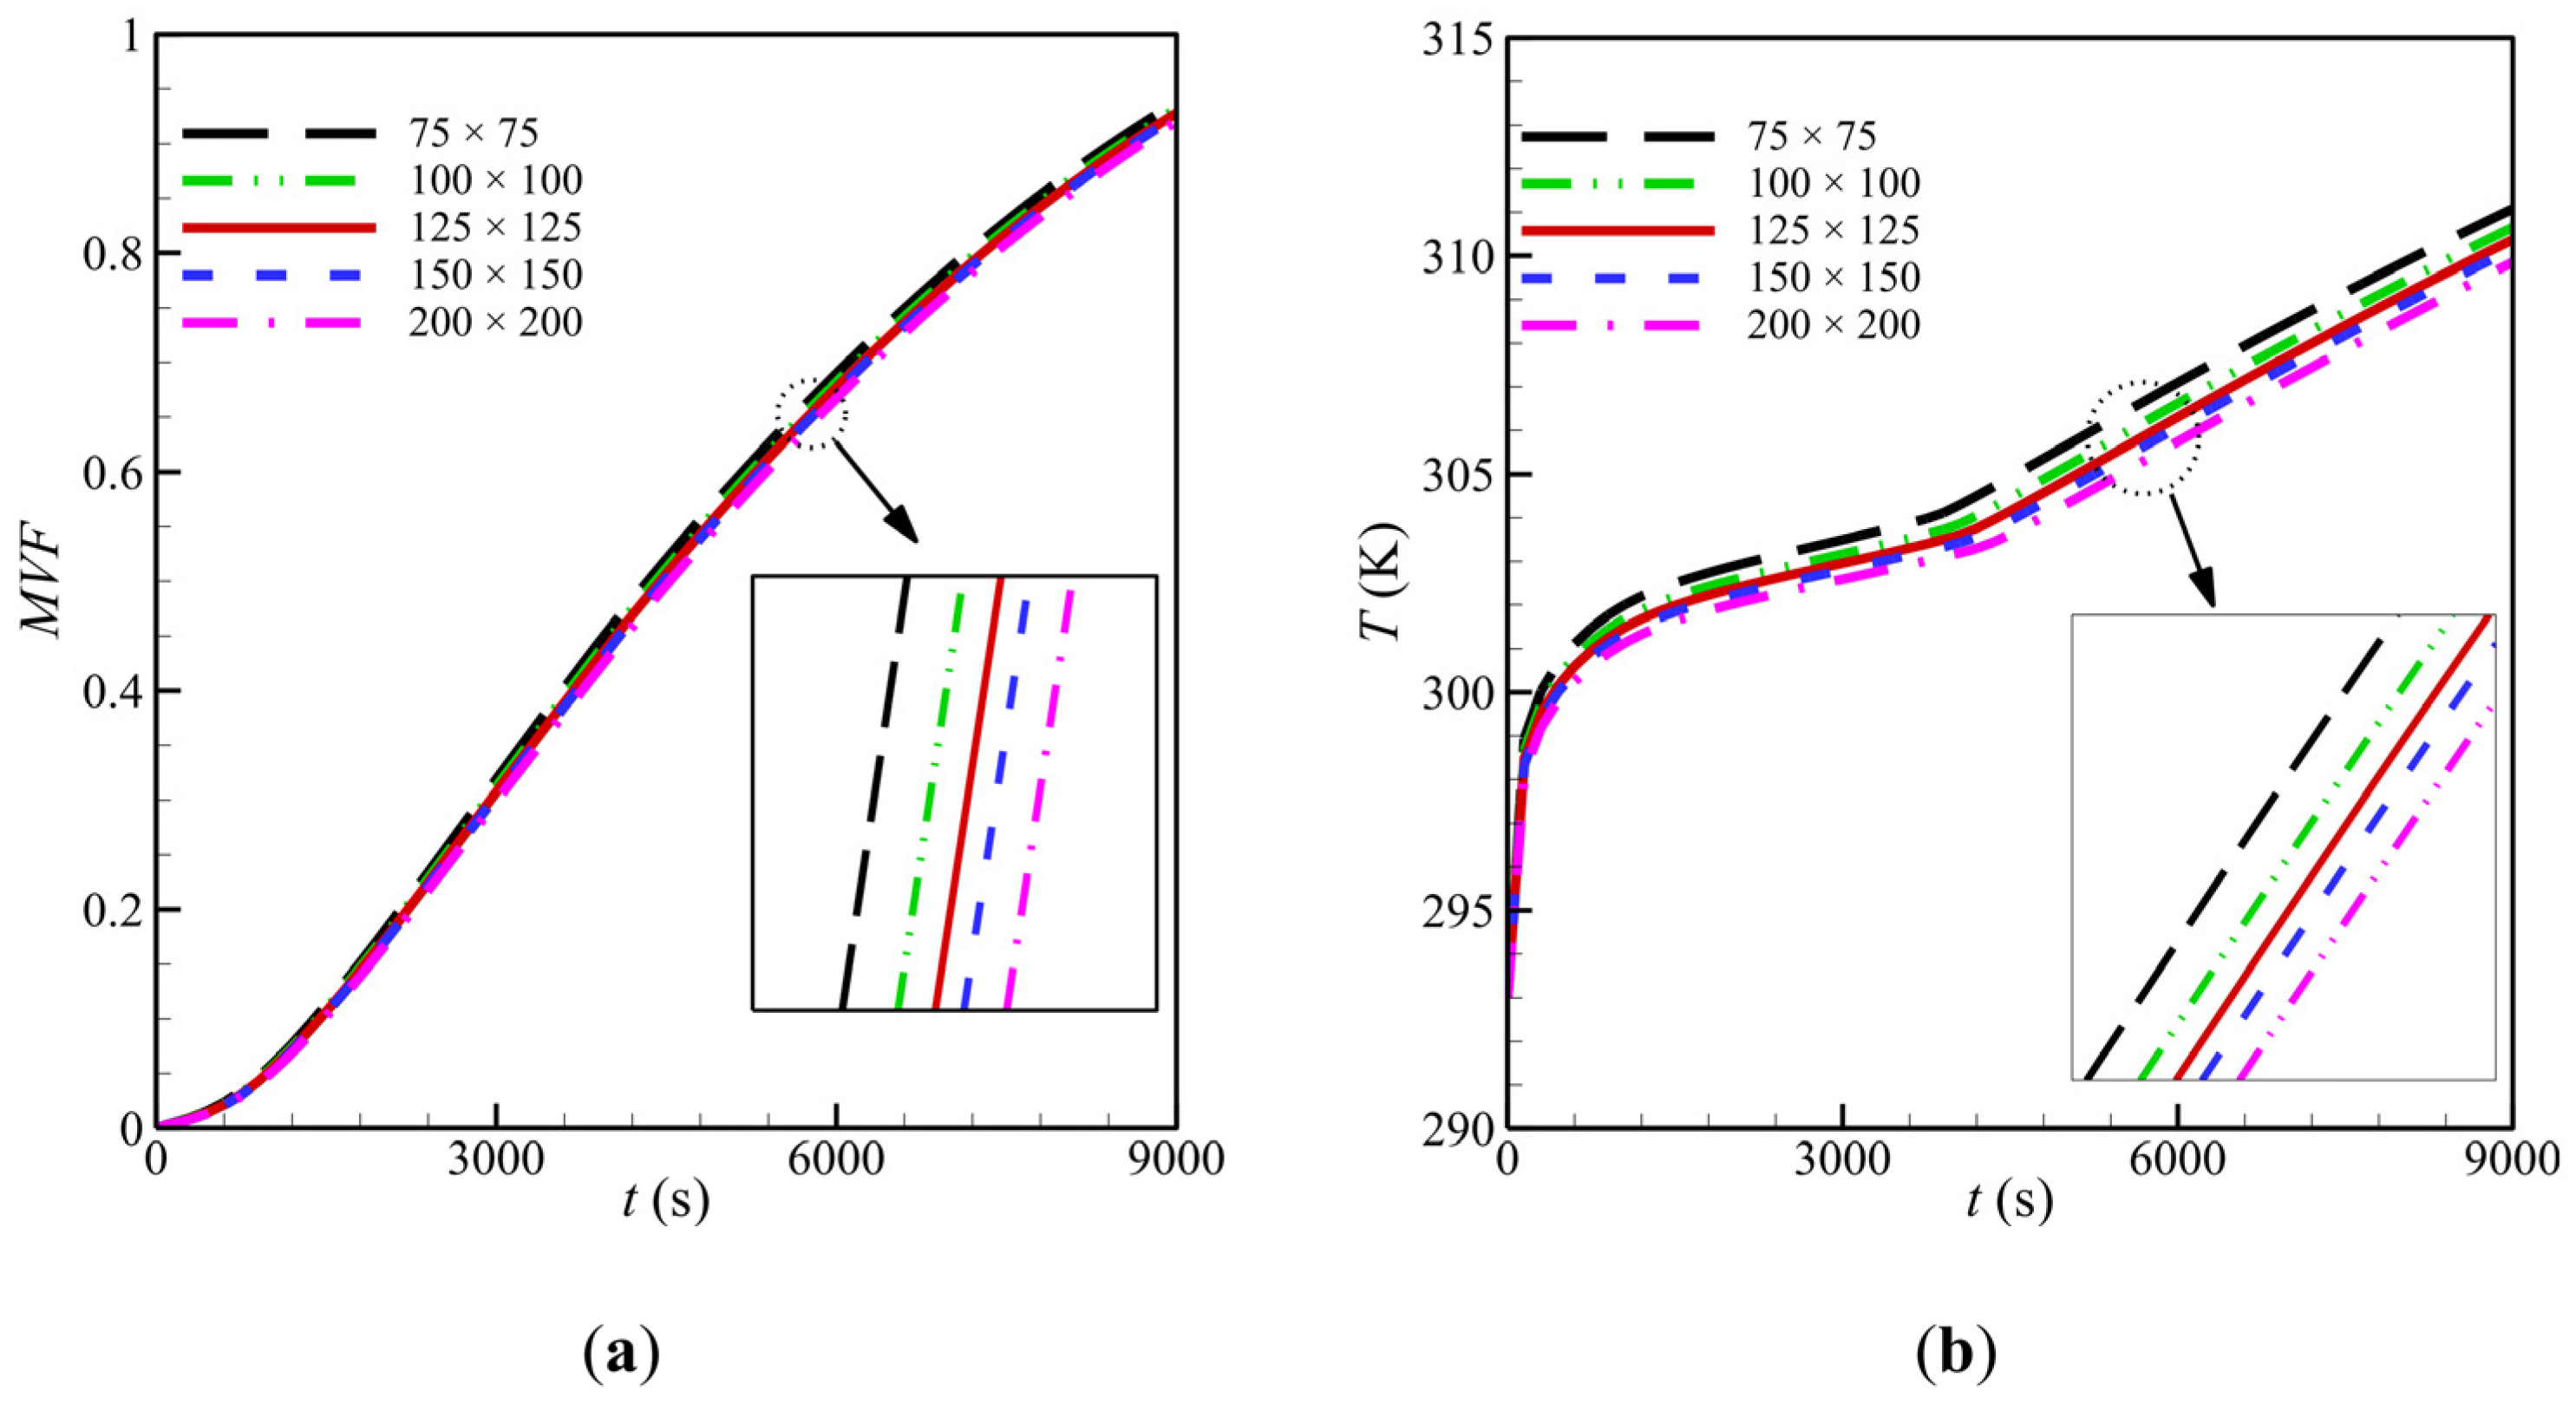
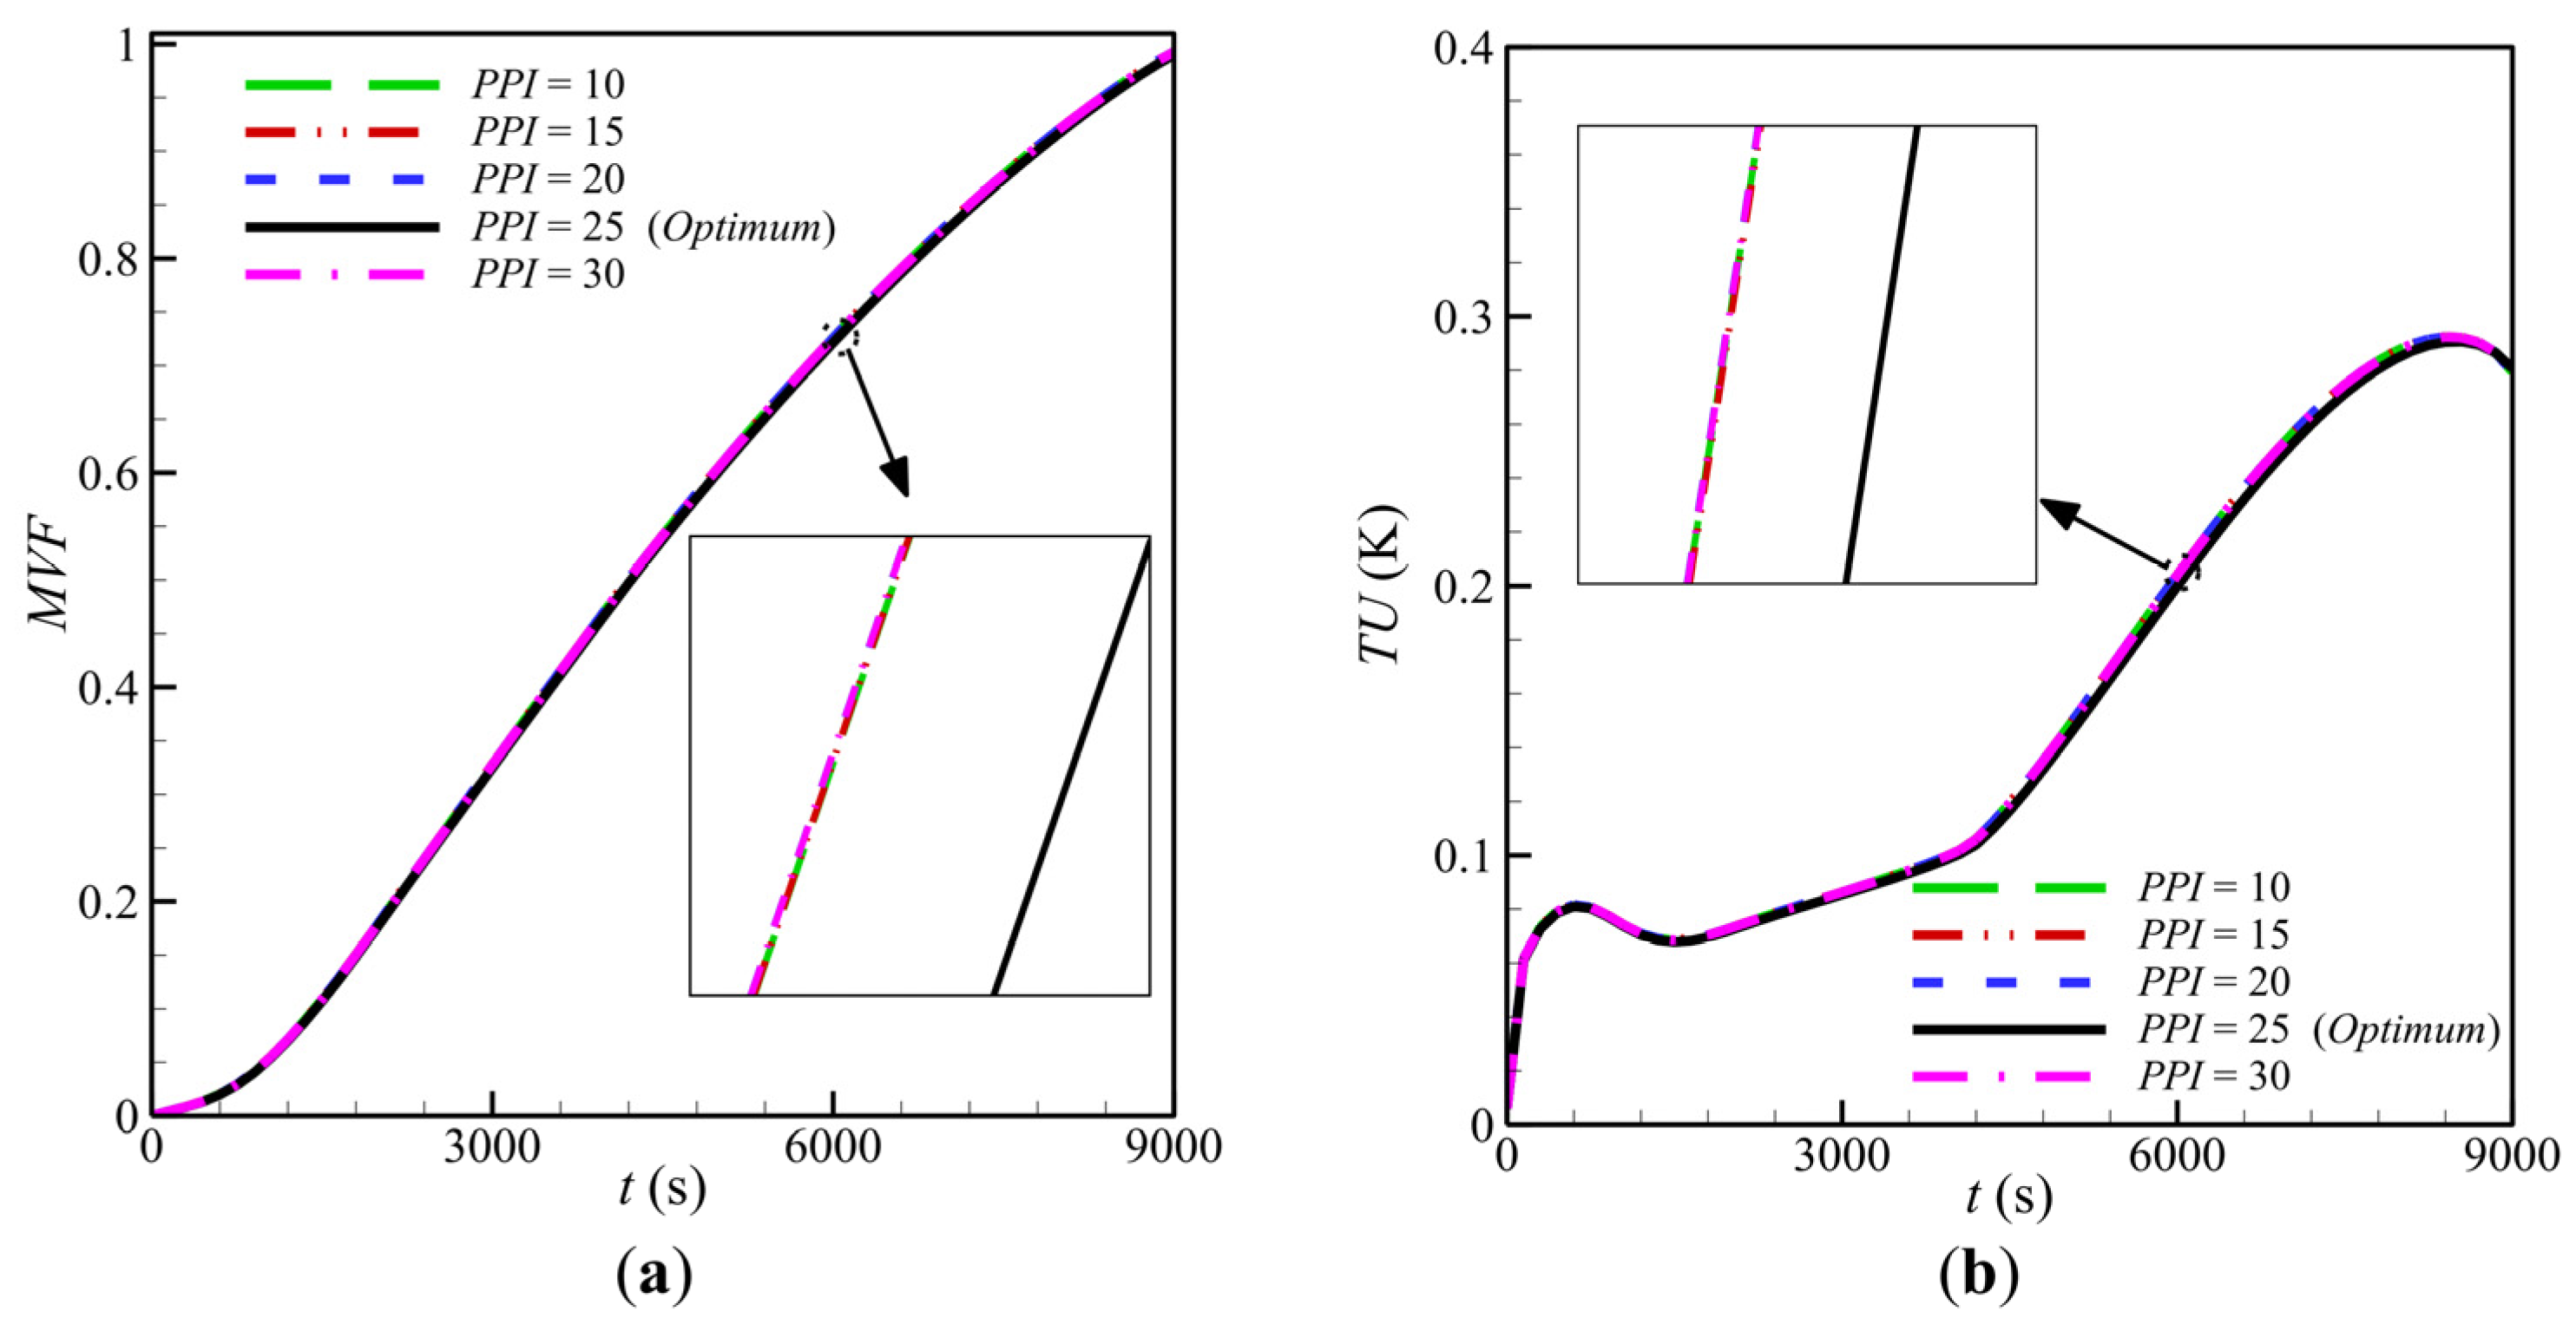
3. Numerical Approach and Grid Dependency
4. Results and Discussion
5. Conclusions
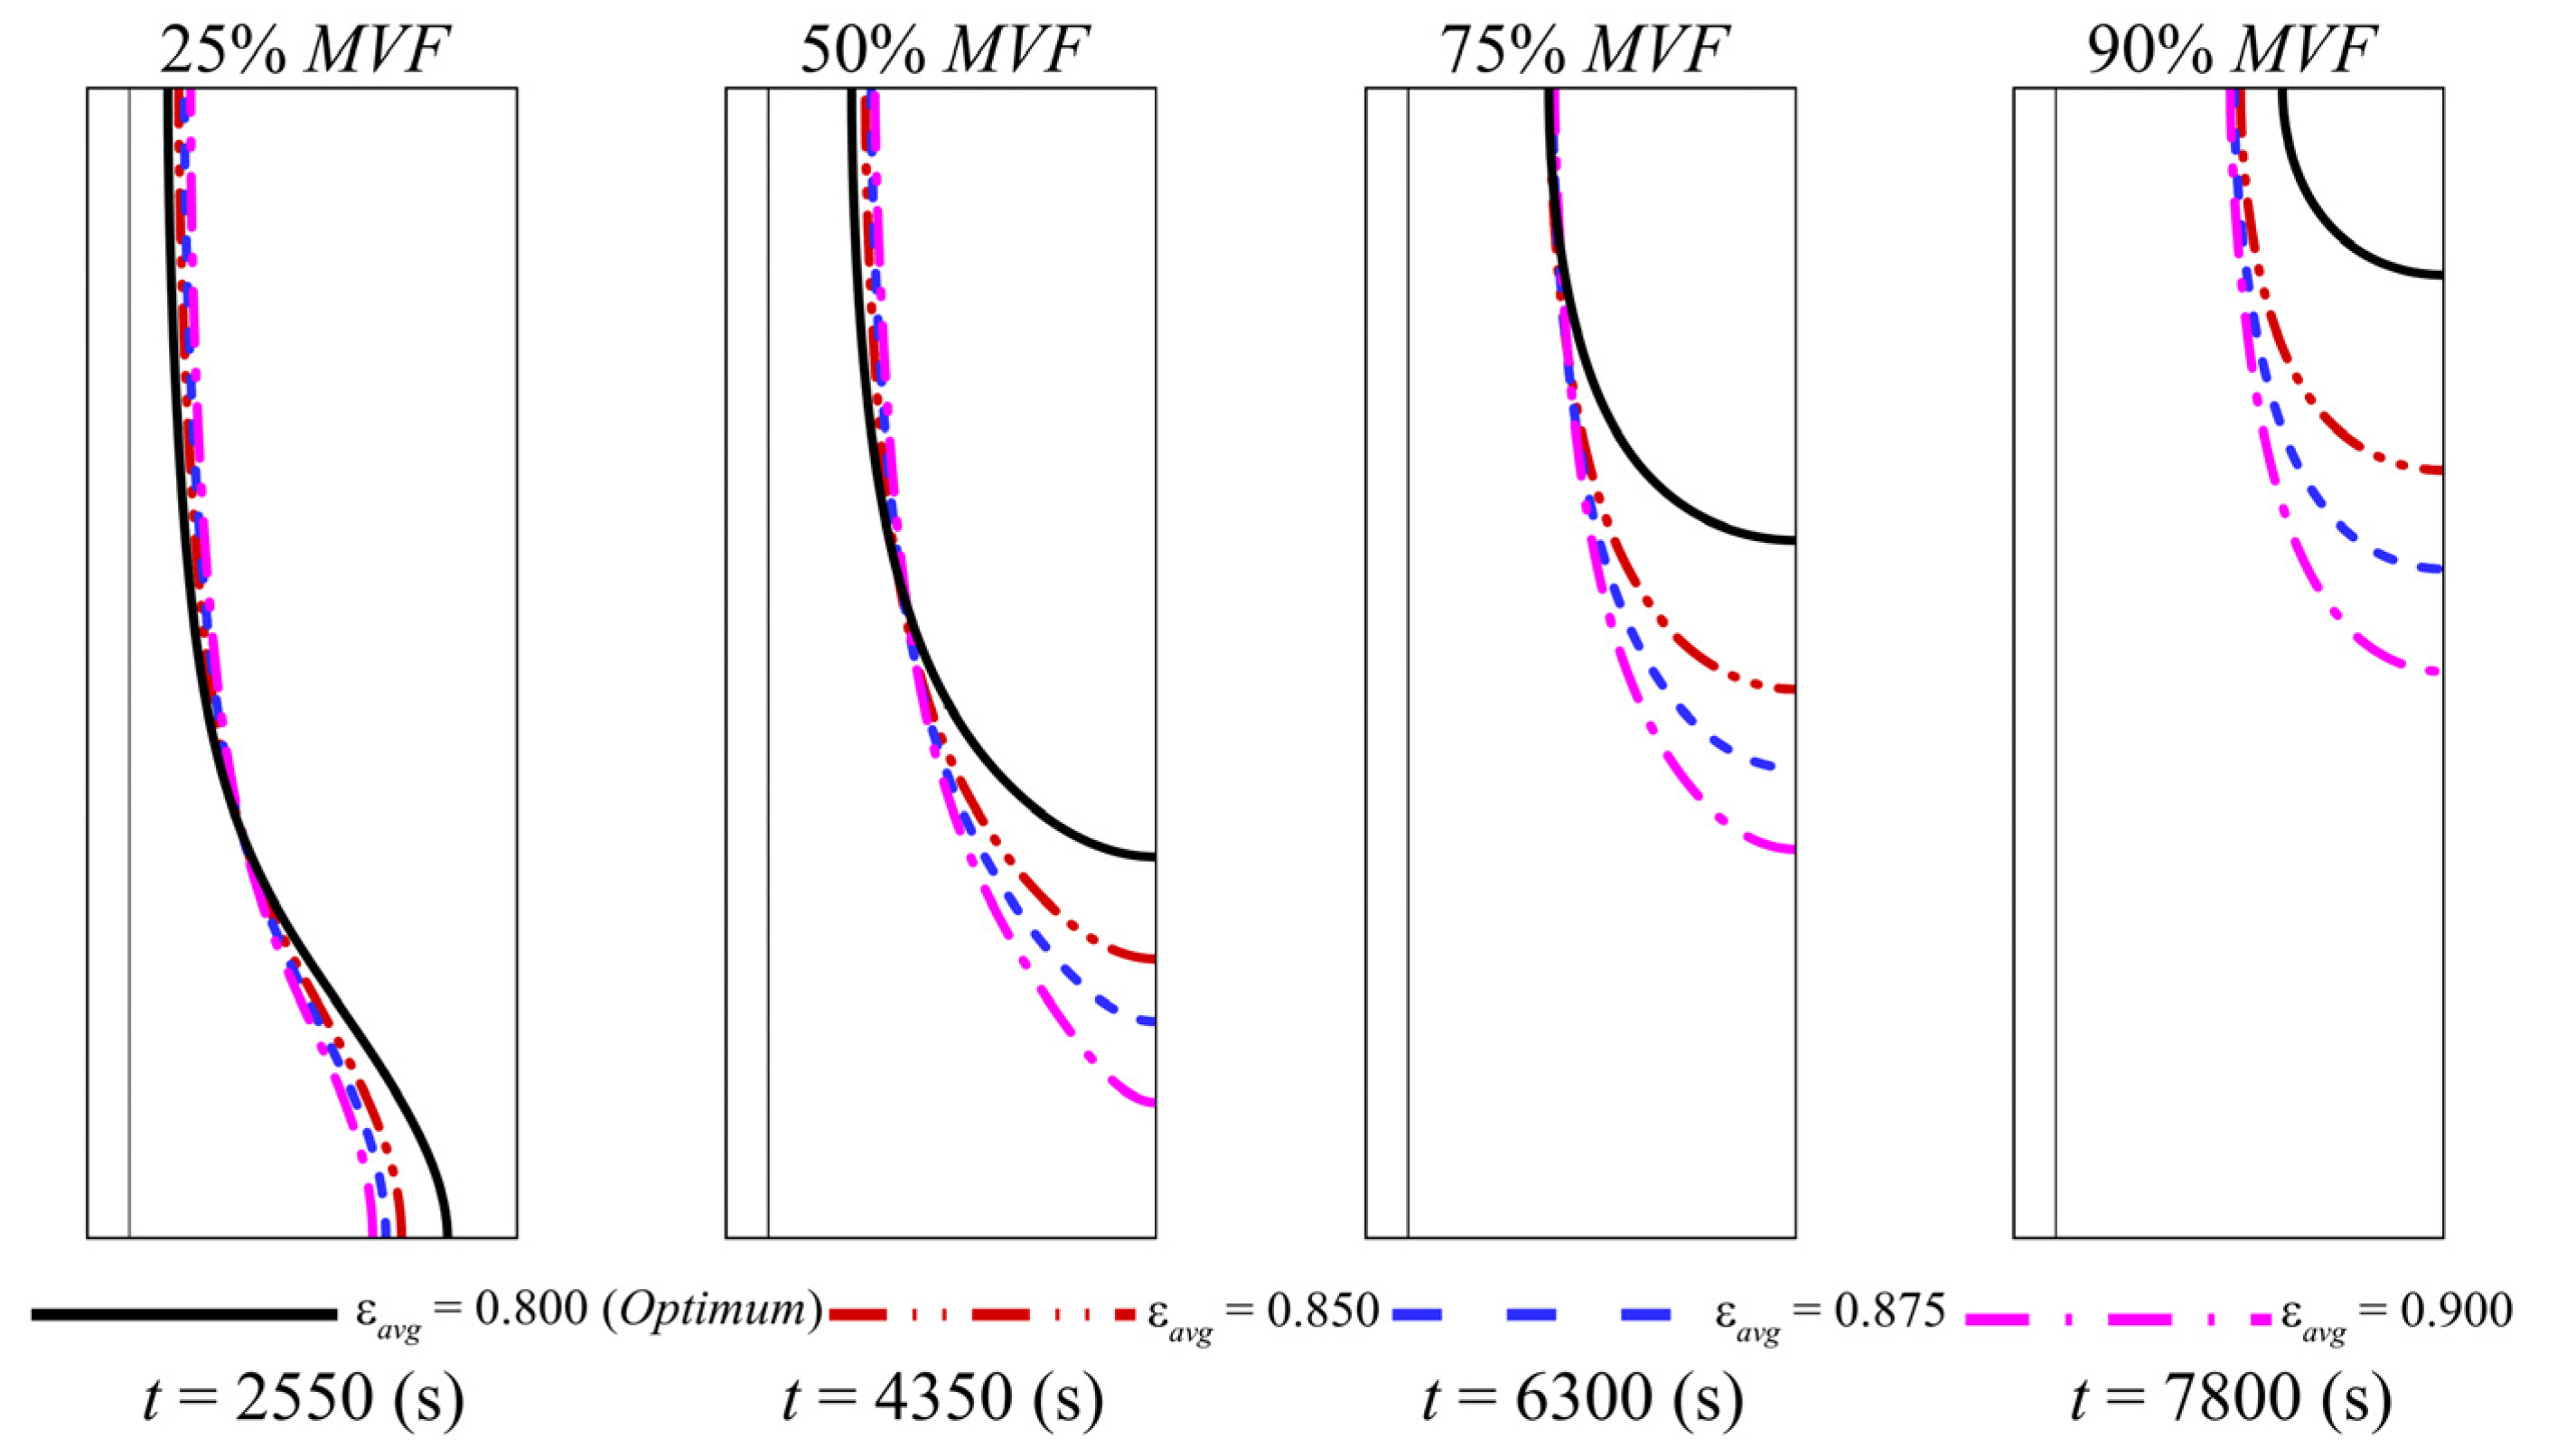
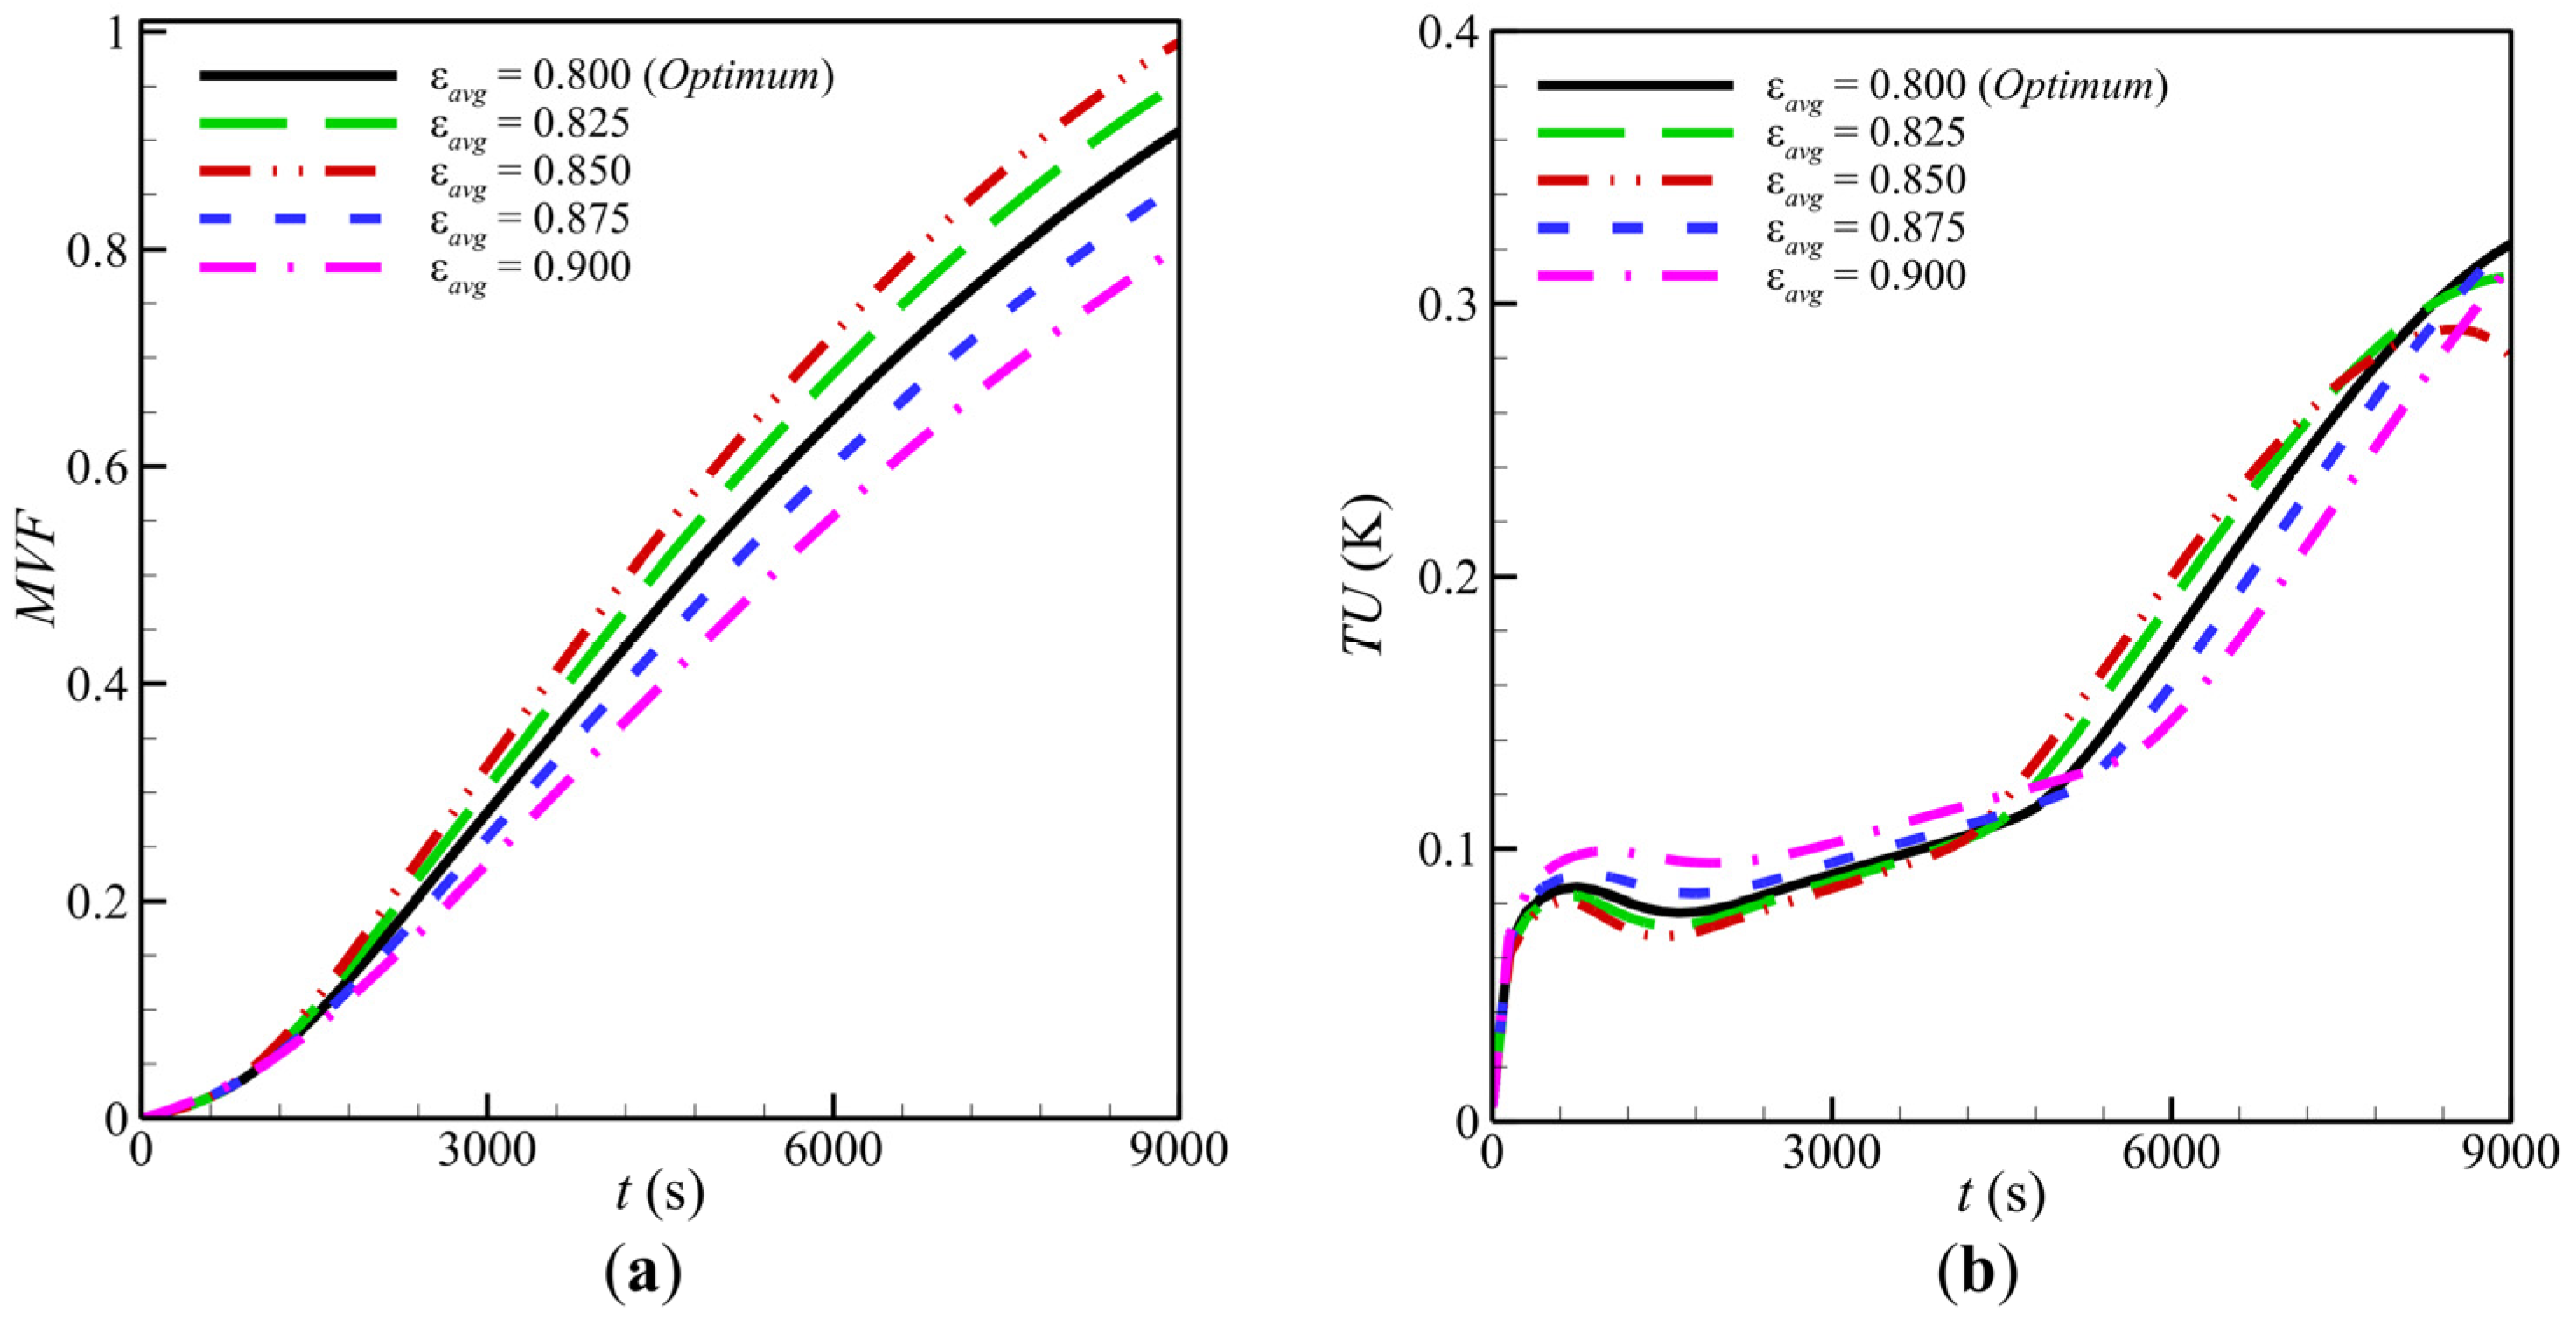
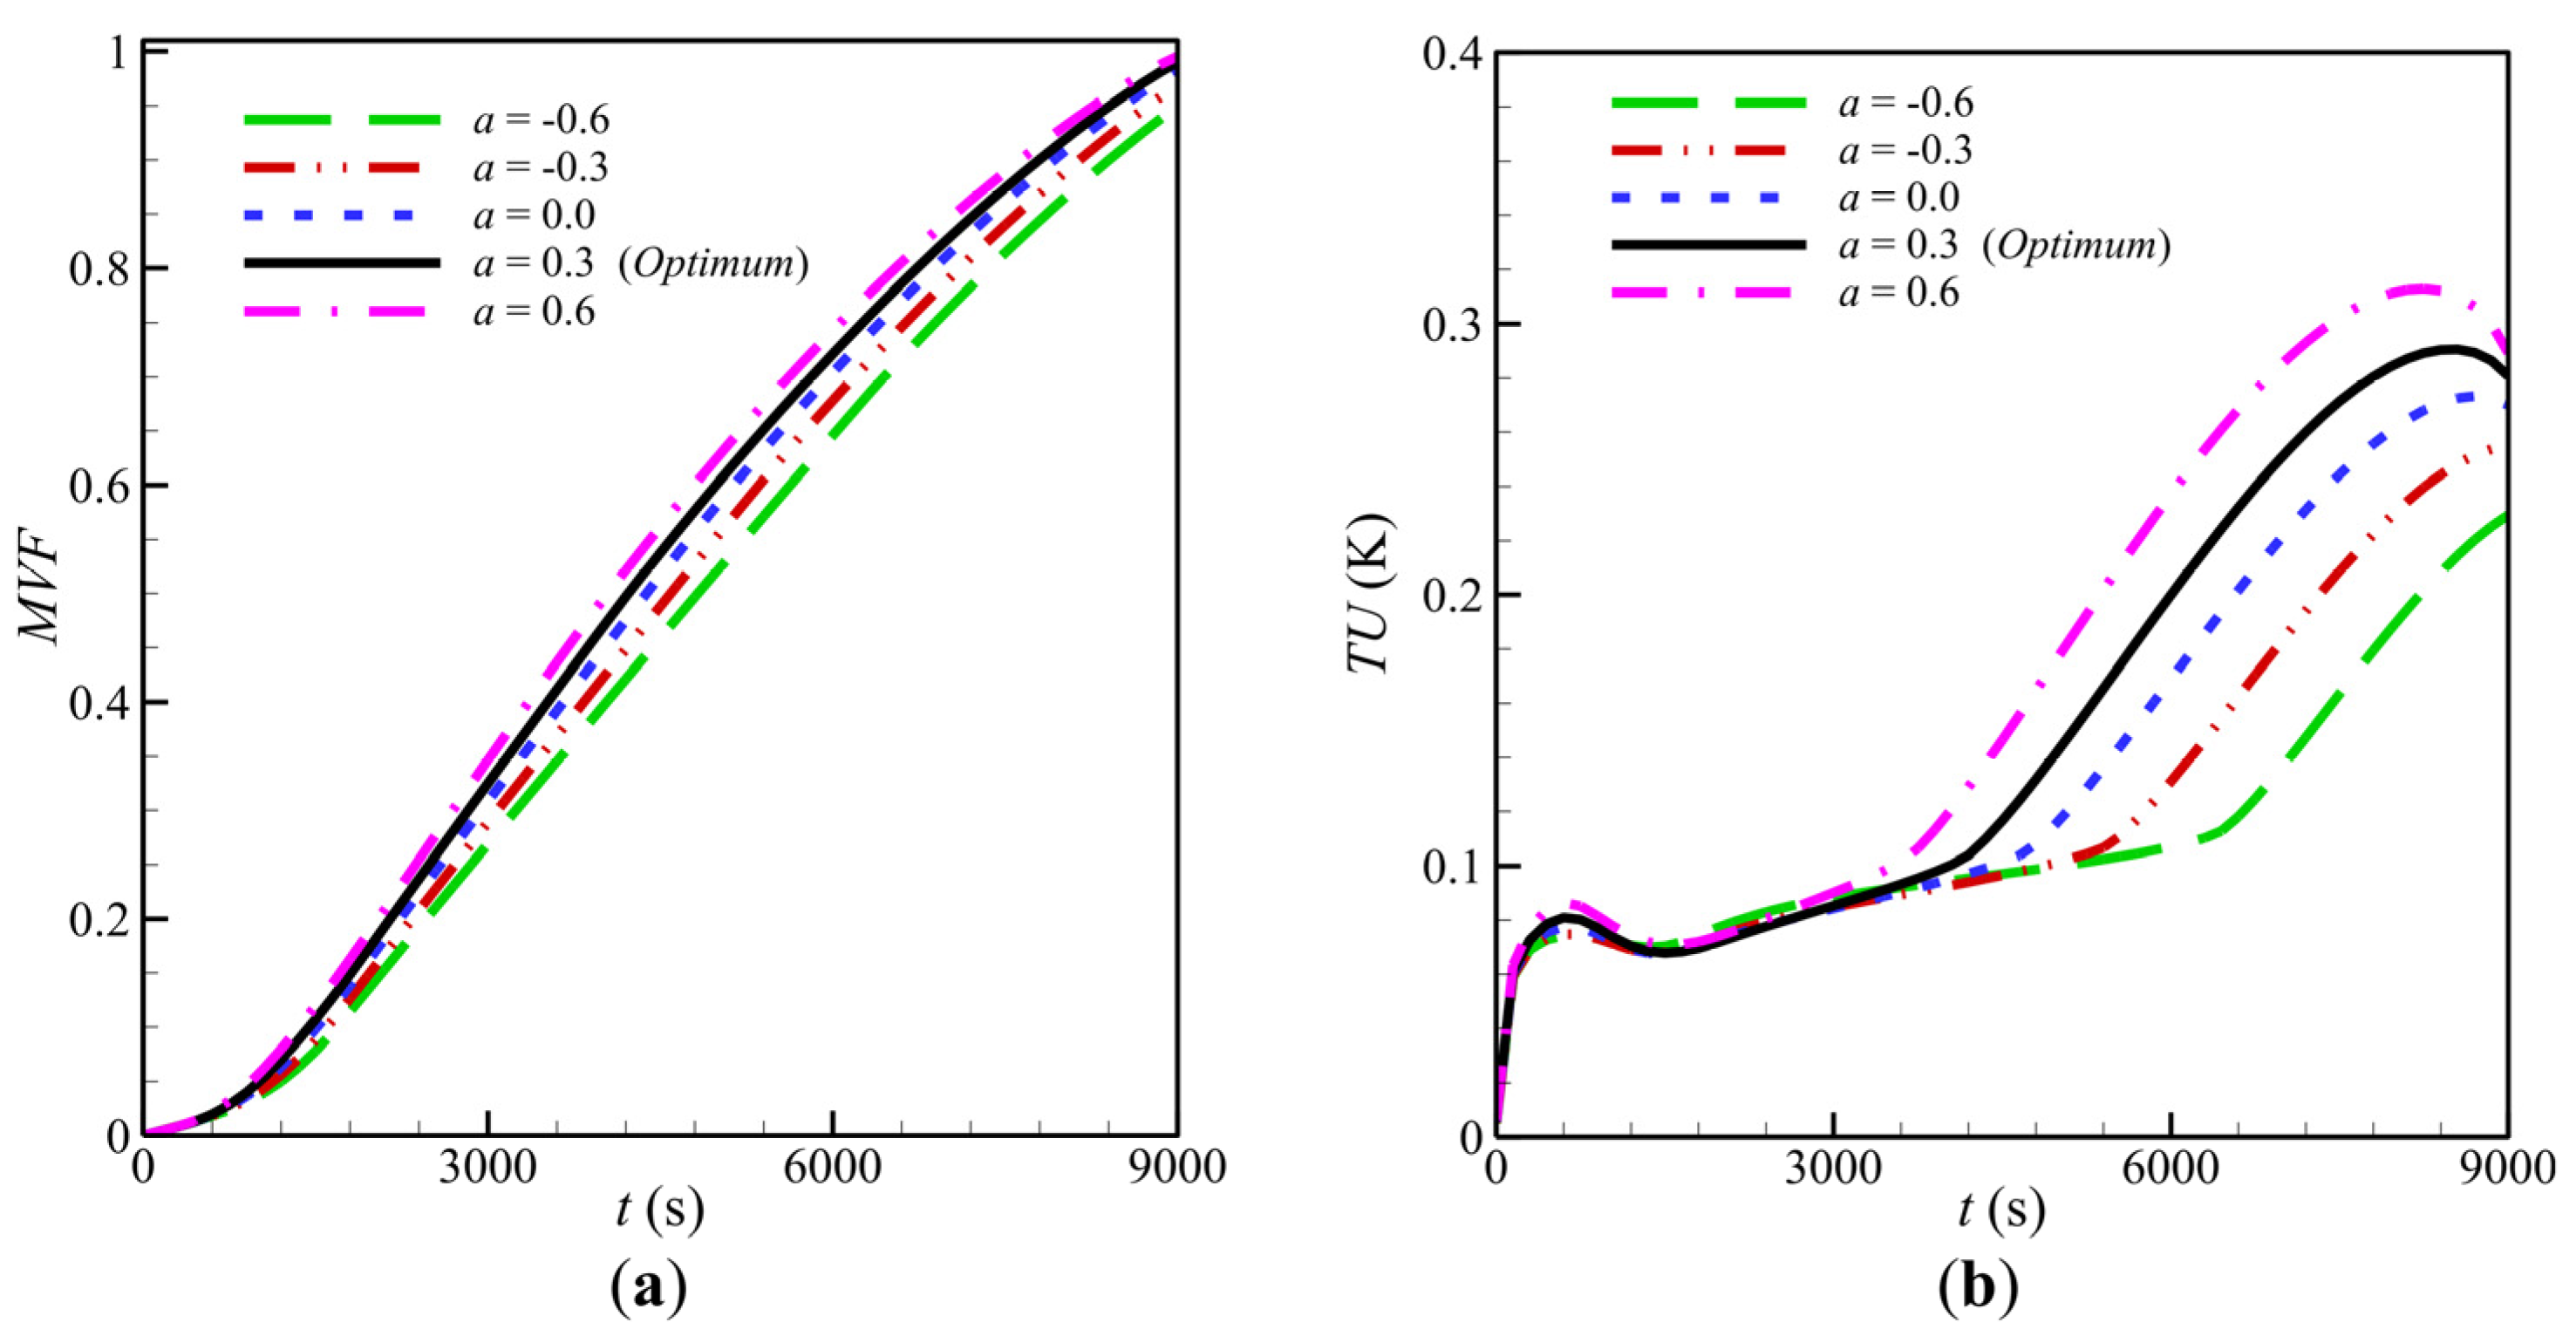
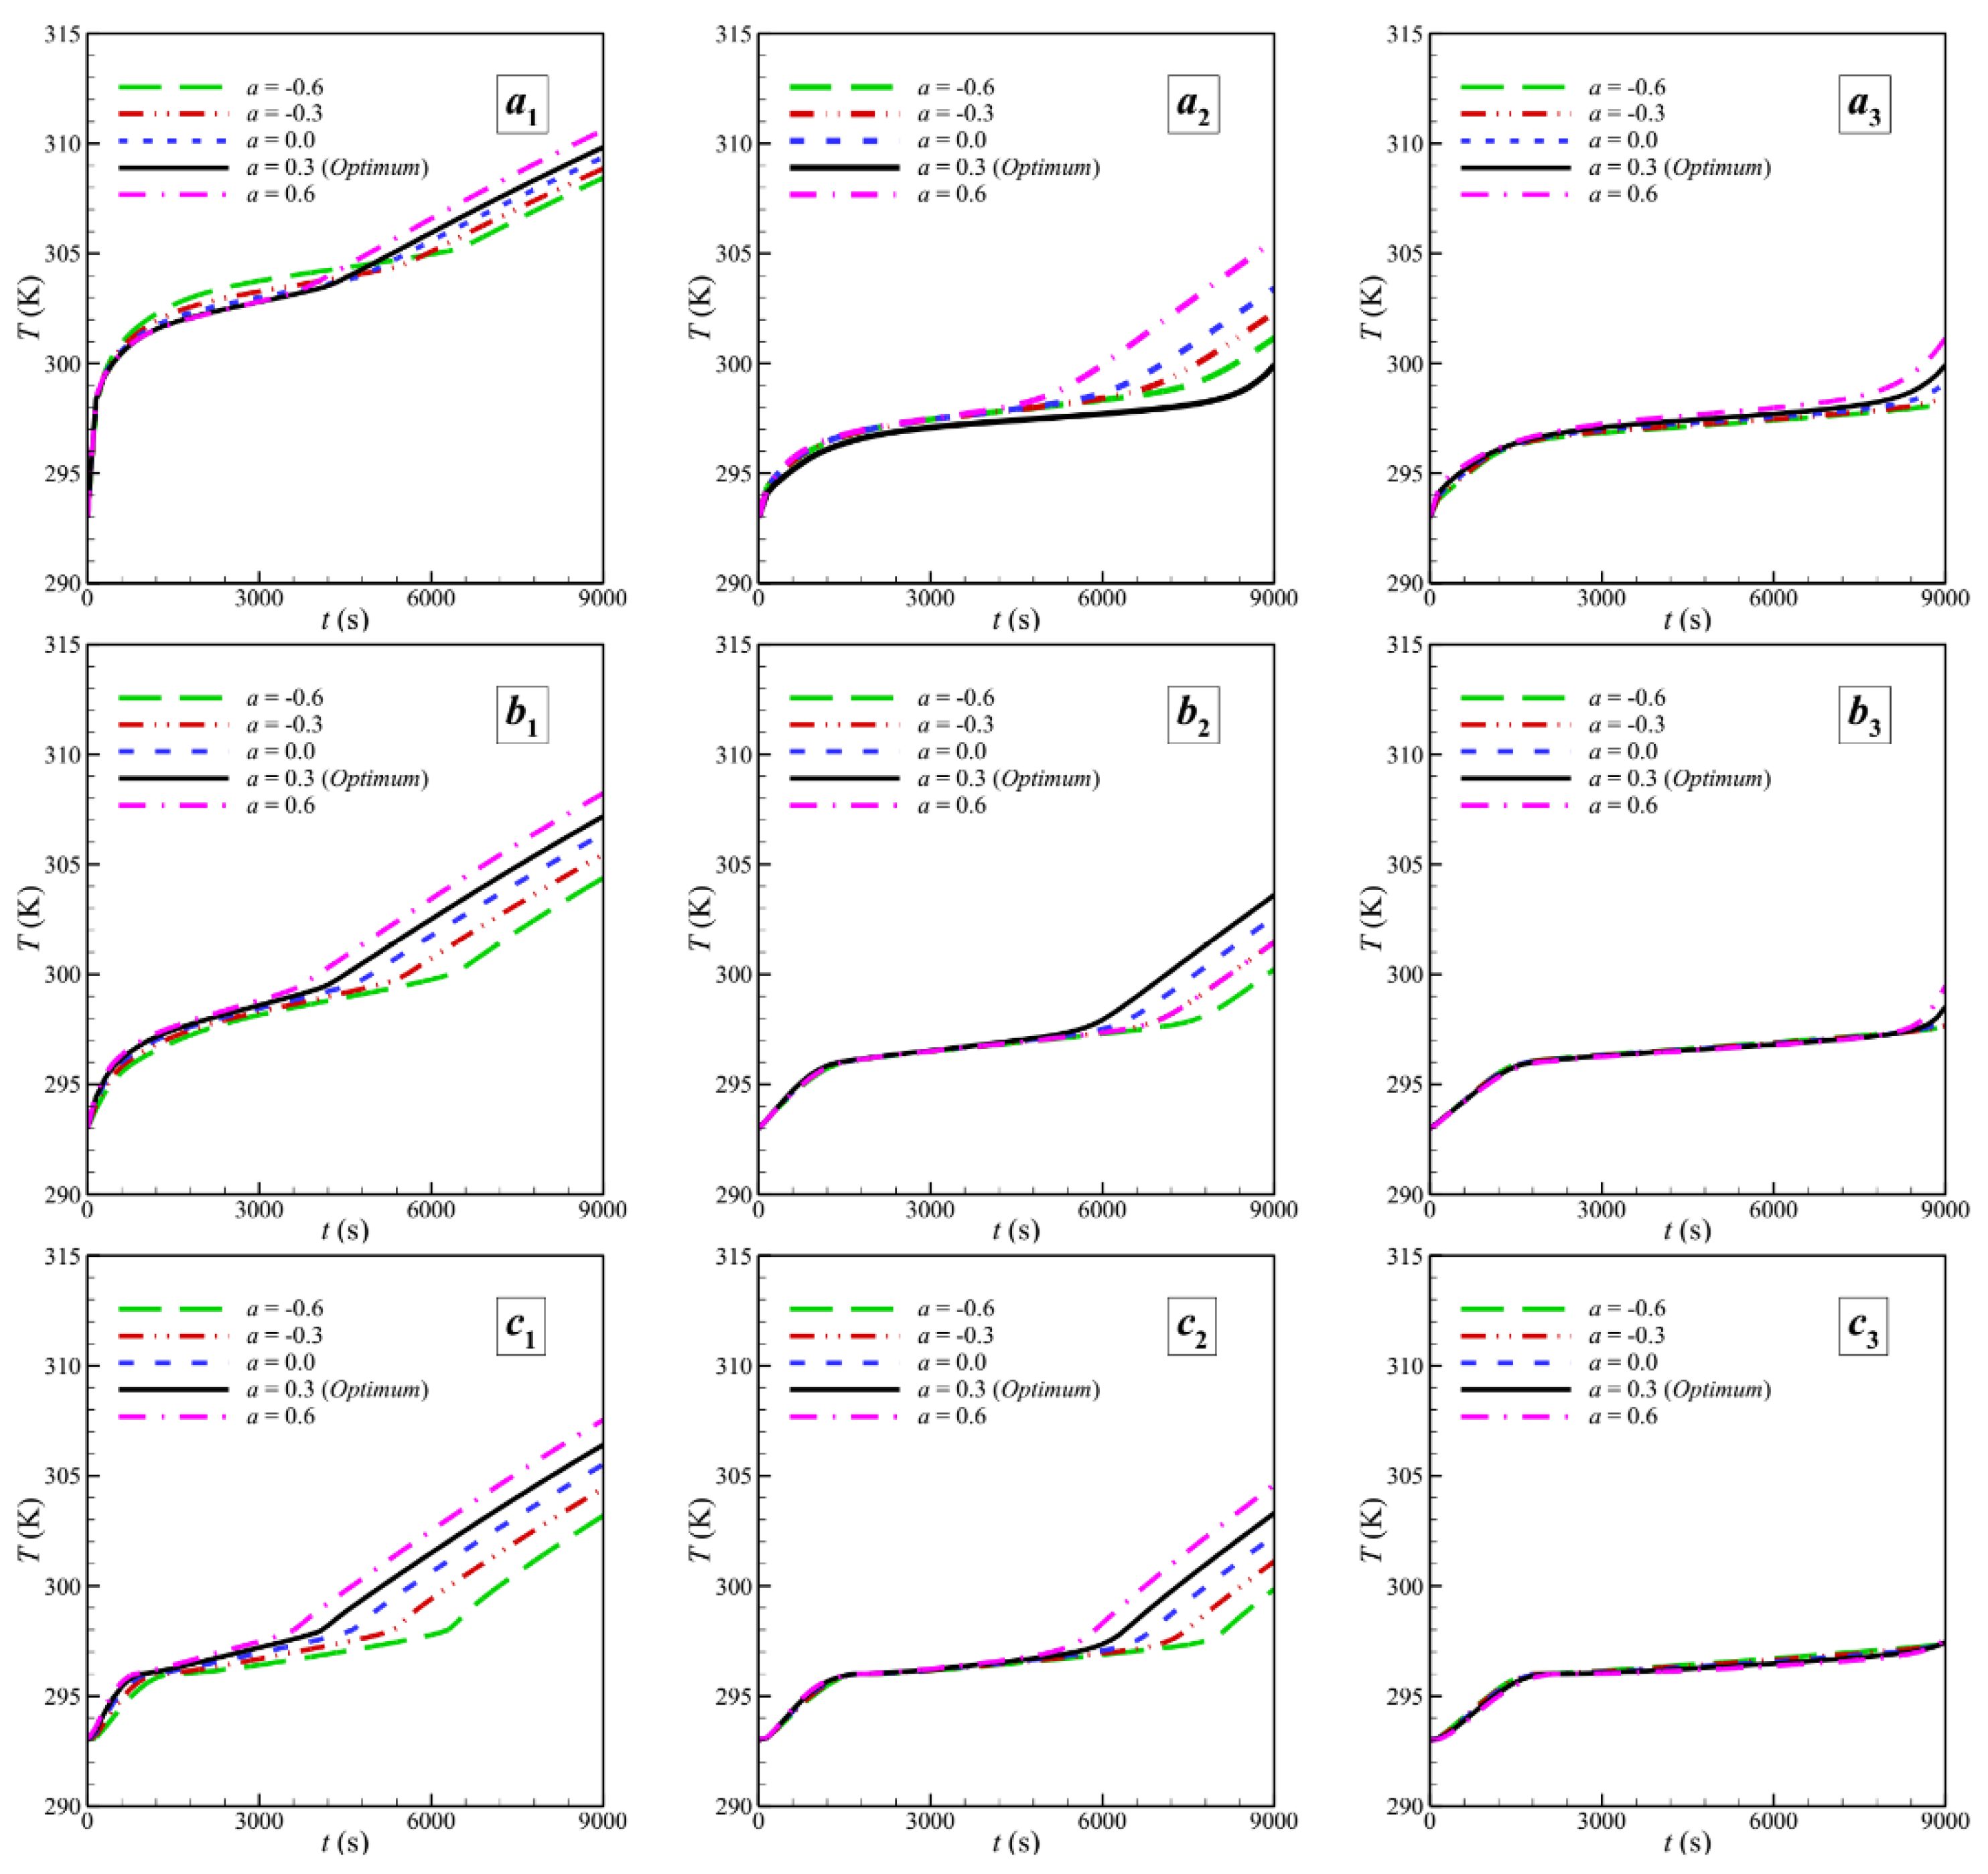
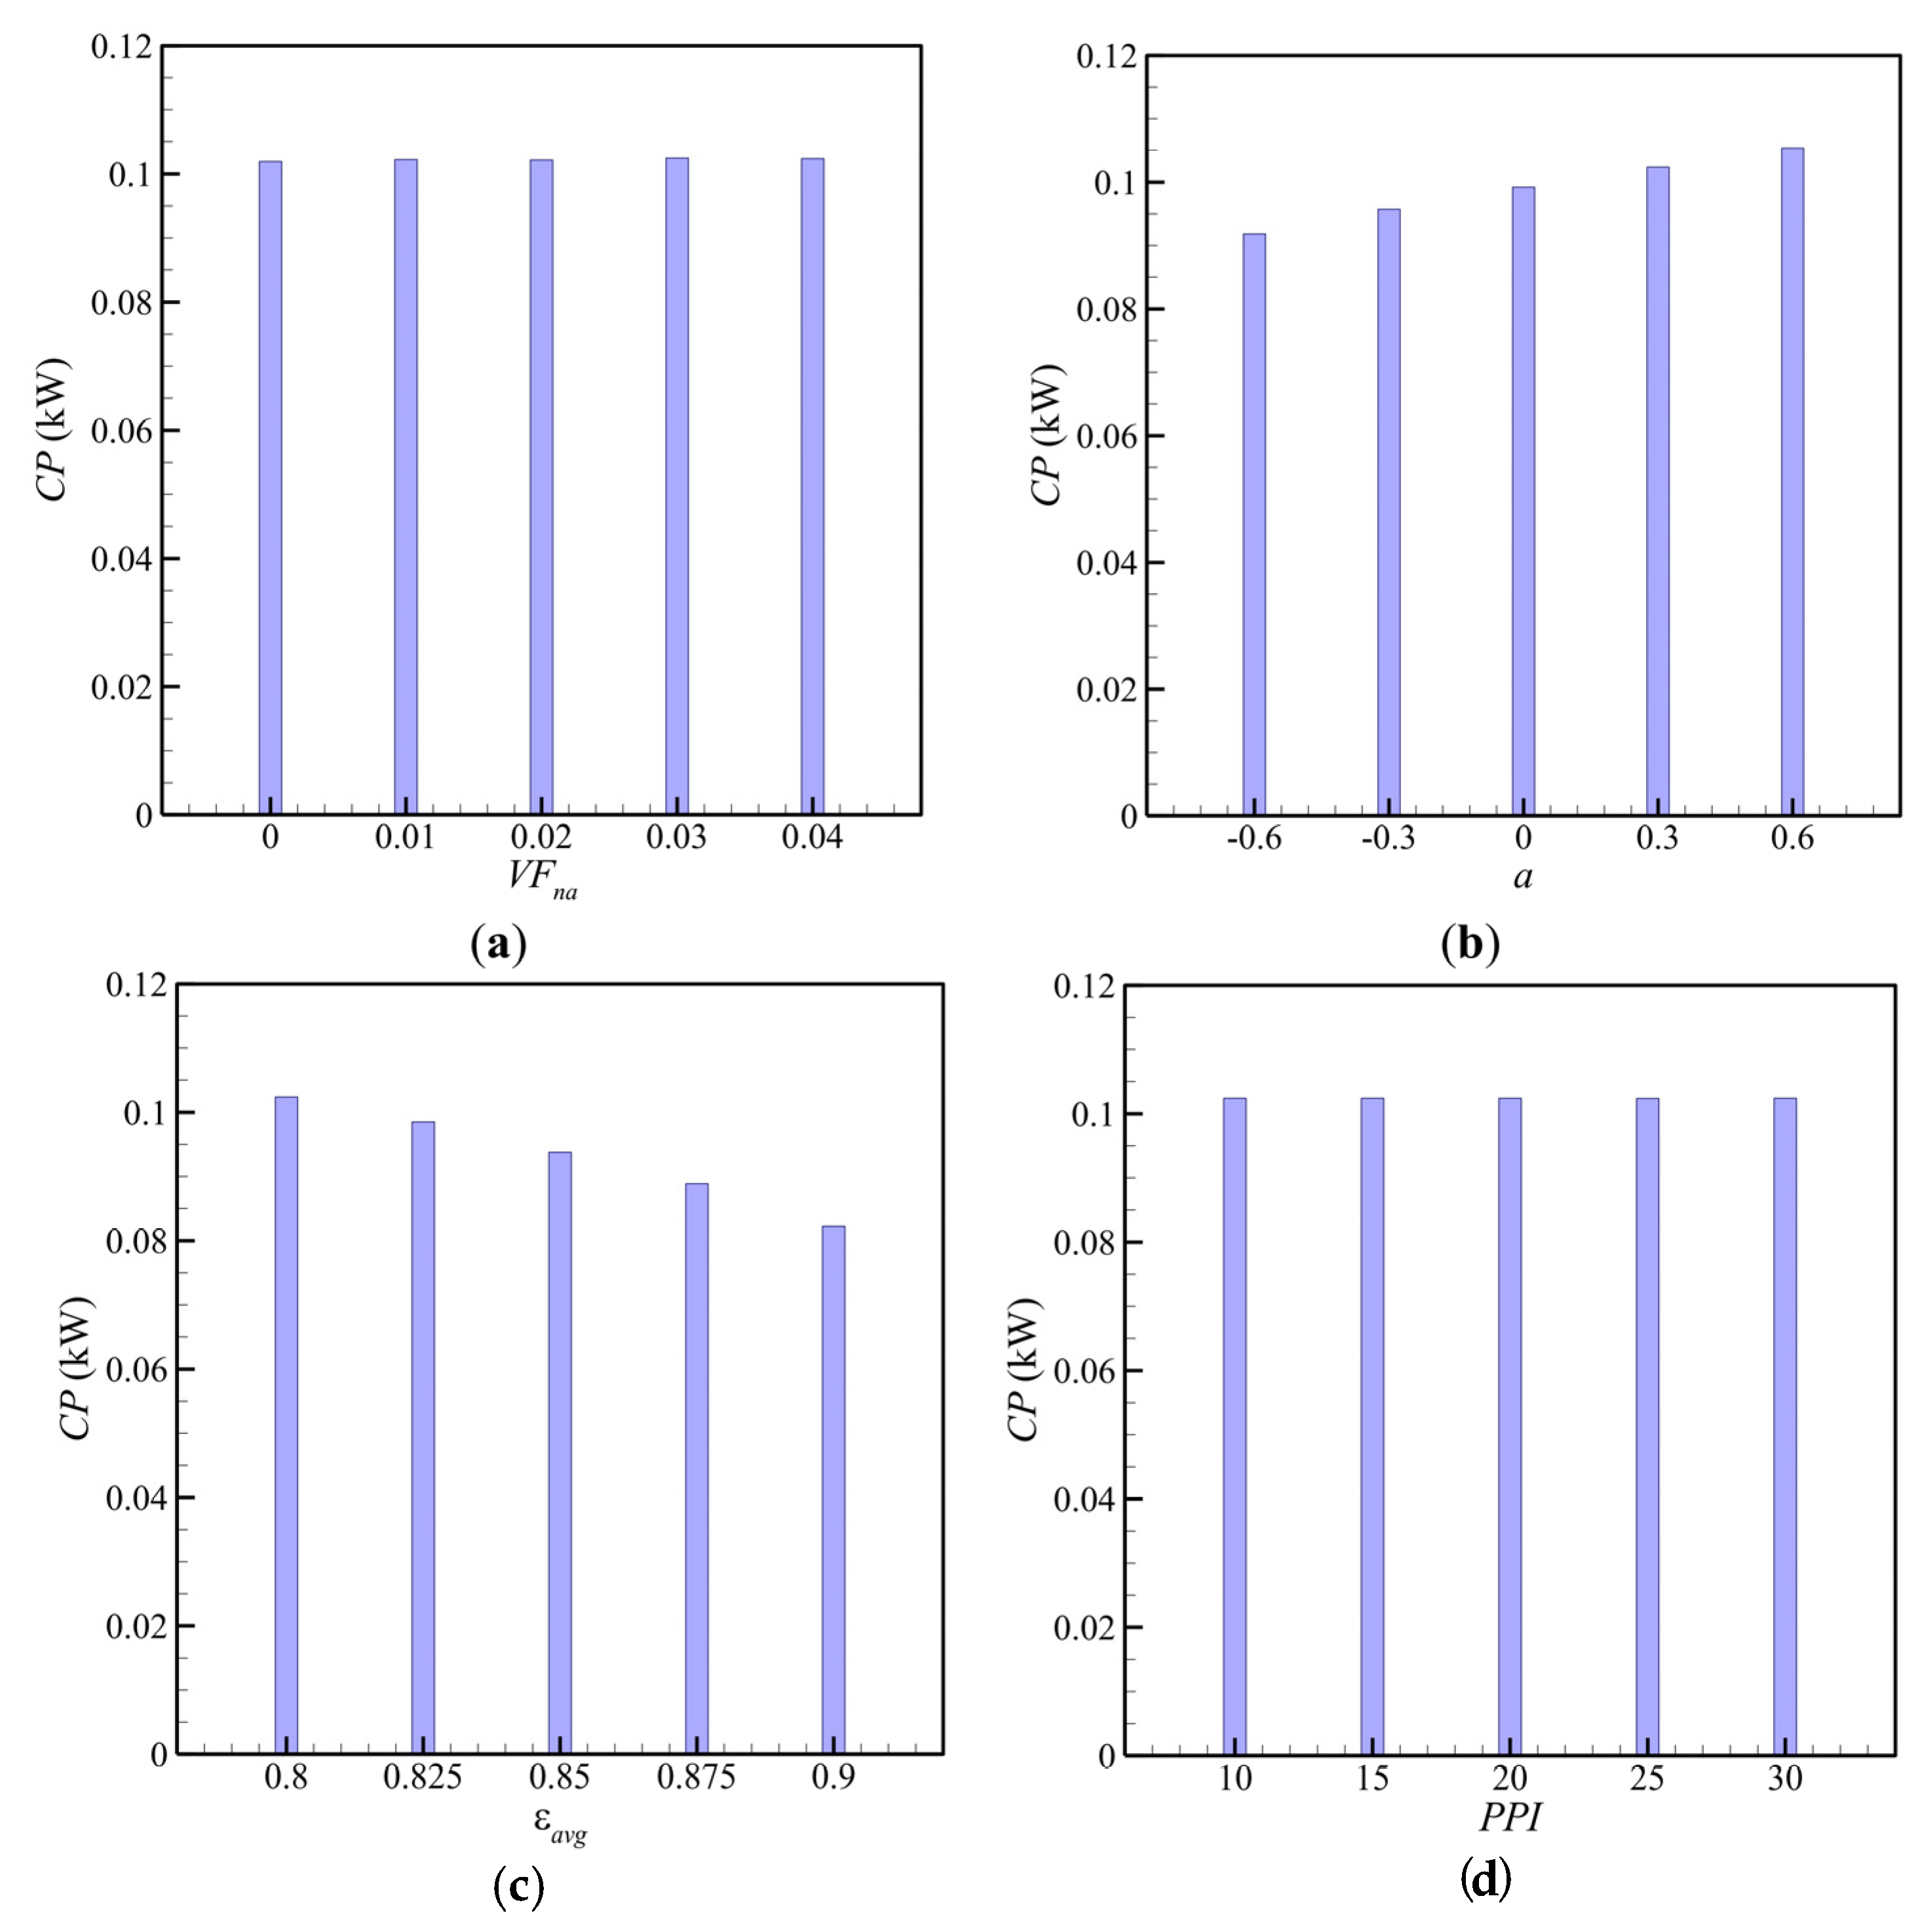
- The average porosity was the dominant factor influencing the charging time and power. Thus, in the design of TES units improved by metal foams, the first step should be selecting the average porosity of the metal foam. The uniformity of the porous medium contributed to heat transfer, and a positive value of porosity gradient (a > 0) could reduce the charging time of the TES unit. A positive porosity gradient corresponded to low porosity at the bottom and high porosity at the top of the PCM enclosure.
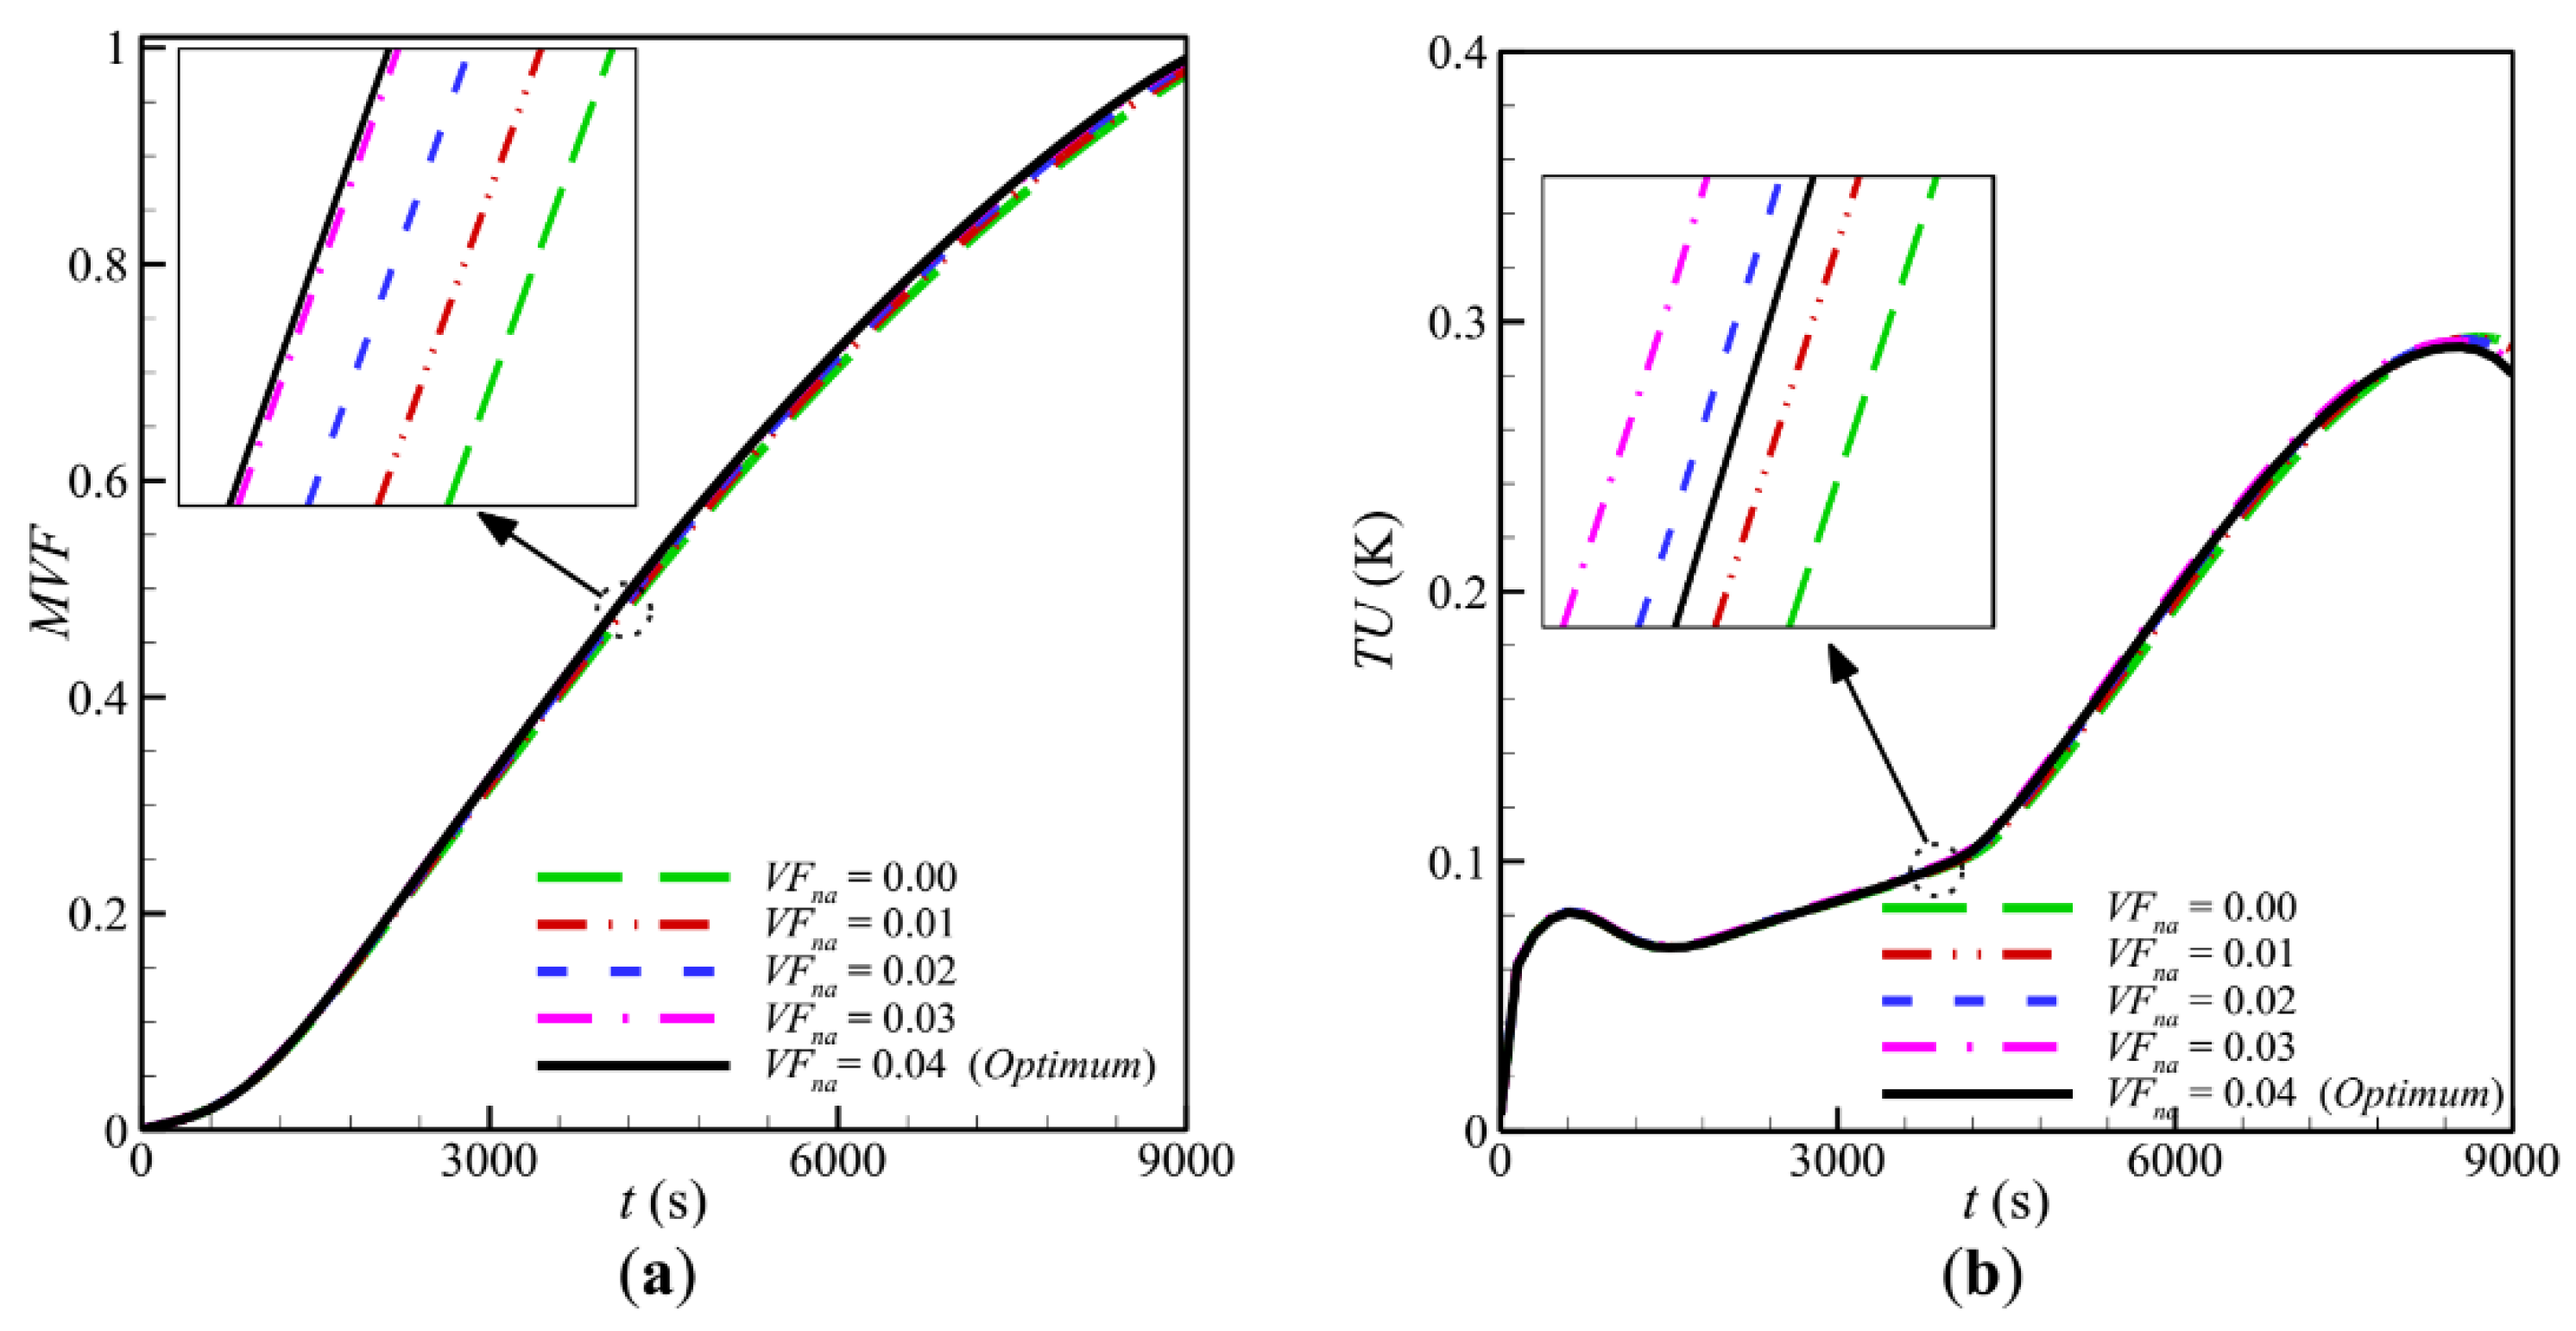
- The volume fraction of nanoparticles was the second most important parameter affecting the TES unit’s phase change behavior. The increase in nanoparticle volume fraction smoothly decreased the charging time.
- The porous medium’s average pore size had a negligible influence on the charging time. This design factor was the least critical parameter among design variables.
Author Contributions
Funding
Institutional Review Board Statement
Informed Consent Statement
Data Availability Statement
Conflicts of Interest
References
- Pomianowski, M.; Heiselberg, P.; Zhang, Y. Review of thermal energy storage technologies based on PCM application in buildings. Energy Build. 2013, 67, 56–69. [Google Scholar] [CrossRef]
- Iten, M.; Liu, S.; Shukla, A. A review on the air-PCM-TES application for free cooling and heating in the buildings. Renew. Sustain. Energy Rev. 2016, 61, 175–186. [Google Scholar] [CrossRef]
- Sahoo, S.K.; Das, M.K.; Rath, P. Application of TCE-PCM based heat sinks for cooling of electronic components: A review. Renew. Sustain. Energy Rev. 2016, 59, 550–582. [Google Scholar] [CrossRef]
- Du, K.; Calautit, J.; Eames, P.; Wu, Y. A state-of-the-art review of the application of phase change materials (PCM) in Mobilized-Thermal Energy Storage (M-TES) for recovering low-temperature industrial waste heat (IWH) for distributed heat supply. Renew. Energy 2021, 168, 1040–1057. [Google Scholar] [CrossRef]
- Jaguemont, J.; Omar, N.; Bossche, P.V.D.; Mierlo, J. Phase-change materials (PCM) for automotive applications: A review. Appl. Therm. Eng. 2018, 132, 308–320. [Google Scholar] [CrossRef]
- Bahraseman, H.G.; Languri, E.M.; East, J. Fast charging of thermal energy storage systems enabled by phase change materials mixed with expanded graphite. Int. J. Heat Mass Transf. 2017, 109, 1052–1058. [Google Scholar] [CrossRef]
- Liu, X.; Huang, Y.; Zhang, X.; Zhang, C.; Zhou, B. Investigation on charging enhancement of a latent thermal energy storage device with uneven tree-like fins. Appl. Therm. Eng. 2020, 179, 115749. [Google Scholar] [CrossRef]
- Nakhchi, M.; Esfahani, J. Improving the melting performance of PCM thermal energy storage with novel stepped fins. J. Energy Storage 2020, 30, 101424. [Google Scholar] [CrossRef]
- Tiari, S.; Qiu, S.; Mahdavi, M. Discharging process of a finned heat pipe–assisted thermal energy storage system with high temperature phase change material. Energy Convers. Manag. 2016, 118, 426–437. [Google Scholar] [CrossRef]
- Zhang, L.; Zhou, K.; Wei, Q.; Ma, L.; Ye, W.; Li, H.; Zhou, B.; Yu, Z.; Lin, C.-T.; Luo, J.; et al. Thermal conductivity enhancement of phase change materials with 3D porous diamond foam for thermal energy storage. Appl. Energy 2019, 233–234, 208–219. [Google Scholar] [CrossRef]
- Hu, N.; Li, H.; Wei, Q.; Zhou, K.; Zhu, W.; Zhang, L.; Li, S.; Ye, W.; Jiao, Z.; Luo, J.; et al. Continuous diamond-carbon nanotube foams as rapid heat conduction channels in composite phase change materials based on the stable hierarchical structure. Compos. Part B Eng. 2020, 200, 108293. [Google Scholar] [CrossRef]
- Talebizadehsardari, P.; Mohammed, H.I.; Mahdi, J.M.; Gillott, M.; Walker, G.S.; Grant, D.; Giddings, D. Effect of airflow channel arrangement on the discharge of a composite metal foam-phase change material heat exchanger. Int. J. Energy Res. 2021, 45, 2593–2609. [Google Scholar] [CrossRef]
- Sardari, P.T.; Babaei-Mahani, R.; Giddings, D.; Yasseri, S.; A Moghimi, M.; Bahai, H. Energy recovery from domestic radiators using a compact composite metal Foam/PCM latent heat storage. J. Clean. Prod. 2020, 257, 120504. [Google Scholar] [CrossRef]
- Zhao, C.; Opolot, M.; Liu, M.; Bruno, F.; Mancin, S.; Hooman, K. Numerical study of melting performance enhancement for PCM in an annular enclosure with internal-external fins and metal foams. Int. J. Heat Mass Transf. 2020, 150, 119348. [Google Scholar] [CrossRef]
- Zhang, X.; Sheikholeslami, M.; Jafaryar, M.; Sheremet, M.A.; Shafee, A.; Babazadeh, H. Simulation for melting of paraffin for saving energy with utilize of nanoparticles. J. Mol. Liq. 2020, 313, 113574. [Google Scholar] [CrossRef]
- Bondareva, N.S.; Gibanov, N.S.; A Sheremet, M. Melting of nano-enhanced PCM inside finned radiator. J. Phys. Conf. Ser. 2018, 1105, 012023. [Google Scholar] [CrossRef]
- Mahdi, J.M.; Mohammed, H.I.; Hashim, E.T.; Talebizadehsardari, P.; Nsofor, E.C. Solidification enhancement with multiple PCMs, cascaded metal foam and nanoparticles in the shell-and-tube energy storage system. Appl. Energy 2020, 257, 113993. [Google Scholar] [CrossRef]
- Al-Jethelah, M.; Ebadi, S.; Venkateshwar, K.; Tasnim, S.; Mahmud, S.; Dutta, A. Charging nanoparticle enhanced bio-based PCM in open cell metallic foams: An experimental investigation. Appl. Therm. Eng. 2019, 148, 1029–1042. [Google Scholar] [CrossRef]
- Choi, S.-K.; Kim, S.-O.; Lee, T.-H. Computation of the Natural Convection of Nanofluid in a Square Cavity with Homogeneous and Nonhomogeneous Models. Numer. Heat Trans. Part A Appl. 2013, 65, 287–301. [Google Scholar] [CrossRef]
- Nield, D.A.; Bejan, A. Convection in Porous Media; Springer: New York, NY, USA, 2013; Volume 3. [Google Scholar]
- Shahsavar, A.; Ali, H.M.; Mahani, R.B.; Talebizadehsardari, P. Numerical study of melting and solidification in a wavy double-pipe latent heat thermal energy storage system. J. Therm. Anal. Calorimet 2020, 141, 1785–1799. [Google Scholar] [CrossRef]
- Yang, X.; Yu, J.; Xiao, T.; Hu, Z.; He, Y.-L. Design and operating evaluation of a finned shell-and-tube thermal energy storage unit filled with metal foam. Appl. Energy 2020, 261, 114385. [Google Scholar] [CrossRef]
- Mahdi, J.M.; Nsofor, E.C. Melting enhancement in triplex-tube latent heat energy storage system using nanoparticles-metal foam combination. Appl. Energy 2017, 191, 22–34. [Google Scholar] [CrossRef]
- Sardari, P.T.; Mohammed, H.I.; Giddings, D.; Walker, G.S.; Gillott, M.; Grant, D. Numerical study of a multiple-segment metal foam-PCM latent heat storage unit: Effect of porosity, pore density and location of heat source. Energy 2019, 189, 116108. [Google Scholar] [CrossRef]
- Xu, Y.; Li, M.-J.; Zheng, Z.-J.; Xue, X.-D. Melting performance enhancement of phase change material by a limited amount of metal foam: Configurational optimization and economic assessment. Appl. Energy 2018, 212, 868–880. [Google Scholar] [CrossRef]
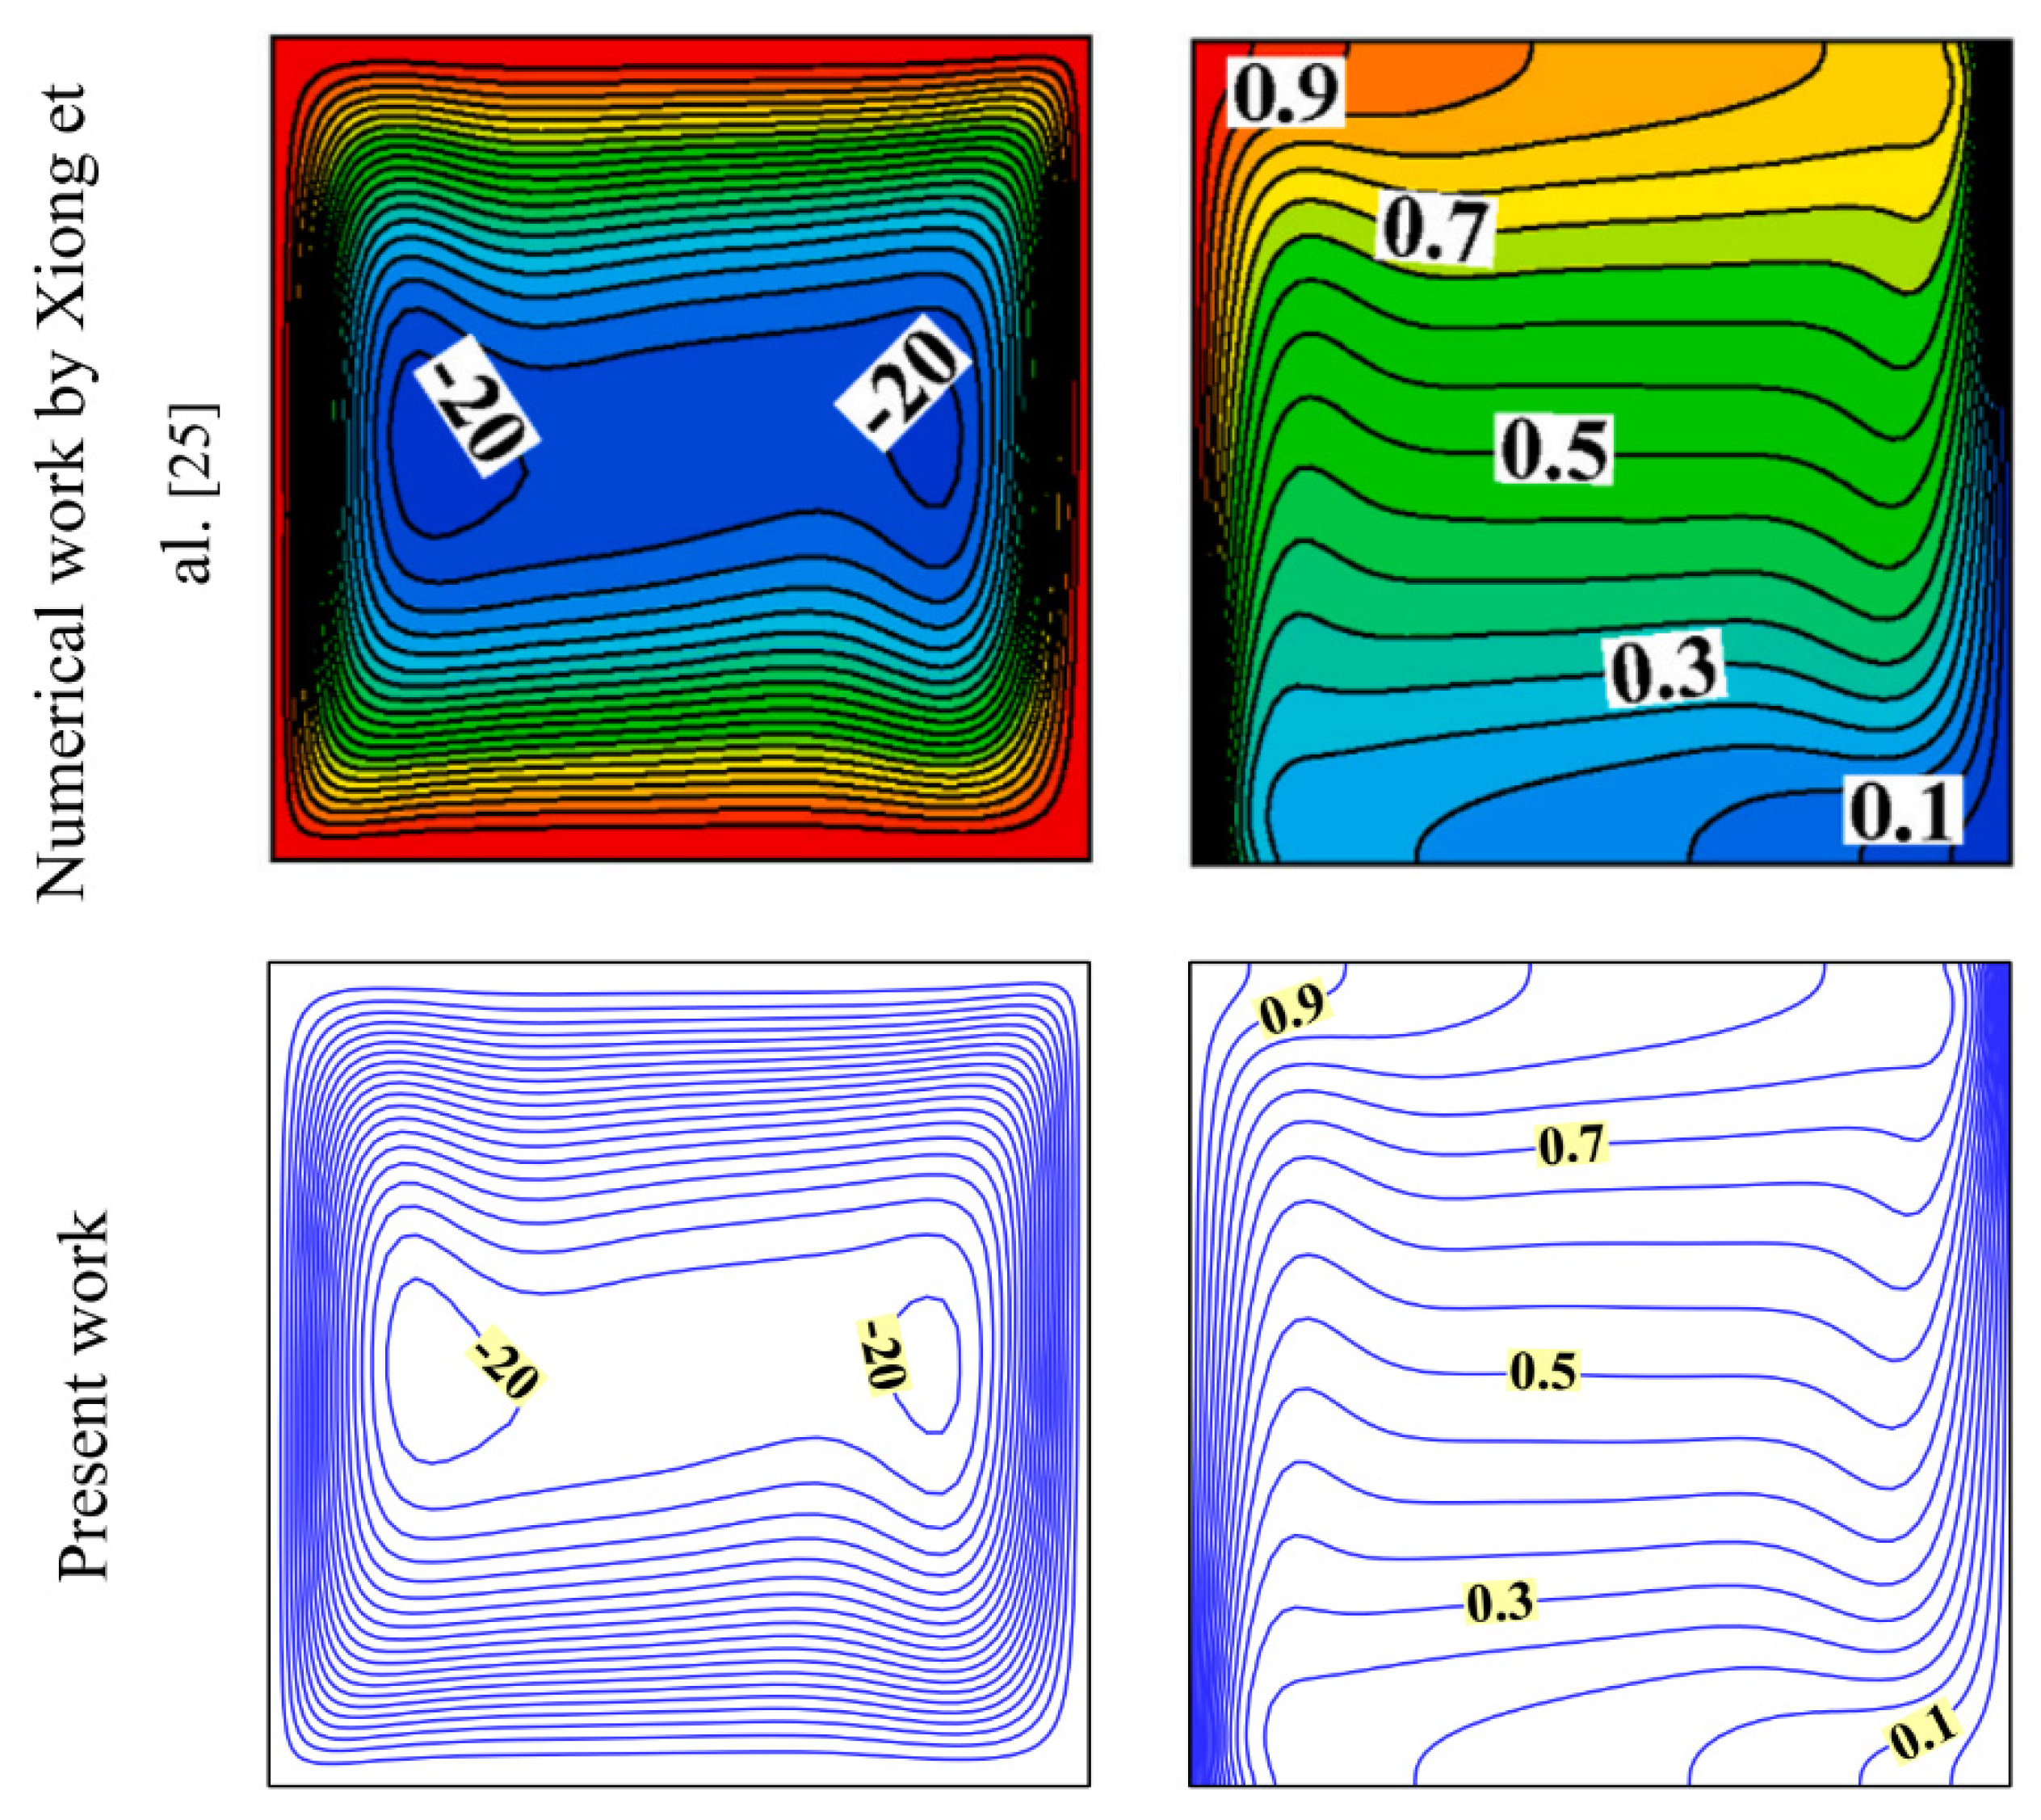
- Xiong, Q.; Poor, H.Z.; Izadi, M.; Assareh, E. Natural heat exchange in inhomogeneous porous medium using linear and quadratic porosity distribution. Int. J. Therm. Sci. 2021, 161, 106731. [Google Scholar] [CrossRef]


| Properties | Coconut Oil (Measured) | Heat Transfer Fluid | CuO Nanoadditives | Metal Foam | |
|---|---|---|---|---|---|
| Solid | Liquid | ||||
| (K) | 297 | Not applicable | Not applicable | Not applicable | Not applicable |
| (K) | 2 | Not applicable | Not applicable | Not applicable | Not applicable |
| lppcm (J·kg–1) | - | Not applicable | 1.03 × 10⁴ | Not applicable | Not applicable |
| ρ (kg·m–3) | 920 | 993.73 | 914 | 6500 | 8900 |
| (N·s·m−2) | Not applicable | 7.05 × 10⁻⁴ | 3.26 × 10⁻² | Not applicable | Not applicable |
| Cp (J·kg·K–1) | 3750 | 4178 | 2010 | 540 | 386 |
| κ (W·m–1·K–1) | 2.28 × 10⁻¹ | 6.23 × 10⁻¹ | 1.66 × 10⁻¹ | 18 | 380 |
| Density | (18) | |
| Dynamic viscosity | (19) | |
| Coefficient of thermal expansion | (20) | |
| Thermal conductivity | (21) | |
| Heat capacity | (22) |
| Initial condition | (23) | |
| Interface of the tube wall and NePCM domain | (24) | |
| Entrance of the tube | (25) | |
| Outlet of the tube | (26) | |
| The right side surface of the NePCM domain | (27) | |
| Top and bottom surface of the NePCM domain | (28) |
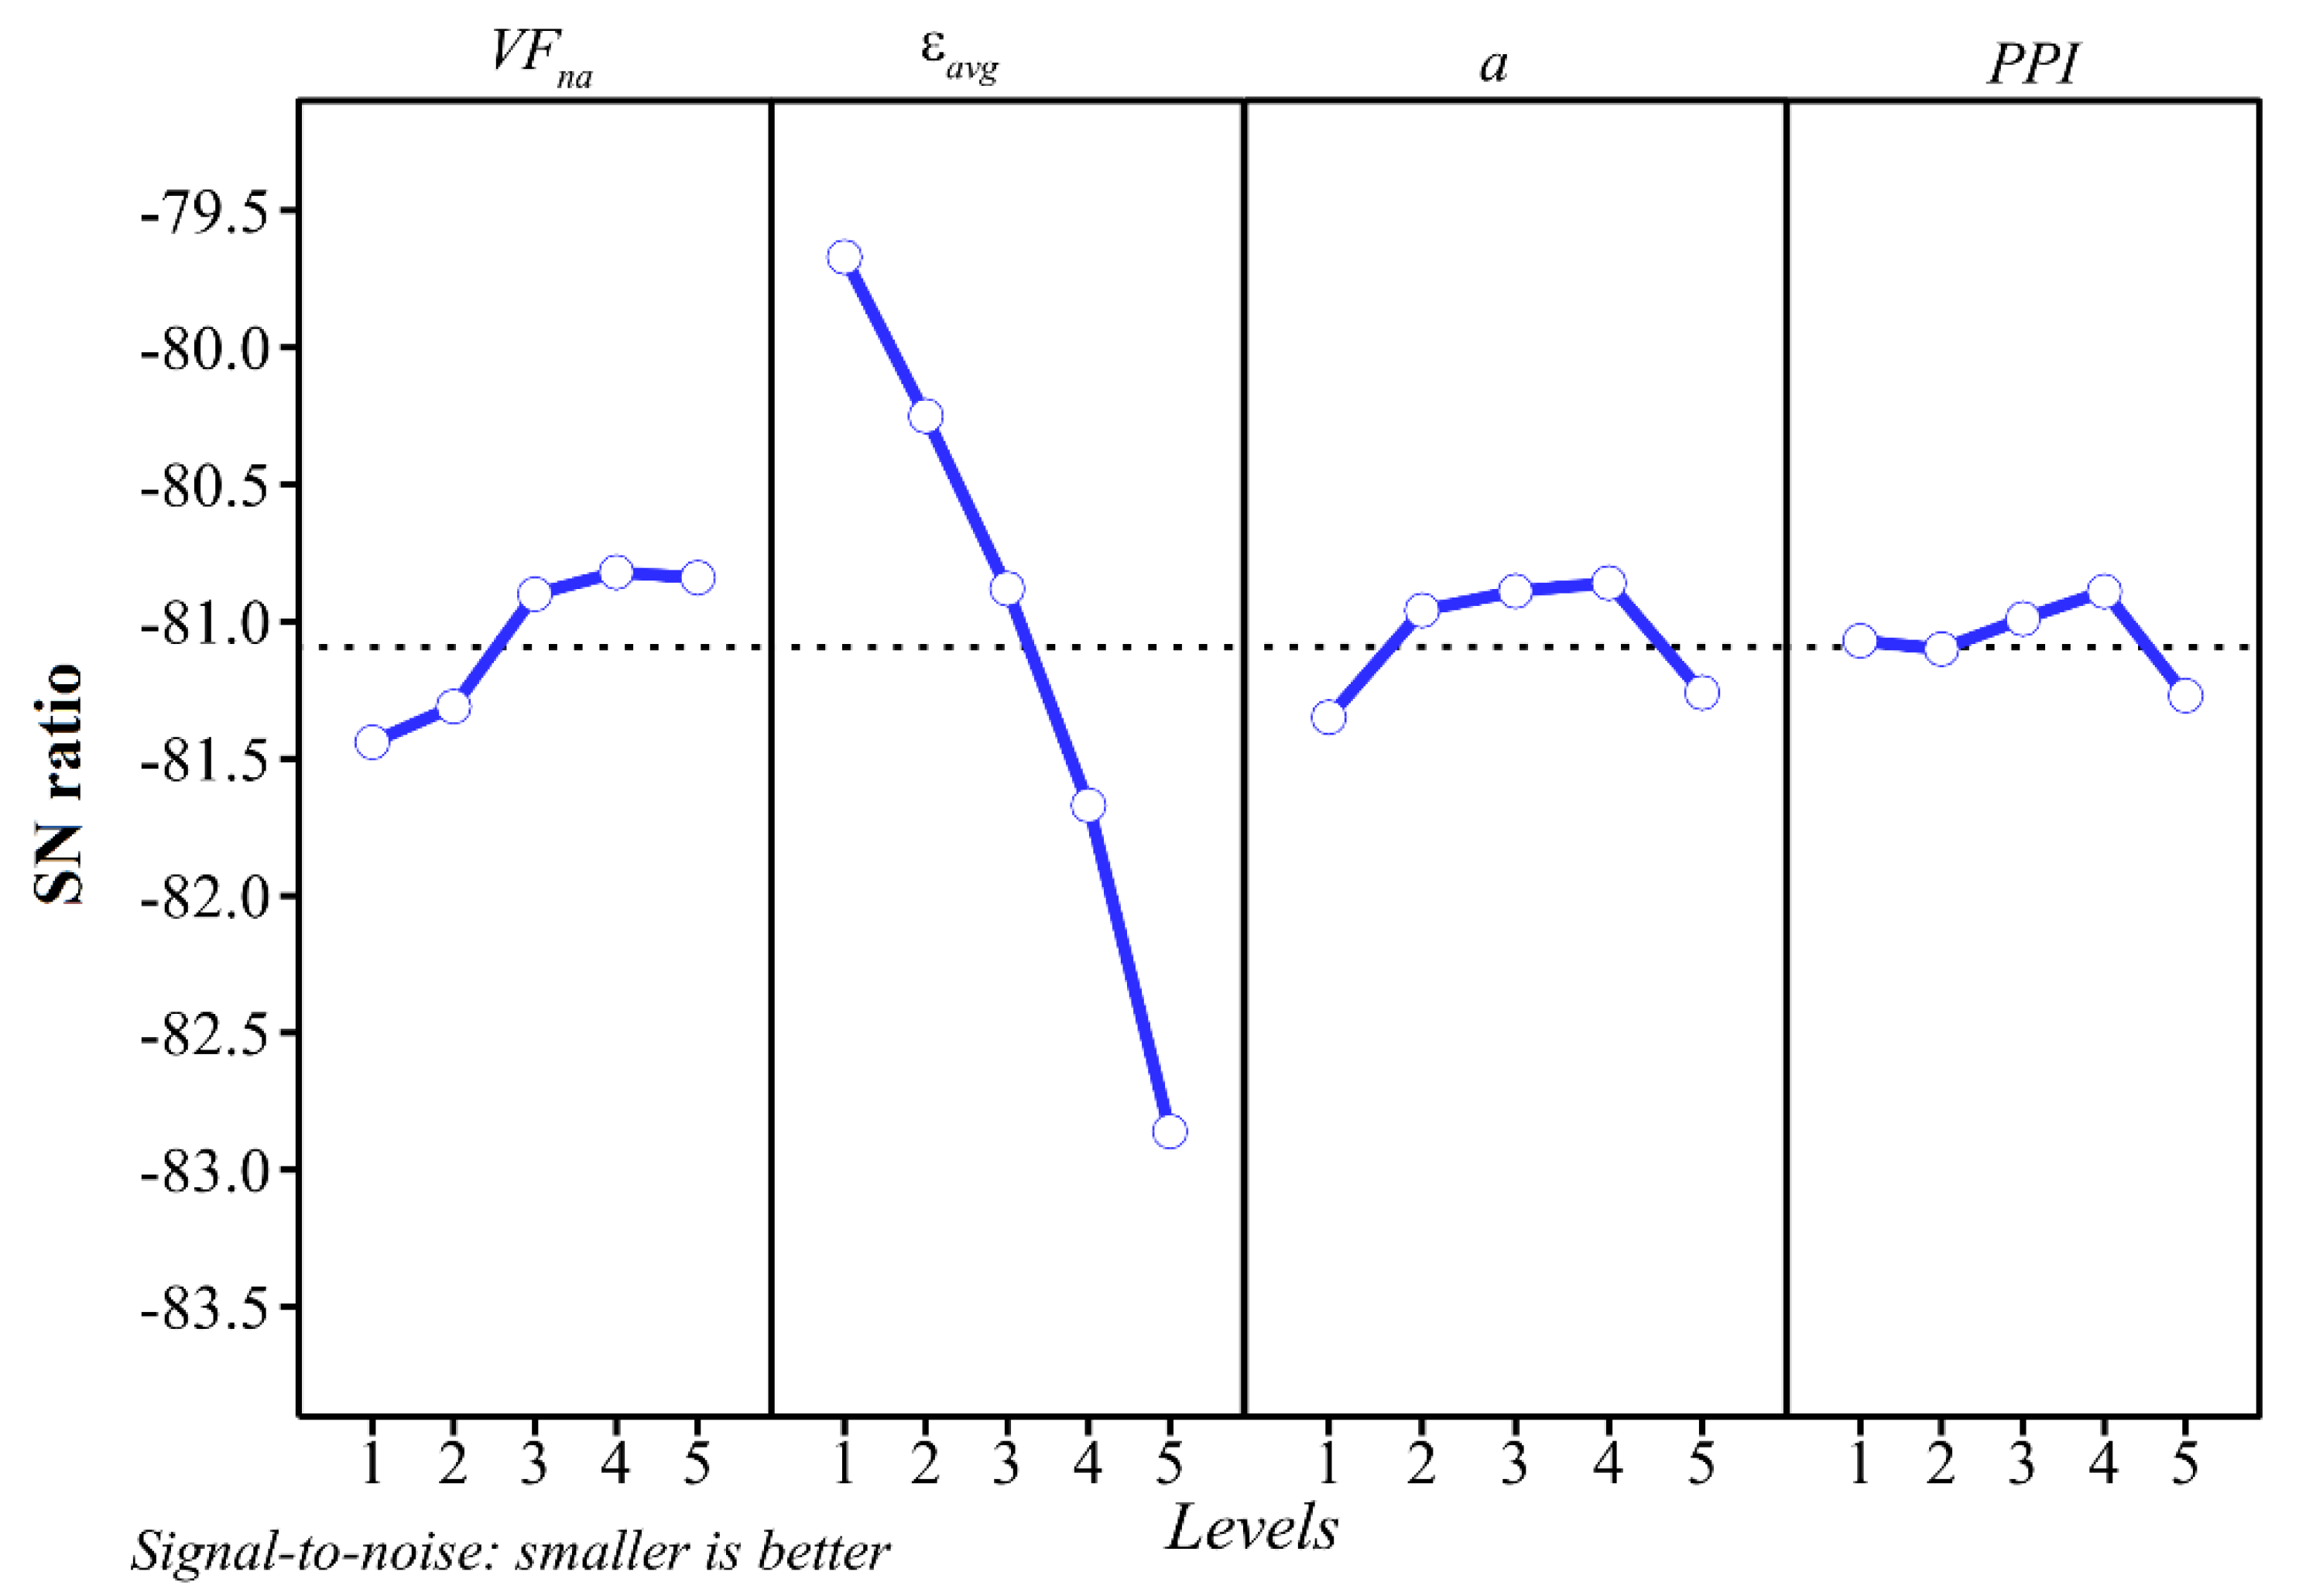
| Factors | Description | Level 1 | Level 2 | Level 3 | Level 4 | Level 5 |
|---|---|---|---|---|---|---|
| A | (Volume fraction) | 0.00 | 0.01 | 0.02 | 0.03 | 0.04 |
| B | (Average of porosity) | 0.800 | 0.825 | 0.850 | 0.875 | 0.900 |
| C | a (Gradient of porosity) | −0.6 | −0.3 | 0.0 | 0.3 | 0.6 |
| D | PPI (Pore per inch of the metal matrix) | 10 | 15 | 20 | 25 | 30 |
| Experiment Number | Control Parameters | Full Melting Characteristics | S/N Ratio | |||||
|---|---|---|---|---|---|---|---|---|
| VFna | a | PPI | ES (kJ) | CP (kW) | ||||
| 1 | 0.00 | 0.800 | −0.6 | 10 | 10,200 | 933.745 | 0.09154 | −80.1720 |
| 2 | 0.00 | 0.825 | −0.3 | 15 | 10,500 | 965.132 | 0.09192 | −80.4238 |
| 3 | 0.00 | 0.850 | 0.0 | 20 | 11,100 | 1011.959 | 0.09117 | −80.9065 |
| 4 | 0.00 | 0.875 | 0.3 | 25 | 12,150 | 1071.543 | 0.08819 | −81.6915 |
| 5 | 0.00 | 0.900 | 0.6 | 30 | 15,900 | 1192.082 | 0.07497 | −84.0279 |
| 6 | 0.01 | 0.800 | −0.3 | 20 | 9900 | 943.927 | 0.09535 | −79.9127 |
| 7 | 0.01 | 0.825 | 0.0 | 25 | 10,350 | 984.372 | 0.09511 | −80.2988 |
| 8 | 0.01 | 0.850 | 0.3 | 30 | 10,950 | 1025.580 | 0.09366 | −80.7883 |
| 9 | 0.01 | 0.875 | 0.6 | 10 | 12,750 | 1109.630 | 0.08703 | −82.1102 |
| 10 | 0.01 | 0.900 | −0.6 | 15 | 14,850 | 1072.519 | 0.07222 | −83.4345 |
| 11 | 0.02 | 0.800 | 0.0 | 30 | 9600 | 950.417 | 0.09900 | −79.6454 |
| 12 | 0.02 | 0.825 | 0.3 | 10 | 10,050 | 987.757 | 0.09828 | −80.0433 |
| 13 | 0.02 | 0.850 | 0.6 | 15 | 11,100 | 1050.637 | 0.09465 | −80.9065 |
| 14 | 0.02 | 0.875 | −0.6 | 20 | 12,150 | 975.115 | 0.08026 | −81.6915 |
| 15 | 0.02 | 0.900 | −0.3 | 25 | 12,900 | 1023.790 | 0.07936 | −82.2118 |
| 16 | 0.03 | 0.800 | 0.3 | 15 | 9300 | 953.180 | 0.10249 | −79.3697 |
| 17 | 0.03 | 0.825 | 0.6 | 20 | 10,050 | 1007.866 | 0.10029 | −80.0433 |
| 18 | 0.03 | 0.850 | −0.6 | 25 | 11,250 | 952.128 | 0.08463 | −81.0231 |
| 19 | 0.03 | 0.875 | −0.3 | 30 | 11,850 | 997.453 | 0.08417 | −81.4744 |
| 20 | 0.03 | 0.900 | 0.0 | 10 | 12,900 | 1054.967 | 0.08178 | −82.2118 |
| 21 | 0.04 | 0.800 | 0.6 | 25 | 9150 | 963.774 | 0.10533 | −79.2284 |
| 22 | 0.04 | 0.825 | −0.6 | 30 | 10,500 | 928.251 | 0.08840 | −80.4238 |
| 23 | 0.04 | 0.850 | −0.3 | 10 | 10,950 | 967.676 | 0.08837 | −80.7883 |
| 24 | 0.04 | 0.875 | 0.0 | 15 | 11,700 | 1018.223 | 0.08703 | −81.3637 |
| 25 | 0.04 | 0.900 | 0.3 | 20 | 13,200 | 1085.484 | 0.08223 | −82.4115 |
| Levels | VFna | a | PPI | |
|---|---|---|---|---|
| 1 | −81.44 | −79.67 | −81.35 | −81.07 |
| 2 | −81.31 | −80.25 | −80.96 | −81.10 |
| 3 | −80.90 | −80.88 | −80.89 | −80.99 |
| 4 | −80.82 | −81.67 | −80.86 | −80.89 |
| 5 | −80.84 | −82.86 | −81.26 | −81.27 |
| δ | 0.62 | 3.19 | 0.49 | 0.38 |
| Rank | 2 | 1 | 3 | 4 |
| Factors | Time for MVF = 1 | Estimated Time Fir MVF = 1 | ES (kJ) | CP (kW) | |||
|---|---|---|---|---|---|---|---|
| VFna | εavg | a | PPI | 9097 | 8784s | 931.508 | 0.10240 |
| 0.04 | 0.8 | 0.3 | 25 | ||||
| Experiment No. | Case | Parameter Study | Control Parameters | ES (kJ) | CP (kW) | ||||
|---|---|---|---|---|---|---|---|---|---|
| VFna | a | PPI | |||||||
| 1 | 1 | VFna | 0.00 | 0.800 | 0.3 | 25 | 9473 | 978.696 | 0.10195 |
| 2 | 2 | 0.01 | 0.800 | 0.3 | 25 | 9400 | 966.340 | 0.10226 | |
| 3 | 3 | 0.02 | 0.800 | 0.3 | 25 | 9327 | 965.680 | 0.10219 | |
| 4 | 4 | 0.03 | 0.800 | 0.3 | 25 | 9254 | 953.160 | 0.10249 | |
| 5 | 5 | εavg | 0.04 | 0.825 | 0.3 | 25 | 9861 | 975.162 | 0.09850 |
| 6 | 6 | 0.04 | 0.850 | 0.3 | 25 | 10669 | 1012.875 | 0.09378 | |
| 7 | 7 | 0.04 | 0.875 | 0.3 | 25 | 11687 | 1039.620 | 0.08886 | |
| 8 | 8 | 0.04 | 0.900 | 0.3 | 25 | 13102 | 1085.454 | 0.08223 | |
| 9 | 9 | a | 0.04 | 0.800 | −0.6 | 25 | 9796 | 909.159 | 0.09183 |
| 10 | 10 | 0.04 | 0.800 | −0.3 | 25 | 9530 | 919.070 | 0.09574 | |
| 11 | 11 | 0.04 | 0.800 | 0.0 | 25 | 9317 | 937.623 | 0.09922 | |
| 12 | 12 | 0.04 | 0.800 | 0.6 | 25 | 9150 | 963.774 | 0.10533 | |
| 13 | 13 | PPI | 0.04 | 0.800 | 0.3 | 10 | 9180 | 952.508 | 0.10242 |
| 14 | 14 | 0.04 | 0.800 | 0.3 | 15 | 9180 | 952.519 | 0.10242 | |
| 15 | 15 | 0.04 | 0.800 | 0.3 | 20 | 9180 | 952.599 | 0.10243 | |
| 16 | 16 | 0.04 | 0.800 | 0.3 | 30 | 9180 | 952.577 | 0.10243 | |
Publisher’s Note: MDPI stays neutral with regard to jurisdictional claims in published maps and institutional affiliations. |
© 2021 by the authors. Licensee MDPI, Basel, Switzerland. This article is an open access article distributed under the terms and conditions of the Creative Commons Attribution (CC BY) license (http://creativecommons.org/licenses/by/4.0/).
Share and Cite
Ghalambaz, M.; Mehryan, S.A.M.; Shirivand, H.; Shalbafi, F.; Younis, O.; Inthavong, K.; Ahmadi, G.; Talebizadehsardari, P. Simulation of a Fast-Charging Porous Thermal Energy Storage System Saturated with a Nano-Enhanced Phase Change Material. Energies 2021, 14, 1575. https://doi.org/10.3390/en14061575
Ghalambaz M, Mehryan SAM, Shirivand H, Shalbafi F, Younis O, Inthavong K, Ahmadi G, Talebizadehsardari P. Simulation of a Fast-Charging Porous Thermal Energy Storage System Saturated with a Nano-Enhanced Phase Change Material. Energies. 2021; 14(6):1575. https://doi.org/10.3390/en14061575
Chicago/Turabian StyleGhalambaz, Mohammad, S.A.M. Mehryan, Hassan Shirivand, Farshid Shalbafi, Obai Younis, Kiao Inthavong, Goodarz Ahmadi, and Pouyan Talebizadehsardari. 2021. "Simulation of a Fast-Charging Porous Thermal Energy Storage System Saturated with a Nano-Enhanced Phase Change Material" Energies 14, no. 6: 1575. https://doi.org/10.3390/en14061575
APA StyleGhalambaz, M., Mehryan, S. A. M., Shirivand, H., Shalbafi, F., Younis, O., Inthavong, K., Ahmadi, G., & Talebizadehsardari, P. (2021). Simulation of a Fast-Charging Porous Thermal Energy Storage System Saturated with a Nano-Enhanced Phase Change Material. Energies, 14(6), 1575. https://doi.org/10.3390/en14061575