
Numerical Study on the Cavitation Flow and Its Effect on the Structural Integrity of Multi-Stage Orifice


Abstract
:1. Introduction
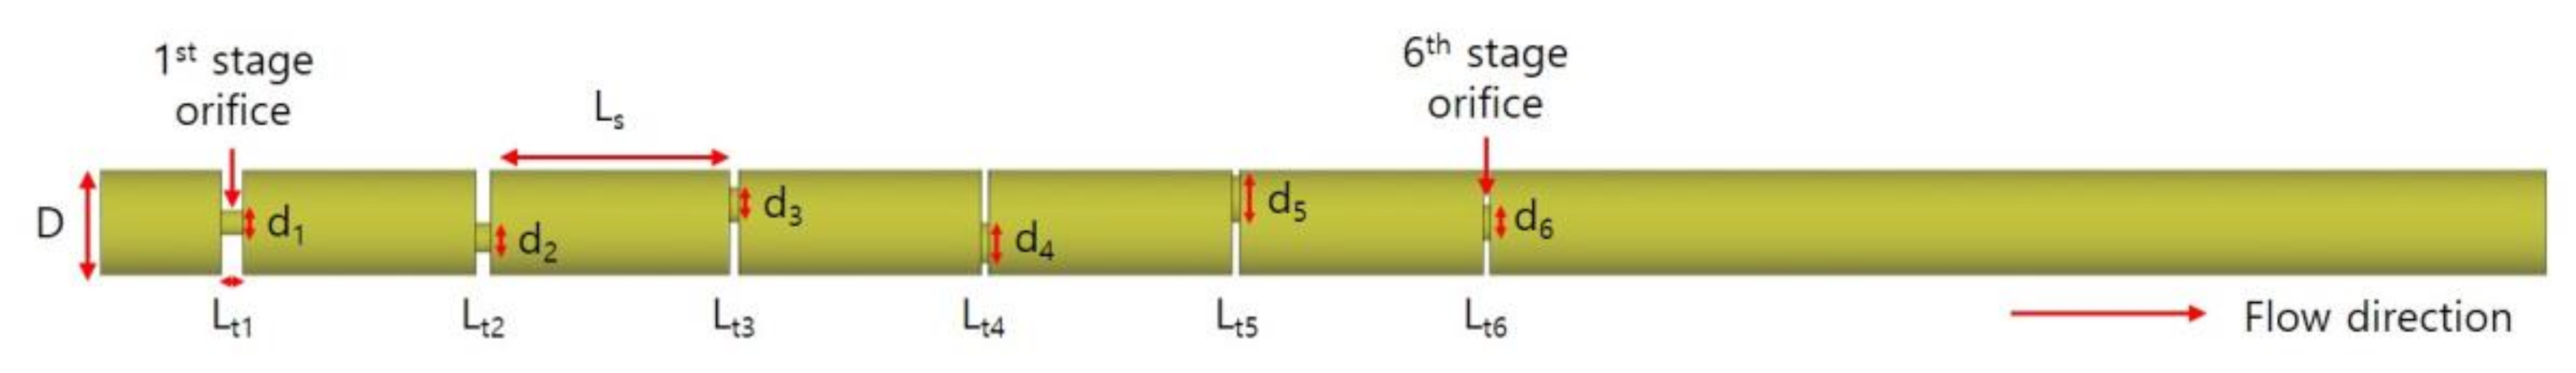
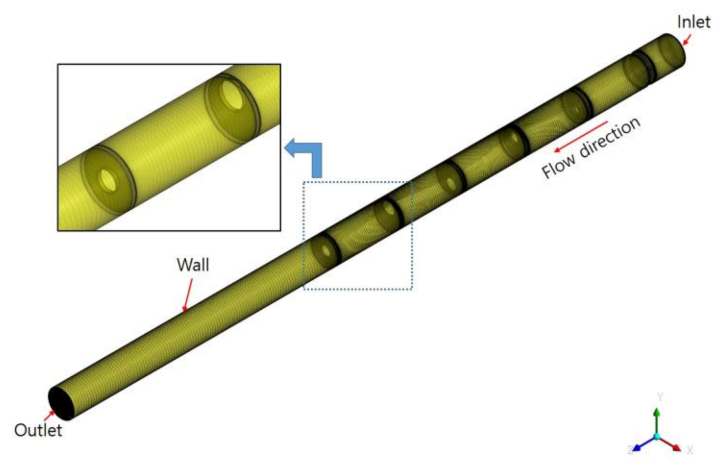
- To verify whether the numerical modeling available in ANSYS CFX R19.1 can predict reliably and accurately the complex flow inside the multi-stage orifice, the numerical analysis was performed on the six-stage orifice test facility, and the simulation results were compared with the measured data.
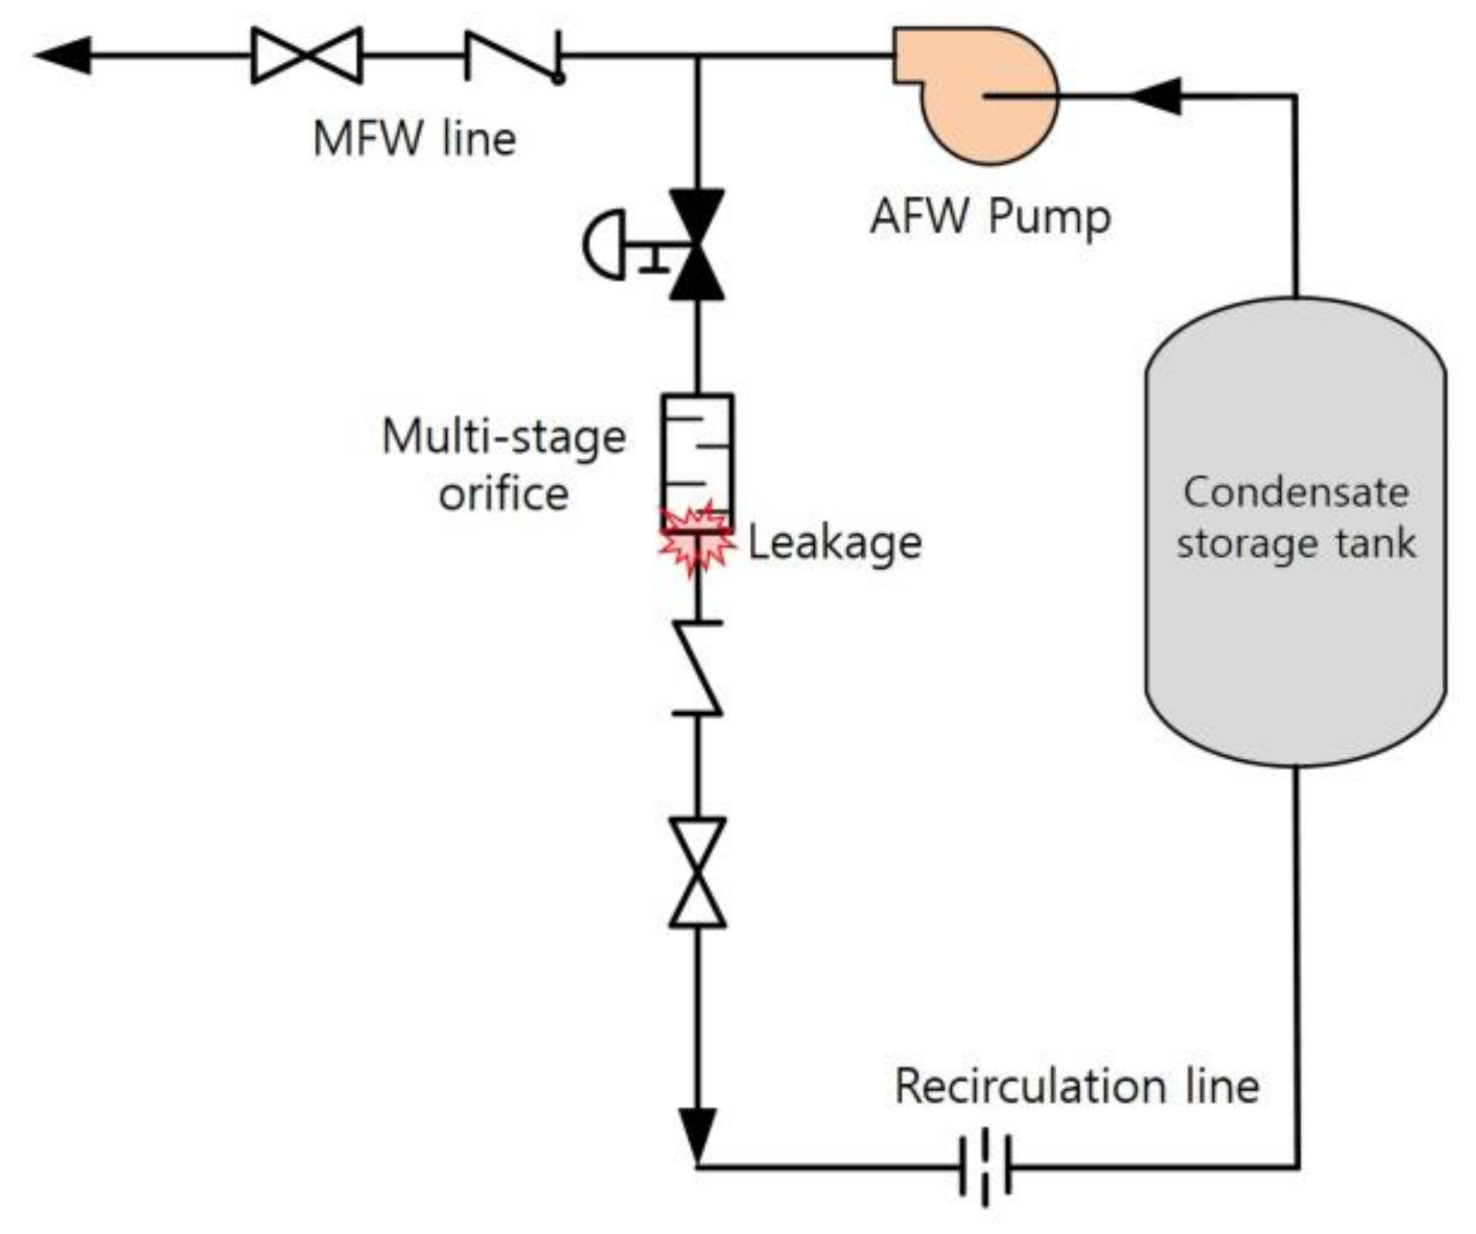
- To assess the adequacy of the changed operating flow rate proposed by a domestic NPP operator as the corrective measure about the flow leakage in the AFW pump recirculation line, the pattern of the cavitation flow in the eight-stage orifice and the connecting pipe depending on the magnitude of the operating flow rate was predicted by using ANSYS CFX R19.1.
- Using ANSYS Mechanical, the structural analysis was conducted for the eight-stage orifice and the connecting pipe under the same operating flow rate condition used for the flow analysis, and the structural integrity was evaluated for the allowable stress. Additionally, modal analysis was performed to predict the possible occurrence of cavitation due to a pressure fluctuation.
- The geometric dimensions and arrangement of orifice hole position at the individual stage of the multi-stage orifice may have a significant influence on the characteristics of pressure drop and flow patterns (including cavitation). Therefore, these effects were examined by simulating an analysis model in which the hole diameter of the eighth stage orifice was changed under the design flow condition.
2. Validation of the Numerical Modeling
2.1. Analysis Model
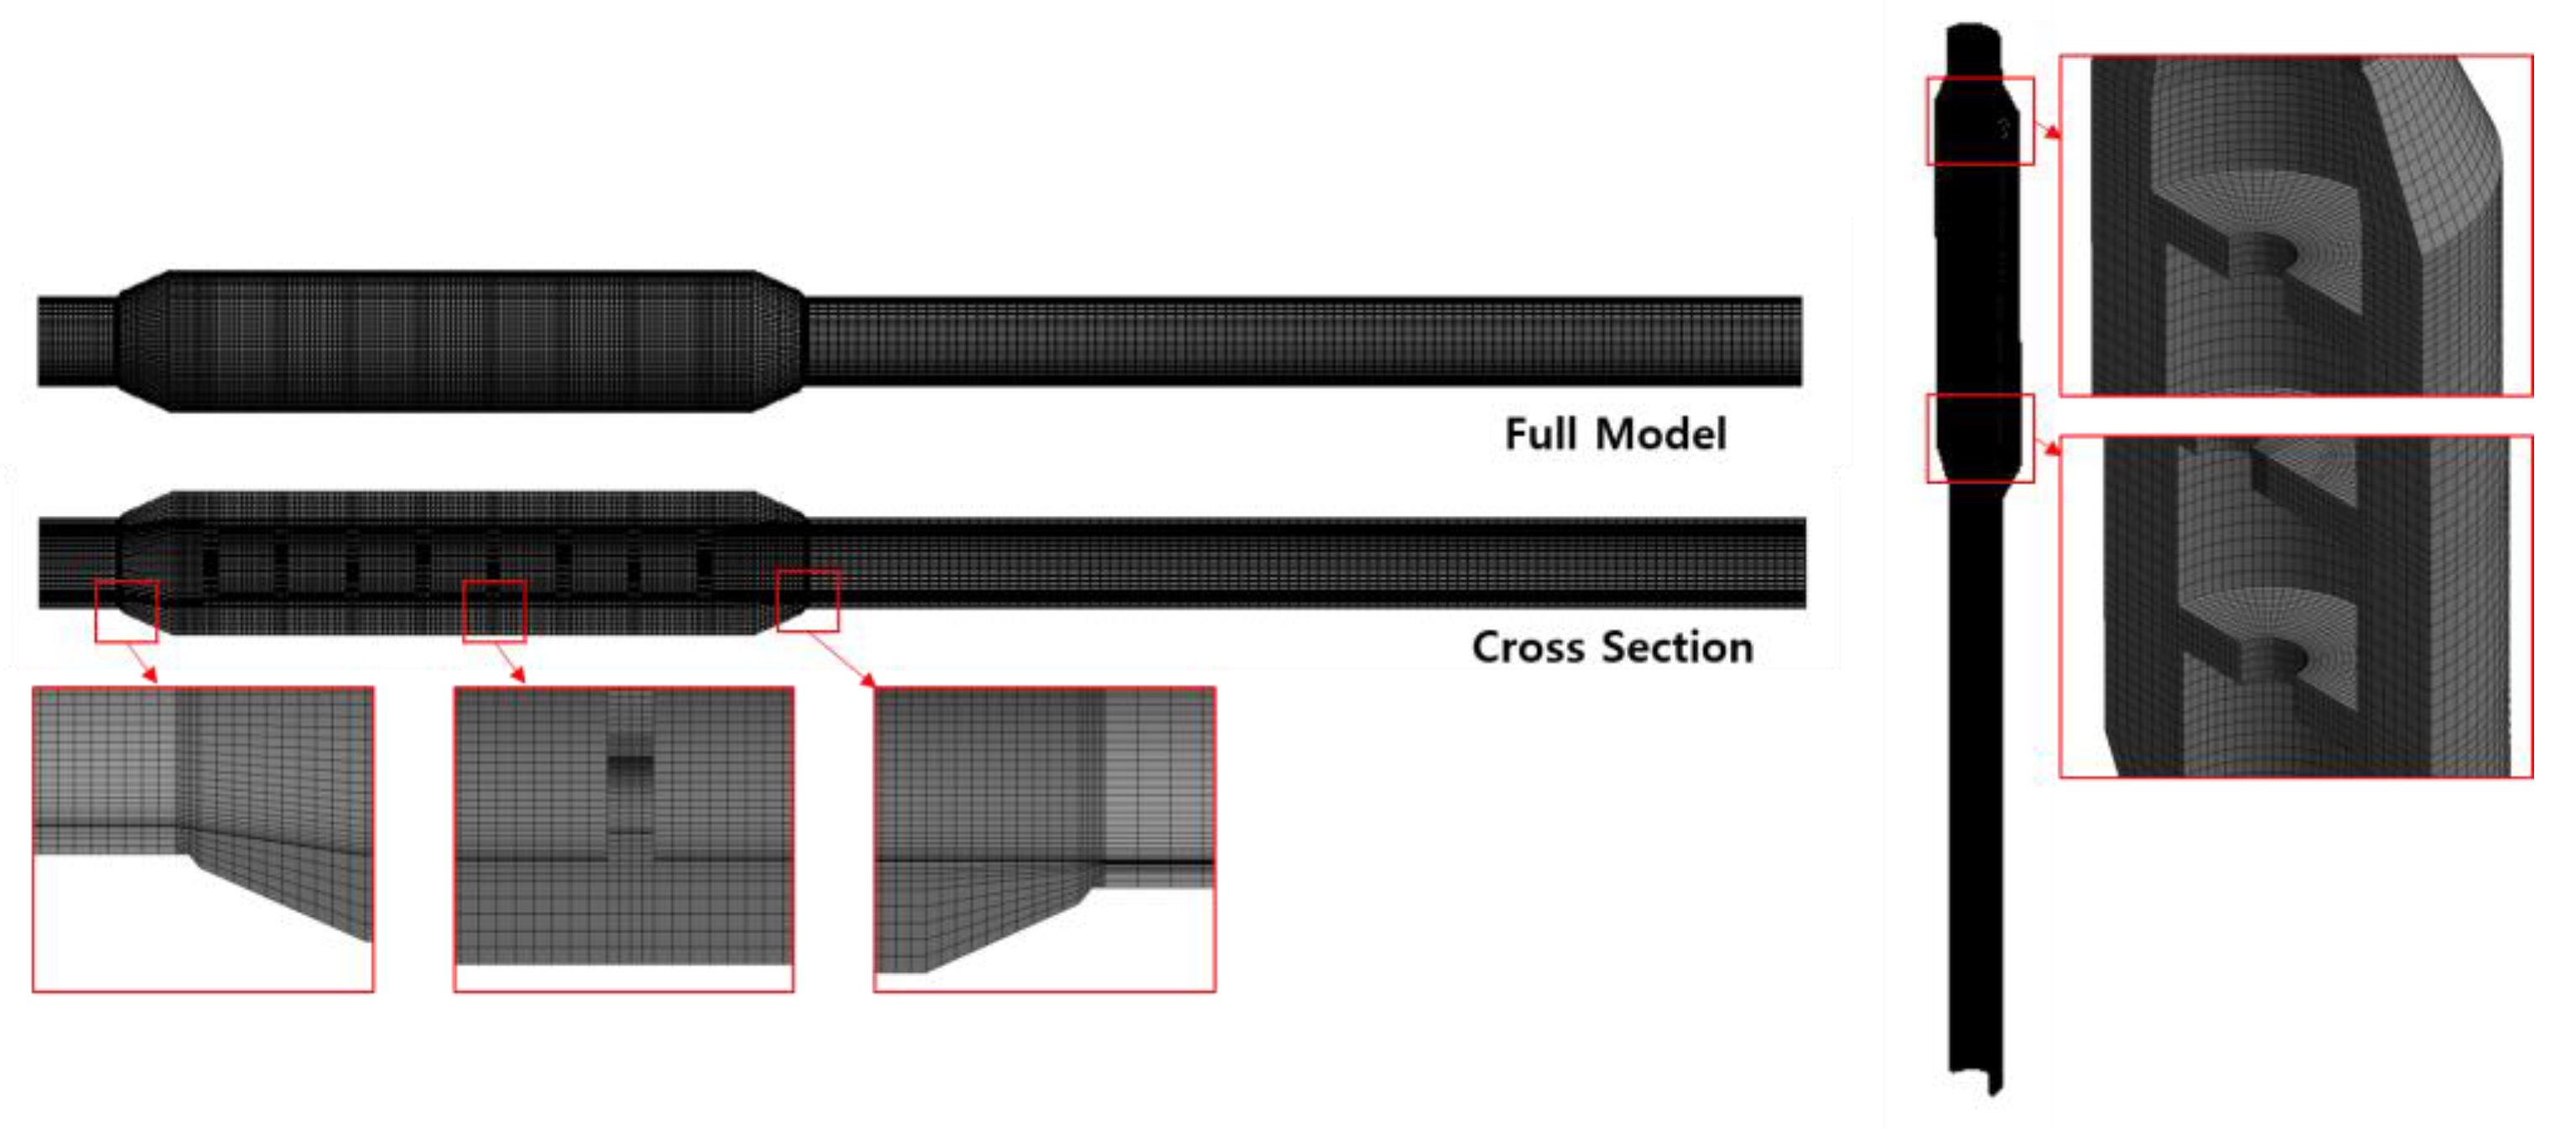
2.2. Numerical Modeling
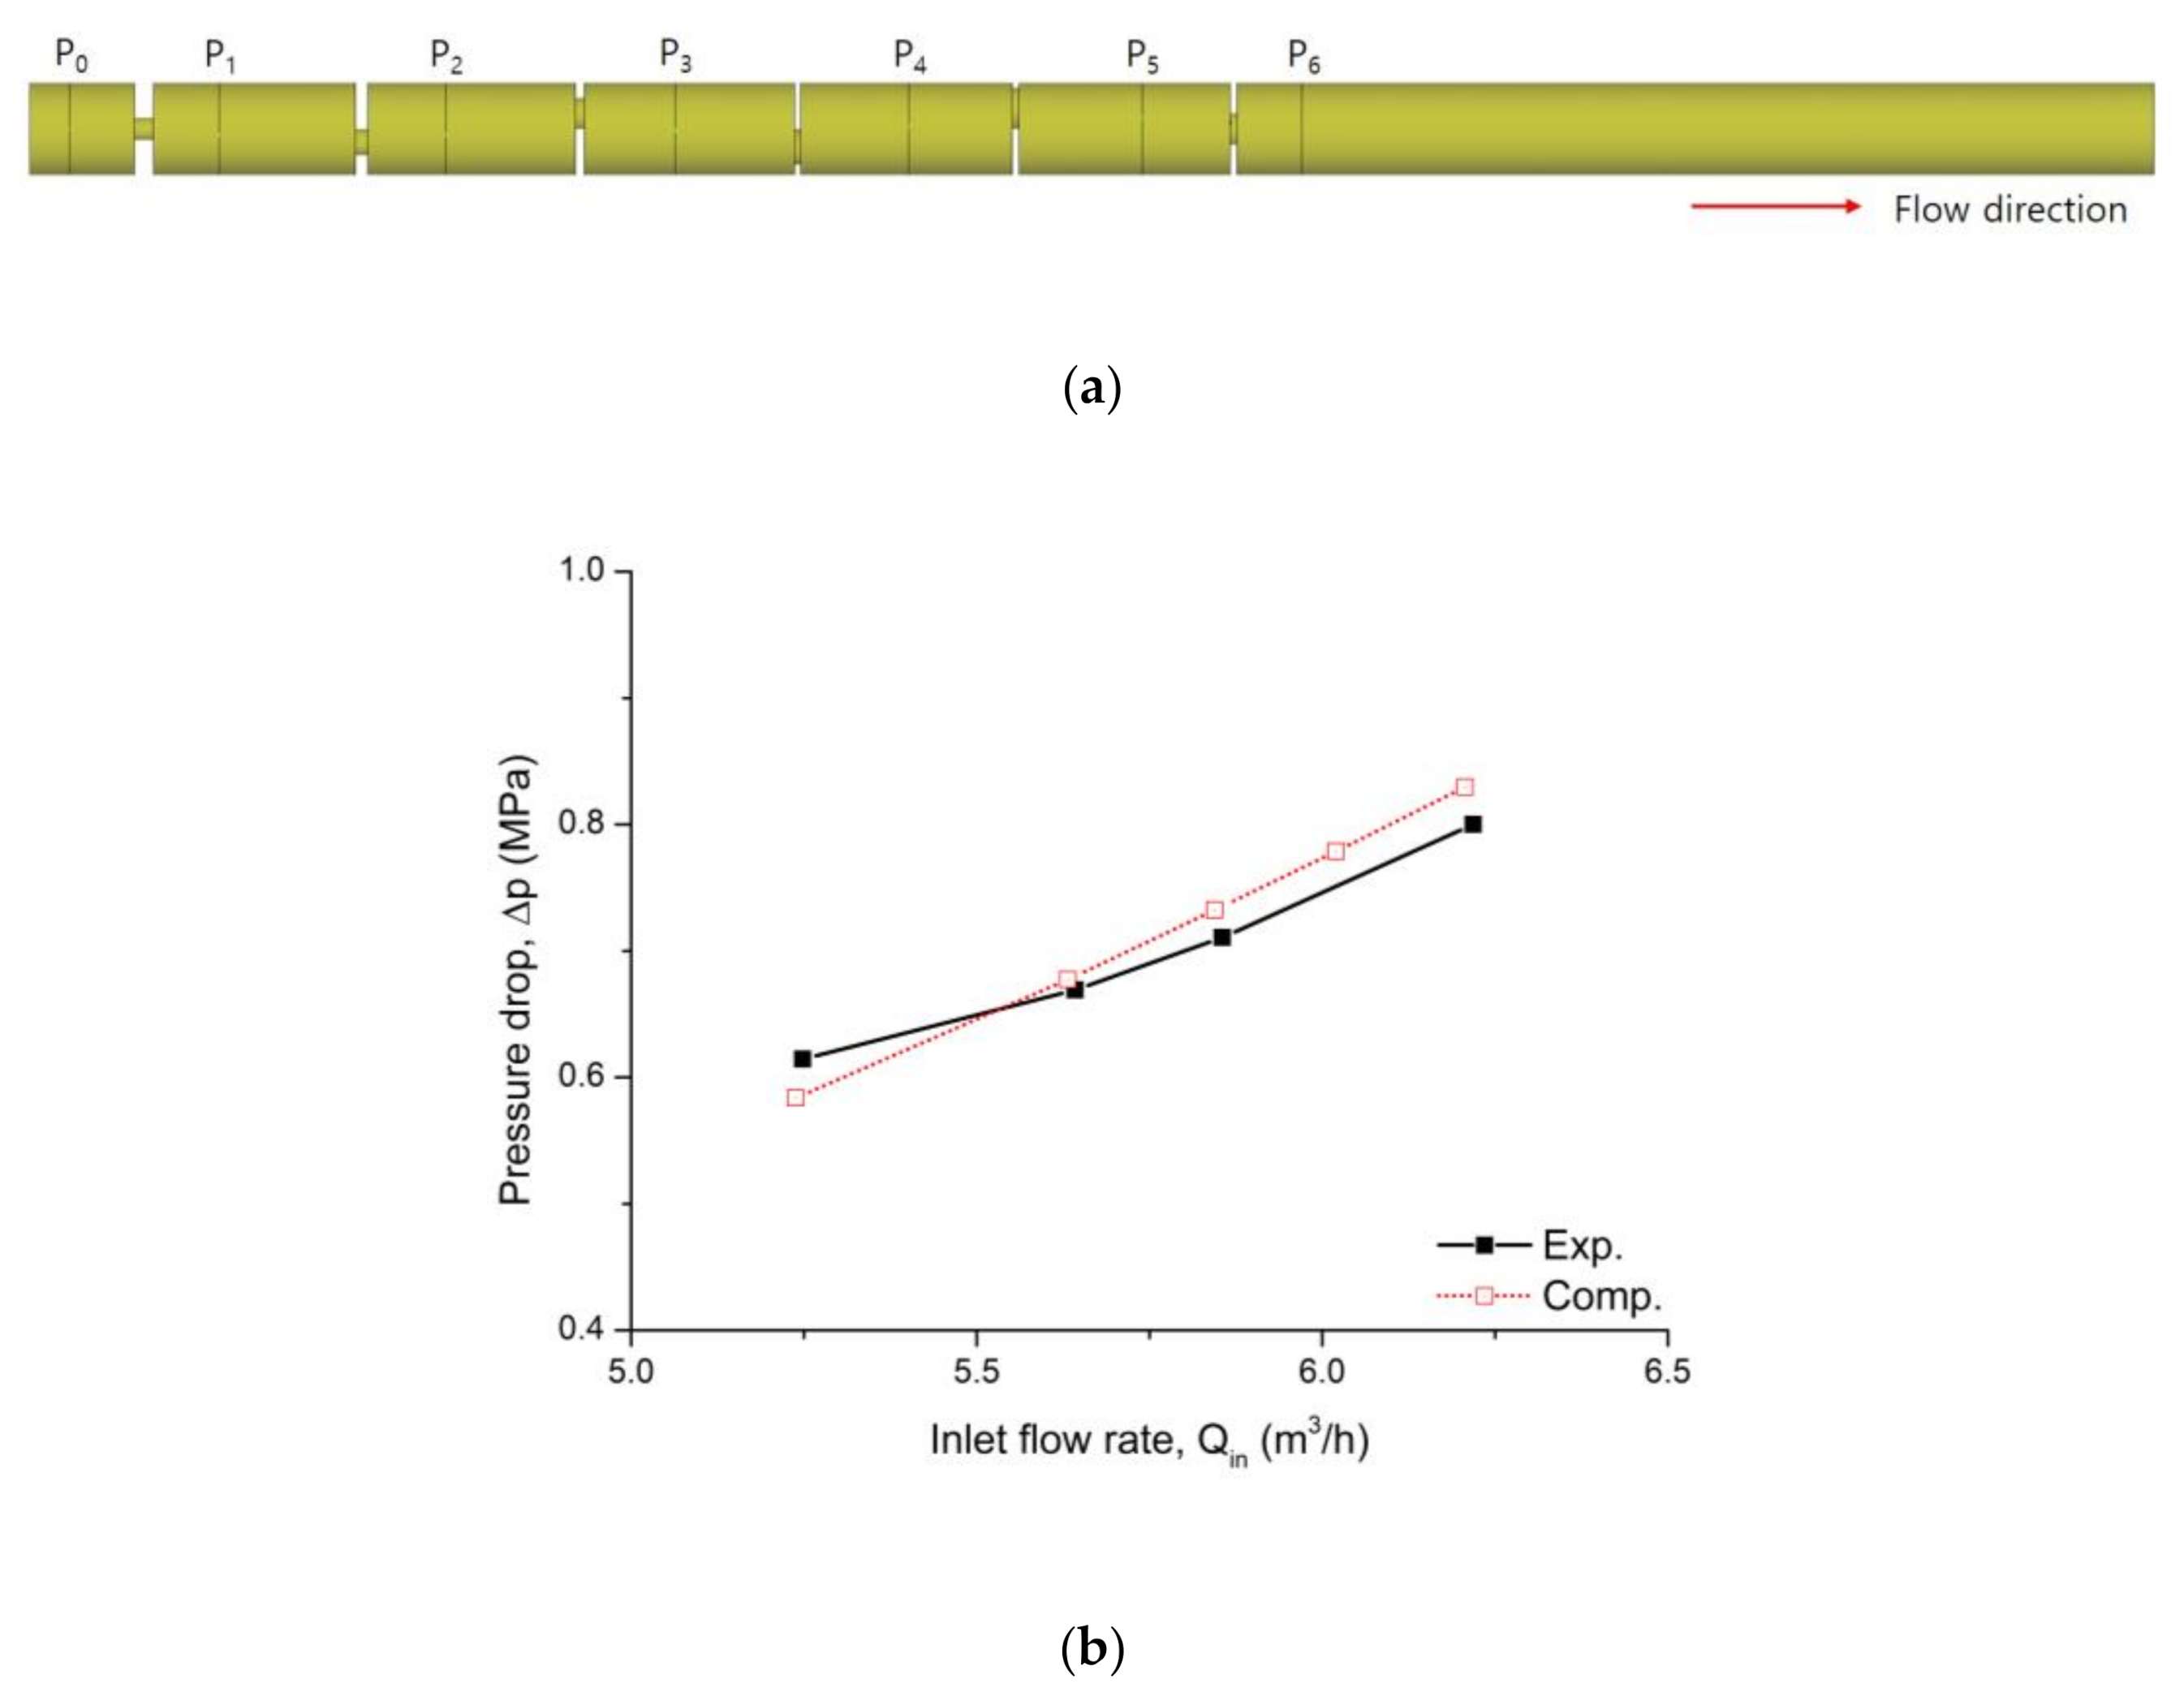
2.3. Validation Results
3. Effect of the Operating Flow Rate
3.1. Analysis Model
3.2. Numerical Modeling
3.2.1. Flow Analysis
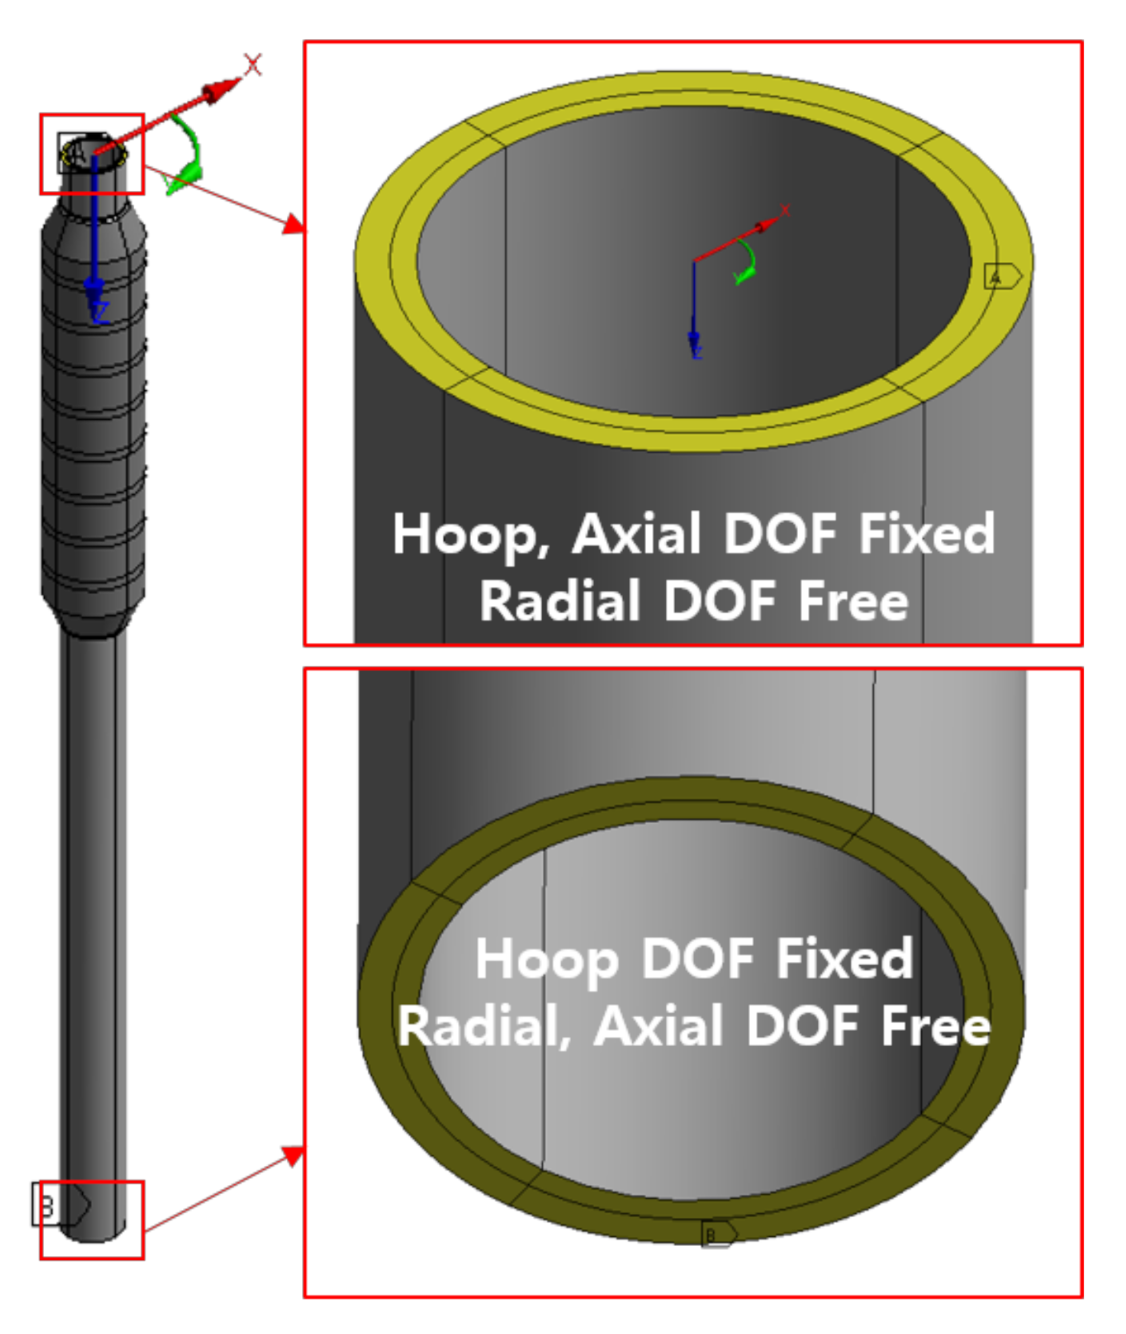
3.2.2. Structural Analysis
3.3. The Computational Results
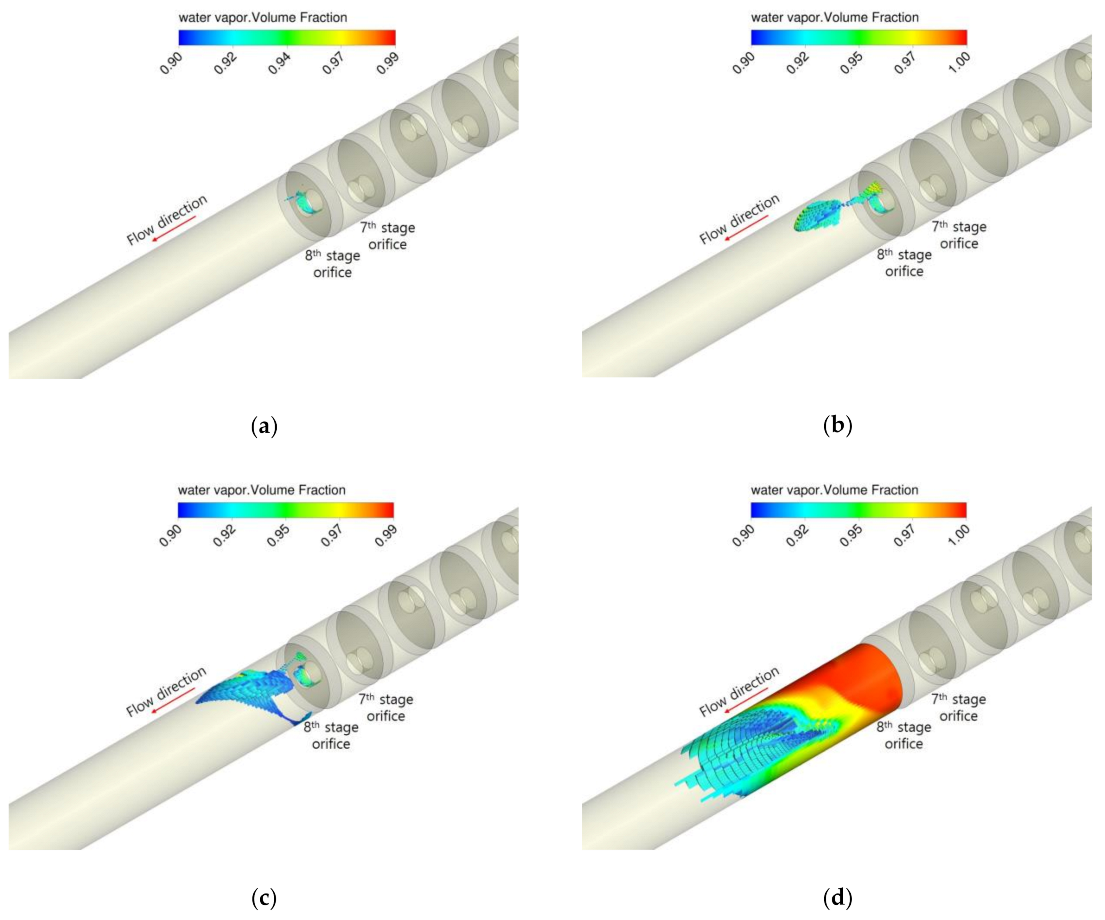
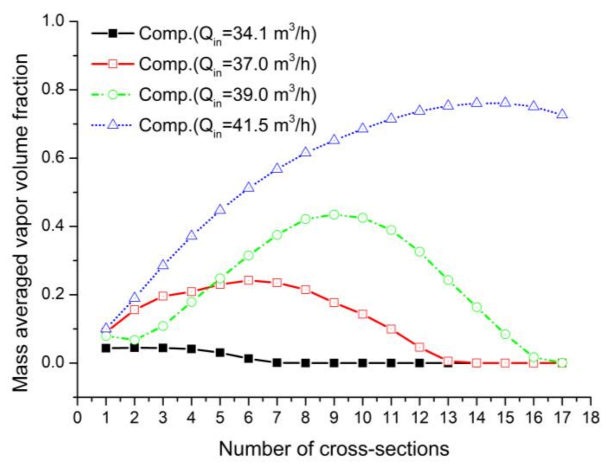
3.3.1. Flow Analysis
3.3.2. Structural Analysis
4. Effect of the Orifice Hole Diameter Size
4.1. Analysis Model
4.2. Numerical Modeling
4.2.1. Flow Analysis
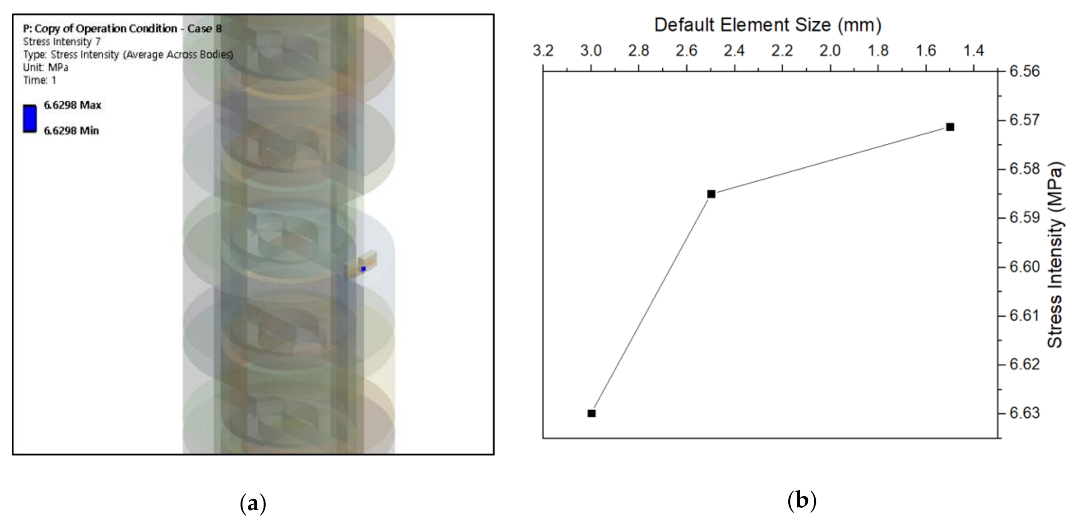
4.2.2. Structural Analysis
4.3. The Computational Results
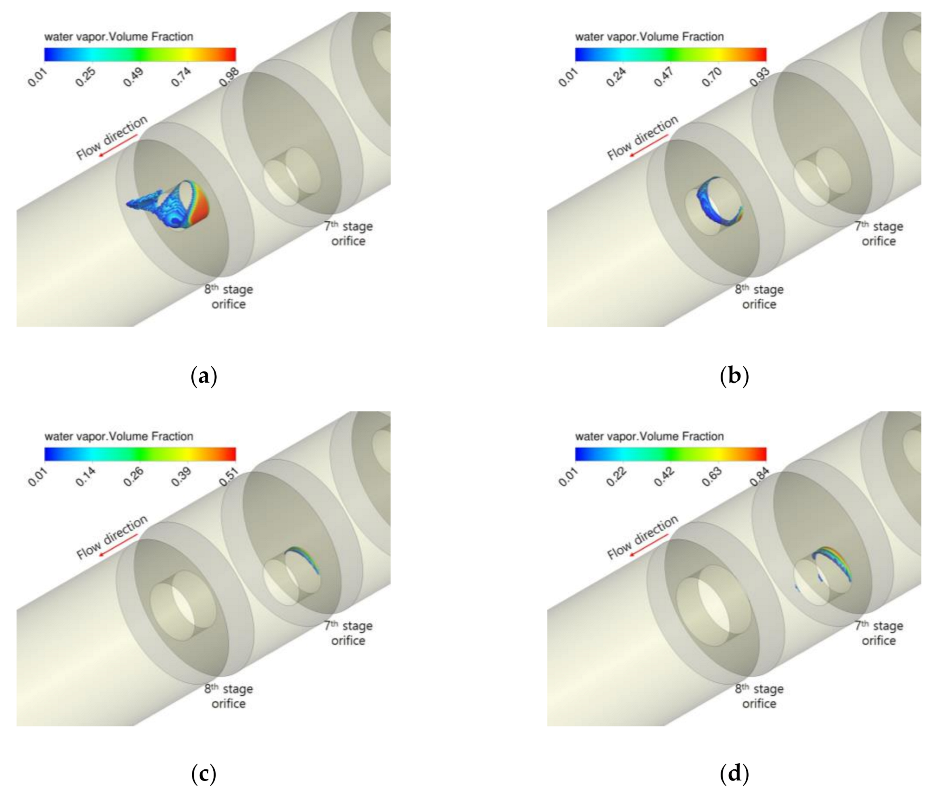
4.3.1. Flow Analysis
4.3.2. Structural Analysis
5. Conclusions
- For the six-stage orifice, selected as the benchmark analysis model, the difference in the static pressure drop between the orifice inlet and outlet depending on the operating flow rate was consistent within a maximum error of 5% compared to the measured data. Therefore, the numerical modeling applied in this study may be valid, and the calculation results may be judged to be reliable to a certain level. However, it is necessary to additionally provide detailed measurement data (velocity vector, vapor volume fraction, turbulence quantities, etc.) to validate the CFD software for complex flow patterns that can occur in the multi-stage orifice, including cavitation flow.
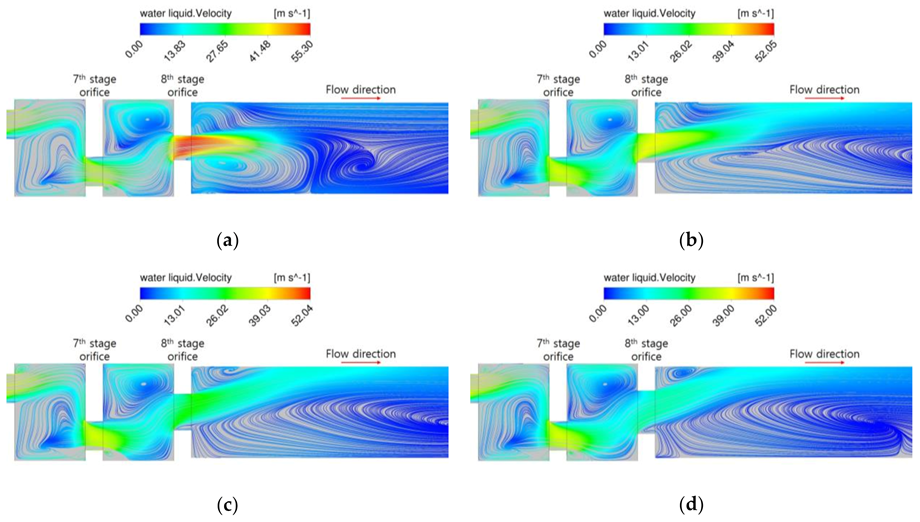
- As the operating flow rate increased, the cavitation region expanded, and through this, it was confirmed that the operating flow rate was a key factor to influence the cavitation behavior inside the multi-stage orifice. Therefore, the reduction of the operating flow rate proposed by the domestic NPP operator concerning the flow leakage in the AFW pump recirculation line is considered to be an appropriate corrective action. However, it was found that cavitation flow still happened even in the vicinity of the corrected operating flow rate, so it is necessary to conduct the operating time reduction of the AFW pump and periodic monitoring reinforcement (e.g., vibration measurement during the AFW pump operation, etc.) suggested as additional measures by the domestic NPP operator. Furthermore, it should be necessary to fundamentally review the adequacy of the multi-stage orifice design.
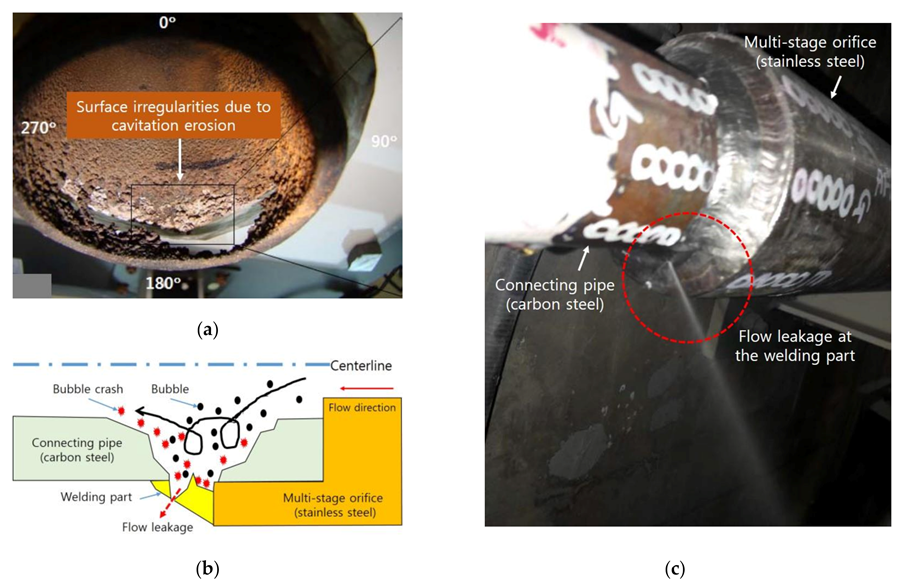
- As the operating flow rate increased, the maximum value of the stress intensity acting on the multi-stage orifice and the connecting pipe also increased but was predicted to be less than the allowable stress for the connecting pipe made of carbon steel in which the actual leakage occurred. Therefore, it is judged that the integrity of the multi-stage orifice and the connecting pipe can be maintained under the condition that there is no pipe thinning due to cavitation erosion.
- One of the important design considerations for the multi-stage orifice is to ensure that no cavitation occurs there. However, in the case of the original multi-stage orifice (d8/d = 1.0) installed in the AFW pump recirculation line of the domestic NPP, it was found that the cavitation region was formed inside the hole of the eighth stage orifice even when the corresponding flow rate was the reduced amount up to 54% compared to the operating flow rate. Therefore, it is necessary to review the appropriateness of the multi-stage orifice design.
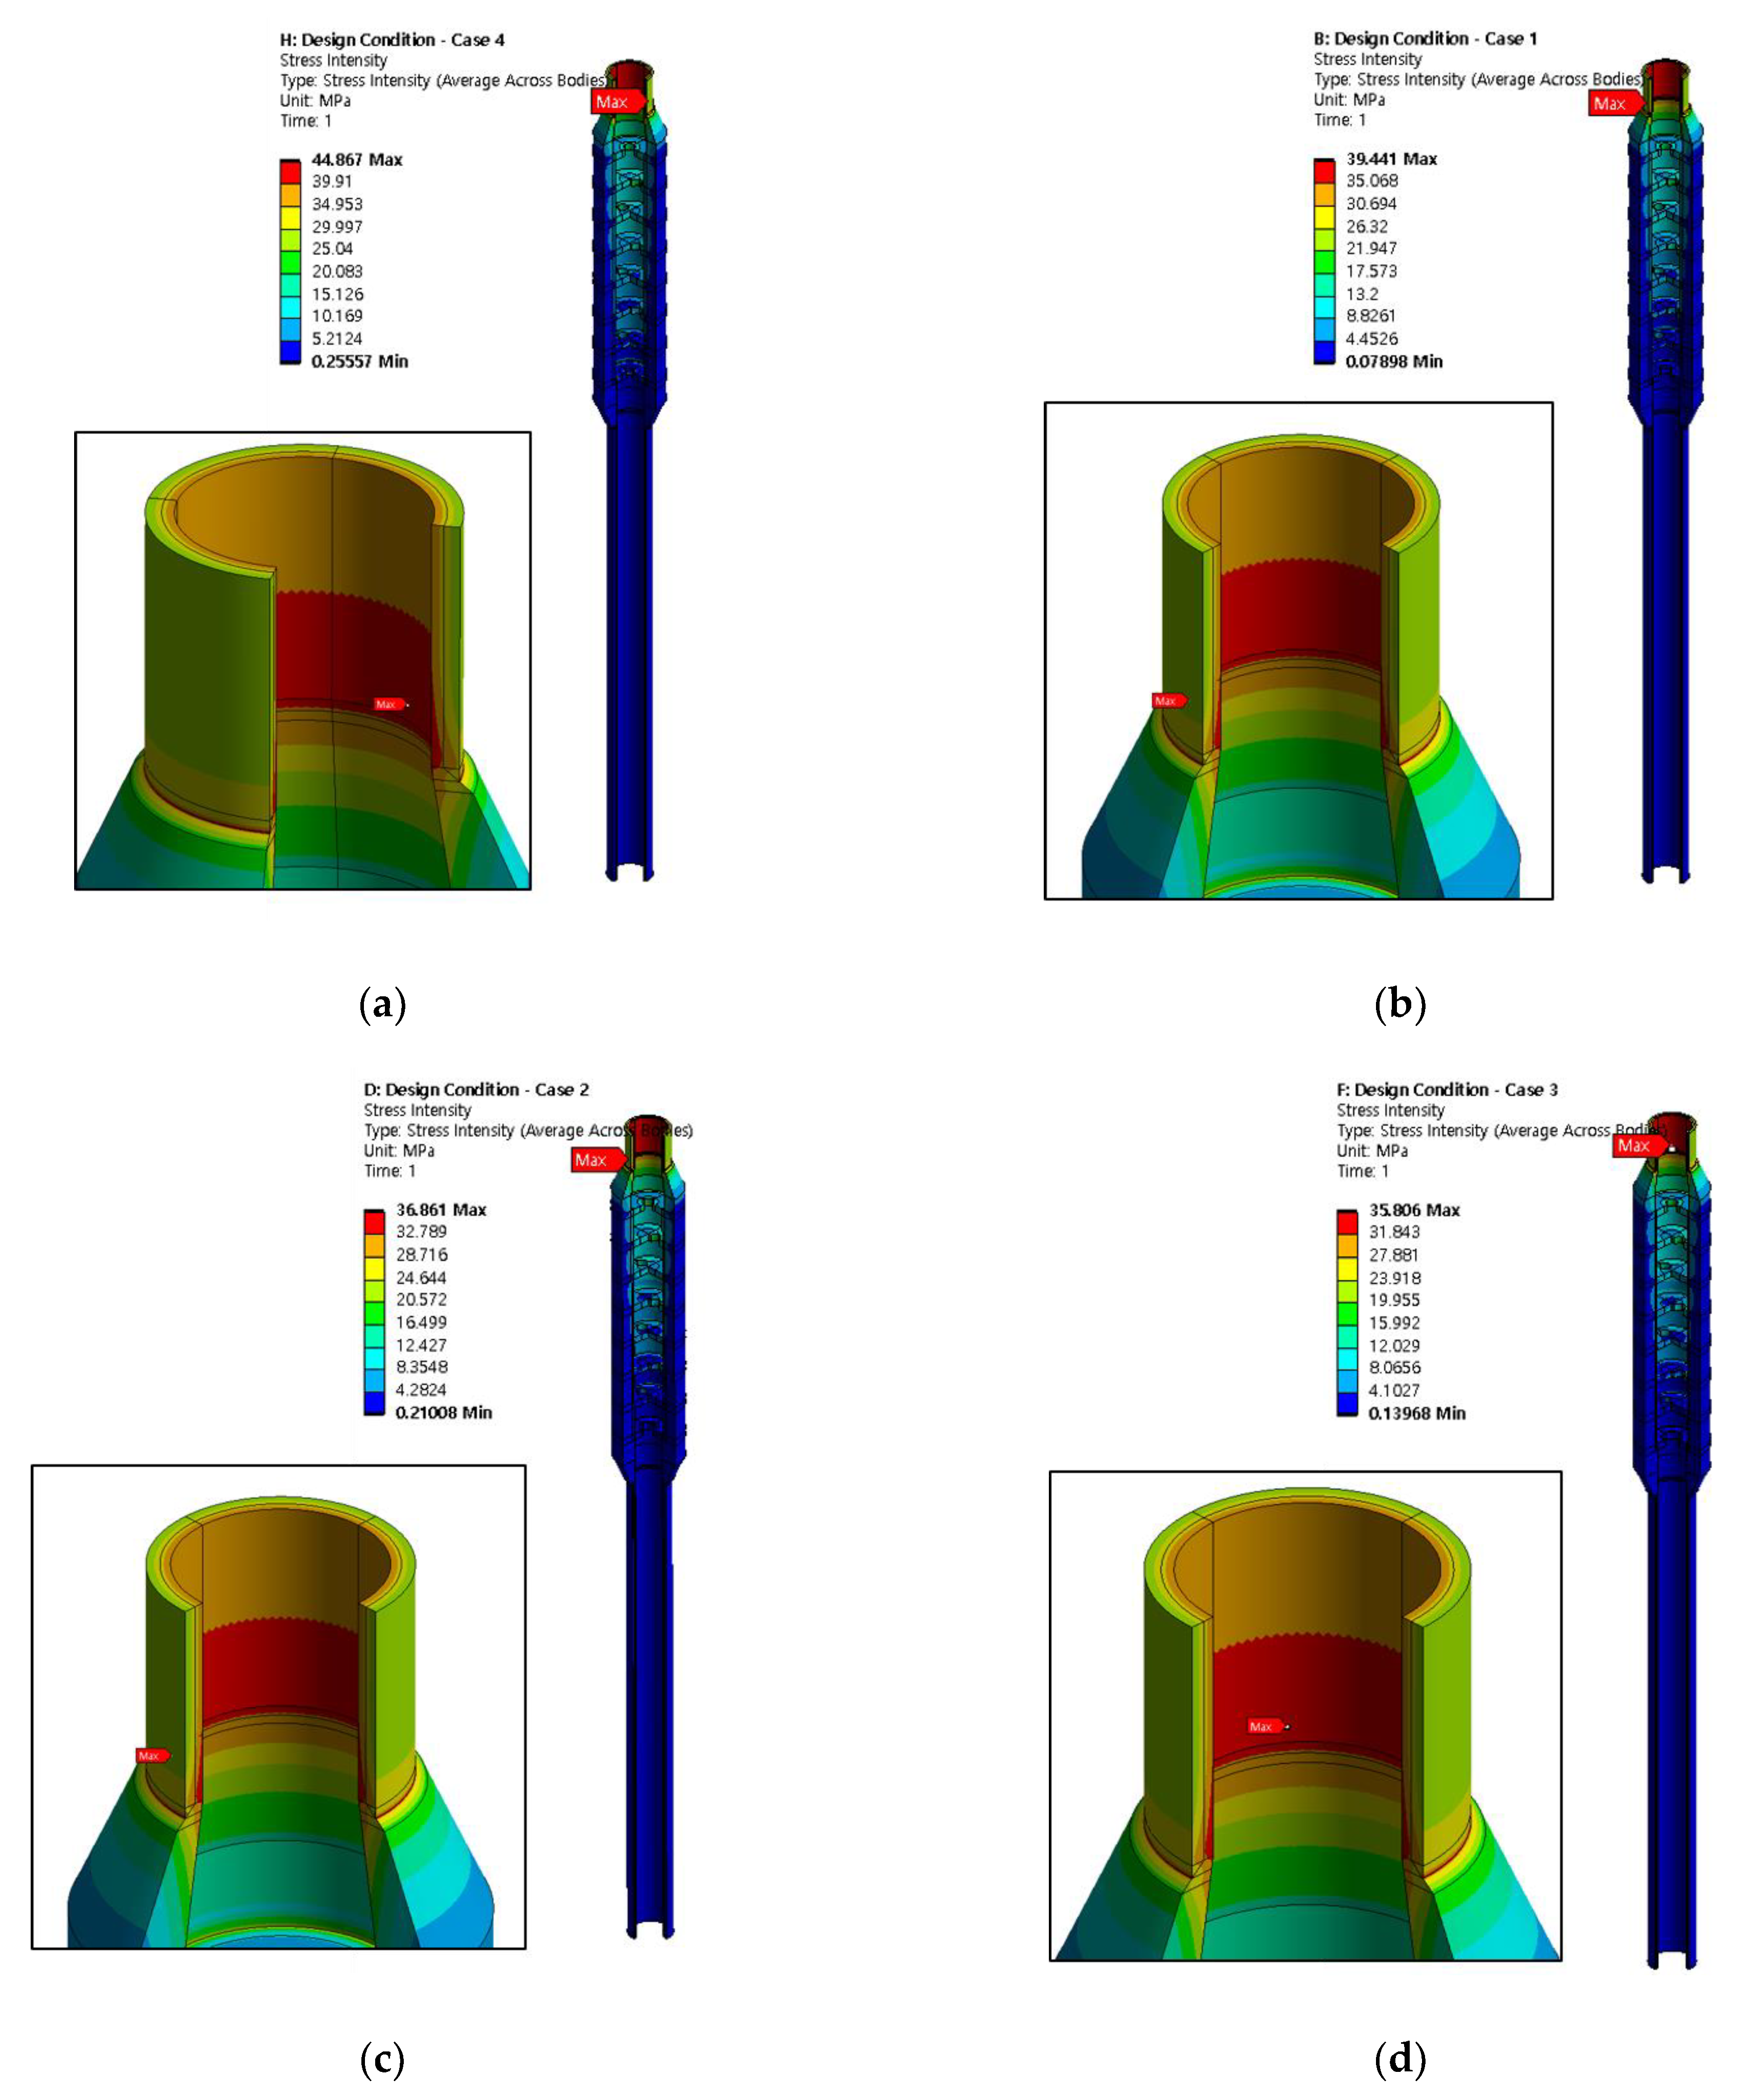
- As the hole diameter size of the eighth stage orifice decreased, the maximum value of the stress intensity that occurred in the upstream connecting pipe of the multi-stage orifice increased. However, it was found that the change in the size of the hole diameter of the eighth stage orifice under the design flow rate condition did not significantly affect the stress intensity distribution in the multi-stage orifice and the connecting pipe.
Author Contributions
Funding
Acknowledgments
Conflicts of Interest
References
- Korea Hydro & Nuclear Power. Comprehensive Action Plane for Leakage of the Welding Part, Reporting Material; Korea Hydro & Nuclear Power: Gyeongju, Korea, 2018. [Google Scholar]
- Lee, H.S.; Choi, M.H. Review of High Vibration of Multistage Orifice Piping by Cavitation. In Proceedings of the KSFM Annual Meeting, Pyeongchang, Korea, 3–5 July 2019; pp. 214–217. [Google Scholar]
- Wang, H.; Xie, S.; Sai, Q.; Zhou, C.; Lin, H.; Chen, E. Experiment study on pressure drop of a multistage letdown orifice tube. Nucl. Eng. Des. 2013, 265, 633–638. [Google Scholar]
- Bai, W.; Duan, Q.; Zhang, Z. Numerical investigation on cavitation within letdown orifice of PWR nuclear power plant. Nucl. Eng. Des. 2002, 305, 230–245. [Google Scholar] [CrossRef]
- Niyogi, K.K.; Anton, S.; Majumdar, D.M. Prediction of Performance of Multi-stage Orifice Assembly using CFD Code. In Proceedings of the 26th International Conference on Nuclear Engineering, ICONE26-81186, London, UK, 22–26 July 2018. [Google Scholar]
- Araoye, A.A.; Badr, H.M.; Ahmed, W.H. Investigation of flow through multi-stage restricting orifices. Ann. Nucl. Energy 2017, 104, 75–90. [Google Scholar] [CrossRef]
- Lee, G.H.; Bae, J.H. Numerical study for the effect of diameter ratio magnitudes on the flow pattern around a flat orifice flowmeter. J. Comput. Fluids Eng. 2019, 24, 42–49. [Google Scholar] [CrossRef]
- Menter, F. CFD Best Practice Guidelines for CFD Code Validation for Reactor Safety Applications; ECORA CONTRACT N°FIKS-CT-2001-00154; European Commission: Brussels, Belgium, 2002; p. 8. [Google Scholar]
- ANSYS. Turbulence and Near-wall Modeling. In ANSYS CFX-Solver Modeling Guide; ANSYS: Canonsburg, PA, USA, 2018. [Google Scholar]
- Lee, G.H.; Bae, J.H.; Kang, S.H. Preliminary Assessment for the Welding Part Integrity of Multistage Orifice in the Auxiliary Feedwater System, NSTAR-20NS13-129; Korea Foundation of Nuclear Safety: Seongnam, Korea, 2020. [Google Scholar]
- Korea Hydro & Nuclear Power. Auxiliary Feedwater. In The Final Safety Analysis Report; Korea Hydro & Nuclear Power: Gyeongju, Korea, 2020. [Google Scholar]
- Lee, G.H.; Bae, J.H. CFD Simulation of Cavitation Flow inside a Cavitating Venturi using ANSYS CFX. In Proceedings of the Transactions of the Korean Nuclear Society Spring Meeting, Jeju, Korea, 9–10 July 2020. [Google Scholar]
- Lee, G.H.; Bae, J.H. Comparative study for the prediction of cavitating flow inside a square-edged orifice using different commercial CFD software. E3S Web Conf. 2019, 128, 1–3. [Google Scholar] [CrossRef]
- Lee, G.H.; Bae, J.H. Assessment of Mesh Topology Effect on the Analysis Result of Cavitation Phenomenon inside an Orifice. In Proceedings of the KSCFE Spring Conference, Jeju, Korea, 3–5 July 2019. [Google Scholar]
- ANSYS. Element Library. In ANSYS Element Reference; ANSYS: Canonsburg, PA, USA, 2020. [Google Scholar]
- Lee, G.H.; Bae, J.H.; Kang, S.H. Numerical Study on the Flow Characteristics inside a Multi-stage Orifice depending on the Orifice Hole Diameter Sizes at the Design Condition. In Proceedings of the 31th International Symposium on Transport Phenomena, Honolulu, HI, USA, 13–16 October 2020. [Google Scholar]


| Stage No. | Lt (mm) | d (mm) | D (mm) | β = d/D |
|---|---|---|---|---|
| 1 | 9.0 | 10.31 | 42.82 | 0.241 |
| 2 | 6.0 | 12.14 | 0.284 | |
| 3 | 4.0 | 14.27 | 0.333 | |
| 4 | 3.0 | 16.69 | 0.390 | |
| 5 | 3.0 | 19.30 | 0.451 | |
| 6 | 3.0 | 15.00 | 0.350 |
| Items | Values | Items | Values |
|---|---|---|---|
| Total number of nodes | 7.58 × 10⁶ | Max. face angle | 135.0° |
| Total number of elements | 7.48 × 10⁶ | Max. edge length ratio | 771.7 |
| Min. face angle | 45.0° | Max. element volume ratio | 18.8 |
| Flowrate (m3/h) | Reynolds Number | P0–P1 (MPa) | P1–P2 (MPa) | P2–P3 (MPa) | P3–P4 (MPa) | P4–P5 (MPa) | P5–P6 (MPa) |
|---|---|---|---|---|---|---|---|
| 5.24 | 8.68 × 10⁴ | 0.25 | 0.11 | 0.08 | 0.046 | 0.027 | 0.067 |
| 5.64 | 9.32 × 10⁴ | 0.29 | 0.13 | 0.09 | 0.055 | 0.031 | 0.08 |
| 5.85 | 9.67 × 10⁴ | 0.31 | 0.14 | 0.1 | 0.06 | 0.034 | 0.086 |
| 6.02 | 9.96 × 10⁴ | 0.33 | 0.15 | 0.11 | 0.062 | 0.035 | 0.09 |
| 6.21 | 1.03 × 10⁵ | 0.35 | 0.16 | 0.12 | 0.065 | 0.038 | 0.096 |
| Items | Contents | |
|---|---|---|
| Discretization accuracy for the convective terms | Momentum eqn. | High resolution |
| Turbulence transport eqn. | High resolution | |
| Interphase transfer model | Mixture | |
| Cavitation model | Rayleigh–Plesset | |
| Turbulence model | Standard k-ε | |
| Near-wall treatment method | Scalable wall function | |
| Convergence criterion | <10−5 | |
| Items | Type1 | Type2 | Type3 |
|---|---|---|---|
| Total number of nodes | 3.21 × 10⁶ | 5.02 × 10⁶ | 7.04 × 10⁶ |
| Total number of elements | 3.15 × 10⁶ | 4.94 × 10⁶ | 6.94 × 10⁶ |
| Min. face angle | 45.3° | 45.2° | 45.2° |
| Max. face angle | 134.9° | 135.0° | 135.0° |
| Max. edge length ratio | 611.6 | 61.3 | 61.3 |
| Max. element volume ratio | 9 | 9 | 9 |
| Case | Flowrate (m3/h) | Diameter Ratio (d8/d) | Stress Intensity (MPa) | Membrane Stress (MPa) | Membrane + Bending Stress (MPa) | Allowable Stress (MPa) | Location of Maximum Stress |
|---|---|---|---|---|---|---|---|
| OP1 | 34.1 | 1 | 123.6 | 105.9 | 121.8 | 207 | Upstream connecting pipe |
| OP2 | 37 | 145.8 | 125 | 143.7 | |||
| OP3 | 39 | 162 | 138.8 | 159.7 | |||
| OP4 | 41.5 | 183.8 | 157.5 | 181.2 |
| Case | Flowrate (m3/h) | Diameter Ratio (d8/d) | Max. Radial Deformation (mm) | Location of Max. Deformation | Max. Hoop Deformation (mm) | Location of Max. Deformation | Max. Axial Deformation (mm) | Location of Max. Deformation |
|---|---|---|---|---|---|---|---|---|
| OP1 | 34.1 | 1 | 0.013 | Upstream connecting pipe | 0.0017 | 3rd stage orifice | 0.0154 | 7th stage orifice |
| OP2 | 37 | 0.0155 | 0.0044 | Downstream connecting pipe | 0.0183 | |||
| OP3 | 39 | 0.0171 | 0.0023 | 3rd stage orifice | 0.0203 | |||
| OP4 | 41.5 | 0.0194 | 0.0037 | Downstream connecting pipe | 0.0231 |
| Case | Flowrate (m3/h) | Diameter Ratio (d8/d) | Stress Intensity (MPa) | Membrane Stress (MPa) | Membrane + Bending Stress (MPa) | Allowable Stress (MPa) | Location of Maximum Stress |
|---|---|---|---|---|---|---|---|
| DS1 | 19.3 | 0.84 | 44.87 | 38.43 | 44.23 | 207 | Upstream connecting pipe |
| DS2 | 1 | 39.44 | 33.77 | 38.88 | |||
| DS3 | 1.24 | 36.86 | 31.56 | 36.34 | |||
| DS4 | 1.49 | 35.81 | 30.65 | 35.3 |
| Case | Flowrate (m3/h) | Diameter Ratio (d8/d) | Max. Radial Deformation (mm) | Location of Max. Deformation | Max. Hoop Deformation (mm) | Location of Max. Deformation | Max. Axial Deformation (mm) | Location of Max. Deformation |
|---|---|---|---|---|---|---|---|---|
| DS1 | 19.3 | 0.84 | 0.0046 | Upstream connecting pipe | 0.0007 | Downstream connecting pipe | 0.0063 | 8th stage orifice |
| DS2 | 1 | 0.0041 | 0.0006 | 3rd stage orifice | 0.0049 | 7th stage orifice | ||
| DS3 | 1.24 | 0.0038 | 0.0005 | 0.0045 | ||||
| DS4 | 1.49 | 0.0037 | 0.0005 | 0.0044 |
Publisher’s Note: MDPI stays neutral with regard to jurisdictional claims in published maps and institutional affiliations. |
© 2021 by the authors. Licensee MDPI, Basel, Switzerland. This article is an open access article distributed under the terms and conditions of the Creative Commons Attribution (CC BY) license (http://creativecommons.org/licenses/by/4.0/).
Share and Cite
Lee, G.; Jhung, M.; Bae, J.; Kang, S. Numerical Study on the Cavitation Flow and Its Effect on the Structural Integrity of Multi-Stage Orifice. Energies 2021, 14, 1518. https://doi.org/10.3390/en14061518
Lee G, Jhung M, Bae J, Kang S. Numerical Study on the Cavitation Flow and Its Effect on the Structural Integrity of Multi-Stage Orifice. Energies. 2021; 14(6):1518. https://doi.org/10.3390/en14061518
Chicago/Turabian StyleLee, Gonghee, Myungjo Jhung, Juneho Bae, and Soonho Kang. 2021. "Numerical Study on the Cavitation Flow and Its Effect on the Structural Integrity of Multi-Stage Orifice" Energies 14, no. 6: 1518. https://doi.org/10.3390/en14061518
APA StyleLee, G., Jhung, M., Bae, J., & Kang, S. (2021). Numerical Study on the Cavitation Flow and Its Effect on the Structural Integrity of Multi-Stage Orifice. Energies, 14(6), 1518. https://doi.org/10.3390/en14061518