
Changes in Energy Consumption in Agriculture in the EU Countries

 ,
,  ,
,  ,
,  ,
, 
Abstract
1. Introduction
2. Materials and Methods
3. Results
4. Discussion
5. Conclusions
Author Contributions
Funding
Conflicts of Interest
References
- Giannakis, E.; Bruggeman, A. The highly variable economic performance of European agriculture. Land Use Policy 2015, 45, 26–35. [Google Scholar] [CrossRef]
- Schulp, C.J.; Levers, C.; Kuemmerle, T.; Tieskens, K.F.; Verburg, P.H. Mapping and modelling past and future land use change in Europe’s cultural landscapes. Land Use Policy 2019, 80, 332–344. [Google Scholar] [CrossRef]
- Kristensen, S.B.P.; Busck, A.G.; van der Sluis, T.; Gaube, V. Patterns and drivers of farm-level land use change in selected European rural landscapes. Land Use Policy 2016, 57, 786–799. [Google Scholar] [CrossRef]
- Leśniewska-Napierała, K.; Nalej, M.; Napierała, T. The Impact of EU Grants Absorption on Land Cover Changes—The Case of Poland. Remote Sens. 2019, 11, 2359. [Google Scholar] [CrossRef]
- Veronica, P.; Raluca, T.A. Convergence of Romanian and European Union Agriculture-Evolution and Prospective Assessment. Ovidius Univ. Ann. Econ. Sci. Ser. 2018, 18, 239–247. [Google Scholar]
- Reiff, M.; Surmanová, K.; Balcerzak, A.P.; Pietrzak, M.B. Multiple criteria analysis of European Union agriculture. J. Int. Stud. 2016, 9, 62–74. [Google Scholar] [CrossRef] [PubMed]
- Nowak, A.; Kaminska, A. Agricultural competitiveness: The case of the European Union countries. Agric. Econ. 2016, 62, 507–516. [Google Scholar]
- Dos Santos, M.L. Segmenting Farms in the European Union. Agric. Econ. 2013, 59, 49–57. [Google Scholar]
- Carraresi, L.; Banterle, A. Agri-food Competitive Performance in EU Countries: A Fifteen-Year Retrospective. Int. Food Agribus. Manag. Rev. 2015, 18, 37–62. [Google Scholar]
- Spicka, J. The economic disparity in European agriculture in the context of the recent EU enlargements. J. Econ. Sustain. Dev. 2013, 4, 125–133. [Google Scholar]
- Reiff, M.; Ivanicova, Z.; Surmanova, K. Cluster analysis of selected world development indicators in the fields of agriculture and the food industry in European Union countries. Agric. Econ. 2018, 64, 197–205. [Google Scholar] [CrossRef]
- Reiff, M.; Surmanova, K.; Balcerzak, A.P.; Pietrzak, M.B. Quantitative Analysis of European Union Agriculture Performance; Institute of Economic Research Working Papers No. 32/2016; 2016; Available online: http://www.badania-gospodarcze.pl/images/Working_Papers/2016_No_32.pdf (accessed on 10 January 2021).
- Coca, O.; Ștefan, G.; Crețu, A.; Creangă, D.E. Research on the Development of Agriculture in the European Union. A Structural Analysis by Geographical Groups of Countries. Rom. Agric. Res. 2020, 37, 229–242. [Google Scholar]
- Vanschoenwinkel, J.; Mendelsohn, R.; Van Passel, S. Do Western and Eastern Europe have the same agricultural climate response? Taking adaptive capacity into account. Glob. Environ. Chang. 2016, 41, 74–87. [Google Scholar] [CrossRef]
- Swinnen, J.F.; Swinnen, J.; Vranken, L. Land & EU Accession: Review of the Transitional Restrictions on New Member States on the Acquisition of Agricultural Real Estate; CEPS: Brussels, Belgium, 2009. [Google Scholar]
- Hartvigsen, M. Land reform and land fragmentation in Central and Eastern Europe. Land Use Policy 2014, 36, 330–341. [Google Scholar] [CrossRef]
- Andrejovská, A.; Buleca, J.; Hudákova, M. Categorization of the EU Countries in the Context of Agricultural Production. AGRIS On-Line Pap. Econ. Inform. 2016, 8, 3–14. [Google Scholar] [CrossRef]
- Rokicki, T.; Perkowska, A.; Ratajczak, M. Differentiation in Healthcare Financing in EU Countries. Sustainability 2021, 13, 251. [Google Scholar] [CrossRef]
- Rokicki, T.; Perkowska, A. Changes in Energy Supplies in the Countries of the Visegrad Group. Sustainability 2020, 12, 7916. [Google Scholar] [CrossRef]
- Ciutacu, C.; Chivu, L.; Andrei, J.V. Similarities and dissimilarities between the EU agricultural and rural development model and Romanian agriculture. Challenges and perspectives. Land Use Policy 2015, 44, 169–176. [Google Scholar] [CrossRef]
- Popescu, G.H.; Nicoale, I.; Nica, E.; Vasile, A.J.; Andreea, I.R. The influence of land-use change paradigm on Romania’s agro-food trade competitiveness—An overview. Land Use Policy 2017, 61, 293–301. [Google Scholar] [CrossRef]
- Giannakis, E.; Bruggeman, A. Regional disparities in economic resilience in the European Union across the urban-rural divide. Reg. Stud. 2020, 54, 1200–1213. [Google Scholar] [CrossRef]
- Szabo, L.; Grznár, M. Agriculture in the EU and Position of the Slovak Republic. Agric. Econ. 2015, 61, 493–501. [Google Scholar] [CrossRef]
- Pietrzak, M.B.; Walczak, D. The Analysis of the Agrarian Structure in Poland with the Special Consideration of the Years 1921 and 2002. Bulg. J. Agric. Sci. 2014, 20, 1018–1039. [Google Scholar]
- Walczak, D.; Pietrzak, M.B. Analysis of Agrarian Structure in Poland in 1921 and 2002 based on the Example of Selected Districts. In Business Challenges in the Changing Economic Landscape; Bilgin, M.H., Danis, H., Demir, E., Can, U., Eds.; Springer: Berlin/Heidelberg, Germany, 2016; Volume 1, pp. 461–472. [Google Scholar]
- Nowak, A.; Różańska-Boczula, M. Differentiation in the production potential and efficiency of farms in the member states of the European Union. Agric. Econ. 2019, 65, 395–403. [Google Scholar] [CrossRef]
- Popescu, A.; Dinu, T.A.; Stoian, E. Efficiency of the agricultural land use in the European Union. Scientific Papers Series-Management. Econ. Eng. Agric. Rural Dev. 2019, 19, 475–486. [Google Scholar]
- Popescu, A. Considerations on utilized agricultural land and farm structure in the European Union. Scientific Papers Series Management. Econ. Eng. Agric. Rural Dev. 2013, 13, 221–226. [Google Scholar]
- Popescu, A.; Alecu, I.N.; Dinu, T.A.; Stoian, E.; Condei, R.; Ciocan, H. Farm Structure and Land Concentration in Romania and the European Union’s Agriculture. Agric. Agric. Sci. Procedia 2016, 10, 566–577. [Google Scholar] [CrossRef]
- Bularca, E.; Toma, E. Agricultural labour productivity and its impact in farming system. Sci. Pap. Ser. Manag. Econ. Eng. Agric. Rural Dev. 2019, 19, 91–96. [Google Scholar]
- Dorward, A. Agricultural labour productivity, food prices and sustainable development impacts and indicators. Food Policy 2013, 39, 40–50. [Google Scholar] [CrossRef]
- Svoboda, J.; Lososová, J.; Zdeněk, R. Analysis of costs and their effectiveness in the EU agrarian sector. Custos Agronegocio Line 2020, 16, 151–173. [Google Scholar]
- Abson, D.J. The economic drivers and consequences of agricultural specialization. In Agroecosystem Diversity; Academic Press: Cambridge, MA, USA, 2019; pp. 301–315. Available online: https://www.sciencedirect.com/science/article/pii/B9780128110508000194 (accessed on 10 January 2021).
- Brunori, G.; D’Amico, S.; Rossi, A. Practices of Sustainable Intensification Farming Models: An Analysis of the Factors Conditioning Their Functioning, Expansion, and Transformative Potential. In Agroecosystem; Academic Press: Cambridge, MA, USA, 2019; pp. 317–333. [Google Scholar]
- Pavlov, A.Y. Managing sustainable development of rural areas using algorithms of agricultural specialization. Mediterr. J. Soc. Sci. 2015, 6, 147. [Google Scholar] [CrossRef][Green Version]
- Pierangeli, F.; Henke, R.; Coronas, M.G. Multifunctional agriculture: An analysis of country specialization and regional differentiation. In Proceedings of the European Association of Agricultural Economists (EAAE), Ghent, Belgium, 26–29 August 2008. No. 725-2016-49366. [Google Scholar]
- Vlasenko, T.; Vlasovets, V.; Timofeev, S.; Kravets, A. Specialization issues of production of agrarian enterprises. In SHS Web of Conferences; EDP Sciences: Paris, France, 2019; Volume 67, p. 06056. [Google Scholar]
- Mushtaq, K.; Abbas, F.; Ghafoor, A. Energy use for economic growth: Cointegration and causality analysis from the agriculture sector of Pakistan. Pak. Dev. Rev. 2007, 46, 1065–1073. [Google Scholar] [CrossRef]
- Sebri, M.; Abid, M. Energy use for economic growth: A trivariate analysis from Tunisian agriculture sector. Energy Policy 2012, 48, 711–716. [Google Scholar] [CrossRef]
- Agheli, L. Estimating the demand for diesel in agriculture sector of Iran. Int. J. Energy Econ. Policy 2015, 5, 660–667. [Google Scholar]
- Ceylan, Z. Assessment of agricultural energy consumption of Turkey by MLR and Bayesian optimized SVR and GPR models. J. Forecast. 2020, 39, 944–956. [Google Scholar] [CrossRef]
- Zaman, K.; Khan, M.M.; Ahmad, M.; Rustam, R. The relationship between agricultural technology and energy demand in Pakistan. Energy Policy 2012, 44, 268–279. [Google Scholar] [CrossRef]
- Perea, R.G.; Poyato, E.C.; Montesinos, P.; Díaz, J.R. Prediction of irrigation event occurrence at farm level using optimal decision trees. Comput. Electron. Agric. 2019, 157, 173–180. [Google Scholar] [CrossRef]
- Qiao, F. Increasing wage, mechanization, and agriculture production in China. China Econ. Rev. 2017, 46, 249–260. [Google Scholar] [CrossRef]
- Tanikawa, T. Mechanization of Agriculture Considering Its Business Model. In Smart Plant Factory; Springer: Singapore, 2018; pp. 241–244. [Google Scholar]
- Kalita, A. Changes in labor pattern and agricultural mechanization. J. Manag. Res. Anal. 2019, 6, 9–13. [Google Scholar] [CrossRef]
- Mihov, M.; Kr, G.; Ivanova, N. Current Problems of Agricultural Production Mechanization. Mech. Agric. Conserv. Resour. 2017, 63, 111–114. [Google Scholar]
- Zheng, S.; Lam, C.M.; Hsu, S.C.; Ren, J. Evaluating efficiency of energy conservation measures in energy service companies in China. Energy Policy 2018, 122, 580–591. [Google Scholar] [CrossRef]
- Raza, M.Y.; Wasim, M.; Sarwar, M.S. Development of Renewable Energy Technologies in rural areas of Pakistan. Energy Sources Part A Recovery Util. Environ. Eff. 2020, 42, 740–760. [Google Scholar] [CrossRef]
- Karkacier, O.; Goktolga, Z.G.; Cicek, A. A regression analysis of the effect of energy use in agriculture. Energy Policy 2006, 34, 3796–3800. [Google Scholar] [CrossRef]
- Alipour, A.; Veisi, H.; Darijani, F.; Mirbagheri, B.; Behbahani, A.G. Study and determination of energy consumption to produce conventional rice of the Guilan province. Res. Agric. Eng. 2012, 58, 99–106. [Google Scholar] [CrossRef]
- Chandio, A.A.; Jiang, Y.; Rehman, A. Energy consumption and agricultural economic growth in Pakistan: Is there a nexus? Int. J. Energy Sect. Manag. 2019, 13, 597–609. [Google Scholar] [CrossRef]
- Inumula, K.M.; Singh, S.; Solanki, S. Energy Consumption and Agricultural Economic Growth Nexus: Evidence from India. Int. J. Energy Econ. Policy 2020, 10, 545. [Google Scholar] [CrossRef]
- Pamučar, D.; Behzad, M.; Božanić, D.; Behzad, M. Decision making to support sustainable energy policies corresponding to agriculture sector: Case study in Iran’s Caspian Sea coastline. J. Clean. Prod. 2020, 125302. [Google Scholar] [CrossRef]
- Chang, J.; Leung, D.Y.; Wu, C.Z.; Yuan, Z.H. A review on the energy production, consumption, and prospect of renewable energy in China. Renew. Sustain. Energy Rev. 2003, 7, 453–468. [Google Scholar] [CrossRef]
- Haberl, H.; Beringer, T.; Bhattacharya, S.C.; Erb, K.H.; Hoogwijk, M. The global technical potential of bio-energy in 2050 considering sustainability constraints. Curr. Opin. Environ. Sustain. 2010, 2, 394–403. [Google Scholar] [CrossRef]
- Gabrielle, B.; Bamière, L.; Caldes, N.; De Cara, S.; Decocq, G.; Ferchaud, F.; Richard, G. Paving the way for sustainable bioenergy in Europe: Technological options and research avenues for large-scale biomass feedstock supply. Renew. Sustain. Energy Rev. 2014, 33, 11–25. [Google Scholar] [CrossRef]
- Ballarin, A.; Vecchiato, D.; Tempesta, T.; Marangon, F.; Troiano, S. Biomass energy production in agriculture: A weighted goal programming analysis. Energy Policy 2011, 39, 1123–1131. [Google Scholar] [CrossRef]
- Popp, J.; Lakner, Z.; Harangi-Rakos, M.; Fari, M. The effect of bioenergy expansion: Food, energy, and environment. Renew. Sustain. Energy Rev. 2014, 32, 559–578. [Google Scholar] [CrossRef]
- Araújo, K.; Mahajan, D.; Kerr, R.; Silva, M.D. Global biofuels at the crossroads: An overview of technical, policy, and investment complexities in the sustainability of biofuel development. Agriculture 2017, 7, 32. [Google Scholar] [CrossRef]
- Bilgen, S.; Keleş, S.; Sarıkaya, İ.; Kaygusuz, K. A perspective for potential and technology of bioenergy in Turkey: Present case and future view. Renew. Sustain. Energy Rev. 2015, 48, 228–239. [Google Scholar] [CrossRef]
- Ozturk, M.; Saba, N.; Altay, V.; Iqbal, R.; Hakeem, K.R.; Jawaid, M.; Ibrahim, F.H. Biomass and bioenergy: An overview of the development potential in Turkey and Malaysia. Renew. Sustain. Energy Rev. 2017, 79, 1285–1302. [Google Scholar] [CrossRef]
- Öztürk, M.; Gucel, S.; Armagan, B.; Kucuk, M. An overview of the biomass potential in Turkey and possibilities for the utilization of degraded areas. In Proceedings of the 1st Intern. Nuclear and Renewable Energy Conference (INREC 10), Amman, Jordan, 21 March 2010; pp. 21–24. [Google Scholar]
- Godard, C.; Boissy, J.; Gabrielle, B. Life-cycle assessment of local feedstock supply scenarios to compare candidate biomass sources. Gcb Bioenergy 2013, 5, 16–29. [Google Scholar] [CrossRef]
- Collotta, M.; Champagne, P.; Tomasoni, G.; Alberti, M.; Busi, L.; Mabee, W. Critical indicators of sustainability for biofuels: An analysis through a life cycle sustainabilty assessment perspective. Renew. Sustain. Energy Rev. 2019, 115, 109358. [Google Scholar] [CrossRef]
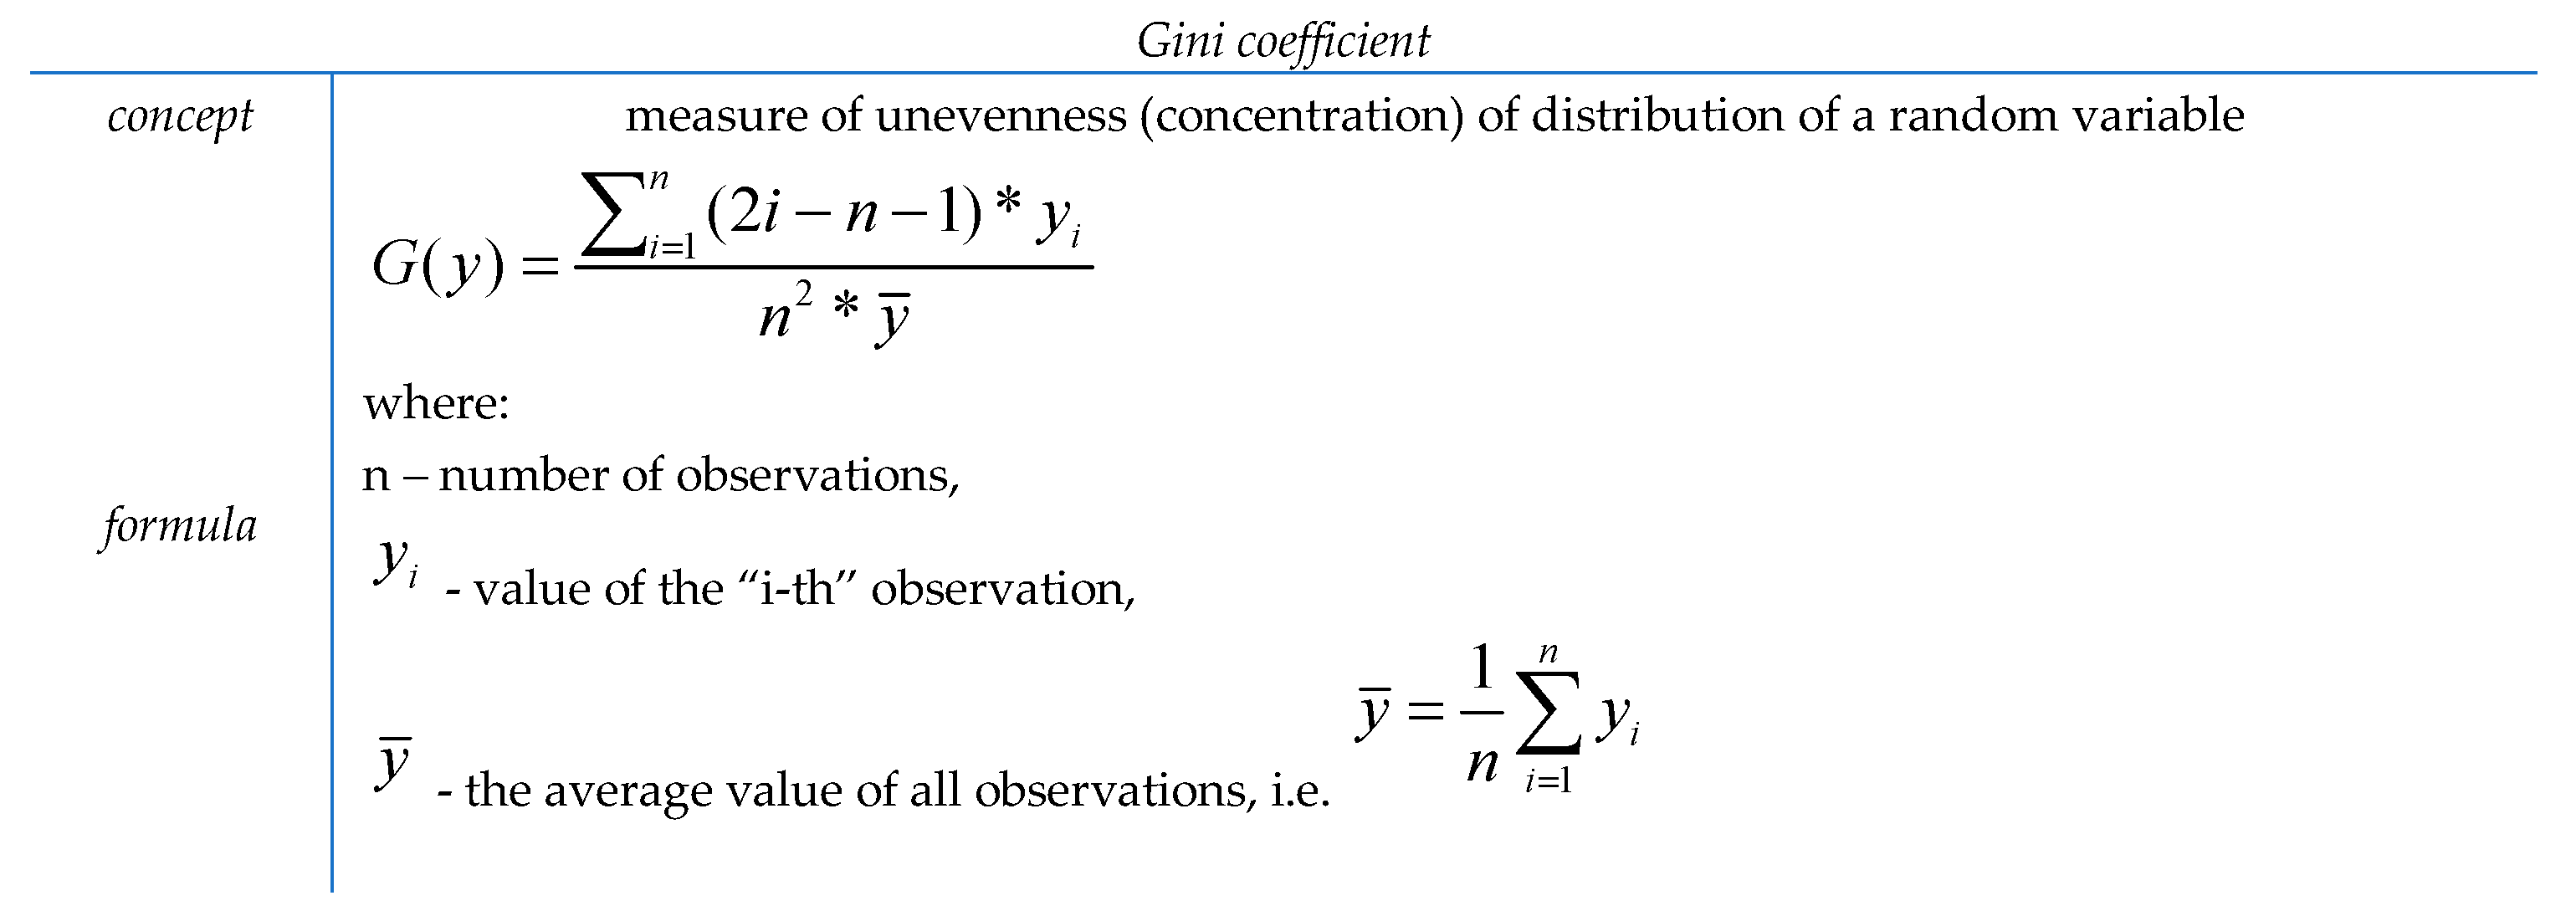
- Dixon, P.M.; Weiner, J.; Mitchell-Olds, T.; Woodley, R. Erratum to ‘Bootstrapping the Gini Coefficient of Inequality. Ecology 1988, 69, 1307. [Google Scholar] [CrossRef]
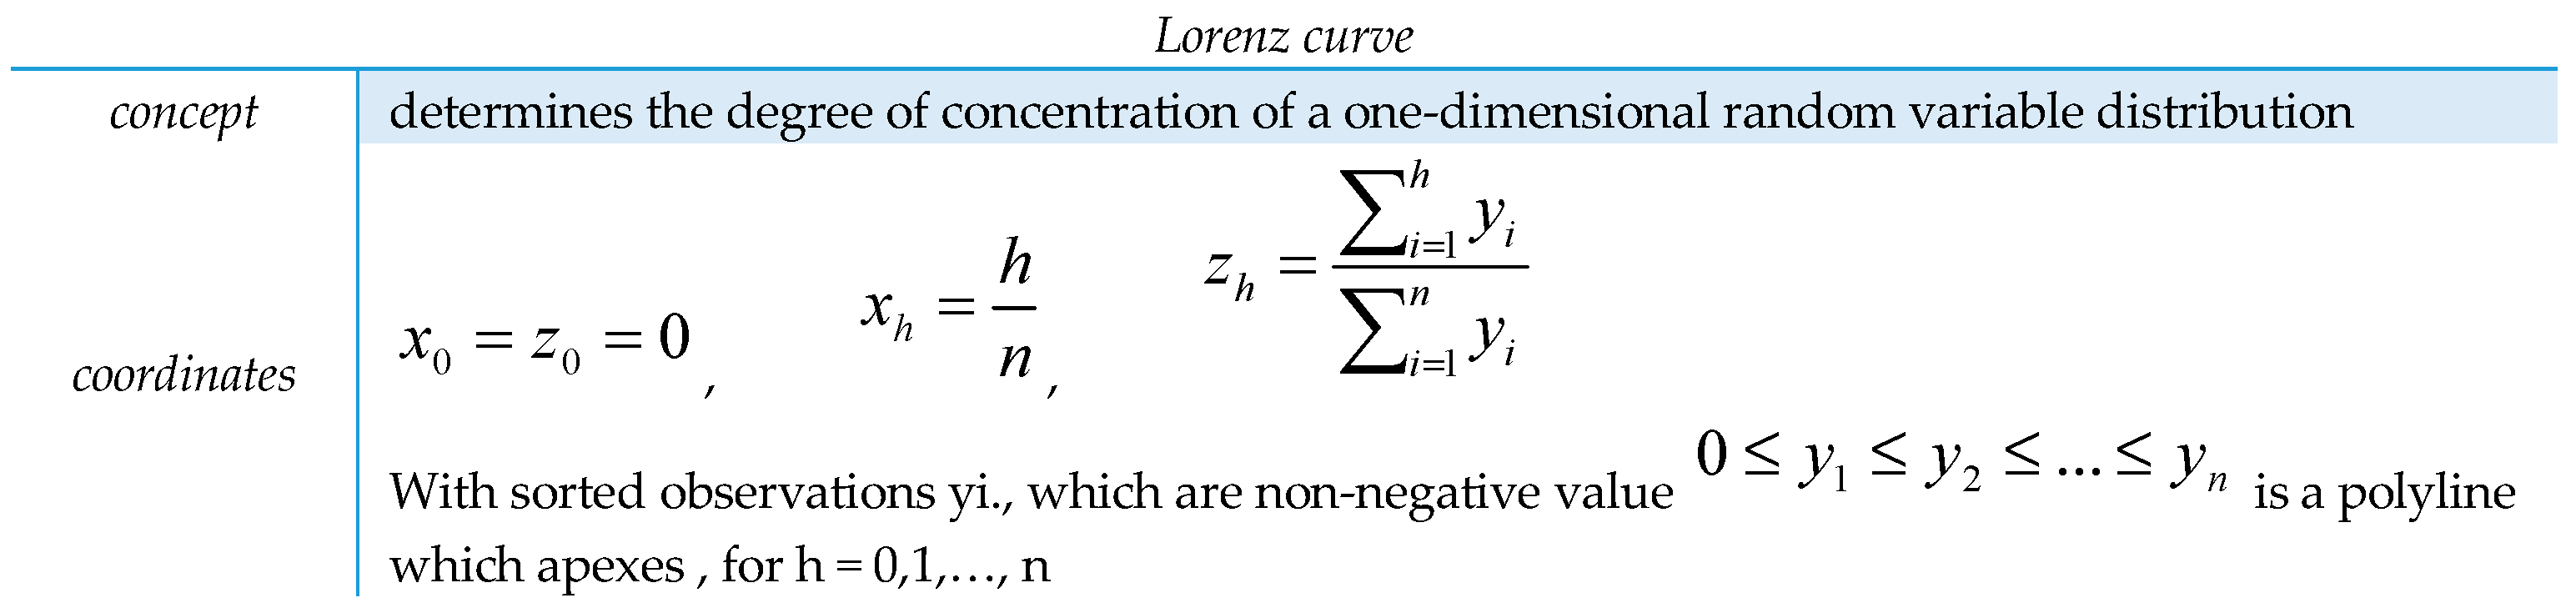
- Dagum, C. The Generation and Distribution of Income, the Lorenz Curve and the Gini Ratio. Econ. Appliquée 1980, 33, 327–367. [Google Scholar]
- Starzyńska, W. Statystyka Praktyczna Wydawnictwo Naukowe; PWN: Warszawa, Poland, 2002. [Google Scholar]
- Abdi, H. Coefficient of variation. Encycl. Res. Des. 2010, 1, 169–171. [Google Scholar]
- Kendall, M.G. Rank Correlation Methods; Griffin: London, UK, 1955; p. 19. [Google Scholar]
- Spearman, C. The proof and measurement of association between two things. Am. J. Psychol. 1904, 15, 72–101. [Google Scholar] [CrossRef]
- Pelletier, N.; Audsley, E.; Brodt, S.; Garnett, T.; Henriksson, P.; Kendall, A.; Kramer, K.J.; Murphy, D.; Nemecek, T.; Troell, M. Energy intensity of agriculture and food systems. Annu. Rev. Environ. Resour. 2011, 36, 223–246. [Google Scholar] [CrossRef]
- Yang, Z.; Wang, D.; Du, T.; Zhang, A.; Zhou, Y. Total-factor energy efficiency in China’s agricultural sector: Trends, disparities and potentials. Energies 2018, 11, 853. [Google Scholar] [CrossRef]
- Fuglie, K.O.; McDonald, J.M.; Ball, V.E. Productivity Growth in US Agriculture; Economic Brief Number 9; Economic Research Service: Washington, DC, USA, 2007; p. 9.
- Po-Chi, C.H.E.N.; Ming-Miin, Y.U.; Chang, C.C.; Shih-Hsun, H.S.U. Total factor productivity growth in China’s agricultural sector. China Econ. Rev. 2008, 19, 580–593. [Google Scholar]
- Gong, B. Agricultural reforms and production in China: Changes in provincial production function and productivity in 1978–2015. J. Dev. Econ. 2018, 132, 18–31. [Google Scholar] [CrossRef]
- Yang, F.; Yang, M.; Nie, H. Productivity trends of Chinese regions: A perspective from energy saving and environmental regulations. Appl. Energy 2013, 110, 82–89. [Google Scholar] [CrossRef]
- Ghisellini, P.; Setti, M.; Ulgiati, S. Energy and land use in worldwide agriculture: An application of life cycle energy and cluster analysis. Environ. Dev. Sustain. 2016, 18, 799–837. [Google Scholar] [CrossRef]
- Pellegrini, P.; Fernández, R.J. Crop intensification, land use, and on-farm energy-use efficiency during the worldwide spread of the green revolution. Proc. Natl. Acad. Sci. USA 2018, 115, 2335–2340. [Google Scholar] [CrossRef] [PubMed]
- Toma, P.; Miglietta, P.P.; Zurlini, G.; Valente, D.; Petrosillo, I. A non-parametric bootstrap-data envelopment analysis approach for environmental policy planning and management of agricultural efficiency in EU countries. Ecol. Indic. 2017, 83, 132–143. [Google Scholar] [CrossRef]
- Rokicki, T.; Perkowska, A. Diversity and Changes in the Energy Balance in EU Countries. Energies 2021, 14, 1098. [Google Scholar] [CrossRef]
- Miglietta, P.P.; Giove, S.; Toma, P. An optimization framework for supporting decision making in biodiesel feedstock imports: Water footprint vs. import costs. Ecol. Indic. 2018, 85, 1231–1238. [Google Scholar] [CrossRef]
- Gomiero, T.; Paoletti, M.G.; Pimentel, D. Energy and environmental issues in organic and conventional agriculture. Crit. Rev. Plant Sci. 2008, 27, 239–254. [Google Scholar] [CrossRef]
- Pimentel, D.; Hepperly, P.; Hanson, J.; Douds, D.; Seidel, R. Environmental, energetic, and economic comparisons of organic and conventional farming systems. BioScience 2005, 55, 573–582. [Google Scholar] [CrossRef]
- Pergola, M.; D’Amico, M.; Celano, G.; Palese, A.; Scuderi, A.; Di Vita, G.; Pappalardo, G.; Inglese, P. Sustainability evaluation of Sicily’s lemon and orange production: An energy, economic and environmental analysis. J. Environ. Manag. 2013, 128, 674–682. [Google Scholar] [CrossRef]
- Fess, T.L.; Benedito, V.A. Organic versus conventional cropping sustainability: A comparative system analysis. Sustainability 2018, 10, 272. [Google Scholar] [CrossRef]
- Polukhin, A.A.; Lankin, A.S.; Novoselov, E.A.; Silko, E.A. Economic assessment of energy consumption in agriculture of the Russian Federation. Econ. Work Manag. Agric. 2019, 1, 58–63. [Google Scholar]
- Quan-le, L.I.U. The Saving Energy of Agriculture Machine Is the Only Way of Agriculture Modernization. Chin. Agric. Mech. 2006, 6. [Google Scholar]
- Xiangxin, L.; Yali, Z.; Chao, Z.; Xianghui, Y.; Yan, Z. The Analysis of Energy Consumption of Agricultural Machinery in Our Country and the Technology of Energy Consumption. J. Agric. Mech. Res. 2012, 4. [Google Scholar]
- Wang, X.Y.; Wang, S.; Zhang, Z.Y. Construction of energy conservation and emission reduction technology system of agricultural mechanization. Chin. Agric. Mech. 2010, 4, 6–10. [Google Scholar] [CrossRef]
- Kondratieva, N.P.; Vladykin, I.R.; Litvinova, V.M.; Krasnolutskaya, M.G.; Bolshin, R.G. Energy-saving technologies and electric equipment applied in agriculture. Res. Agric. Electr. Eng. 2016, 2, 62–68. [Google Scholar]
- Jawad, H.M.; Nordin, R.; Gharghan, S.K.; Jawad, A.M.; Ismail, M. Energy-efficient wireless sensor networks for precision agriculture: A review. Sensors 2017, 17, 1781. [Google Scholar] [CrossRef]
- Zambon, I.; Cecchini, M.; Egidi, G.; Saporito, M.G.; Colantoni, A. Revolution 4.0: Industry vs. agriculture in a future development for SMEs. Processes 2019, 7, 36. [Google Scholar] [CrossRef]
- Farajian, L.; Moghaddasi, R.; Hosseini, S. Agricultural energy demand modeling in Iran: Approaching to a more sustainable situation. Energy Rep. 2018, 4, 260–265. [Google Scholar] [CrossRef]
- Golmohamadi, H. Agricultural Demand Response Aggregators in Electricity Markets: Structure, Challenges and Practical Solutions-a Tutorial for Energy Experts. Technol. Econ. Smart Grids Sustain. Energy 2020, 5, 1–17. [Google Scholar] [CrossRef]
- Marks, G.; Wilcox, E.; Olsen, D.; Goli, S. Opportunities for Demand Response in California Agricultural Irrigation: A Scoping Study (No. LBNL-6108E); Lawrence Berkeley National Lab. (LBNL): Berkeley, CA, USA, 2013.
- Liu, J.; Chai, Y.; Xiang, Y.; Zhang, X.; Gou, S.; Liu, Y. Clean energy consumption of power systems towards smart agriculture: Roadmap, bottlenecks and technologies. CSEE J. Power Energy Syst. 2018, 4, 273–282. [Google Scholar] [CrossRef]
- Mason, E.S. Reports on the Productive Uses of Nuclear Energy: Energy Requirements and Economic Growth; National Planning Association: Washington, DC, USA, 1955; pp. 1–51. [Google Scholar]
- Frank, A.G. Industrial capital stocks and energy consumption. Econ. J. 1959, 69, 170–174. [Google Scholar] [CrossRef]
- Schurr, S.H.; Netschert, B.C.; Eliasberg, V.F.; Lerner, J.; Landsberg, H.H. Energy in the American Economy, 1850–1975: An Economic Study of Its History and Prospects; No. HD9545 R45; Johns Hopkins Press: Baltimore, MD, USA, 1955. [Google Scholar]
- Warren, J.C. Energy and economic advances. In The Philippine Economic Journal Manila; Philippine Economic Society: Quezon, Philippine, 1964. [Google Scholar]
- de Janosi, P.E.; Grayson, L.E. Patterns of energy consumption and economic growth and structure. J. Dev. Stud. 1972, 8, 241–249. [Google Scholar] [CrossRef]
- Solow, R.M. The economics of resources or the resources of economics. In Classic Papers in Natural Resource Economics; Palgrave Macmillan: London, UK, 1974; pp. 257–276. [Google Scholar]
- Rasche, R.H.; Tatom, J.A. Energy resources and potential GNP. Fed. Reserve Bank St. Louis Rev. 1977, 5910–5924. [Google Scholar] [CrossRef]
- Kraft, J.; Kraft, A. On the relationship between energy and GNP. J. Energy Dev. 1978, 3, 401–403. [Google Scholar]
- Humphrey, W.S.; Stanislaw, J. Economic growth and energy consumption in the UK, 1700–1975. Energy Policy 1979, 7, 29–42. [Google Scholar] [CrossRef]
- Zilberfarb, B.Z.; Adams, F.G. The energy-gdp relationship in developing countries: Empirical evidence and stability tests. Energy Econ. 1981, 3, 244–248. [Google Scholar] [CrossRef]
- Yu, E.S.; Choi, J.Y. The causal relationship between energy and GNP: An international comparison. J. Energy Dev. 1985, 10, 249–272. [Google Scholar]
- Adams, F.G.; Miovic, P. On relative fuel efficiency and the output elasticity of energy consumption in western Europe. J. Ind. Econ. 1968, 17, 41–56. [Google Scholar] [CrossRef]
- Abakah, E.M. Real incomes and the consumption of woodfuels in Ghana: An analysis of recent trends. Energy Econ. 1990, 12, 227–231. [Google Scholar] [CrossRef]
- Shafik, N.; Bandyopadhyay, S. Economic Growth and Environmental Quality: Time-Series and Cross-Country Evidence; World Bank Publications: Washington, DC, USA, 1992; Volume 904. [Google Scholar]
- Hawdon, D.; Pearson, P. Input-output simulations of energy, environment, economy interactions in the UK. Energy Econ. 1995, 17, 73–86. [Google Scholar] [CrossRef]
- Masih, A.M.; Masih, R. Energy consumption, real income and temporal causality: Results from a multi-country study based on cointegration and error-correction modelling techniques. Energy Econ. 1996, 18, 165–183. [Google Scholar] [CrossRef]
- Cheng, B.S.; Lai, T.W. An investigation of co-integration and causality between energy consumption and economic activity in Taiwan. Energy Econ. 1997, 19, 435–444. [Google Scholar] [CrossRef]
- Naqvi, F. A computable general equilibrium model of energy, economy and equity interactions in Pakistan. Energy Econ. 1998, 20, 347–373. [Google Scholar] [CrossRef]
- Apergis, N.; Payne, J.E. Energy consumption and economic growth: Evidence from the Commonwealth of Independent States. Energy Econ. 2009, 31, 641–647. [Google Scholar] [CrossRef]
- Ozturk, I.; Aslan, A.; Kalyoncu, H. Energy consumption and economic growth relationship: Evidence from panel data for low and middle income countries. Energy Policy 2010, 38, 4422–4428. [Google Scholar] [CrossRef]
- Ouedraogo, N.S. Energy consumption and economic growth: Evidence from the economic community of West African States (ECOWAS). Energy Econ. 2013, 36, 637–647. [Google Scholar] [CrossRef]
- Aslan, A.; Apergis, N.; Yildirim, S. Causality between energy consumption and GDP in the US: Evidence from wavelet analysis. Front. Energy 2014, 8, 1–8. [Google Scholar] [CrossRef]
- Huang, B.N.; Hwang, M.J.; Yang, C.W. Causal relationship between energy consumption and GDP growth revisited: A dynamic panel data approach. Ecol. Econ. 2008, 67, 41–54. [Google Scholar] [CrossRef]
- Narayan, P.K.; Narayan, S.; Popp, S. A note on the long-run elasticities from the energy consumption–GDP relationship. Appl. Energy 2010, 87, 1054–1057. [Google Scholar] [CrossRef]
- Kasman, A.; Duman, Y.S. CO2 emissions, economic growth, energy consumption, trade and urbanization in new EU member and candidate countries: A panel data analysis. Econ. Model. 2015, 44, 97–103. [Google Scholar] [CrossRef]
- Costantini, V.; Martini, C. The causality between energy consumption and economic growth: A multi-sectoral analysis using non-stationary cointegrated panel data. Energy Econ. 2010, 32, 591–603. [Google Scholar] [CrossRef]
- Belke, A.; Dobnik, F.; Dreger, C. Energy consumption and economic growth: New insights into the cointegration relationship. Energy Econ. 2011, 33, 782–789. [Google Scholar] [CrossRef]
- Coers, R.; Sanders, M. The energy–GDP nexus; addressing an old question with new methods. Energy Econ. 2013, 36, 708–715. [Google Scholar] [CrossRef]
- Wolde-Rufael, Y. Energy consumption and economic growth: The experience of African countries revisited. Energy Econ. 2009, 31, 217–224. [Google Scholar] [CrossRef]
- Kahsai, M.S.; Nondo, C.; Schaeffer, P.V.; Gebremedhin, T.G. Income level and the energy consumption–GDP nexus: Evidence from Sub-Saharan Africa. Energy Econ. 2012, 34, 739–746. [Google Scholar] [CrossRef]
- Śmiech, S.; Papież, M. Energy consumption and economic growth in the light of meeting the targets of energy policy in the EU: The bootstrap panel Granger causality approach. Energy Policy 2014, 71, 118–129. [Google Scholar] [CrossRef]
- Dogan, E.; Sebri, M.; Turkekul, B. Exploring the relationship between agricultural electricity consumption and output: New evidence from Turkish regional data. Energy Policy 2016, 95, 370–377. [Google Scholar] [CrossRef]
- Raeeni, A.A.G.; Hosseini, S.; Moghaddasi, R. How energy consumption is related to agricultural growth and export: An econometric analysis on Iranian data. Energy Rep. 2019, 5, 50–53. [Google Scholar] [CrossRef]
- Altinay, G.; Karagol, E. Electricity consumption and economic growth: Evidence from Turkey. Energy Econ. 2005, 27, 849–856. [Google Scholar] [CrossRef]
- Lee, C.C.; Chang, C.P. Energy consumption and economic growth in Asian economies: A more comprehensive analysis using panel data. Resour. Energy Econ. 2008, 30, 50–65. [Google Scholar] [CrossRef]
- Adebola, S.S. Electricity consumption and economic growth: Trivariate investigation in Botswana with capital formation. Int. J. Energy Econ. Policy 2011, 1, 32–46. [Google Scholar]
- Apergis, N.; Payne, J.E. Energy consumption and growth in South America: Evidence from a panel error correction model. Energy Econ. 2010, 32, 1421–1426. [Google Scholar] [CrossRef]
- Apergis, N.; Payne, J.E. Renewable and non-renewable energy consumption-growth nexus: Evidence from a panel error correction model. Energy Econ. 2012, 34, 733–738. [Google Scholar] [CrossRef]
- Chen, X.; Shuai, C.; Zhang, Y.; Wu, Y. Decomposition of energy consumption and its decoupling with economic growth in the global agricultural industry. Environ. Impact Assess. Rev. 2020, 81, 106364. [Google Scholar] [CrossRef]
- Eberhardt, M.; Vollrath, D. The effect of agricultural technology on the speed of development. World Dev. 2018, 109, 483–496. [Google Scholar] [CrossRef]
- Marinoudi, V.; Sørensen, C.G.; Pearson, S.; Bochtis, D. Robotics and labour in agriculture. A context consideration. Biosyst. Eng. 2019, 184, 111–121. [Google Scholar] [CrossRef]
- Rokicki, T.; Perkowska, A.; Klepacki, B.; Szczepaniuk, H.; Szczepaniuk, E.K.; Bereziński, S.; Ziółkowska, P. The Importance of Higher Education in the EU Countries in Achieving the Objectives of the Circular Economy in the Energy Sector. Energies 2020, 13, 4407. [Google Scholar] [CrossRef]
- Fuglie, K.O. Is agricultural productivity slowing? Glob. Food Secur. 2018, 17, 73–83. [Google Scholar] [CrossRef]
- Alene, A.D.; Manyong, V.M. The effects of education on agricultural productivity under traditional and improved technology in northern Nigeria: An endogenous switching regression analysis. Empir. Econ. 2007, 32, 141–159. [Google Scholar] [CrossRef]
- Wang, S.L.; Schimmelpfennig, D.; Fuglie, K.O. Is agricultural productivity growth slowing in Western Europe. In Productivity Growth in Agriculture: An International Perspective; CABI: Oxfordshire, UK, 2012; pp. 109–125. [Google Scholar]
- Baráth, L.; Fertő, I. Productivity and convergence in European agriculture. J. Agric. Econ. 2017, 68, 228–248. [Google Scholar] [CrossRef]
- Kijek, A.; Kijek, T.; Nowak, A.; Skrzypek, A. Productivity and its convergence in agriculture in new and old European Union member states. Agric. Econ. 2019, 65, 1–9. [Google Scholar] [CrossRef]
- Wu, Y. Energy intensity and its determinants in China’s regional economies. Energy Policy 2012, 41, 703–711. [Google Scholar] [CrossRef]
- Saudi, M.H.M.; Sinaga, O.; Roespinoedji, D.; Jabarullah, N.H. Industrial, Commercial, and Agricultural Energy Consumption and Economic Growth Leading to Environmental Degradation. Ekoloji 2019, 28, 299–310. [Google Scholar]
- Zhang, L.; Pang, J.; Chen, X.; Lu, Z. Carbon emissions, energy consumption and economic growth: Evidence from the agricultural sector of China’s main grain-producing areas. Sci. Total Environ. 2019, 665, 1017–1025. [Google Scholar] [CrossRef]
- Gokmenoglu, K.K.; Taspinar, N.; Kaakeh, M. Agriculture-induced environmental Kuznets curve: The case of China. Environ. Sci. Pollut. Res. 2019, 26, 37137–37151. [Google Scholar] [CrossRef] [PubMed]
- Nwaka, I.D.; Nwogu, M.U.; Uma, K.E.; Ike, G.N. Agricultural production and CO2 emissions from two sources in the ECOWAS region: New insights from quantile regression and decomposition analysis. Sci. Total Environ. 2020, 748, 141329. [Google Scholar] [CrossRef] [PubMed]
- Khan, R. Agricultural production and CO2 emissions causes in the developing and developed countries: New insights from quantile regression and decomposition analysis. bioRxiv 2020. [Google Scholar] [CrossRef]
- Wang, C.; Zhang, L.; Zhou, P.; Chang, Y.; Zhou, D.; Pang, M.; Yin, H. Assessing the environmental externalities for biomass-and coal-fired electricity generation in China: A supply chain perspective. J. Environ. Manag. 2019, 246, 758–767. [Google Scholar] [CrossRef] [PubMed]
- Burney, J.A.; Davis, S.J.; Lobell, D.B. Greenhouse gas mitigation by agricultural intensification. Proc. Natl. Acad. Sci. USA 2010, 107, 12052–12057. [Google Scholar] [CrossRef] [PubMed]
- Lin, B.; Xu, B. Factors affecting CO2 emissions in China’s agriculture sector: A quantile regression. Renew. Sustain. Energy Rev. 2018, 94, 15–27. [Google Scholar] [CrossRef]


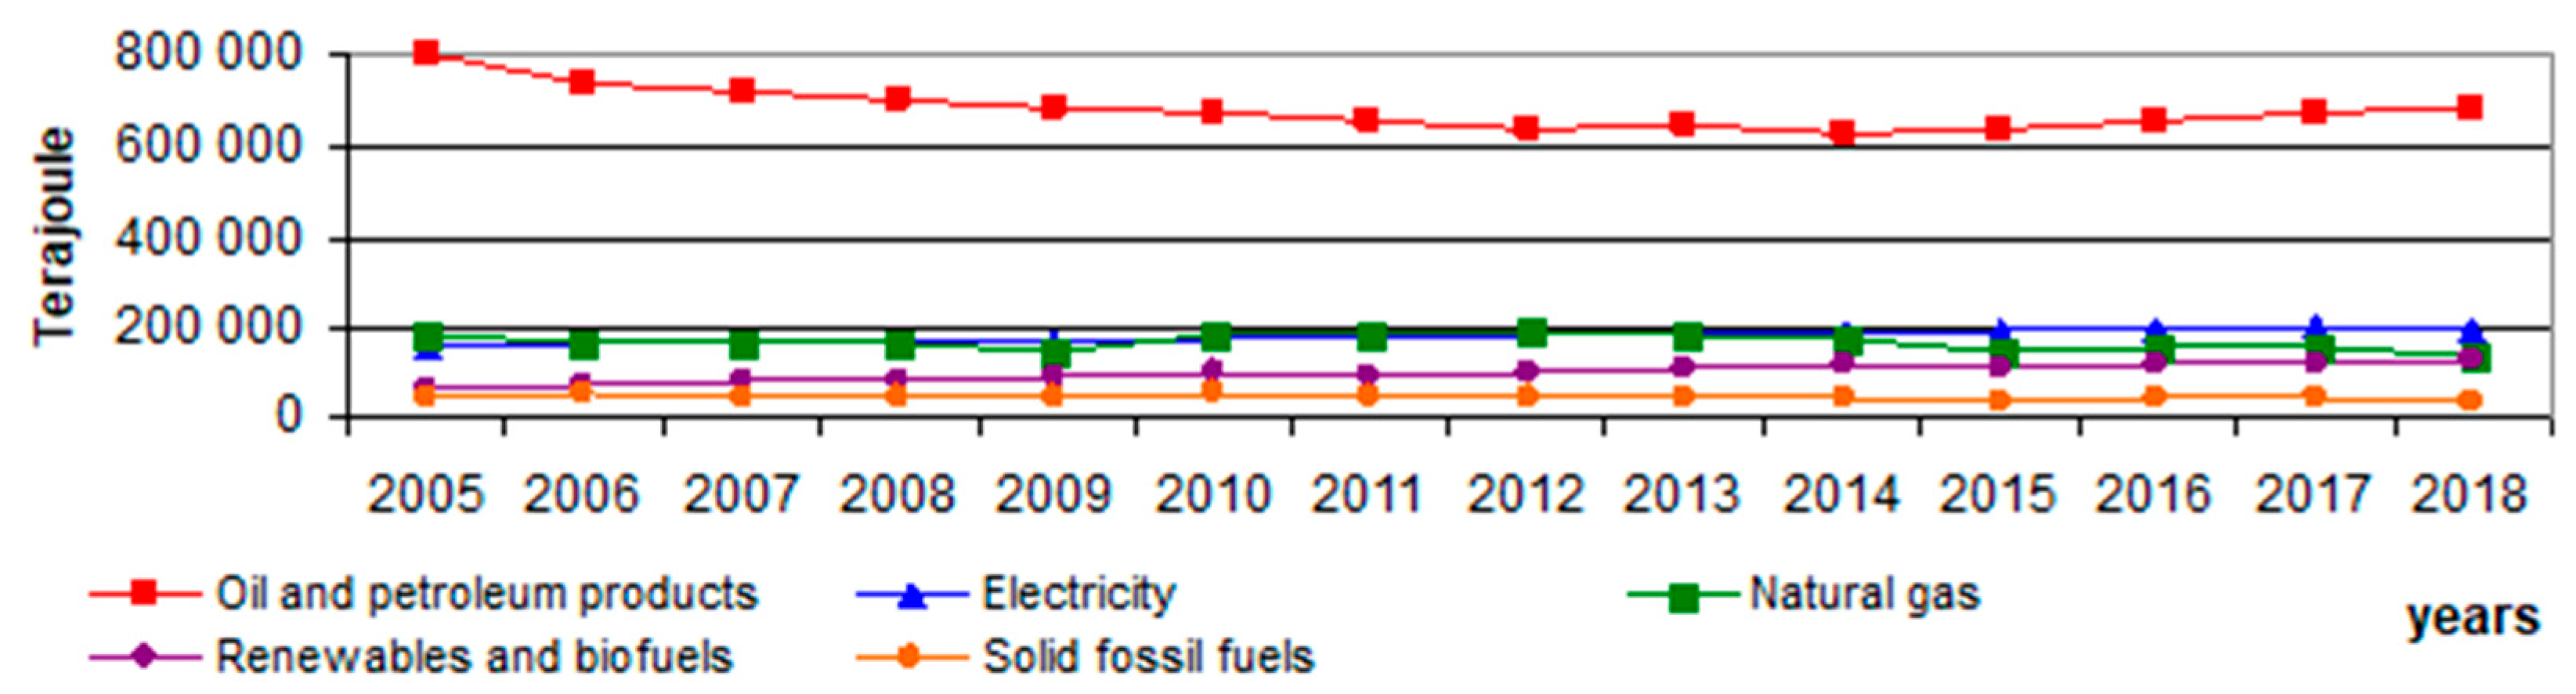
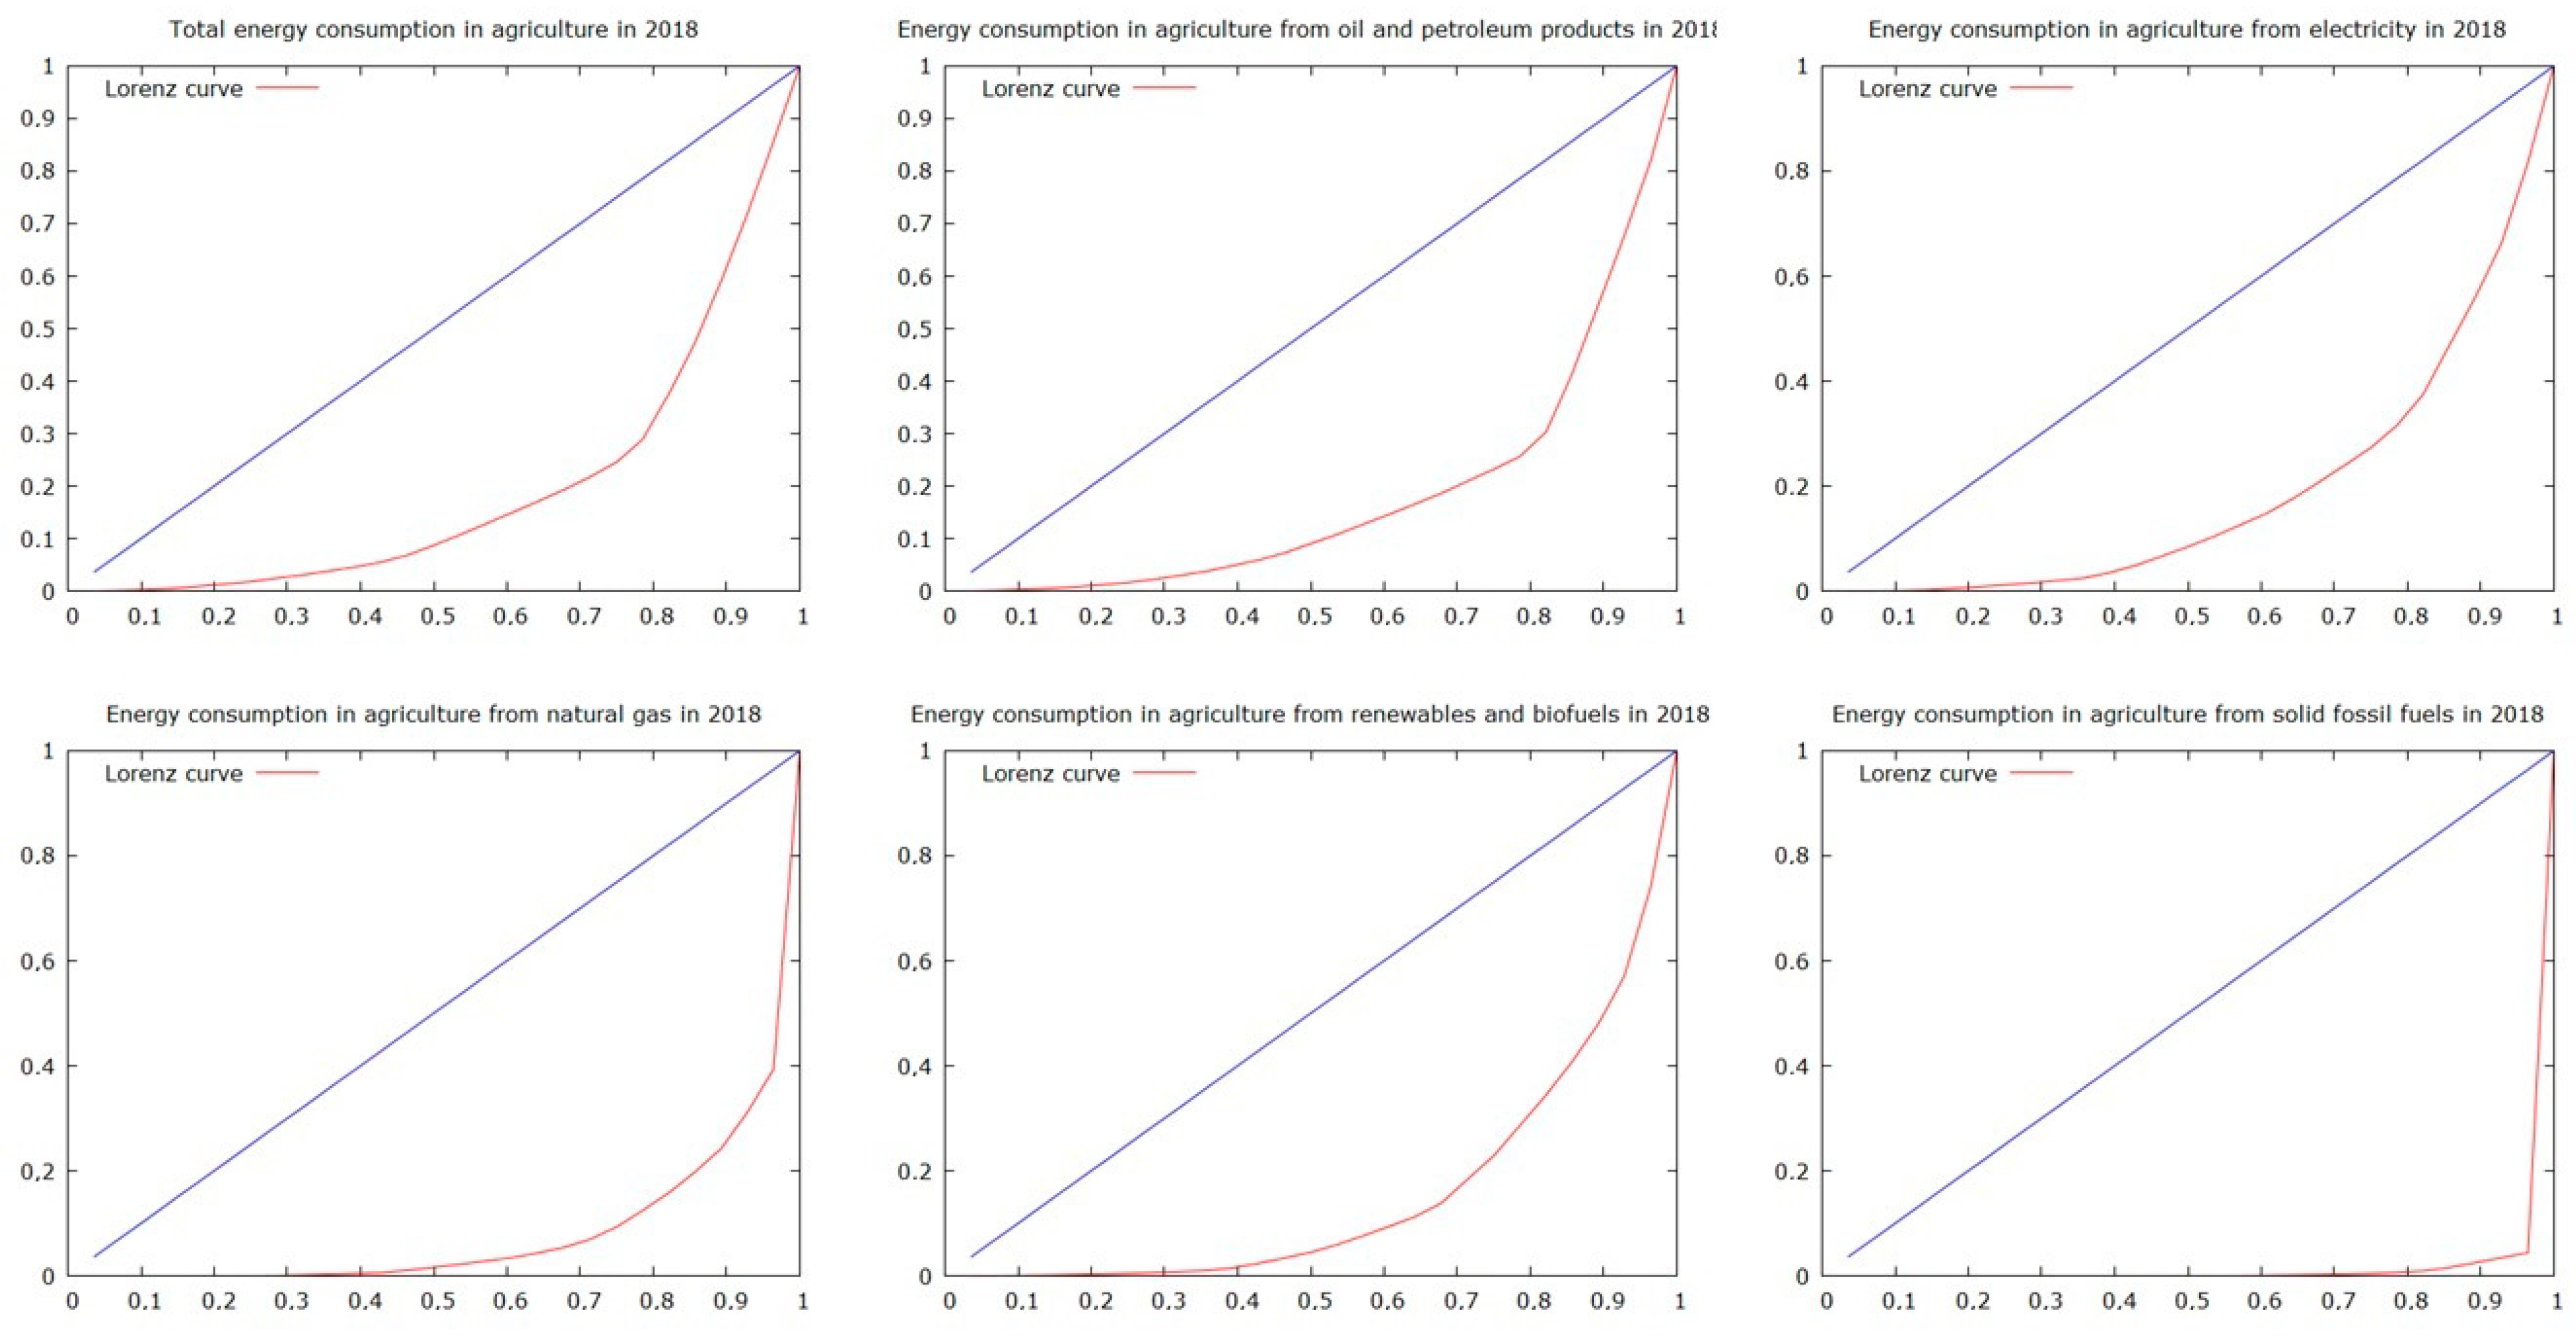
| Type of Energy Source | Estimated Gini Coefficients in Years | ||||
|---|---|---|---|---|---|
| 2005 | 2008 | 2011 | 2014 | 2018 | |
| Total | 0.63 | 0.62 | 0.63 | 0.64 | 0.64 |
| Oil and petroleum products | 0.65 | 0.65 | 0.65 | 0.66 | 0.66 |
| Electricity | 0.66 | 0.64 | 0.64 | 0.64 | 0.64 |
| Natural gas | 0.88 | 0.86 | 0.84 | 0.85 | 0.87 |
| Renewables and biofuels | 0.79 | 0.76 | 0.73 | 0.71 | 0.71 |
| Solid fossil fuels | 0.97 | 0.98 | 0.99 | 0.99 | 0.99 |
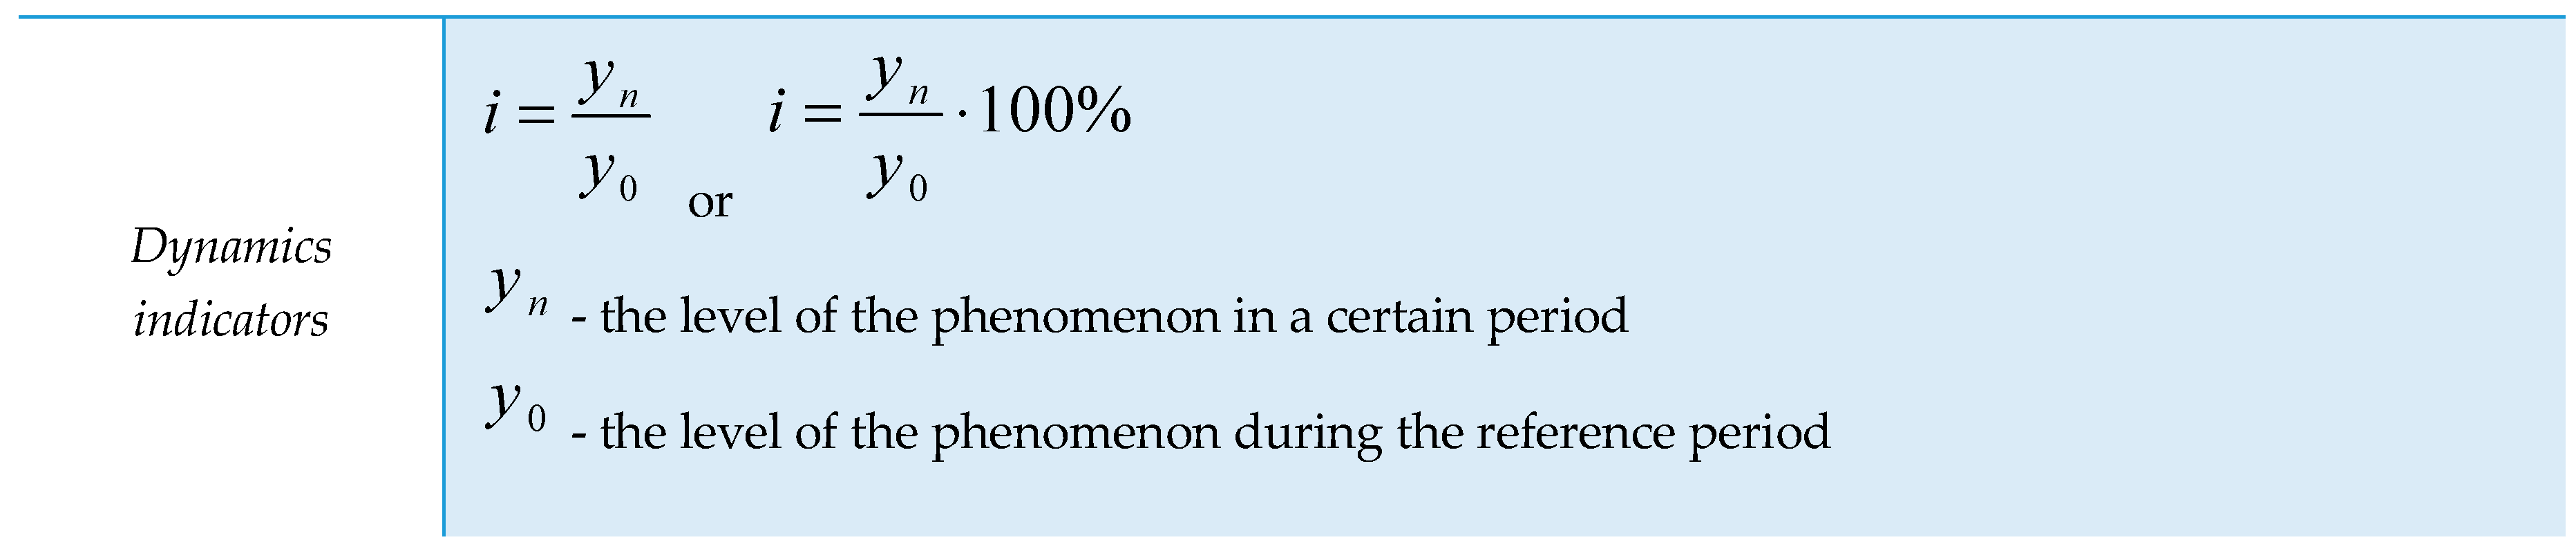
| Countries | Dynamics Indicators for Types of Energy Used in Agriculture in 2005–2018 | ||||||
|---|---|---|---|---|---|---|---|
| Total | Solid Fossil Fuels | Natural Gas | Oil and Petroleum Products | Renewables and Biofuels | Electricity | Heat | |
| Romania | 263.40 | 49.82 | 310.99 | 309.87 | 198.55 | 227.27 | 17.81 |
| Latvia | 142.99 | 0.18 | 36.10 | 154.89 | 211.59 | 119.67 | 308.26 |
| Germany | 134.80 | - | - | 93.83 | 417.30 | - | - |
| United Kingdom | 134.02 | - | 45.92 | 222.34 | 195.02 | 80.95 | - |
| Estonia | 118.96 | 81.01 | 66.65 | 137.33 | 103.81 | 76.19 | 70.83 |
| Hungary | 114.34 | 21.00 | 48.82 | 169.60 | 225.12 | 104.86 | 150.00 |
| Czechia | 113.28 | 31.94 | 77.47 | 98.75 | 745.13 | 94.59 | 55.19 |
| Cyprus | 111.99 | - | - | 86.26 | - | 147.13 | - |
| Luxembourg | 105.71 | - | 724.74 | 96.46 | 160.71 | 102.11 | - |
| Lithuania | 103.22 | 199.15 | 73.49 | 111.29 | 237.97 | 110.90 | 41.34 |
| Austria | 100.48 | 19.45 | 118.48 | 80.52 | 121.42 | 125.12 | 159.74 |
| Croatia | 99.48 | - | 102.55 | 94.28 | - | 94.48 | - |
| Slovenia | 97.30 | - | - | 93.75 | - | - | - |
| Belgium | 97.17 | 52.00 | 1 533.80 | 41.68 | 2 807.09 | 457.57 | - |
| France | 97.13 | - | 80.41 | 91.87 | 198.37 | 114.04 | - |
| Finland | 96.13 | 64.38 | 7.33 | 74.88 | 137.67 | 120.26 | 123.86 |
| Malta | 94.48 | - | - | 74.33 | - | - | - |
| EU | 94.13 | 90.60 | 77.36 | 96.38 | 185.30 | 124.82 | 66.81 |
| Netherlands | 94.00 | - | 74.67 | 94.45 | 4 093.37 | 172.32 | 39.90 |
| Italy | 93.00 | - | 81.03 | 90.24 | 202.12 | 103.69 | 879.48 |
| Poland | 88.29 | 97.71 | 116.89 | 79.82 | 110.60 | 123.50 | 97.21 |
| Denmark | 87.06 | 21.94 | 68.03 | 93.63 | 108.34 | 91.36 | 79.55 |
| Slovakia | 80.24 | 15.49 | 48.01 | 73.72 | 1 280.81 | 61.22 | 20.67 |
| Spain | 78.84 | - | 39.84 | 79.44 | 389.18 | 94.71 | - |
| Portugal | 73.24 | - | 101.96 | 65.91 | - | 107.53 | 0.00 |
| Ireland | 66.57 | - | - | 62.59 | - | 86.74 | - |
| Sweden | 62.25 | - | 26.89 | 58.02 | 63.75 | 78.08 | 100.00 |
| Bulgaria | 60.95 | 191.79 | 53.87 | 50.25 | 92.53 | 137.82 | 2 816.45 |
| Greece | 22.92 | 24.01 | - | 4.16 | 186.10 | 77.22 | - |
| Countries | Coefficients of Variation in the Volume of Energy Used in Agriculture by Types | ||||||
|---|---|---|---|---|---|---|---|
| Total | Solid Fossil Fuels | Natural Gas | Oil and Petroleum Products | Renewables and Biofuels | Electricity | Heat | |
| France | 0.02 | - | 0.12 | 0.03 | 0.21 | 0.08 | - |
| Austria | 0.02 | 0.72 | 0.20 | 0.06 | 0.10 | 0.07 | 0.20 |
| EU | 0.02 | 0.08 | 0.09 | 0.09 | 0.19 | 0.07 | 0.13 |
| Finland | 0.03 | 0.27 | 0.85 | 0.07 | 0.13 | 0.07 | 0.08 |
| Croatia | 0.03 | - | 0.12 | 0.06 | - | 0.05 | - |
| Slovenia | 0.04 | - | - | 0.05 | - | - | - |
| Lithuania | 0.04 | 0.56 | 0.22 | 0.07 | 0.22 | 0.07 | 0.33 |
| Netherlands | 0.04 | - | 0.09 | 0.04 | 0.68 | 0.17 | 0.34 |
| Italy | 0.05 | - | 0.09 | 0.06 | 0.42 | 0.03 | 0.72 |
| Denmark | 0.06 | 0.41 | 0.14 | 0.07 | 0.03 | 0.04 | 0.11 |
| Slovakia | 0.07 | 0.57 | 0.20 | 0.08 | 0.90 | 0.15 | 0.69 |
| Cyprus | 0.07 | - | - | 0.12 | - | 0.11 | - |
| Poland | 0.07 | 0.08 | 0.16 | 0.15 | 0.07 | 0.06 | 0.09 |
| Czechia | 0.08 | 0.34 | 0.11 | 0.01 | 0.66 | 0.10 | 0.27 |
| Belgium | 0.08 | 0.56 | 0.31 | 0.29 | 0.49 | 0.34 | - |
| Luxembourg | 0.08 | - | 1.55 | 0.10 | 0.23 | 0.13 | - |
| Spain | 0.10 | - | 0.67 | 0.12 | 0.37 | 0.14 | - |
| Latvia | 0.12 | 0.75 | 0.29 | 0.12 | 0.38 | 0.12 | 0.49 |
| Hungary | 0.13 | 0.99 | 0.25 | 0.21 | 0.34 | 0.10 | 0.36 |
| Estonia | 0.13 | 1.79 | 0.20 | 0.19 | 0.40 | 0.09 | 0.21 |
| Portugal | 0.14 | - | 0.18 | 0.17 | - | 0.09 | 0.80 |
| Germany | 0.15 | - | - | 0.02 | 0.36 | - | - |
| Ireland | 0.16 | - | - | 0.19 | - | 0.04 | - |
| Sweden | 0.18 | - | 0.45 | 0.14 | 0.27 | 0.24 | 0.00 |
| United Kingdom | 0.19 | - | 0.30 | 0.51 | 0.59 | 0.14 | - |
| Bulgaria | 0.20 | 0.26 | 0.29 | 0.30 | 0.69 | 0.12 | 0.77 |
| Romania | 0.25 | 2.20 | 0.39 | 0.30 | 1.01 | 0.25 | 0.36 |
| Malta | 0.26 | - | - | 0.36 | - | - | - |
| Greece | 0.60 | 1.38 | - | 0.98 | 0.23 | 0.10 | - |
| Tested Parameters | Kendall’s Tau Correlation Coefficient | |||||
|---|---|---|---|---|---|---|
| Total Energy | Oil and Petroleum Products | Renewables and Biofuels | ||||
| τ | p-Value | τ | p-Value | τ | p-Value | |
| Correlation coefficients between energy consumption and | ||||||
| Value of GDP | 0.978 | 0.001 | −0.341 | 0.080 | 0.868 | 0.001 |
| Final consumption expenditure of households | 0.978 | 0.001 | −0.341 | 0.080 | 0.868 | 0.001 |
| Export of goods and services | 0.978 | 0.001 | −0.341 | 0.080 | 0.868 | 0.001 |
| Import of good and services | 0.978 | 0.001 | −0.341 | 0.080 | 0.824 | 0.001 |
| GDP per capita | 0.999 | 0.001 | −0.319 | 0.100 | 0.846 | 0.001 |
| Final consumption expenditure of households per capita | 0.999 | 0.001 | −0.319 | 0.100 | 0.846 | 0.001 |
| Gross value added of agriculture, forestry, and fishing | 0.934 | 0.001 | −0.341 | 0.080 | 0.780 | 0.001 |
| Area of agricultural crops | −0.495 | 0.012 | 0.692 | 0.001 | −0.604 | 0.002 |
| Area of grain sowing | −0.538 | 0.006 | 0.077 | 0.743 | −0.516 | 0.009 |
| Cows’ milk production | 0.495 | 0.016 | −0.165 | 0.381 | 0.560 | 0.006 |
| Tested Parameters | Spearman’s Rank Correlation Coefficient | |||||
|---|---|---|---|---|---|---|
| Total Energy | Oil and Petroleum Products | Renewables and Biofuels | ||||
| τ | p-Value | τ | p-Value | τ | p-Value | |
| Correlation coefficients between energy consumption and | ||||||
| Value of GDP | 0.996 | 0.010 | −0.442 | 0.100 | 0.947 | 0.010 |
| Final consumption expenditure of households | 0.996 | 0.010 | −0.442 | 0.100 | 0.947 | 0.010 |
| Export of goods and services | 0.996 | 0.010 | −0.442 | 0.100 | 0.952 | 0.010 |
| Import of good and services | 0.996 | 0.010 | −0.437 | 0.100 | 0.930 | 0.010 |
| GDP per capita | 0.999 | 0.010 | −0.429 | 0.100 | 0.934 | 0.010 |
| Final consumption expenditure of households per capita | 0.999 | 0.010 | −0.429 | 0.100 | 0.934 | 0.010 |
| Gross value added of agriculture, forestry, and fishing | 0.982 | 0.010 | −0.442 | 0.100 | 0.903 | 0.010 |
| Area of agricultural crops | −0.723 | 0.010 | 0.824 | 0.010 | −0.780 | 0.010 |
| Area of grain sowing | −0.692 | 0.010 | 0.169 | 0.100 | −0.697 | 0.010 |
| Cows’ milk production | 0.618 | 0.050 | −0.178 | 0.100 | 0.675 | 0.010 |
Publisher’s Note: MDPI stays neutral with regard to jurisdictional claims in published maps and institutional affiliations. |
© 2021 by the authors. Licensee MDPI, Basel, Switzerland. This article is an open access article distributed under the terms and conditions of the Creative Commons Attribution (CC BY) license (http://creativecommons.org/licenses/by/4.0/).
Share and Cite
Rokicki, T.; Perkowska, A.; Klepacki, B.; Bórawski, P.; Bełdycka-Bórawska, A.; Michalski, K. Changes in Energy Consumption in Agriculture in the EU Countries. Energies 2021, 14, 1570. https://doi.org/10.3390/en14061570
Rokicki T, Perkowska A, Klepacki B, Bórawski P, Bełdycka-Bórawska A, Michalski K. Changes in Energy Consumption in Agriculture in the EU Countries. Energies. 2021; 14(6):1570. https://doi.org/10.3390/en14061570
Chicago/Turabian StyleRokicki, Tomasz, Aleksandra Perkowska, Bogdan Klepacki, Piotr Bórawski, Aneta Bełdycka-Bórawska, and Konrad Michalski. 2021. "Changes in Energy Consumption in Agriculture in the EU Countries" Energies 14, no. 6: 1570. https://doi.org/10.3390/en14061570
APA StyleRokicki, T., Perkowska, A., Klepacki, B., Bórawski, P., Bełdycka-Bórawska, A., & Michalski, K. (2021). Changes in Energy Consumption in Agriculture in the EU Countries. Energies, 14(6), 1570. https://doi.org/10.3390/en14061570