Article

Empirical Analysis of High Voltage Battery Pack Cells for Electric Racing Vehicles †

1
Department of Electronic & Computer Engineering, CEDPS, Brunel University, London UP8 3PH, UK
2
Department of Electrical Engineering, College of Engineering, Taif University, Taif 21944, Saudi Arabia
3
Department of Electrical Engineering, College of Engineering, University of Business and Technology (UBT), Jeddah 23846, Saudi Arabia
*
Author to whom correspondence should be addressed.
This paper is an extended version of our paper published in the 55th of Int. Universities Power Engineering Conference (UPEC), Torino, Italy, 2020, pp. 1–6, doi:10.1109/UPEC49904.2020.9209870.
Energies 2021, 14(6), 1556; https://doi.org/10.3390/en14061556
Submission received: 31 January 2021 / Revised: 1 March 2021 / Accepted: 9 March 2021 / Published: 11 March 2021

Abstract

:
This paper examines the specifications of lithium battery cells, which are considered one of the most vital sources for electrical energy storage units. The specifications have been covered to associate battery performance with its usage for electrically powered motor vehicles. With the motivation of rapid deployment of electric vehicles (EVs) around the world, the key contribution of this study is to provide a comparative investigation of well-known commercially available Li-ion battery cells used as a pack for electric race car. Five lithium cells from different manufacturers were analyzed for start voltage, end voltage, current, and the use of active cooling under different test conditions. Thermal imaging was used to provide more comprehensive analysis of tested battery packs. The outcomes of this experimental investigation are described in the sections below in the order in which the analyses were conducted. The key findings of this study are presented in the conclusion section.

1. Introduction

In principle, electric vehicles (EVs) use an electric motor for traction and such things as chemical batteries, fuel cells, ultracapacitors, and flywheels for energy sources. The electric vehicle has numerous advantages over conventional internal combustion engine vehicles, such as reduced emissions, higher efficiency, independence from petroleum, and smooth operation [1]. The level of efficiency from tank to wheels is approximately three times greater for electrical vehicles than for internal combustion engine vehicles [2,3]. A visionary argumentation suggests that electric vehicles are the face of the future automobile industry for personal and commercial transportation. To meet the global climate change aggressive targets, there has been a rapid growth of EVs in the last years. Globally, the total number of EV fleet is around 8.5 million in 2020. The majority is for battery electric vehicles. The global sales of EVs jump by 39% in 2020 with 3.1 million vehicles sold.
Electric vehicle batteries require high power inputs, up to a hundred KW, to produce high-energy capacity, and electric vehicles must have low weight and minimum installation space to make an electric vehicle of high quality at an affordable price. Therefore, researcher and automobile companies around the world are putting a high level of effort and investment into modernizing battery technologies that are sustainable for the design of electrical vehicles.
The reliable operation of batteries for EV requires an efficient battery management system [4]. Two main factors decide the battery efficiency and effect its performance significantly which are the operating temperature and the rate at which the battery is charged and discharged. These factors determine the life span of a battery and hence the battery lifespan can be prolonged when operating at the desired temperature. Based on this fact, many research works have been done in proposing cooling techniques to achieve a better battery operation under high temperatures. The main cooling techniques include air cooling [5], liquid cooling [6] and phase change of material [7]. The direct air-cooling technique [8] is considered the simplest compared to other cooling techniques. Heat is basically dissipated from the battery cells through convection into the enclosure.
This research studies the thermal behavior of different EV batteries at different rate of current charging/discharging. A comparative analysis of lithium battery cells used as a pack for an electric race car was performed for different brands from different manufacturers. Primarily, the battery pack’s crucial characteristics are as follows:
  • 400 V DC maximum to match the motor controller’s voltage limit
  • 7 kWh battery capacity
  • 80 kW power output
  • 200 A of maximum discharge current
These characteristics have been selected according to the standard of the tractive system energy storage [9]. The key contribution of this research is to provide an experimental comparative thermal analysis for of Li-ion battery cells used as a pack for electric race car. It investigates five lithium cells from different manufacturers for start voltage, end voltage, current, and the use of active air cooling under different test conditions.
The rest of this paper comes in the following sections. Section 2 explain the battery energy storage system (BESS). Section 3 presents the commercially available EV battery technology. Section 4 demonstrates the results and discussion for the conducted comparative analysis of batteries from different manufacturers. In this section, four basic tests were conducted at different discharging rates. The batteries performance was tested when no active cooling is applied and with the application of active air cooling. Section 5 shows further thermal/experimental investigations on select battery brand. The conclusion and key findings of this research are shared in Section 6.

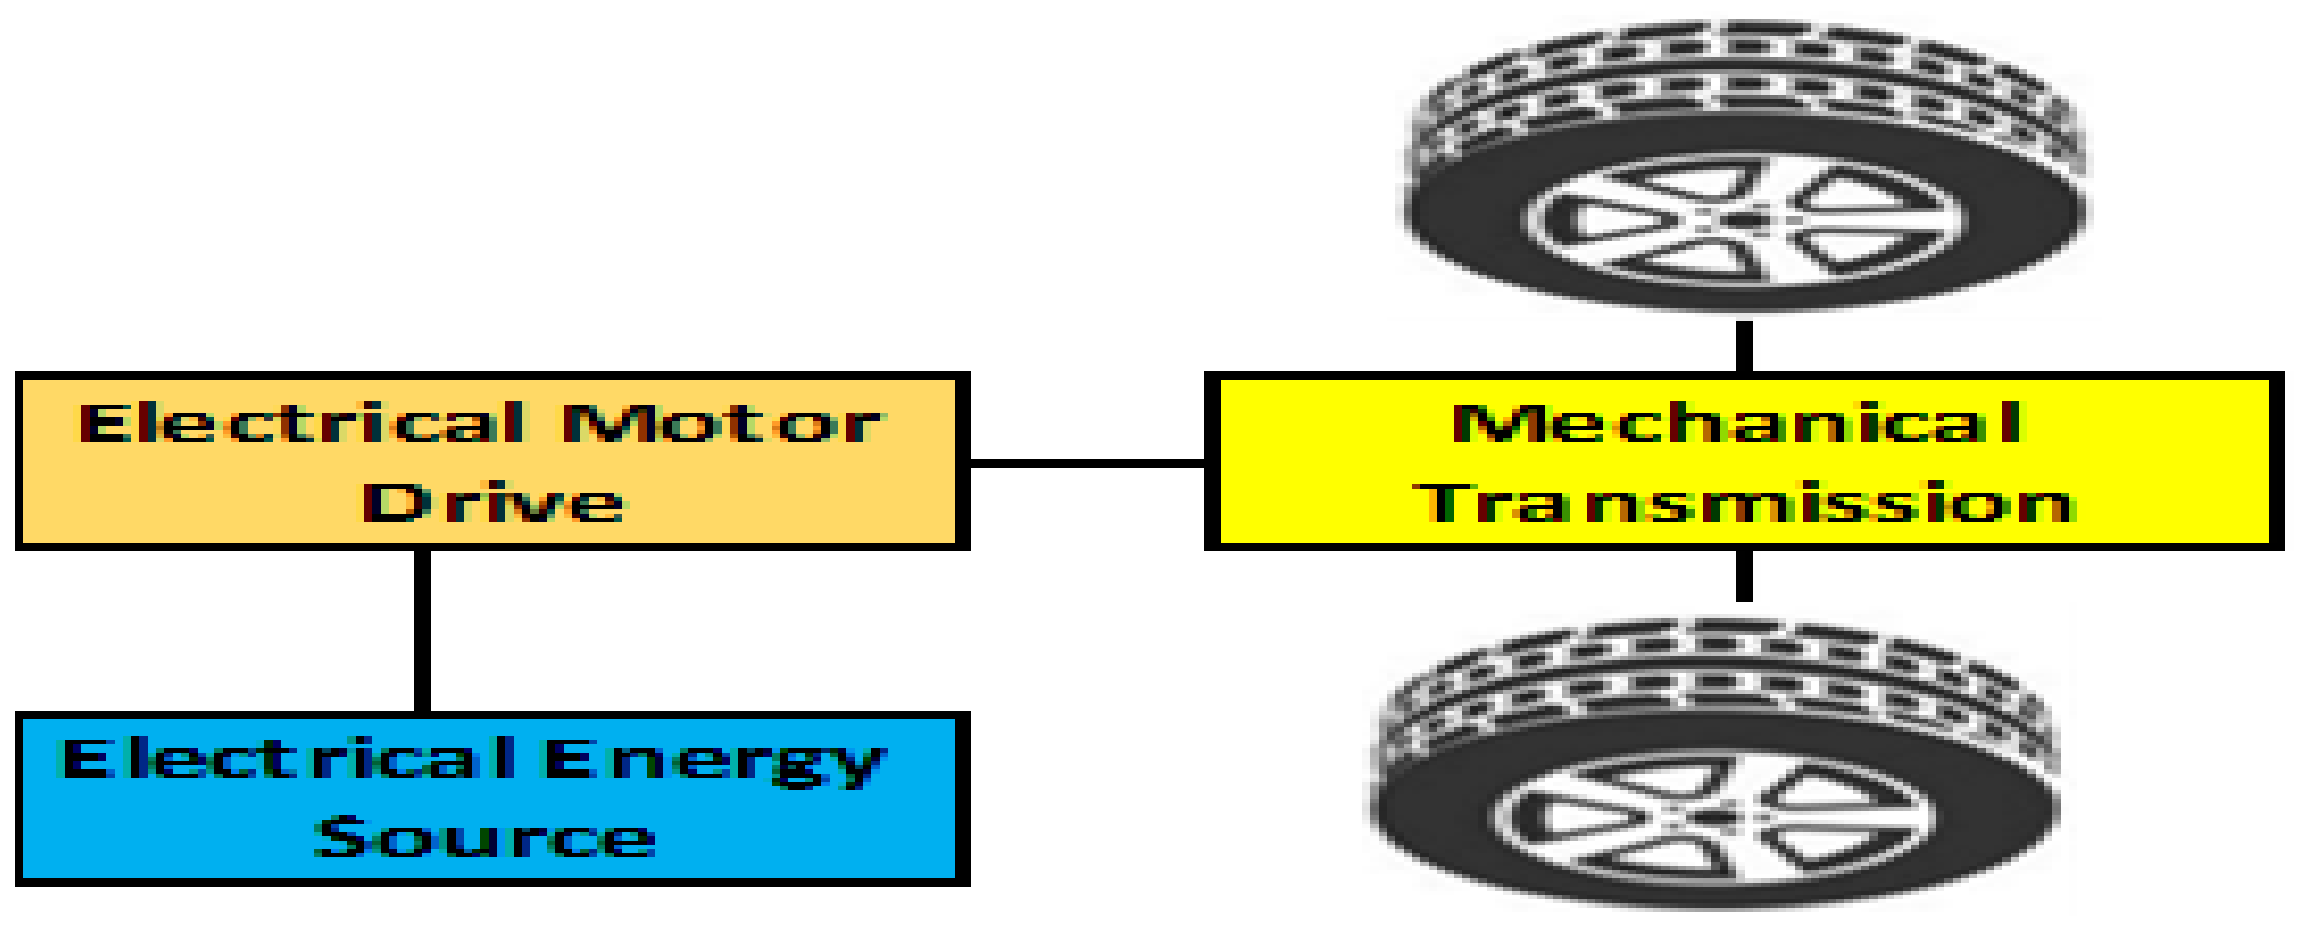
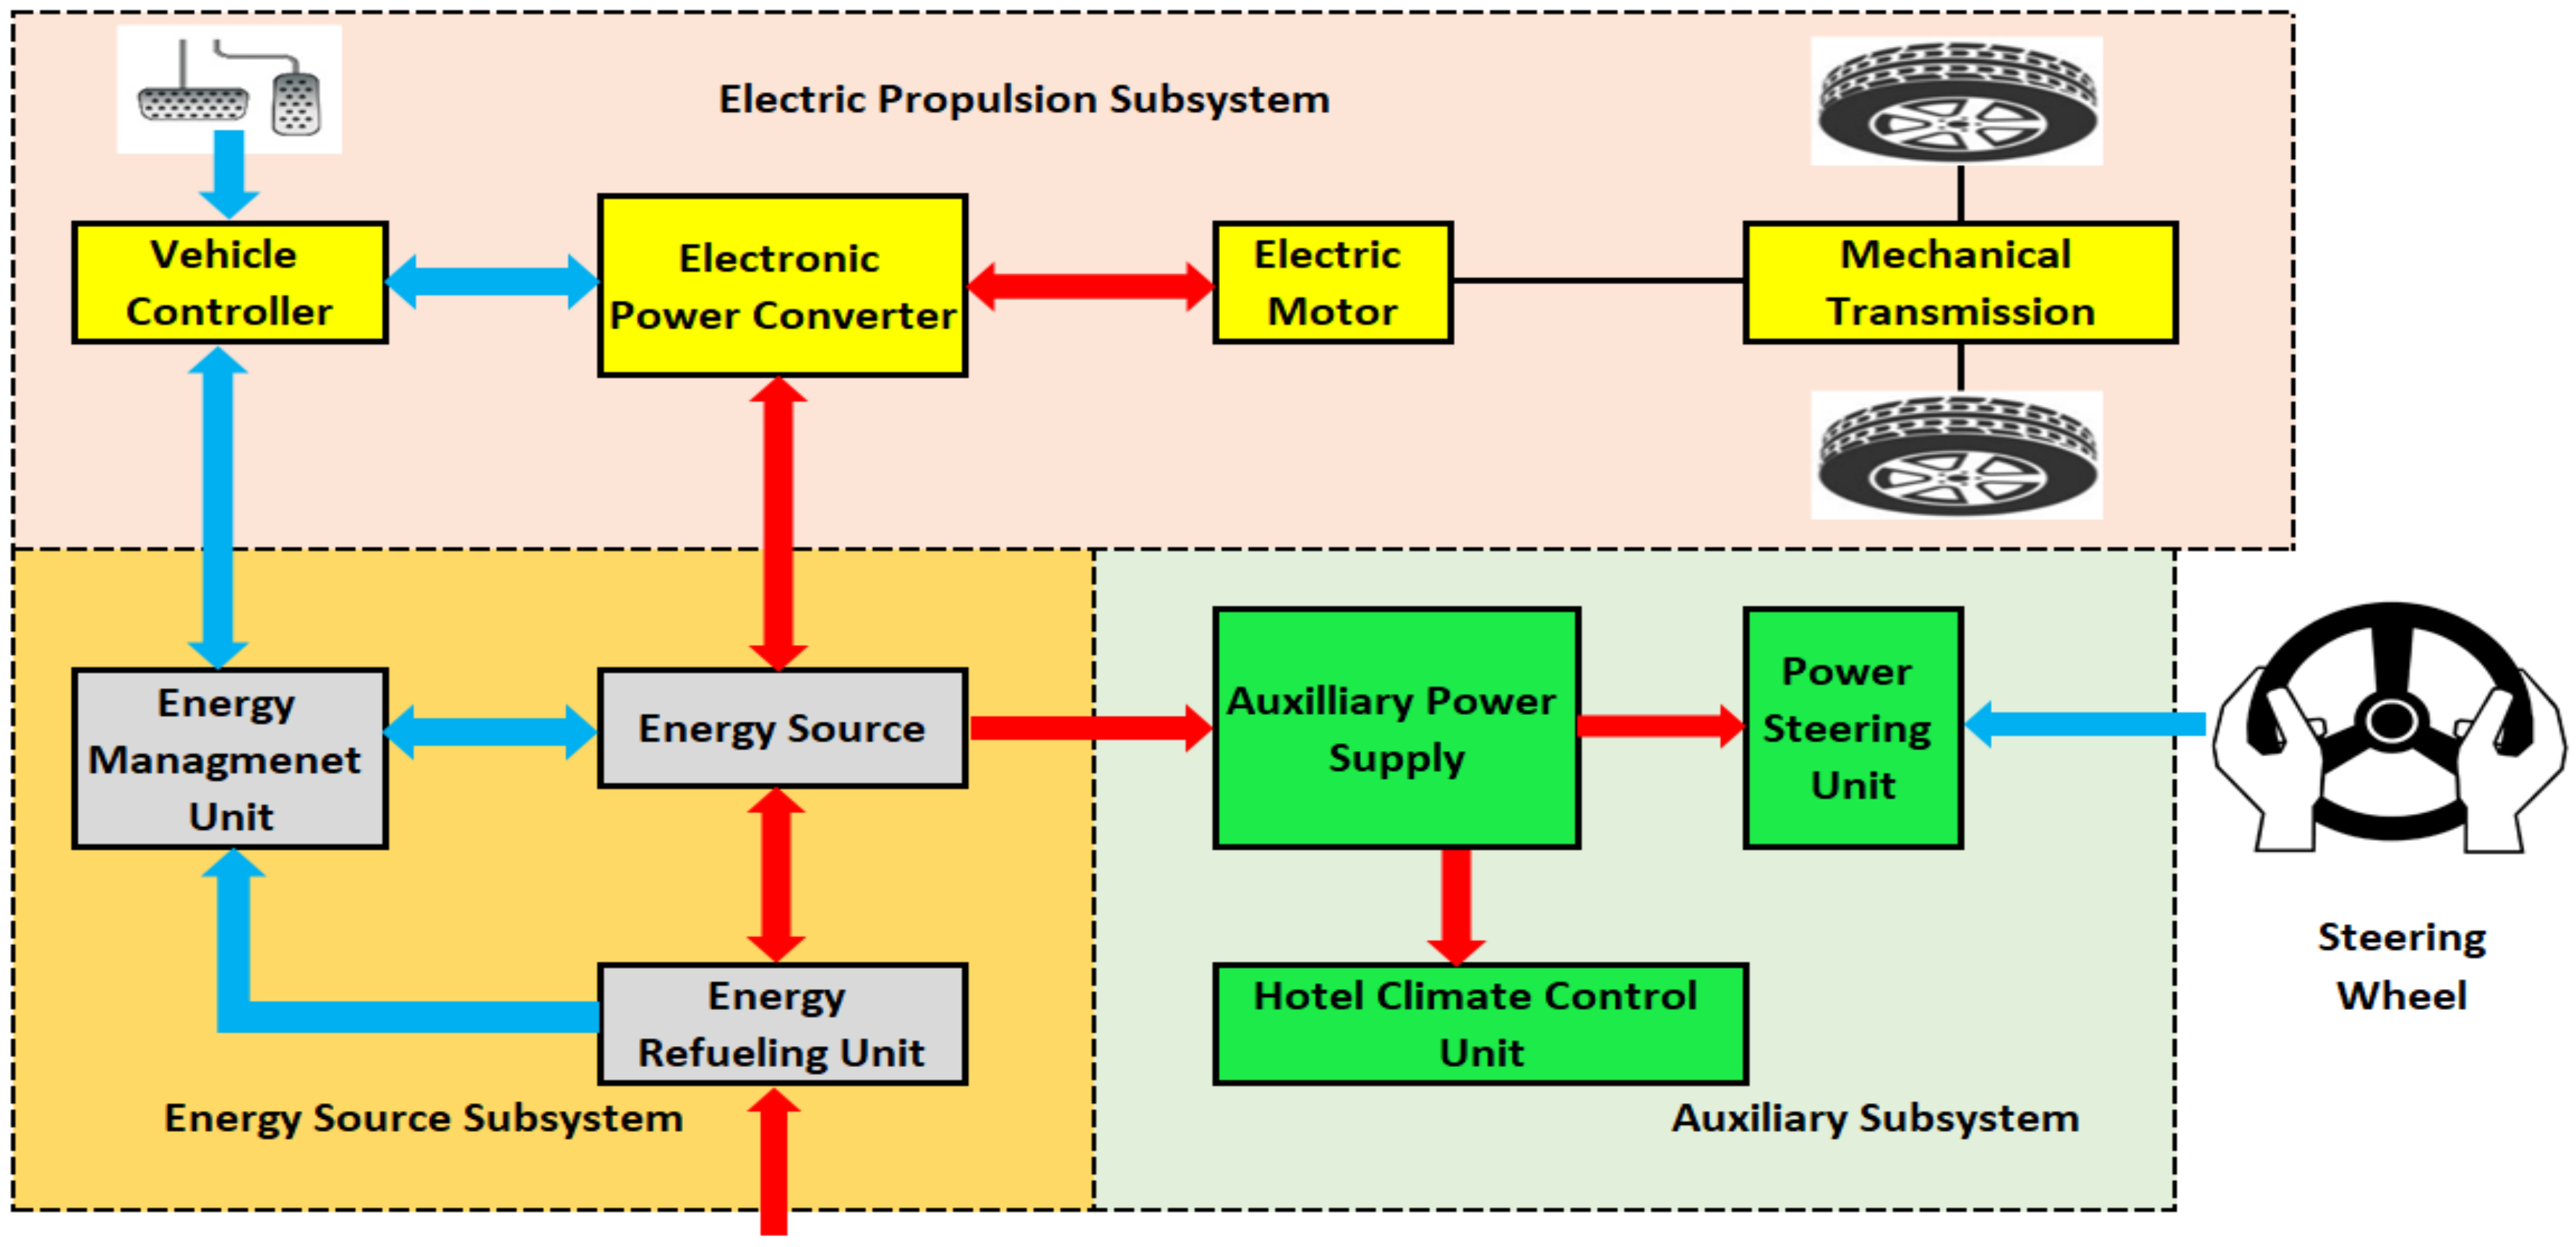
2. Battery Energy Storage System (BESS)

Figure 1 shows the primary configuration of an EV power train. The drive train in the work unit consists of three major subsystems: electric engine propulsion, energy supply, and auxiliary. The electrical propulsion subsystem comprises the vehicle controller, power electronic converter, electric motor, mechanical transmission, and driving wheels. The energy source subsystem comprises the energy source, energy management unit, and energy fueling unit. The auxiliary subsystem comprises the steering unit, climate control unit, and auxiliary power supply unit. A conceptual illustration of the general EV configuration is presented in Figure 2. In this figure, the blue arrows refer to the control links in the EV system, the red arrows indicate the electric links, and the black links indicate the mechanical interconnections.
Batteries are one of the most regularly used technologies for energy storage, and the conversion of electrical energy into portable chemical energy is not possible without batteries. The capacity to charge—that is, to store energy using a chemical process—is achieved through distinctive processes like reduction and oxidation reactions that can create electron transfers from different chemicals. Electrical energy can thus be released from chemical energy during battery discharge [10,11,12]. These reactions take place within storage cells, which are combined into a single mechanical and electrical unit to create a feasible module. A group of modules is connected electrically to form a battery pack that contains a long charge/discharge time and low- and high-power energy density [11,13]. Batteries are composed of one or more electromechanical cells.
Battery cells are of two types, liquid electrolyte and solid electrolyte, both of which contain positive and negative electrodes. When the battery is charged, it causes fundamental chemical reactions in the electromechanical cells that store the energy. When power is required, a reverse chemical reaction causes the battery to supply power. There are different sizes of batteries that range from “less than 100 watts to multiple megawatts”. The round-trip efficiency of batteries is estimated to be in the range of 60% to 80%, depending on the cycle time and the type of electrochemistry applied [14]. Generally, there are five types of batteries used for industrial- and utility-scale energy storage [15,16]: lead acid, nickel cadmium, sodium sulfur, lithium-ion, and sodium nickel chloride. For EVs Li-ion are the most used type nowadays. Next section discusses the commercially available batteries for EVs.

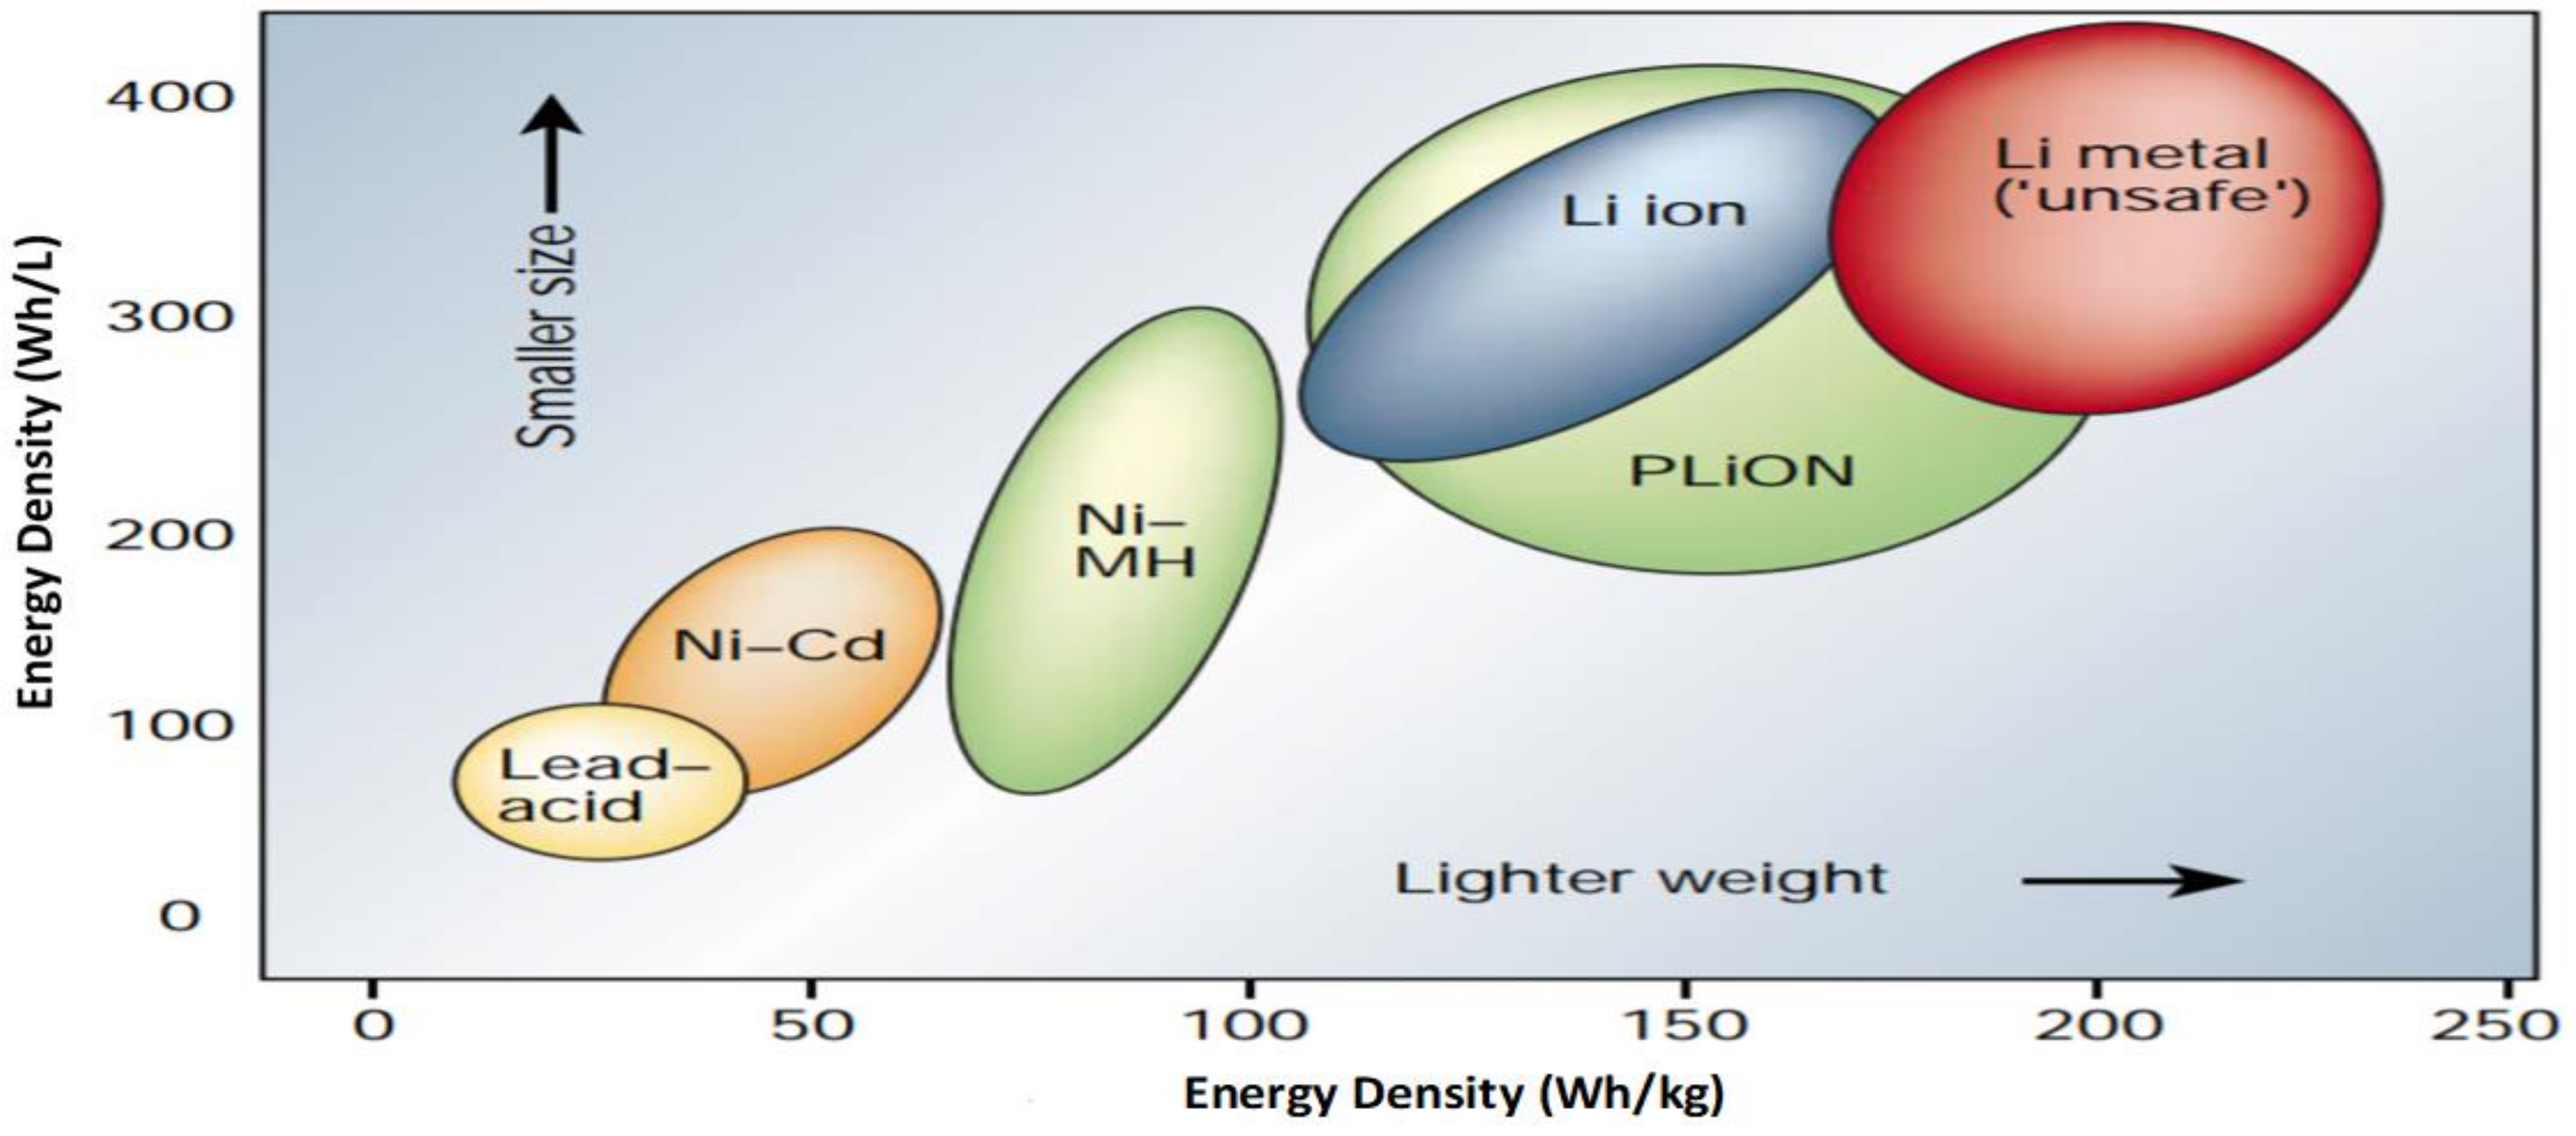
3. Electrical Vehicle Battery Technology

Electric vehicles (EVs) rely on two major battery technologies: nickel metal hydride (NiMH) and lithium ion (Li-ion). Table 1 shows the types of battery technologies used in some electric vehicle models.
NiMH battery cell voltage ranges from 0.9 V to 1.6 V; its most notable characteristic is that it performs well even at low temperatures from −20 °C to −40 °C. However, power transfer efficiencies range from 72% to 78%, and gravimetric energy densities have a range of 50–70 Wh/kg. Their life span is 500 cycles at 100% depth of discharge. However, this type of battery suffers from memory effect and loses additional energy from self-discharge standby [17,18]. Lithium batteries have high cell voltage levels up to 3.7 volts. Batteries of this type normally have high gravimetric energy densities of 100–150 Wh/kg, and high-power transfer efficiencies usually range from 95% to 98%. Their life span is 3000 cycles at 80% depth of discharge, and the discharge time varies from a few seconds to several weeks. These batteries have extremely quick responses in practice. Quick discharge time can vary from a few seconds to many weeks, and they have agile time responses [13,18]. As illustrated in Figure 3, the volumetric and specific energy volumes are smaller for cells of lighter weights. Thus, lithium batteries have superior volumetric energy density compared to NiMH batteries.
The advantages of the lithium battery mentioned above motivated this study of lithium battery technology. Generally, lithium batteries are of two types: polymer and ion. The crucial difference between polymer and ion is the composition of the electrolyte between the cathode and the anode. Lithium polymer (Li-po) cells utilize a polymer-based electrolyte that is either dry or, more frequently, a gel-like substance, while lithium-ion (Li-ion) cells utilize a liquid compound electrolyte instead [20]. The fundamental advantages and disadvantages of the two batteries are charted in Table 2. The key design specifications of the electrical battery pack used in this study are as specified in Table 3.
Table 1. Electric vehicle batteries used by car manufacturers [16,21].
CompanyCountryVehicle ModelBattery Technology
GMUSAChevy-VoltLi-ion
Saturn Vue HybridNiMH
FordUSAEscape, Fusion, MKZ HEVNiMH
Escape PHEVLi-ion
ToyotaJapanPrius, LexusNiMH
HondaJapanCivic, InsightNiMH
HyundaiSouth KoreaSonataLithium polymer
ChryslerUSAChrysler 200C EVLi-ion
BMWGermanyX6NiMH
Mini E (2012)Li-ion
BYDChinaE6Li-ion
Daimler BenzGermanyML450, S400NiMH
Smart EV (2010)Li-ion
MitsubishiJapaniMiEV (2010)Li-ion
NissanJapanAltimaNiMH
Leaf EV (2010)Li-ion
TeslaUSARoadster (2009)Li-ion
ThinkNorwayThink EVLi-ion, Sodium/metal chloride
To calculate the discharge current, the power output is divided by the maximum applied voltage. Accordingly, as the battery pack voltage diminishes, the demand for the discharge current to maintain the output power increases. Due to this, the maximum required current relies upon the lower voltage of the battery pack, which in turn depends on the cell used. Because of the voltage decline in the battery pack, the full power 80 kW may not be met when the pack is fully discharged. The cells in the battery pack can be arranged in a series, parallel, or both in a mixture.

Selection of Cells

According to the required design parameters, the five best-fitting lithium battery cells were selected by battery calculator design software, as given in Table 4. This selection was determined by comparing 24 distinct cells from different battery manufacturers with various parameters, including the size of the cell, the current discharge rates, the chemistry, and the number of cells needed to produce the required total traction voltage, cell voltage, battery capacity, and cell energy density. Those batteries were completely tested both thermally and electrically.

4. Comparative Analysis, Results and Discussion

4.1. Comparative Analysis of Li-ion Battery Cells from Different Manufacturers

To achieve the most precise outcomes for the correlation, all the battery cells were completely new, had been stored under similar conditions, and were without mechanical damage. Each of the cells was tested four times under various conditions. Table 5 presents the discharge test conditions. The discharge currents chosen were 15 A and 30 A, which are almost half of the maximum levels. This is equal to an output of 48 kW from the full battery at 400 V, which is the power level at which the vehicle regularly runs. Additionally, 30 A was selected as this is the maximum discharge for these cells.
Following these strict tests, the cell temperature was checked by a thermocouple joined to the focal point of the packaging of the cell with the opposite end connected to a direct TC-08 data logger, which in turn was connected to a PC through a USB for recording the temperature of each cell. The cell discharge load was of the programmable resistive type. Strict safety conditions were also applied, and the test could be aborted whenever one or more of these conditions were met:
  • The temperature of the cell exceeded the maximum specified in the cell Material Safety Data Sheet (MSDS).
  • The maximum current indicated in the MSDS was surpassed.
  • The cell was operating below the lower voltage limit given in the MSDS.

4.2. Test 1: Continuous 15 A Discharge with No Active Cooling

The cell output voltage and the internal temperature were configured during the test. Figure 4 shows the voltages of the five tested cells, and Figure 5 shows the results when temperature was checked against time in seconds. The 30Q and 25R tests were stopped before they could be fully run, but this was an information defilement issue that also influenced the 25R thermal patterns. However, among the three cells with full informational indexes, the VTC6 endured the longest association because of its larger 3000 mAh capacity. Though the HG2 is advertised as having a 3000 mAh capacity, the VTC6 performed better in the test. The VTC5A seems better than the VTC6, which is firmly coordinated by the 30Q cell. Moreover, both the VTC5A and the 30Q cells have 2500-mAh capacities, which are smaller than the 3000-mAh capacity of the VTC6. The outcomes from this test demonstrate that the 30Q, VTC6, and VTC5A gave better thermal performance than the HG2.

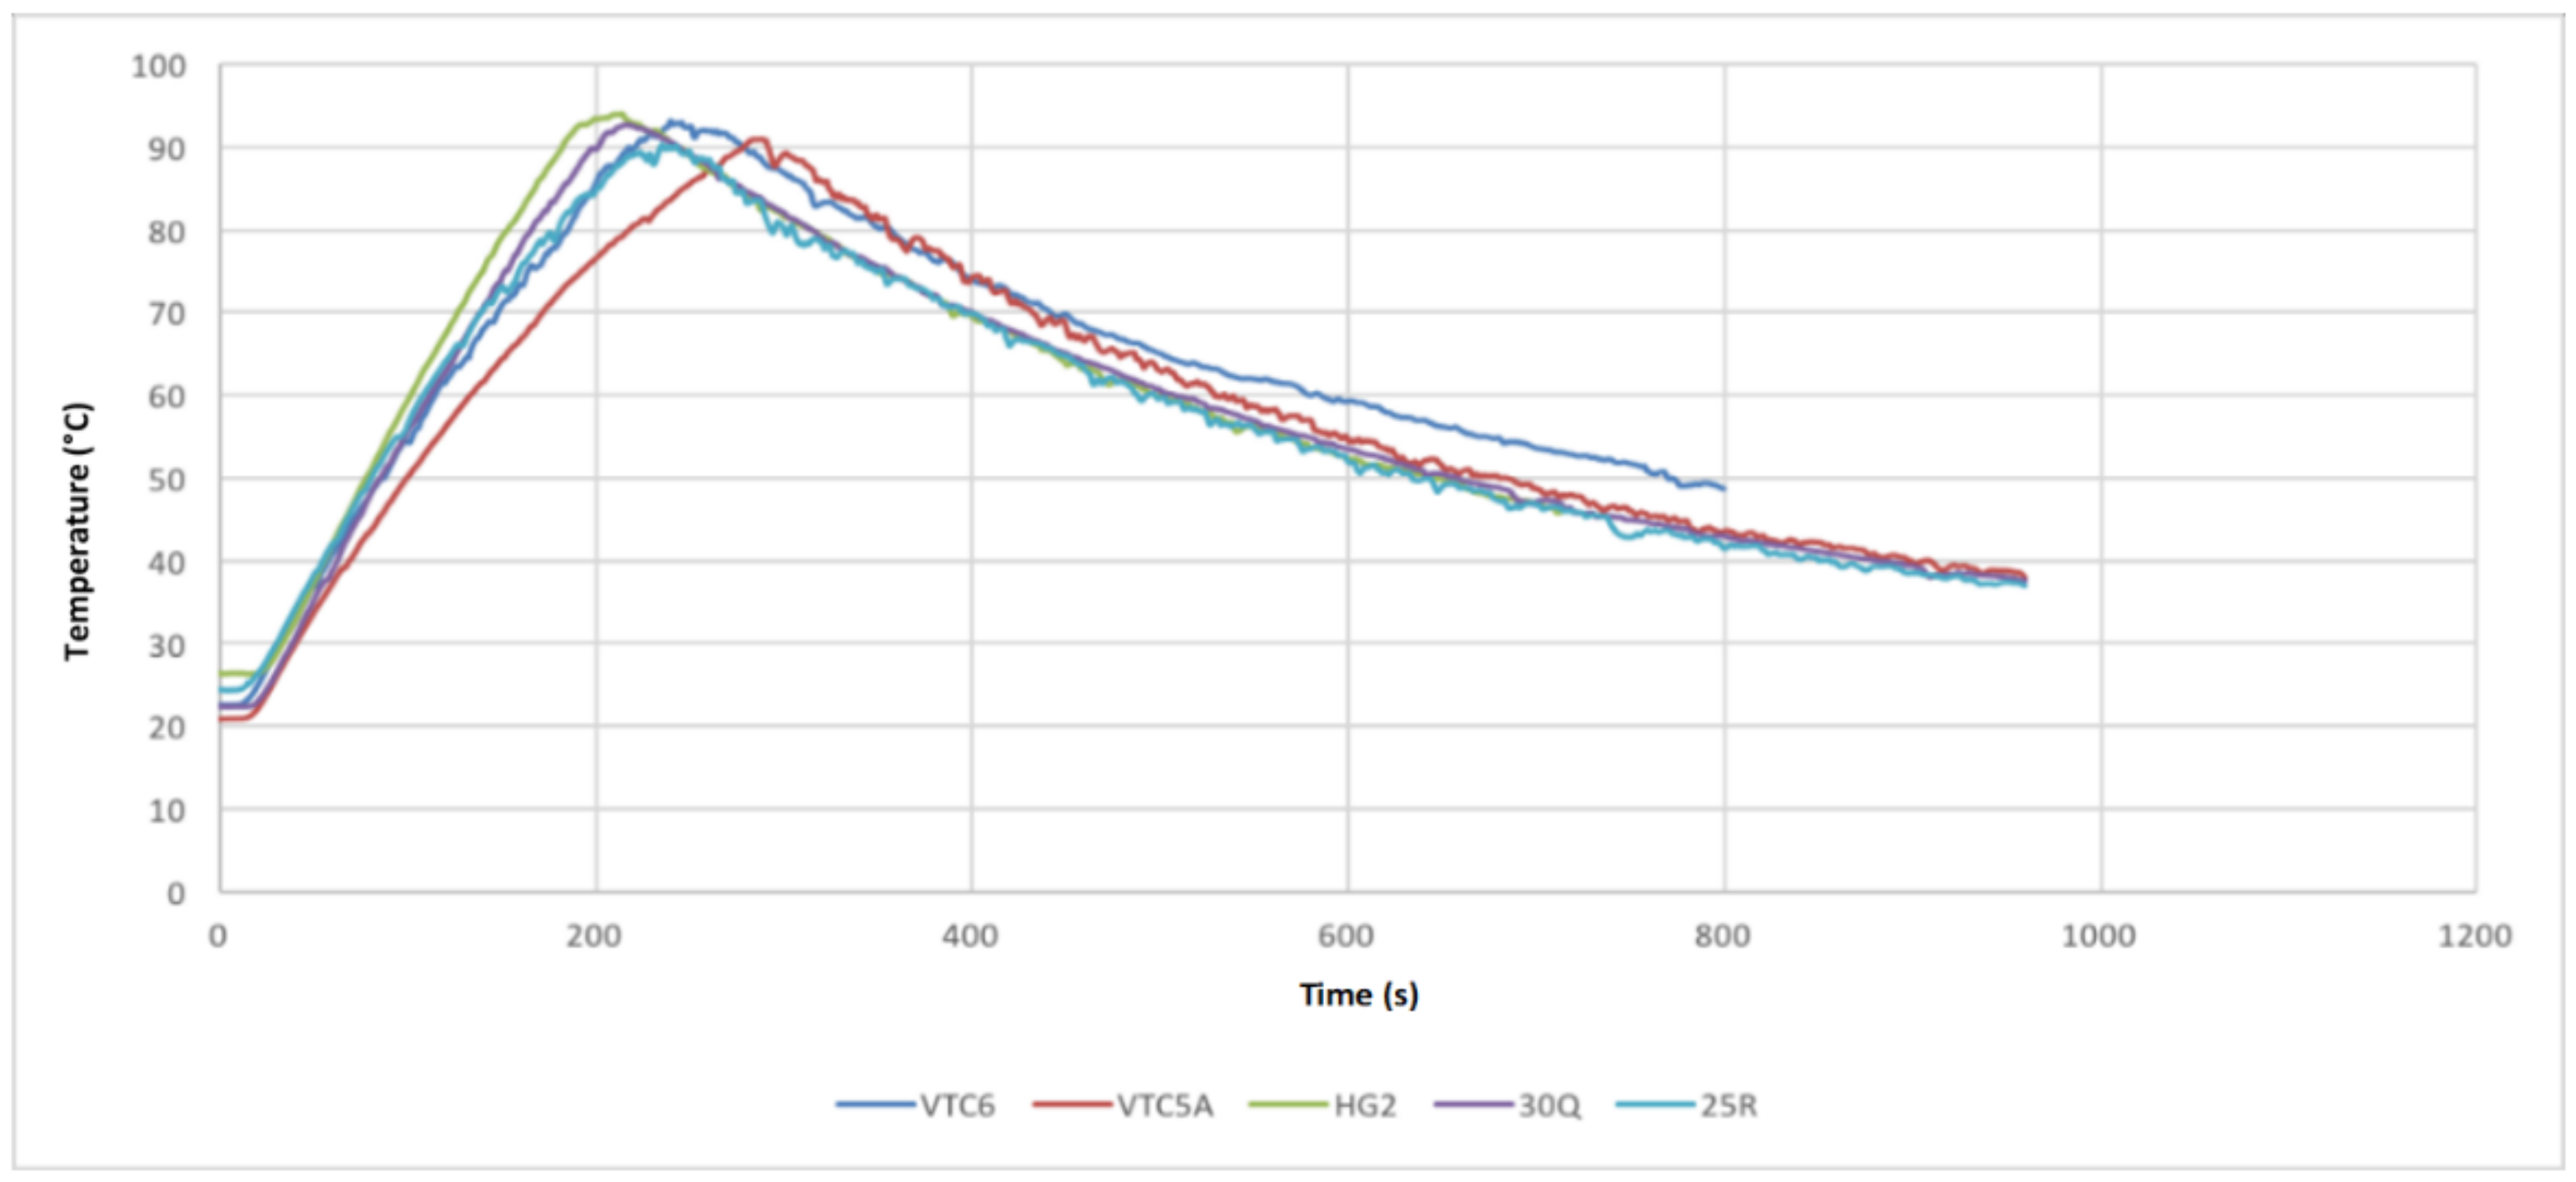
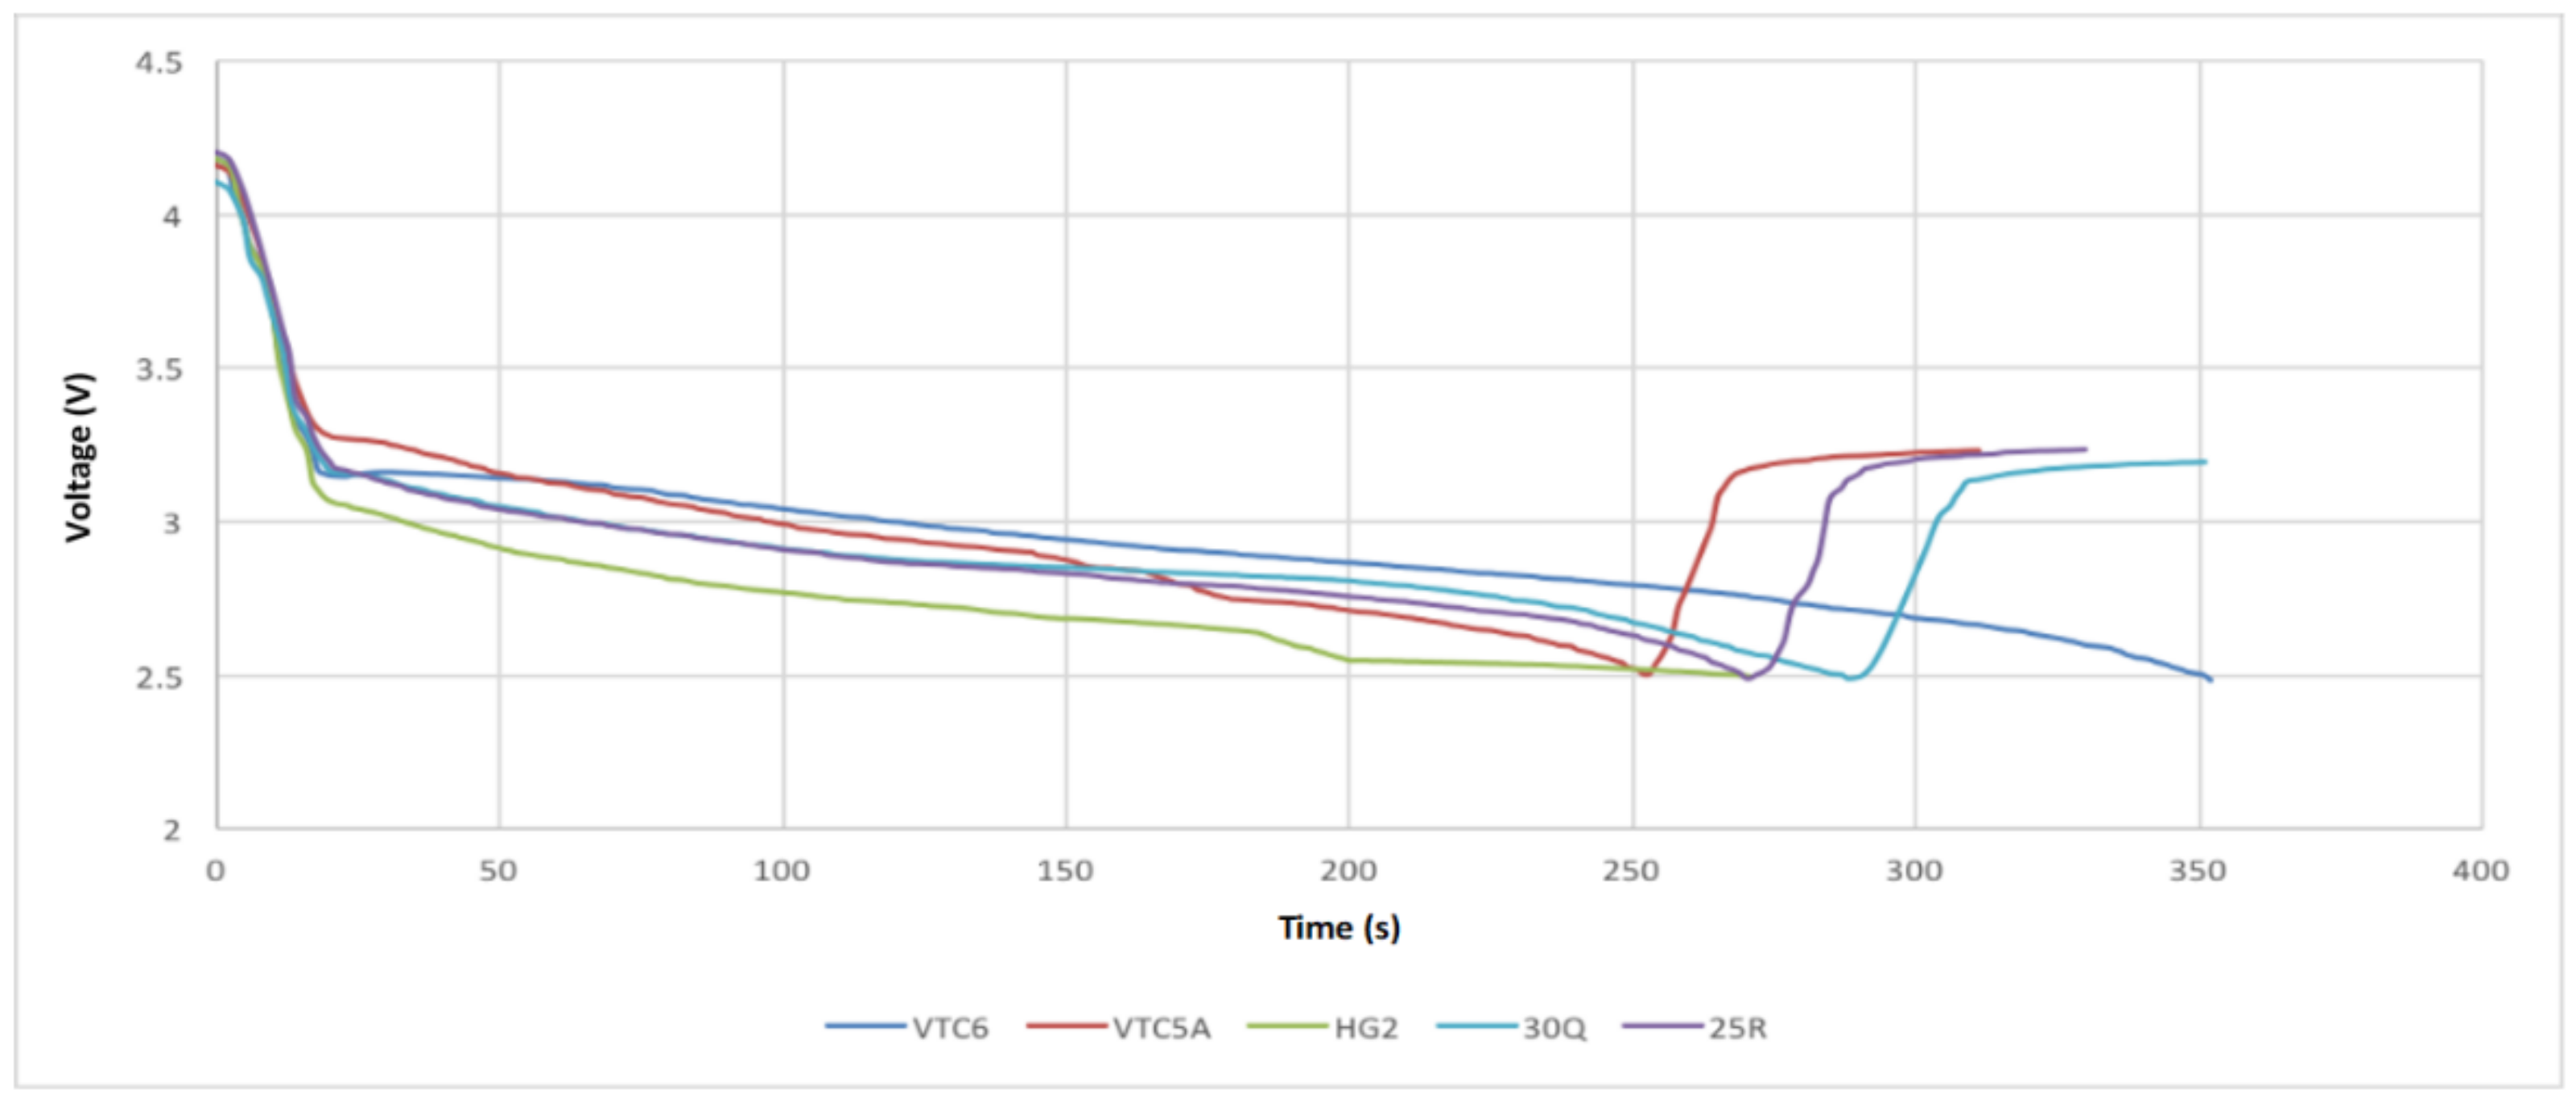
4.3. Test 2: 30 A Discharge Current Tests with No Active Cooling

Figure 6 shows that the VTC5A outperformed the other cells in the thermal tests, having the longest discharge time prior to arriving at the thermal cutoff point. The peak of the voltage curve is from the beginning of the test until the temperature begins to fall, as shown in Figure 7. The 25R and VTC6 performed equally well in the thermal tests. No cell could completely discharge at 30 A without reaching thermal cutoff. The thermal characteristics of the VTC5A can be ascribed to low internal resistance, which not only reduces the amount of energy warming the cell as it discharges but also permits a higher discharge current because of a lower internal voltage drop under load.

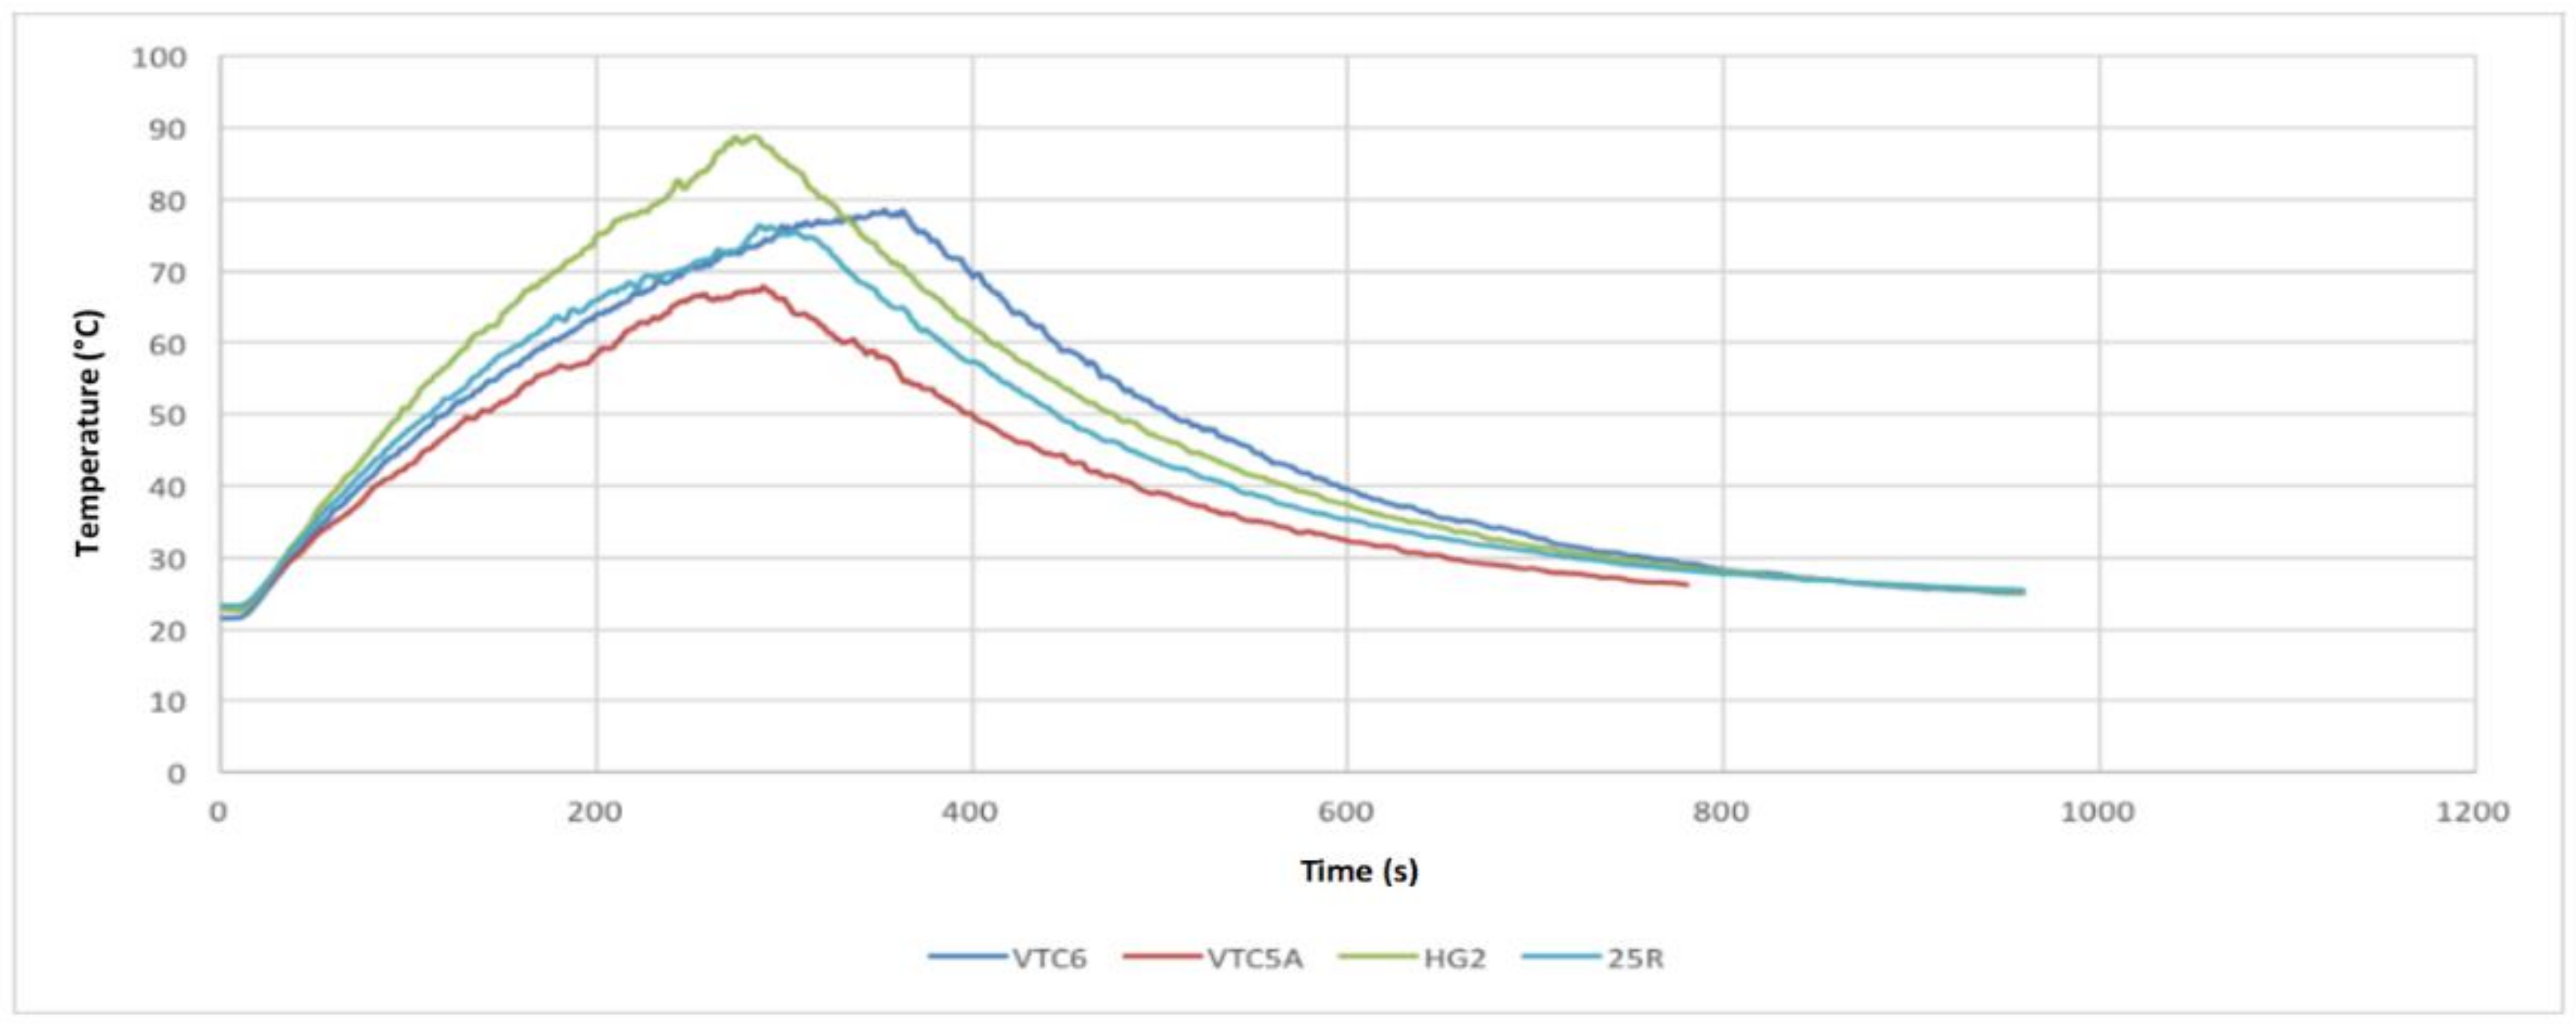
4.4. Test 3: 15 A Discharges with Active Air Cooling

Figure 8 shows that all the cells performed very well, with the VTC5A and VTC6 performing better than the rest (due to their low internal resistance, which appears in the increased voltage under load during the consistent inclination gradient at discharge). (Data defilement influenced the voltage curve of the 25R cell.) The cells discharged for a similar amount of time as those in the 15 A test without cooling, although the VTC6 did not last long. This could have happened because of the positive effect of the electrolyte heating up when the cell was performing; this effect decreased as the cell cooled.
The cooling arrangement functioned well. Figure 9 shows that all the cells fully discharged at peak temperatures in the range from 42 °C to 51 °C, in contrast with from 61 °C to 73 °C when the test was conducted without cooling. The difference in temperature is around 22 °C. As in the prior test, the VTC5A gave the strongest performance and the HG2 the weakest.

4.5. Test 4: 30 A Discharge Current Test with Active Air Cooling

Test 4 subjected the cells to extreme load and thermal conditions. As shown by the voltages and temperatures in Figure 10 and Figure 11, the VTC6 maintained the highest charge, taking more than 60 s longer to fully discharge because of its greater capacity. It was also not excessively affected by the maximum allowable load in the MSDS. The VTC5A maintained a low voltage drop until the 50 s to 80 s mark, at which time the VTC6 kept a higher voltage than all other cells until the test finished. The VTC5A outperformed all other cells by reaching a peak temperature of 68 °C and cooling with a thermal profile comparable to that of all other cells. The HG2 gave the weakest performance, as seen in different tests. Similarly, the 25R and VTC6 performed until the load was completely removed. The VTC6 increased in temperature to a peak of 79 °C; however, this gave it no advantage over the 25R cell, as the latter lasted much longer. The VTC6 was clearly the best in this test.

4.6. Key Findings and Summary

The VTC5A cell gave the best performance of all the cells tested. As the findings suggest, the heating impact will be intensified when there are many cells in the vicinity because the surrounding air will not be sufficient to cool them, particularly under large loads. Air cooling appears to have a great effect on cell temperature because of the large temperature contrast between the surrounding air and the cells. Overall, a cooling system is needed to permit the cell to maintain a temperature within its allowable operating range, and blending cells from various producers influences battery performance, particularly in cell voltage adjustment, current limit, and thermal performance.
Therefore, the VTC6 battery cell was selected for the subsequent tests. An arrangement to cool the battery pack was necessary. To meet the power needs, a module setup of eight equal cells with four arrangement cells (8P4S) was utilized. These modules were charged to 16 V (4 V per cell) with a 240 A discharge capability. When 25 modules are incorporated into the electric vehicle, the battery arrangement will be 8P100S. This could have a range from 400 V to 420 V and enable a 240 A discharge.

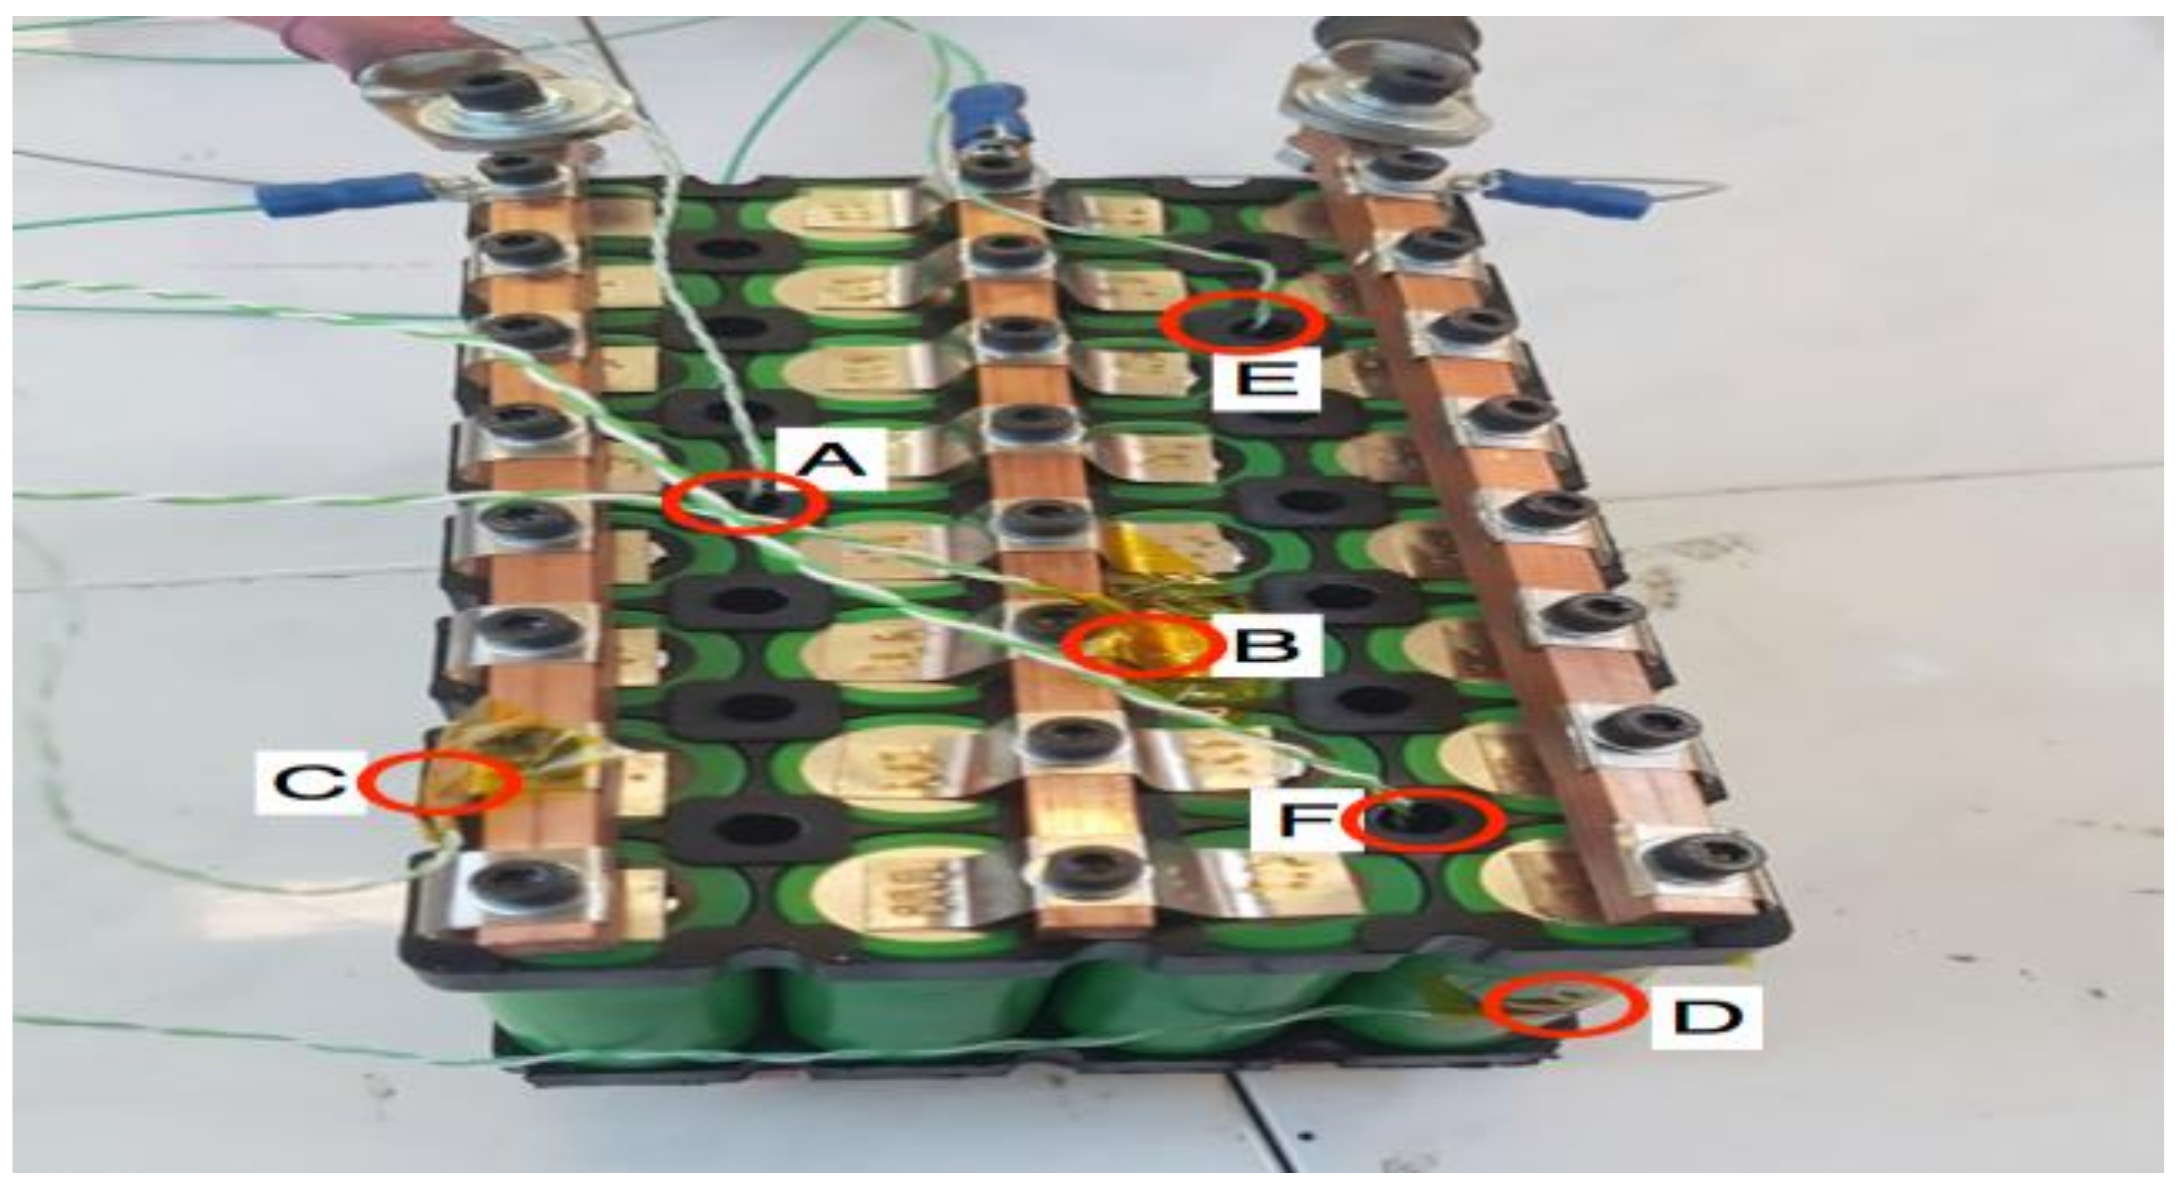
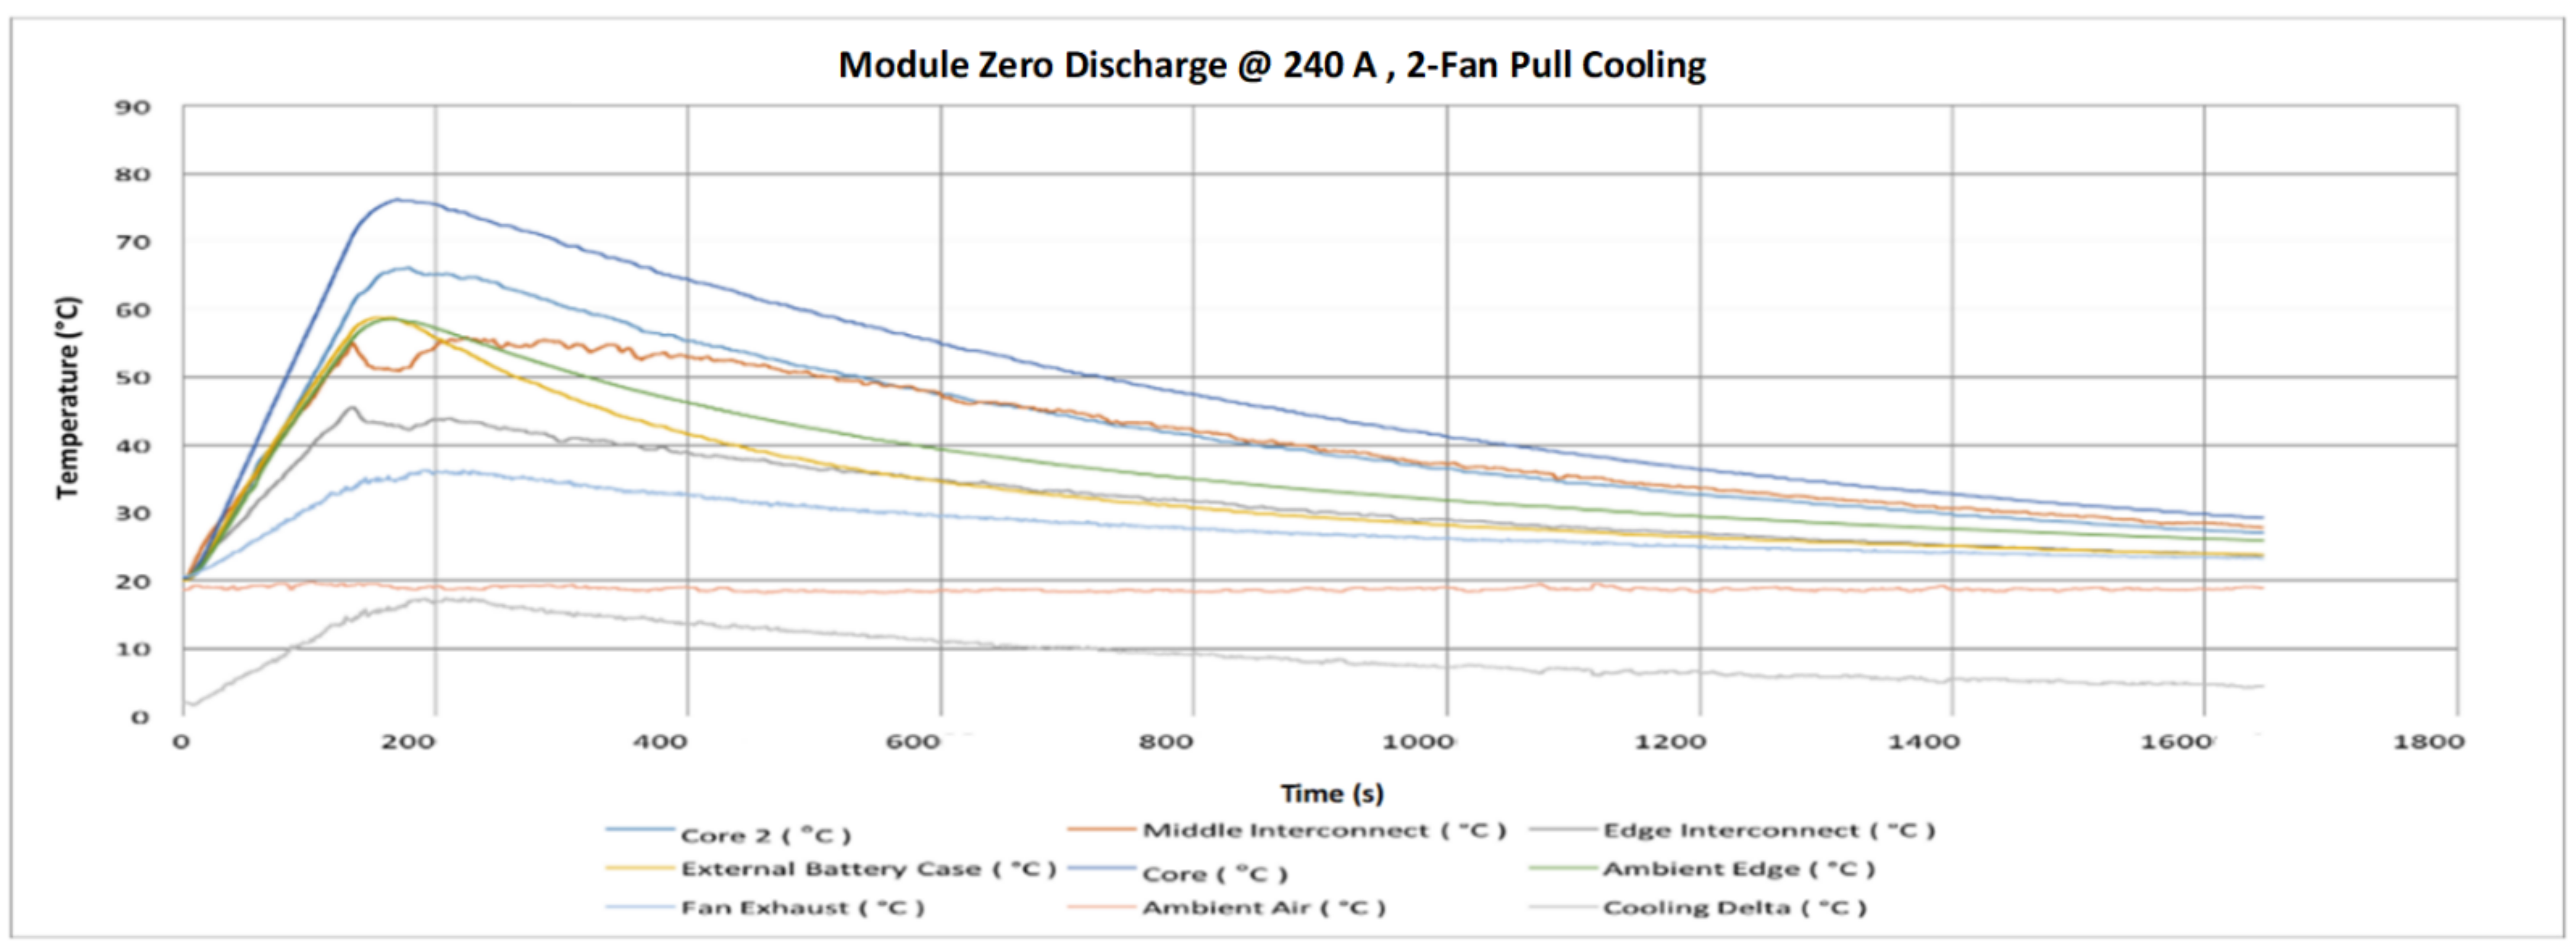
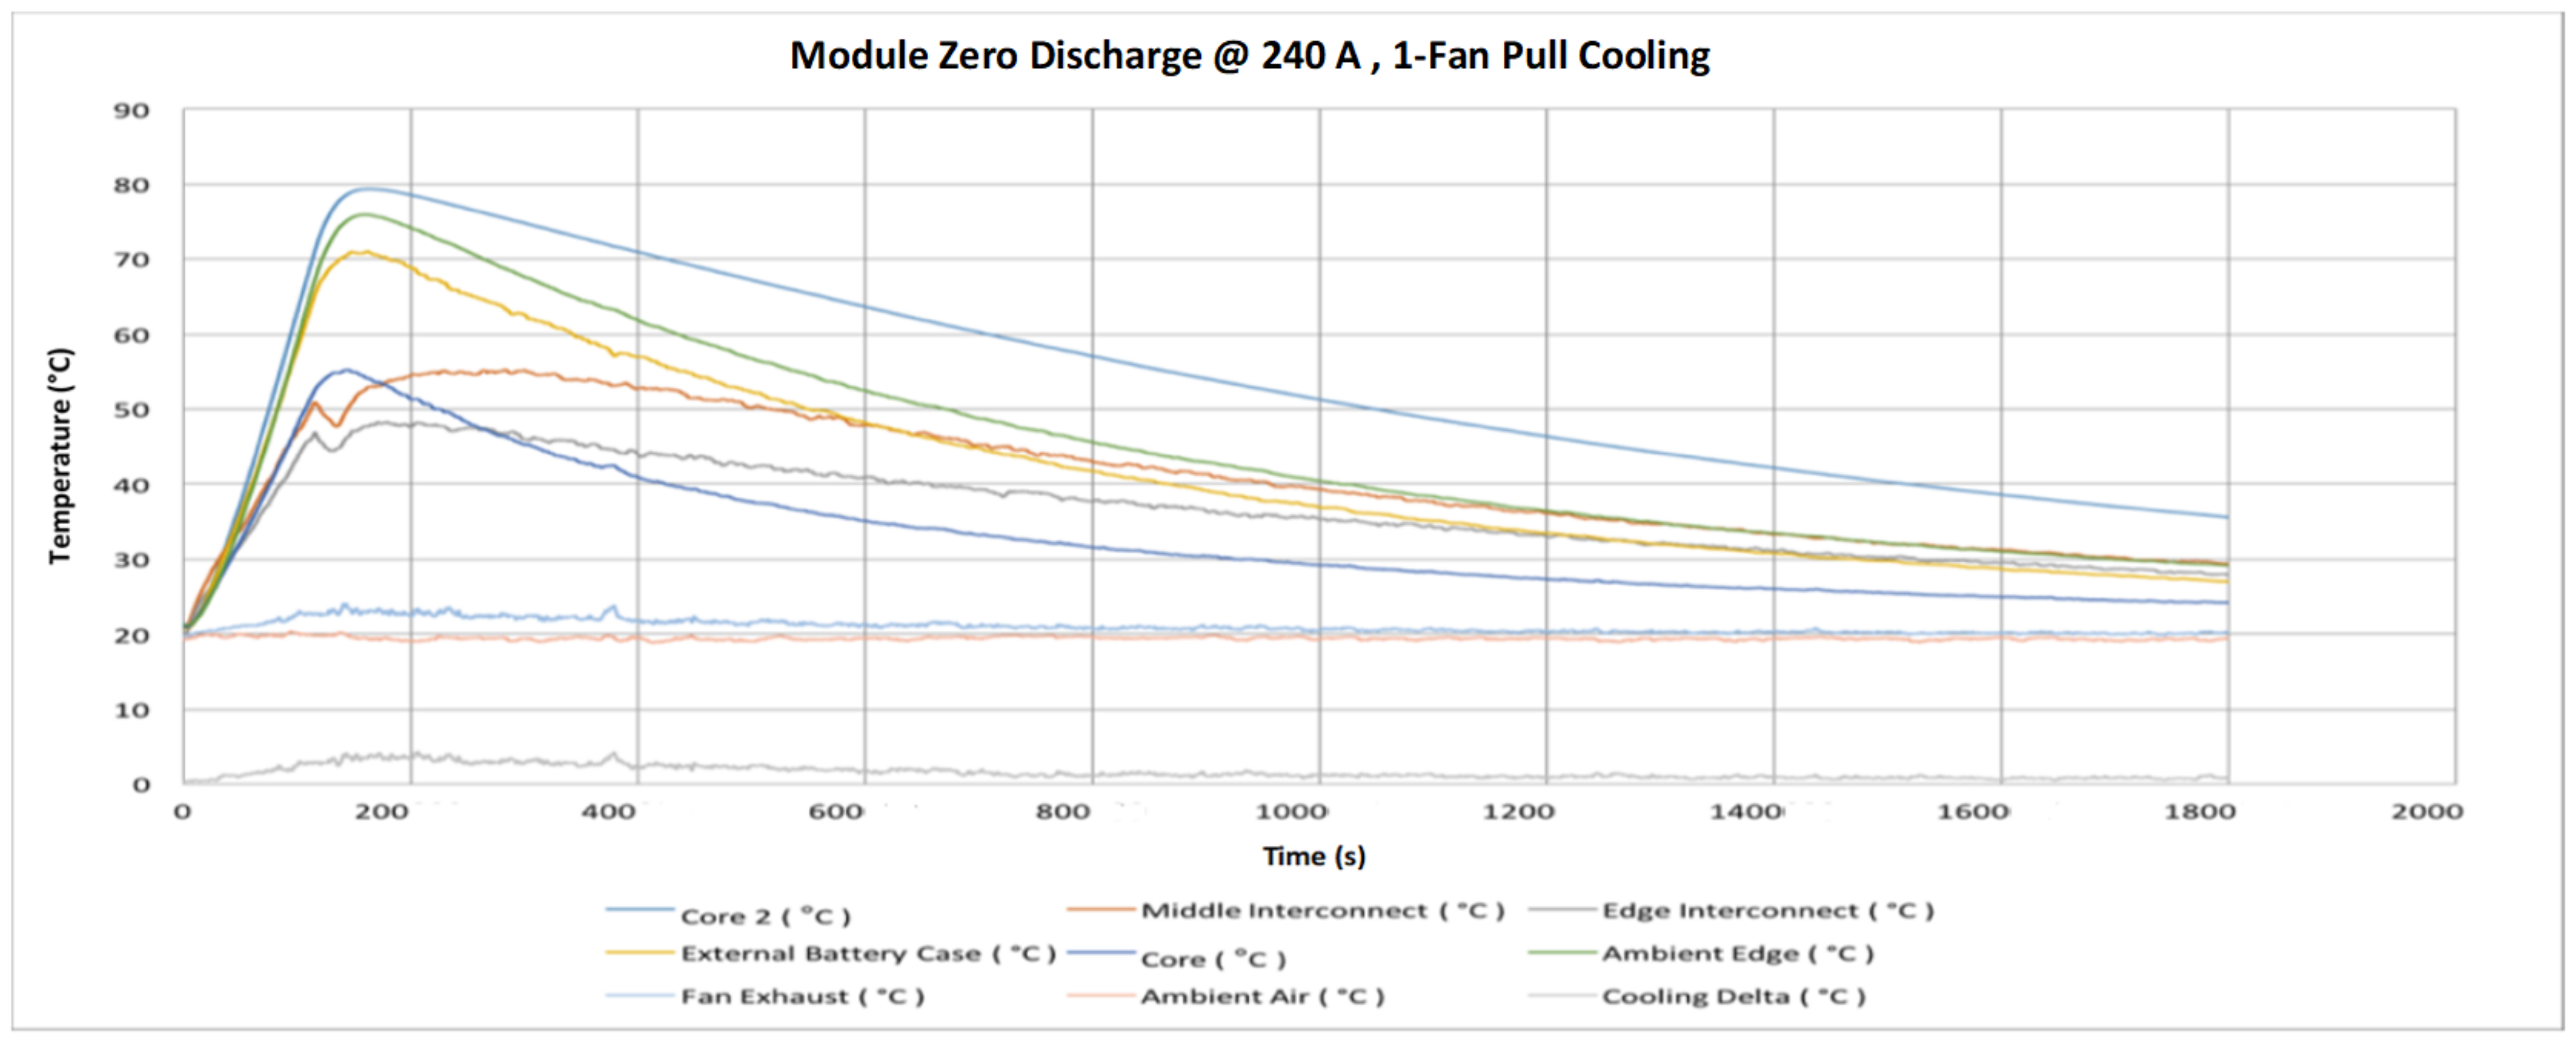
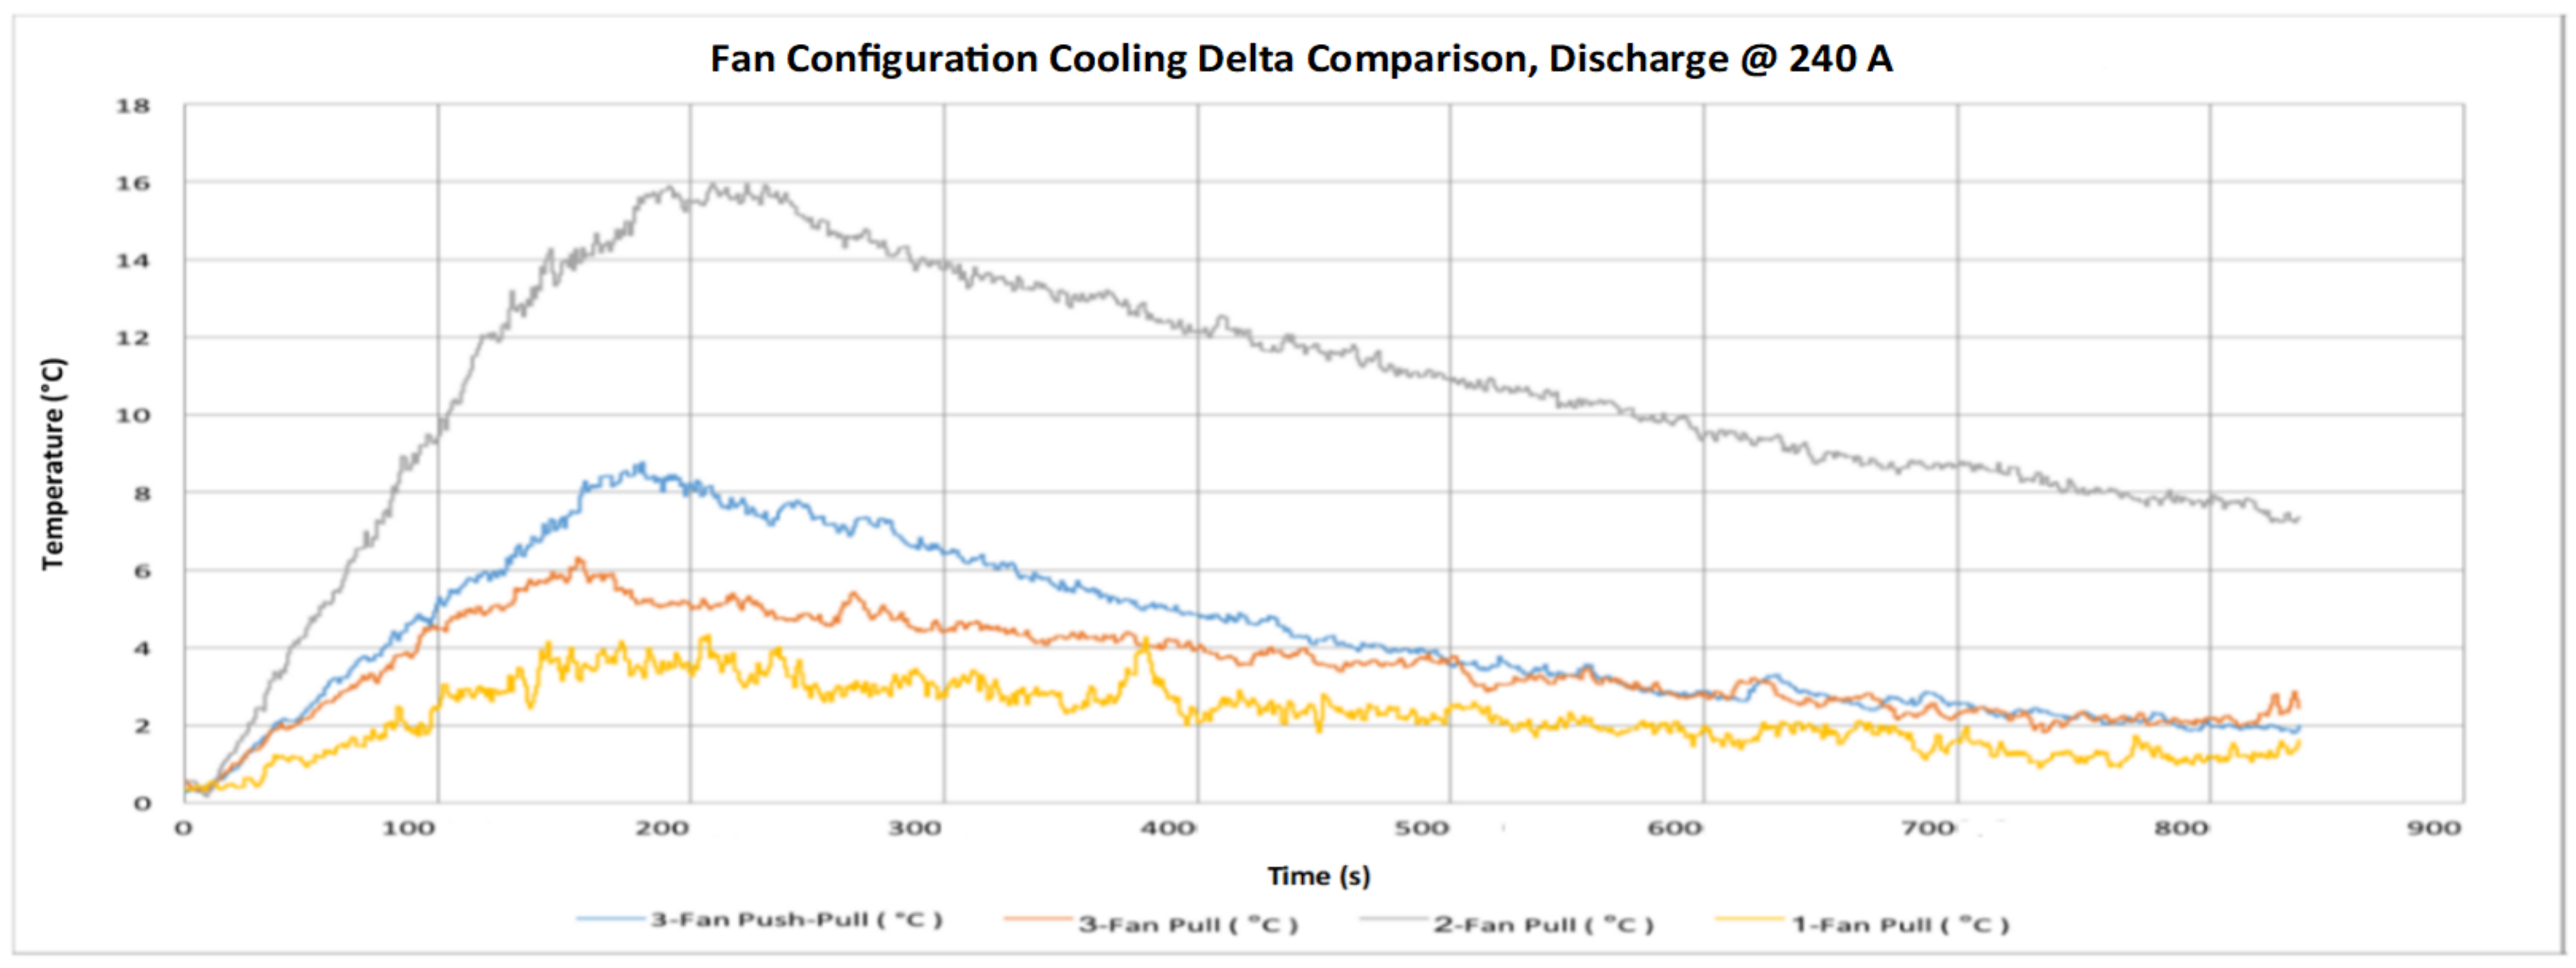
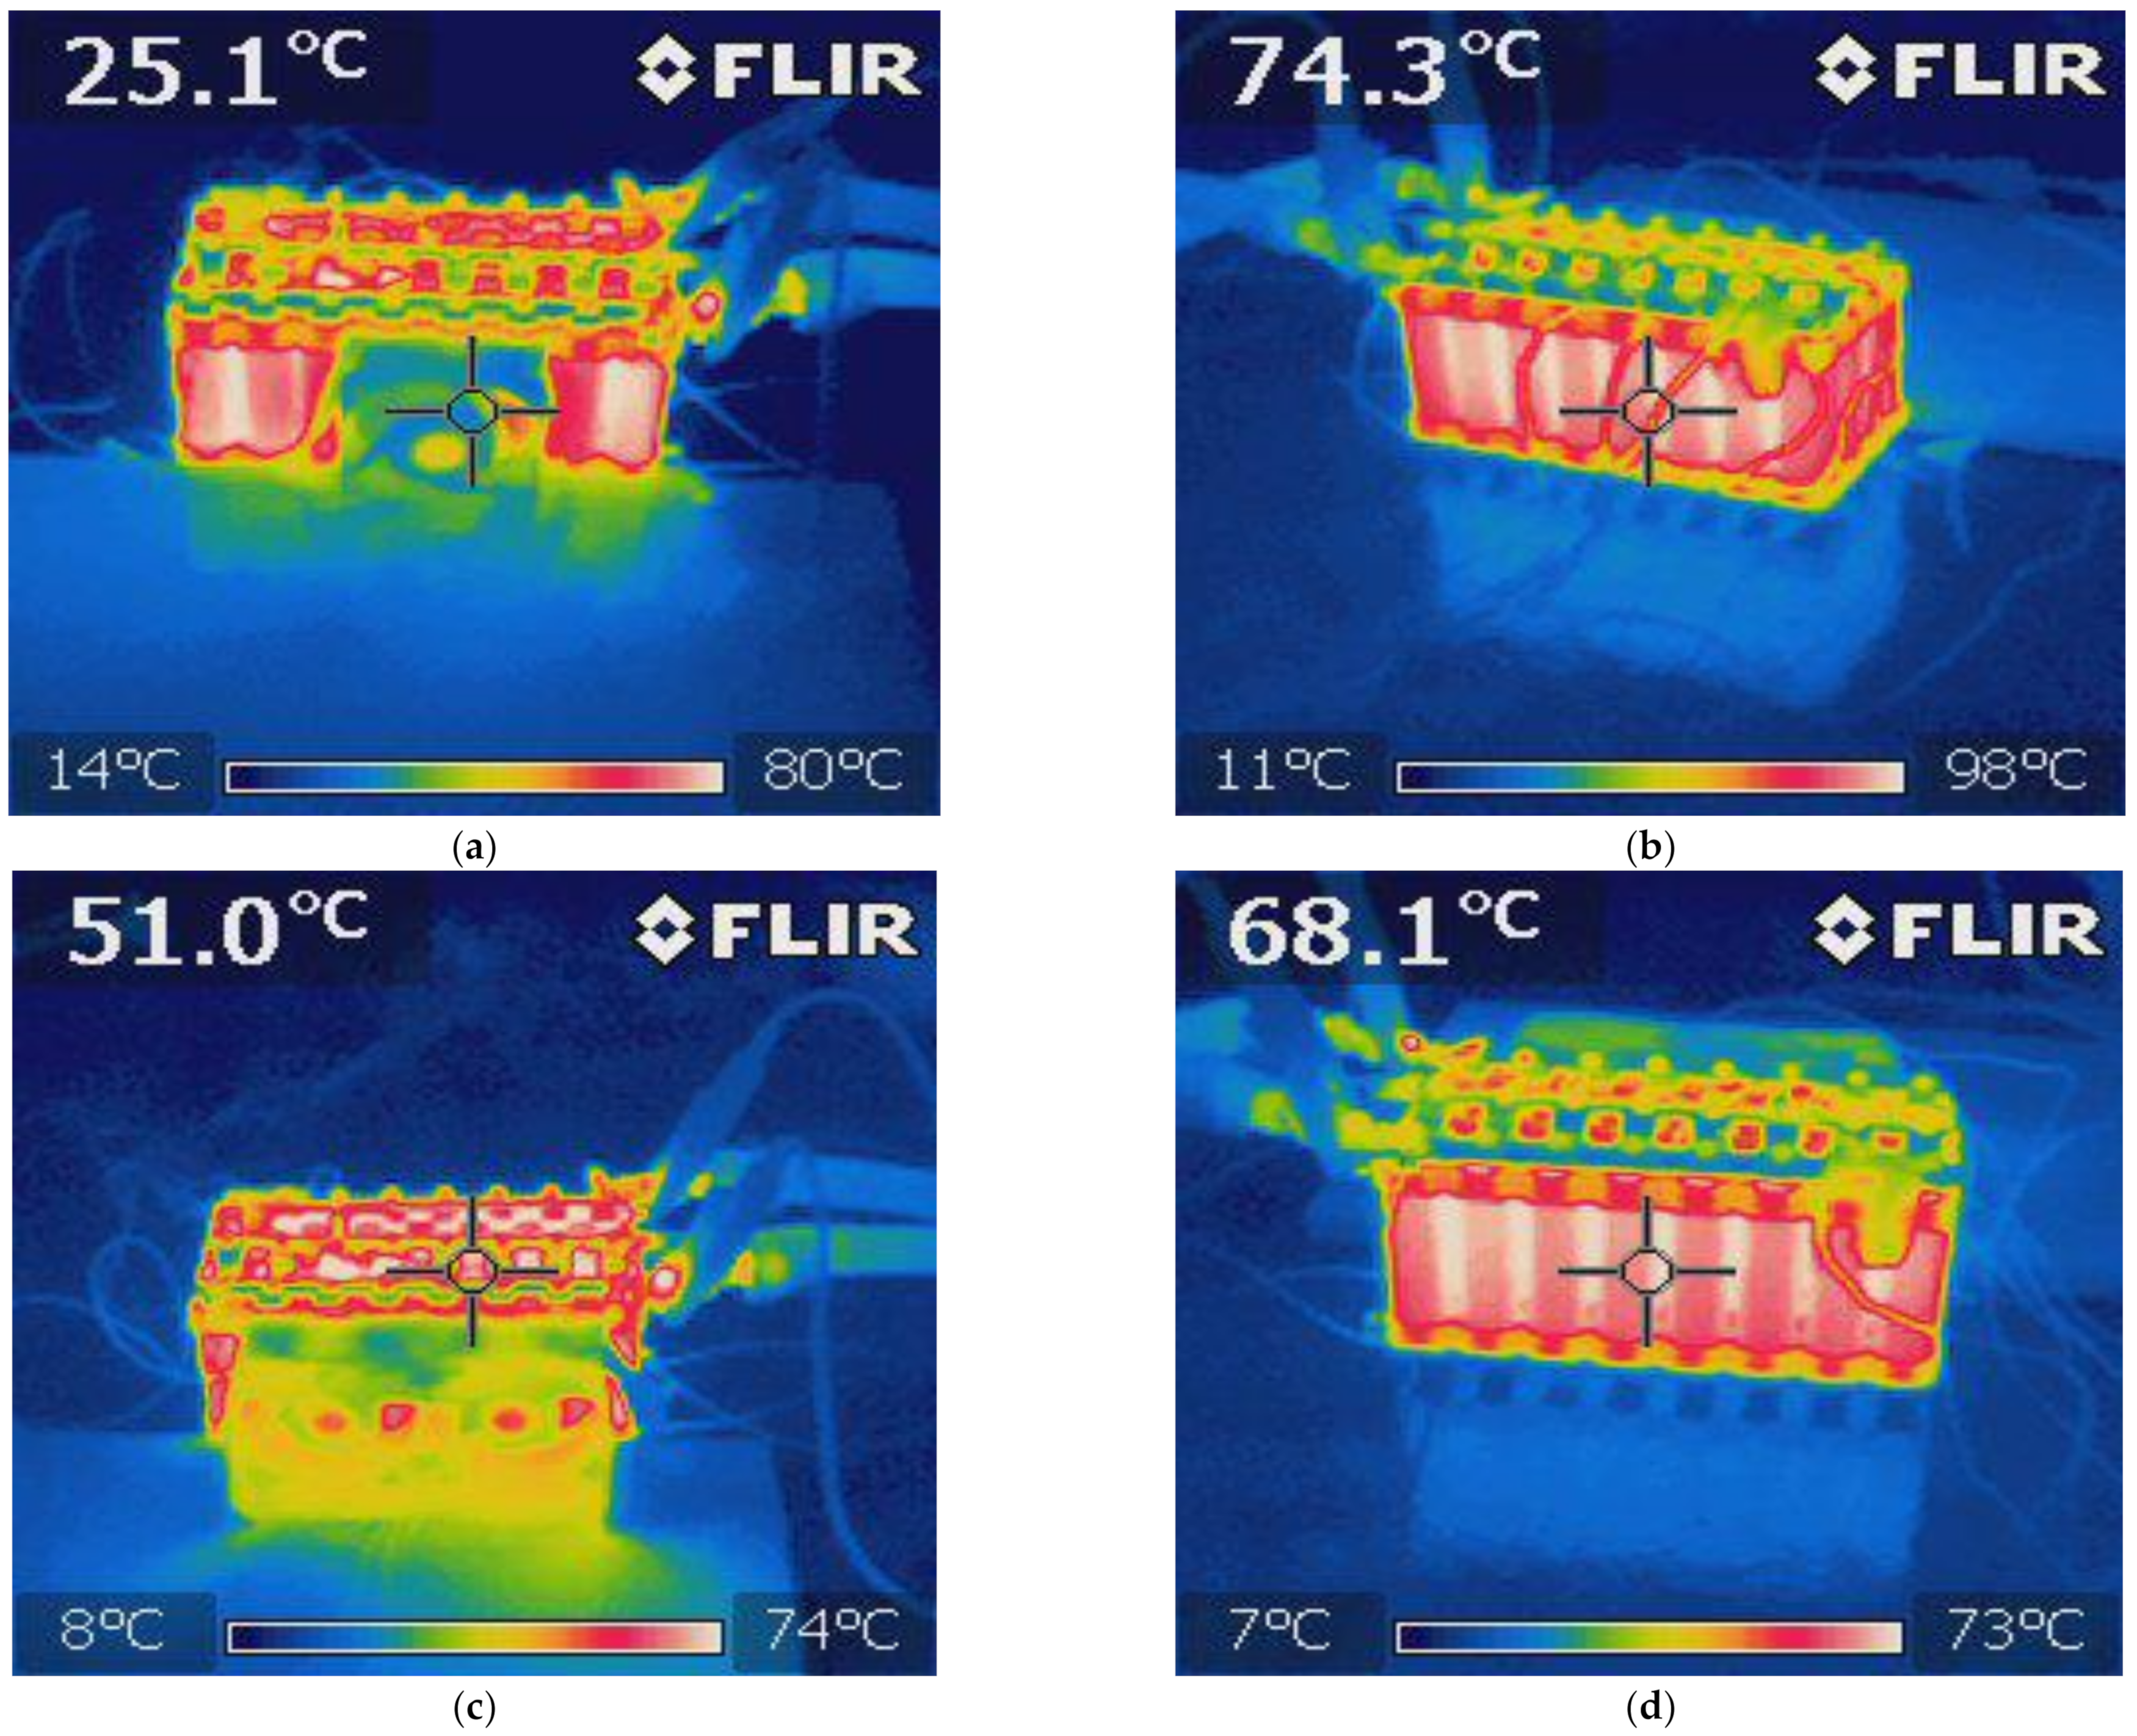
5. Battery Module Test

The module shown in Figure 12 was built according to the requirements of the test. Several instruments, such as thermocouples, were used to assess and evaluate the temperatures around the module. They were located as shown in Figure 12. To enable high current discharges, the module was connected to a programmable load that could draw the full current of 240 A from it. Safety measures were set to be invoked when the temperature exceeded 80 °C at any location in the pack, when a current higher than 240 A was drawn, or when the cell reached its maximum voltage.
Figure 13 shows the results of the test. The test continued for 130 s and ended when the thermal cutoff points were reached. The results were unsurprising because the two thermocouples put in the center of the module were the hottest points from discharge starting to the furthest limit of the measured cooling period. The outside battery case thermocouple reached 69.6 °C before the cutoff. The hottest interconnect reached 51.5 °C before the cutoff, but because of the thermal mass of the pack, the temperature kept increasing to 57.9 °C before it began to cool down.
A subsequent test was performed on the module with a discharge from 16 V (4.0 V per cell) at 240 A steady current load with three fans pulling air through the module to cool it. Figure 14 shows the results of this thermal test. The test lasted 127 s, with the highest temperature reaching 75.5 °C at the principal core checking point. The remainder of the measuring points were much cooler (<50 °C) than the two core values measured.
The curve for the middle interconnect appears unusual, but the properties and thermal mass of the module explain this shape. When the load is applied to the module, the temperature increases similarly to the other points. When the load is eliminated, the current stops going through the interconnection, so the temperature quickly begins to fall as all the thermal energy in the interconnect is dissipated. After an underlying cooling period, the thermal energy in the cells and encompassing module segments flow into the interconnection and other cooler parts. This exchange of energy causes the temperatures inside the module to cool at a similar rate that depends on the surrounding air temperature and the air stream through the module. This cooling arrangement is superior to the common convection method of cooling the module.
The test did not last as long as anticipated because the maximum temperature decreased as the dynamic cooling prevented the battery pack from warming up after the load was disconnected. Besides, the temperature contrasts in the module were more spread out, and different parts of the module were kept cooler, helping keep the module generally warm.
The third test was on the module discharging from 16 V (4.0 V per cell) 240 A steady current load with three fans pulling air through the module and three fans pushing air through the module on the opposite side for cooling. This test was conducted to examine changed cooling arrangements and learn how the increase in air flow rate and distinctive fluid dynamics can influence the cooling of the module.
Figure 15 shows the results of the thermal tests. The test lasted 140 s, with the temperature reaching 73.31 °C at the principal core checking and monitoring point. However, the remainder of the measured points were cooler (<60 °C) than the core measurement. This test utilized twice the number of cooling fans as the previous test and lasted 13 s longer (10.2% more conduction period). Especially interesting here is the core temperature before thermal cutoff and the wide and lower range of temperatures.
In contrast with the previous test, the new design, which involves a higher flow of air, has only one hotter point. This can be explained by seeing how the six fans were pushing and pulling air through the module. The location of the measuring point for Core 2 is where the expansion of air being driven into the module greatly reduces the heat of this region. This point is also kept cooler because the design puts one fan in the module that pushes cool surrounding air straight onto the thermocouple of Core 2. This cooling arrangement is better at keeping the module cool than both normal convection cooling and the three-fan pull design tested previously. This arrangement will be contrasted with different arrangements that utilize six fans to accomplish a 10.2% improvement in discharging time. Slightly cooler temperatures are generally not feasible with respect to the expanded weight, cost, and power utilization.
Figure 16 contrasts the two hottest points of the module during the three-fan push and the three-fan push-and-pull tests. The purpose of this correlation was to measure which of these cooling arrangements is more efficient for cooling the battery pack. As shown, the test utilizing the push-pull arrangement kept going 10.2% longer than the test with fans only pulling air through the module.
This test was performed at a maximum temperature of 73.3 °C, 2.9% cooler than the maximum temperature of 75.5 °C for the force design. Though both the improvement in the running time of 10.2% and the 2.9% reduction in the battery pack’s temperature are considered great advantages, the disadvantages are a 100% increase in the weight, cost, and power utilization of the cooling system. Even though the upgrades would bring about a cooler battery pack and eventually the capacity to run a longer duty cycle, the costs outweigh the advantages. The various requirements for cooling systems with respect to cost, weight, and power utilization are analyzed later across different cooling arrangements and setups.
Based on the result that a pull-only cooling system is overall better than a push-pull system, the fifth test conducted was on the module with a discharge from 16 V (4.0 V per cell) at 240 A consistent current load with two fans pulling air through the module for cooling. This test was conducted to evaluate the suitability of utilizing two fans rather than three fans for each module, bringing about a 33% decrease in cooling system requirements.
Figure 17 presents the results of this thermal test, which was performed on the module with a discharge from 16 V (4.0 V per cell) at 240 A steady current load with just a solitary fan for cooling. The test lasted 128 s, with the maximum temperature reaching 76.2 °C at the main core checking point. The second-highest temperature was at Core 2. The remainder of the measuring points were found to be fundamentally cooler (<60 °C) than the two core measurements.
Figure 18 shows that the results for the two-fan test are measurably superior to those in the test of only one fan. The air flow was not sufficient to keep the module cool, and subsequently the discharge lasted for only 104 s, before thermal cutoff.
In comparison with the two-fan pull arrangement, the cooling delta line for a single fan is much lower. This shows that the design is not eliminating as much thermal energy from the battery pack, which explains why there are three locations on the chart where the temperature increased quickly, as opposed to a solitary area causing the thermal cutoff seen in different discharges with better cooling.
The last two diagrams emphasize how valuable the cooling delta is as a strategy for ranking and measuring the presence of the cooling design. To gather a full dataset, the three-fan pull design was retried with the fan exhaust temperature monitored to permit the cooling delta to be determined for each setup.
Figure 19 compares the cooling deltas of all the tested cooling designs. It shows that the single fan arrangement was the least efficient at cooling the module, and even though it is the best arrangement with respect to cost, weight, and power utilization, it is incapable of removing thermal energy from the module. The three-fan push-pull arrangement is imperceptibly better than the three-fan pull arrangement, as explained previously. The two arrangements perform well, and the benefit of the three-fan push-pull arrangement is made clearer as the module warms up and the delta increments until it is fully discharged.
However, the arrangement that removes the most thermal energy from the module is the two-fan pull arrangement. This arrangement surpasses the cooling delta performance of all other setups from the start of discharge until the end and all through the chill-off period. When the discharge is at the hottest point, the two-fan cooling delta is larger than the next-best arrangement by around 93%. This possibly surprising outcome can be explained by the actual physical structure of the fans. The two-fan arrangement places two fans over the module, which fits the module size well overall and pulls air over each cell without hanging off the edge of the module, bringing air around them without pulling in air from outside the module. This is not the case for the three-fan arrangements, which, because of their size, pass air around the edge of the module and accordingly do not pass as much air through the module and so are not able to cool as effectively.
Figure 20a–d present four thermal images that were taken during these retests. They show a two-measurement guide for temperature as opposed to the several limited focuses provided by the thermocouple strategy. This permits itemized investigation of the cooling strategies to be conducted. Figure 20a,b demonstrate the module with the single fitted cooling fan. The module pictures were taken at full thermal saturation and near thermal cutoff. The cells are typically the hottest parts of the battery pack, and the fan does little to cool them, mostly because the small fan size does not cover all the cells in the module. The hottest part of the module is the back, where the temperature is around 98 °C. The single fan is incapable of keeping the module cool.
In Figure 20c,d, air is pulled through the module by two cooling fans. The module is thermally saturated and close to cutoff. The front view shows how the fans cover practically all the front cells, and the heat that appears on the bottom is proof of the improved performance of the fans, as this warming is brought about by the hot air being taken out of the module. At the location of the fan, the hottest point is 74 °C, which is 6 °C cooler than in the single fan arrangement. The entire back of the module is cooler, and the hottest point is 73 °C, which is 15 °C cooler than the single-fan arrangement.
The results demonstrate that the two-fan pull setup is an ideal compromise of power usage, cooling performance, weight, and the crucial factor of cost. Thus, this fan configuration was used for the longer 72 A endurance run to model a more realistic event where the average power usage would remain almost 28 kW.
Figure 21 depicts the results of the thermal test. The test lasted for 916 s. A maximum temperature of 51.6 °C was reached at the primary core checking point. Overall, the only other points surpassing 40 °C at any time during the discharge were the Center Interconnect and Core 2 monitoring points. In this test, the two-fan pull cooling arrangement functioned well, keeping the entire module cool at the lower load current of 72 A. This permitted the module to be fully discharged to 10 V (2.5 V per cell) before thermal cutoff. This test also shows what happens under average load conditions when the interconnecting heat rises significantly more than it does in the shorter high current burst tests conducted before. This is close to perfection, and temperatures are still reasonable, safe, and within the test limits.
Figure 22a,b are two thermal pictures taken during the 72-amp endurance run. Both photographs were taken close to the end of the discharge, when the module was in thermal saturation and close to its maximum temperature limit. Figure 22a depicts the front of the module, where the two cooling fans were placed. The two cooling fans removed a great deal of thermal energy from the module, as shown by the heating of the floor by the fans, which took hot air from the module and warmed the floor and surrounding area. The hottest point of the module was 52 °C, which associates precisely with the thermocouple data.
Figure 22b shows the back of the module, through which cold air was pulled in. The cells are fundamentally the same color, indicating that the pack is warming and being cooled uniformly. No hot spots developed at the back, as the temperature was 54 °C, only 2 °C more than at the front. This indicates the thermal stability of the pack when this cooling arrangement is implemented.

6. Conclusions

A comparative analysis of lithium battery cells used as a pack for an electric race car was performed, and these findings have implications for the use of batteries in electric vehicles. The levels of performance of batteries made by different manufacturers were also studied. Cell analysis was also conducted to build a battery pack, as shown in many tables. Specifically, Table 3 represents the cells’ connectivity ratio in series and in parallel to achieve the overall voltage and the power requirement for an electric racing car. To ensure preciosity, all the batteries used in this experimental study were brand new and free of any mechanical damage. Moreover, the batteries had been stored under similar conditions. Each of the cells was tested four times under various conditions as specified in Table 5. The cell temperature was checked by a thermocouple and monitored through a PC. The key findings of these test conducted in this study can be summarized as follows:
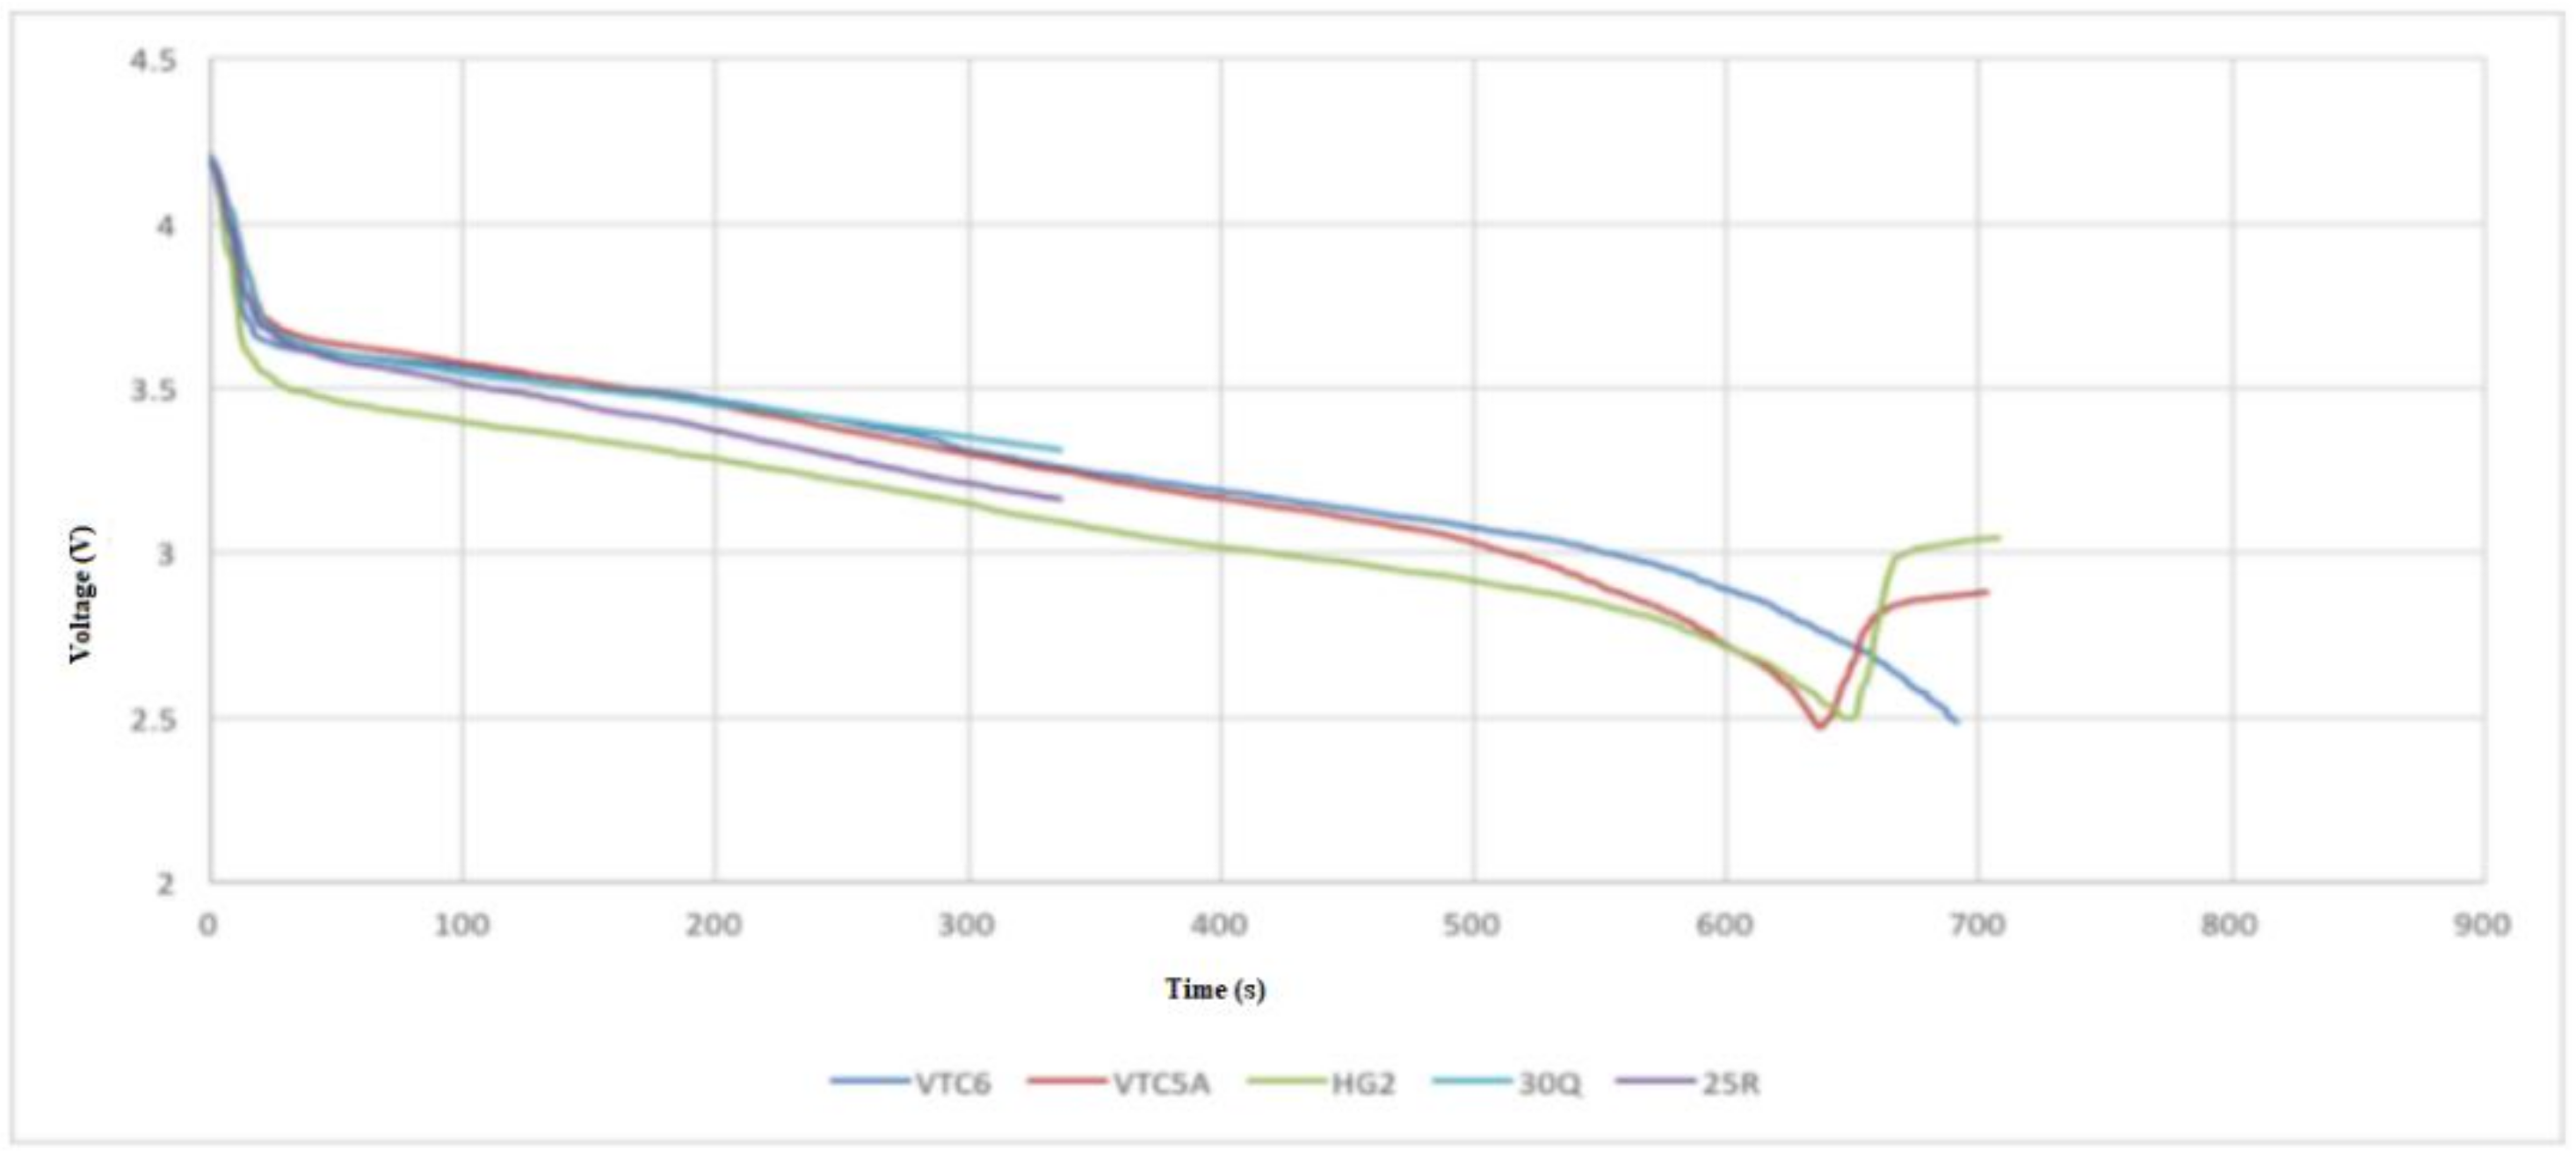
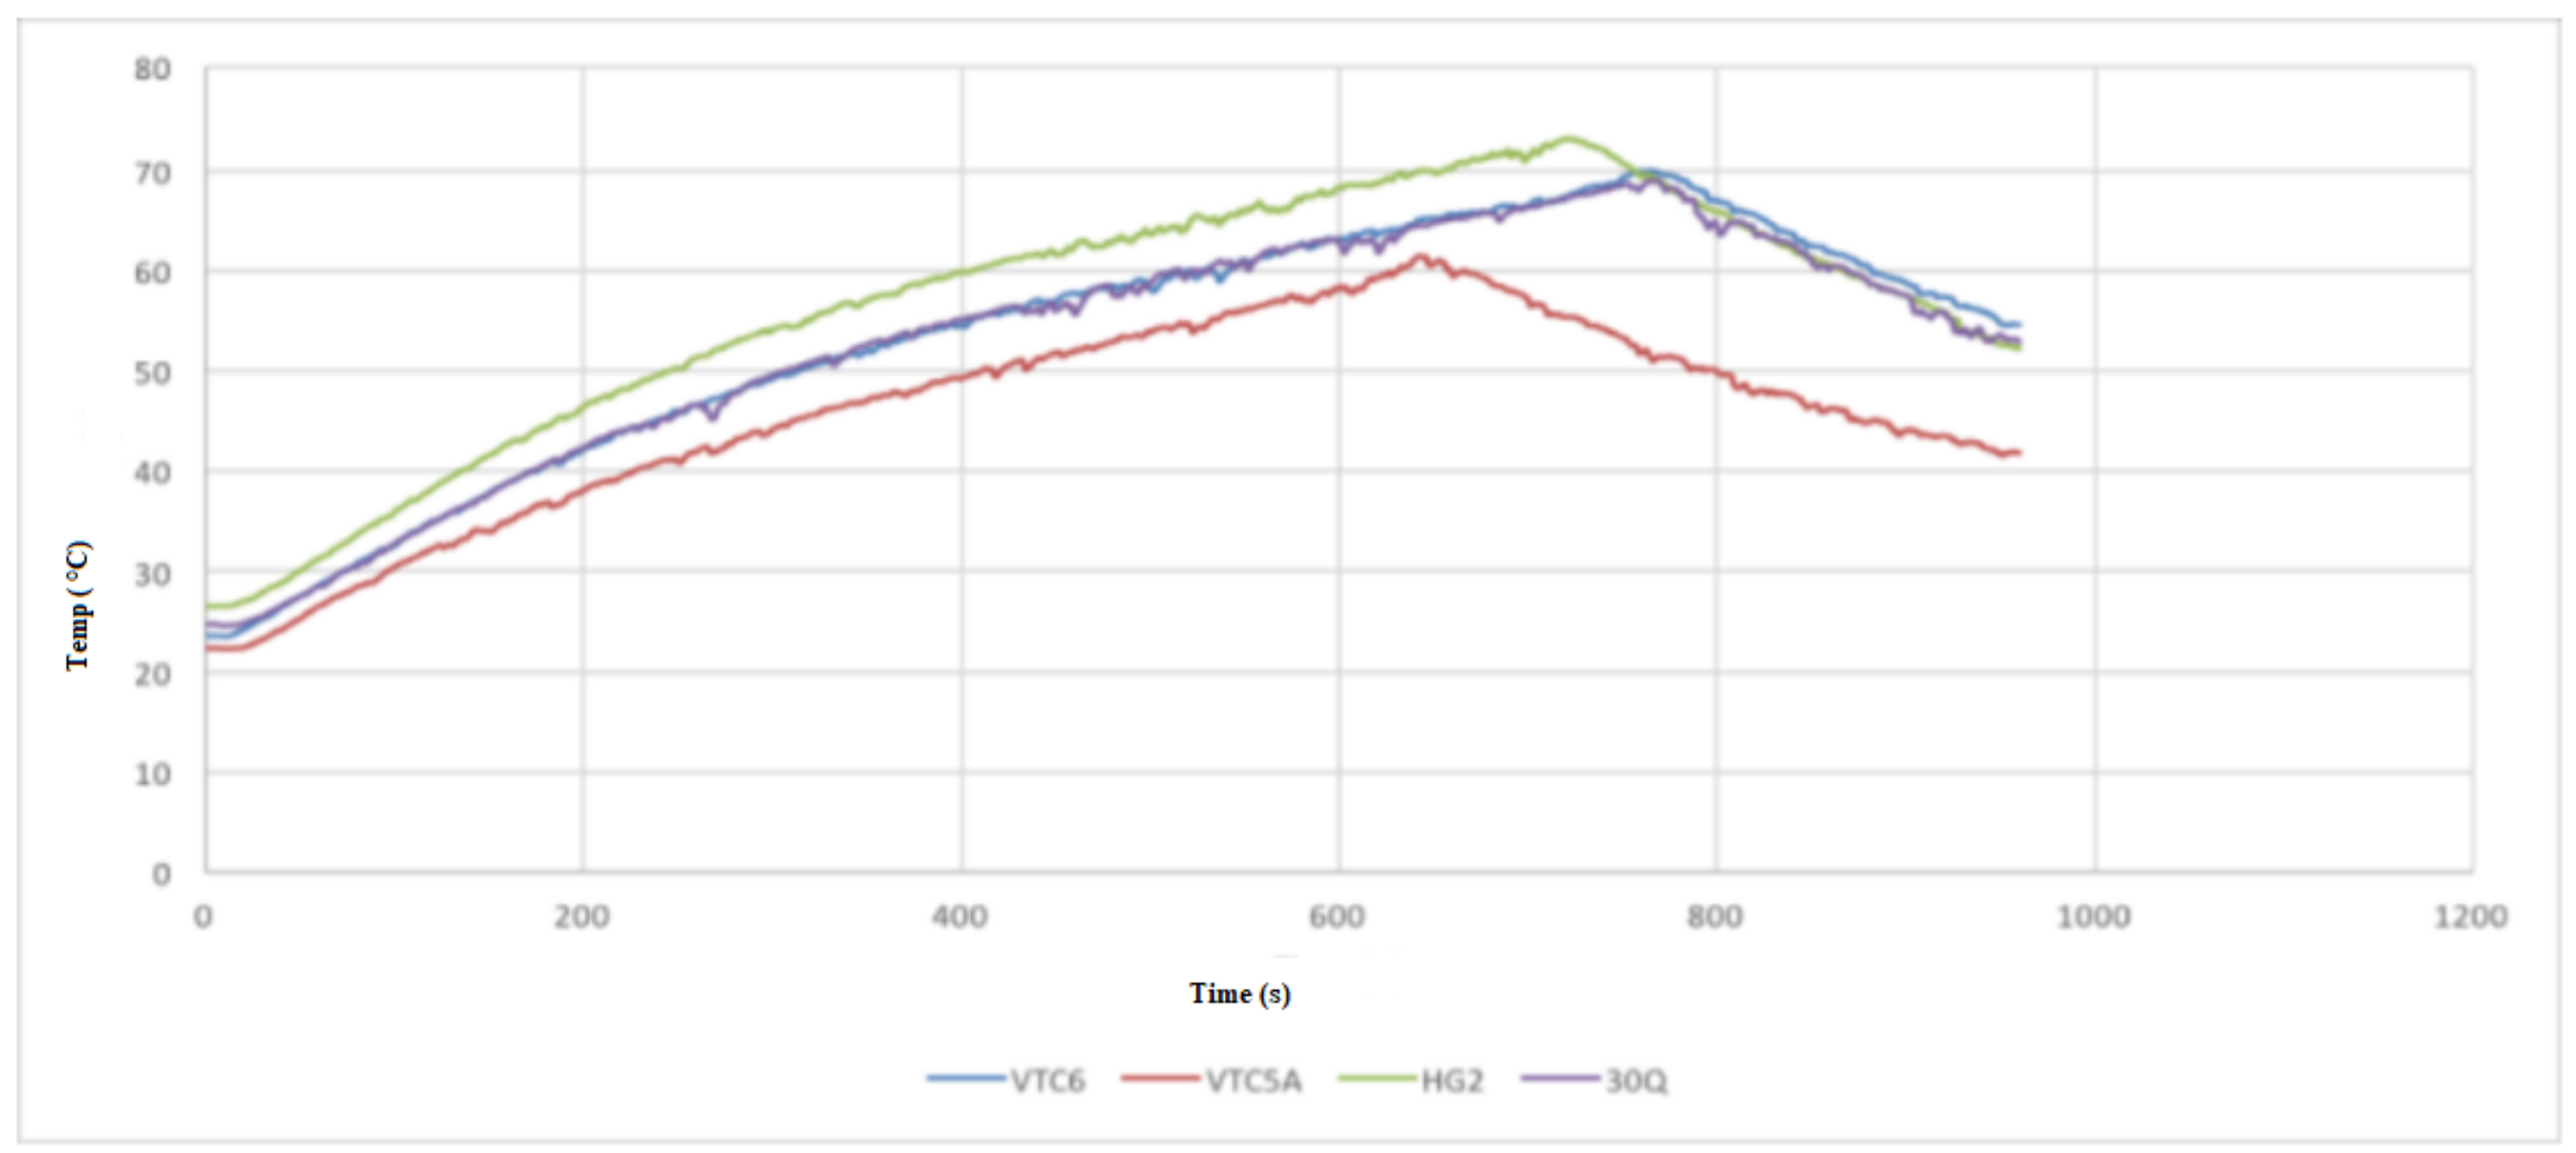
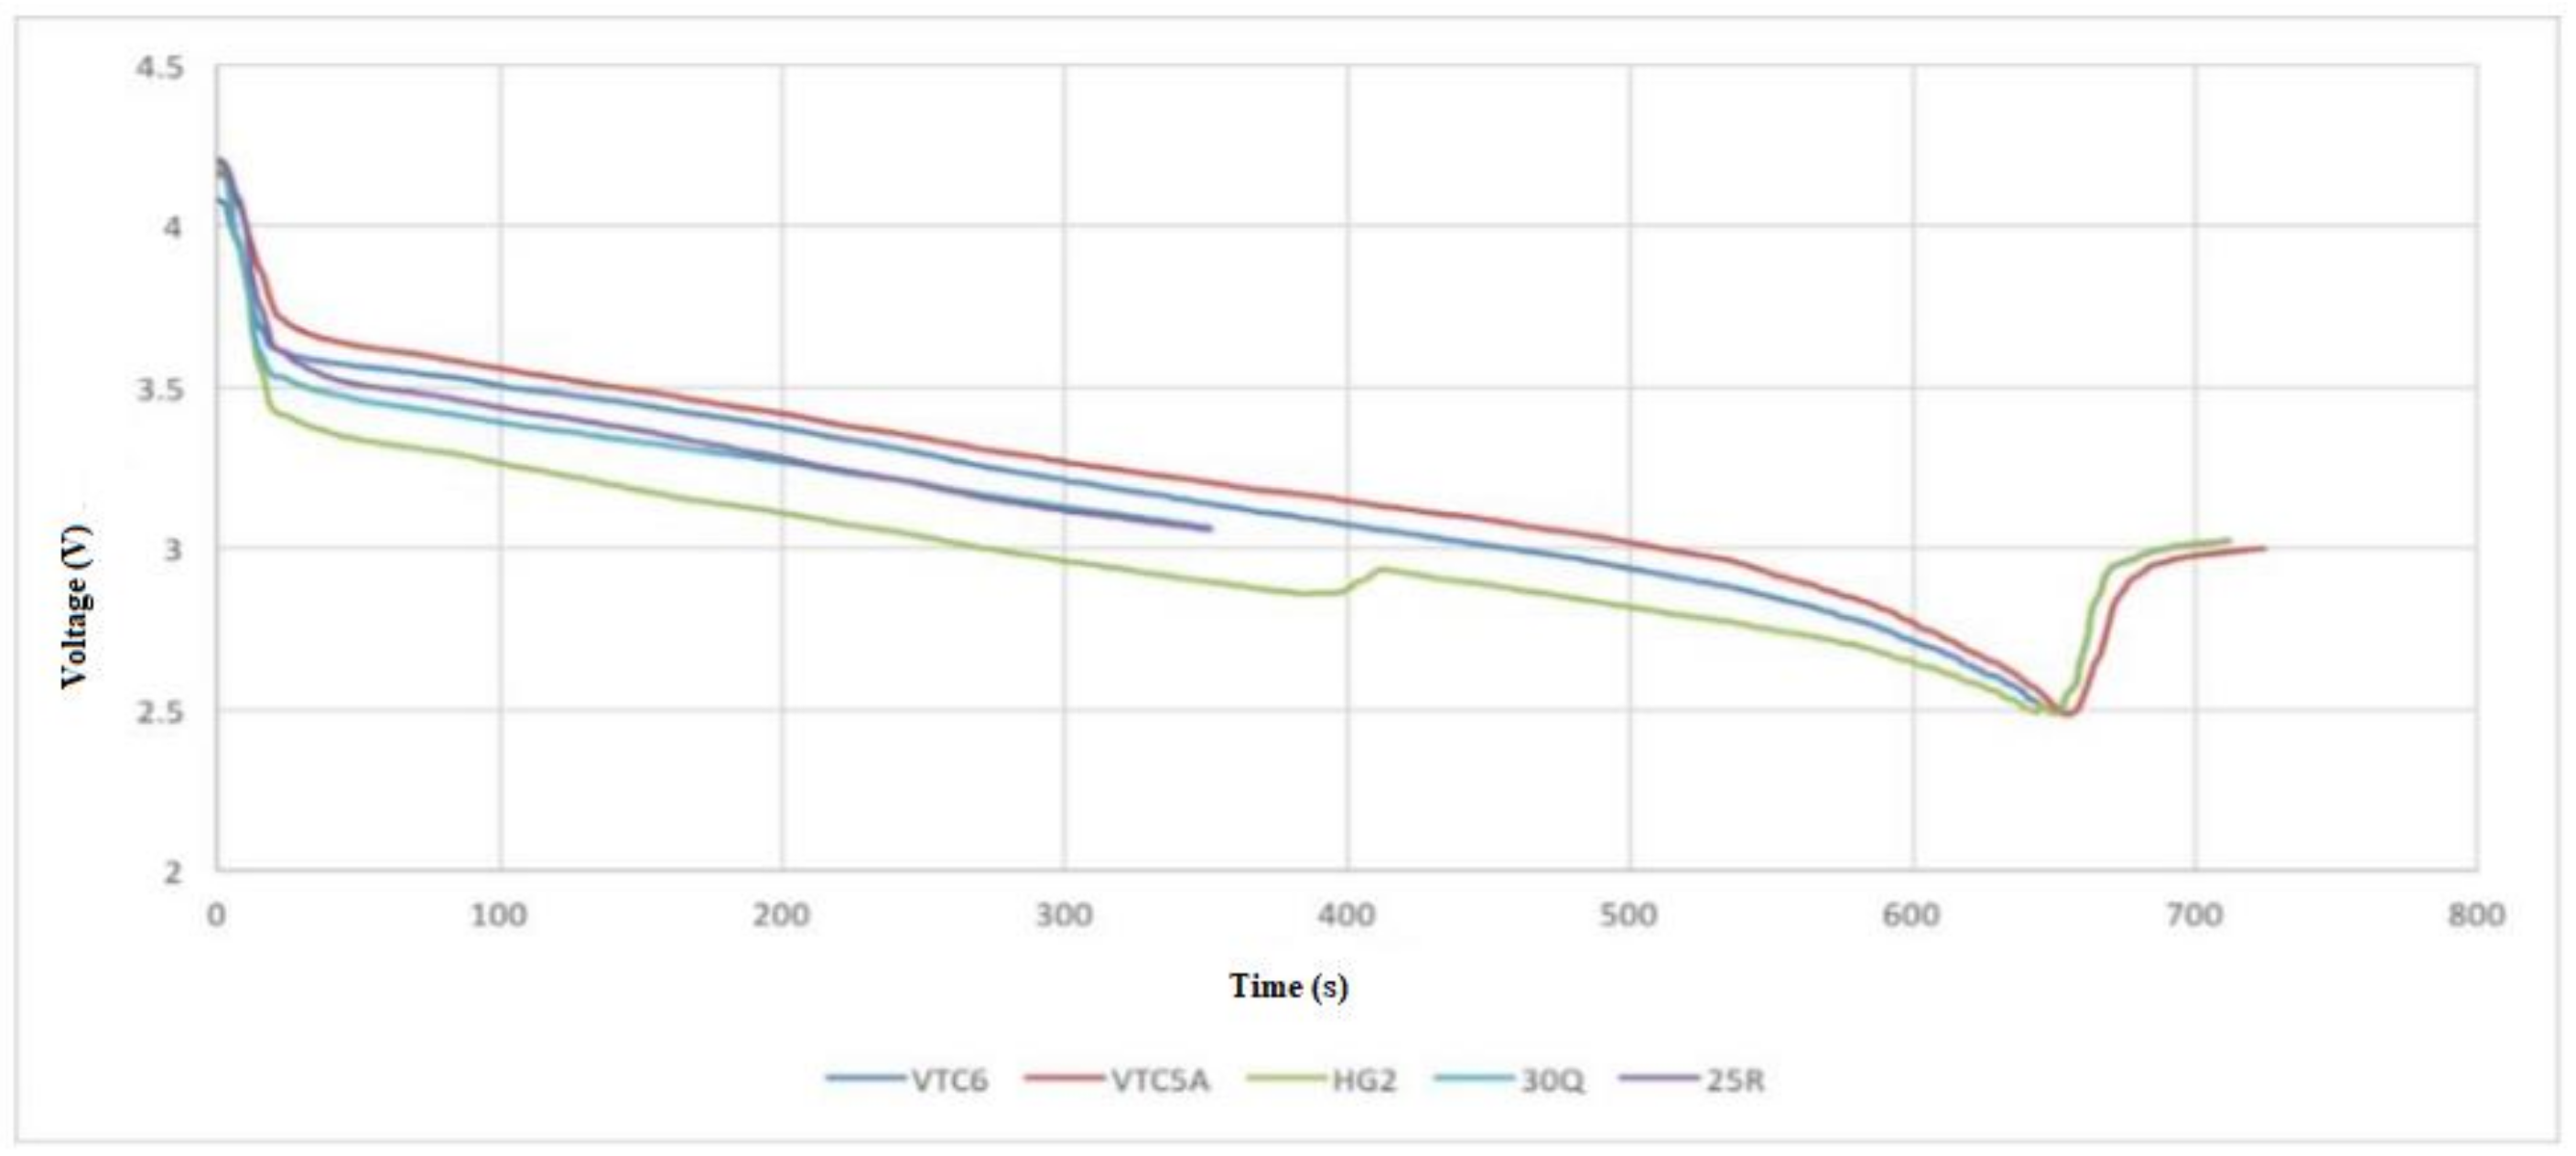
  • Test 1 was performed at continuous 15 A discharge with no active cooling applied. This test demonstrated that the 30Q, VTC6, and VTC5A gave better thermal performance than the HG2.
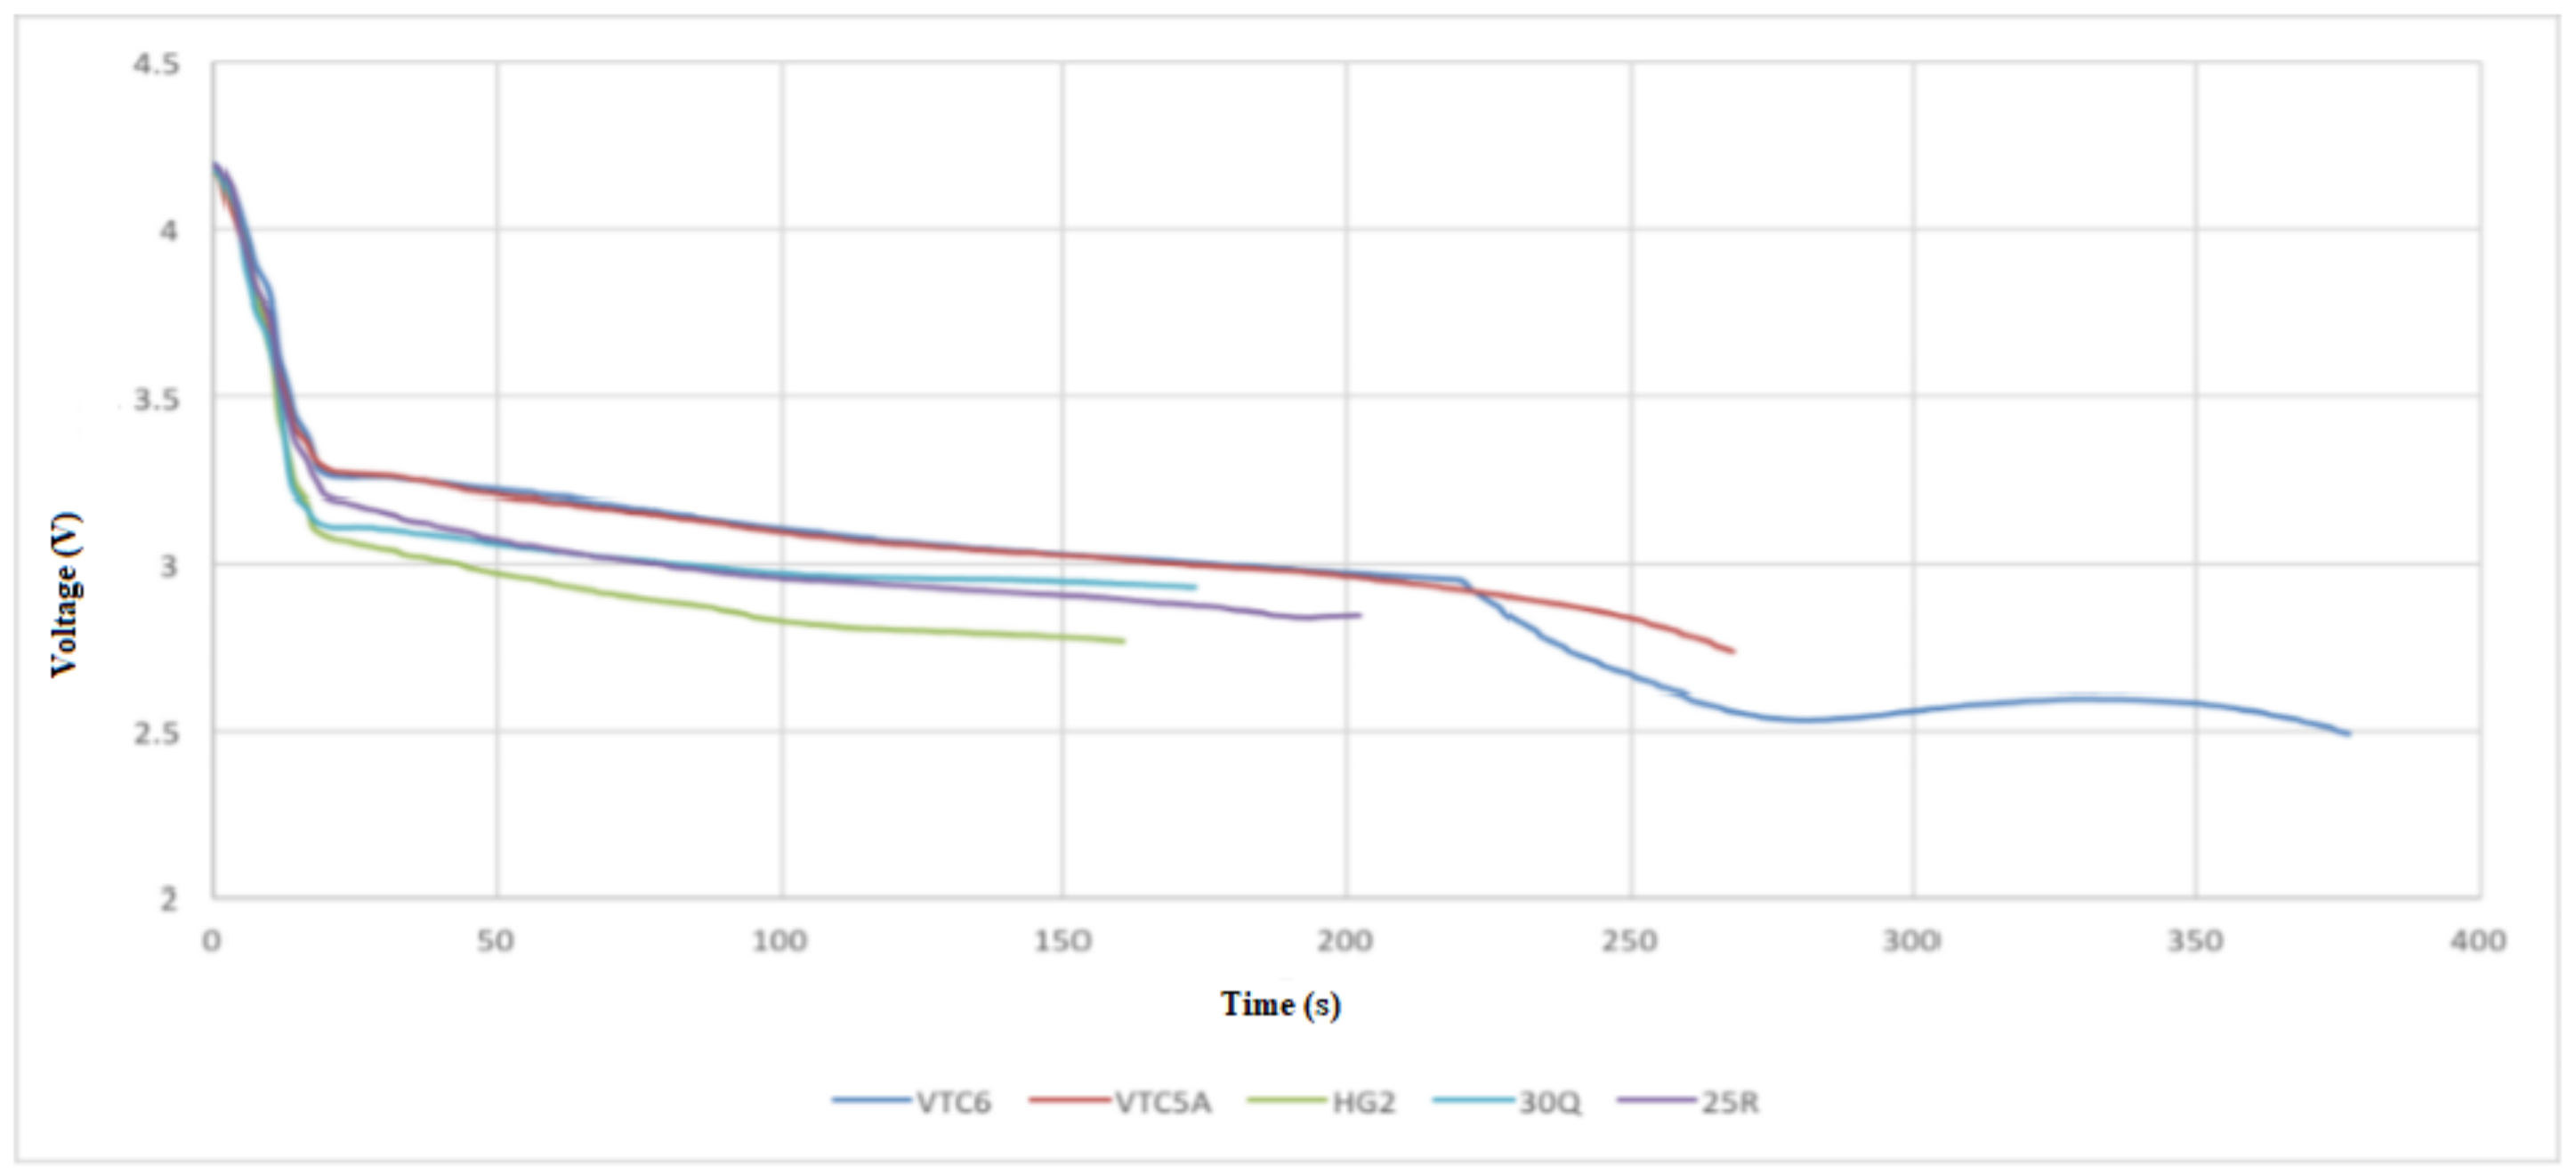
  • Test 2 was conducted at 30 A discharge current when no active cooling applied. In this test, the VTC5A outperformed the other cells, having the longest discharge time prior to arriving at the thermal cutoff point. The 25R and VTC6 performed equally well in the thermal tests. None of the cells under test was able to fully discharge at 30 A without reaching thermal cutoff.
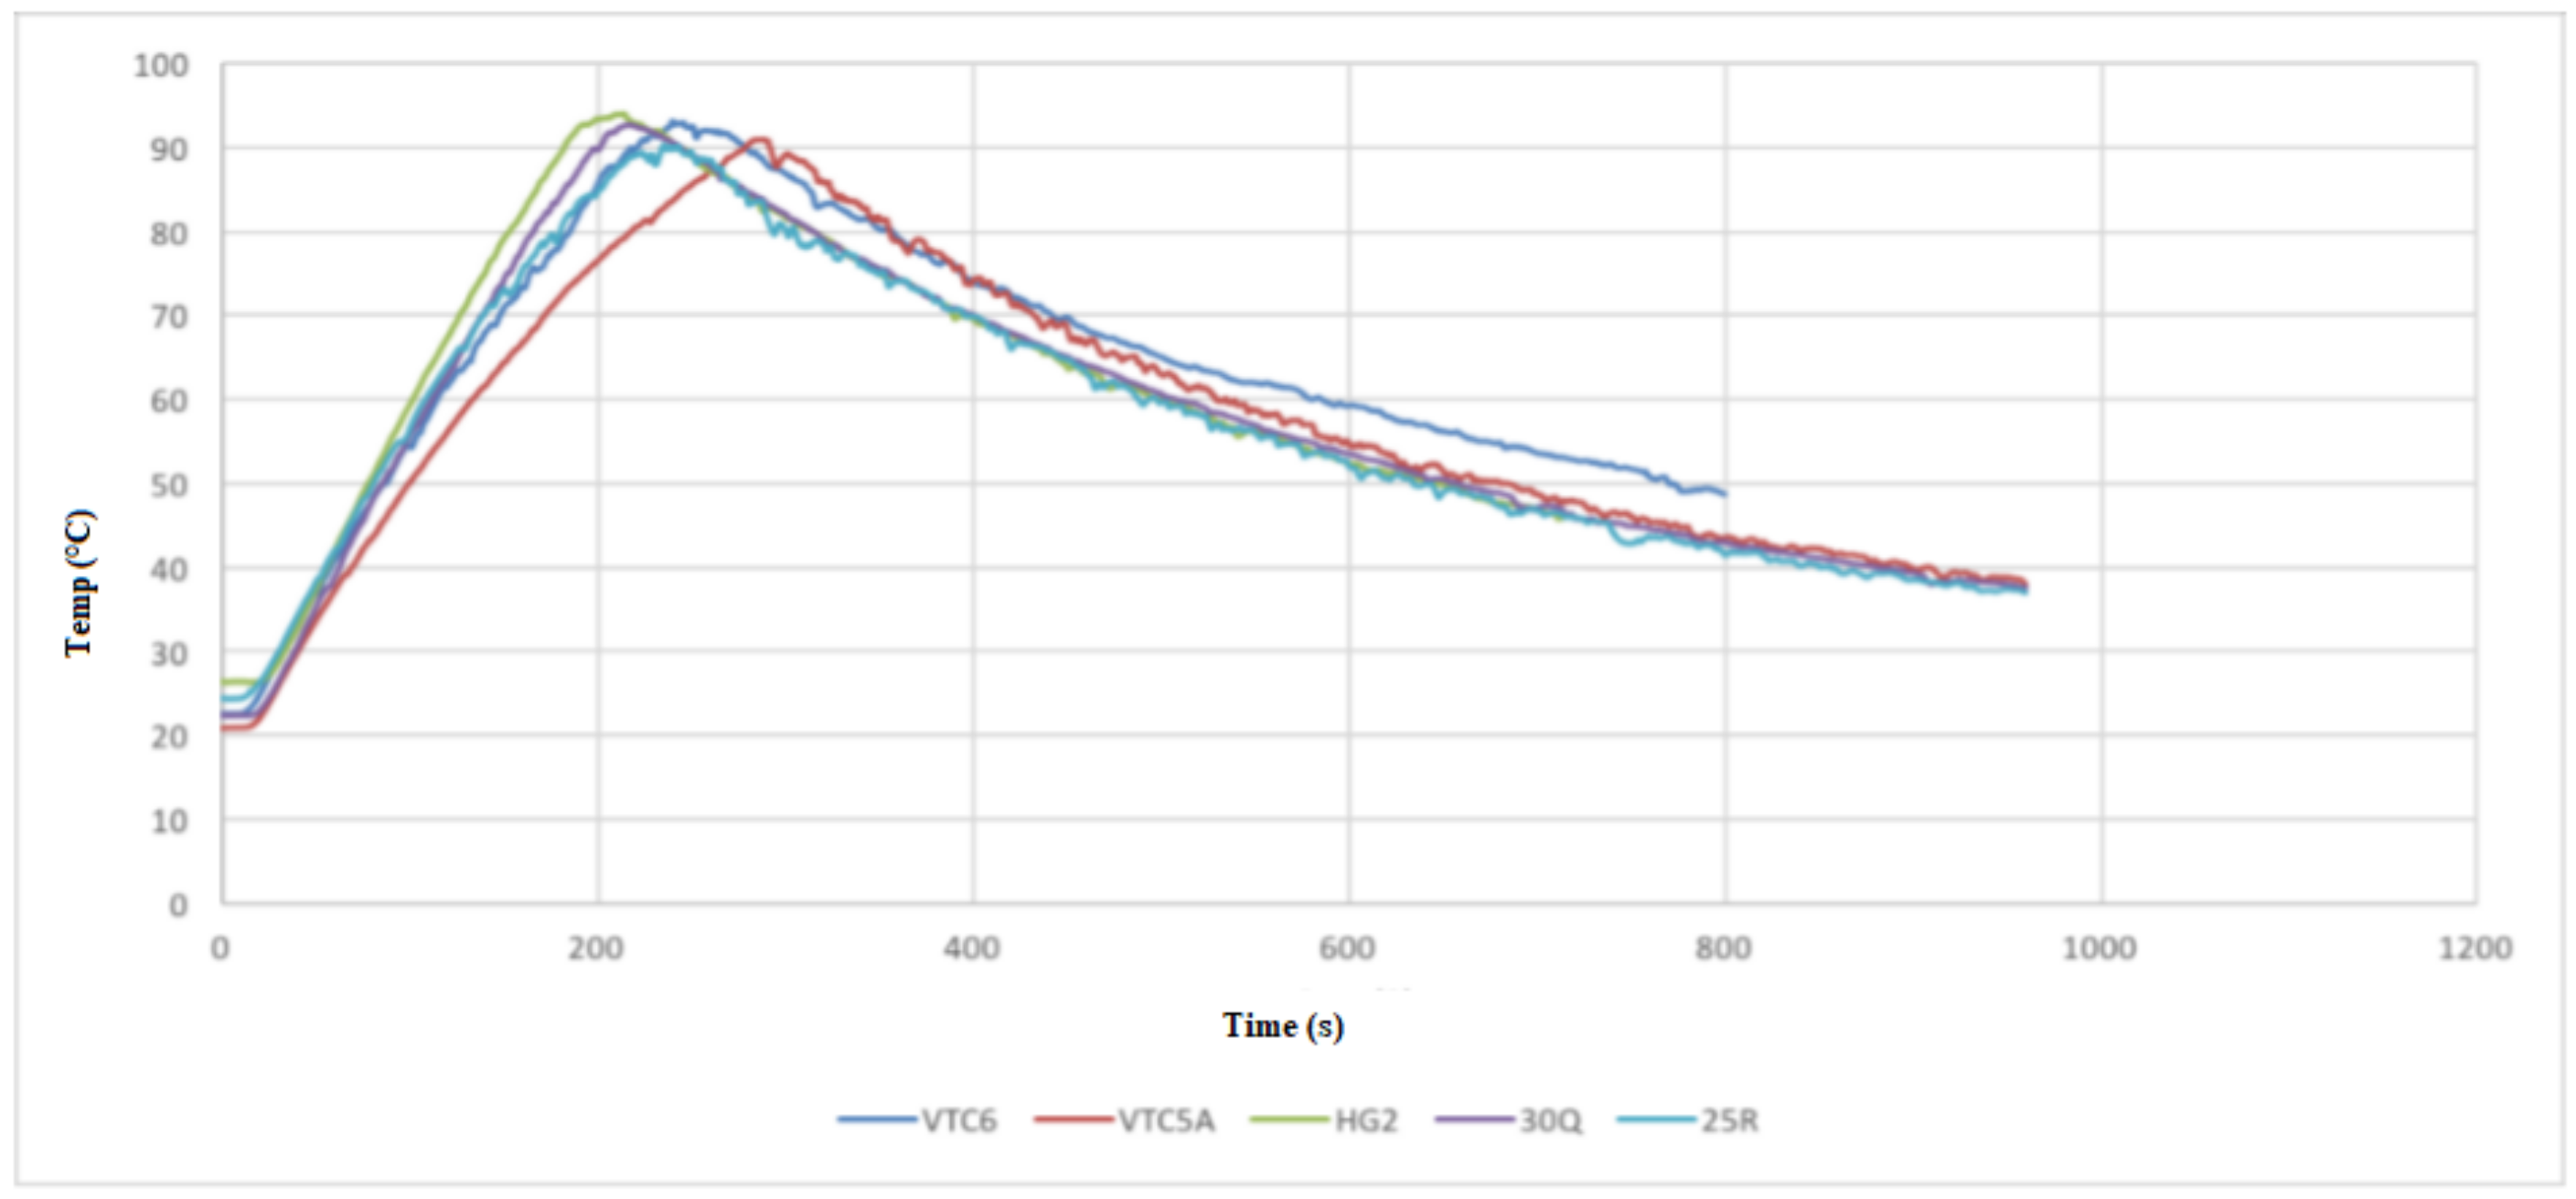
  • Test 3 was carried out at 15 A discharge current when active air cooling applied. Under this test conditions, all the cells performed very well, with the VTC5AV and VTC6 performing better than the rest. This mainly due to their low internal resistance, which appears in the increased voltage under load during the consistent inclination gradient at discharge. Similar to Test 3, the VTC5A had the best performance with longest discharge time before the module reaches the thermal cutoff point. The HG2 had the weakest performance with the shortest discharge time.
  • Test 4 was performed at 15 A discharge current when active air cooling applied. It is found when conducting this test that the VTC6 maintained the highest charge, taking more than 60 s longer to fully discharge because of its greater capacity. The VTC5A maintained a low voltage drop until the 50 s to 80 s mark, at which time the VTC6 kept a higher voltage than all other cells until the test finished.
  • Based on the 4 test applied, the VTC5A cell gave the best performance among other brands.
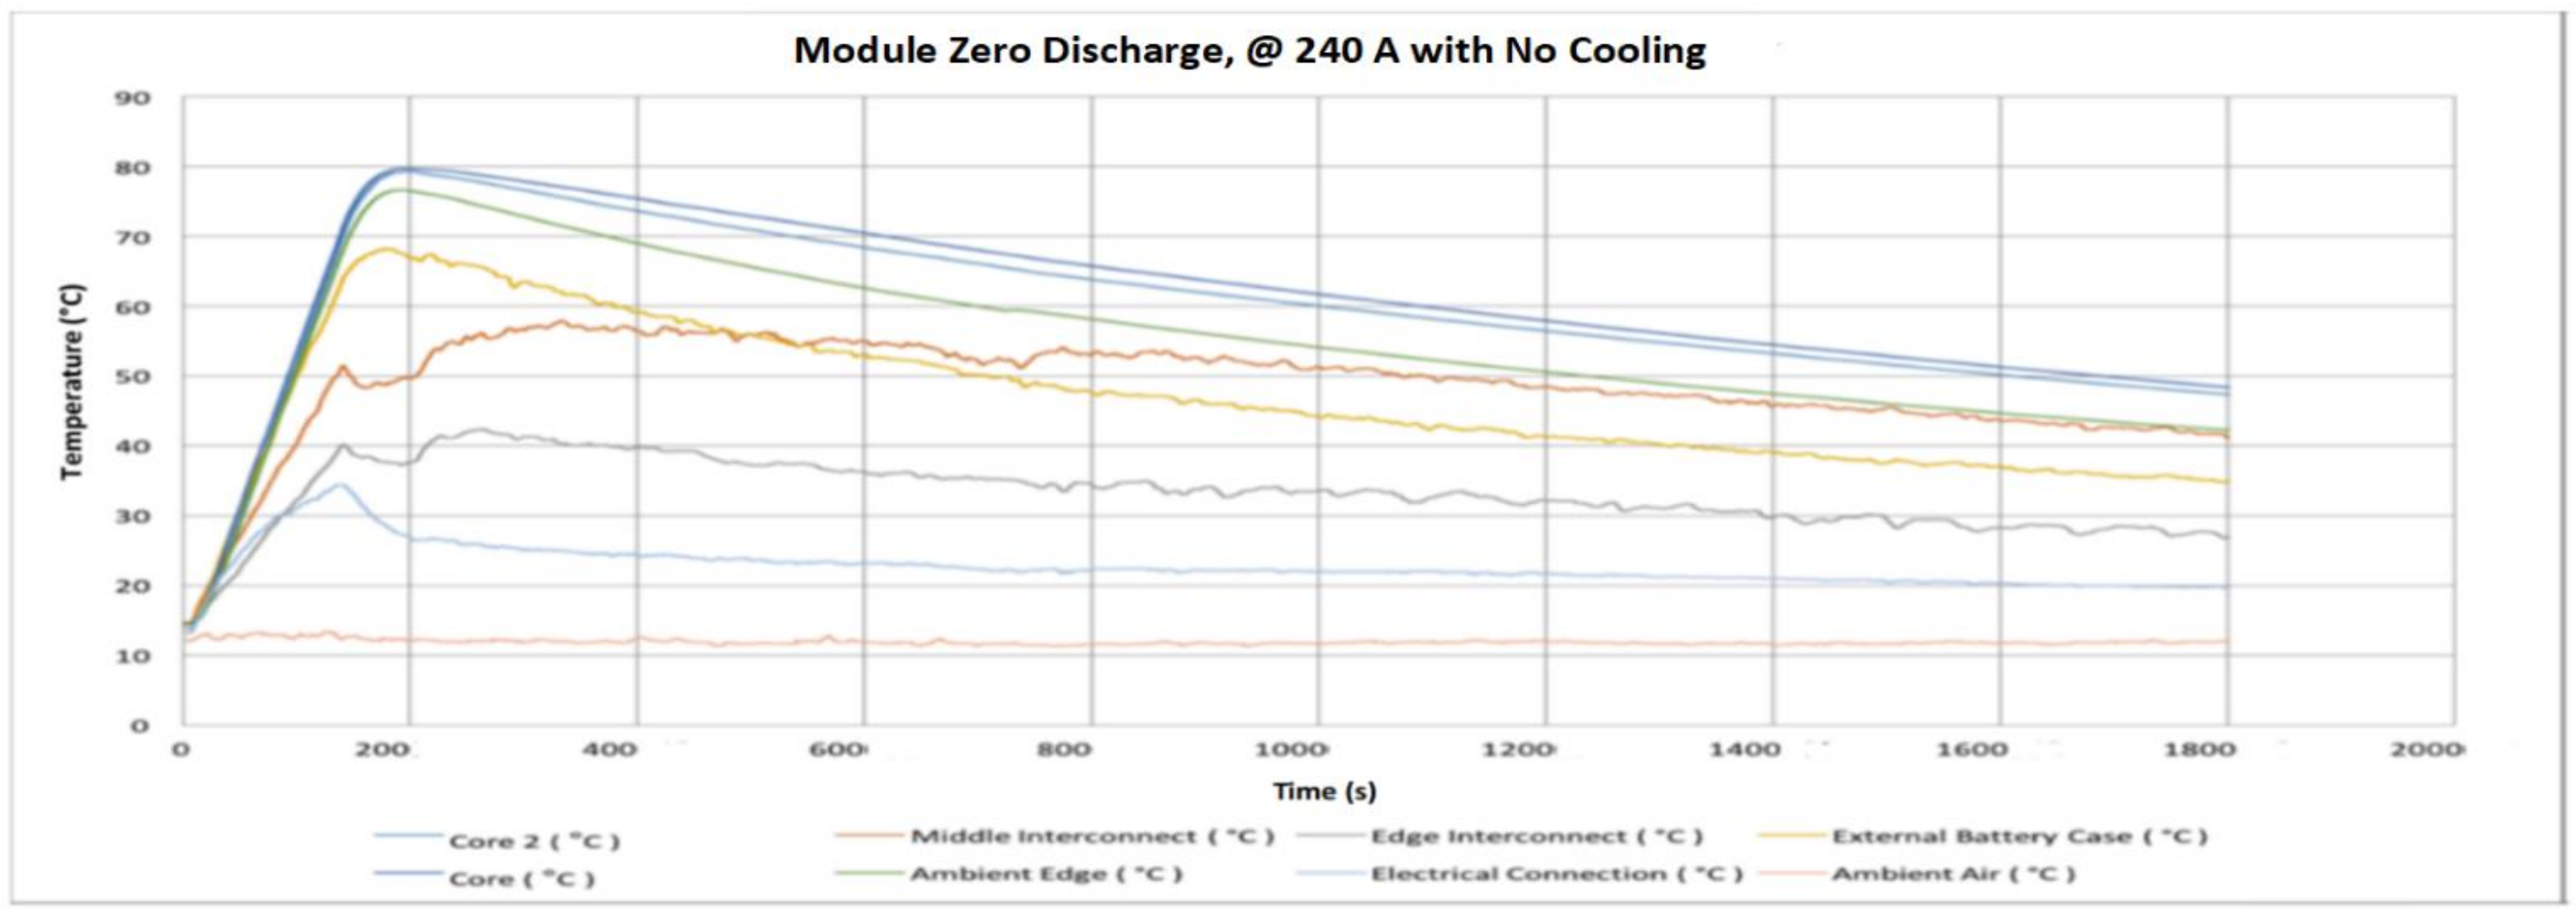
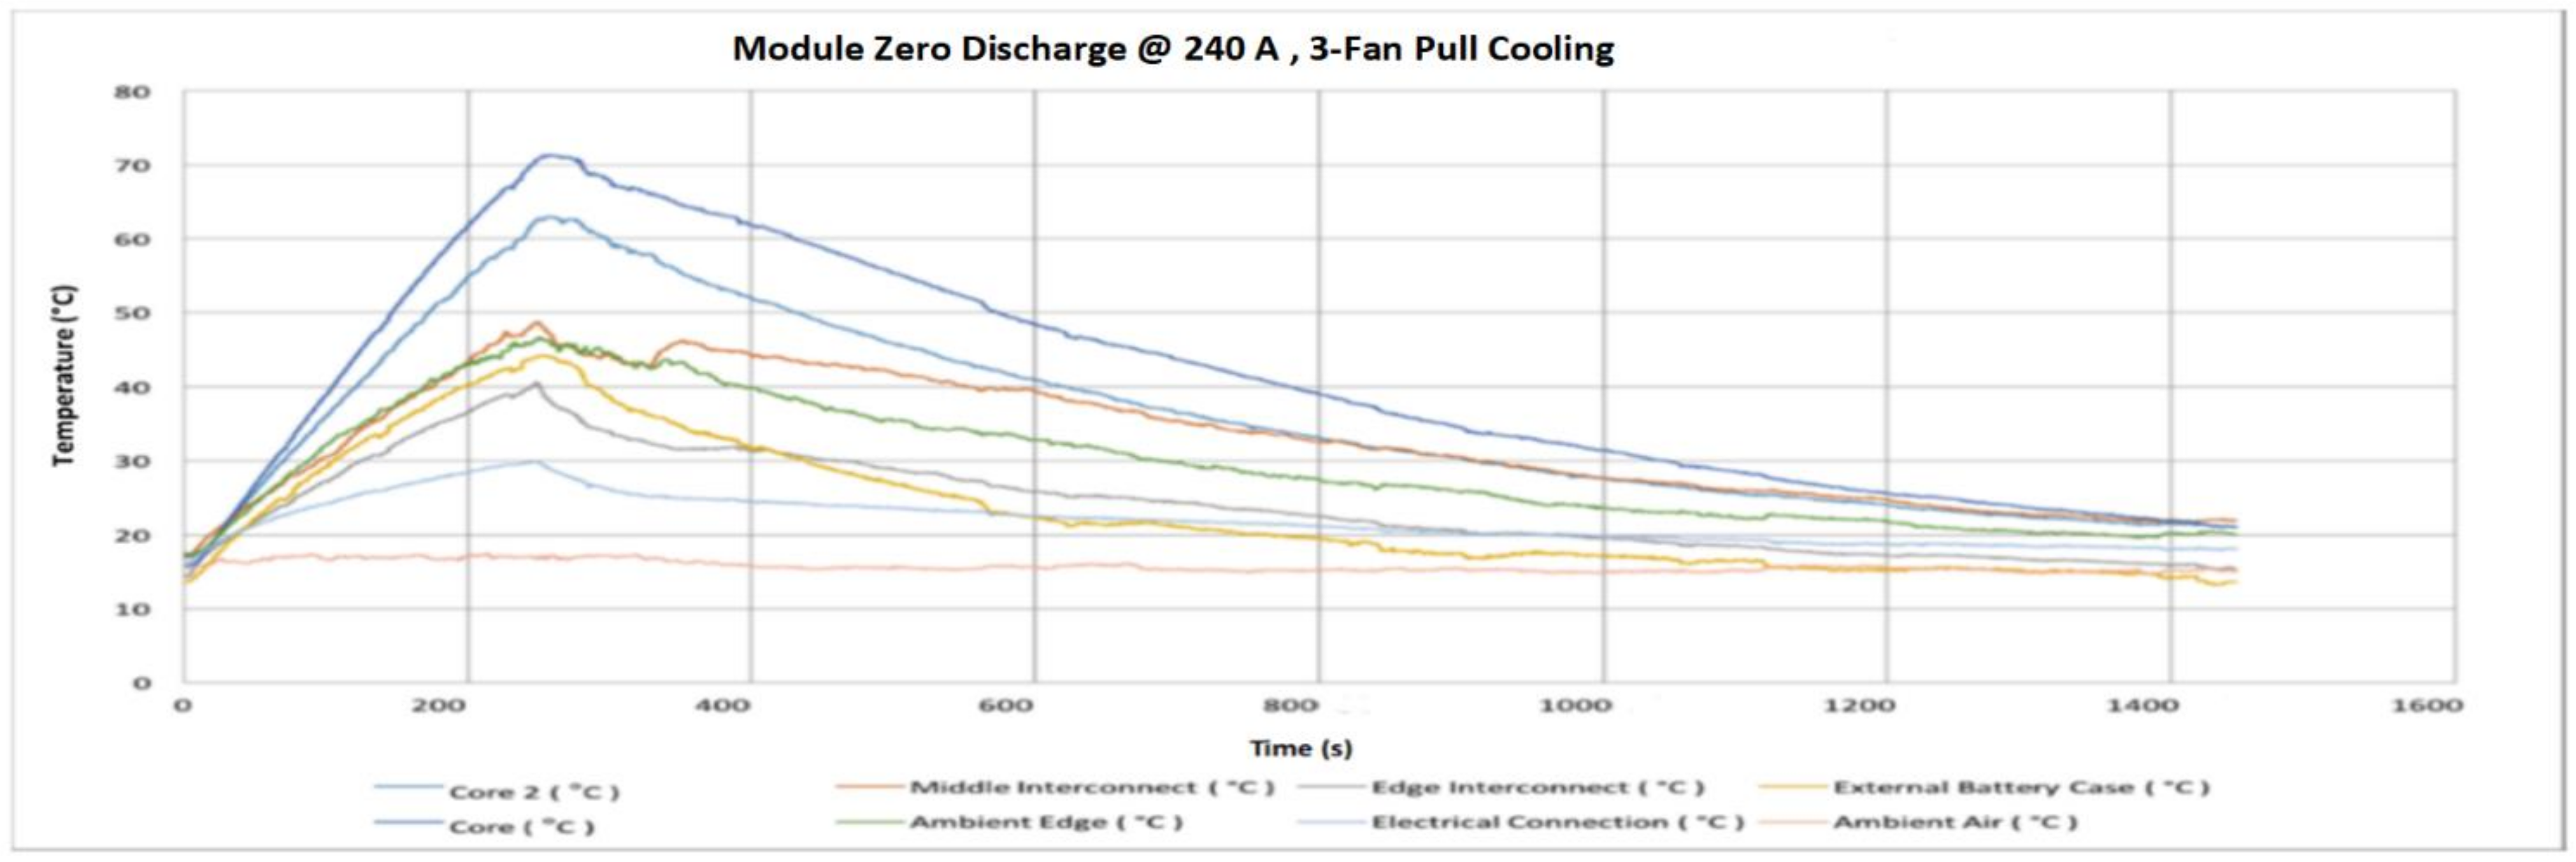
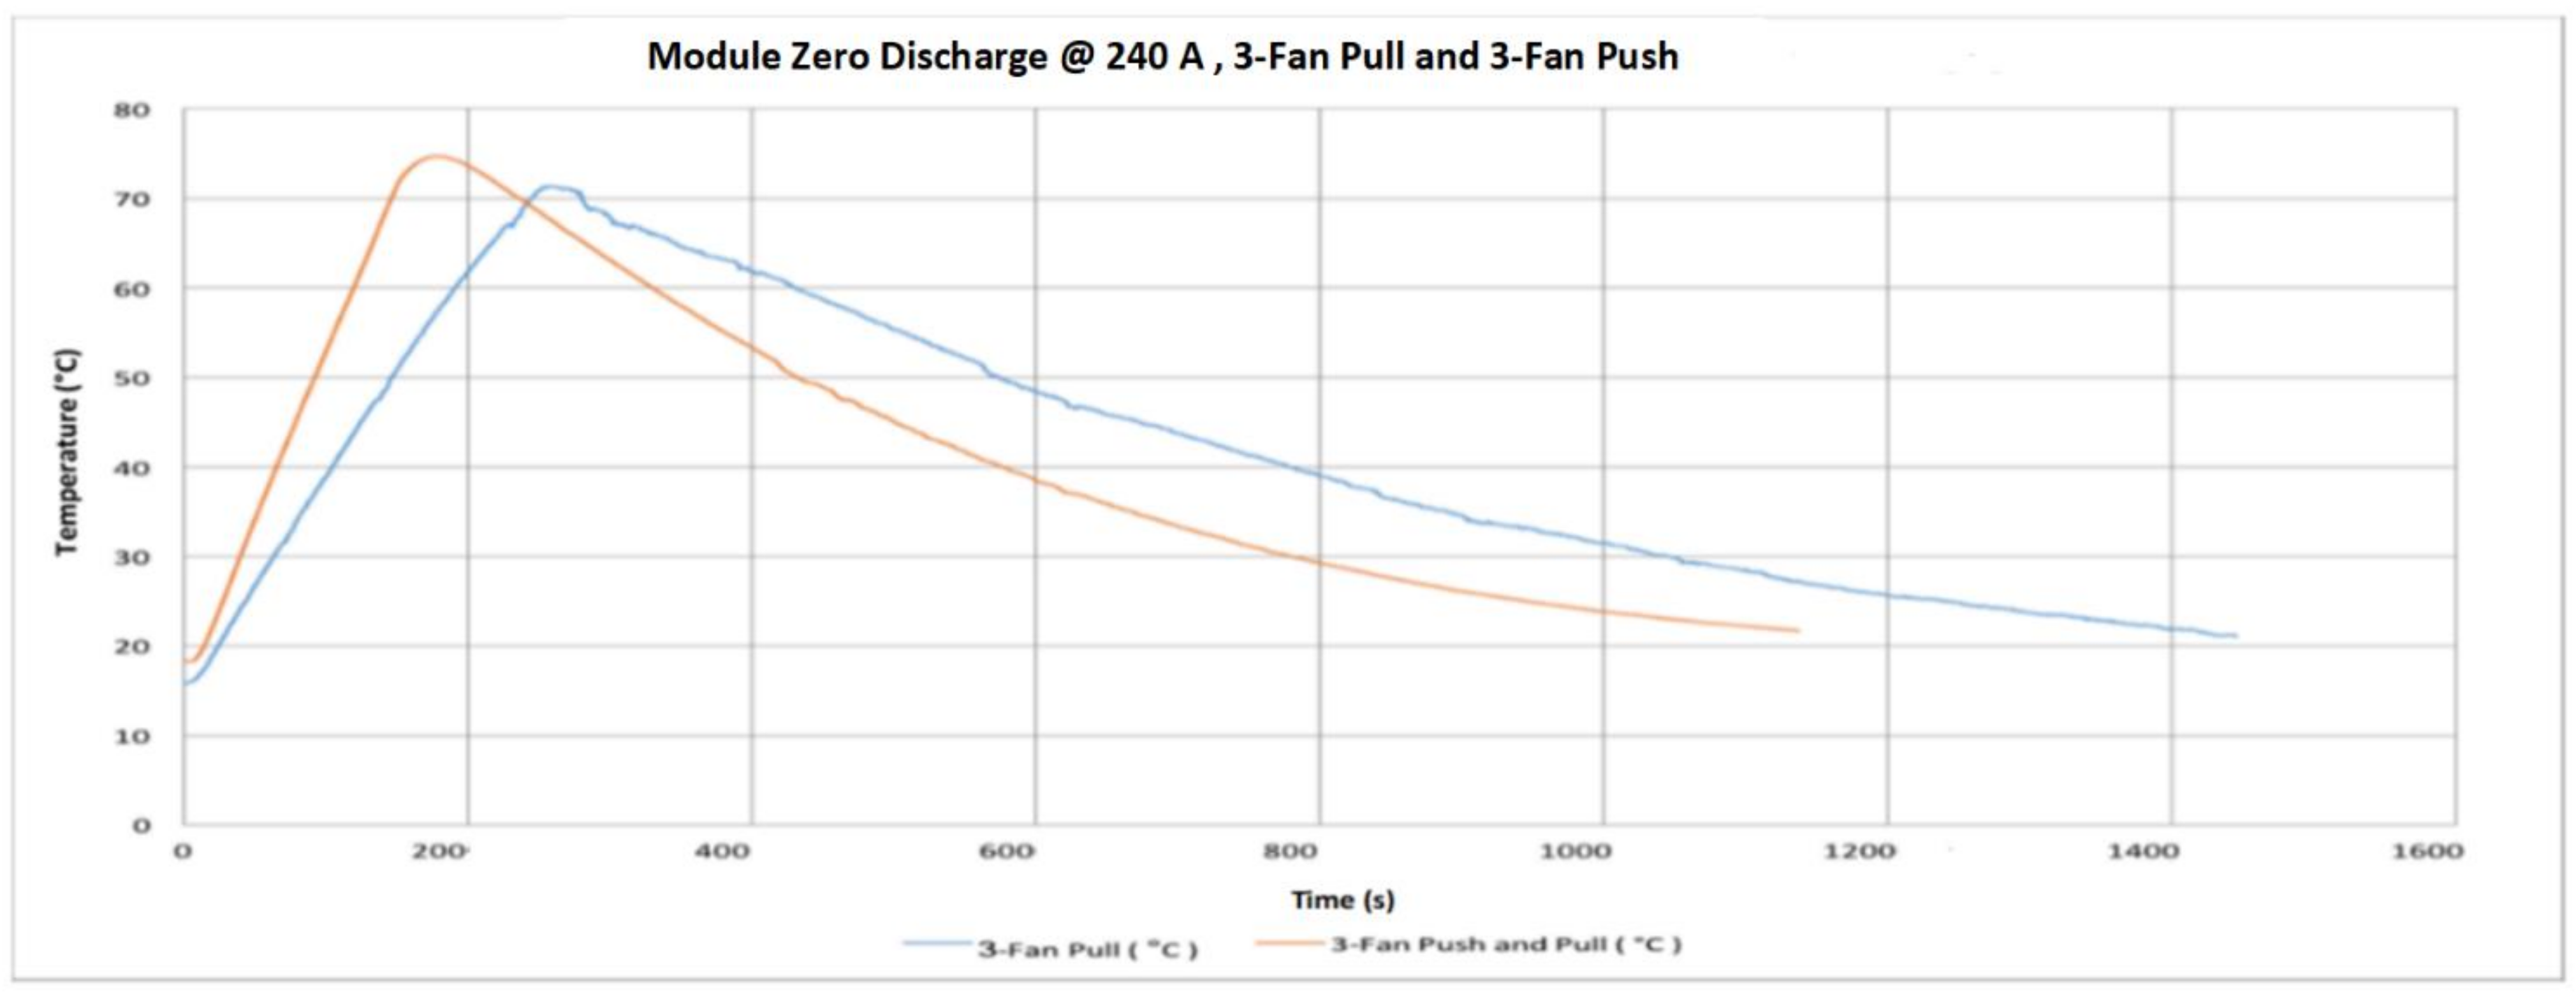
  • Air cooling system found very efficient in significantly cooling the modules because of the large temperature contrast between the surrounding air and the module. The cooling system is required to ensure operating within allowable limits.
  • Finally, the VTC6 battery cell was selected, due to its thermal superiority, for the subsequent tests with focus on thermal temperatures of the module. Thermocouples and thermal imaging used as well to monitor the module temperatures at different cooling approaches.
  • The key outcome of this further experiments indicates that a forced-air cooling system with a suitable battery pack can keep the temperature of the cell at a level that enables superior performance.

Author Contributions

Conceptualization, K.S. and M.D.; methodology, K.S. and B.A.; software, A.S., M.A. and K.S.; validation, M.D., K.S. and B.A.; formal analysis, M.A. and M.D.; investigation, K.S. and A.S.; resources, M.D. and K.S.; data curation, B.A. and M.A.; writing—original draft preparation, K.S. and A.S.; writing—review and editing, B.A., K.S., M.A. and A.S.; visualization, M.D., A.S., K.S. and M.A.; supervision, M.D. project administration, K.S., B.A.; funding acquisition, M.D., K.S. and B.A. All authors have read and agreed to the published version of the manuscript.

Funding

This research was funded by Taif University Researchers Supporting Project, grant number TURSP-2020/278, and the APC was funded by Mohammed Alqarni.

Acknowledgments

The authors would like to acknowledge the financial support received from Taif University Researchers Supporting Project Number (TURSP-2020/278), Taif University, Taif, Saudi Arabia.

Conflicts of Interest

The authors declare no conflict of interest.

References

  1. Ehsani, M.; Gao, Y.; Gay, S.E.; Emadi, A. Modern Electric Hybrid Electric and Fuel Cell Vehicles; CRC Press: Boca Raton, FL, USA, 2005. [Google Scholar]
  2. Charadsuksawat, A.; Laoonual, Y.; Chollacoop, N. Comparative Study of Hybrid Electric Vehicle and Conventional Vehicle Under New European Driving Cycle and Bangkok Driving Cycle. In Proceedings of the 2018 IEEE Transportation Electrification Conference and Expo, Asia-Pacific (ITEC Asia-Pacific), Bangkok, Thailand, 6–9 June 2018; pp. 1–6. [Google Scholar]
  3. Markowitz, M. “Wells to Wheels: Electric Car Efficiency”, Energy Matters. Available online: https://matter2energy.wordpress.com/2013/02/22/wells-towheels-electric-car-efficiency/ (accessed on 26 March 2018).
  4. Lu, L.; Han, X.; Li, J.; Hua, J.; Ouyang, M. A review on the key issues for lithium-ion battery management in electric vehicles. J. Power Sources 2013, 226, 272–288. [Google Scholar] [CrossRef]
  5. Zolot, M.D.; Kelly, K.; Keyser, M.; Mihalic, M.; Pesaran, A.; Hieronymus, A. Thermal evaluation of the Honda Insight battery pack. In Proceedings of the Intersociety Energy Conversion Engineering Conference SAE, Savannah, GA, USA, 29 July–2 August 2001; pp. 923–928. [Google Scholar]
  6. Kim, G.-H.; Pesaran, A. Battery Thermal Management Design Modeling. World Electr. Veh. J. 2007, 1, 126–133. [Google Scholar] [CrossRef] [Green Version]
  7. Wu, M.-S.; Liu, K.H.; Wang, Y.-Y.; Wan, C.-C. Heat dissipation design for lithium-ion batteries. J. Power Sources 2002, 109, 160–166. [Google Scholar] [CrossRef]
  8. Peng, X.; Cui, X.; Liao, X.; Garg, A. A Thermal Investigation and Optimization of an Air-Cooled Lithium-Ion Battery Pack. Energies 2020, 13, 2956. [Google Scholar] [CrossRef]
  9. Formula SAE, “Formula SAE Rules”, Formula SAE. Available online: https://www.fsaeonline.com/content/2017-18%20FSAE%20Rules%20PRELIMINARY.pdf (accessed on 30 June 2020).
  10. Kim, Y. Design and Management of Energy-Efficient Hybrid Electrical Energy Storage Systems; Springer International Publishing: Cham, Switzerland, 2014. [Google Scholar]
  11. Sehil, K. A Super-Capacitor-Based Energy Storage for Quick Variation in Stand-Alone PV Systems. Ph.D. Thesis, Brunel University, London, UK, 2018. [Google Scholar]
  12. Crompton, T. Battery Reference Book; Elsevier: Amsterdam, The Netherlands, 2000. [Google Scholar]
  13. Sehil, K.; Darwish, M.; Marouchos, C.C.; Jeans, W.C. Comparative Analysis of High Voltage Battery Pack Cells for Electric Vehicle. In Proceedings of the 2020 55th International Universities Power Engineering Conference (UPEC), Torino, Italy, 1–4 September 2020; pp. 1–6. [Google Scholar]
  14. Schainker, R.B. Executive overview: Energy storage options for a sustainable energy future. In Proceedings of the IEEE Power Engineering Society General Meeting, Denver, CO, USA, 6–10 June 2004; pp. 2309–2314. [Google Scholar] [CrossRef]
  15. Kusko, A.; Dedad, J. Short-term, long-term, energy storage methods for standby electric power systems. In Proceedings of the Fourtieth IAS Annual Meeting, Conference Record of the 2005 Industry Applications Conference, Hong Kong, China, 2–6 October 2005; pp. 2672–2678. [Google Scholar] [CrossRef]
  16. Alamri, B.R.; Alamri, A.R. Technical review of energy storage technologies when integrated with intermittent renewable energy. In Proceedings of the 2009 International Conference on Sustainable Power Generation and Supply, Nanjing, China, 6–7 April 2009; pp. 1–5. [Google Scholar]
  17. Perrin, M.; Malbranche, P.; Mattera, F.; Simonin, L.; Sauer, D.U.; Lailler, P.; Joessen, A.; Willer, B.; Dahlen, M.; Ruddell, A.; et al. Evaluation and perspectives of storage technologies for PV electricity. In Proceedings of the 3rd World Conference on Photovoltaic Energy Conversion, Osaka, Japan, 11–18 May 2003; pp. 2194–2197. [Google Scholar]
  18. Glaize, C.; Geniès, S. Lithium Batteries and Other Electrochemical Storage Systems; Wiley: New York, NY, USA, 2013. [Google Scholar]
  19. Tarascon, J.-M.; Armand, M. Issues and challenges facing rechargeable lithium batteries. Nat. Cell Biol. 2001, 414, 359–367. [Google Scholar] [CrossRef]
  20. Sun, C. Advanced Battery Materials Hoboken; Wiley: New York, NY, USA, 2019. [Google Scholar]
  21. Young, K.; Wang, C.; Wang, L.Y.; Strunz, K. Electric Vehicle Battery Technologies. In Electric Vehicle Integration into Modern Power Networks; Springer: New York, NY, USA, 2013; pp. 15–56. [Google Scholar]
Figure 1. Basic structure of the electric vehicle power train [1].
Energies 14 01556 g001
Figure 2. Illustrative configuration of general electric vehicles (EVs) [1].
Energies 14 01556 g002
Figure 3. Comparison of size and weight of energy density [19].
Energies 14 01556 g003
Figure 4. Single cell tests: voltages from 15 A discharge with no cooling.
Energies 14 01556 g004
Figure 5. Single cell tests: temperatures from 15 A discharge with no cooling.
Energies 14 01556 g005
Figure 6. Single cell tests: voltages from 30 A discharge with no cooling.
Energies 14 01556 g006
Figure 7. Single cell tests: temperatures from 30 A discharge with no cooling.
Energies 14 01556 g007
Figure 8. Single cell tests: voltages from 15 A discharge with active air cooling.
Energies 14 01556 g008
Figure 9. Single cell tests: temperatures from 15 A discharge with active air cooling.
Energies 14 01556 g009
Figure 10. Single cell tests: voltages from 30 A discharge with active air cooling.
Energies 14 01556 g010
Figure 11. Single cell tests: temperatures from 30 A discharge with active air cooling.
Energies 14 01556 g011
Figure 12. Battery pack with high voltage.
Energies 14 01556 g012
Figure 13. Module zero discharge, 240 A with no cooling.
Energies 14 01556 g013
Figure 14. Module zero discharge, 240 A 3-fan pull cooling.
Energies 14 01556 g014
Figure 15. Module zero discharge, 240 A 3-fan pull and 3-fan push cooling.
Energies 14 01556 g015
Figure 16. Module zero discharge, 240 A 3-fan pull vs. 3-fan push and pull cooling.
Energies 14 01556 g016
Figure 17. Module zero discharge, 240 A 2-fan pull cooling.
Energies 14 01556 g017
Figure 18. Module zero discharge, 240 A 1-fan pull cooling.
Energies 14 01556 g018
Figure 19. Module zero discharge, fan configuration cooling delta comparison.
Energies 14 01556 g019
Figure 20. Thermal images: (a) 1-fan front view; (b) 1-fan rear view; (c) 2-fan front view; (d) 2-fan rear view.
Energies 14 01556 g020
Figure 21. Module zero discharge, 72 A 2-fan pull cooling.
Energies 14 01556 g021
Figure 22. Thermal images. (a) Front of module zero, 72 A discharge; (b) rear of module zero, 72 A discharge.
Energies 14 01556 g022
Table 2. Lithium-polymer (Li-po) vs. lithium-ion (Li-ion).
Battey TypeAdvantagesDisadvantages
Lithium Polymer
(Li-po)
Robust
Flexible
Low profile
Less likely to leak electrolyte
More expensive to manufacture
Store less energy
Shorter lifespan
Lithium Ion
(Li-ion)
Generally higher energy density
Better power performance
No memory effect *
Cheaper to manufacture
More prone to suffer from aging.
More likely to combust if
overcharged
* Where a cell stores less charge from poor charging habits.
Table 3. Requirements of battery pack.
Battery Pack Specification
Max voltage (V)400
Minimum discharge current (A)200
Capacity (kWh)7
Output power (kW)80
Table 4. Selection of the five best-fitting Li-ion cells [21].
Discharge (A)
Cell NamemAhFormatModule Required in ParallelPulseContinuousPeak Pack
Sony VTC63000Cylindrical63015180
Sony VTC5A2500Cylindrical73020210
LG DB 18650 HG23000Cylindrical62020120
Samsung 18650 30Q3000Cylindrical6151590
Samsung 18650 25R2500Cylindrical62020120
Table 5. Test conditions of single cell.
Test1234
Start voltage (V)4.004.004.004.00
End voltage (V)2.502.502.502.50
Current (A)15301530
Use of active coolingNoNoYesYes
Publisher’s Note: MDPI stays neutral with regard to jurisdictional claims in published maps and institutional affiliations.

