1. Introduction
The relationship between food production, energy and the environment is currently an essential issue faced by agriculture [
1]. Soil as a means of crop production is subject to many relationships associated with nutrition of population, environmental cleanliness as well as the need to ensure a sustainable source of energy [
2]. The problem is escalating due to the necessity to secure food for the growing population [
3,
4,
5], while responding to changes in farming conditions as a result of climate change [
6,
7]. A need arises to more accurately specify the production that will be politically justifiable. It turns out that the priority for political decision-making is the food and nutrition security of the population, but a wide-ranging discussion has emphasized the additional potential of energy generation from agricultural products. The entire process has not been adequately specified as yet due to insufficient knowledge of the context of agricultural production with regard to the referred to aspects and diverse conditions [
8]. Discussions have been opened up on the use of straw for energy purposes [
9], but there are also other matters to be addressed apart from the sufficient volume of production, which also concern the organic matter in soil [
10,
11].
Agricultural production has diverse impacts on the environment, economy and energy production depending on the relevant conditions [
12]. Determination of soil and climatic conditions for crop production and their impact on energy and the environment are crucial for drafting the supporting documents for the purpose of analyzing the relationship between the energy production possibilities and the environment as well as for agricultural policy-making. The existing data provide good quality information regarding the individual crops in the form of a case study helping to identify mutual relationships. However, a systematic overview of crop production as a whole, including energy production and links to the environment, is missing. The submitted paper uses the comprehensive information on land resources in the Czech Republic and draws up mutual interactions of economic and energy nature that are dependent on the main characteristics of climatic and soil conditions in the Czech Republic. The paper determines the energy and economic margin based on the cost–benefit analysis by crop production technology, and also a comprehensive relationship to the environment based on the life cycle assessment (LCA) analysis for a total of 18 impacts in line with the midpoint analysis. Matters of evaluation of production with respect to decision-making on support, location and potential of agricultural crop production also for energy generation are addressed by numerous recent publications [
13,
14,
15]. Multiple issues arise that are difficult to resolve by the agricultural policy unless the main economic, energy and environmental context is known well in advance [
8].
These matters are extensively covered by the literature. Nonetheless, for the evaluation of all relationships, no comprehensive data are available on the entire territory and production structure. These issues are therefore mostly reflected only with respect to the production of one or more crops based on a model solution or a case study [
14].
All the explored parameters, namely the economic, energy as well as environmental parameters, should be subjected to a comprehensive analysis in order to find the optimal future use of crops. Razm [
16] in his production assessment used the LCA model in order to achieve the Pareto optimality in assessing the environmental and social impacts of crop production. This procedure can also be applied to seeking the optimal production when making decisions on the use of biofuels.
Some countries have searched for the missing framework for crop production assessment—e.g., development of supporting documents for agricultural crop production in Denmark should be based on a review and an assessment of publicly available databases, inventory reports and scientific literature on measures in the field of governance and their effectiveness with respect to legislation, agreements, conventions and standardizations (Bentsen [
17]). The main reason behind this is the necessity to promote the environmental sustainability represented by greenhouse gas emissions from the agricultural sector, soil carbon sequestration, water quality, and biological diversity.
The bioeconomy plays an important role in replacing fossil fuels and is the key factor for sustainability. Wohlfahrt [
8] stresses the socio-ecological concept of its exploration, the importance of knowledge of individual territories, flexibility of business activities of subsystems and local regulatory instruments. This justifies the necessity to develop an integrated model approach with various subsystems and heterogeneity. This builds on the assessment of agricultural land composition and its configuration.
2. Materials and Methods
The energy plan of the Czech Republic provisionally estimates that with a decrease in the production of biofuels from 11,093 TJ in 2020 to 9276 TJ in 2030—i.e., a decrease by approximately 15%—that biogas production should fall from 22,856 to 20,166 TJ—i.e., by 12% [
18]. This plan states that the value of agricultural production is very uncertain in the future and depends mainly on the setting of the rules of the Common Agricultural Policy (CAP). Further development of the trend is based on a careful evaluation of all aspects of energy production, including in terms of the function of energy production in the landscape.
Overall energy effectiveness of production is conditional on the choice of crops in the given location, while respecting local conditions which depend on the particular type of farming of agricultural holdings and may vary according to the needs of animal production. Fundamental studies necessary to derive energy indicators have been addressed by a number of authors [
19,
20,
21], and data for the Czech Republic from the IAEI survey and Preininger [
22] were used in this analysis.
In the Czech Republic, a permanent monitoring system of agricultural production was developed based on the evaluation of evaluated soil ecological units (ESEUs, in the Czech Republic called BPEJ, introduced in the Czech Republic in 1970). The system is based on the classification of climatic factors within the climatic region (
Appendix C,
Table A2, the main soil unit (MSU (HPJ)), describing the main pedological characteristics of soil, and on the description of terrain configuration: slope (°), deep of the soil (cm), stoniness (%), and by the area in the Czech Republic [
23]. MSUs are laid down in a decree [
24], but more information is provided by the tracking of the Research Institute for Soil and Water Conservation [
25]. In the Czech Republic, a total of 2199 ESEUs have been classified that are mutually compatible throughout the territory of the Czech Republic. Based on the definition of these units, a paper was elaborated in order to cast more light on the links between the production and soil-climatic conditions—e.g., the modification of economic indicators based on production functions [
26]. Even though the evidence of ESEU is domestic, the obtained generalized information can also be used for assessments in other countries.
Environmental indicators are essential to assess any production. The LCA assessment of crop growing impacts is described, e.g., by [
27,
28,
29,
30], and preparations are carried out for individual evaluation of technologies for the size of emissions, especially CO
2 [
31]
.This study is based on the values included in the Agri-footprint 4.0 database [
32] and impact categories of the ReCiPe method were used. Model processes, based on Agri-footprint database processes, were modified on the basis of specific data for the Czech Republic. The adequacy of the modified processes was verified by comparison with the results of the original Agri-footprint processes and the Ecoinvent 3 database.
The data included in the national database of soil economic information were used to set the main yields and inputs and are subsequently updated in line with the soil and climatic conditions in the Czech Republic. The statistical survey is based on a sample cost survey of approximately 250 agricultural enterprises and the results are processed according to the IAEA methodology [
33,
34].
Information on crop yields and costs on individual soil-climatic conditions was used to calculate total emissions in individual categories according to the Agri-footprint database [
32] and to calculate crop production in MJ. The resulting ratio was assessed against the description of soils in the Czech Republic [
35].
The current papers add more information on ESEU and thus offer a comprehensive picture of mutual inter-relationship of economic, energy and environmental aspects [
36,
37,
38].
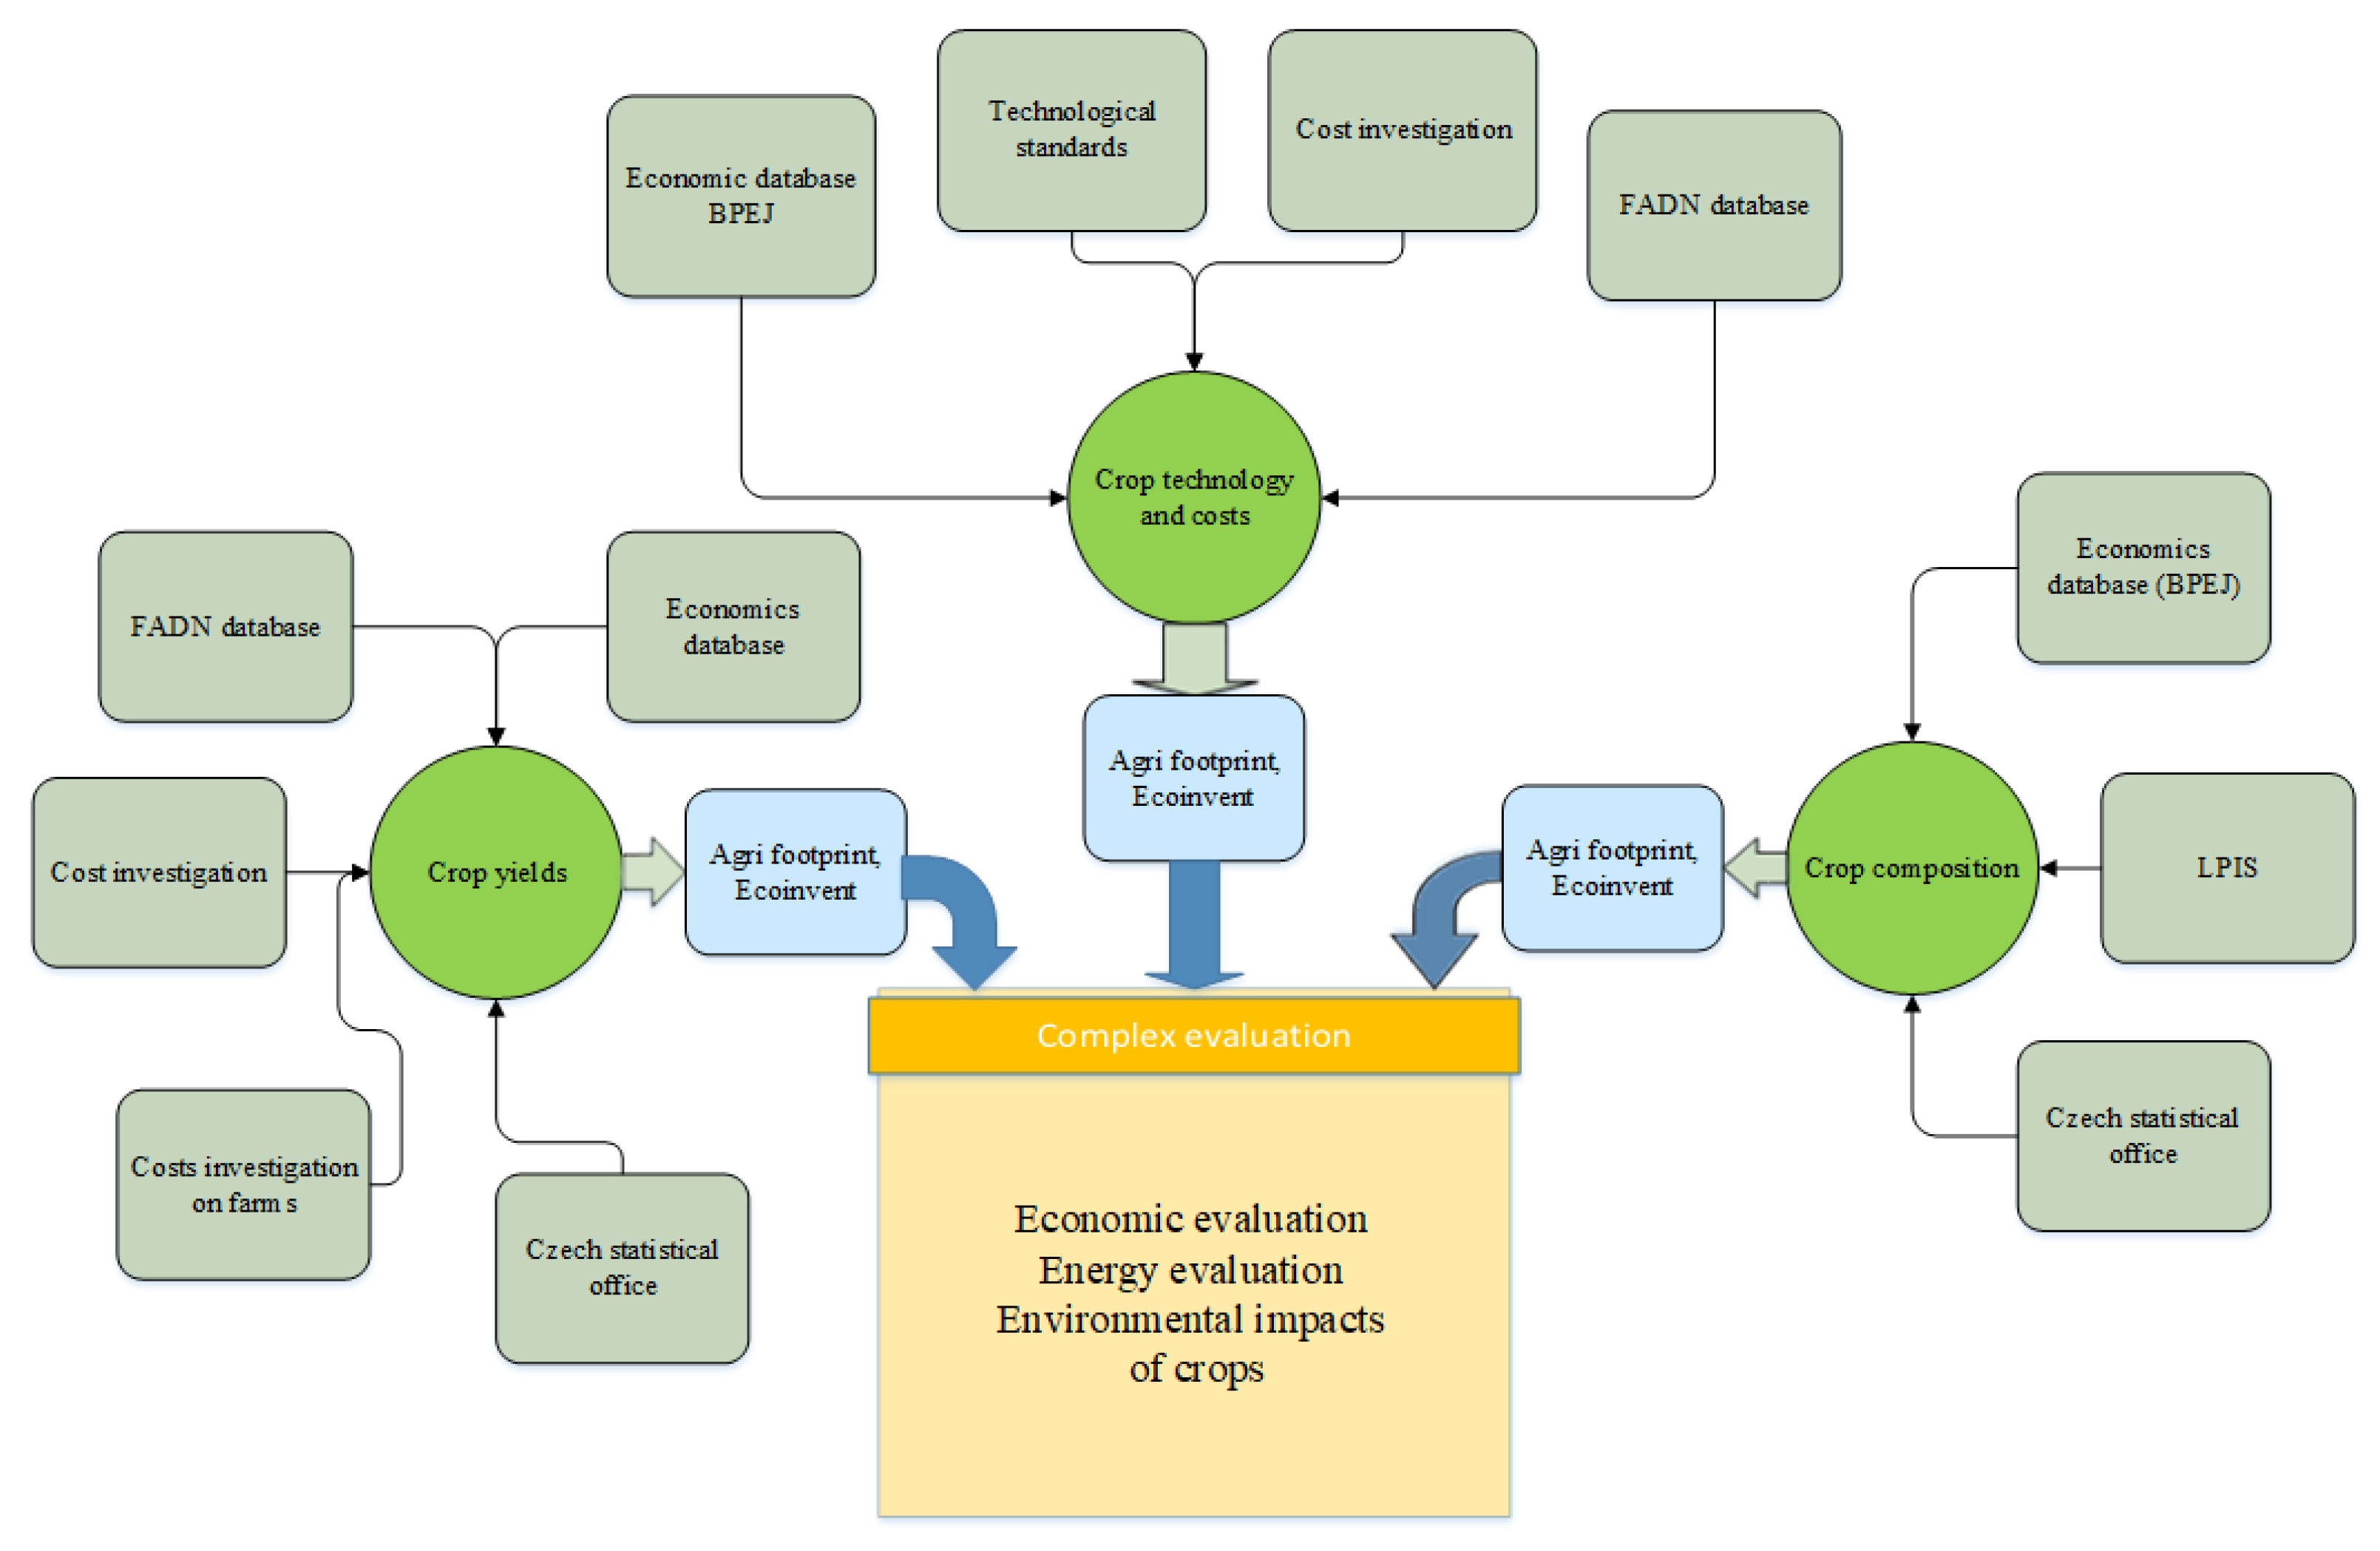
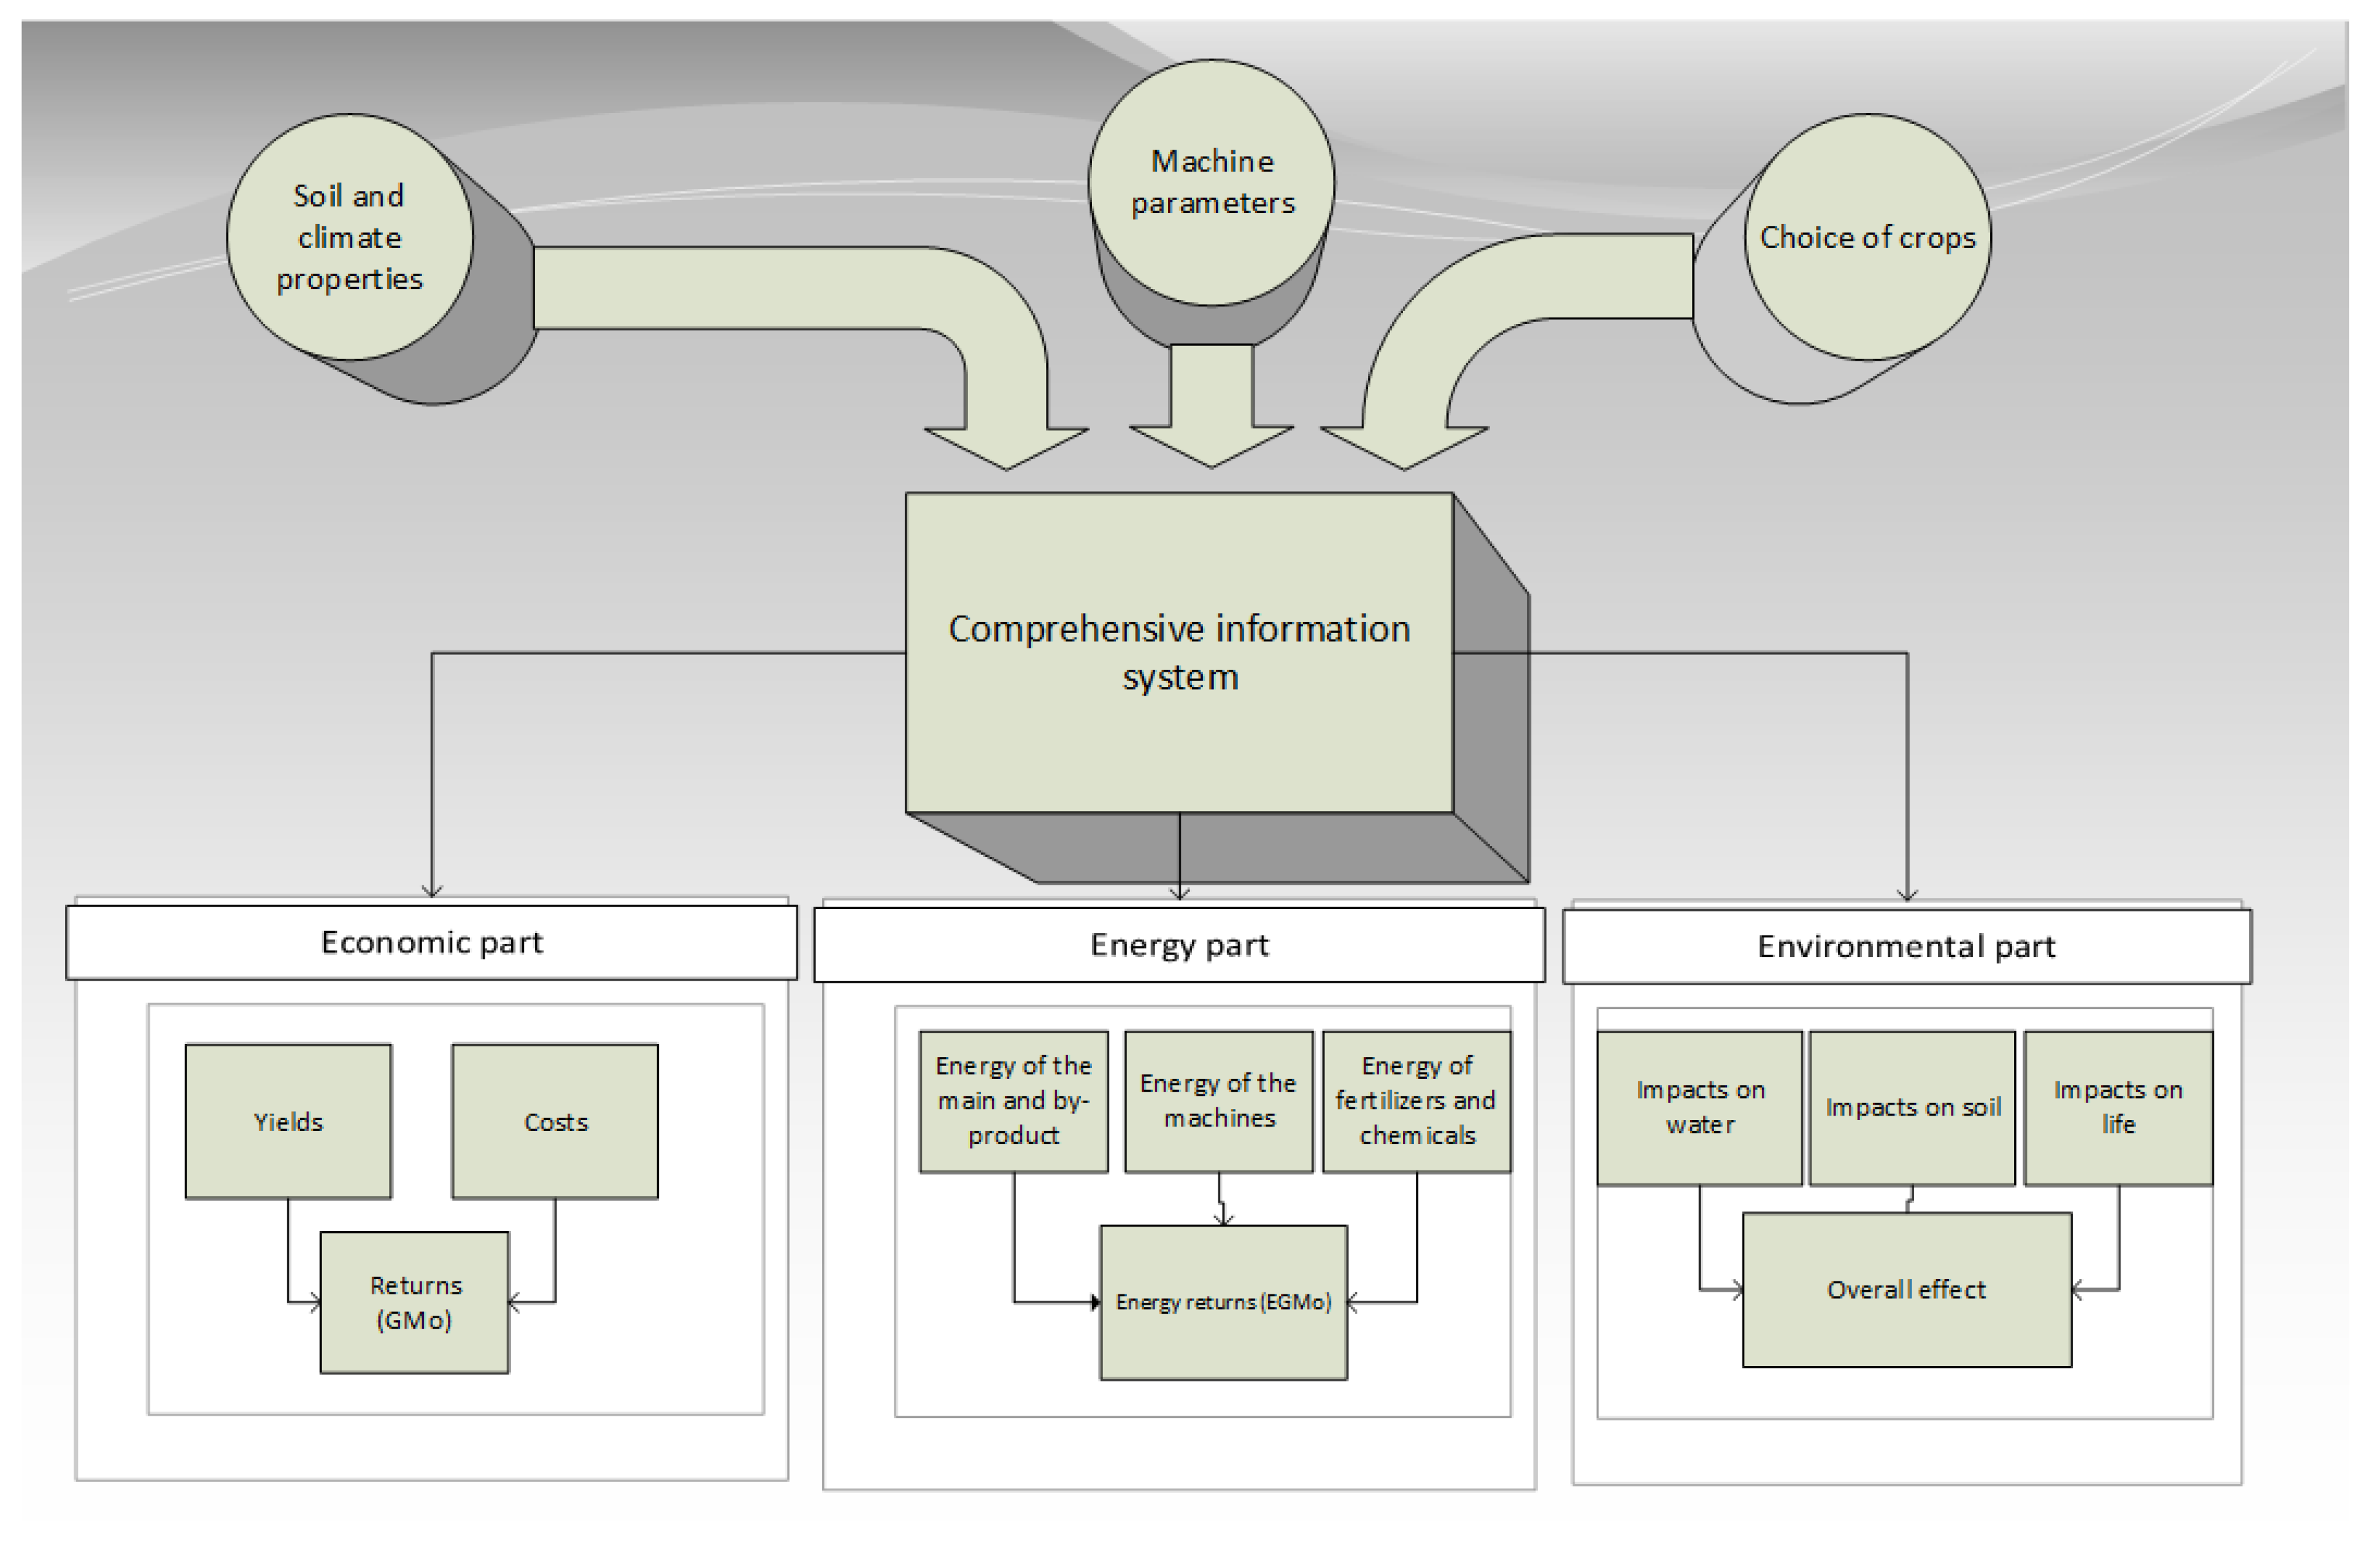
Figure 1 shows a comprehensive monitoring system based on available data, which are validated and specified against individual ESEUs. The diagram shows the sources for processing the economic and energy data of crop yields, technologies and their costs as well as the composition of crops, including links to the calculation of emissions from Agri-footprint data.
The main scheme of calculation is given in
Appendix A. It is used to calculate the economic, energy and environmental data.
The basic approach consists in the cost–benefit analysis of production of individual crops.
2.1. Method to Determine the Economic and Energy Values
When assessing the production, the indicators of economic and energy gain (Gross margin including overheads) were determined based on the production value once the necessary operating and overhead costs were deducted [
39].
where:
GMo,i,p is a Gross Margin with overheads for crops
p and soil-climatic conditions
i,
COGSo = cost of goods sold including overheads (EUR·ha
−1) and
SO is a standardized output of crop products (EUR·ha
−1). More details are provided in
Appendix B.
This procedure was opted for due to the need to calculate the total costs of production for the purpose of assessing the economics of farms according to individual crops by the Institute of Agricultural Economics and Information (IAEI) and it is reflected in all the supporting documents [
40].
The overheads are derived from the economic data on agricultural holdings ascertained by the IAEI survey and, with respect to energy, the same value was used as the costs of working operations in in the overhead costs to direct variable crop production cost ratios. The reason thereof is primarily the burdening of production of some crops (e.g., potatoes) with high overhead costs of postharvest treatment and storage.
The market price of agricultural production resulting from the IAEI statistical survey and the resulting price depends on the yields corresponding to the given soil and climatic units according to ESEU.
Energy gross margin including overheads 2 is similar:
where:
EGMo,i,p is the energy gross margin with overheads for crops
p and soil-climatic conditions
i,
ECOGSo = energy of cost of goods sold (GS) including overheads (
Table A4,
Table A5,
Table A6 and
Table A7 MJ) and
ENSi,p is the standardized output in MJ (
Table A3).
The energy values of
EGMo, i, p production were evaluated on the same inputs and outputs as
GMo (1). The primary energy values of the costs are derived from weight of the machines in kilograms listed in the database according to the example in
Table A1, where the weights (in kilograms) of machines needed for the production inputs are described. The value of primary energy per kilogram of weight (
Table A5) is divided by the number of years of depreciation and by the number of hectares processed per year. Energy of fuel (
Table A6) is given by fuel consumption for work operations and for maintenance on the basis of fuel consumption equivalent, fuel consumption for the transport of materials and technological equipment, according to the energy of organic and inorganic fertilizers (
Table A6 and
Table A7) [
34], and protective equipment [
41]. The costs were calculated by the Institute of Agricultural Economics and Information (IAEI) [
36]. The costs of transport of material were calculated for the standard distance of 5 km between the farm and the land. The calculation of costs also included the labor costs based on the average labor rates in agriculture in the last 5 years.
Soil conditions were determined by soil classification in the ESEU system. Data on slope, soil depth and percentage of stones over 2 mm in the soil were evaluated in the physical units.
The economic values of yields and inputs into the soil for soil-climatic conditions in the Czech Republic were compiled according to the database of ESEUs rated [
33,
35,
36]. Earlier data on revenues for ESEU based on the data of 1970 have been updated by a detailed survey of 529 plots conducted over a period of 9 years (2002–2010). The yield (
Y) design was based on the production functions of the dependence of yields on natural and technological conditions [
38] according to Equation (3).
where
Y: yield of crops,
W: variables of temperature, precipitations and soil moisture,
S: soil type, sort and conditions,
Z: nutrition of nitrogen, phosphorus and kalium;
P: number of chemical protection operations,
L: cultivation of soil and
T: progress of technology.
The underlying values for yields and similarly for nitrogen dosing and the chemical treatment application were compiled according to the statistical valuation of the given environmental conditions [
39].
According to the identified functions, the yields were standardized to the remaining soil-climatic conditions. Subsequently, the proposed value of standard yields was validated with the current value of yields under the given conditions, and a new standardized value of yields was proposed for ESEU. A similar function such as the derivation of the yield (Relationship 3) was compiled by the dependence of nitrogen doses on soil-climatic influences.
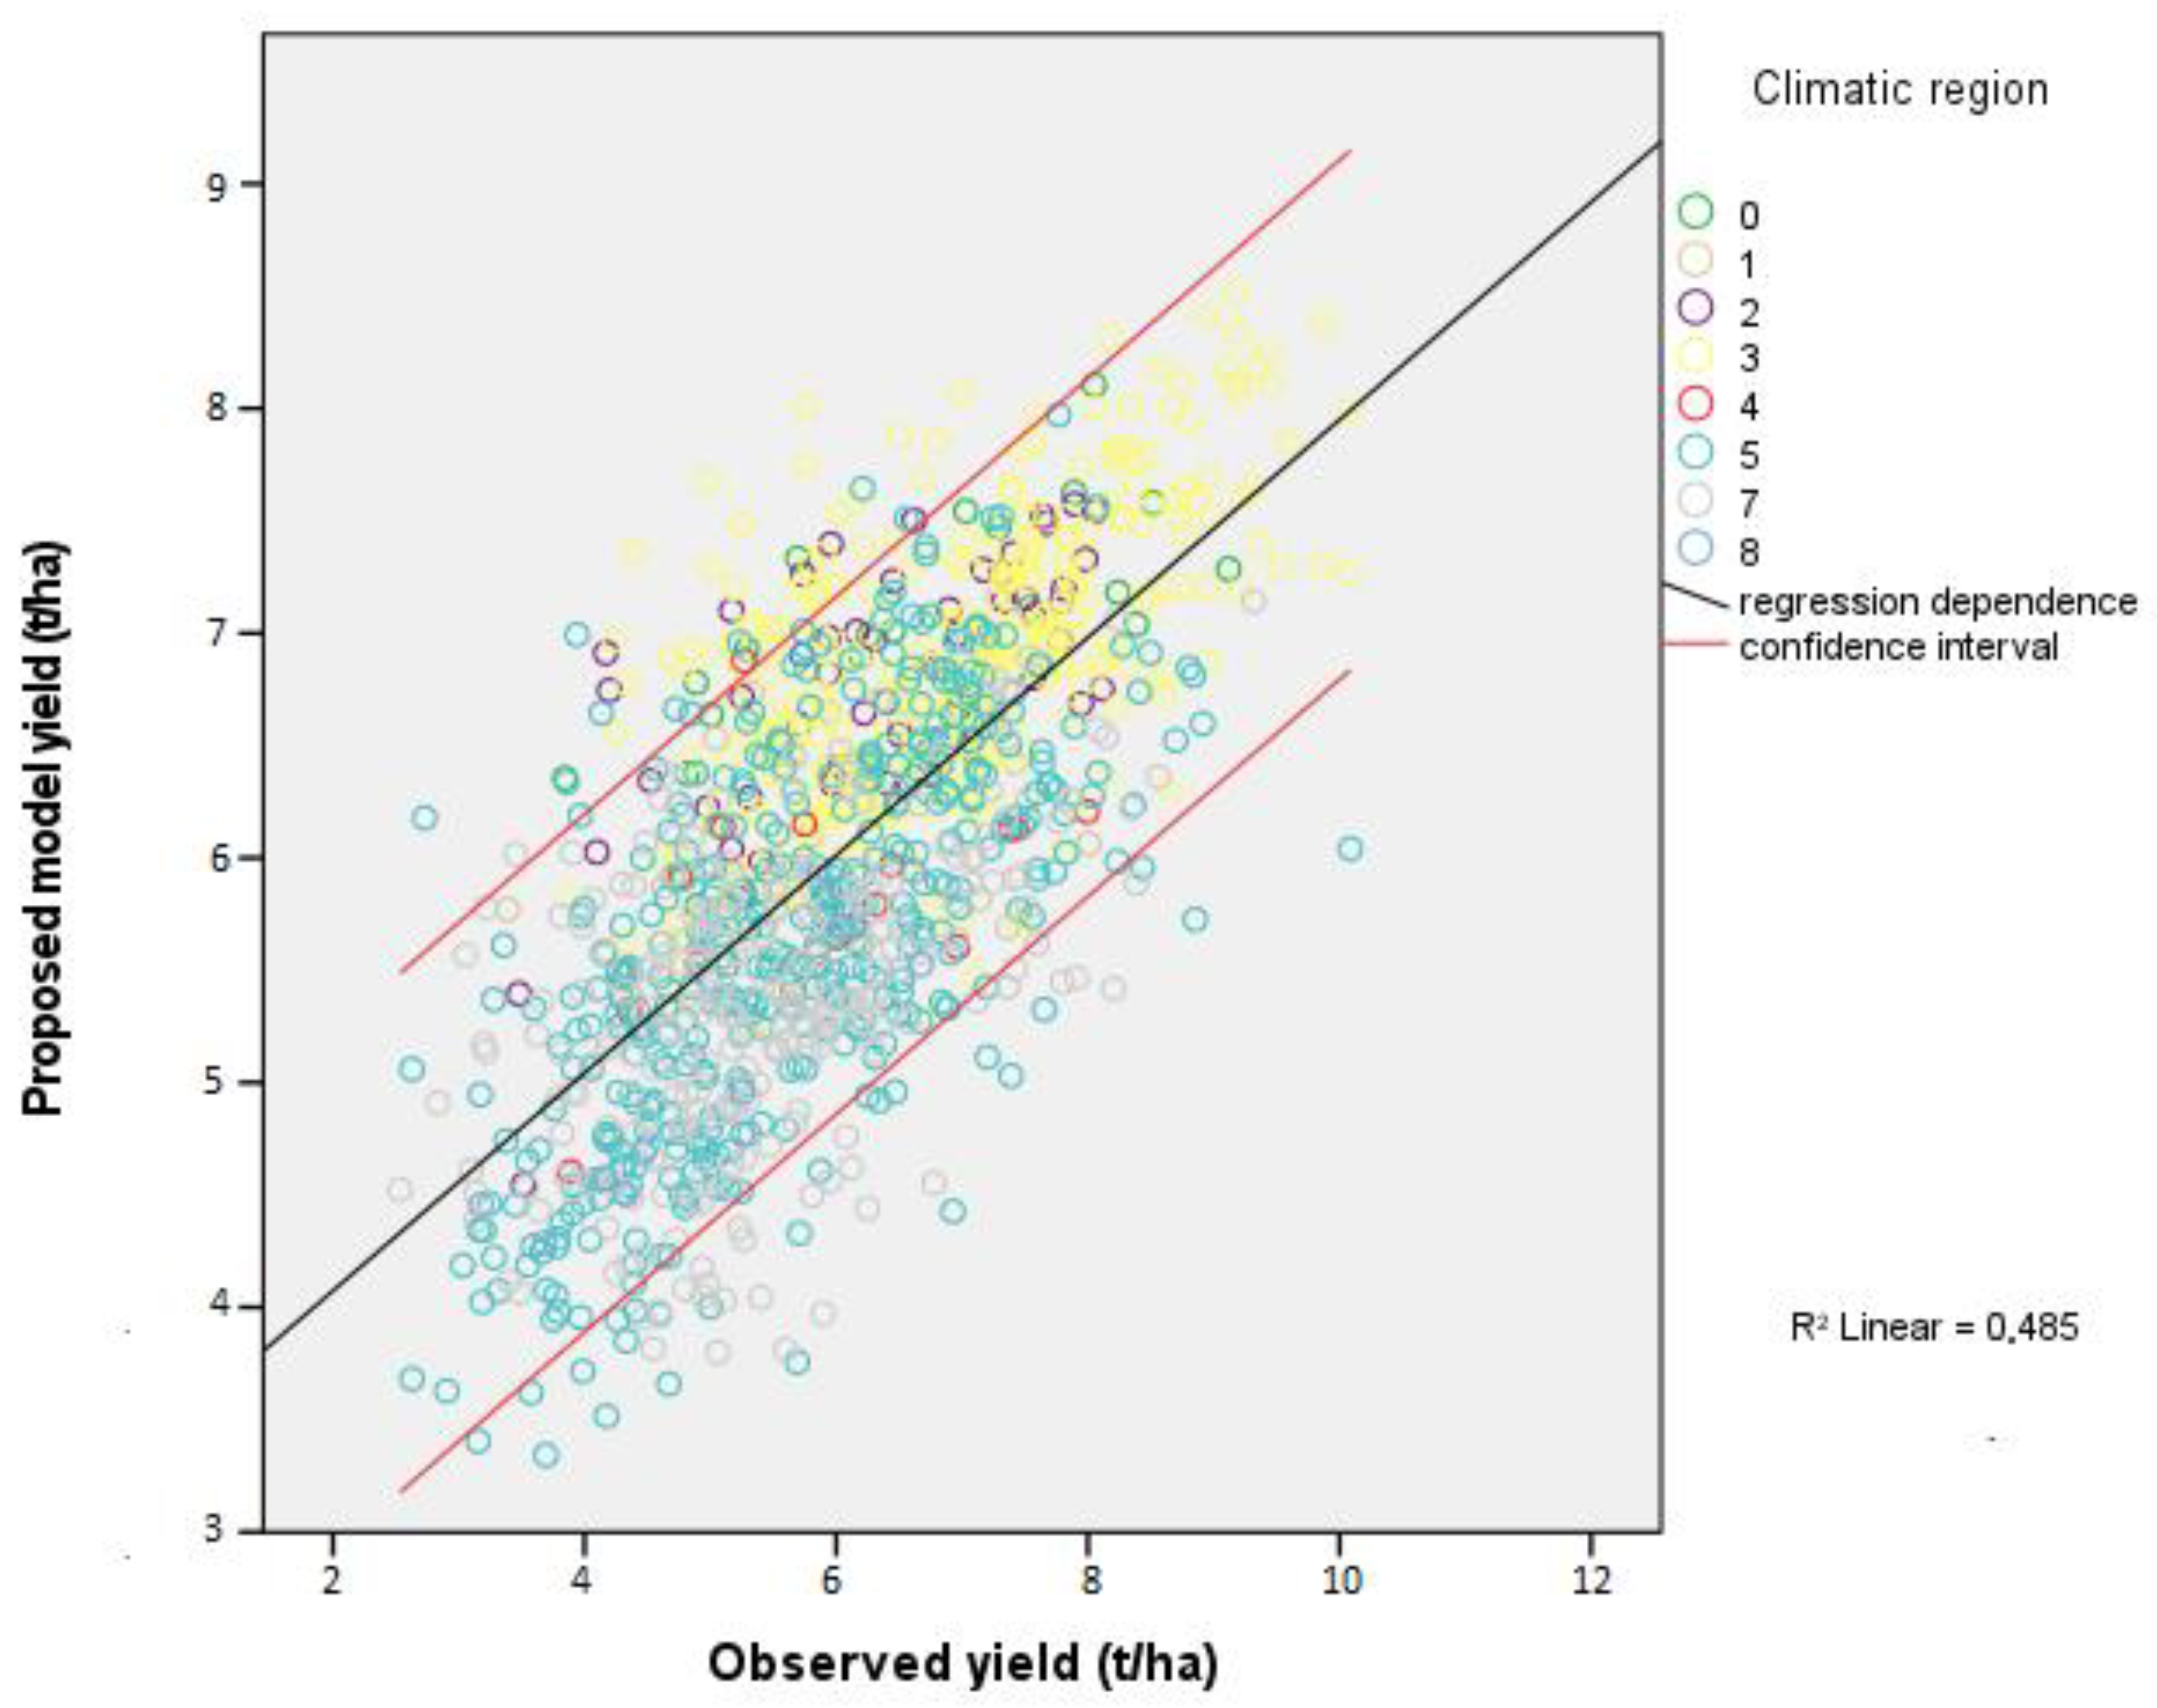
An example of a comparison of actual and standardized results of production functions for yield of winter wheat is shown in
Figure 2.
The compiled standardized yield values correspond to the categories of soil-climatic conditions for which the values are determined. The climatic factors that are most important for the achieved yields are therefore always calculated for the relevant classification scale and its values—i.e., for climatic regions 0–9 (
Table A2). When evaluating specific yield conditions, there is always a deviation from the standardized values due to the achieved weather values, which similarly applies to the monitored soil values. Nevertheless, the database is based on the balanced properties given by long-term observation and statistical analysis of individual effects. For the purpose of this article, the data are sufficiently informative even if they do not meet the requirements of directly measured values, and thus the statistical results are affected by a certain similarity of climatic and soil influences within specific groups of conditions.
For the economic evaluation of the cultivated crop, the economic efficiency
ηEp was determined according to the Equation (4).
as the ratio of the value of output (
SO) to the value of input (
COGS).
Energy efficiency
ηEnp is computed similarly in Equation (5).
2.2. Assessing the Environmental Impacts of Crop Production
The assessment comprises the methods determining the formation of emissions from crop production on soil, water and air as well as physical impacts of production on the quality of soil in the form of soil compaction.
2.3. Model Processes to Determine Emissions
The model processes are based on the Agri-footprint database; they were modified using the specific data of IAEI and are based on the data for energy evaluation—the weight of machinery, repairs (equivalent in l/ha of consumed diesel), transport costs (energy requirements of transport in MJ/ha), consumption of fuels and chemical protection (necessary technology in MJ/ha and weighted dose of pesticides in kg/ha) were expressed as diesel consumed by diesel engine of an agricultural machine (energy, from diesel burned in machinery/RER economic) [
41,
43,
44,
45]. The impact of fertilizers was calculated for crop inputs of N, P2O5, K2O, MgO, CaO, and S, and the emissions factors were derived from Agri-footprint database. The emission size relationship is based on the source data of the Agri-footprint database [
32,
46]. Organic fertilizers were calculated as manure in accordance with the database documents at the level of ESEU. Emissions to air mainly include nitrous oxide, ammonia and pesticide residues, carbon dioxide emissions, which as a reaction of soil with limestone and urea were not included due to the lack of specific data on consumption. Based on the specific data, emissions from minerals, livestock manure and pesticides were recalculated and adjusted. Emissions from crop residues remained the same as in the original process. Emissions to water from mineral fertilizers and livestock manure and pesticides were recalculated and adjusted on the basis of specific data, and emissions from crop residues and heavy metals were assessed according to the original process. Emissions to from soils were based on the specific data; emissions from pesticide residues were recalculated and adjusted and heavy metal emissions were used from the original process.
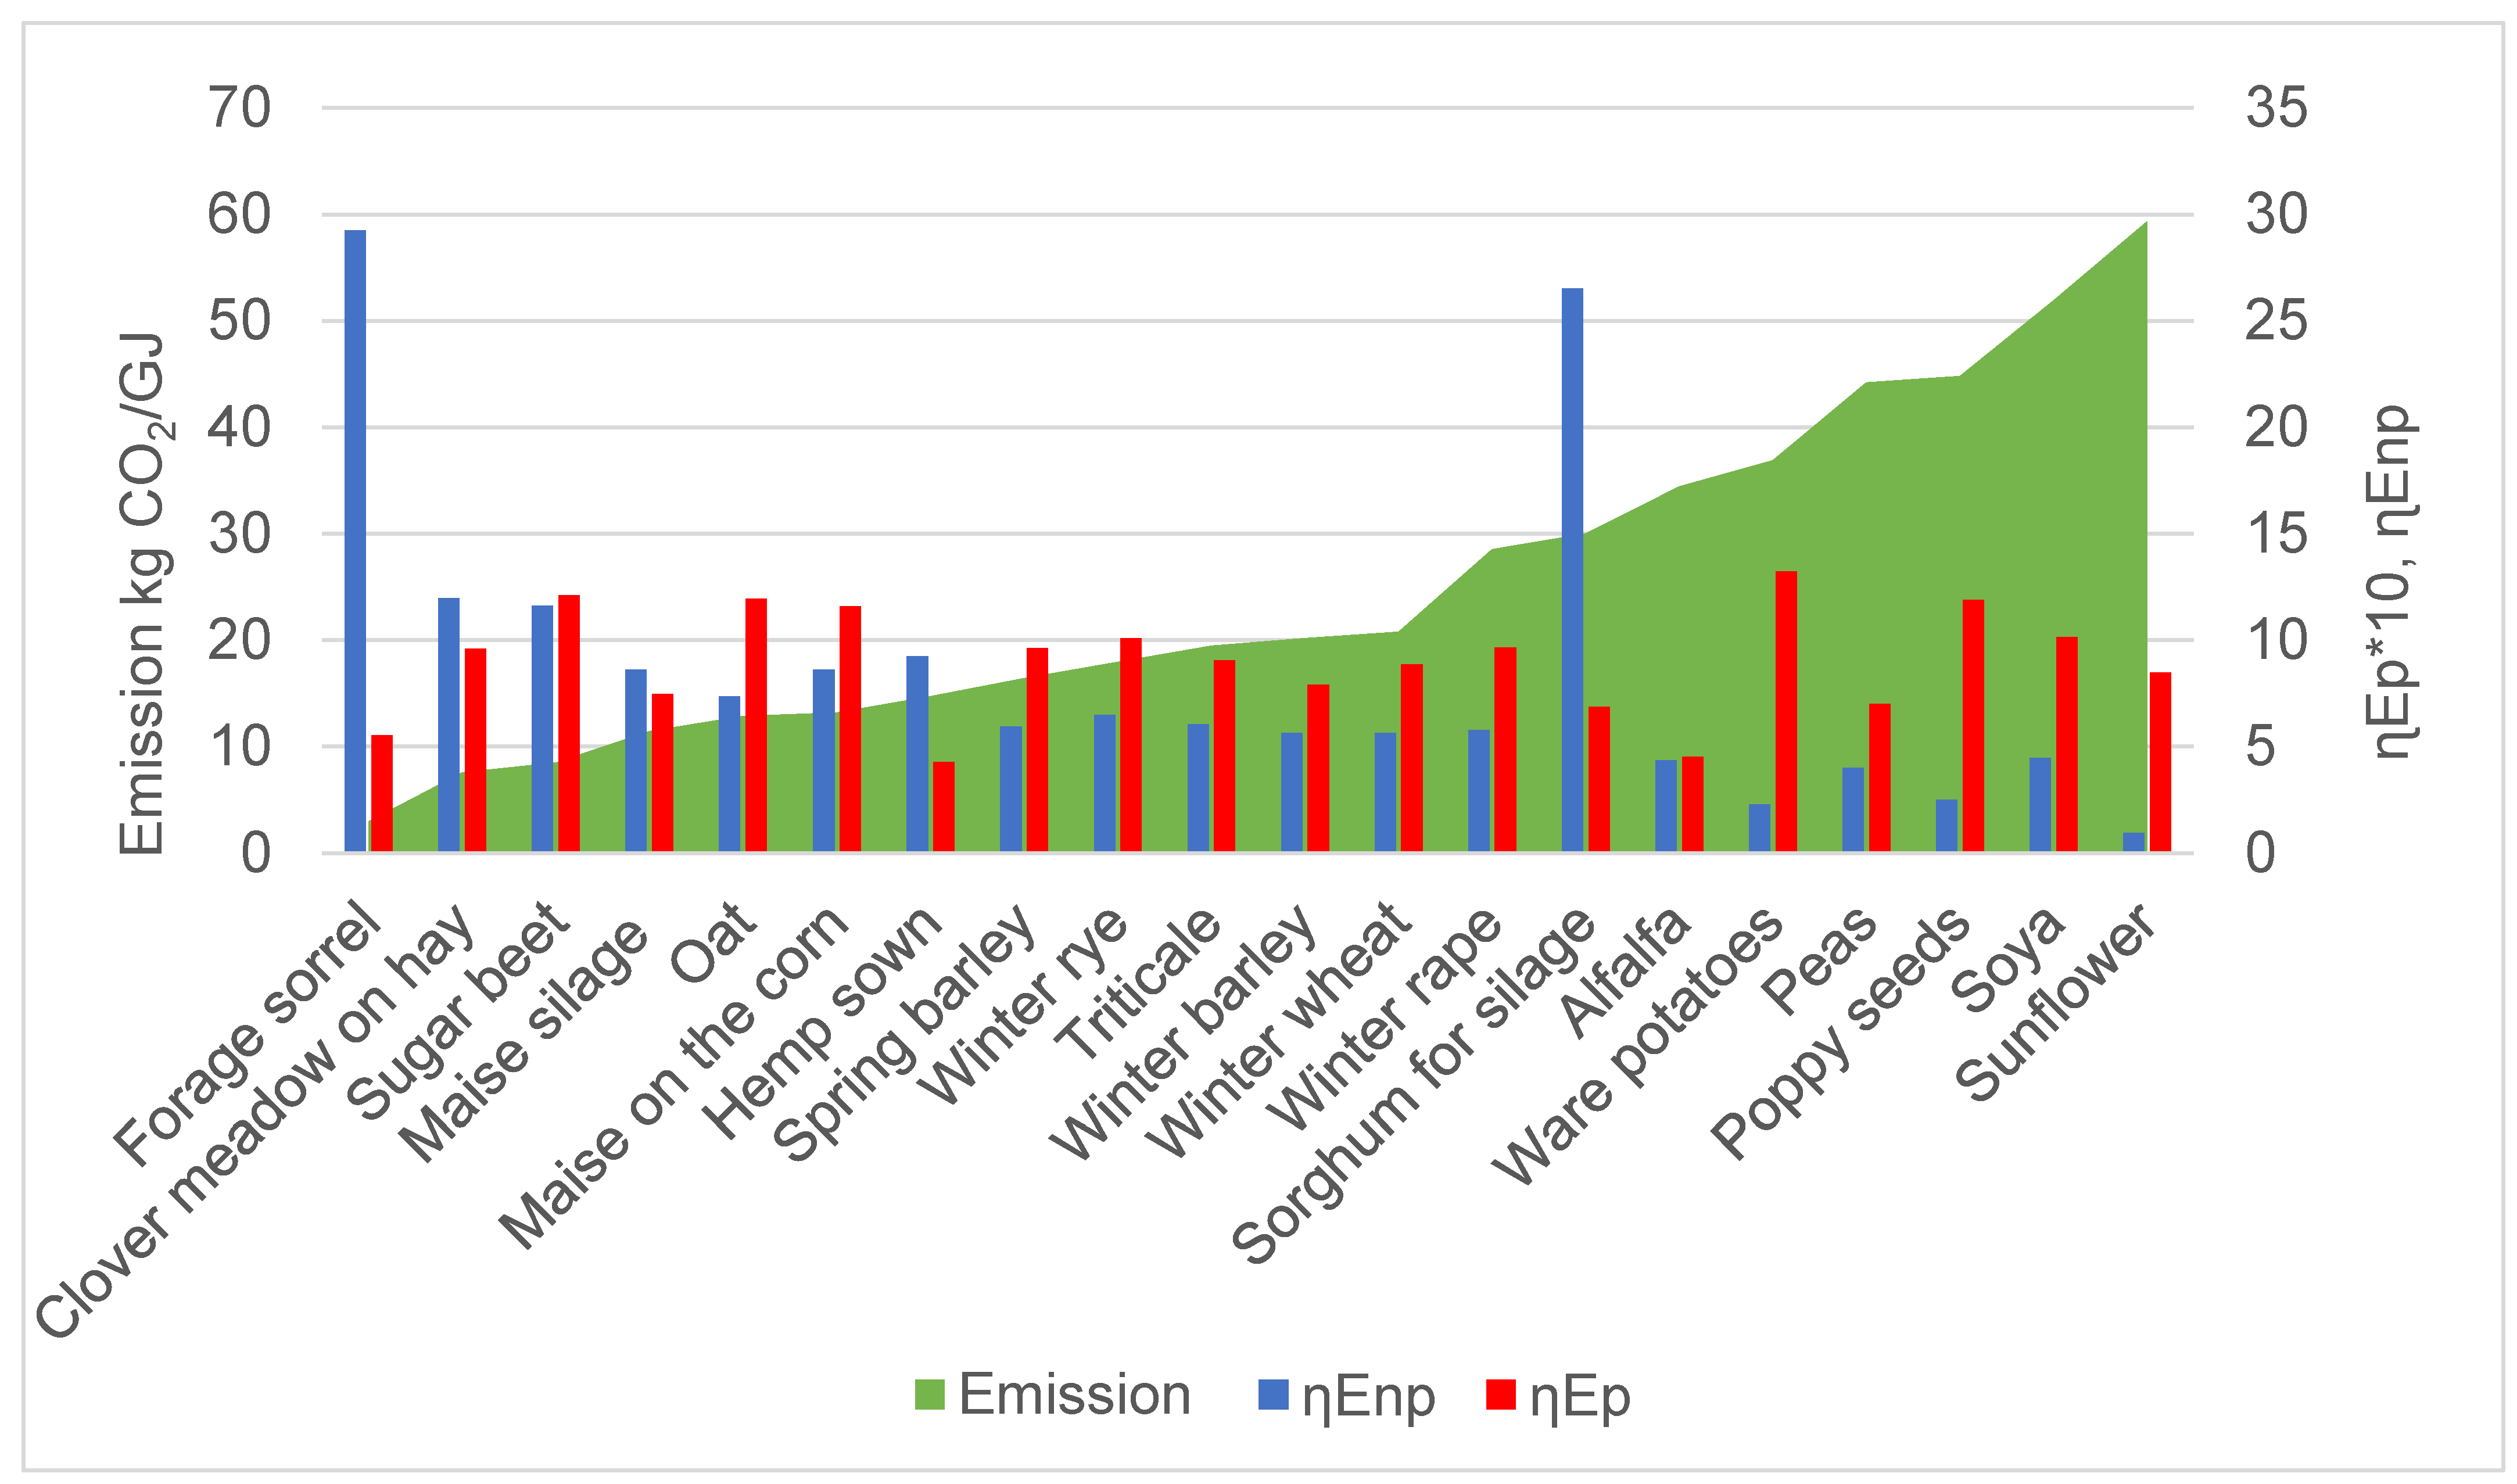
The ratio of total emissions of individual types of indicators and the energy contained in the total production of the crop, including the by-product, was used as the main indicator for assessing the ecological impact of production. An overview of the average energy efficiency of crops in the Czech Republic is given in
Figure 1. To assess the impact of emission to MJ (
EmMJ) of produced energy, the specific value of emissions per unit of output energy in MJ 6 was used:
where
EMmidp is the emission of midpoint classifications as a sum of all included partial emissions of operations, fertilization, chemical inputs and transport, for crops
p and soil-climatic conditions
i.
Evaluation of the significance and influence of individual ecological indicators is a separate issue beyond the scope of this work. For their complex evaluation, it is possible to use more methods based on the evaluation of the meaning and weights of individual indicators. Due to the large number of indicators and their various possible interpretations and due to the simplification of the issue, the methodology of multicriteria decision-making was chosen to determine the total emission value per MJ
EEm according to Equation (7)
where
Emo is an order of the value of emission for
ith crop on ESEU,
E is a sort of emission,
k is a number of calculated emissions and
l is a number of ESEU.
4. Method of Assessment of Crop Impacts on Soil Environment
The impact of crops on soil compaction was evaluated from a survey conducted in the years 2002–2011; the assessment of the impacts on soil was based on the penetrometric resistance of soil, which is an appropriate indicator of the overall conditions of agricultural land [
47,
48], bearing in mind the need to obtain information on deeper layers of soil on large areas. Soil penetrometric resistance is closely related to soil-organic carbon (SOC) formation, where soil resistance decreases with higher soil content [
49].
The underlying principles of penetrometer measurements are described in the paper by Lhotský [
50]. The methodology has been modified to have one sample point for approximately 5 ha. There were three sample points on a plot with the area of up to 10 ha, with another sample point that always added an additional area of up to 5 ha; the sufficient number of sample points, however, was 10. The location of these points was chosen so that they were equally distributed across the entire land plot and were not located in the headland. During each measurement, the probe was pushed into the soil at a constant speed and the penetrometer was reset in cases where the probe hit a stone. Soil samples were collected in each plot in order to determine the soil moisture—namely, from no deeper than the soil tillage depth and from the subsoil layer.
The obtained values of penetrometric resistance are expressed in the form of the mean resistance of three layers—namely, 0–18 cm, 19–38 cm and 39–72 cm.
The results were assessed based on the correlation analysis and show, as well as the direct impact of the crop on the resistance, the general relationships, which determine the effects of penetrometric reistance in the respective soil layers.
5. Results
The results of the comprehensive assessment of economic, energy and environmental impacts of crop growing are based on the determination of individual soil and climatic parameters of the locations where the crops are cultivated. Altogether, the assessment covered a selection of 20 crops and different options for their use. The assessment of economic indicators builds on the calibrated economic results of agricultural holdings—namely, on the average of the last 5 years. Therefore, the results are stable and independent of the respective year. The economic and energy indicators are based on the cost–benefit analysis, which facilitates the evaluation of the absolute profit per hectare of the agricultural land in monetary or energy terms. These indicators are shown in the figures and tables as the attained efficiencies according to Relationships (4) and (5). The environmental indicators are related to the produced energy in production including straw.
5.1. Relation of Economic, Energy and Environmental Characteristics to Soil-Climatic Conditions in the Czech Republic
To determine more detailed effects of weather and soil conditions in the Czech Republic on the achieved economic, energy and environmental parameters, the available database data of individual crops and environmental indicators in the database were processed.
The overview of average energy and economic efficiency of crops in the Czech Republic in comparison to CO
2 emissions is provided in
Figure 3 and
Table A8 and the average terrestrial ecotoxicity values are described in
Table A9, with individual data provided in a separated file for all emissions [
35].
The system enables a comparison of results of ηEnp, ηEp and EmMJ in the same soil-climatic conditions as well as all the other monitored inputs and outputs. The results of individual crops show the lowest emission load for CO2 per MJ produced for forage bulk crops, the largest load is achieved for crops with food use, where economic efficiency also prevails over energy efficiency. The achieved environmental results depend very much on the technologies used for growing crops and harvesting. For example, alfalfa has almost the same cultivation technology as clover, but its environmental impact reflects a high consumption of diesel fuel, when the silage mass is harvested by high-performance and high-consumption cutters instead of using solar energy for drying. The different value of the energy balance between energy and food crops also provides a new perspective on emissions from animal production, which consumes bulk feeds with better energy efficiency than food production.
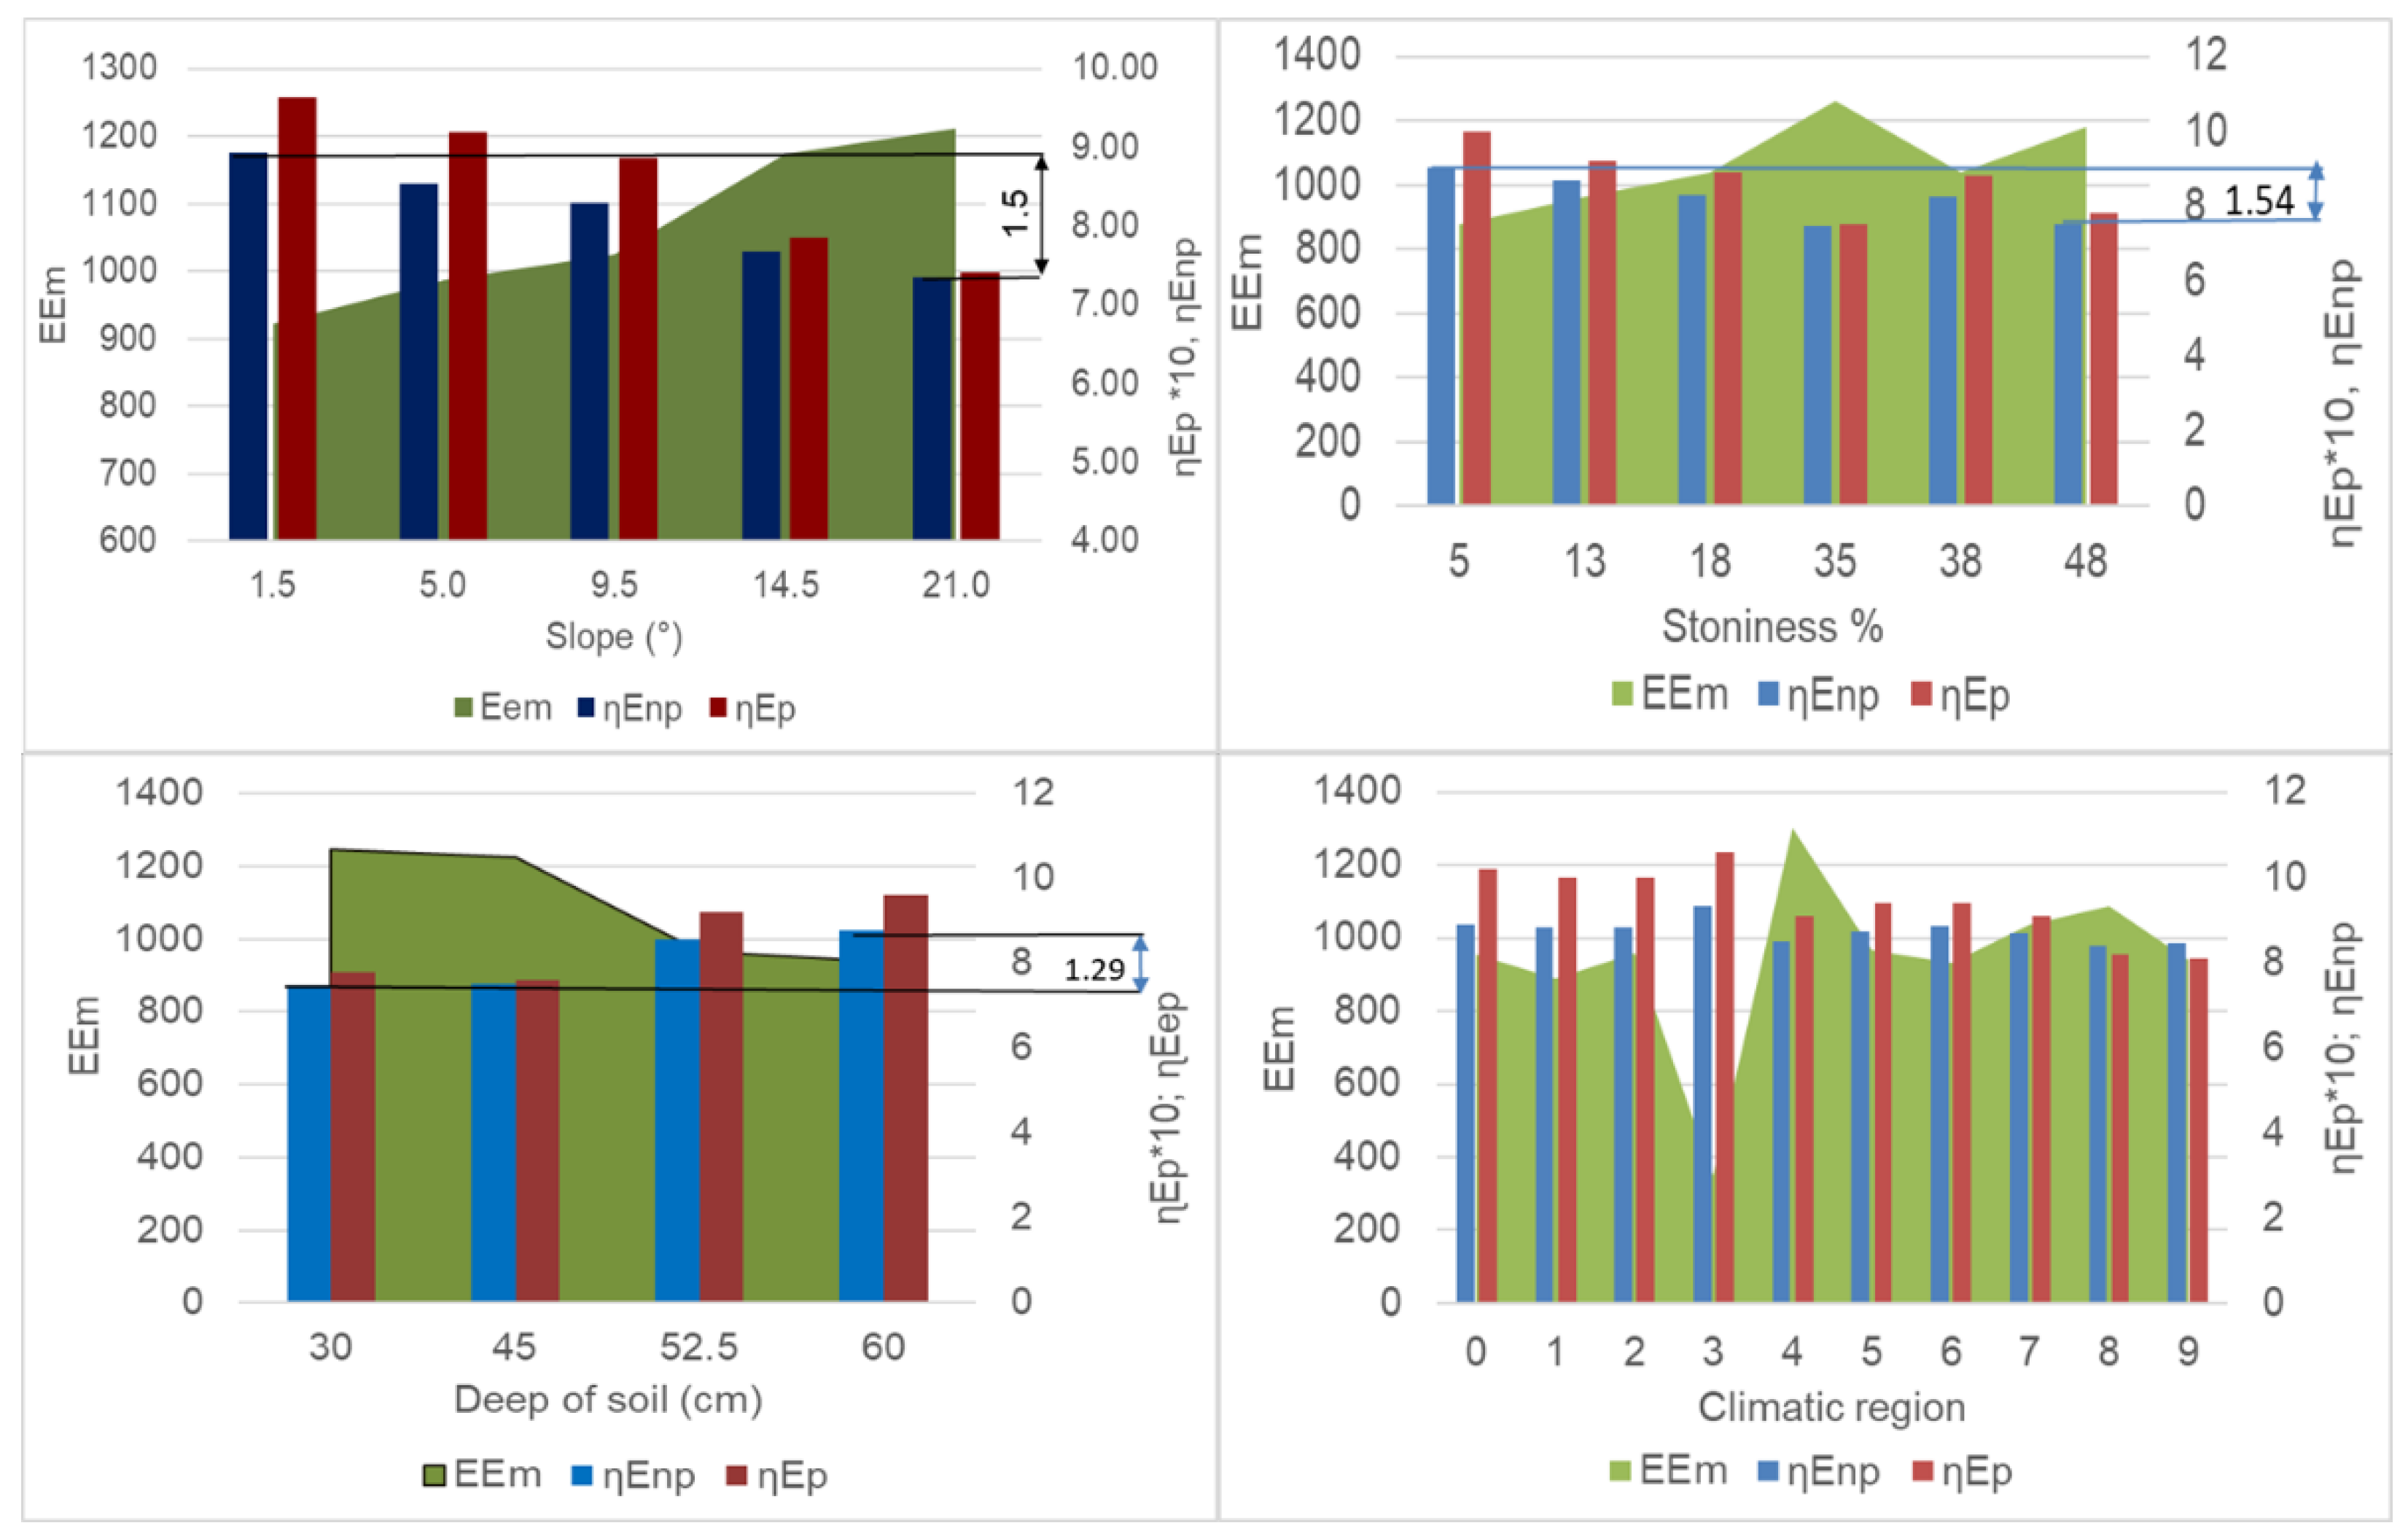
In the following section, the main soil-climatic indicators according to the ESEU system were used individually.
The obtained values in line with the ESEU code are included in
Figure 4.
From the above dependencies, the importance of land and climate configuration indicators is obvious. Due to the slope of soil, the energy efficiency decreases most significantly, namely, by 1.58, while due to the stoniness of soil there is a decrease of 1.54, and due to the depth of soil, of 1.29. Due to the difference in climate regions of 0.94, the difference in economic efficiency decreases in similar relations, and in absolute values less significantly (values in the graphs are multiplied by 10), but the percentage of the decrease is more pronounced. The percentage changes of all indicators are given in
Table A10,
Table A11,
Table A12 and
Table A13.
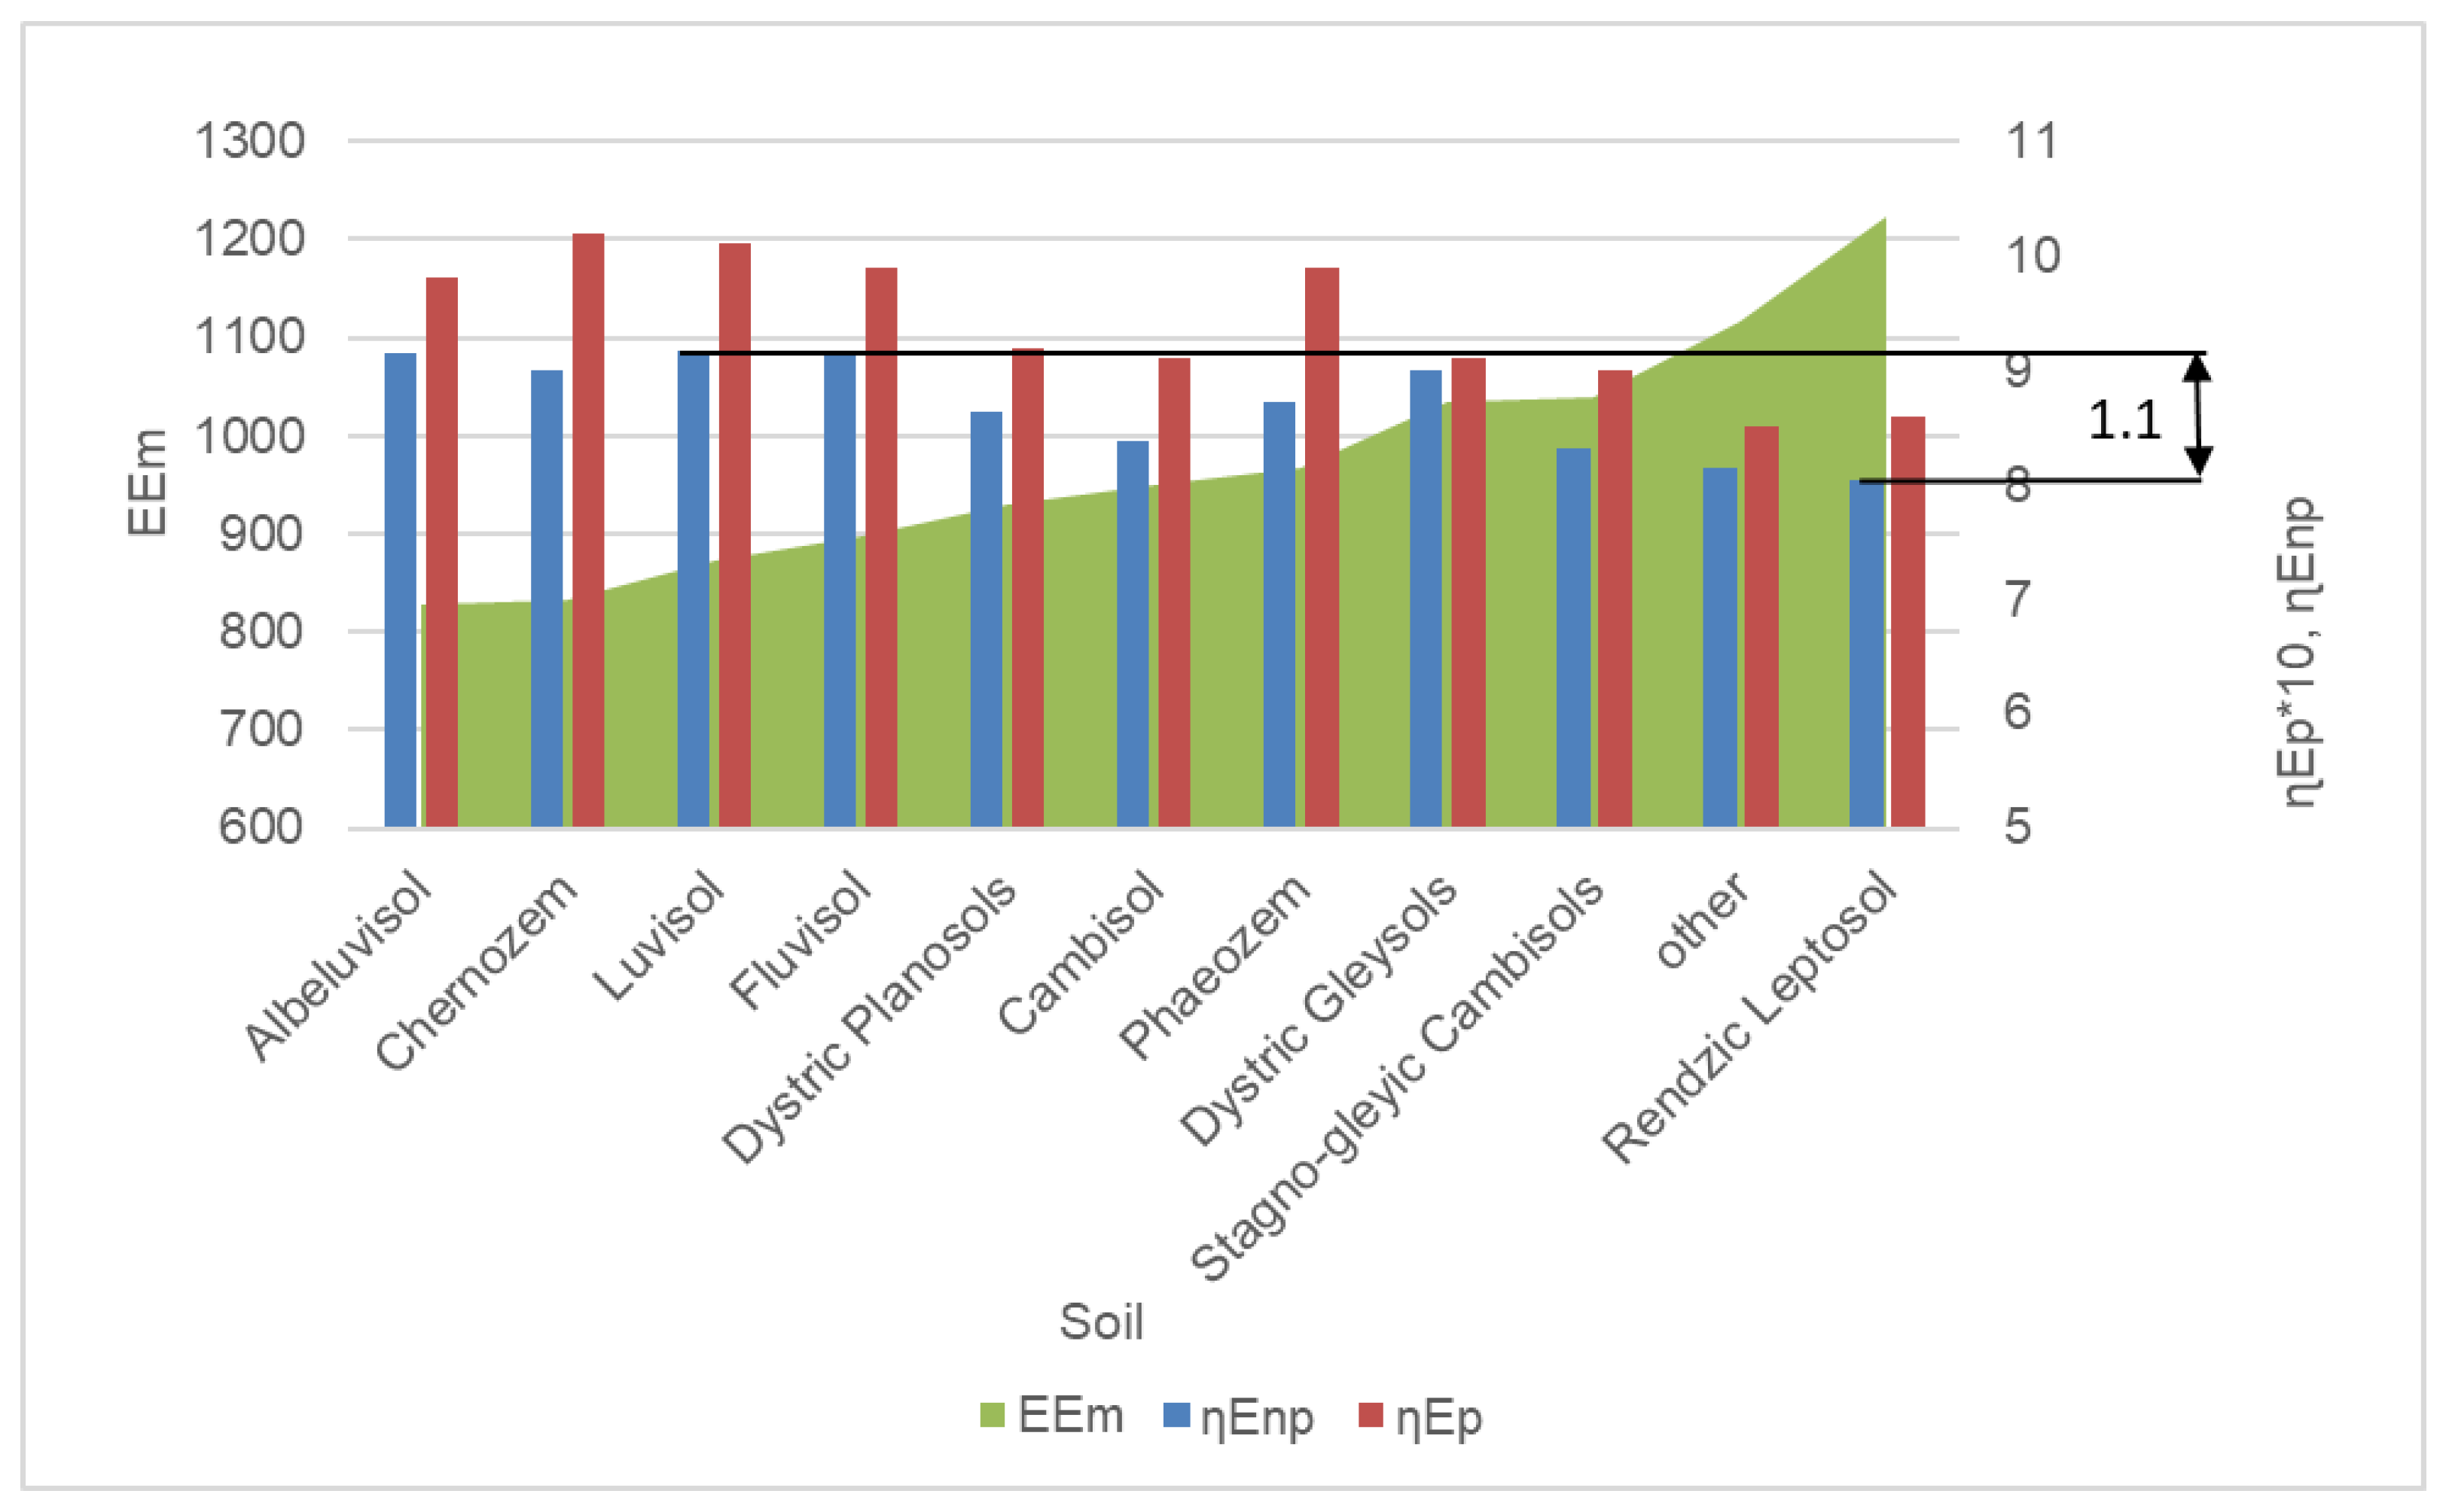
The results for the main types of soil are shown in
Figure 5.
The results show the main difference value of ηEnp is 1.1; there is also an interesting difference between the energy and economic efficiency in chernozem, which is mainly caused by growing economically favorable crops on fertile areas. Higher emissions per energy of outputs correspond to the lower economic and energy efficiency.
5.2. Assessment of Impacts of Chosen Crops on Penetrometric Resistance
In order to assess the relationship to soil compaction, a survey was carried out measuring the penetrometer resistance by frequency of crops grown on the plots. The assessment also included cases when more than three values of penetrometer resistance for the respective crop were obtained. The correlation analysis (
Table A13) indicates the main dependence of the value of resistance in the monitored crop, determining the effects of penetrometer resistance in the respective soil layers.
The results of the survey of penetrometric resistances from the years 2002–2011 [
38] are shown in
Figure 6.
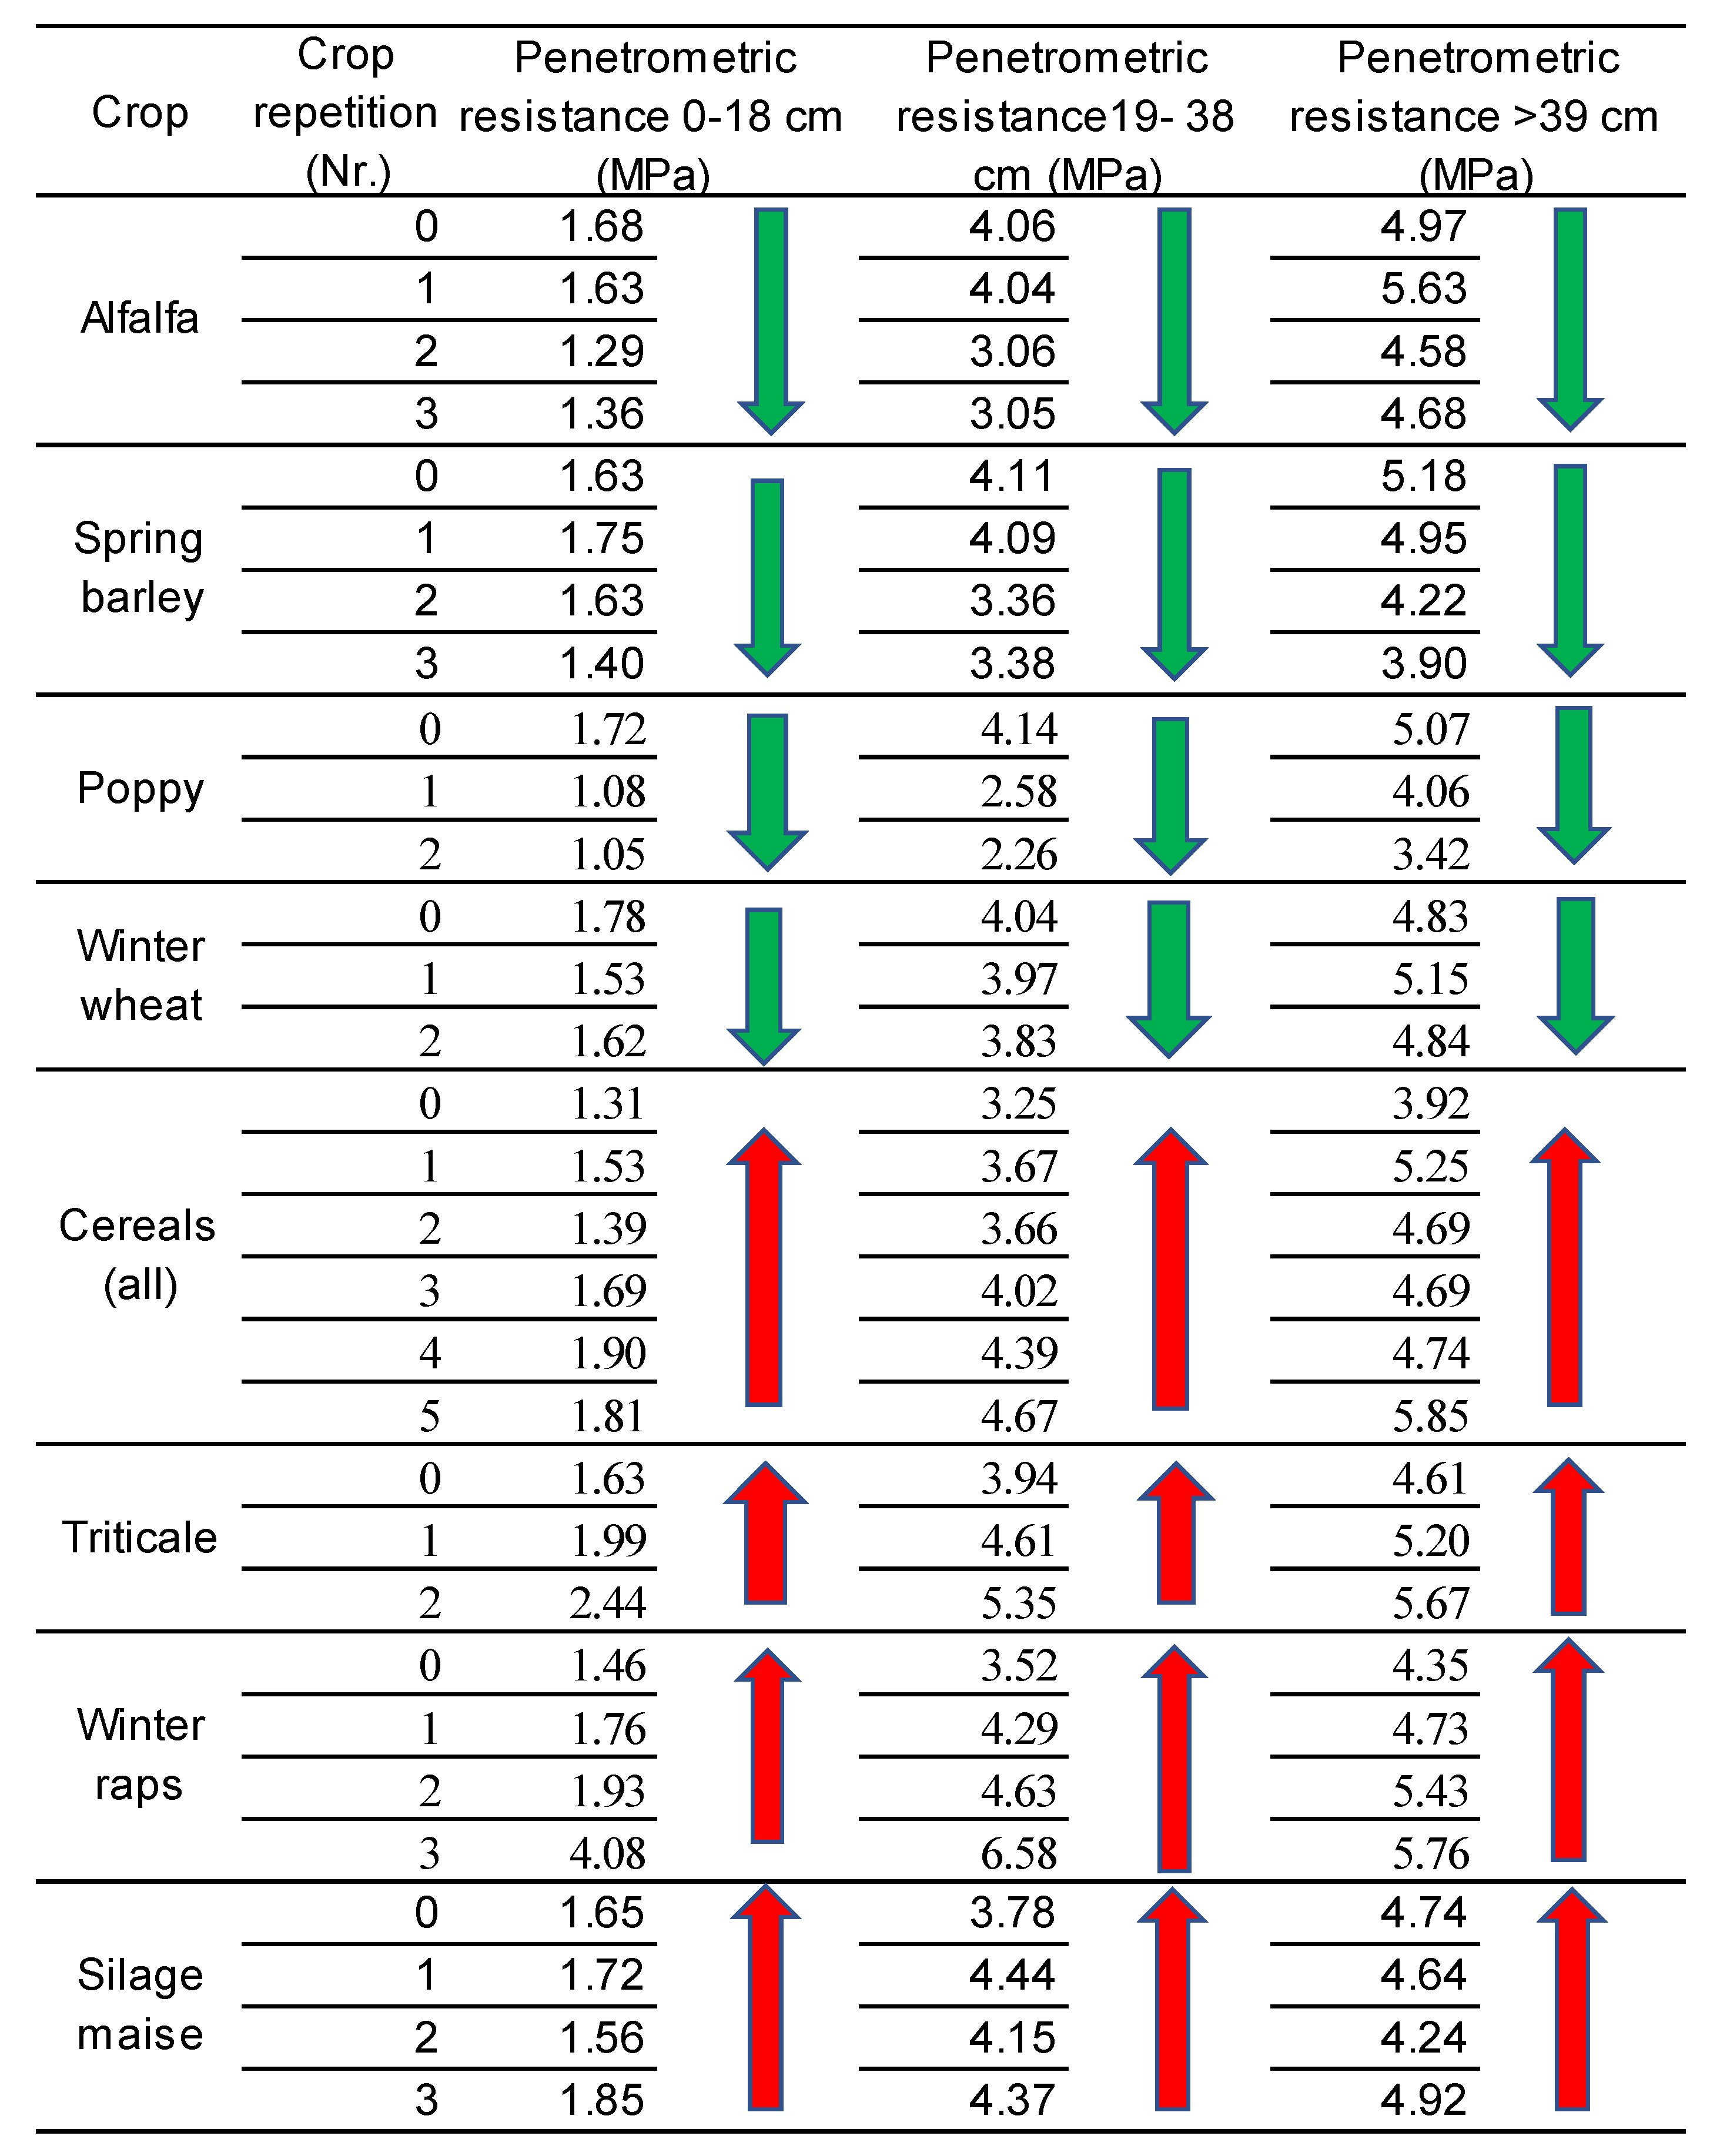
The results of penetrometer measurements and the identified trends in soil compaction are included in
Table A14, with plotted significant dependences of the penetrometric resistance on the crop, the positive effects of alfalfa in subsoil, and the negative impact of winter rapeseed growing across the soil profile as well as of maize in the bottom layer at the depth of more than 39 cm. The values in subsoil are crucial for the assessment of effects of penetrometer resistance. The values of penetrometric resistance at the depth of more than 39 cm can be influenced by penetrometer measurements that ended prematurely due to the solid bedrock. The largest effect on subsoil compaction is seen in poppy seed (difference of 1.88 MPa) and alfalfa (1.1 MPa). The highest compaction, on the contrary, is reported for winter rapeseed (3.06 MPa) and triticale (1.4 MPa).
6. Discussion
The main contribution of this article is a comprehensive view of the economic, energy and emission context of the production of individual crops according to soil and climatic conditions. The evaluation of individual factors is based on the standardized values of inputs and outputs of individual crop processing technologies up to the level of work operations. The work thus enables a systematic view of the production structure of farms in their soil-climatic conditions, and thus enables better planning and management of land use in local conditions. The existing information in the literature is fragmented into partial cases under specific conditions, which are difficult to combine into one framework to find complex contexts. The literature presents analyses of individual energy and economic balance of crops, especially according to higher territorial units and countries, or on the basis of a partial calculation of technology data and simulation of operating conditions [
51,
52]. This issue is addressed on the basis of data of technological processes individually also according to the yield of straw [
9,
53] or biomass of selected crops [
54]; however, the overall crop balance depending on local conditions for energy, economic and environmental concepts is not addressed. Specific conditions by territorial units are determined on the basis of statistical surveys without functional interdependence [
9]. This work does not address the individual technological context of the use of new technological procedures, but the basic standardized framework, by which the newly obtained data can be evaluated. The way in which emission data are processed by ordering ESEUs within individual crops allows the impact of emissions on specific businesses and for specific input choices to be adapted. The way in which emission data are processed by ordering ESEUs within individual crops allows the impact of emissions on specific businesses and for specific input choices to be adapted. Environmental impacts are based on the results of ReCiPe method assessment of specific data for Czech Republic combined with model processes of the LCI database Agri-footprint. A system approach to derive emissions based on this database makes it possible to evaluate individual soil-climatic conditions based on the full impact of technologies. The basis is a complete evaluation of emissions according to primary energy in the manufacture of machinery, according to fuel consumption, fertilizers and protective equipment depending on the doses of material and the performance of kits in individual operations in specific soil and climatic conditions. Emission sources are therefore assessed comprehensively and compared to some other sources, which only evaluate some emission components [
55]. The standard LCA database evaluation approach allows for crop-specific evaluation but without the choice of individual emission items according to machine aggregations [
4,
56]. This division makes it possible to adapt the emission factors for the individual difficulty conditions.
A comprehensive evaluation of individual crops shows significant differences between energy and food crops. Higher economic efficiency of food crops is accompanied by increased costs per unit of energy and higher emissions (e.g., soybeans, poppy, sunflower). Higher energy efficiency of feed crops and lower emissions of energy produced can contribute to a further discussion on the focus of food in relation to animal production as well as to discussions on energy production. There are conflicting views on this topic and a detailed LCA analysis of the whole process is needed [
57,
58,
59]. An important context of the relationship between emissions
EmMJ from the production of feed crops and grains for human consumption is given in
Table 1.
The table shows that emissions produced from energy crops (fodder: clover grass, clover hey, maize silage) are 42–50% lower per GJ of energy produced than those from food crops (winter wheat, spring barley, peas).
The identified connections between energy, economic and environmental impacts of agricultural crop production show a very significant dependence on soil-climatic conditions. The article separately evaluated the individual properties of land on the operational indicators of crops. The soil depth affects the energy efficiency of crops in the Czech Republic by 15%, the economic efficiency by 21% and the overall order of emissions by 33%. The land slope affects the energy efficiency of crops in the Czech Republic by 18%, the economic efficiency by 23% and the overall order of emissions by 31%. The stoniness affects the energy efficiency of crops in the Czech Republic by 14%, the economic efficiency by 18% and the overall order of emissions by 31%. The results depend on long-term observations of the IAEA and the identification of crop production functions.
Climatic indicators are a factor acting together with soil indicators and according to their specific compositions, overall results can be derived. The interaction is mainly due to the achieved crop yields in specific conditions. From the point of view of the suitability of crops for production, the dependences found show that marginal soils with a shallow soil depth, high stoniness and slope, even on less fertile soils, have higher relative emissions from crop production to 1 MJ. Consequently, there is a need to grow crops in these conditions without large emission effects, especially perennial energy crops, which can be used for both animal production and energy production.
The local conditions also cover the effects on the environment in soil based on the mechanical effects of crop growing on soil. The obtained results suggest major impacts of individual crops on soil conditions. The penetrometric resistance of the soil depends mainly on the content of organic matter in the soil and on the method of farming. The content of organic matter in the soil is ensured both by organic fertilization and in deeper layers, above all by the decomposition of the root system of crops. According to the performed penetrometric survey, less compaction of subsoil and subsoil is found in alfalfa and some springs, spring barley and poppy. In terms of lasting effect on improving the condition of the soil in the deeper layers of the soil, alfalfa is very important crop [
60,
61,
62]. Global biogas (methane) production needs new opportunities for production using legumes on arable land, as they do not significantly degrade soil quality compared to other crops [
63], unlike the cultivation of sown maize [
64]. Under the new climatic conditions, there is a significant relationship to precipitation, where alfalfa is highly profitable in dry conditions, while clover in humid conditions [
65]. A very important advantage is the high production of roots in depth with a positive effect on the soil structure, the content of soil organic matter (SOM) and consequently also on the productivity of the stand [
64]. This makes it possible to improve the sustainability and resilience of the natural environment, in particular with regard to reduced external inputs, improved humus balance (carbon, energy and nutrient cycle), reduced greenhouse gas emissions and the general positive impact of fodder and catch crops in crop production practices [
63].
For the purpose of aligning the growing of crops for food and energy purposes, according to the effects of selected crops on soil ascertained based on the obtained values of penetrometric resistance of individual crops, alfalfa is a highly suitable crop since it improves subsoil compaction and at the same time provides good energy gain. The area under alfalfa, however, substantially decreased in recent years due to the reduction in cattle breeding and has reached its minimum in the Czech Republic. The current need to improve the subsoil conditions together with the need to increase the energy crop capacities, with the concurrent pressure to reduce the cultivation of maize for silage, speaks in favor of its production. Alfalfa can easily be used in all the existing biogas plants, up to a share of 20%, for pellet production and cattle fattening.
The system can analyze 22 environmental indicators in the endpoint category and 18 environmental indicators in the midpoint category [
35] and can be combined with the physical effects of crop growing on soil. The physical effects of crop growing on soil constitute an equal impact on the environment as the emissions and assume the form of numerous impacts, especially on soil erosion, soil fertility, resilience to drought as well as water contamination in the case of topsoil wash off. The subsoil compaction keeps increasing as a result of a change in crop composition and climate change, with a decrease in the number of frost days causing soil swelling (frost heaving), as well as an increase in crop yields that have to be harvested and transported from the land by heavy machinery.
7. Conclusions
The paper describes the process of developing the system of assessment of soil and climatic impacts on individual crops with respect to economic, energy and environmental indicators for the classified unit of soil and climatic properties—i.e., ESEU in the Czech Republic. The main indicator that was selected to compare the individual conditions was the ratio of the value of individual types of emissions per energy output in MJ. Apart from this indicator, other usual indicators were also set such as the energy of production and economic efficiency of production. The statistical results can also be defined for all the other indicators. Aside from direct classification of soil and climatic conditions, other soil properties, available from the monitoring of the Research Institute for Soil and Water Conservation, were subjected to regression analysis.
With respect to emission impacts, perennial energy crops (silage sorghum, sorrel, hemp), should be encouraged. The current status among major energy crops is of the corn silage with good emission characteristics, but it is necessary to ensure the proper growing conditions with regard to soil quality. The exploration of energy outputs diminishes the nutritional properties of food crops. In spite of this, the analysis shows that in terms of emissions the energy crops bring more benefits when grown under marginal conditions, if the cultivation of these crops under the respective conditions is possible. From the point of view of impact on the soil and sustainable development, justified cultivation of alfalfa with a proven influence on the amelioration of compacted soils is crucial. Alfalfa has increased emission effects compared to clover due to harvesting with a high-power cutter. In the case of alfalfa harvesting on hay, its emissions are comparable to clover. Due to the increasingly difficult search for suitable biomass for energy production while respecting the requirements for food production, alfalfa production is a suitable solution for ensuring the quality of soil and replacement biomass for current energy crops. From the point of view of sustainable development, this solution is very essential for obtaining biomass from agricultural sources. The overall use of results should be based on the evaluation of Pareto optimality [
16] in line with the current production options and requirements determined by policies and thorough knowledge of territorial aspects of production. For the sake of further development, the use of maps with the impacts of production on emissions under specific conditions is expected. In the future, it is possible to consider a comprehensive assessment of emission effects in agriculture [
66].
The article provides a comprehensive view of the joint impact of natural factors on energy, economic and environmental indicators, and thus provides a better picture of their impact on measures for further development of energy in regions and for agricultural policy. As Wohlfart [
8] writes, a comprehensive assessment of all contexts is always important for further assessment of a bioeconomy, and therefore also for energy policy. For further development, it is important to compare modeled and measured results in connection with local land conditions for a real evaluation of the conditions of the whole region.
One of the best examples of aligned energy generation and food production is the use of alfalfa as a sanitary crop to address subsoil compaction and as a crop that can help reduce maize silage on the soils at risk of erosion and emissions impact [
11,
67]. Deep-rooting crops are a desirable source of carbon in the deeper layers of the soil, where they also ensure the stability of soil aggregates and sufficient soil permeability. Knowledge of local conditions and their appropriate agricultural use should also become part of the Green for Europe strategy [
68], which assumes keeping global warming below 1.5 °C while still reducing greenhouse gas emissions. The main advantage of energy crops for the low-carbon economy is their potentially lower CO
2 production, especially in marginal areas with less soil depth, slope and stoniness. Higher variability of biomass production in the field, taking into account the requirements of sustainable energy, can also lead to higher deregulation and liberalization of the energy market. See [
69] for case of ensuring sufficient biomass capacities.


