
Methodology to Evaluate the Impact of Electric Vehicles on Electrical Networks Using Monte Carlo †

 , ,
, ,  , ,
, ,  , , and
Abstract
1. Introduction
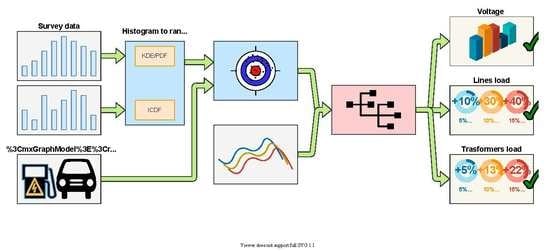
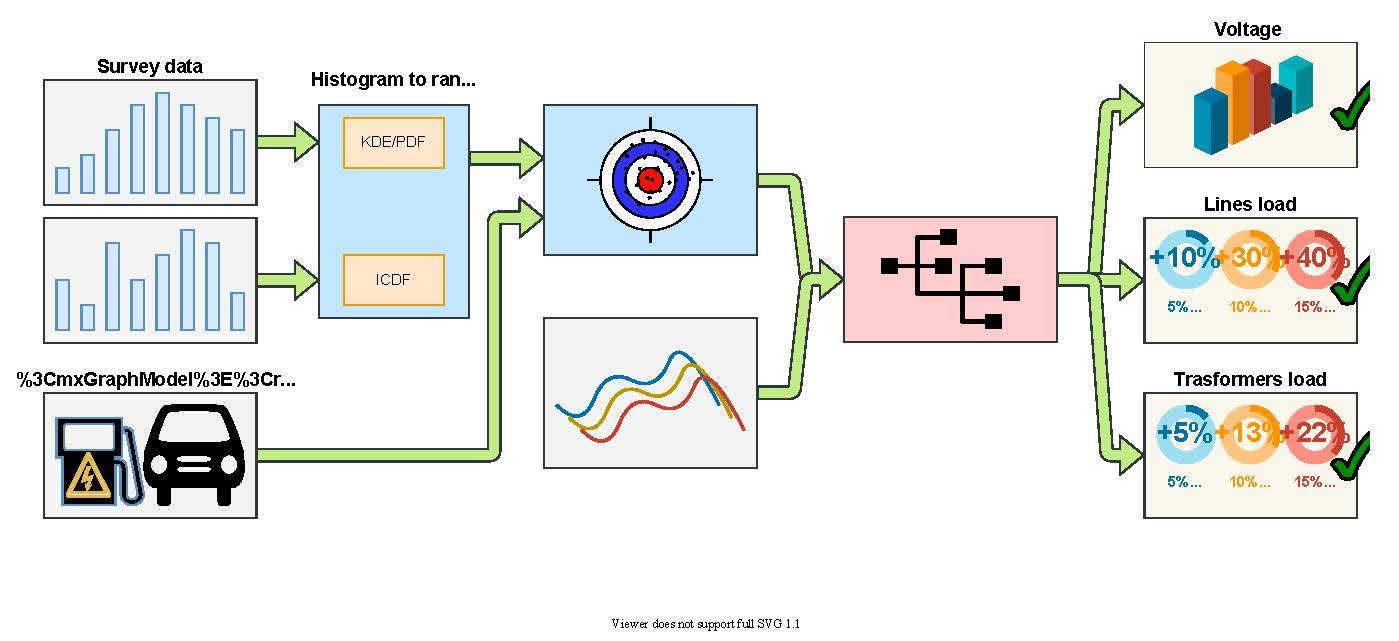
2. Methodology
2.1. Description
2.2. Model For EV Charging
2.2.1. Daily Mileage
2.2.2. Charging Behavior
- Start charging time: A parameter that indicates the time of day when the user begins to charge his/her PEV.
- State-of-charge (SOC): This is the state of the battery at a given moment, assuming that the battery is fully charged after ending the charging processes; the SOC when the charging processes ends is 100%, and it decreases as the vehicle is used. Equation (2) is adapted from [18] and describes how to calculate SOC from daily mileage (), EV performance (), and battery capacity (C).
- Charge preferences (user SOC): This parameter indicates the user preference to charge his/her PEV, that is the battery charge level when the user chooses to connect the PEV to the charging station.From these parameters it is possible to determine the number of charging hours for each user and the starting time of charge. Charging time (H) depends on residual battery power (), charger efficiency (), battery capacity (C), and the rated power capacity of the charger (), as can be seen in Equation (3), which is adapted from [18].
2.2.3. EV’s Electric Energy Consumption
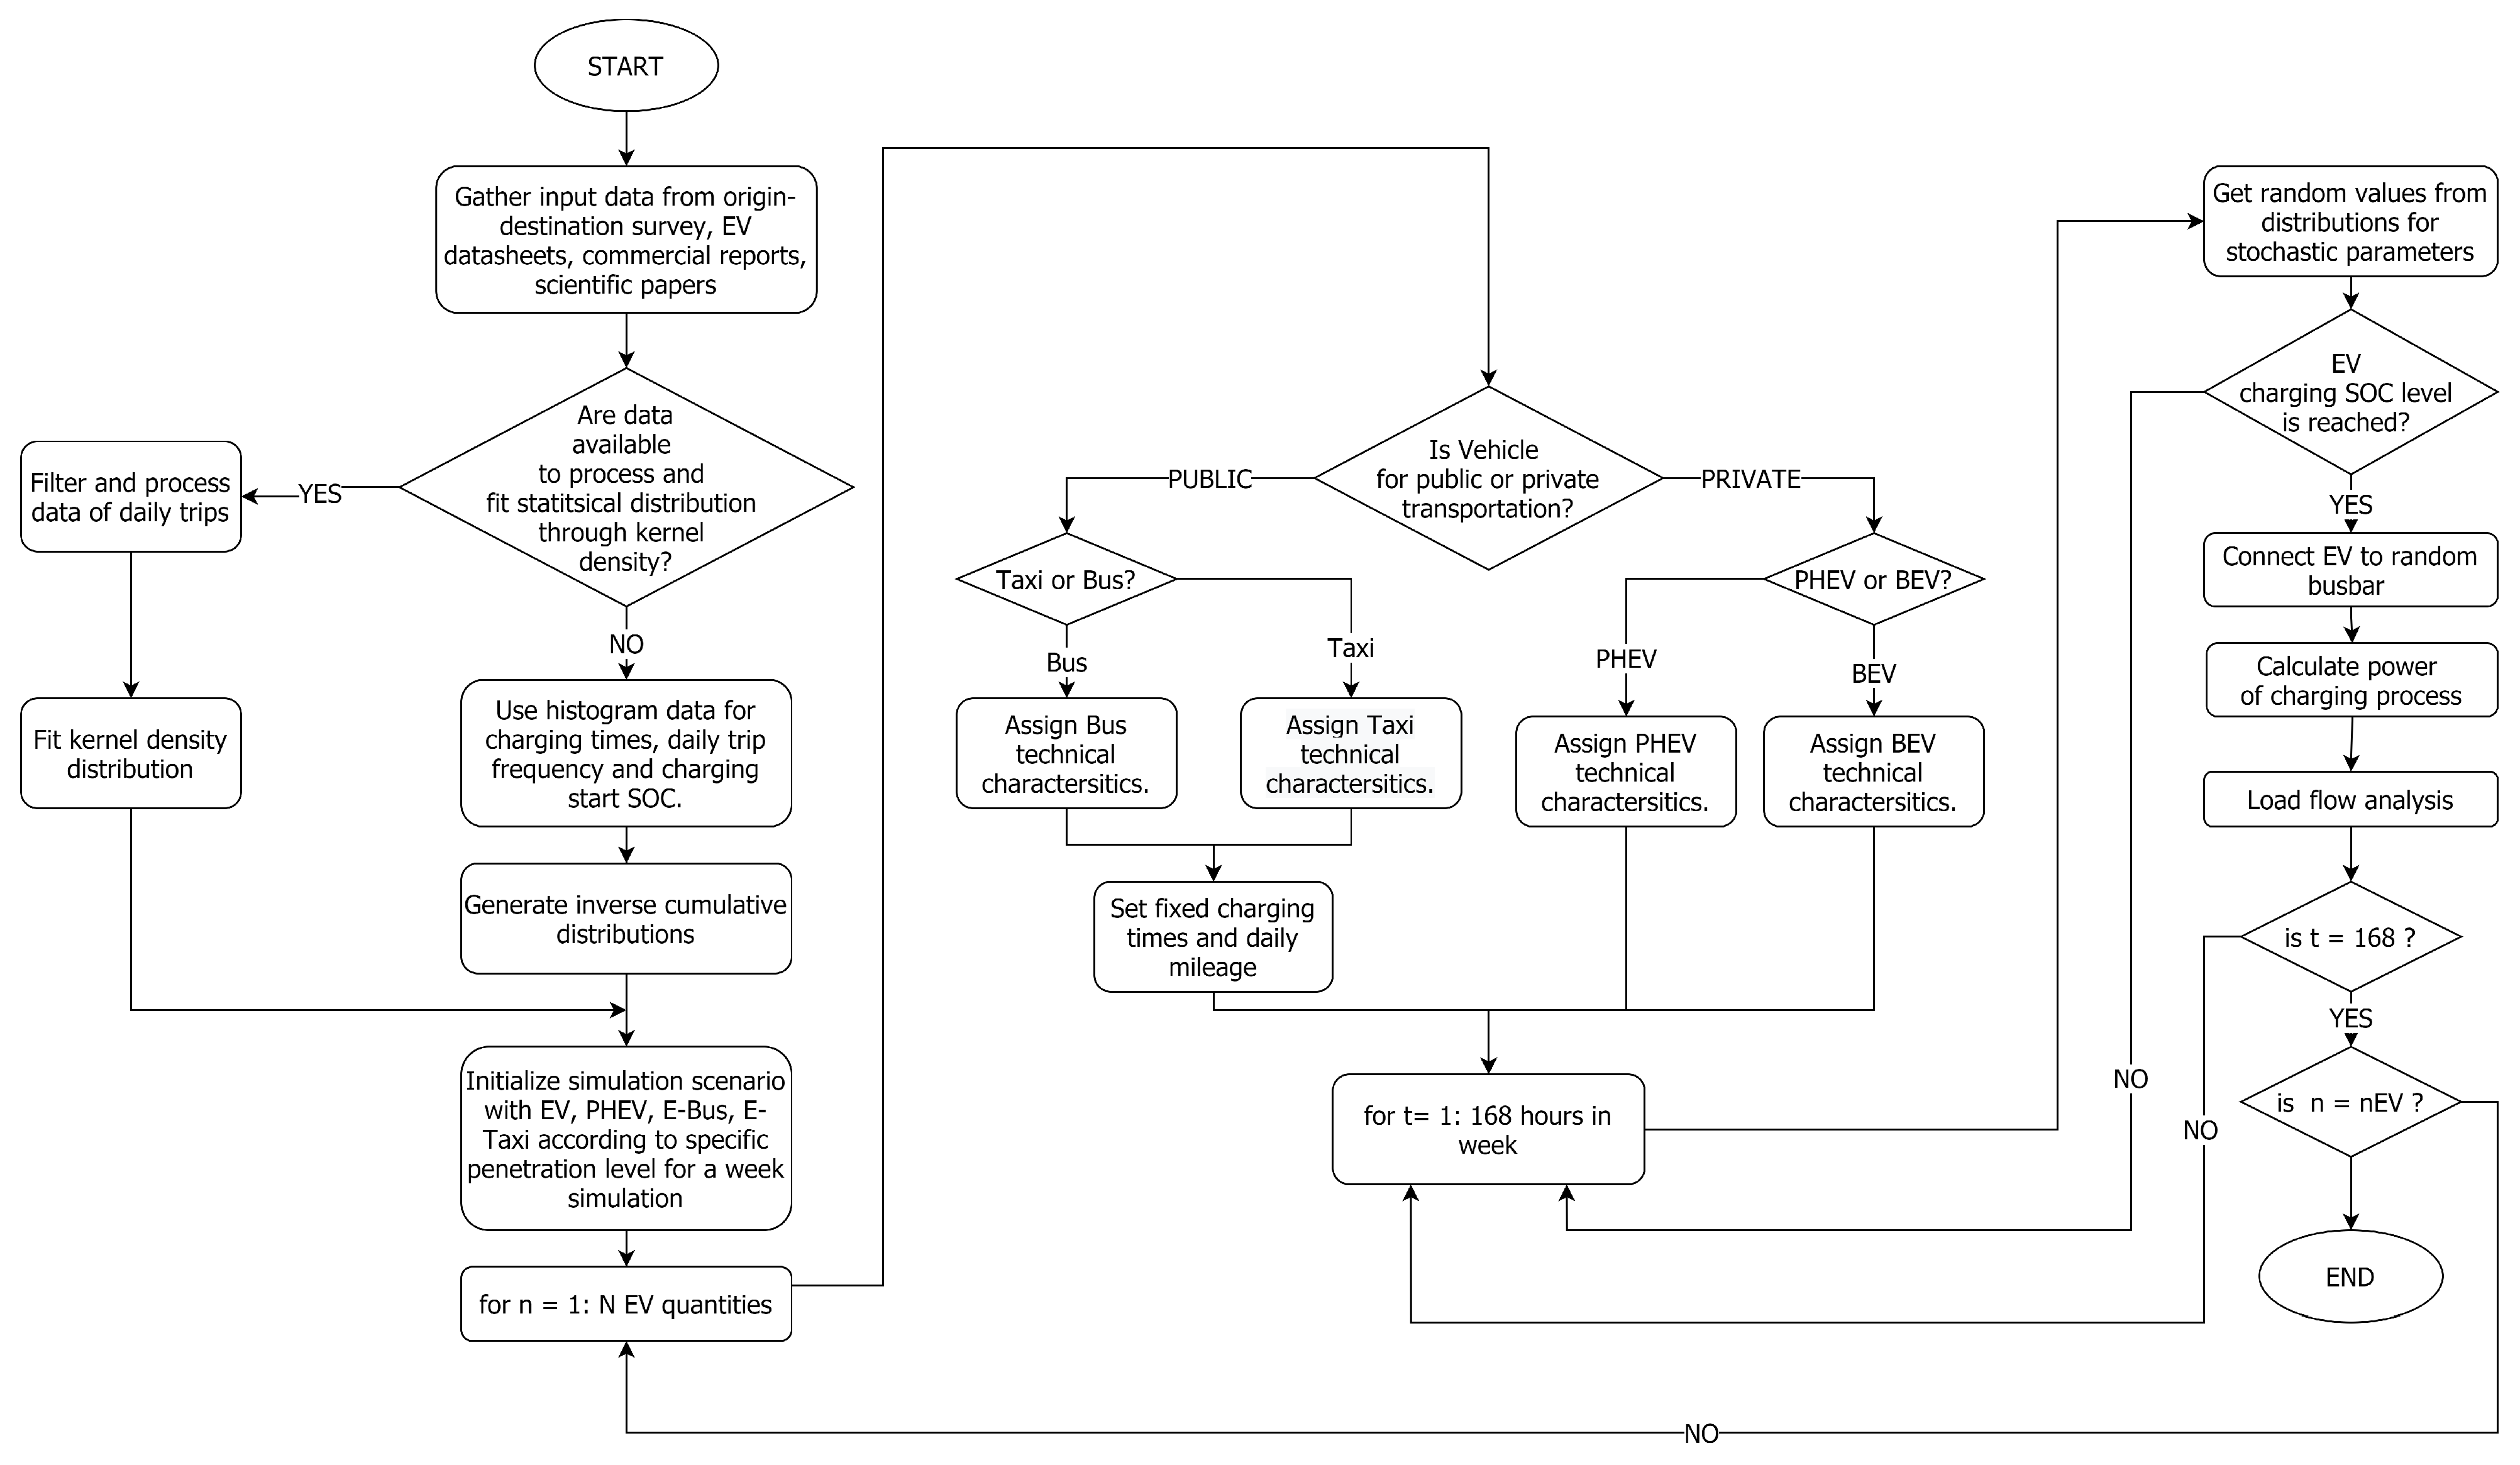
2.2.4. Monte Carlo Simulation
- Model system variables as probability density functions (PDFs) or equivalent inverse cumulative distribution functions (ICDFs).
- Repeatedly sample from the PDFs.
- Compute the statistics and calculations of interest.
3. Study Case and Simulation Results
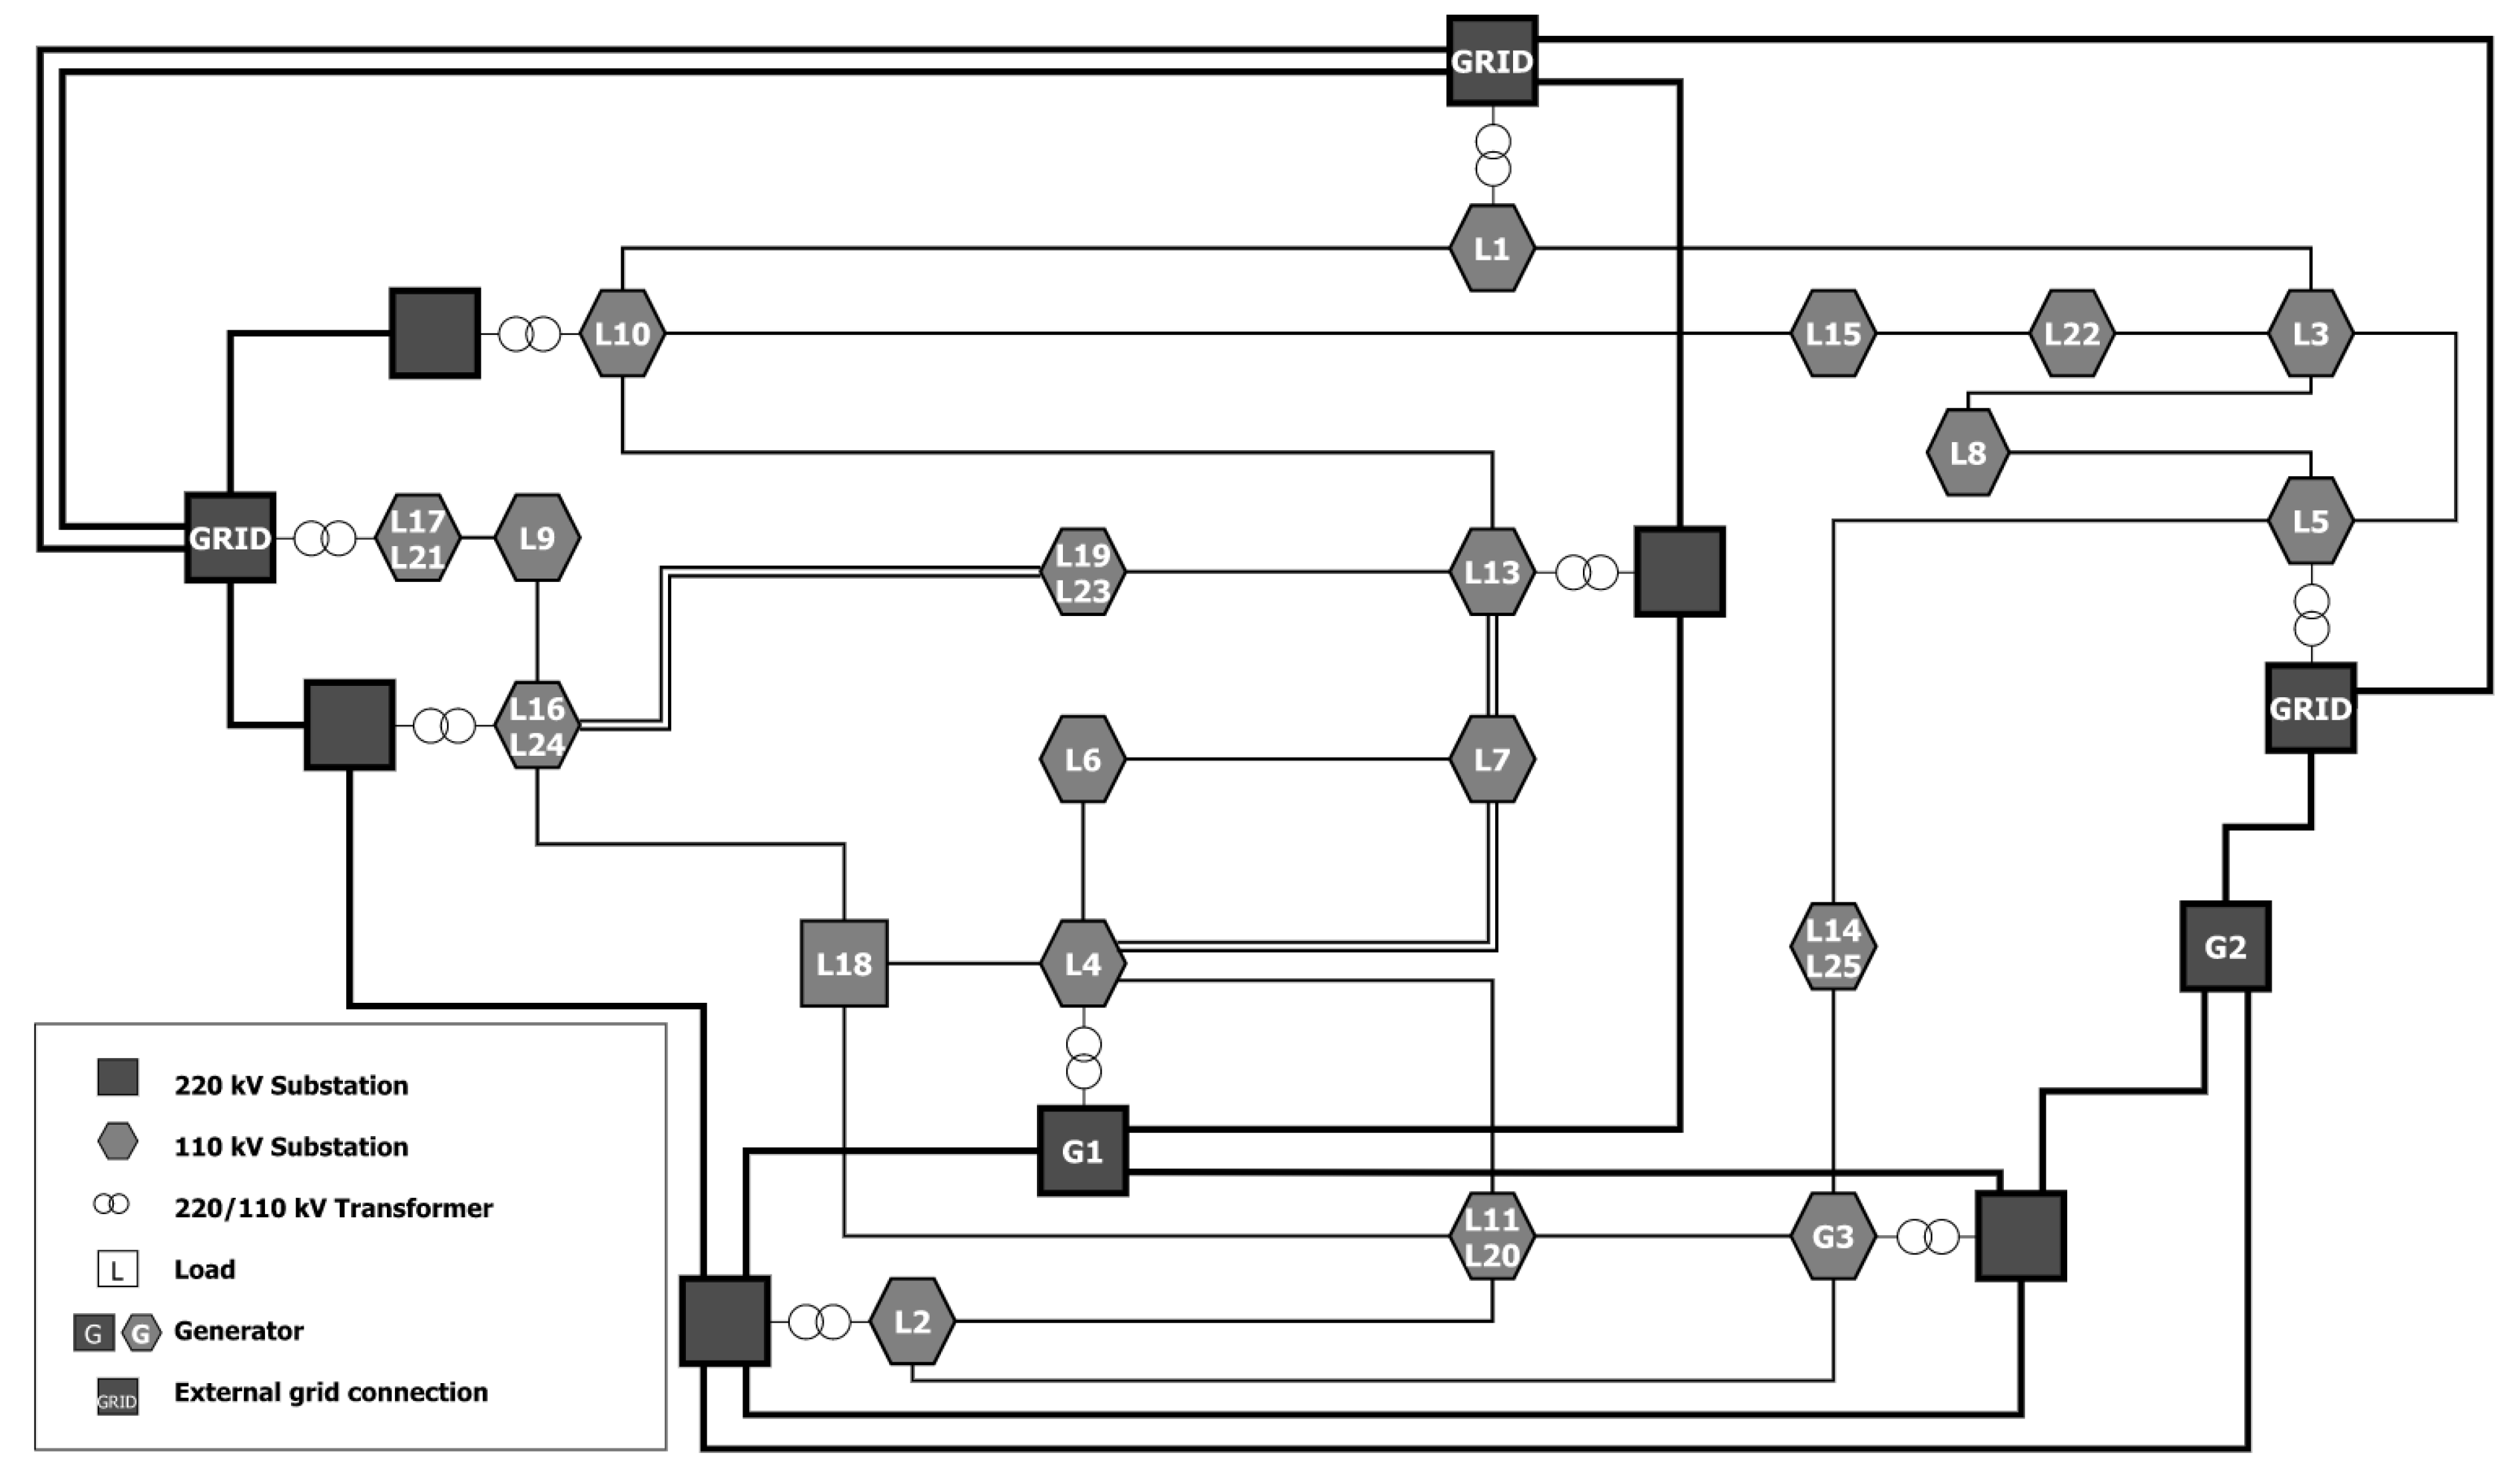
3.1. Network Description
3.2. PEV Types and Characteristics
3.3. PEV Penetration Scenarios
3.4. Daily Mileage
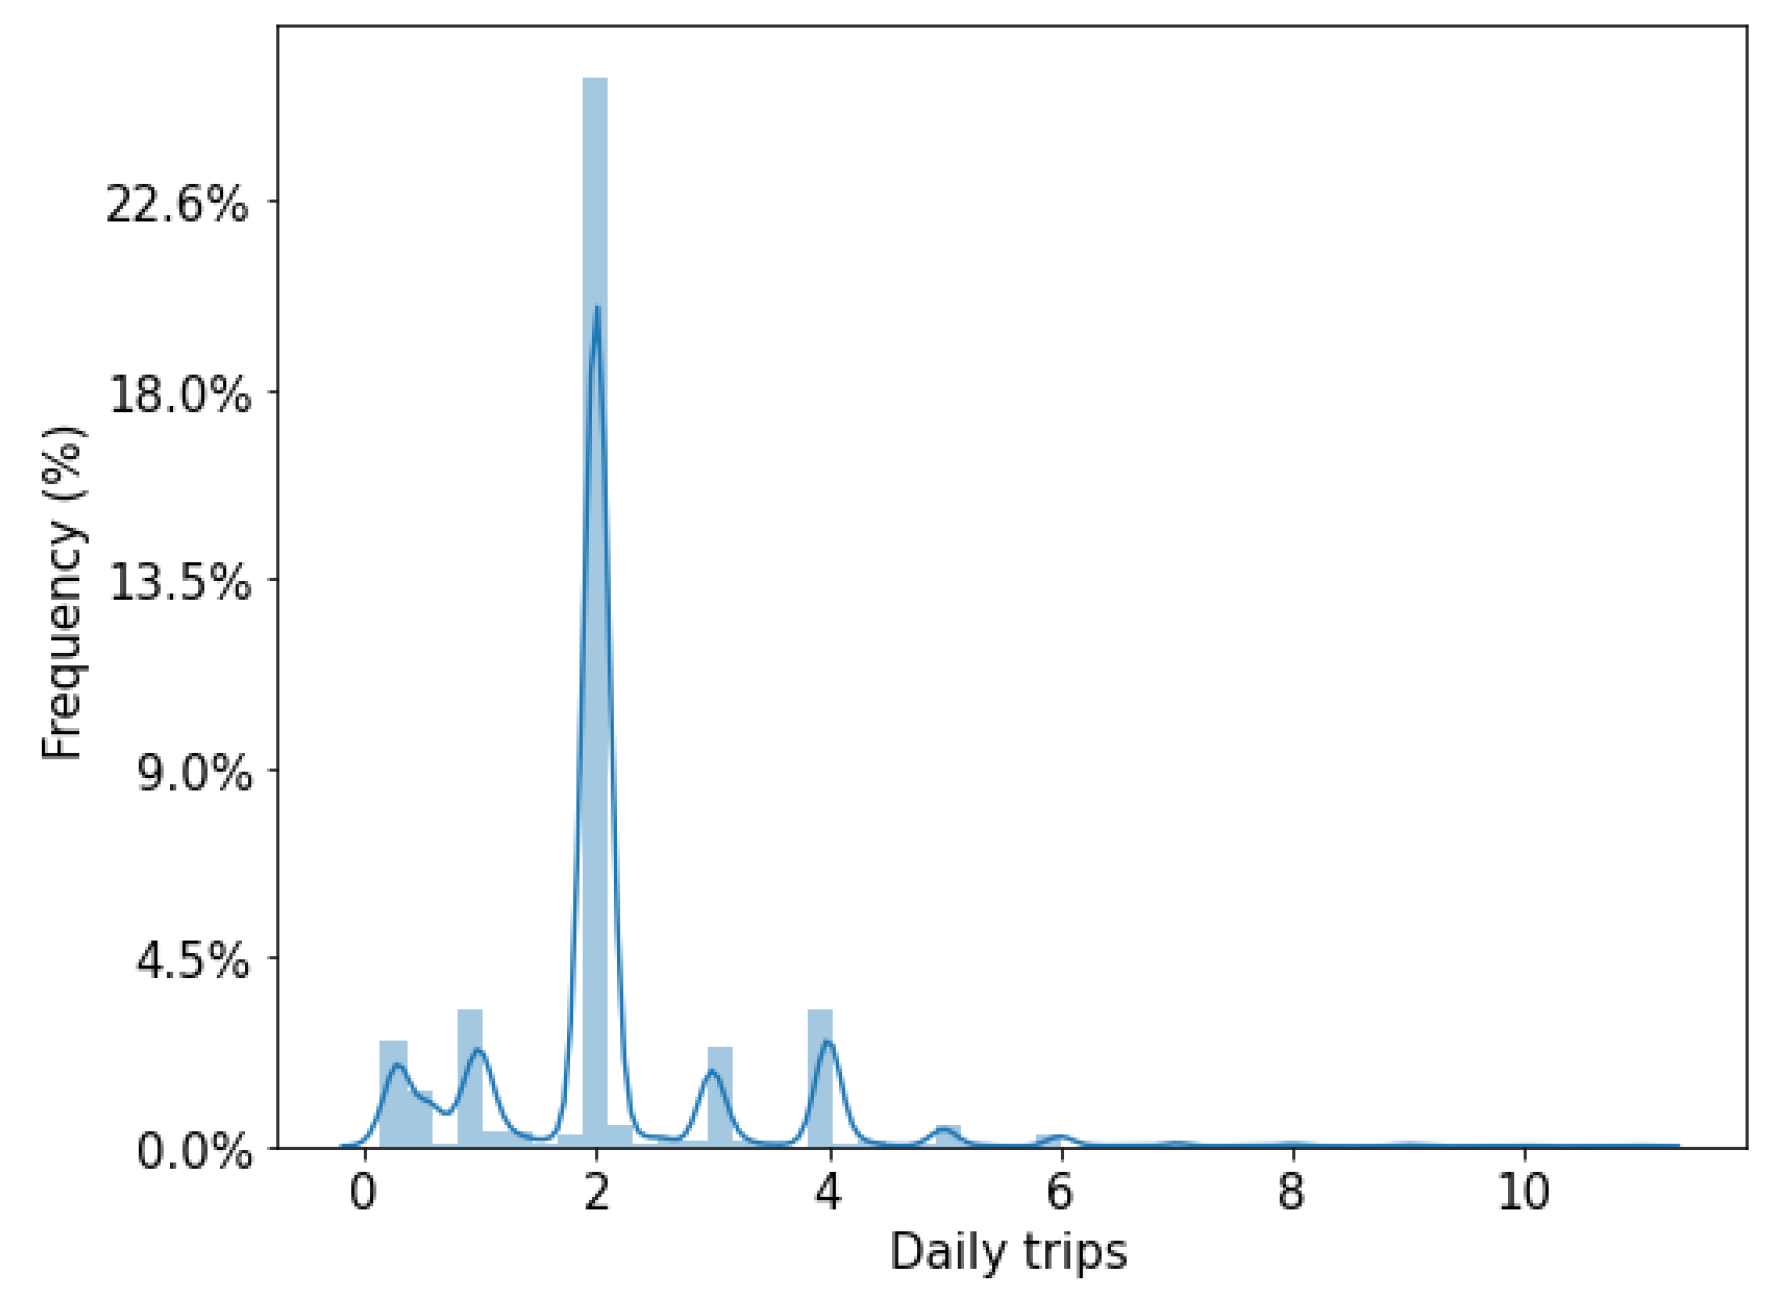
3.4.1. Daily Trips
3.4.2. Distance Per Trip
3.5. Charging Behavior
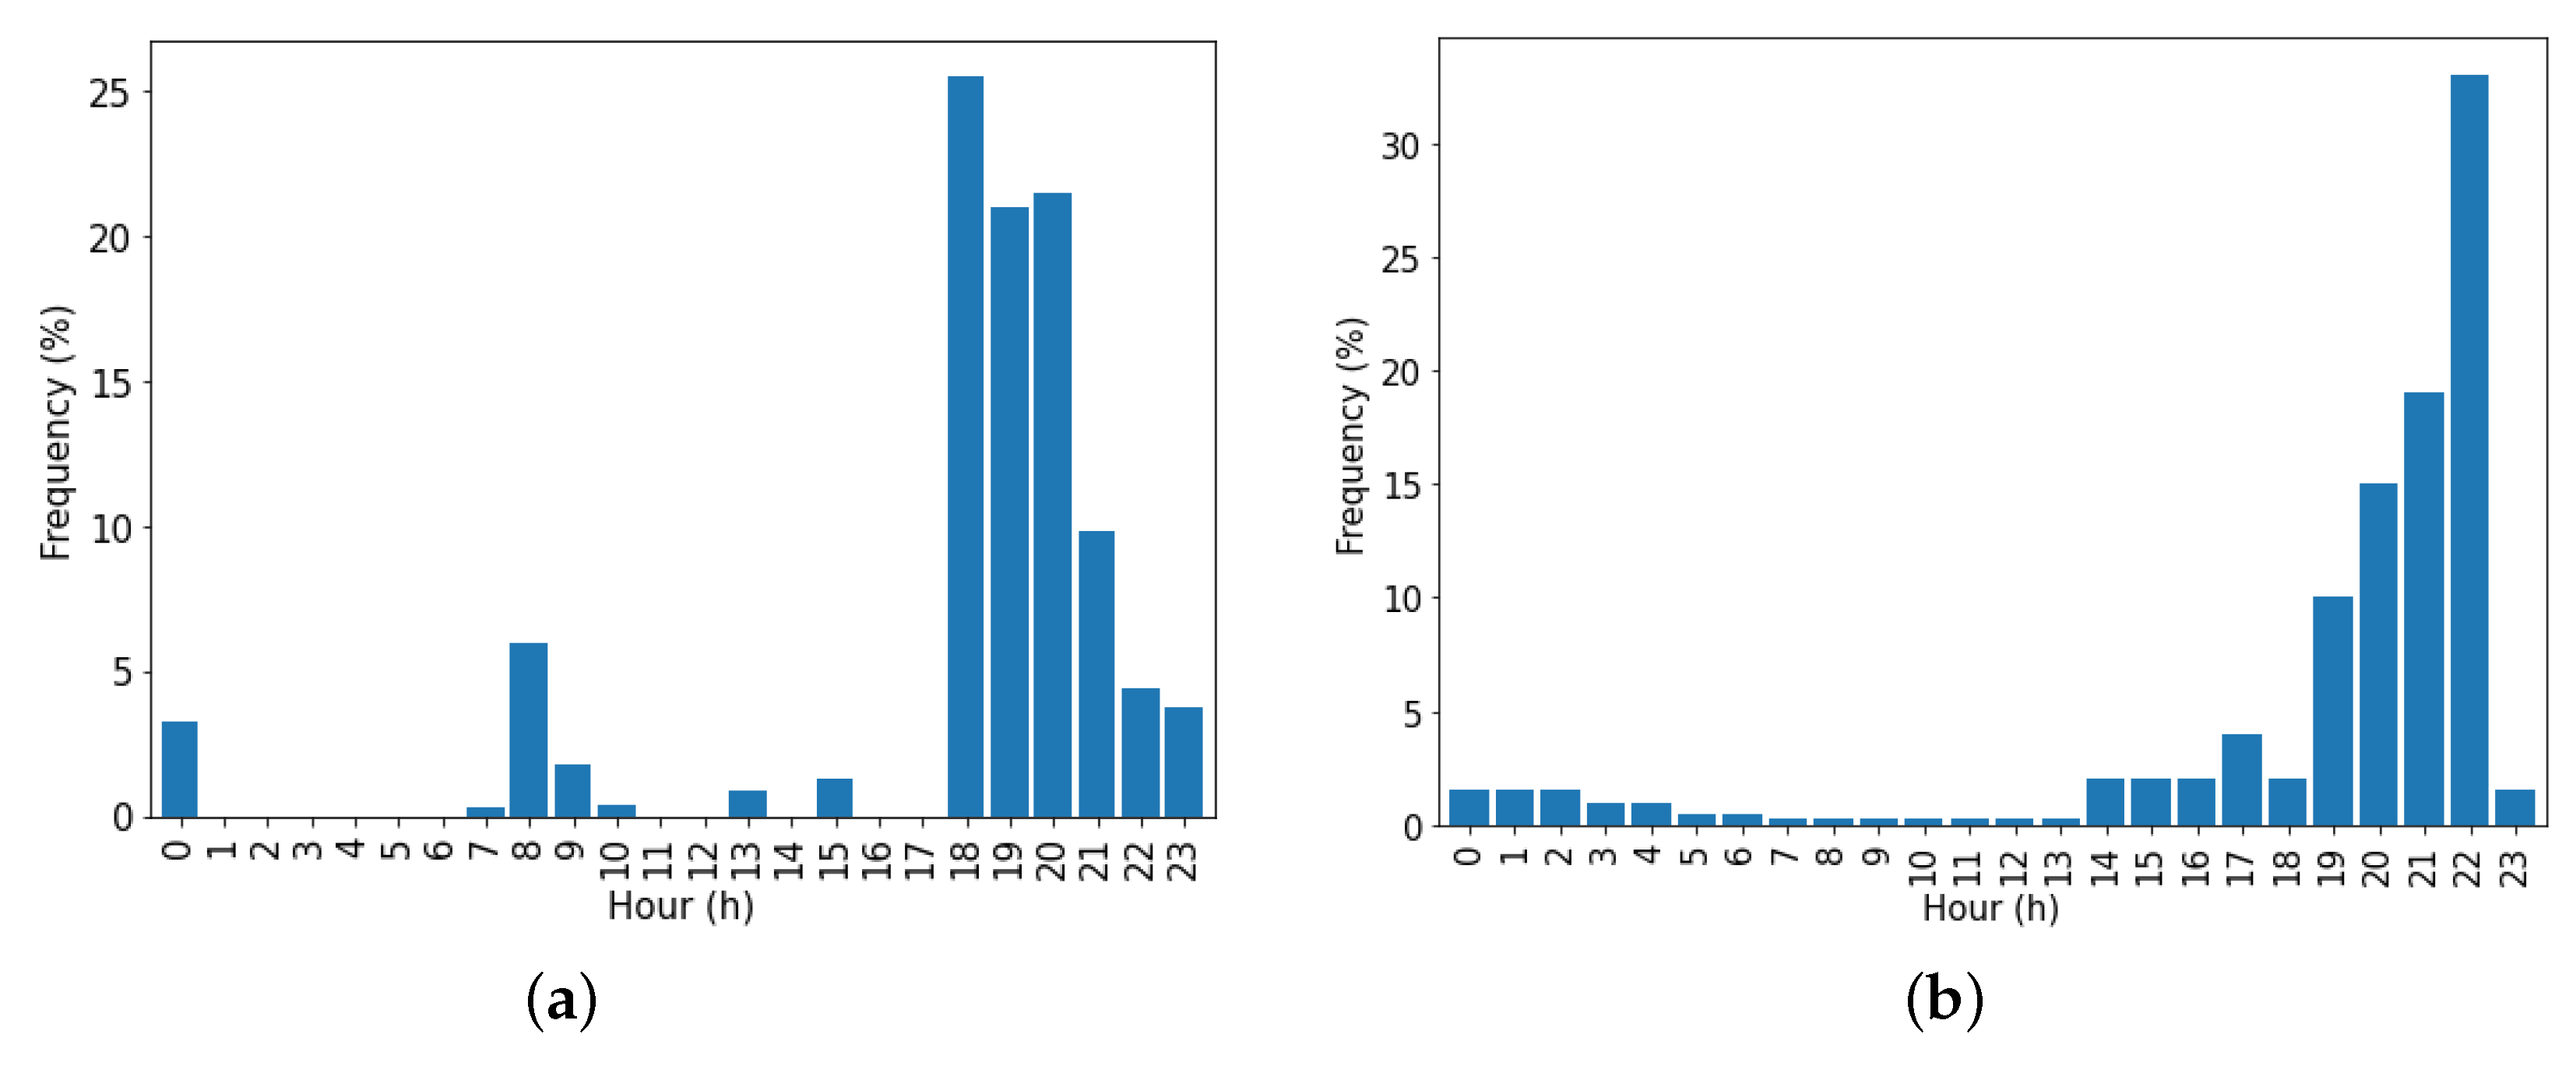
3.5.1. Start Charging Time
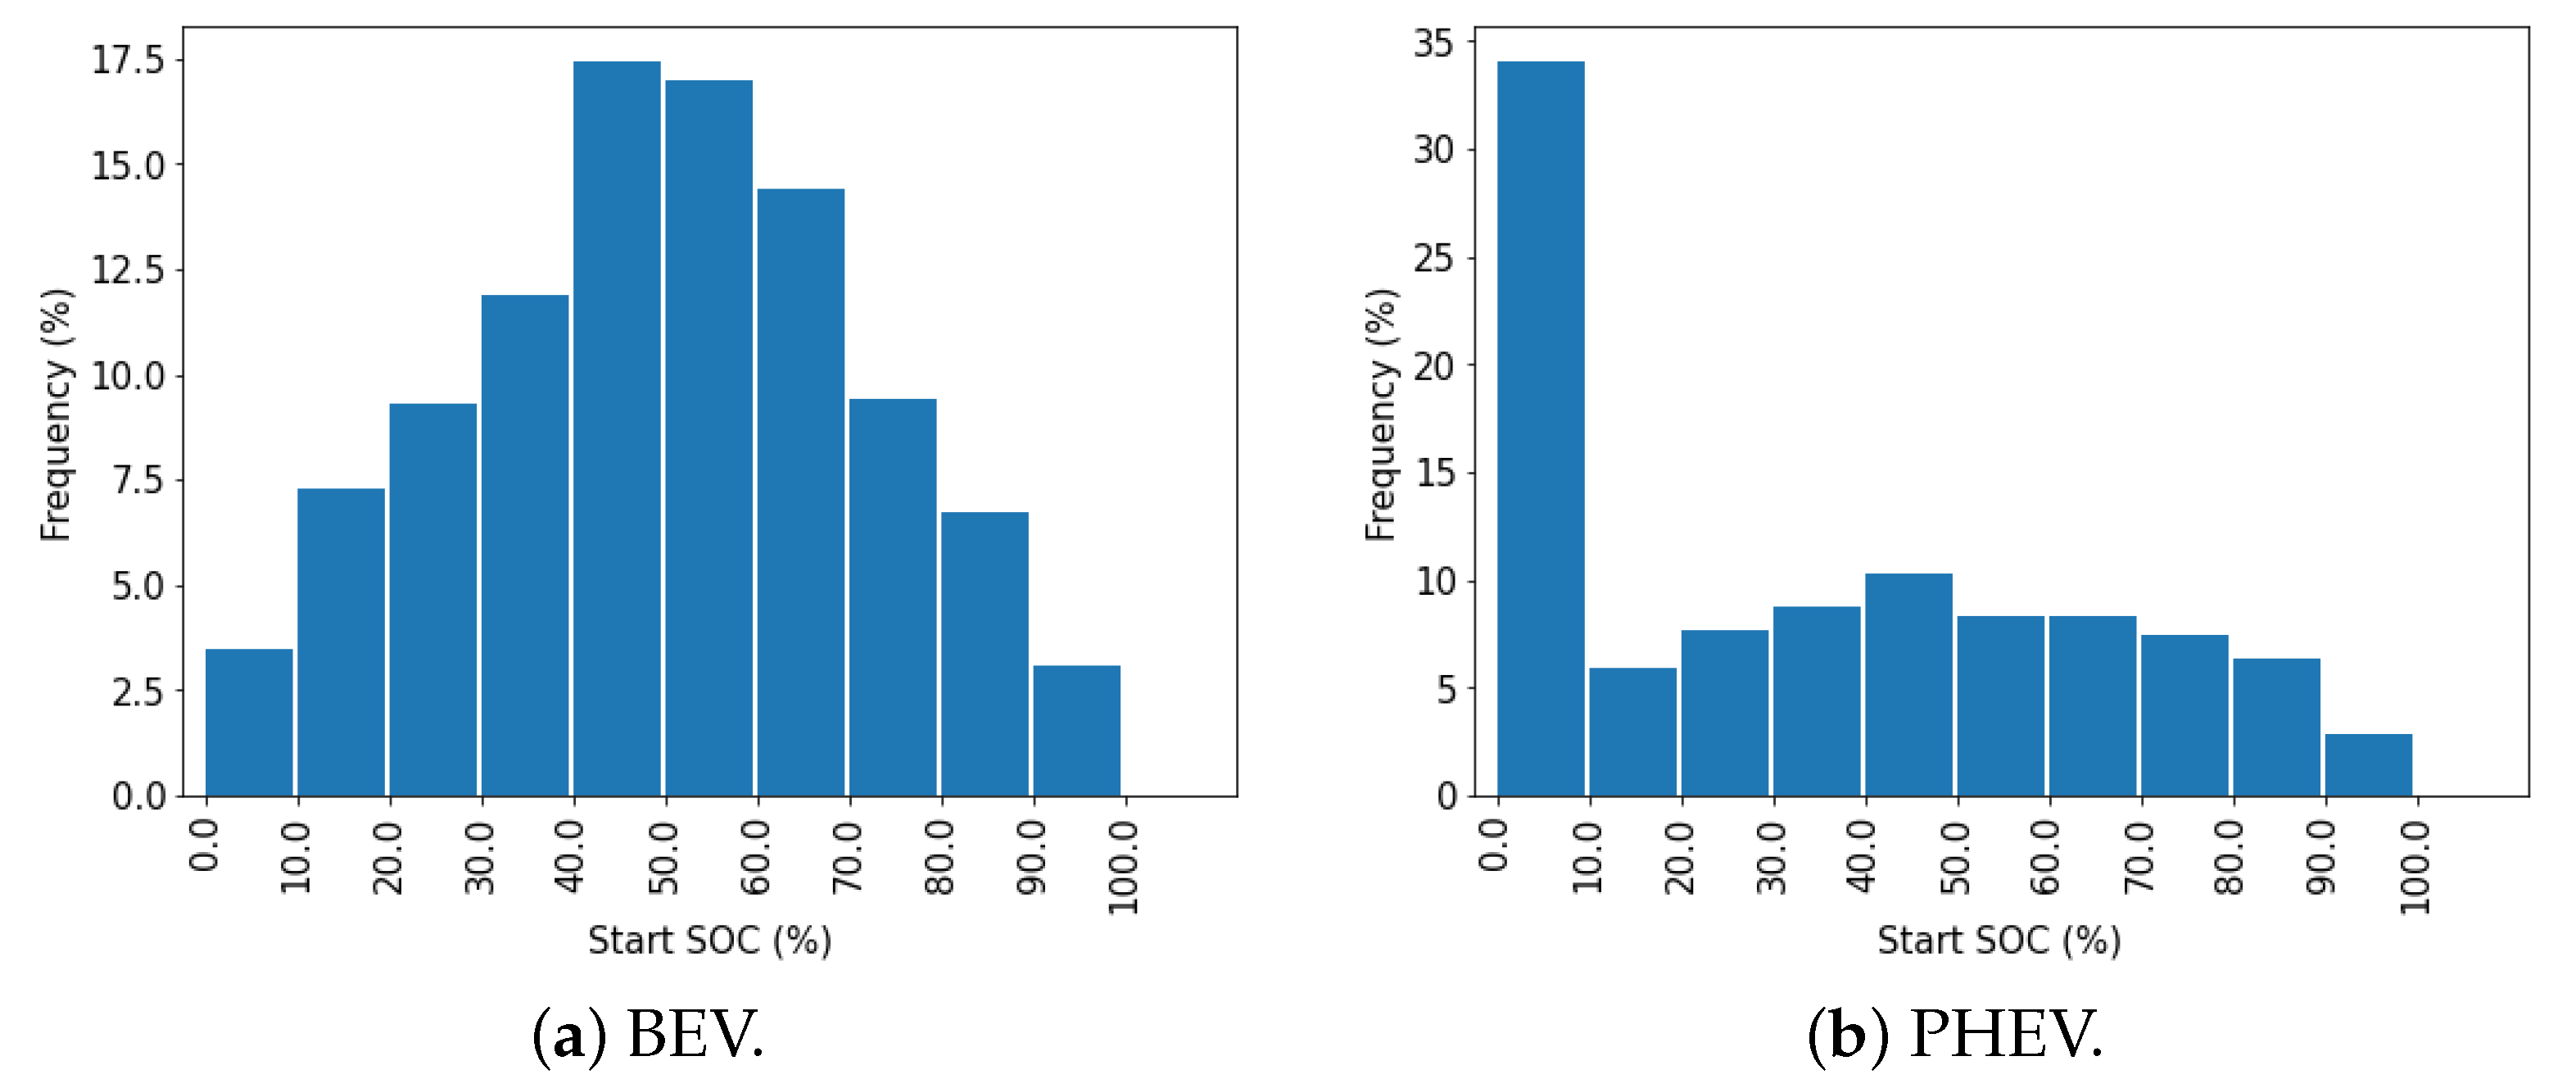
3.5.2. Charge Preferences (user SOC)
3.5.3. Charging Schedule
3.6. Monte Carlo Simulation
- Daily trips
- Distance per trip
- Start charging time
- Charge preferences
- Charge busbar
3.7. Results’ Analysis
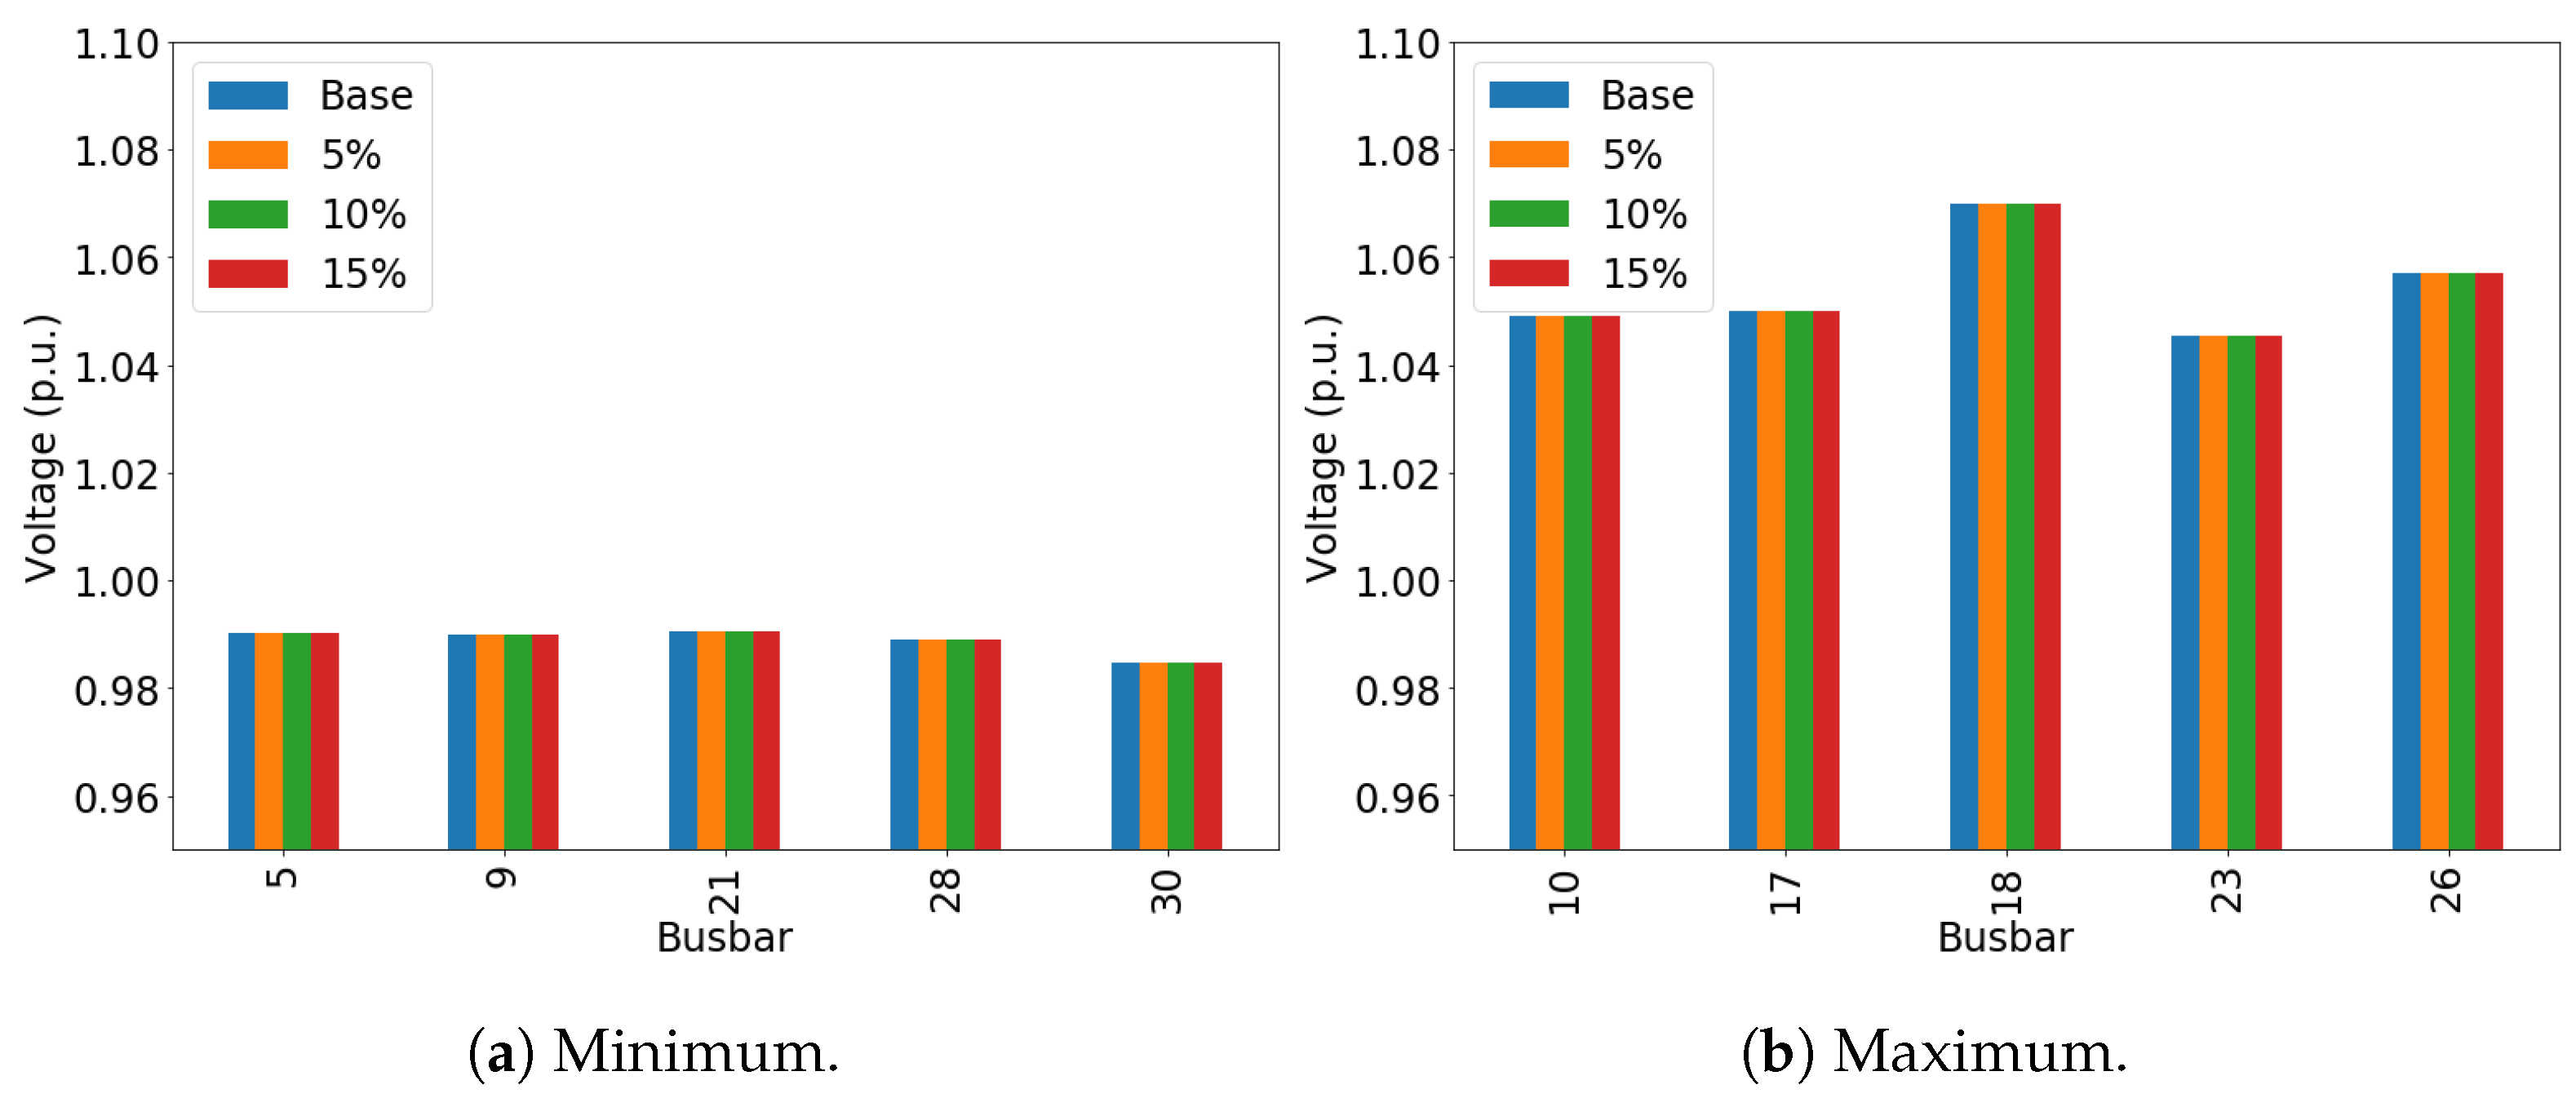
3.7.1. Voltage Results
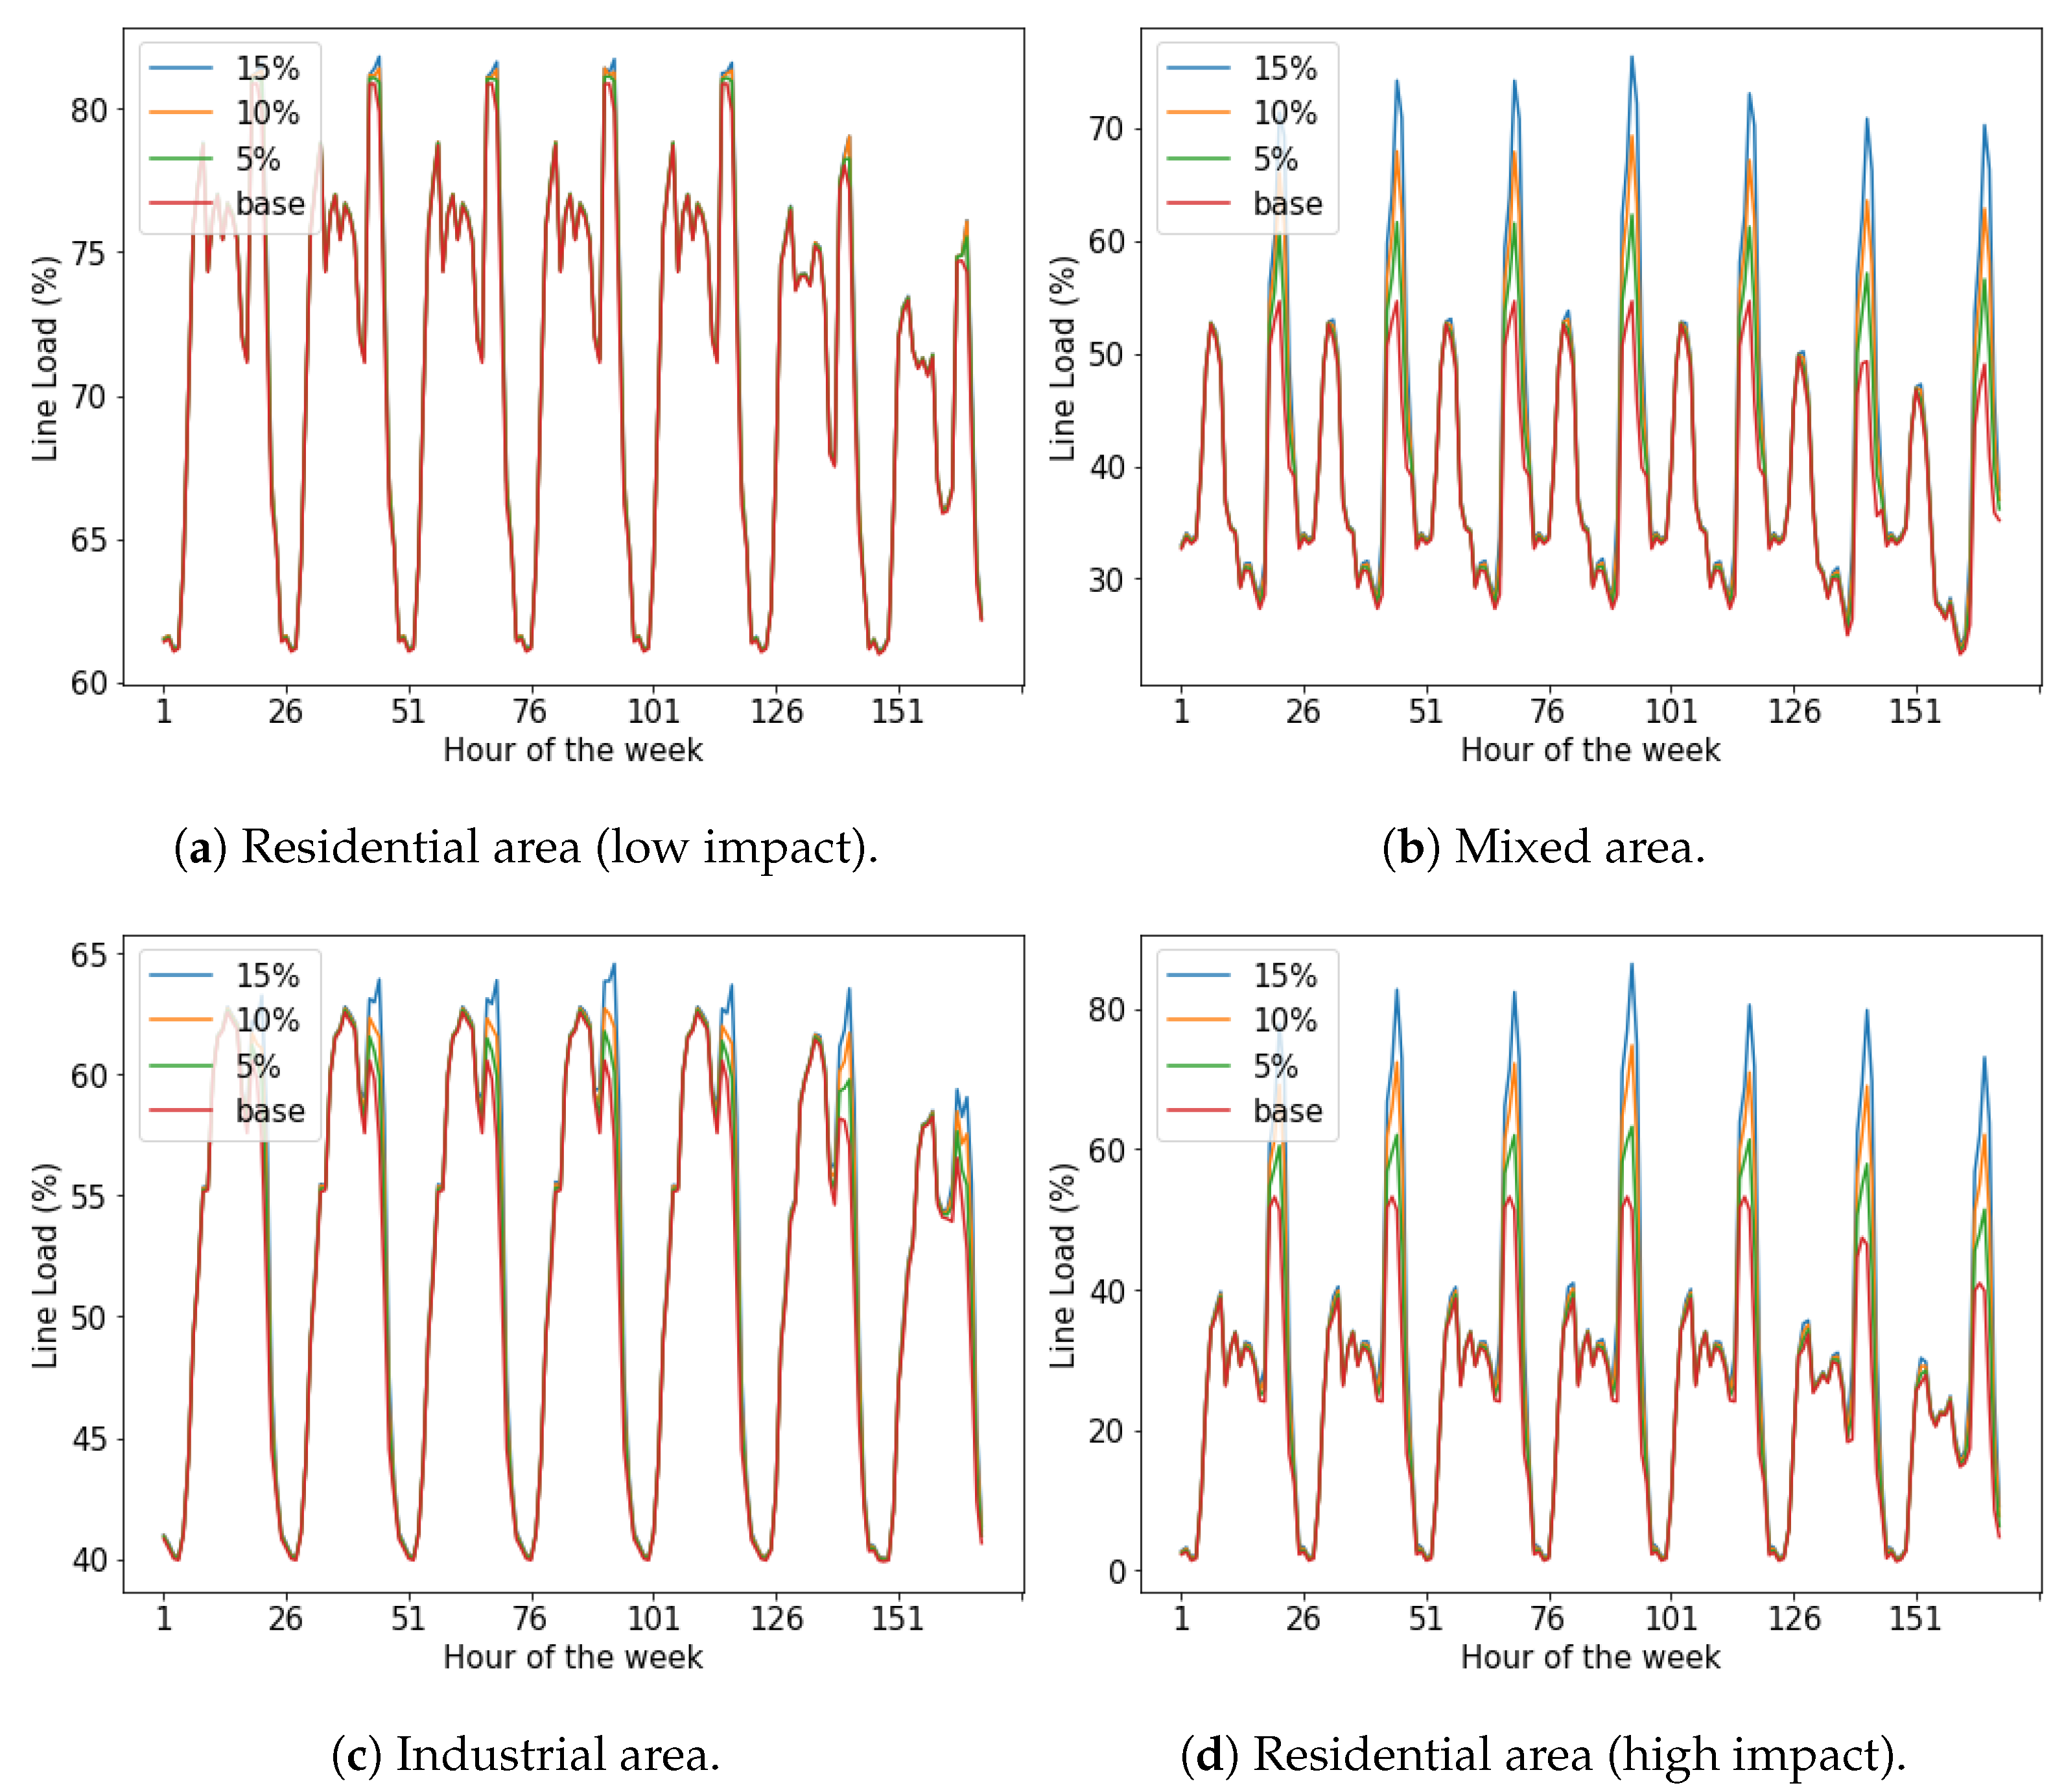
3.7.2. Lines’ Load Results
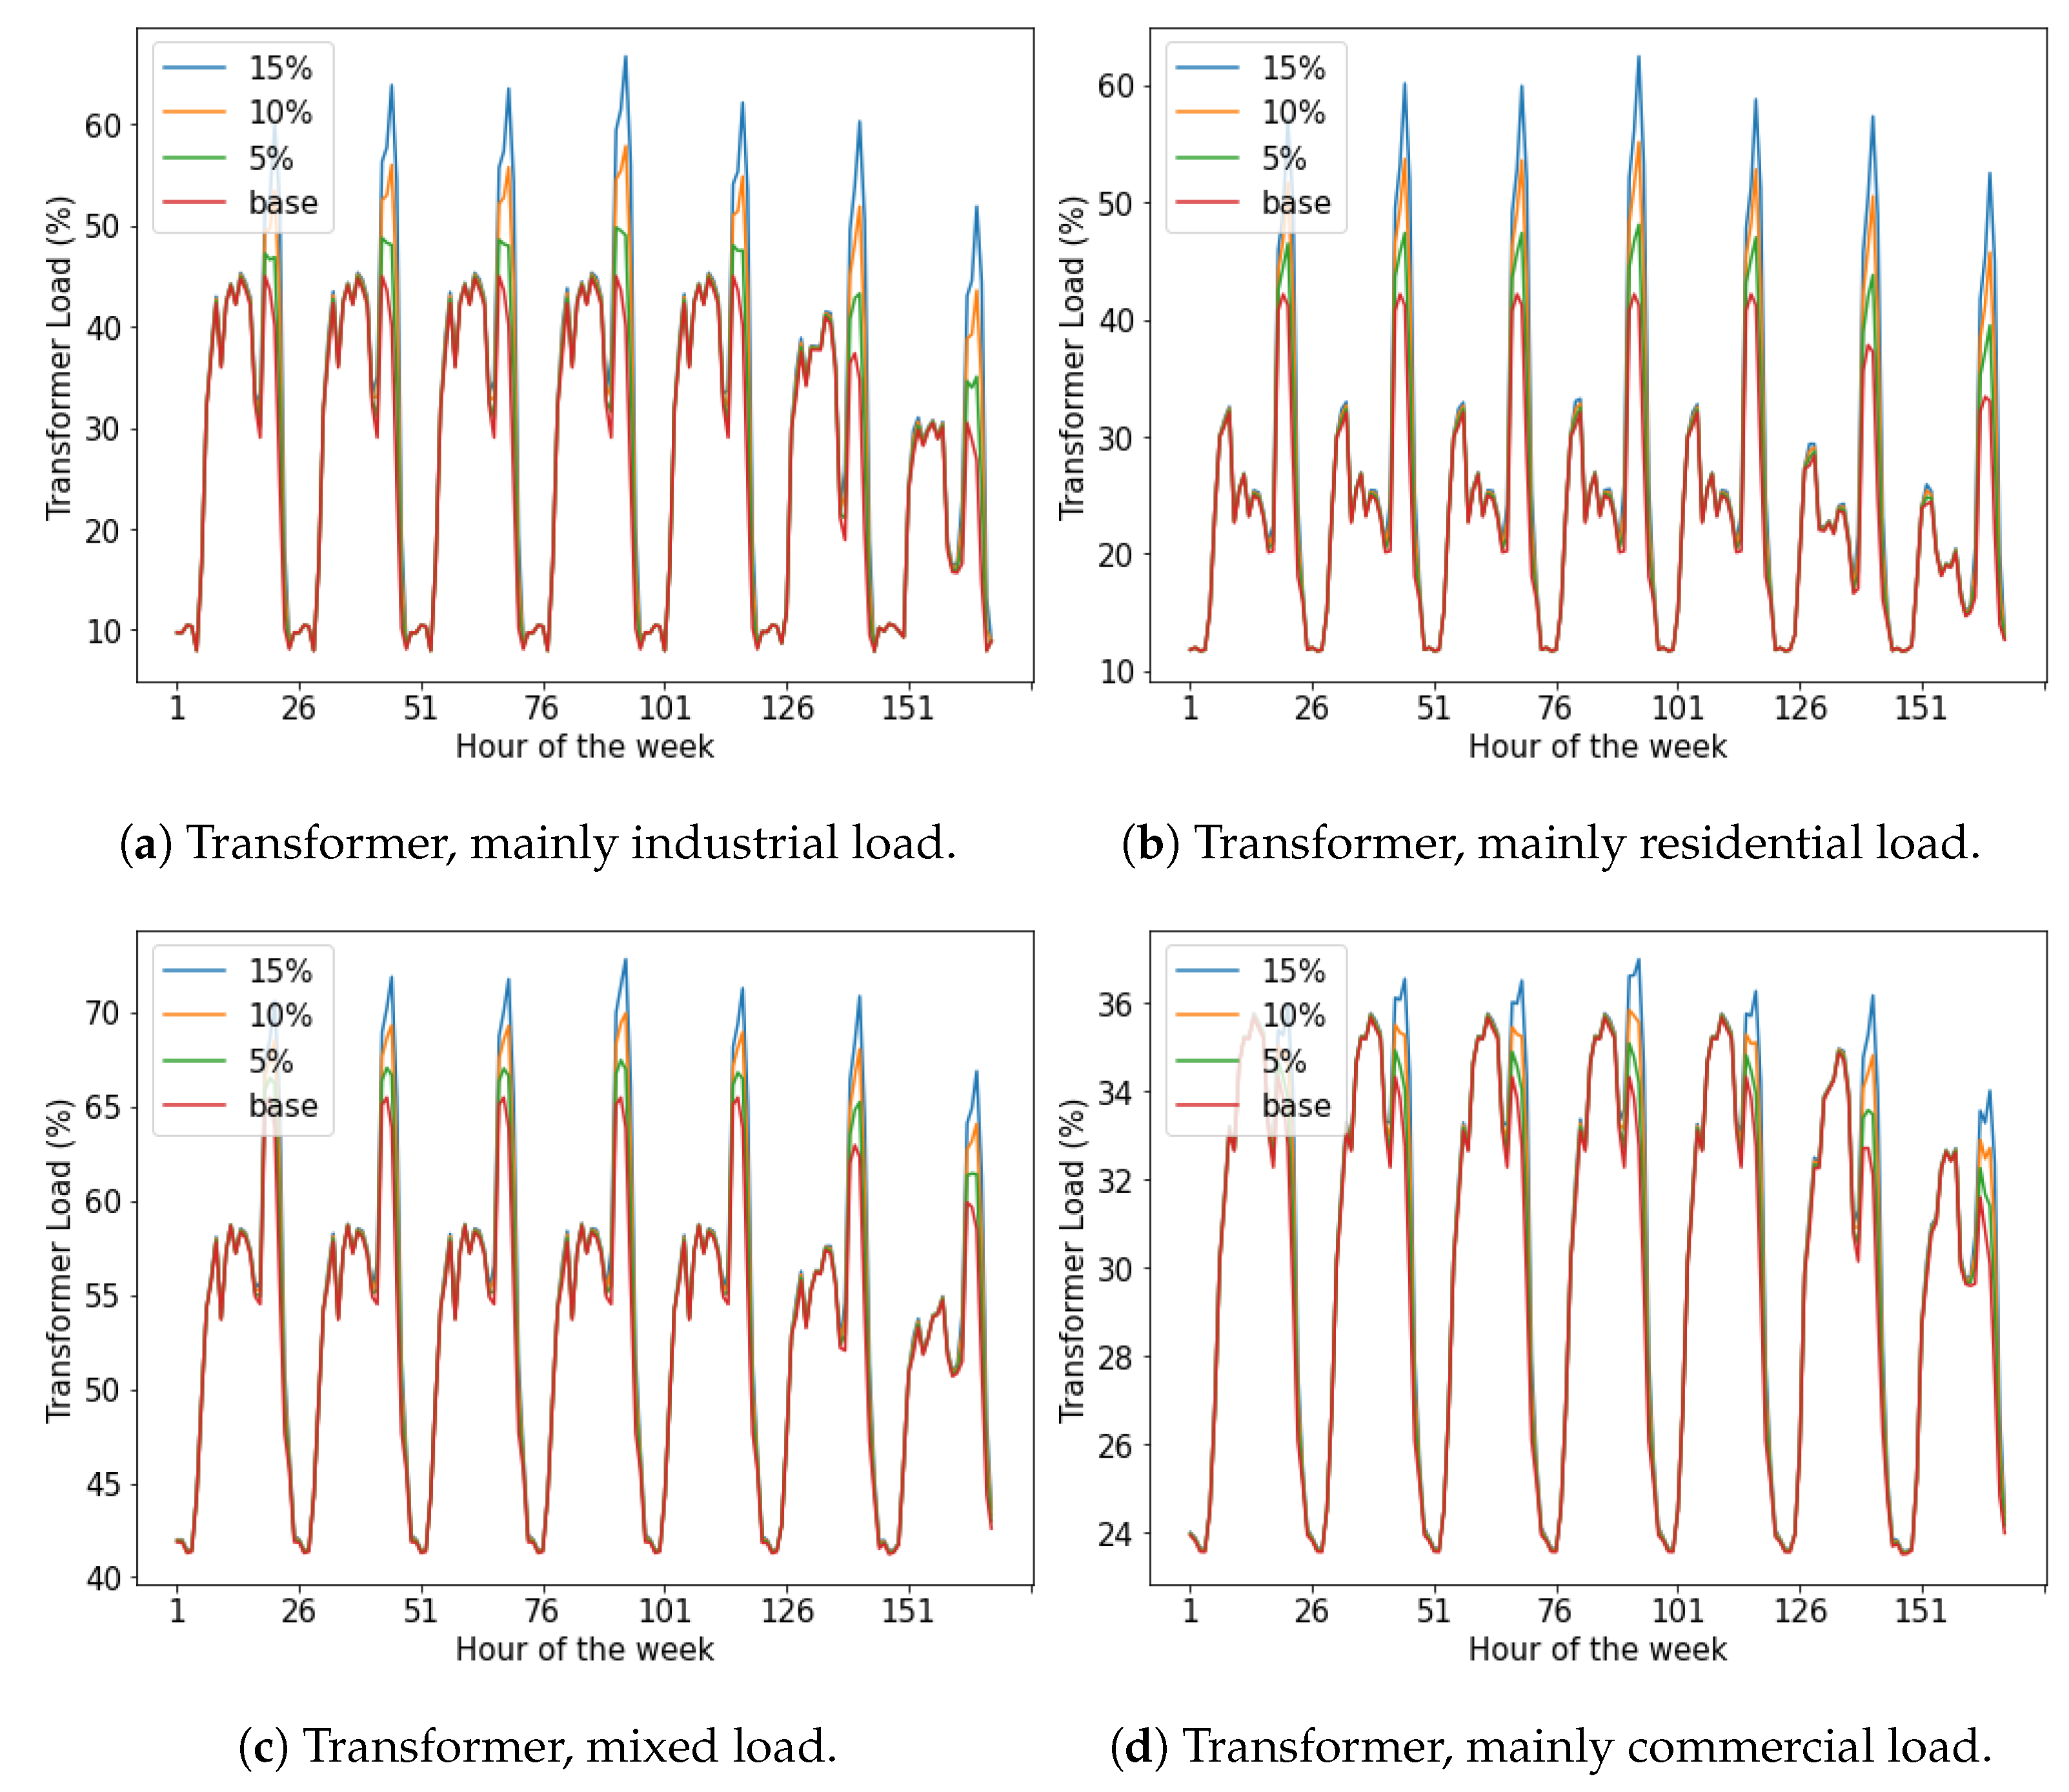
3.7.3. Transformers’ Load Results
4. Discussion
5. Conclusions
- The quantile function (ICDF) is a useful tools to produce non-uniform random values in Monte Carlo simulations. These can be used as an alternative when using histograms (raw data are scarce) and regional probability density functions to model stochastic variables required in EV simulations, like mileage driven and start charging time, are not known.
- In a high PEV penetration scenario, a load increase of up to 40% in lines between Hours 18 and 24 is expected. Lower penetration scenarios may carry load increases between 10% and 30% in lines. It is necessary to promote the creation of public access charging stations in commercial areas, universities, and companies, in order to encourage different schedules of vehicle charging and to try to balance loadability and avoid bottlenecks in networks.
- Due to the stochastic nature of the location of residential EV charging stations, it is necessary to encourage the charging of EVs in different areas of Colombian cities and at different times of the day, in order to prevent distribution system equipment overloading in certain areas of a city at load peak hours. In a high PEV penetration scenario, the maximum load increase of the transformers is close to 22%; however, this equipment does not reach an overload state.
- It is necessary to classify the total load into residential, industrial, and commercial categories in order to correctly evaluate the impact of EV charging on different distribution systems. It is possible that if the correct category is not assigned to an area, the results would not show problems that may arise due to the nature of the load.
- The proposed methodology can be applied to transmission, as well as distribution networks. A model that represents the PEV charging station distribution across the network in a deterministic way could allow measuring more precisely the impact on the electrical networks. The application of this kind of charging model on distribution networks, where the impact of PEVs is expected to be higher, could allow performing a more successful system planning analysis.
- The presented methodology was applied to the Antioquia transmission network. According to the results in the high PEV penetration scenario, the capacity of the grid in 2030 can withstand the effect of EV charging and does not need an upgrade.
- Electrical systems with electrical urban rail transit systems, like the study case, can make use of the existing traction substations to feed future charging points for buses and taxis at valley hours, allowing the use of the existing robust infrastructure without increasing the load on other distribution networks.
Author Contributions
Funding
Data Availability Statement
Acknowledgments
Conflicts of Interest
Abbreviations
| BEV | Battery electric vehicle |
| CDF | Cumulative distribution function |
| E-bus | Electric bus |
| E-taxi | Electric taxi |
| EV | Electric vehicle |
| ICDF | Inverse cumulative distribution function |
| KDE | Kernel density estimation |
| p.u. | Per-unit |
| Probability density function | |
| PEV | Plug-in electric vehicle |
| PHEV | Plug-in hybrid electric vehicle |
| SOC | State-of-charge |
References
- Energy Demand Situation in Colombia. Technical Report, Enersinc and DNP. 2017. Available online: https://www.dnp.gov.co/Crecimiento-Verde/Documents/ejes-tematicos/Energia/MCV-Energy Demand Situation VF.pdf (accessed on 20 March 2020).
- Ministerio de Transporte; RUNT. Runt en Cifras. Available online: https://www.runt.com.co/runt-en-cifras (accessed on 2 May 2021).
- IEA. Global EV Outlook 2020; Technical Report; IEA: Paris, France, 2020. [Google Scholar]
- XM. Boletín Energético # 179 Seguimiento a Variables; Technical Report; XM: Medellín, Colombia, 2019. [Google Scholar]
- World Energy Council; Oliver Wyman. World Energy Trilemma Index; Technical Report; World Energy Council: London, UK, 2020. [Google Scholar]
- Anand, M.P.; Bagen, B.; Rajapakse, A. Probabilistic reliability evaluation of distribution systems considering the spatial and temporal distribution of electric vehicles. Int. J. Electr. Power Energy Syst. 2020, 117, 105609. [Google Scholar] [CrossRef]
- Mao, D.; Gao, Z.; Wang, J. An integrated algorithm for evaluating plug-in electric vehicle’s impact on the state of power grid assets. Int. J. Electr. Power Energy Syst. 2019, 105, 793–802. [Google Scholar] [CrossRef]
- Shafiee, S.; Fotuhi-Firuzabad, M.; Rastegar, M. Investigating the impacts of plug-in hybrid electric vehicles on power distribution systems. IEEE Trans. Smart Grid 2013, 4, 1351–1360. [Google Scholar] [CrossRef]
- Pieltain Fernández, L.; Gómez San Román, T.; Cossent, R.; Mateo Domingo, C.; Frías, P. Assessment of the impact of plug-in electric vehicles on distribution networks. IEEE Trans. Power Syst. 2011, 26, 206–213. [Google Scholar] [CrossRef]
- Tehrani, N.H.; Wang, P. Probabilistic estimation of plug-in electric vehicles charging load profile. Electr. Power Syst. Res. 2015, 124, 133–143. [Google Scholar] [CrossRef]
- Qian, K.; Zhou, C.; Allan, M.; Yuan, Y. Modeling of load demand due to EV battery charging in distribution systems. IEEE Trans. Power Syst. 2011, 26, 802–810. [Google Scholar] [CrossRef]
- Garcia-Villalobos, J.; Zamora, I.; Marinelli, M.; Eguia, P.; San Martin, J.I. Co-simulation with DIgSILENT powerfactory and MATLAB: Optimal integration of plug-in electric vehicles in distribution networks. Green Energy Technol. 2018, 67–91. [Google Scholar] [CrossRef]
- Hinestroza Olascuaga, L.M.; Rosero García, J.A.; Prias Caicedo, O.F. Customer role in the integration of EVs with the Colombian electricity market. In Proceedings of the 2014 14th International Conference on Environment and Electrical Engineering, Krakow, Poland, 10–12 May 2014; pp. 216–221. [Google Scholar] [CrossRef]
- Hinestroza Olascuaga, L.M.; Rosero Garcia, J.A.; Puerto Pinzon, J.E. EVs mass adoption in Colombia—A first approach model. In Proceedings of the 2015 IEEE 15th International Conference on Environment and Electrical Engineering (EEEIC), Rome, Italy, 10–13 June 2015; pp. 1285–1290. [Google Scholar] [CrossRef]
- Villamil, W.; Rojas, C.; Téllez, S.; Rosero, J. Energy demand impact due to mass use of Electrical Vehicles and future Demand Side Management strategies. In Proceedings of the 2015 IEEE PES Innovative Smart Grid Technologies Latin America (ISGT LATAM), Montevideo, Uruguay, 5–7 October 2015; pp. 281–285. [Google Scholar] [CrossRef]
- Téllez Gutiérrez, S.; Villamil, W.F.; Rosero Garcia, J. Electric vehicle charging impacts by increasing demand and varying customer charging behaviors. Int. Rev. Electr. Eng. 2016, 11, 142–150. [Google Scholar] [CrossRef]
- Rodríguez, C.D.B.; Segura, J.A.J.; Ruiz, M.C.C.; Estevez, G.A.J.; Araya, P.A.M. Evaluating the Impact of a V2G Scheme on the Demand Curve. In Proceedings of the 2019 IEEE CHILEAN Conference on Electrical, Electronics Engineering, Information and Communication Technologies (CHILECON), Valparaiso, Chile, 13–27 November 2019; pp. 1–6. [Google Scholar] [CrossRef]
- Tang, D.; Wang, P. Stochastic modeling of electric vehicle movable loads: Nodal impact from transportation. In Proceedings of the 2014 International Conference on Probabilistic Methods Applied to Power Systems (PMAPS), Durham, UK, 7–10 July 2014; pp. 1–6. [Google Scholar] [CrossRef]
- Deilami, S.; Masoum, A.S.; Moses, P.S.; Masoum, M.A. Real-time coordination of plug-in electric vehicle charging in smart grids to minimize power losses and improve voltage profile. IEEE Trans. Smart Grid 2011, 2, 456–467. [Google Scholar] [CrossRef]
- Valentine, K.; Temple, W.G.; Zhang, K.M. Intelligent electric vehicle charging: Rethinking the valley-fill. J. Power Sources 2011, 196, 10717–10726. [Google Scholar] [CrossRef]
- Leou, R.C.; Su, C.L.; Lu, C.N. Stochastic analyses of electric vehicle charging impacts on distribution network. IEEE Trans. Power Syst. 2014, 29, 1055–1063. [Google Scholar] [CrossRef]
- Wang, Y.; Infield, D. Markov Chain Monte Carlo simulation of electric vehicle use for network integration studies. Int. J. Electr. Power Energy Syst. 2018, 99, 85–94. [Google Scholar] [CrossRef]
- Soares, F.; Lopes, J.A.; Almeida, P.; Moreira, C.; Seca, L. A Stochastic Model to Simulate Electric Vehicles Motion and Quantify the Energy Required from the Grid. In Proceedings of the 17th Power Systems Computation Conference, Stockholm, Sweden, 22–26 August 2011. [Google Scholar]
- Rahmani-Andebili, M.; Bonamente, M.; Miller, J.A.; Miller, J.A. Mobility Analysis of Plug-in Electric Vehicles in San Francisco Applying Monte Carlo Markov Chain. In Proceedings of the 2020 IEEE Kansas Power and Energy Conference (KPEC), Manhattan, KS, USA, 13–14 July 2020; pp. 1–6. [Google Scholar] [CrossRef]
- Harrison, R.L. Introduction to Monte Carlo simulation. AIP Conf. Proc. 2009, 1204, 17–21. [Google Scholar] [CrossRef]
- ANDEMOS. Cifras y Estadisticas. 2017. Available online: https://www.andemos.org/index.php/cifras-y-estadisticas-version-2/ (accessed on 2 November 2019).
- Ministerio de Transporte; RUNT. Parque Automotor Vehículos Eléctricos Matriculados por Departamento. 2019. Available online: http://81494.asset.goto-9.net/web_public_shared/attached/81494/parque_automotor_vehiculos_electricos.pdf?utm_source=email_marketing&utm_admin=81494&utm_medium=email&utm_campaign=Mercado_de_elctricos_en_aumento (accessed on 2 December 2019).
- Area Metropolitana del Valle de Aburra. Encuesta Origen Destino. Available online: https://www.metropol.gov.co/observatorio/Paginas/encuestaorigendestino.aspx (accessed on 21 June 2020).
- Metroplús. Buses Eléctricos. Available online: https://metroplus.gov.co/proyectos/medellin/buses-electricos-2/ (accessed on 17 June 2020).
- Li, Y.; Davis, C.; Lukszo, Z.; Weijnen, M. Electric vehicle charging in China’s power system: Energy, economic and environmental trade-offs and policy implications. Appl. Energy 2016, 173, 535–554. [Google Scholar] [CrossRef]
- Varoquaux, G.; Buitinck, L.; Louppe, G.; Grisel, O.; Pedregosa, F.; Mueller, A. Scikit-learn. GetMobile Mob. Comput. Commun. 2015, 19, 29–33. [Google Scholar] [CrossRef]
- Scikit-learn. Density Estimation. Available online: https://scikit-learn.org/stable/modules/density.html (accessed on 2 August 2020).
- Metro de Medellín. Horarios Metro de Medellín. Available online: https://www.metrodemedellin.gov.co/viaje-con-nosotros/horarios (accessed on 2 May 2020).
- Electric Vehicle Driving, Charging, and Load Shape Analysis: A Deep Dive Into Where, When, and How Much Salt River Project (SRP) Electric Vehicle Customers Charge; Technical Report; EPRI: Palo Alto, CA, USA, 2018.
- Situación de los Conductores de Taxis en Bogotá; Technical Report; Fenalco Bogotá Cundinamarca: Bogotá, Colombia, 2016.
- Lopez, K.L.; Gagne, C.; Gardner, M.A. Demand-side management using deep learning for smart charging of electric vehicles. IEEE Trans. Smart Grid 2019, 10, 2683–2691. [Google Scholar] [CrossRef]
- You, P.; Yang, Z.; Chow, M.Y.; Sun, Y. Optimal Cooperative Charging Strategy for a Smart Charging Station of Electric Vehicles. IEEE Trans. Power Syst. 2016, 31, 2946–2956. [Google Scholar] [CrossRef]
- Wang, Q.; Liu, X.; Du, J.; Kong, F. Smart Charging for Electric Vehicles: A Survey from the Algorithmic Perspective. IEEE Commun. Surv. Tutor. 2016, 18, 1500–1517. [Google Scholar] [CrossRef]
- García-Villalobos, J.; Zamora, I.; Martín, J.I.S.; Asensio, F.J.; Aperribay, V. Plug-in electric vehicles in electric distribution networks: A review of smart charging approaches. Renew. Sustain. Energy Rev. 2014, 38, 717–731. [Google Scholar] [CrossRef]
- Díez, A.E.; Diez, I.C.; Lopera, J.A.; Bohorquez, A.; Velandia, E.; Albarracin, A.; Restrepo, M. Trolleybuses in smart grids as effective strategy to reduce greenhouse emissions. In Proceedings of the 2012 IEEE International Electric Vehicle Conference, Greenville, SC, USA, 4–8 March 2012; pp. 1–6. [Google Scholar] [CrossRef]
- Bartlomiejczyk, M. Practical Application of in Motion Charging: Trolleybuses Service on Bus Lines. In Proceedings of the 18th International Scientific Conference on Electric Power Engineering (EPE), Kouty nad Desnou, Czech Republic, 17–19 May 2017; pp. 1–6. [Google Scholar] [CrossRef]


| Elements | Quantity |
|---|---|
| Generation units | 3 |
| External grids | 3 |
| Substations | 30 |
| Transformers | 9 |
| 220 kV transmission lines (km) | 576.5 |
| 110 kV transmission lines (km) | 389.3 |
| Vehicle Type | Battery Capacity (kWh) | Performance (kWh/km) | Charging Power (kW) |
|---|---|---|---|
| BEV | 28 | 0.1582 | 50.0 /7.6 |
| PHEV | 11 | 0.2723 | 3.7 |
| Taxi | 61 | 0.1639 | 50.0 /7.6 |
| Bus | 348 | 1.0000 | 190 |
Publisher’s Note: MDPI stays neutral with regard to jurisdictional claims in published maps and institutional affiliations. |
© 2021 by the authors. Licensee MDPI, Basel, Switzerland. This article is an open access article distributed under the terms and conditions of the Creative Commons Attribution (CC BY) license (http://creativecommons.org/licenses/by/4.0/).
Share and Cite
Betancur, D.; Duarte, L.F.; Revollo, J.; Restrepo, C.; Díez, A.E.; Isaac, I.A.; López, G.J.; González, J.W. Methodology to Evaluate the Impact of Electric Vehicles on Electrical Networks Using Monte Carlo. Energies 2021, 14, 1300. https://doi.org/10.3390/en14051300
Betancur D, Duarte LF, Revollo J, Restrepo C, Díez AE, Isaac IA, López GJ, González JW. Methodology to Evaluate the Impact of Electric Vehicles on Electrical Networks Using Monte Carlo. Energies. 2021; 14(5):1300. https://doi.org/10.3390/en14051300
Chicago/Turabian StyleBetancur, Daniel, Luis F. Duarte, Jesús Revollo, Carlos Restrepo, Andrés E. Díez, Idi A. Isaac, Gabriel J. López, and Jorge W. González. 2021. "Methodology to Evaluate the Impact of Electric Vehicles on Electrical Networks Using Monte Carlo" Energies 14, no. 5: 1300. https://doi.org/10.3390/en14051300
APA StyleBetancur, D., Duarte, L. F., Revollo, J., Restrepo, C., Díez, A. E., Isaac, I. A., López, G. J., & González, J. W. (2021). Methodology to Evaluate the Impact of Electric Vehicles on Electrical Networks Using Monte Carlo. Energies, 14(5), 1300. https://doi.org/10.3390/en14051300