1. Introduction
The European Union has imposed an obligation on all member countries to reduce energy consumption, with this obligation being particularly relevant to sectors of the economy characterized by significant energy consumption. As buildings are responsible for approximately 40% of the total energy consumption worldwide, construction industry is a particular type of these sectors [
1].
About 35% of the annual energy consumption in residential buildings is used for heating and ventilation, while public buildings use about 45% of energy for this purpose [
2]. One of the strategies to improve the energy performance of buildings and reduce their heat demand for heating can be the use of passive solar systems integrated into the external walls of buildings (e.g., Trombe walls) [
3,
4]. The traditional Trombe wall is a passive solar energy generation system based on indirect gains with the use of a heat accumulating layer (AL). It consists of a massive wall, air layer, and glazing which together form a system capable of absorbing, collecting, and gradually releasing heat into the building. However, very high heat losses are one of the main drawbacks of the Trombe wall in sunless periods and at night [
5]. The efficiency of these systems can be improved by using transparent insulation (TI) instead of traditional glazing, which is why a solar wall (SW) with transparent insulation has recently become an interesting design solution for newly constructed energy-efficient buildings and for renovations of buildings to a passive standard [
6,
7].
TI (characterized similarly to glass by low infrared losses) performs a function identical to that of traditional insulation, i.e., it limits heat losses from the building; however, it additionally enables the transmittance (at the level of about 50% [
6]) of solar radiation to the AL. The energy from the solar gains available during the day is stored in the massive layer of the wall and is released to the rooms with some delay, depending on the AL parameters [
5,
8]. In this case, the greater heat loss, compared to walls with conventional thermal insulation, is offset by solar heat gains, and the wall acts as an additional heat source in the room. An overview of transparent materials used as insulation materials can be found in the works [
6,
9,
10,
11].
The idea of thermal insulating the external walls of buildings using transparent materials was born over 30 years ago [
6]. Since then, experimental work has been carried out to prove the effectiveness of using various transparent materials as insulation materials. Studies on real facilities equipped with TI are described among others in the articles [
12,
13,
14,
15,
16,
17,
18,
19]. On the basis of the quoted works, it can be concluded that the use of TI on the building envelope leads to a reduction in the need for energy for heating, while there is a danger of overheating of rooms during the summer. Therefore, the SW should be equipped with appropriate shading elements such as blinds or rolling shutters [
12,
13] which, by influencing the gains and radiant heat losses, play a significant role in the thermal performance of Trombe walls [
3,
4]. The amount of the acquired solar radiation can also be regulated by selecting an absorber with appropriate parameters [
20,
21,
22].
Thermal properties of the material of which the accumulation layer is made and its thickness are the basic parameters influencing the efficiency of SWs [
5,
23]. In order for the material to store heat effectively, it must have a high density, high thermal capacity, a significant thermal conductivity value, and an appropriate thickness so that the heat can penetrate the whole layer of material during the absorption of solar radiation and reach the interior of the heated room [
8]. The depth, at which a daily temperature wave reaches the accumulation material during a given period of time, depends on the value of thermal diffusivity of the material—i.e., on the transport coefficient controlling the non-stationary heat flow. Materials with higher thermal diffusivity values are usually more effective in storing heat at greater depths than those with lower thermal diffusivity values. On the other hand, if the AL is too thin, the time shift of the extreme temperature is short, and the heat will reach the room in the early afternoon, when, at the same time, there are large direct gains through the glazed surfaces. On the other hand, if the AL is too thick, then we can expect a significant reduction in solar gains flowing into the building in the case of an unventilated Trombe wall [
24].
In the literature on the subject, studies on the influence of the type of AL material or its thickness on the effectiveness of traditional SWs with external glazing can be found. In the article [
24] based on the methodology contained in ISO 13790:2008, the amount of solar gains was determined for the Trombe wall made of heavy concrete. Calculations were made for different AL thickness values (from 15 to 40 cm, with a change every 5 cm). The results obtained indicate that in the case of an unventilated SW, heat gains decrease with the wall thickness, while in the case of a ventilated SW, we can expect solar gains to increase with the thickness of the AL. In the study [
25], the optimum thickness of concrete and brick AL in the form of an openwork wall was determined, which was a part of the Trombe system with single glazing. The authors stated that 49 cm thick brick wall show the best performance in this case, but from a technical point of view it may be considered too thick, so designers can limit its thickness to 37 cm. On the other hand, for low concrete walls (about 1 m), a thickness of 35–40 cm is optimal, while for high walls (about 3 m), the thickness should be between 40–45 cm. When determining the optimal thickness of AL, the authors of [
25] were guided only by the criterion of the thermal efficiency of the system, not taking into account the time lag of the temperature wave and the time of maximum solar gains in the room.
Studies on the selection of AL material of the Trombe wall were also carried out in the paper [
26]. It compared the energy efficiency and environmental impact of two houses located in Lyon (France)—one with Trombe walls and the other without SWs. A sum of indicators was used as an environmental performance indicator: primary energy demand for heating and AL-related grey energy, related to the wall life cycle (50 years). The wall cores made of bricks of three different densities and of ordinary and lightweight concrete were analyzed, as well as two different types of heating: gas and electric. It was found that lower annual primary energy consumption during the life cycle is obtained for a core made of heavier materials and with a lower value of grey energy used for their production. In order to achieve maximum primary energy savings and minimum environmental impact, the core of the Trombe wall must have an optimal thickness. This value depends on the type of heating, and so, in the case of electric heating, the optimum thickness of the brick wall is about 35 cm, and in the case of gas heating about 25 cm.
In the study [
27], the heat demand for heating and cooling was calculated and the global warming potential (GWP) was determined for a residential building located in Ancona (Italy) with an unventilated Trombe wall. The GWP indicator was determined for two phases of the facility’s life cycle: the pre-utilization phase (it takes into account the purchase of raw material, production of materials, transport, and construction) and the utilization phase (it takes into account the energy needs for heating and cooling). The energy demand was determined using EnergyPlus computer program as the difference in demand between the reference building without the SW and that with it. Three AL material variants were analyzed: concrete, brick, and cellular concrete as well as three core layer thickness cases: 20, 30, and 40 cm. It turned out that during the utilization phase, the energy demand depends to a large extent on the thermal properties of selected material and is the lowest for a Trombe wall made of cellular concrete, while the cooling energy demand is the lowest for a SW with the concrete core. Considering both the pre-utilization and utilization phase, the best overall performance was achieved with the cellular concrete wall whose production cycle has a low environmental impact, and at the same time, high energy efficiency during the utilization phase. The authors stated that reducing the thickness of the SW has two effects: the negative impact on the environment in the pre-utilization phase is lower because the amount of material produced and transported is lower; the energy efficiency in the utilization phase is compromised due to the lower thermal resistance of the system. However, the overall efficiency of the SW increases with the reduction of the wall thickness, due to the dominant influence of the pre-utilization phase.
In the literature available to the authors of this article, there are no works devoted to the issue of selection of appropriate material and thickness of the AL of SWs with TI. Such walls, due to the increased thermal resistance of TI in relation to traditional glazing used in Trombe systems, are characterized by a slightly different way of operation and higher tendency to overheat (on a sunny day the temperature on the absorber may exceed 120 °C [
22]). This can lead to a situation in which the TI temperature values go beyond the temperature limits for safe operating conditions of the insulation. The optimal type of wall core material and its thickness depend of course on the latitude and climate which the building is located in [
28], which further complicates the considerations.
Numerical simulations are the most commonly used approach for testing effectiveness and sensitivity to selected SW parameters [
9,
29]. Compared to testing on a scaled model or on actual facilities, numerical calculations are clearly much ‘cheaper’ in terms of both time and cost. Changes in the SW parameters can be easily introduced into the software and thus provide guidelines for optimal solutions in real life [
6]. Various types of calculation models and approximate methods can be used to simulate the behavior of SWs with TI. Programs such as EnergyPlus, ESP-r, and TRNSYS provide the possibility to model SWs dynamically over long periods of time, taking into account the geometry and thermal characteristics of the building, as well as the climate where they are located in [
21,
30]. For a simplified analysis of the impact of TI walls on the heating or cooling demand of a building, quasi-stationary algorithms such as those presented in the paper [
7] or standard [
31] can be used. A non-stationary model of heat transfer based on electrical analogies can be used for a shortened analysis of SW behavior during one day [
32,
33]. Such calculations can predict thermal processes taking place in the wall during days with different insolation and to determine the daily thermal balance of the wall in different weather conditions. A numerical SW model can also be obtained using the finite differences in the heat equation, after introducing an appropriate source term associated with the absorption of solar radiation by the absorber [
34].
In this work, the method of elementary balances was used to analyze the behavior of the SW with TI. Within this method, differential elements (or elementary volumes) represented by nodal points are distinguished in the considered area. It is assumed that heat capacity and heat sources are geometrically assigned to the nodes. On the other hand, the heat flow resistances are assigned to the segments connecting adjacent nodes. This is a very universal method of creating finite difference equations when it comes to heat flow issues [
35]. What is important, the radiative heat transport between the surfaces of TI and AL constituting the boundaries of the air gap can be easily taken into account by the source terms in the energy balance for the elementary volumes including these surfaces. The heat exchange by convection within the air gap is taken into account by increasing the air heat transfer coefficient in proportion to the Nusselt number [
32,
36]. During the calculation, a constant distance between the nodes was assumed as equal to 4 mm in every wall layer. Such a dense spatial division ensured high accuracy of the conducted simulations. The length of the time step changed during the calculation and was selected in such a way that the standard condition of convergence for the numerical method [
35] is met, and at the same time, the temperature does not change by more than 0.1 °C between individual steps in any node. The calculations were made for the whole heating season (from October to April) for SWs with TI oriented south and located in four different places in Europe: Stockholm (Sweden), Warsaw (Poland), Paris (France), and Rome (Italy).
The purpose of the simulations presented in this work was to select the right AL material and thickness as well as TI thickness for different climatic conditions in Europe. For each location, the calculations were carried out for the AL thermal diffusivity ranging from 4.32 × 10⁻⁷ m2/s to 8.43 × 10⁻⁷ m2/s (every twentieth of the range), the AL thickness changing from 10 cm to 50 cm (every twentieth of the range), and for three different TI thicknesses (48, 88, and 128 mm). As a result of the calculations, the energy balance of the analyzed SWs was obtained in individual months of the heating period and in the entire heating period, as well as the time when the SWs act as a heat source in the room. Moreover, the time, in which the temperature resistance (140 °C) of the TI is exceeded, was also determined. On this basis, the authors proposed solutions of SWs with the optimal AL parameters and TI thickness for each of the analyzed locations.
The original elements of the work include contour graphs obtained through the performed simulations, allowing to estimate, for the considered SWs, the value of the thermal balance, the length of the heating time, and the average temperature wave time lag depending on the thickness and thermal diffusivity of the applied AL with the TI of different thickness for 4 locations in Europe. The original element of the conducted analyzes is also the selection of AL parameters, due to the temperature conditions in which the TI under consideration can operate safely. This is an important aspect of the discussed issue, often overlooked in the works in the discussed field.
The objective of this study is overcoming at least some of the barriers to the widespread use of TIs and making it easier for designers to construct optimal SWs for the different climate patterns and different building materials available in particular European regions.
2. Materials and Methods
2.1. Solar Wall
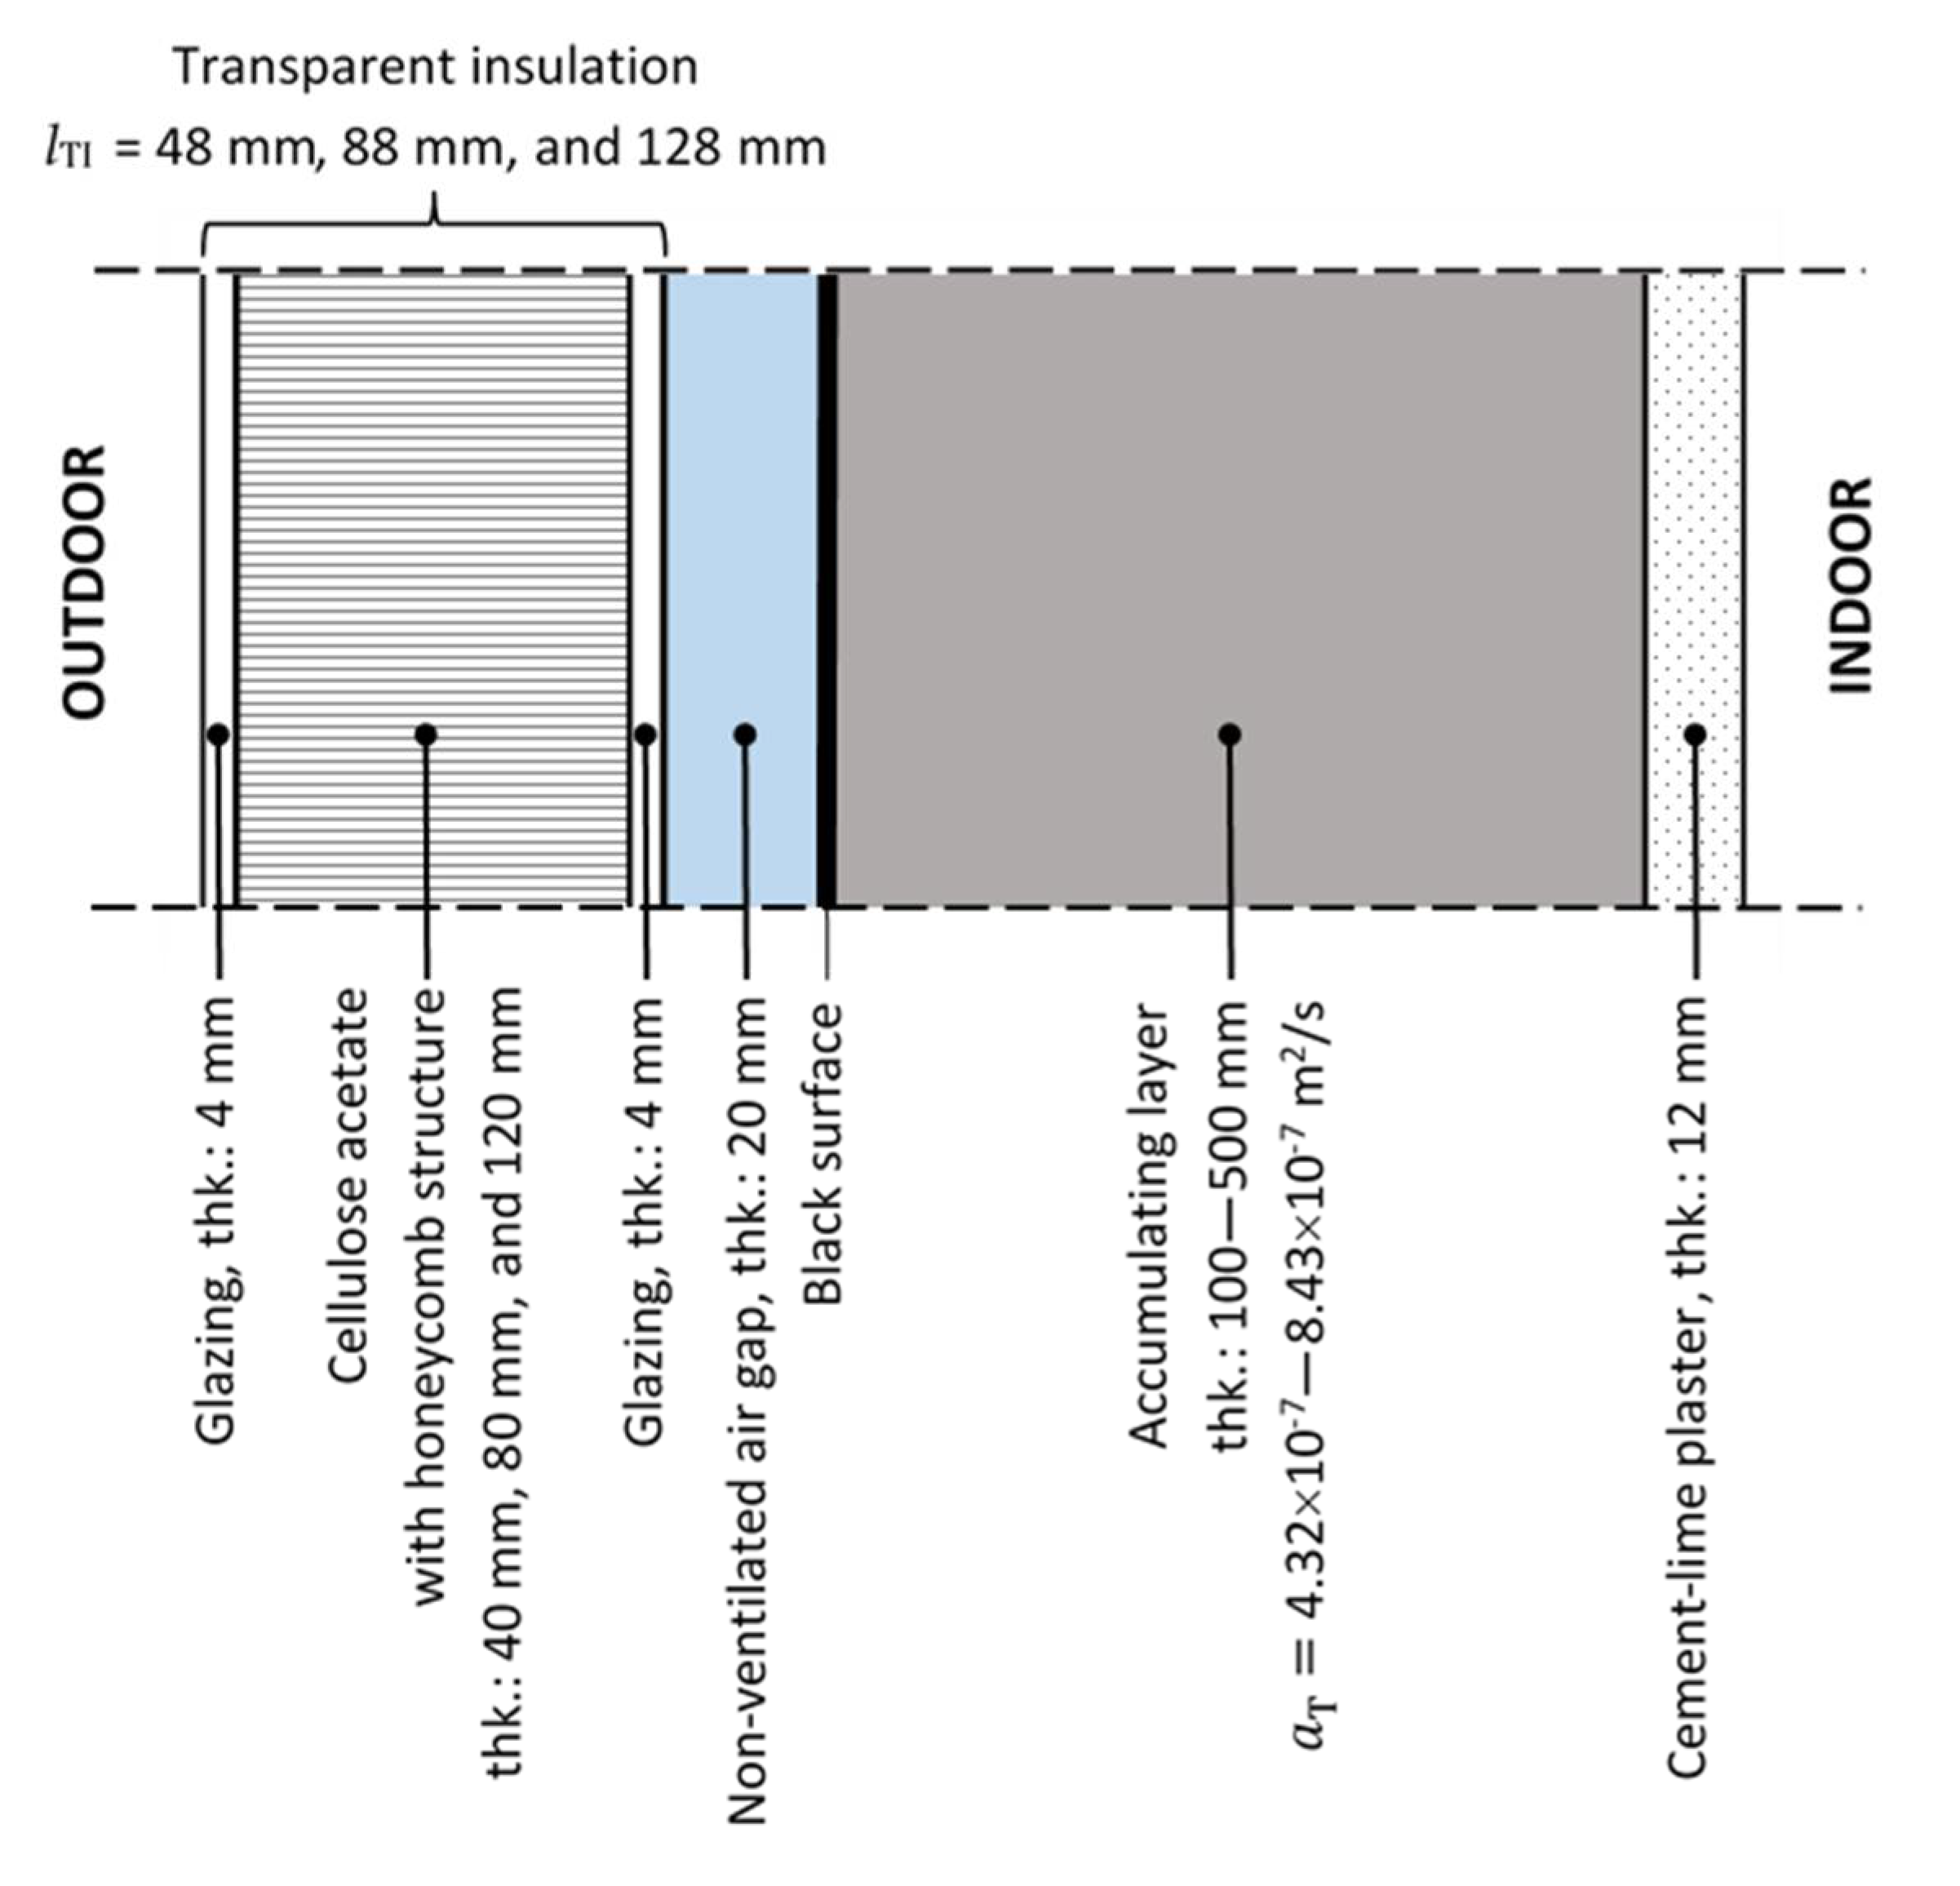
Within the study, SWs equipped with TI in the form of honeycomb (TIMax CA) are analyzed. The insulation is made of modified cellulose acetate with a density of 16 kg/m
3 and placed between two 4 mm thick panes. This material shows resistance to effects of long-lasting temperature of 100 °C and short-term resistance to temperature of 140 °C [
37]. If a duration of short-term thermal resistance is prolonged, the honeycomb becomes brittle. However, if the insulation is not mechanically loaded, the honeycomb retains its structure and thermal insulation properties [
38].
The literature on the subject includes studies on the influence of temperature, humidity, and solar radiation on the functional properties of modified cellulose acetate film and TI structures made of it [
39,
40]. In the work [
39], the films were aged in an aging chamber where they were artificially weathered, i.e., they were exposed to the action of UV radiation, and hot and humid air (temperature 65 °C, relative humidity 80%). Additionally, the samples were subjected to thermal aging only in hot air at the temperatures of 80 °C and 120 °C. On the basis of the obtained results, the authors concluded that as a result of artificial weathering, the thermal conductivity of the TI structure with rectangular cells and a thickness of 10 cm decreased by 1.3%, while the solar radiation transmittance decreased by 12.9%. The changes in the transmittance were associated with an increase in light scattering and yellowing of the film. The authors found that, unlike artificial weathering, the action of hot air only does not have a significant effect on the transparency of the film. In the work [
40], the TI structures from modified cellulose acetate were investigated in terms of their applicability in solar collectors. The tests were carried out in laboratory conditions, subjecting the samples to high temperatures and UV radiation. The authors found that after 450 h of aging at 140 °C, the optical performance of TI had decreased by approximately 3%. Additionally, it was shown that the combined effect of UV radiation and high temperature may cause yellowing and deterioration of the optical properties of TI even at temperatures below 100 °C (i.e., below the permissible operating temperature declared by the manufacturer). However, as there are no studies available to the authors of this study on the behavior of TI from cellulose acetate in natural conditions, it was assumed preliminary in the simulations that the performance parameters of the analyzed TI remain constant throughout the life cycle of the building.
Dust on the outer surfaces of TI may also be a factor influencing the SWs’ efficiency in heat collecting. Although the authors did not reach the research on this problem regarding exactly TI, the literature on the subject contains articles on the impact of dust deposition on the efficiency of other solar installations [
41,
42]. It was shown in the work [
41] that the predicted thermal efficiency of the collector with an inclination angle of up to 45° decreases from 10.7% to 21.0% in the case of strong dust deposition, while the optical efficiency of the collector decreases by 8.39% compared to the case of a collector with a clean cover surface. However, since the amount of dust deposited decreases with the inclination angle of the surface [
42], it can be expected that dust will have a smaller effect on the efficiency of the vertical TI than on the solar collector described above. Nevertheless, in order to maintain their original efficiency, TI surfaces should be cleaned regularly (before the start of the heating season and, if necessary, also during the season). It also seems reasonable to cover the outer surface of TI with a self-cleaning coating by the manufacturer.
The calculations were carried out for three variants of insulation thickness, namely
48, 88, and 128 mm. The coefficients of solar radiation energy permeability,
, and heat transfer of the whole set,
, and the effective thermal conductivity of the cellulose acetate panel itself,
, for the insulation of individual thickness values are presented in
Table 1 (DQ stands for dimensionless quantity). The values of the effective thermal conductivity coefficient of the TI material were determined on the basis of the specified values
of the whole set, assuming that the
coefficient for the glazing is 1.0 W/(m·K).
It is assumed that there is a 2 cm thick non-ventilated air gap in the SW going inwards behind TI and before the AL and an absorber in the form of a black paint layer with a solar absorption coefficient of 0.94 on the AL surface from the side of air gap. The inner surface of the wall is finished with 1.2 cm thick cement-lime plaster. It is also assumed that the thermal diffusivity coefficient of the AL,
, can take values from 4.32 × 10
−7 m
2/s to 8.43 × 10
−7 m
2/s, which corresponds to the most commonly used construction materials for such layers (cellular concrete (CC), solid ceramic brick (SCB), sand-lime block (SLB), ordinary concrete (OC)), while the thickness of the AL,
, is in the range from 10 cm to 50 cm. The layout of the wall’s layers is illustrated in
Figure 1.
In order to protect a building against overheating, it is designed that the TI layer is equipped with rolling shutters which are lowered in spring and summer (from May to September) in all considered cases. In the case of the SW solution analyzed, the roller shutters should be mounted on the outer surface of the wall. They can be lowered manually or automatically controlled. Leaving the roller shutters raised in the summer, especially in areas with high insolation (e.g., in Rome), may result in exceeding the temperature of 140 °C for several hours in the insulation material, which, in a repeated situation, may lead to yellowing or even beginning of a melting process of TI [
40], i.e., to lowering significantly its optical properties and thermal efficiency.
2.2. Climatic Data
The thermal performance of SWs equipped with TI is determined by climatic conditions in which they operate, as well as by a location and construction factors (wall orientation, shading, type of insulation, accumulating layer material, type of air gap). The climatic conditions are characterized in this issue by such values as solar irradiance, ambient air temperature, and speed of wind.
The solar irradiance, its distribution over time and its availability is essential to assess the effectiveness of SWs. In Europe, the average annual amount of solar radiation falling on the horizontal plane varies considerably depending on the location and usually ranges between 700–1800 kWh/m
2. Annual insolation of less than 700 kWh/m
2 is found in regions such as northern Sweden and Finland or Scotland, while insolation of more than 1800 kWh/m
2 can be observed in southern Spain and Portugal [
43]. Of course, the highest level of solar irradiance on the ground occurs statistically in June or July and the lowest one in December. In the period from October to March, only a small part of the total annual insolation is available, usually not exceeding 30% of the total value. This part increases as moving towards southern Europe. For example, it is about 16% for Stockholm, 21% for Warsaw, 25% for Paris, and 29% for Rome [
44].
Within the study, the optimum TI thickness and AL material with optimum thermal diffusivity was sought for an SW oriented south and located in four optional European cities, namely Stockholm (Sweden), Warsaw (Poland), Paris (France), and Rome (Italy). In the cities under consideration, the annual horizontal plane insolation is respectively [
44]: Stockholm—958 kWh/m
2, Warsaw—1077 kWh/m
2, Paris—1182 kWh/m
2, and Rome—1652 kWh/m
2. When selecting the places whose meteorological data were used in the calculations, efforts were made to ensure that these cities represent the different types of climates which can be found in Europe, and that the average annual insolation on the horizontal plane at these locations is within the typical European range of 700–1800 kWh/m
2.
According to Köppen’s classification, the climate in Stockholm and Warsaw is of the Dfb type, i.e., the continental climate with warm and wet summers and moderately cold winters. However, due to the fact that Stockholm is further north, temperatures in Stockholm are lower than in Warsaw. The climate in Paris belongs to the category of Cfb, which is a temperate oceanic climate with mild winters and warm, humid summers, while in Rome, we are dealing with the Csa-type climate, that is, a temperate Mediterranean climate, with mild winters and hot and dry summers.
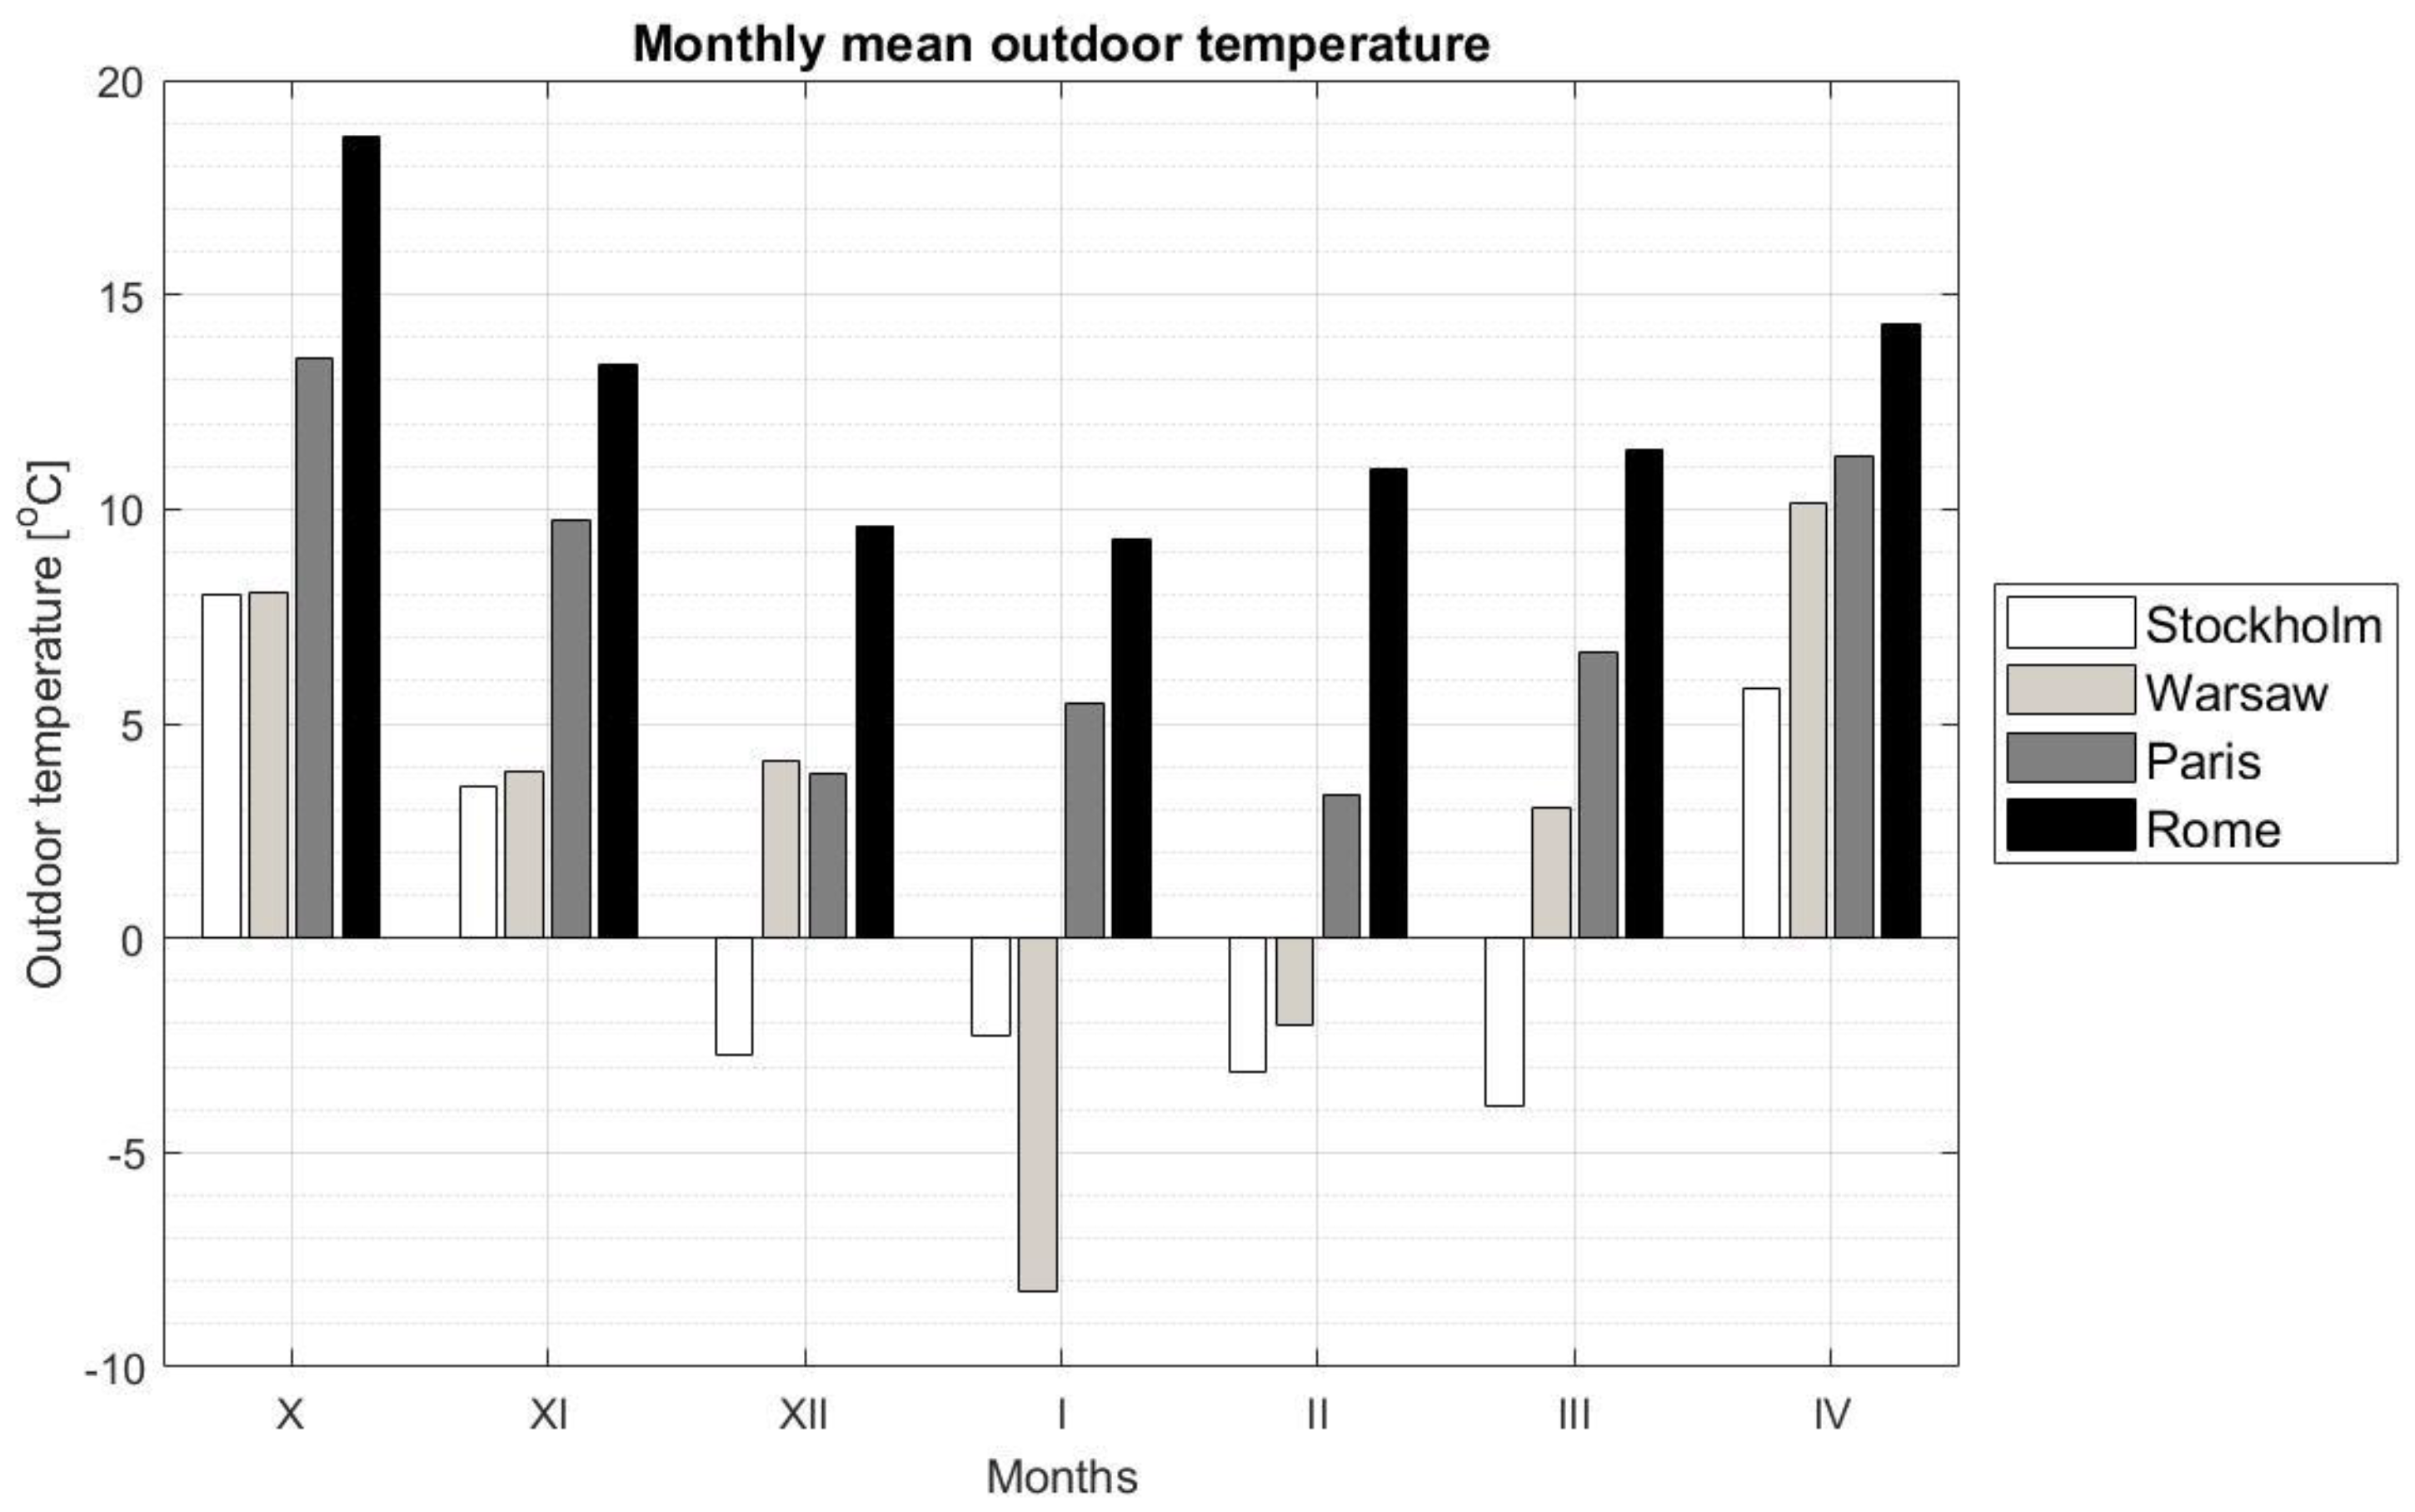
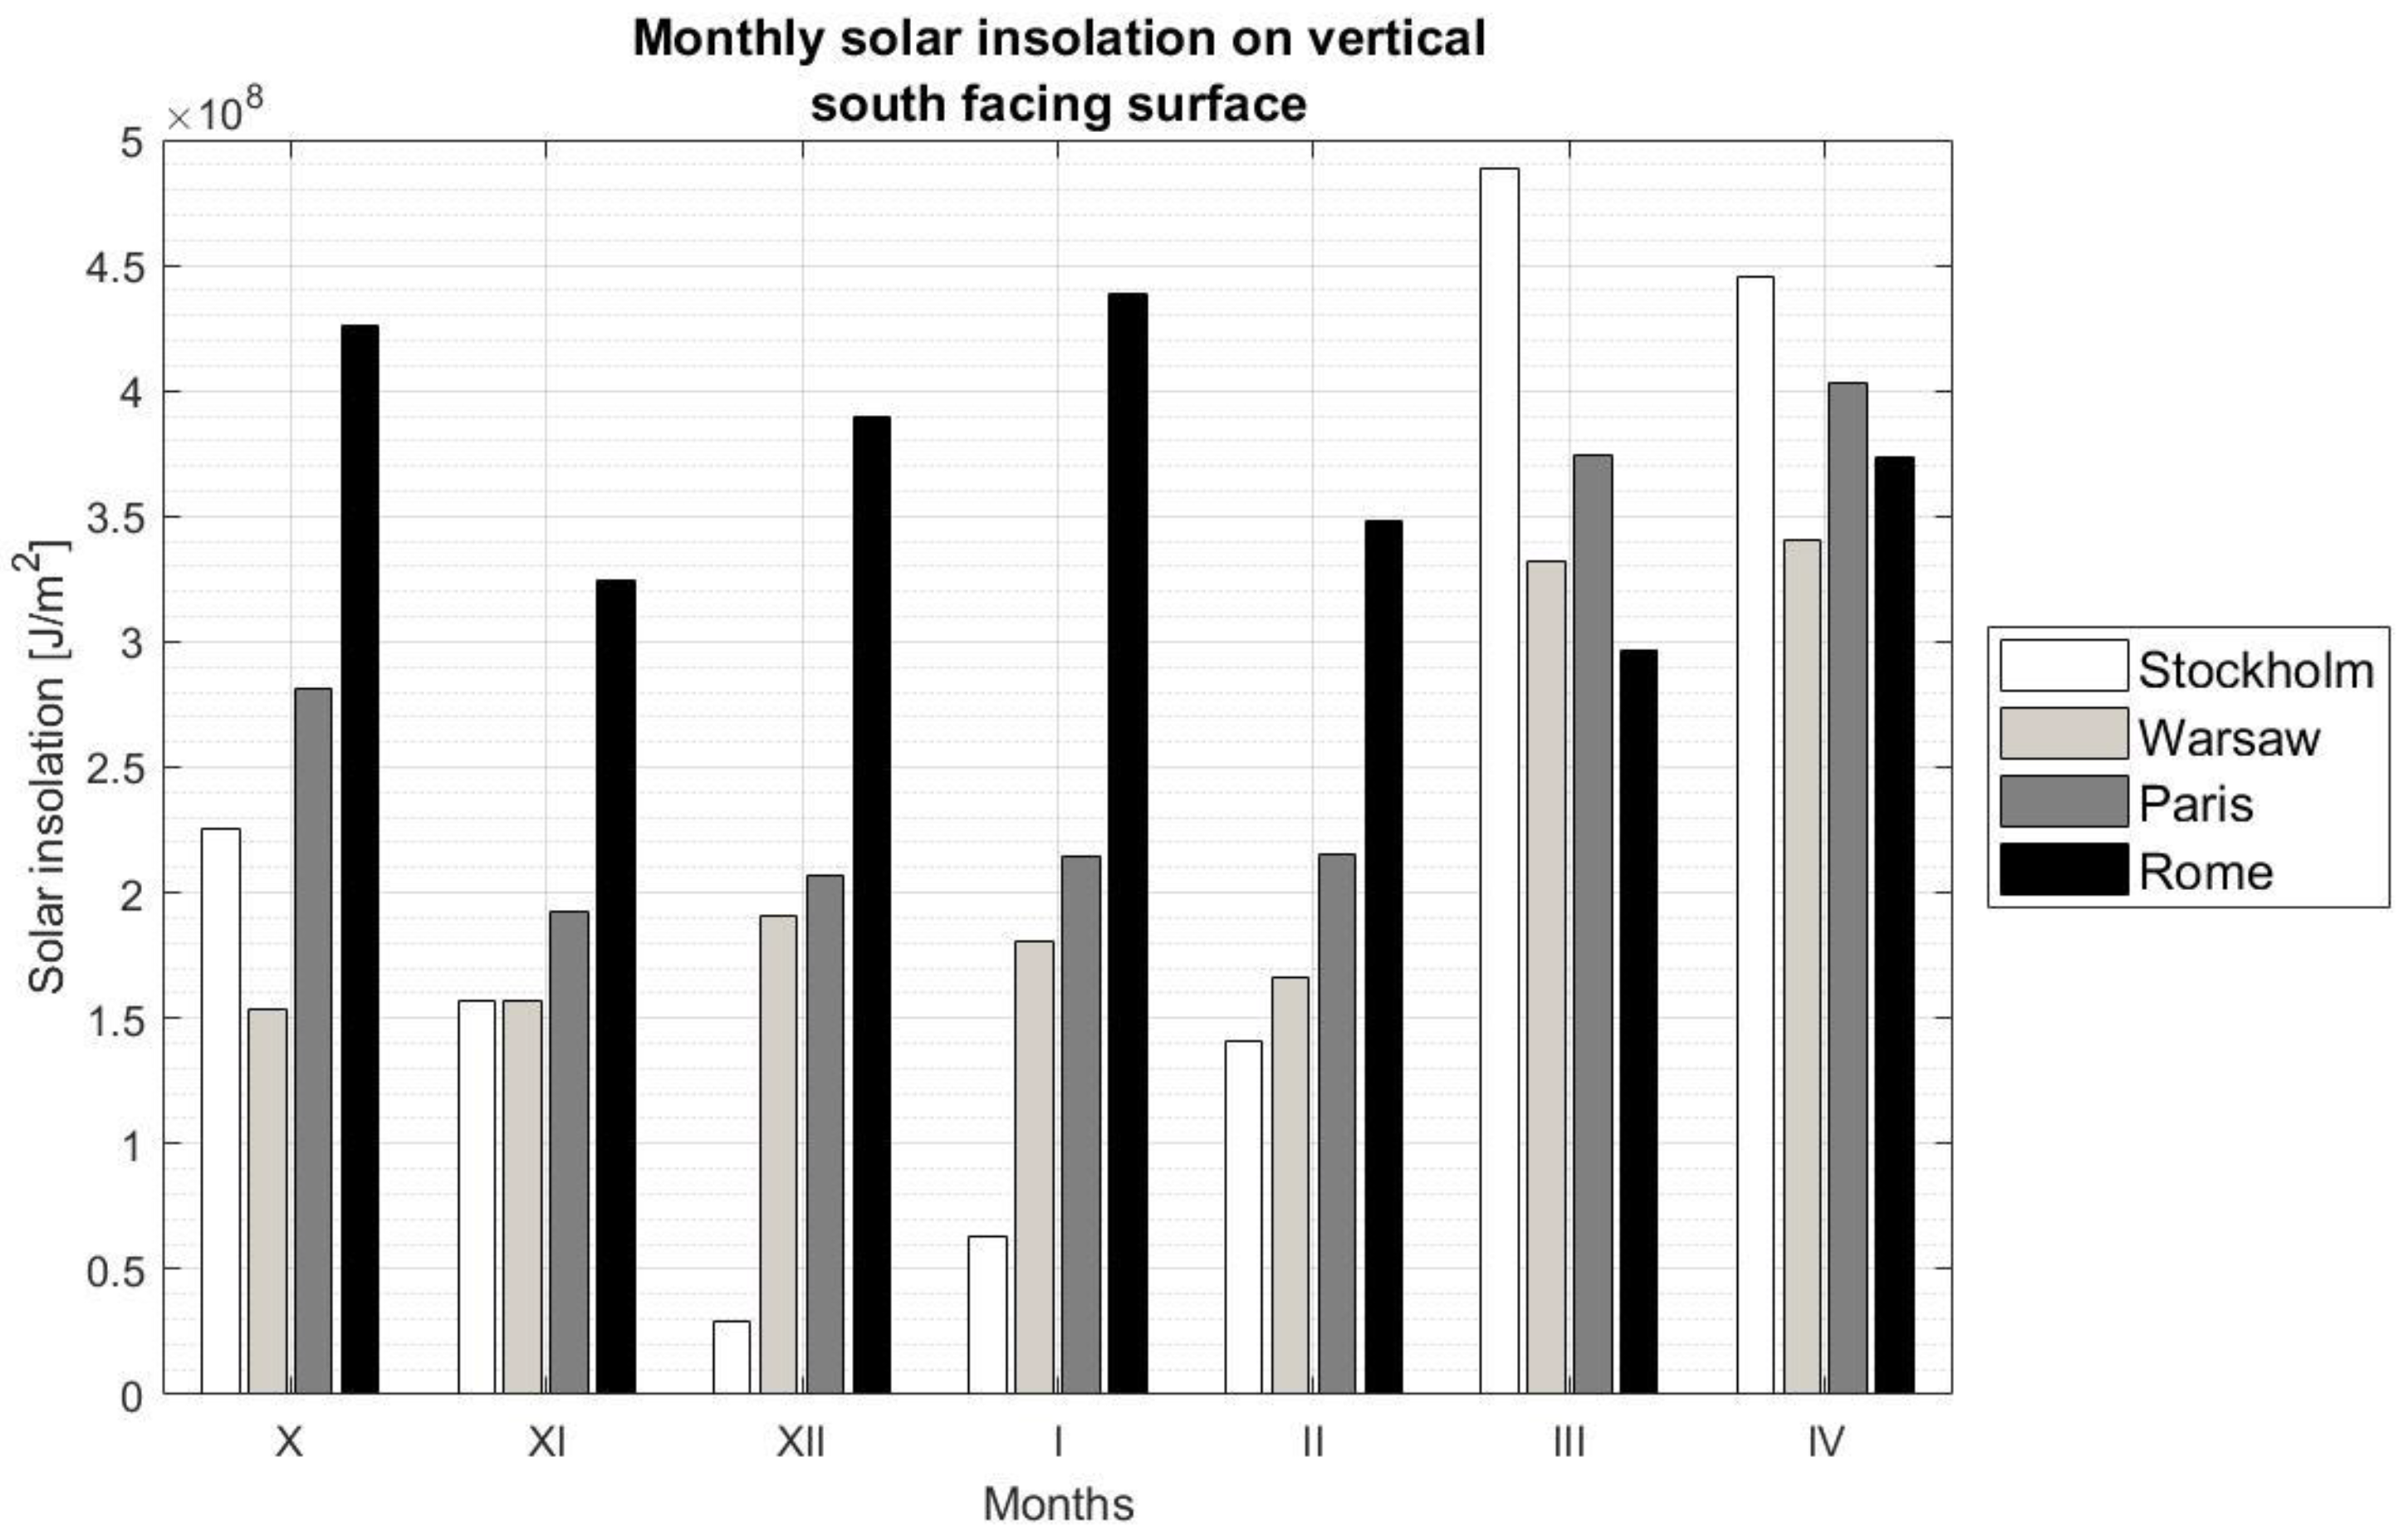
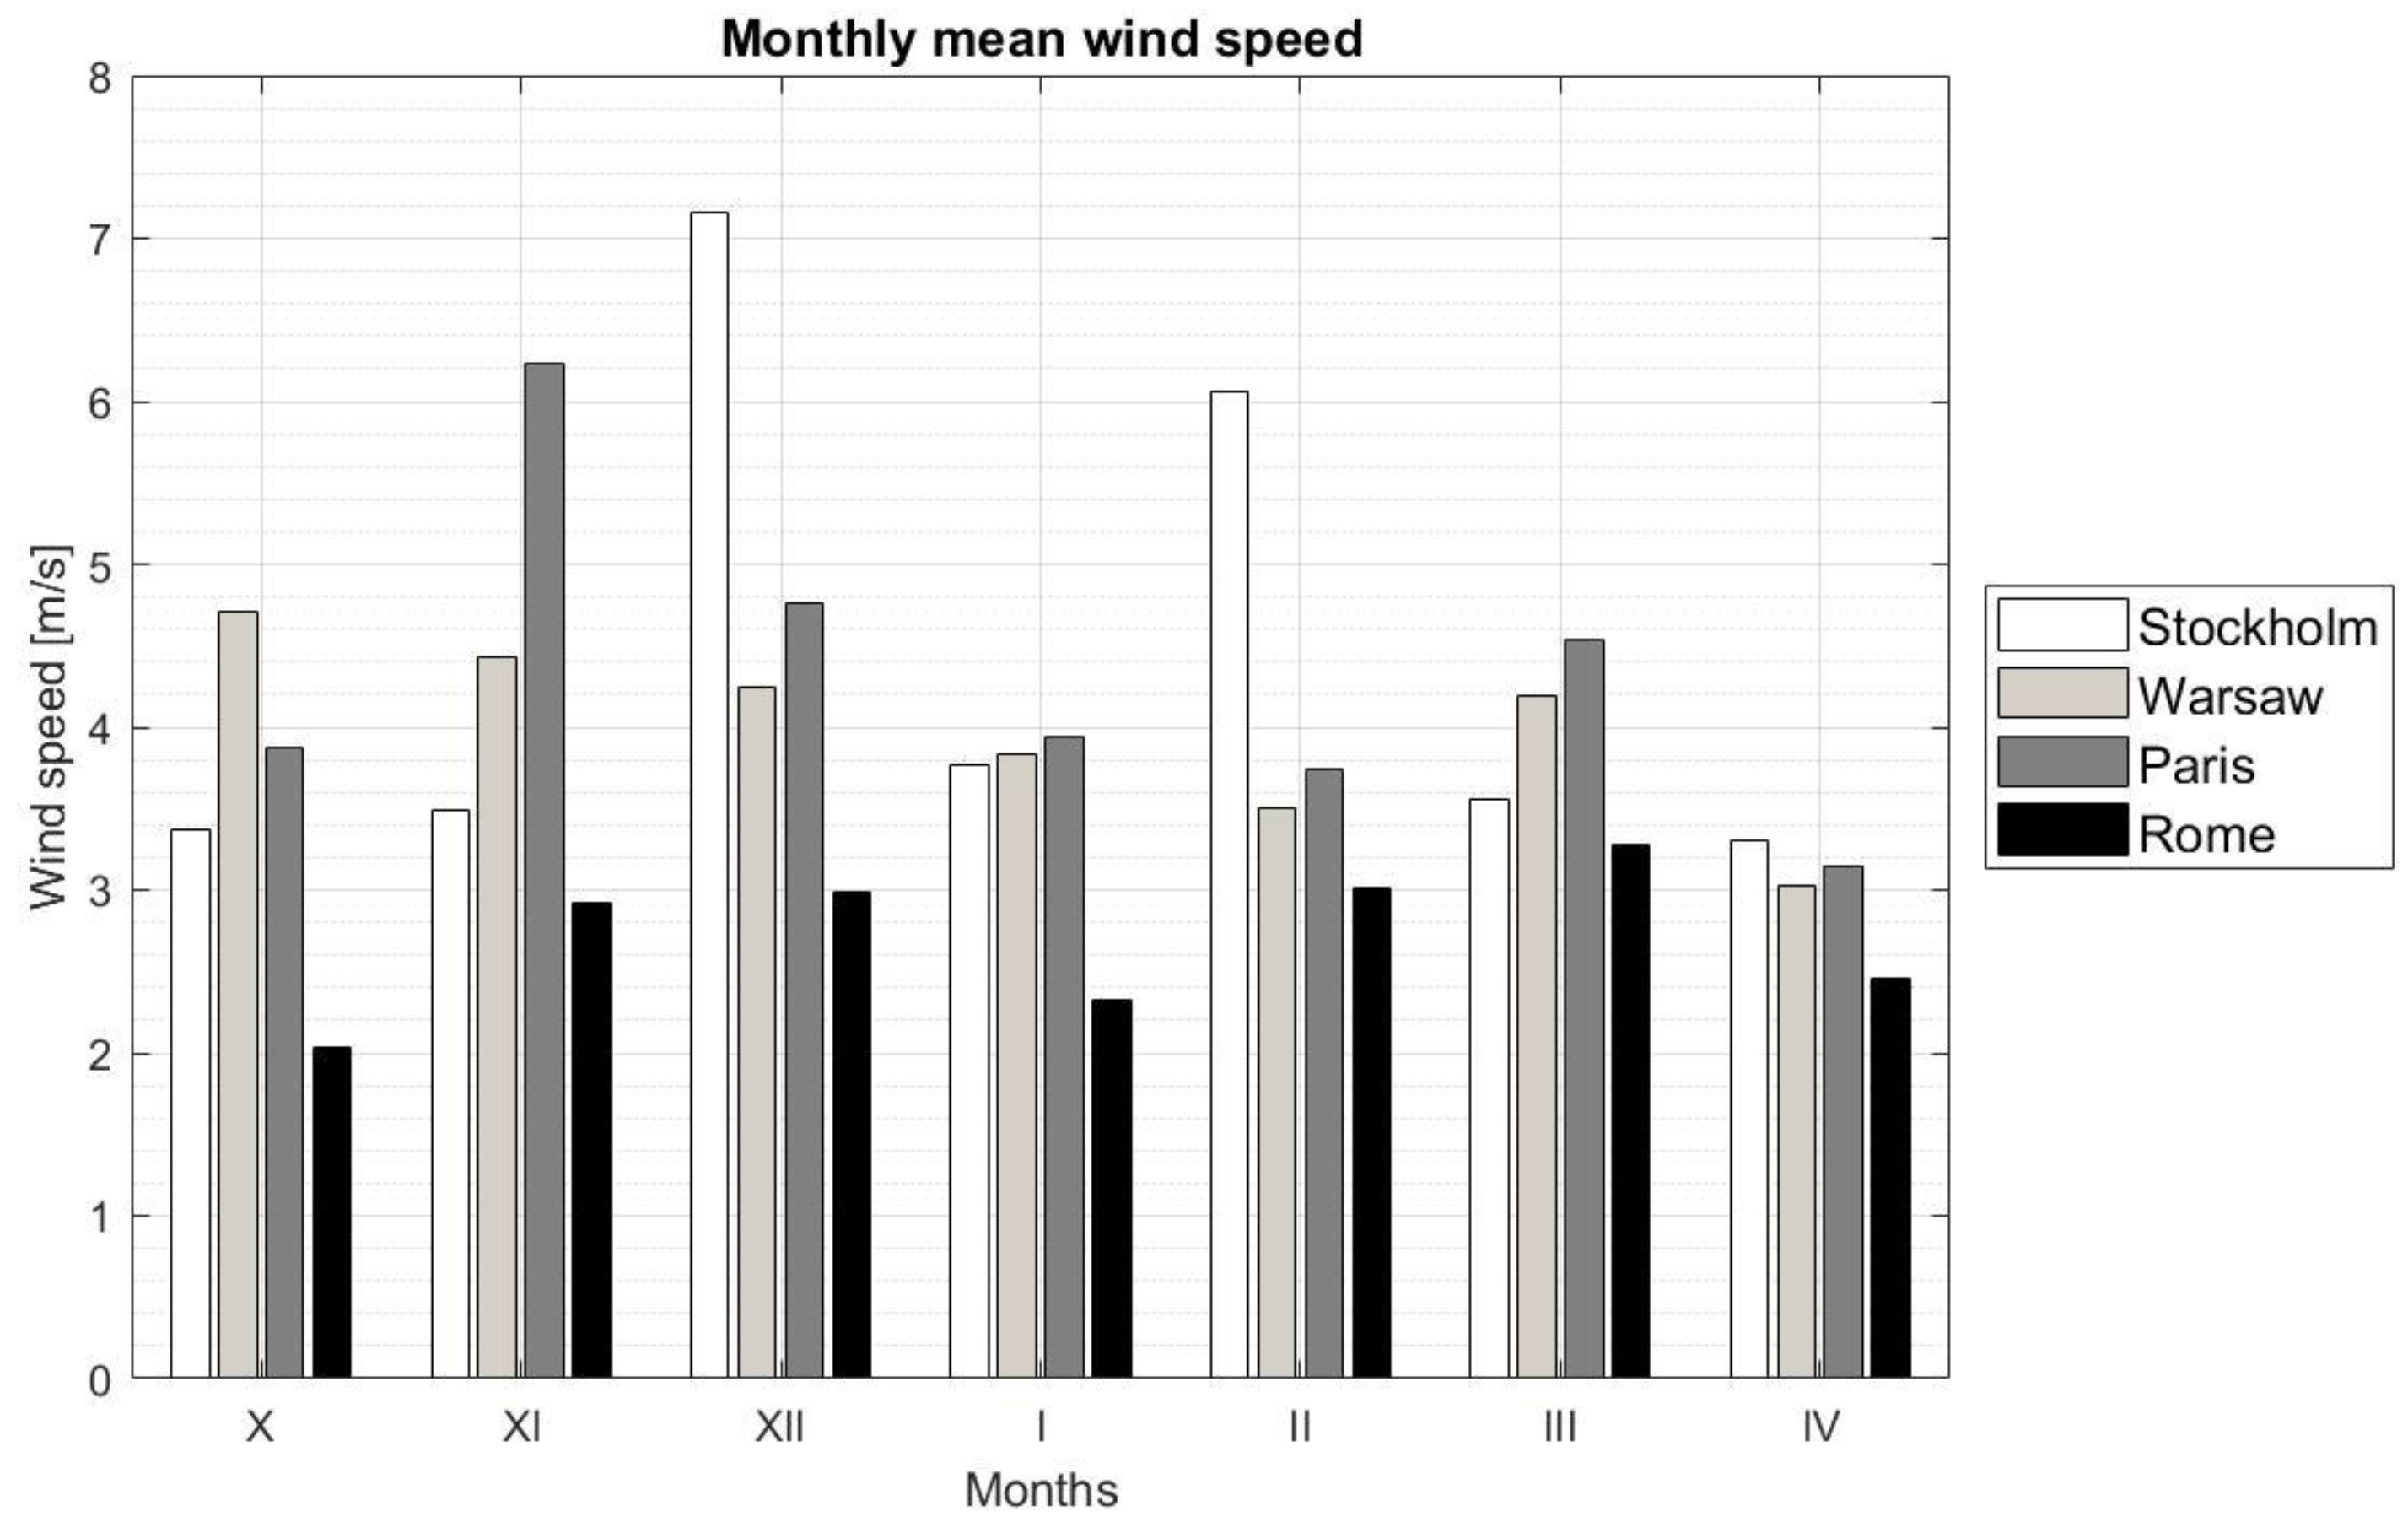
Figure 2,
Figure 3 and
Figure 4 show a comparison of the monthly mean outdoor temperature, monthly insolation of the south-oriented vertical plane, and the monthly mean speed of wind in the individual months of heating period (from October to April) for all analyzed cities respectively.
In the paper [
45], the Winter Climatic Severity Index (WCSI) and Summer Climatic Severity Index (SCSI) were introduced to describe the nuisances of a given climate, respectively in winter and summer. Depending on the WSCI values, the authors have singled out five different climate zones marked with the letters A, B, C, D, and E, with each successive climate characterized by a more severe winter. The SSCI values were used by the researchers to distinguish four climate zones 1, 2, 3, and 4, with different summer nuisance, whereby the higher the number the zone has, the hotter the summer in the zone. The values of the discussed indicators in the case of the individual cities analyzed in this work are respectively: Stockholm—WSCI = 2.91, SCSI = 0.01; Warsaw—WSCI = 2.38, SCSI = 0.26; Paris—WSCI = 1.39, SCSI = 0.31; Rome—WSCI = 0.51, SCSI = 1.37. This allows the above locations to be classified by the zones: Stockholm, Warsaw—E1, Paris—D1, Rome—on the border of zones B3 and C4.
The meteorological data necessary to carry out computer simulations have been downloaded for each of the locations under consideration from the European Commission’s Photovoltaic Geographical Information System [
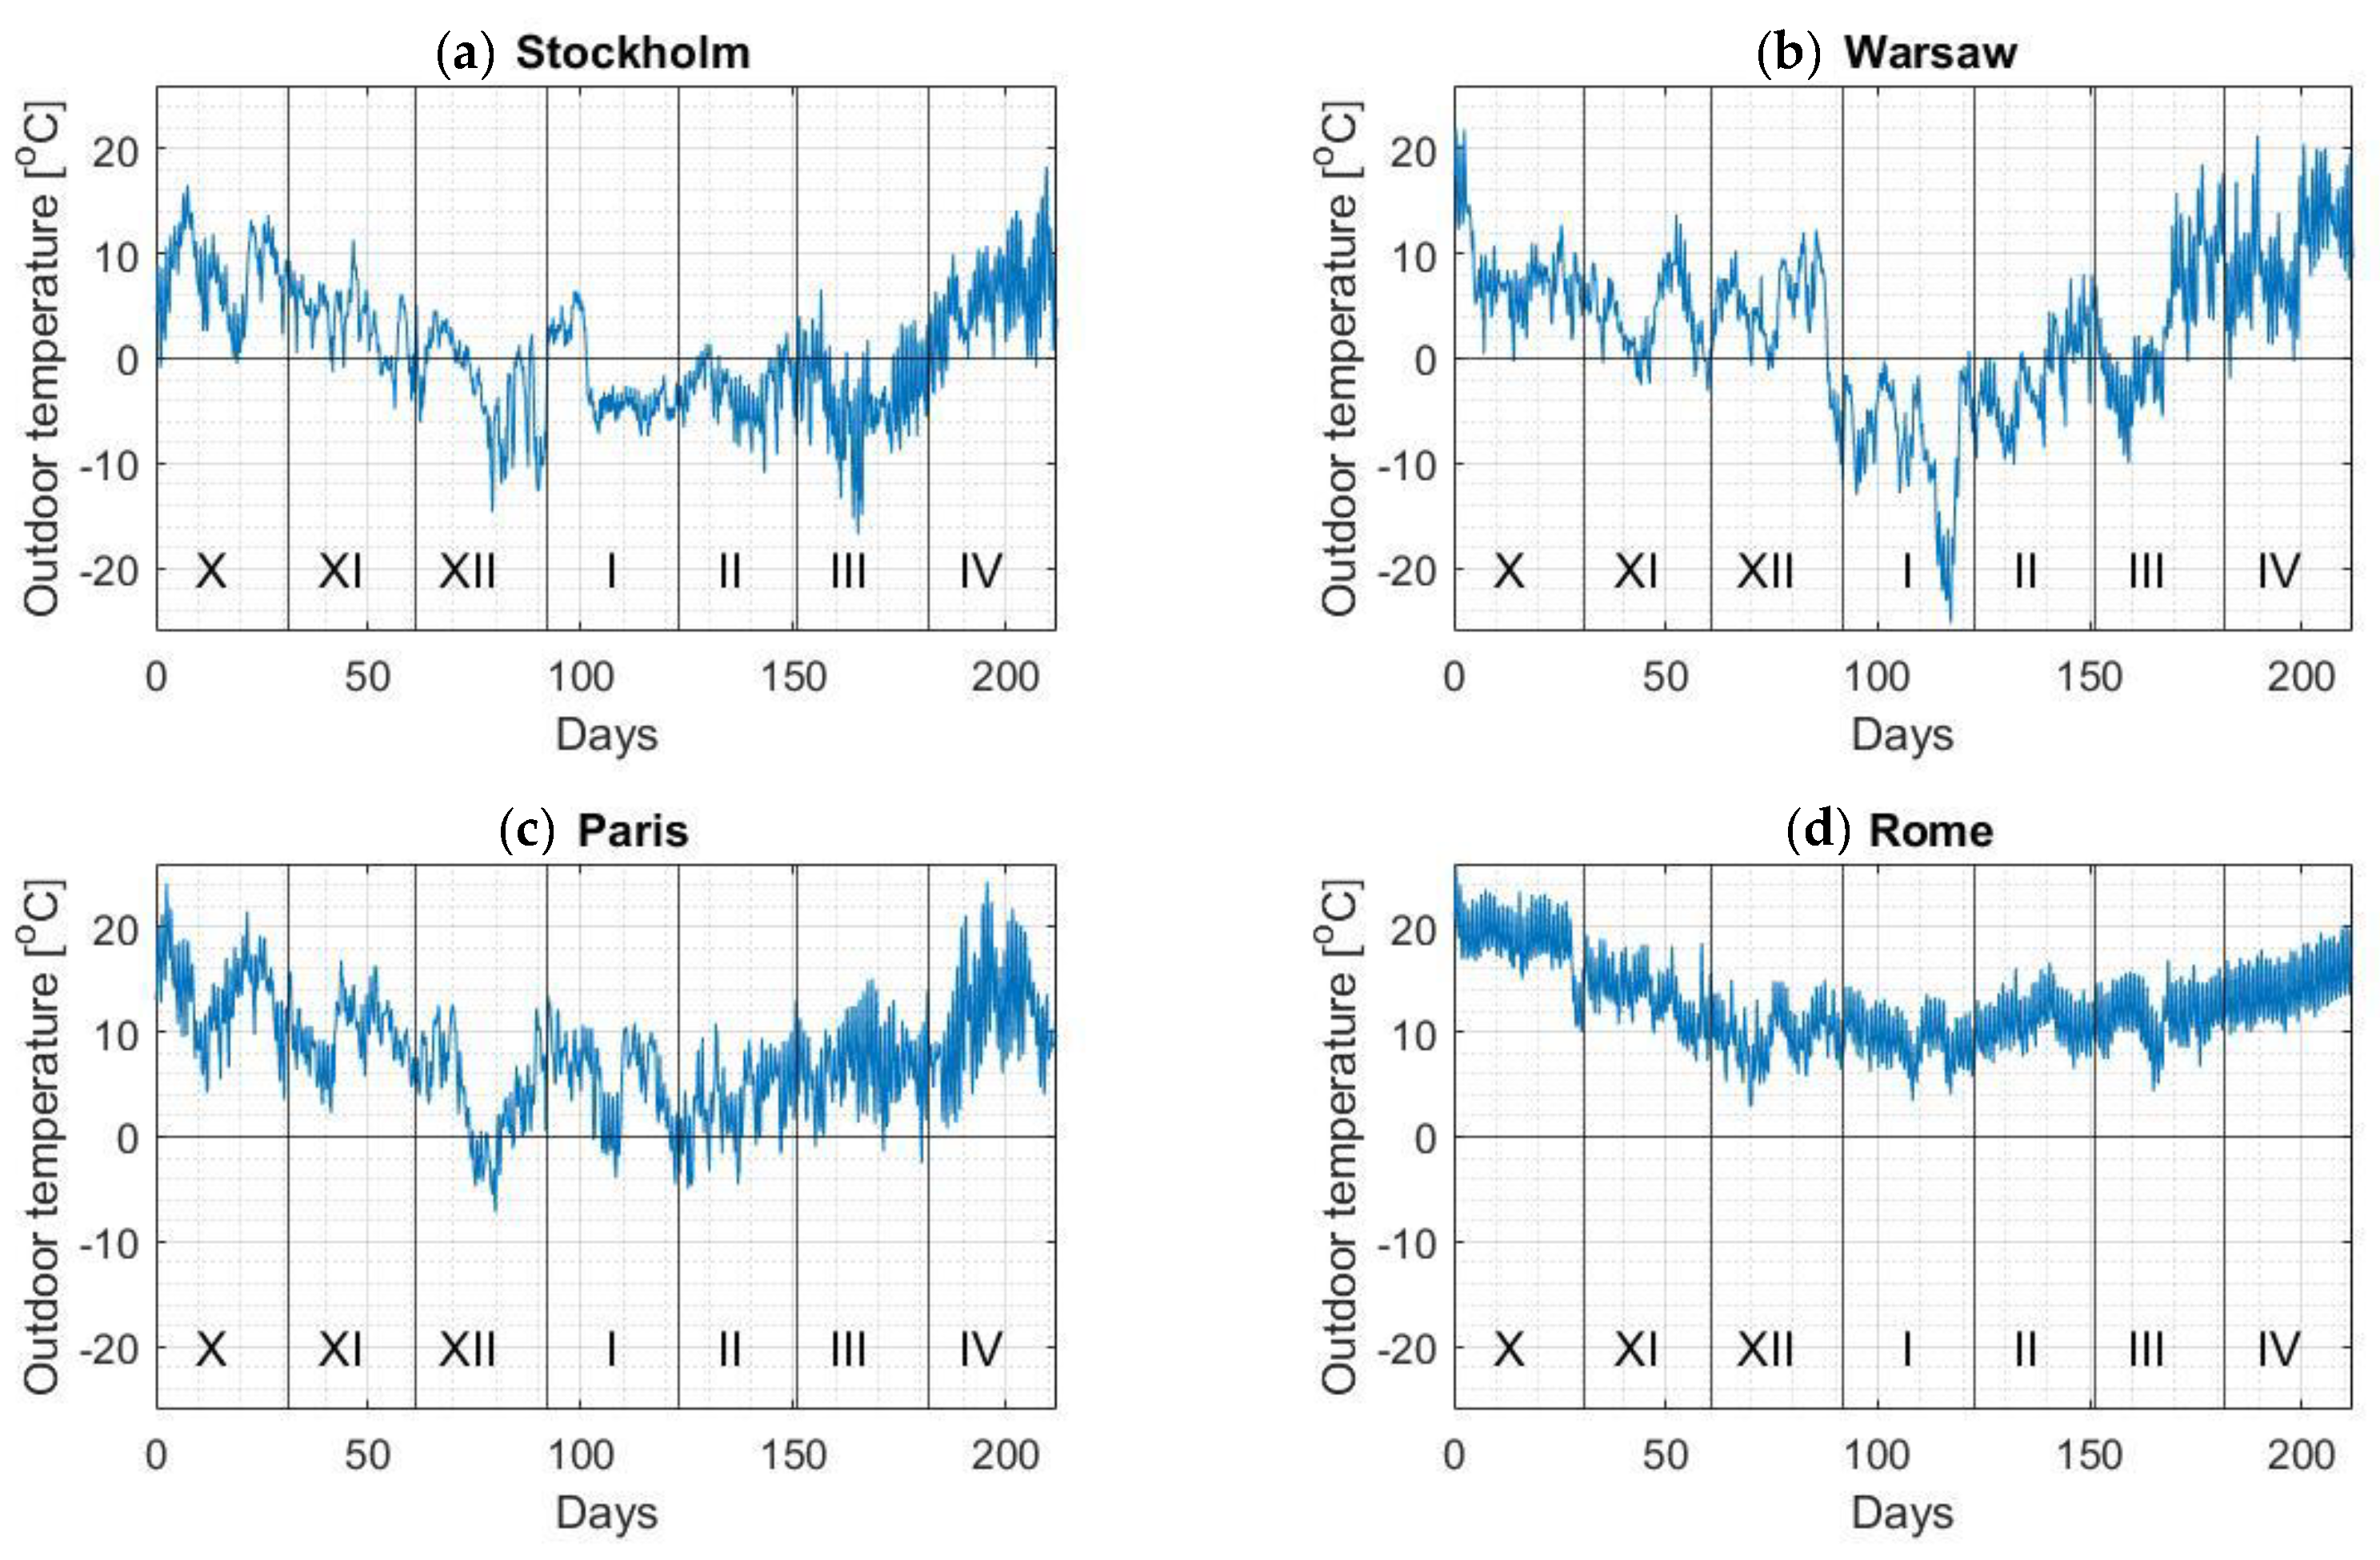
44]. These data are a set of hourly parameters, characteristic for the climate of a given place and are called a typical meteorological year. The values used in the presented work are a sequence of hourly values: outside temperature, solar irradiance falling on a vertical plane oriented to the south, and speed of wind, for the whole heating period and for two months preceding the heating period (data for August and September were used to determine the initial temperature distributions in the walls at the beginning of October). Diagrams of this data are shown illustratively in
Figure 5 and
Figure 6 for the temperature and solar irradiance courses respectively. It is worth noting at this point that a length of the heating season is usually different for the individual locations: Stockholm—from mid-September to mid-May [
46]; Warsaw—from September to May; Paris—from October to April [
47]; Rome—from November to mid-April [
48]. However, in order to unify the calculations and increase the comparability of the results, the same average length of the heating season—i.e., from October to April—was adopted in this work for all the analyzed cities.
2.3. Governing Equations
Differential equations describing the non-stationary heat flow in the SW can be obtained using several different methods. The numerical model can be built on the basis of analogies to the electrical diagram [
32,
33] which treats the area of wall as a grid of points with specific thermal capacities, connected to each other by segments with a given thermal resistance (i.e., as a set of resistors and capacitors). The temperature at a given point is the result of a balance of the heat fluxes flowing between adjacent nodes and the solar radiation flux, and it depends on the thermal capacity attributed to the node. A numerical SW model can also be obtained by transforming the heat equation by using finite differences and after introducing to it an additional source term related to the absorption of solar radiation by the absorber [
34]. This method is particularly convenient when the nodal grid has a constant step, and when there are no changes in material coefficients between the adjacent nodes. Otherwise, it leads to finite difference equations of a more complex form [
35].
A universal method of creating finite difference equations in the problems of non-stationary heat transport is the method of elementary balances which consists in making internal energy balances for individual finite difference elements where, in each of them, a nodal point is also distinguished (usually in their geometric center of gravity). The same indexes;
; are assigned to pairs: a given finite difference element—a node belonging to it, where
is the number of all elements. It is assumed that the sum of heat fluxes flowing to a given node from adjacent nodes, the external environment, and internal heat sources contribute to the change of internal energy of the finite difference element [
35], i.e.,
where:
—heat flux (W) flowing from the
-th node to the
-th node;
—heat flux (W) flowing to the
-th node from the ambient (it occurs only for the nodes lying on the external boundaries of wall);
—average surface density of heat sources (W/m
2) in the
-th element;
—surface area (m
2) in the
-th element on which the heat source occurs (
is equal to zero if the heat sources do not occur in the
-th element);
—volume (m
3) of the
-th element;
—specific heat of the material (J/(kg·K)) in the
-th element;
—material density (kg/m
3) in the
-th element;
—temperature (K) at the
-th node;
—time (s). If there are different materials within the
-th element, then the product
is weighted average with regard to the volume fractions of these materials in the volume
.
The heat fluxes in Formula (1) are given as the dependencies
where
—temperature (K) at
-th node;
—temperature (K) in the SW ambient,
—thermal resistance (K/W) of the material between the
-th and
-th nodes;
—thermal conductivity coefficient (W/(m·K)) of the material between the
-th and
-th nodes;
—distance (m) between the
-th and
-th nodes;
—average surface area (m
2) of heat flow perpendicular to the segment connecting the
-th and
-th nodes;
—heat transfer resistance ((m
2·K)/W) on the external surface of wall belonging to the
-th element;
—area (m
2) of the external surface of wall belonging to the
-th element.
In the issue under consideration, we can assume that we are dealing with a one-dimensional heat flow, then
m
2, and
m
2 , where
is the thickness of the
-th element. This thickness is related to the distances between adjacent nodes by the relationship
Taking into account the above, Equation (1) can be written for the
-th node in the form
In further considerations, the thermal diffusivity coefficient
of the material between the
-th and
-th nodes is introduced
and the time derivative occurring on the right side of Equation (5) is approximated with the right-hand difference quotient. Under these assumptions, the internal energy balance for the
-th element at the moment
can be expressed as
where the additional index
represents the quantities for the moment
and
for the previous moment
. In the considered issue, the thermal diffusivities
and
are equal to thermal diffusivity of material of a given layer in the case of nodes lying inside this layer, while in the case of nodes located at the boundary of layers, these diffusivities have a value resulting from the averaged heat capacity
assigned to the layers’ boundary nodes and depending on the properties of adjacent layers’ materials. The term
occurs for the node corresponding to the position of the absorber, and it will be equal to the source term
related to the solar irradiance.
where
—coefficient of absorption of solar radiation (DQ) by the absorber,
—coefficient of total permeability (transmittance) (DQ) of solar radiation through TI,
—solar irradiance (W/m
2) falling on the external wall surface. Generally, the term
appears for the nodes on the planes that limit the air gap, due to the radiant heat exchange between them. In this case, it is given by the expression [
49]
where
,
—temperatures (K) on the inner surfaces of the TI glass and the absorber respectively,
5.67 × 10
−8 (W/(m
2∙K
4))—radiation constant of perfectly black body,
—the equivalent emissivity (DQ) which, for two large parallel surfaces which are a short distance apart, can be calculated from the formula
In the above equation,
and
denote the surface emissivity (DQ) of the glass (equal to 0.836 [
50]) and the absorber emissivity (taken as 0.94) respectively. The source term is equal to zero
in other nodes what also means that the absorption of solar radiation inside TI including its glazing is considered as negligible. Based on the results presented in the work [
34], another simplifying assumption was made that the convective heat transfer within the air gap is of low intensity. Such an assumption allowed for a simplified approach to the phenomenon of convection, consisting in increasing the thermal conductivity coefficient of air in proportion to the Nusselt number of gas [
32,
36]. Values of the Nusselt number for air filling the gap were determined analogously as in the study [
34].
The third term on the right-hand side of the expression (7), describing the heat exchange with the ambient air, will occur only in the case of nodes situated on the external and internal surface of the SW. It was assumed in the paper that the heat transfer resistance on the external surface of the SW,
, depends on the wind speed [
51]
where
is the wind speed, and
is expressed in (m
2∙K)/W, while the heat transfer resistance on the internal surface,
, is constant and equal to
(m
2∙K)/W.
At this point, it should be noted that although the assumption of one-dimensional heat flow is commonly used in the design of the wall layers’ layout, it neglects the effect of two-dimensional flow in the vicinity of the border of SW and disturbs the 1D model behavior of the actual barrier. However, since TIs are usually found in buildings in combination with traditional insulations (covering the remaining wall outer surfaces), and the thermal conductivity coefficient of the analyzed TI is about two times higher than the conductivity coefficient of traditional insulation, the essential transverse heat flow from TI should not be expected towards the traditional insulation in the period when the SW accumulates heat. On the other hand, it is obvious that within the AL at the boundary of the SW, a noticeable heat flow will occur also in the direction parallel to the wall surface, which will apparently increase the thermal diffusivity of the AL and increase the heat flux reaching the room. Faster heat dissipation from the absorber surface will also result in lowering the temperature of the TI, i.e., reducing the risk of exceeding the permissible operating temperature. At night, however, heat from the traditionally insulated part of the building envelope may flow towards the SW and increase its losses. Of course, the share of the described phenomena in the entire heat balance of the SW will be the greater, the smaller the ratio of its surface to circumference. It is also important that the effects of these two described processes (during the day and night) will be partially canceled out. From the above considerations, it can be concluded that the solution of the SW proposed with the use of one-dimensional analysis in actual conditions will be characterized by a similar energy balance to the anticipated, and at the same time, it will be safer in terms of the possibility of exceeding the permissible operating temperature in the TI.
2.4. Verification of the Numerical Model
As a result of the discretization applied to the initial-boundary value problem, the resulting system of Equation (7) is an explicit scheme. This scheme allows to determine the temperature values at the nodal points of SW at any moment based on the temperature values from the previous moment and gives the possibility to change the length of the time step at individual moments of the simulation depending on the required accuracy of calculations. The advantage of this approach is the ease of writing a computer program solving this type of initial-boundary value problem. However, this algorithm is not unconditionally convergent and imposes certain limitations on the length of step which guarantees the correctness of the results obtained.
One of such limitation results from the fact that the difference Equation (7) should be structured in such a way that an increase in each temperature from the previous moment
leads to an increase in the sought values of
at the current moment. This condition is met if the coefficients in the Equation (7) at
are positive [
35]. Hence, with a constant length of the spatial step
, we obtain the condition
Condition (13) means that the limit value is to be taken as the smallest of the values determined for the individual nodes in the SW. In the analyzed issue, the greatest limitation on the length of the time step resulting from relation (13) always occurred in one of the nodes located in the air gap, i.e., in the layer with the highest thermal diffusivity values .
During the calculations, the length of the time step was first determined individually for each successive step
from the condition (13). This necessity resulted from the fact that in order to precisely determine the value of the Nusselt number, the parameters of air in the gap were assumed as temperature functions [
34]. However, the analysis of the initial simulation results showed that satisfying the condition (13) did not guarantee the stability of the results obtained. It was caused by the presence in the Equation (7) of the source terms which had very high values during the intense solar irradiance. Ultimately, the procedure of selecting the length of the time step was based on meeting two criteria: firstly—dependence (13); secondly—the assumption that the temperature from step to step in any node cannot change by more than 0.1 °C. If, after performing calculations in a given step, it turned out that the second of the above limitations is not met, the calculations were repeated with the
half shorter, and the second condition was checked again. The length of the time step thus selected guaranteed the convergence and stability of the solutions.
In order to prove the correctness of the results obtained, preliminary simulations were carried out and compared for three different spatial step lengths—i.e., equal to 4 mm, 2 mm, and 1 mm and the corresponding time step values. At the same time with the shortening of , the second condition concerning the length of the time step was also changed, i.e., it was assumed that the temperature from step to step in each node may change by no more than 0.05 °C and 0.025 °C for mm and mm respectively. These preliminary calculations were made for the climatic conditions of Rome, where the source terms took generally the highest values. They were carried out for the thickest analyzed transparent insulation (128 mm) and for all considered values of AL thermal diffusivity and thickness. It turned out that when changing the spatial step from 4 mm to 2 mm, the maximum observed relative changes (related to the values from the shorter step) were as follows: for the heat balance of the SW during the whole heating period—1.11 × 10⁻⁶, for the length of heating time—6.15 × 10⁻⁵, for the total time of TI overheating above the highest permissible temperature of 140 °C—5.84 × 10⁻⁵, and for the mean time lag of the maximum temperature on the absorber and on the internal surface of the wall—4.42 × 10⁻⁴. The corresponding relative changes for the spatial step change from 2 mm to 1 mm were respectively: 1.06 × 10⁻⁶, 1.50 × 10⁻⁶, 4.08 × 10⁻⁵, 1.10 × 10⁻⁴. The values of the relative changes between the calculation results obtained at different lengths of spatial and time steps indicate that the differential scheme used is convergent and that the solution converges at an accurate solution.
Since with the change in the length of the spatial step, the calculation time for one task (computer with 64 GB of RAM, 3.6 GHz processor) was significantly extended, i.e., from 850 s to 1230 s for mm, from 3570 s to 5730 s for mm, and from 1.41 × 10⁴ s to 2.52 × 10⁴ s for mm, it was decided to perform all other calculations with a spatial step of 4 mm.
Due to the lack of access to experimental data on the considered SWs, the authors of the study decided to assess the correctness of the obtained results using the quasi-stationary method of calculating heat gains through opaque building envelope with TIs proposed in PN-EN ISO 13790: 2009 standard [
31]. According to this method, the monthly solar gains via the SW per 1 m
2 of the wall are calculated from the formulas
where
—monthly solar heat gains (J/m
2),
—monthly solar insolation of a plane with a given orientation (J/m
2),
—heat transfer coefficient of SW (W/(m
2∙K)),
—heat transfer resistance of TI ((m
2⋅K)/W),
—heat transfer resistance of air gap ((m
2⋅K)/W). By reducing the result of Equation (14) by the amount of heat losses through the SW in a given month (calculated as the product of
, the temperature difference between the internal and external environment, and period of time), we will obtain the heat balance for the wall in the considered month. Summing up the heat balances for the individual months of the heating period, the SW heat balance in the entire analyzed period is obtained.
The discussed calculations were performed illustratively for two locations, characterized by extremely different climates, i.e., for Stockholm and Rome, for the ALs made of six different materials (CC, SCB, SLB, and OC with different densities and parameters listed in
Section 3 of the article) and three different thicknesses: 10, 30, and 50 cm. Analyzing the obtained results, it was found that in the case of Stockholm, the seasonal thermal balances of SWs obtained using both compared methods differ on average by: 6.8%—the SW with 48 mm TI (the differences in the range from 3.5% to 11.9%), 4.3%—the SW with 88 mm TI (the differences ranging from 2.0% to 7.9%), and 2.6%—the SW with 128 mm TI (the differences ranging from 1.9% to 4.9%). Larger differences were always obtained in the case of thinner AL and lower thermal diffusivity of this layer. In the case of Rome, the differences between the seasonal thermal balances of SWs were as follows: 5.6%—the SW with 48 mm TI (the differences ranging from 3.8% to 9.0%), 4.6%—the SW with 88 mm TI (the differences between 3.2% and 7.1%), and 3.8%—the SW with 128 mm TI (the differences in the range from 2.8% to 5.7%). In all analyzed cases, the standard method gave a higher value of the seasonal heat balance than the numerical method. The same relationship could be observed in the majority of monthly balances. From the above, it can be concluded that due to its quasi-stationary approach, the standard method slightly overestimates solar thermal gains obtained by SWs with TI. Finally, on the basis of the conducted analyzes, it was found that both calculation methods did not show large discrepancies, and the numerical model proposed in the paper was considered verified.
3. Results
The program to simulate a behavior of SWs with TI was elaborated by the authors of this work in the MATLAB environment. During the calculations, a constant distance between the spatial grid nodes was assumed within all layers of SWs, i.e., mm. The spatial discretization adopted in this way ensured sufficiently good accuracy of the results (see point 2.4) and an acceptable duration of the simulations (from 850 s to 1230 s for one task depending on its input data). Thanks to the use of a 4 mm spatial step, it was also possible to model the thin TI protective glass layers as homogenous and separated from the core of TI. The length of time step changed during the calculations and was selected so that the convergence condition (13) was met, and that the temperature from step to step did not change by more than 0.1 °C at any spatial grid node. The individual selection of the time step at each moment of the simulation allowed the calculation to be significantly shortened.
The simulations were performed for the SWs with southern orientation (recommended for SWs) for four optional locations—Stockholm, Warsaw, Paris, and Rome—representing the different climatic conditions in Europe. A wall with three different TI thickness values (48, 88, and 128 mm) and with AL of variable thickness and thermal properties was analyzed. It was assumed that the thickness of the layer, , can take values from 0.1 m to 0.5 m (every 2 cm), while the thermal diffusivity is within the range from 4.32 × 10⁻⁷ m2/s to 8.43 × 10⁻⁷ m2/s (every twentieth of the analyzed range). The adopted range of thermal diffusivity variability corresponds to the values of diffusivity coefficients of the most frequently used construction materials (CC, SCB, SLB, and OC). The temperature inside the room is assumed to be constant and equal to 20 °C.
Due to the fact that there are the terms describing thermal capacity
of AL material for the boundary nodes of the accumulating layer in the Equation (7), it became necessary to assign the thermal diffusivities of this layer (from the analyzed range of variability of
) to the thermal capacity values, i.e., to assume the relationship
. For this purpose, thermal parameters of typical building materials were used, commonly used for erecting walls of buildings and having (according to the literature on the subject) the potential to be used as an AL in SWs [
52]:
CC: ,
SCB: ,
SLB: ,
OC: ,
OC: ,
OC: .
The relationship was adopted as in the form of a broken line, where the thermal diffusivities with the values as for the above-mentioned materials corresponded to the values of for these materials, and between these points, the values of the thermal capacity were determined by linear interpolation.
In the analyzed initially-boundary value problem, the temperature distribution in the wall at the beginning of the heating season is not known in advance. In order to get the right initial condition, the simulation for each of the considered SWs was started from 1 August at 00:00, assuming the initial temperature distribution as for the stationary distribution for the initial outdoor temperature and the lack of solar heat sources (the TI covered by the rolling shutters). This simulation was carried out until 30 September at midnight. The temperature distribution in the SW obtained for this moment was taken as the initial condition for the calculations for the heating season, when it was started to take into account the solar gains (the moment the insulation was exposed). From the preliminary simulation work carried out by the authors, it appeared that the adopted form of the initial condition affects the results of calculations corresponding to the first two weeks of the simulation. The authors of [
34] reached the same conclusion. It can therefore be assumed that the initial condition set in this way is correct.
Finally, in case of each SW’s configuration and location, thermal calculations resulted in:
the heat balance per the unit area of SW in the heating period,
the heating time during which the SW acts as a source of heat in the room in the heating period,
the longest time when the temperature in the TI rises above 140 °C (the longest time of TI overheating) in the heating period,
the time lag of the maximum temperature between the absorber and SW’s internal surface in the daily cycle during the heating period.
The SW’s heat balance for the period under consideration was calculated as the time integral of the heat flux on the unit area of SW’s internal surface, assuming the flux flowing inward as positive. The heating time, when the SW constitutes the source of heat in the room, was determined as the sum of periods in which the heat flux on the internal surface flowed inward (i.e., the wall surface temperature was higher than the assumed internal air temperature of 20 °C). The maximum temperature time lag was calculated as the mean time difference between the occurrence of the maximum temperature on the absorber and the wall’s internal surface for each day in the heating season.
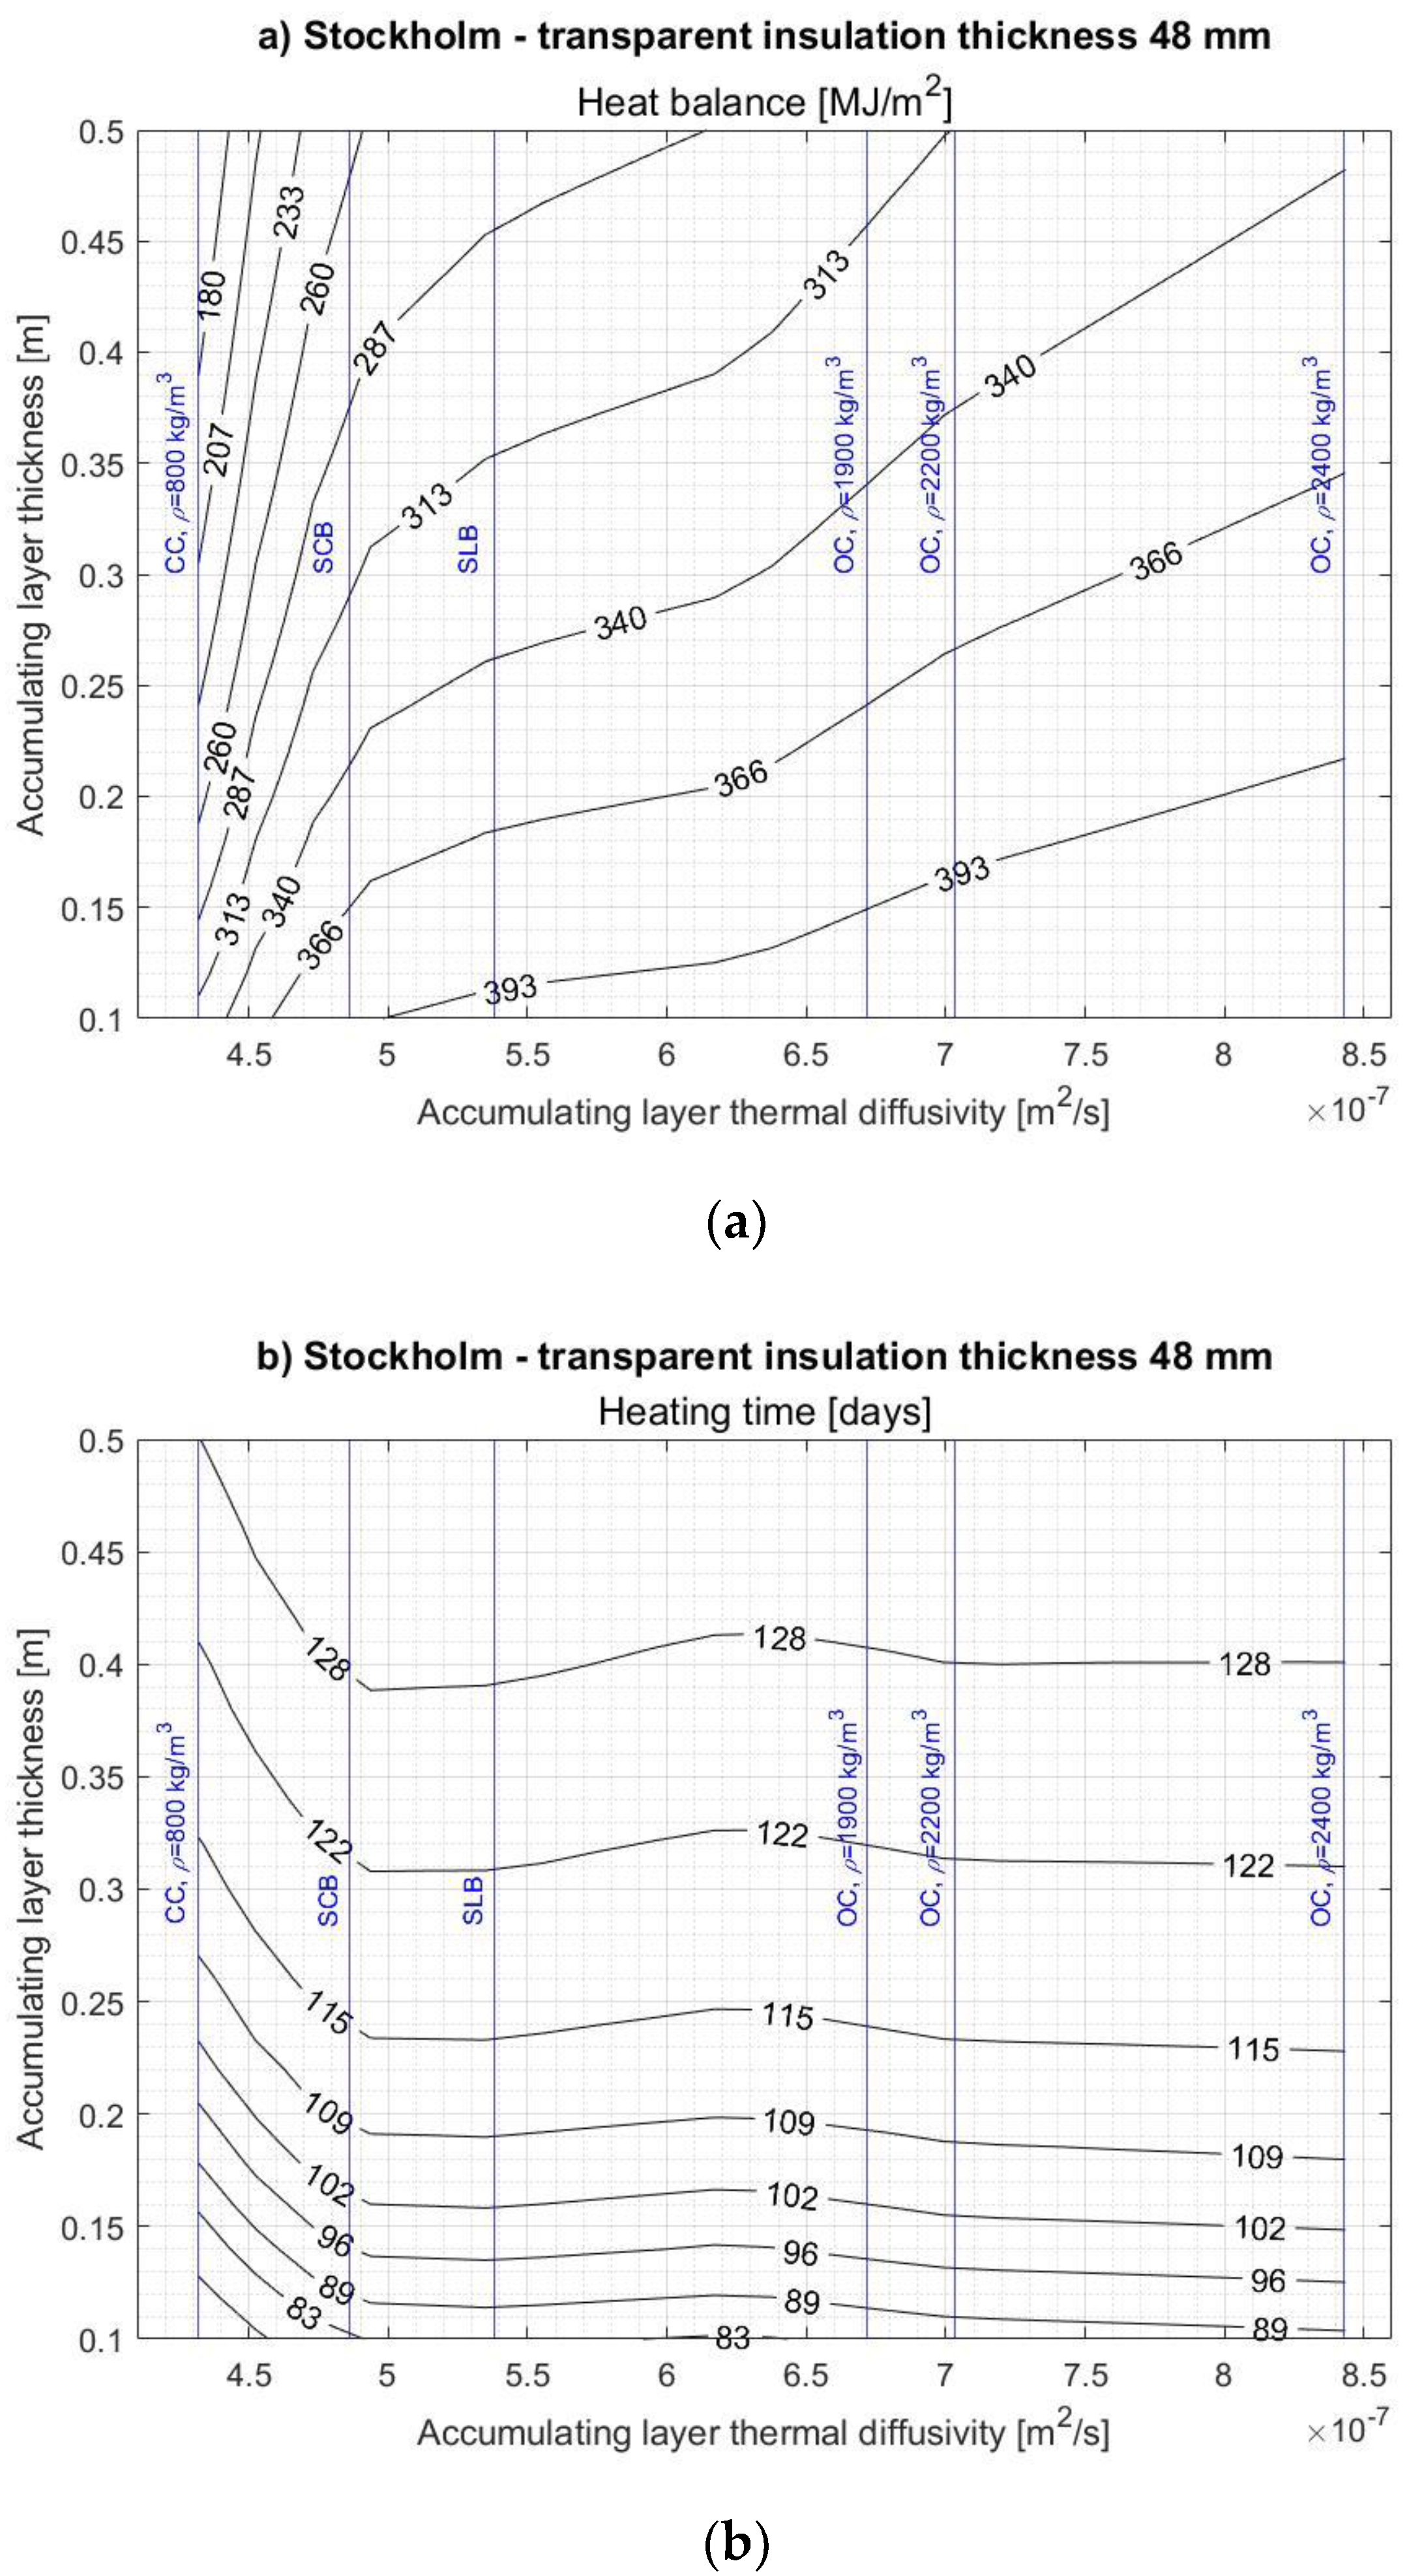
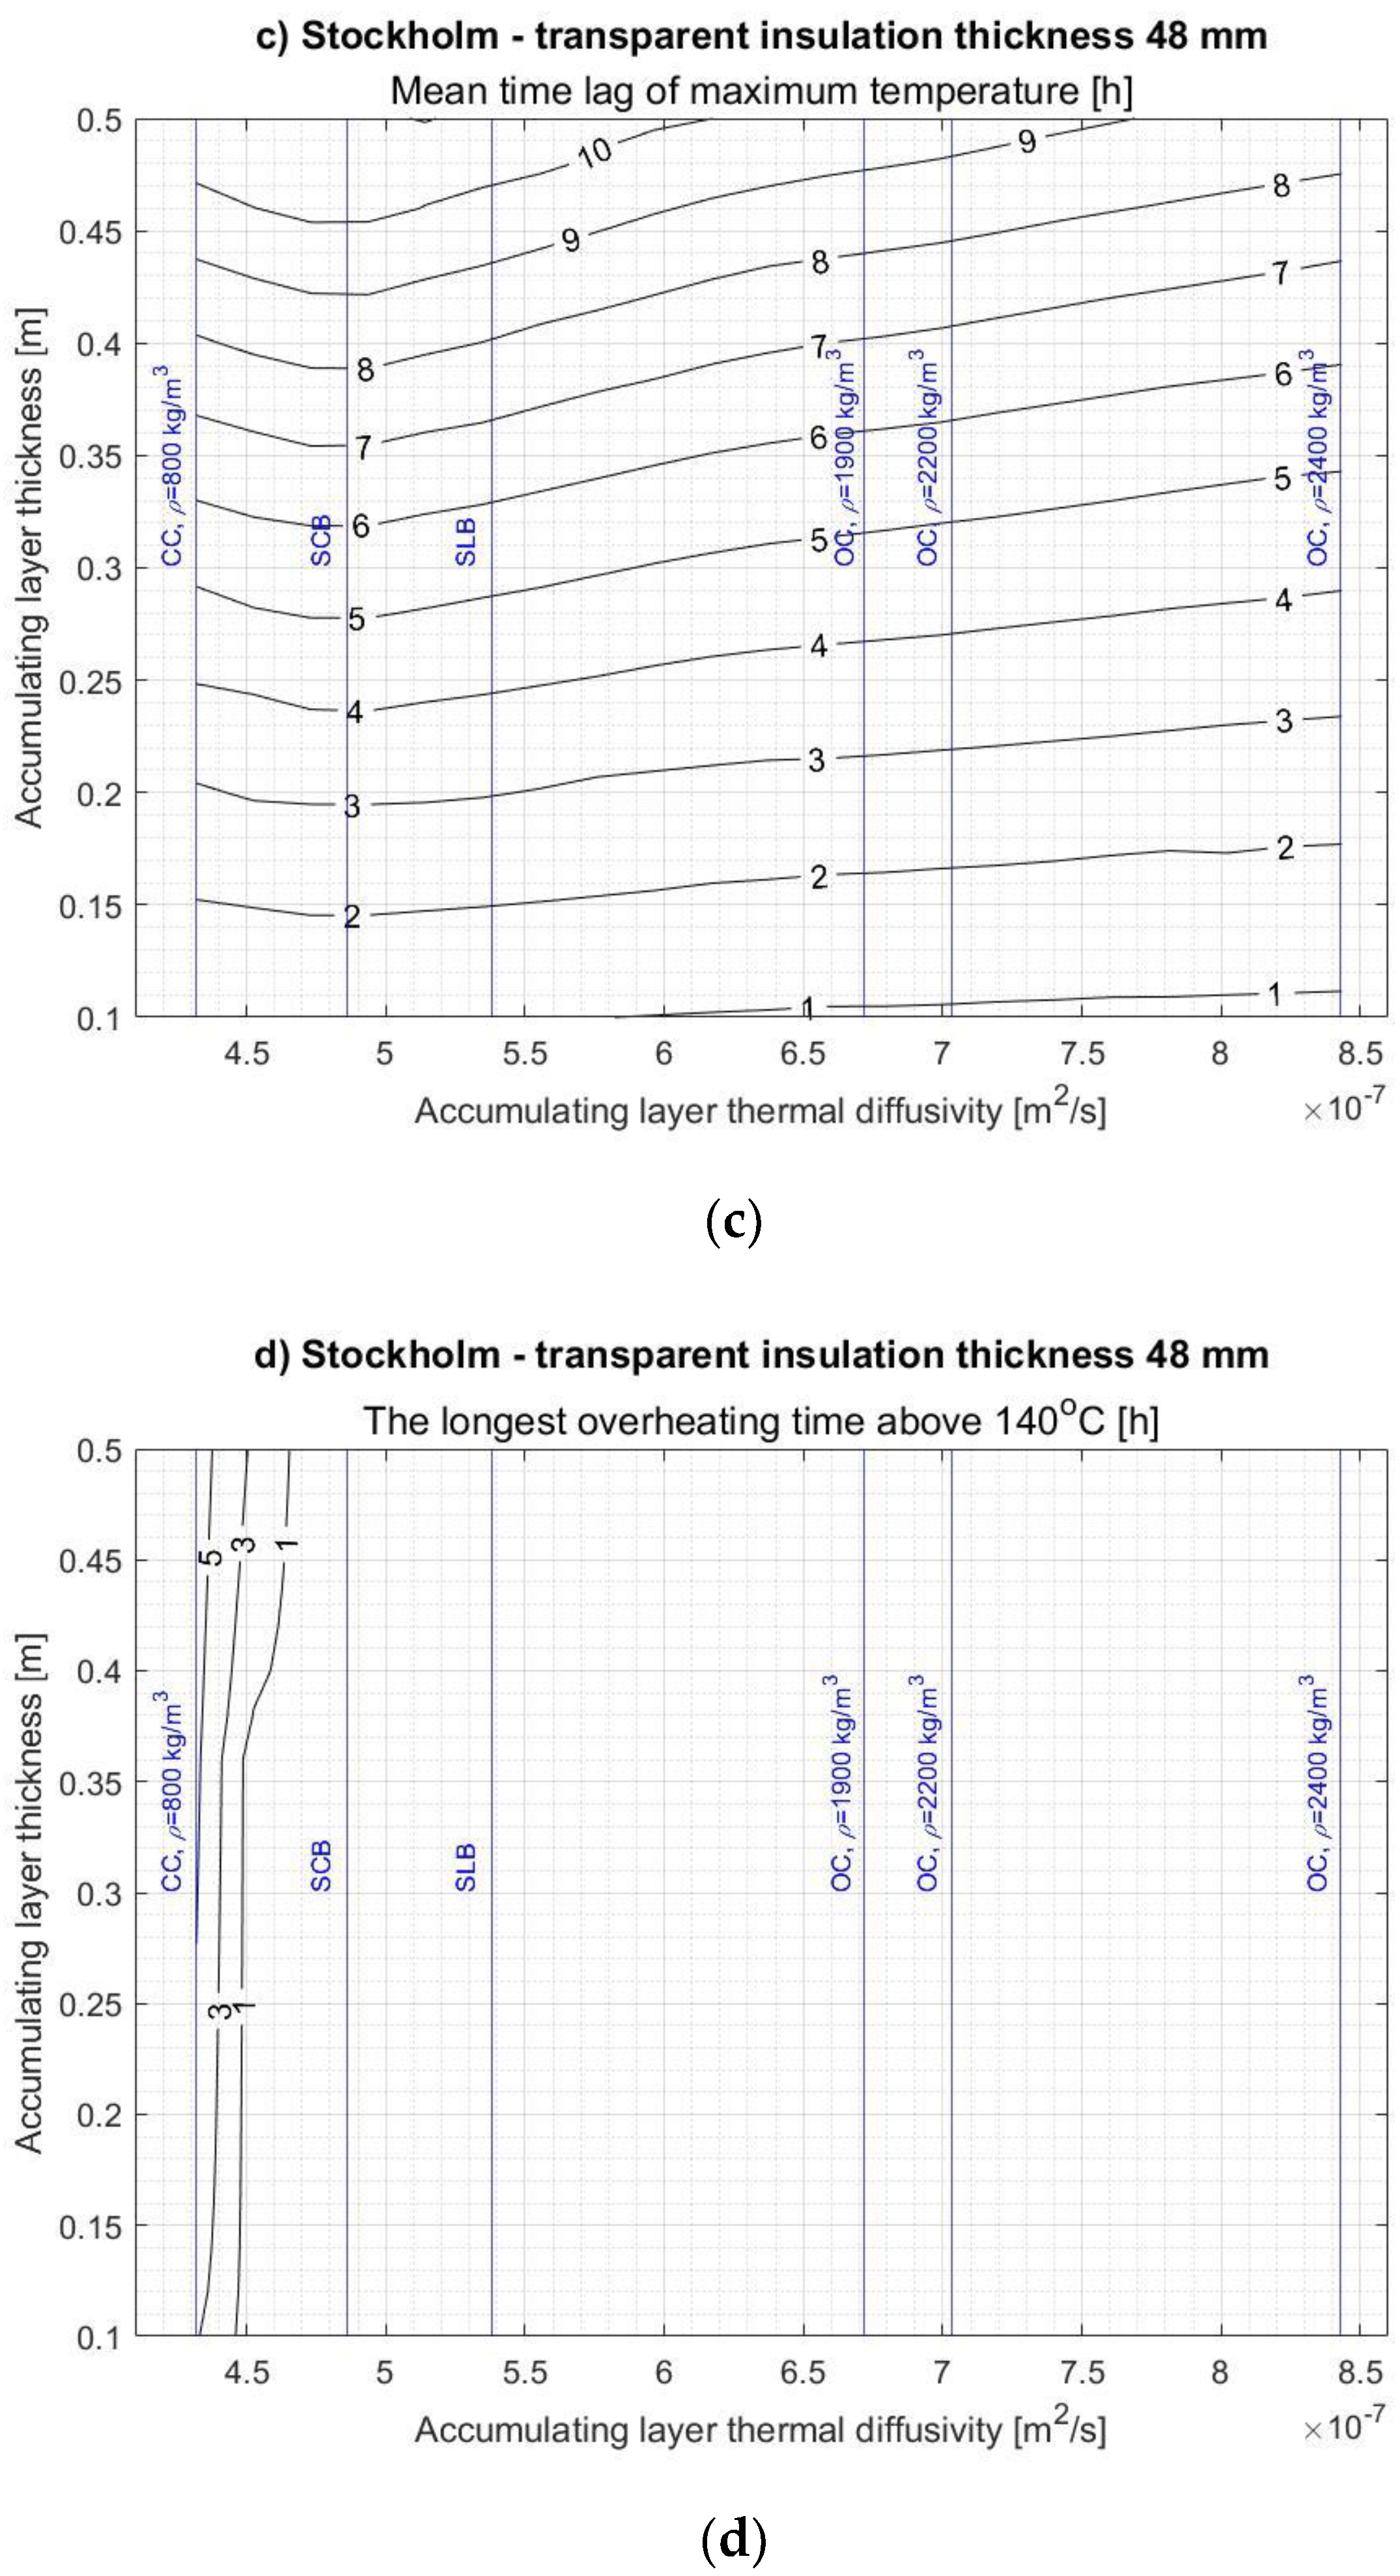
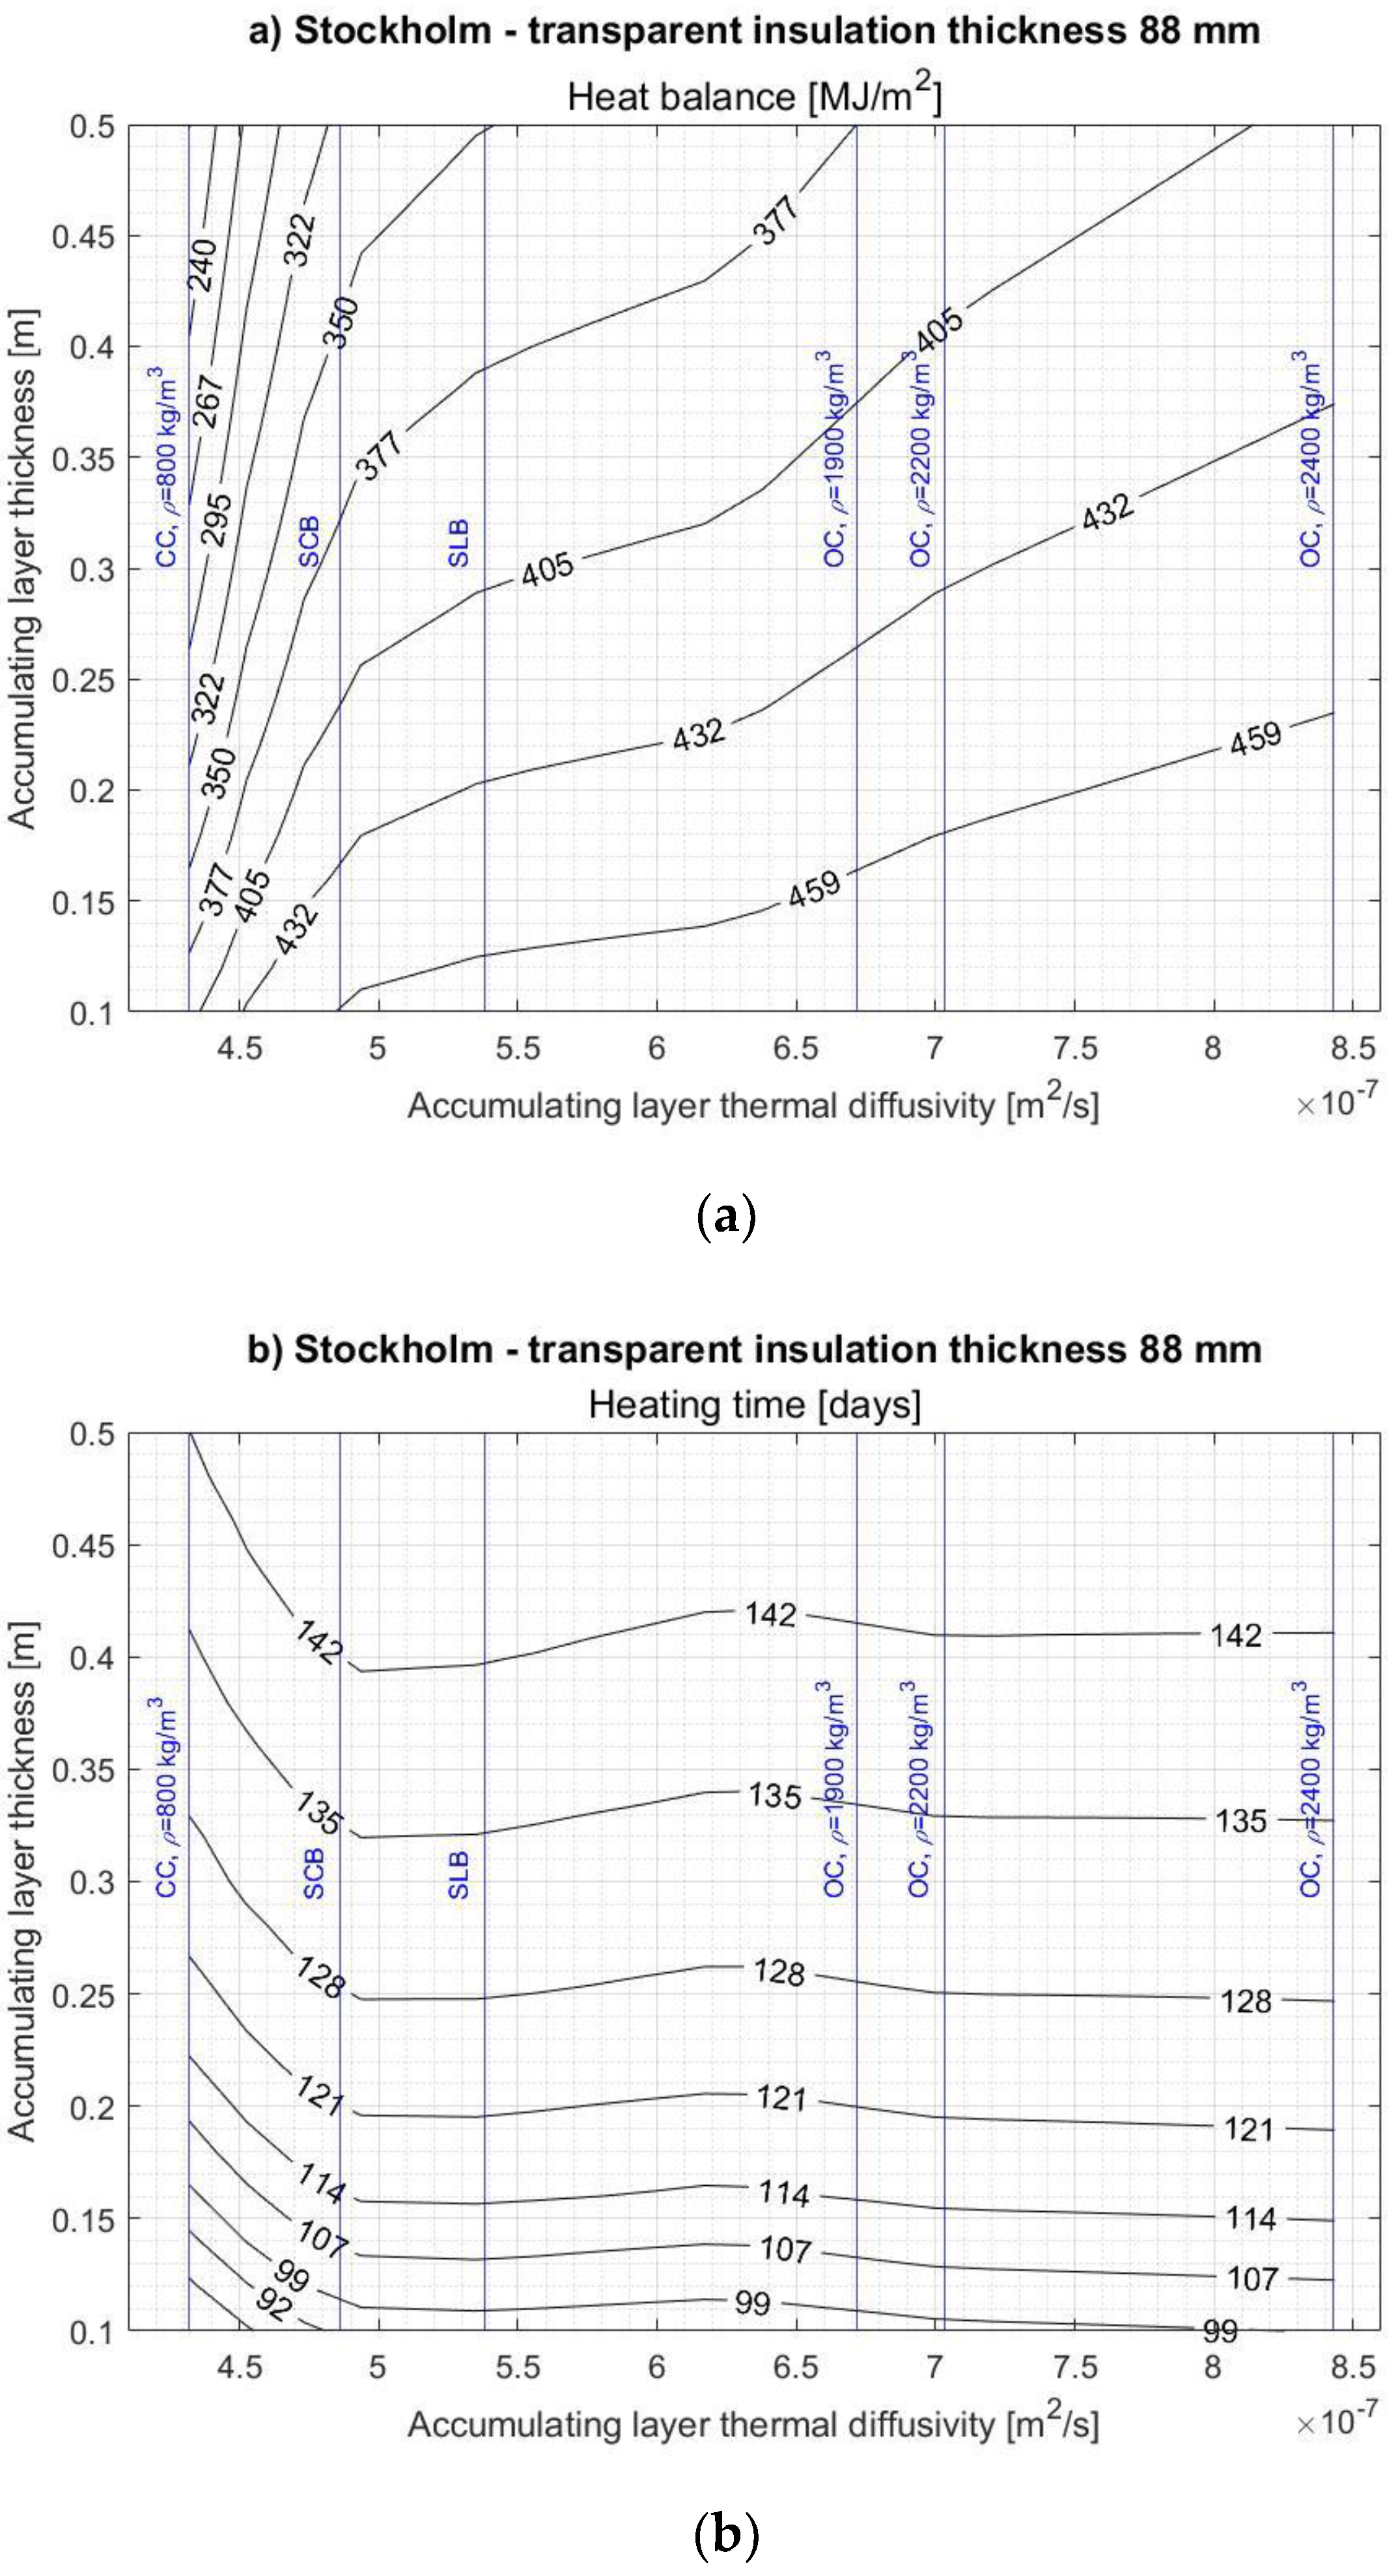
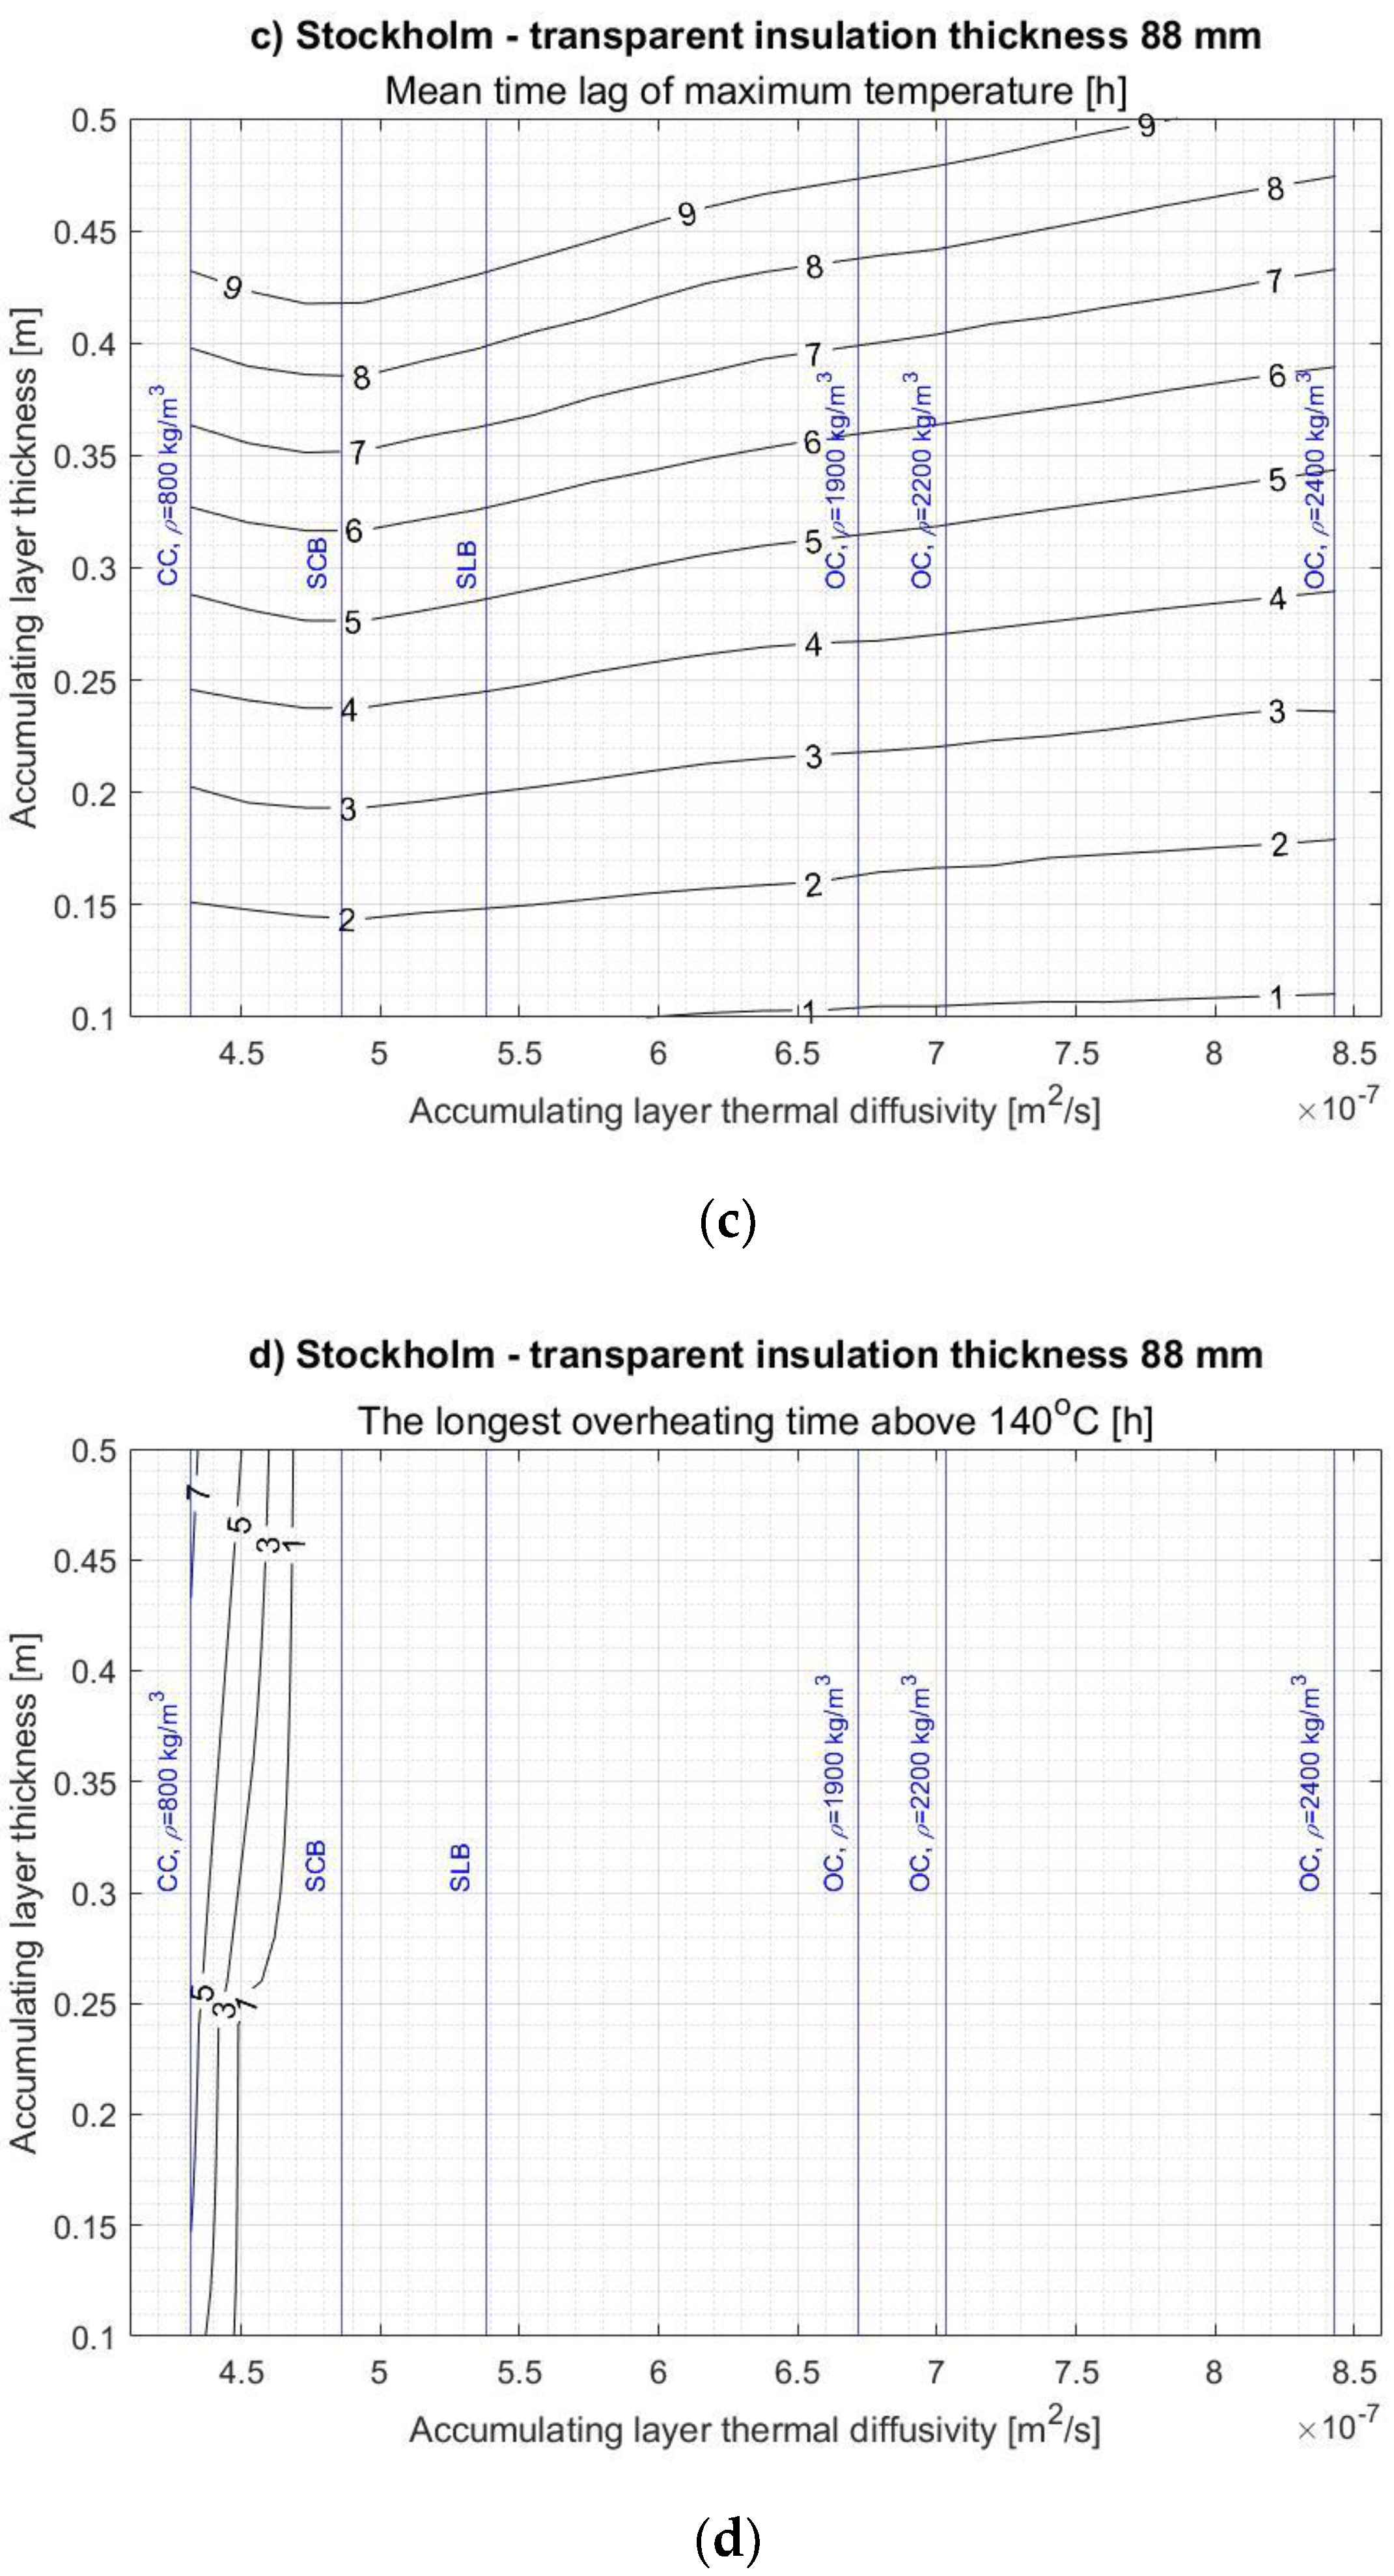
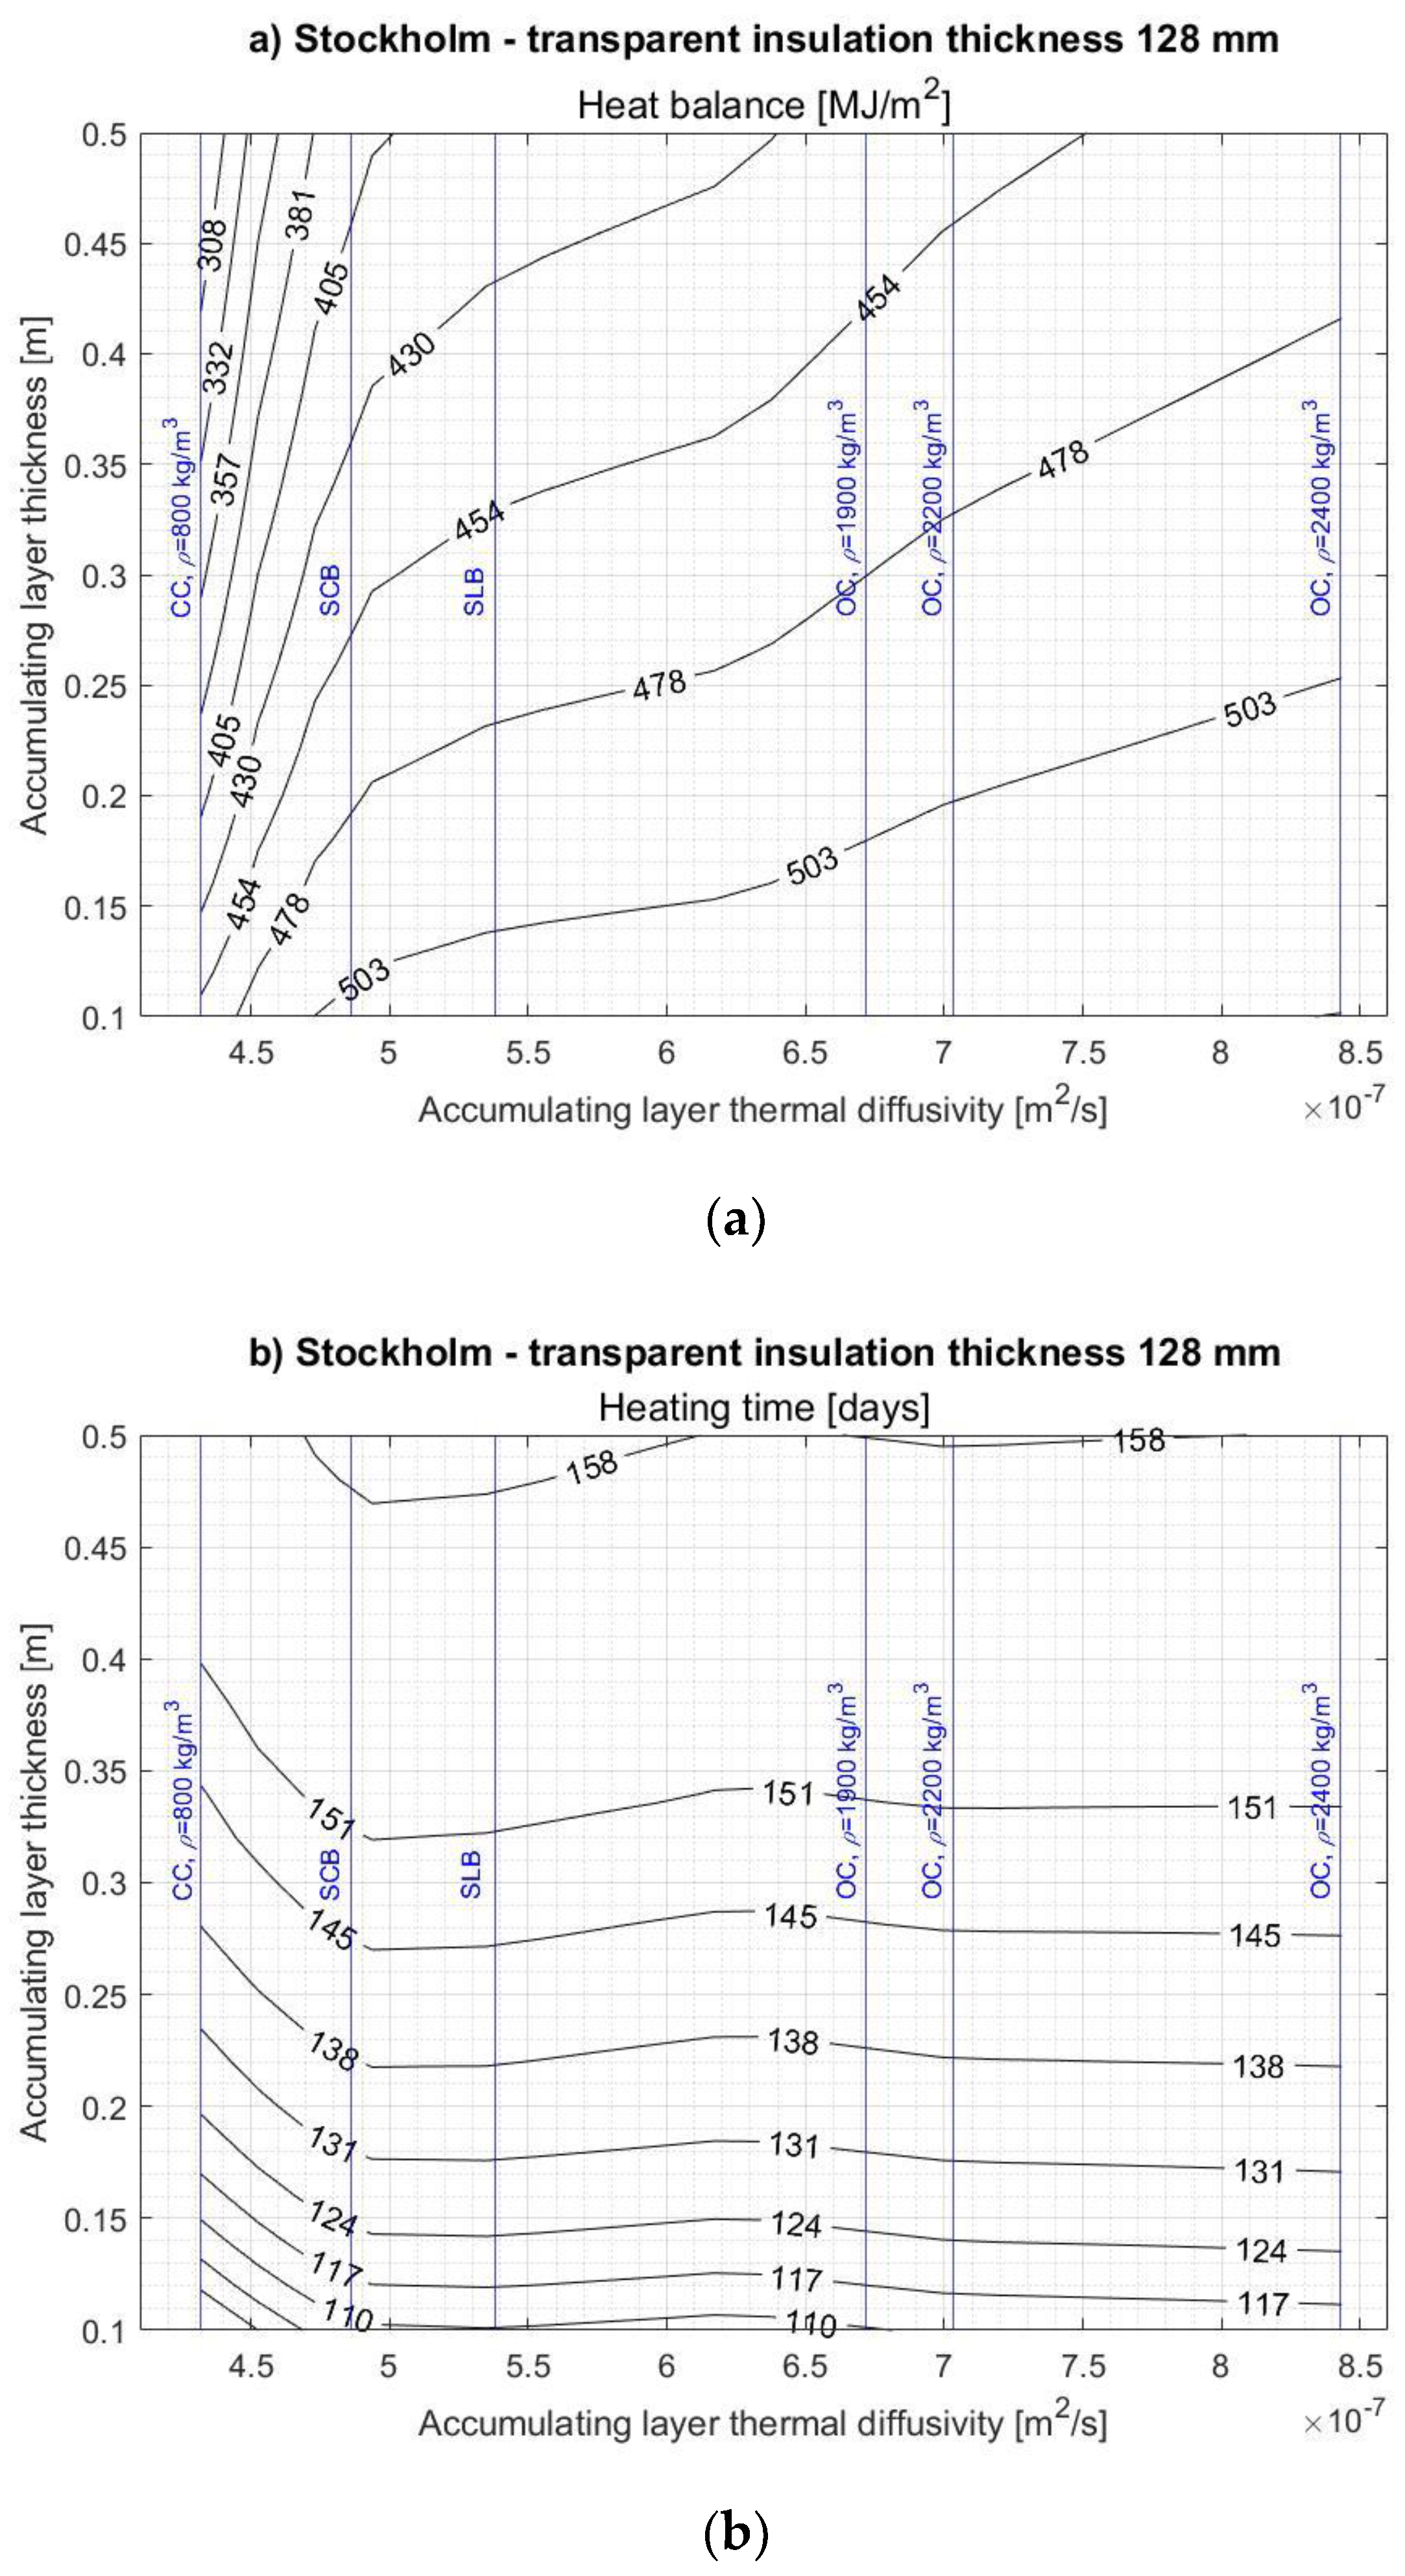
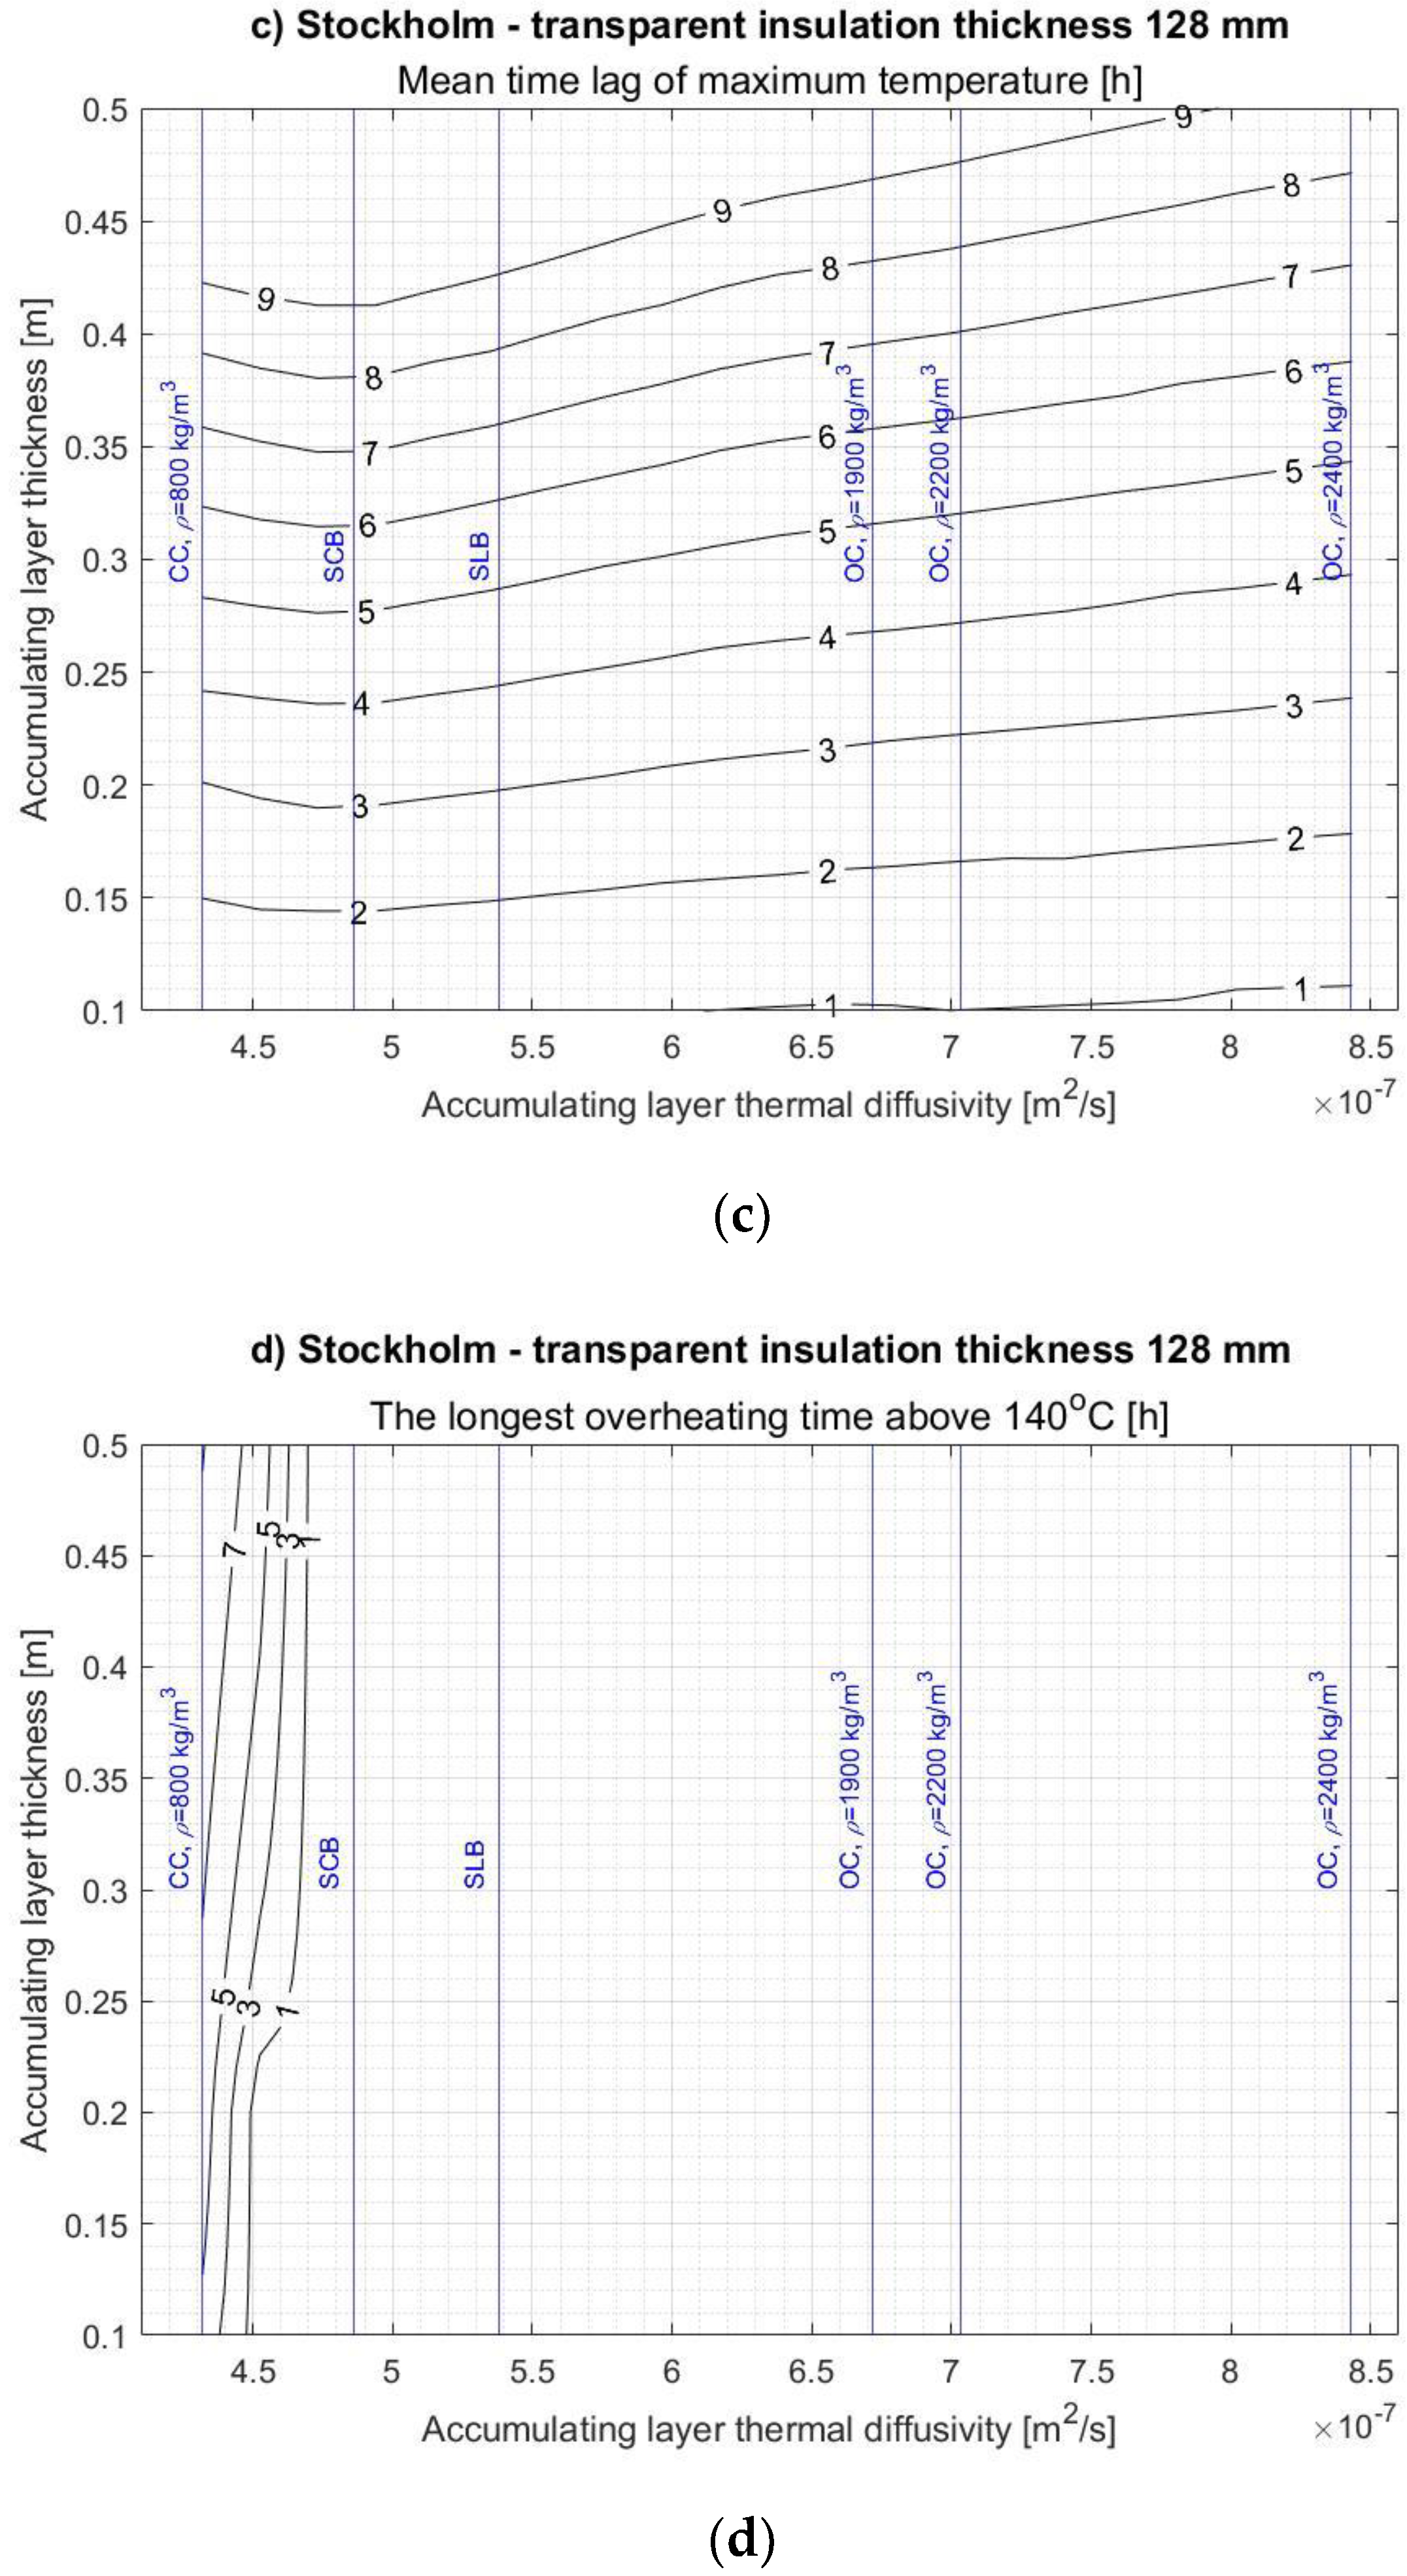
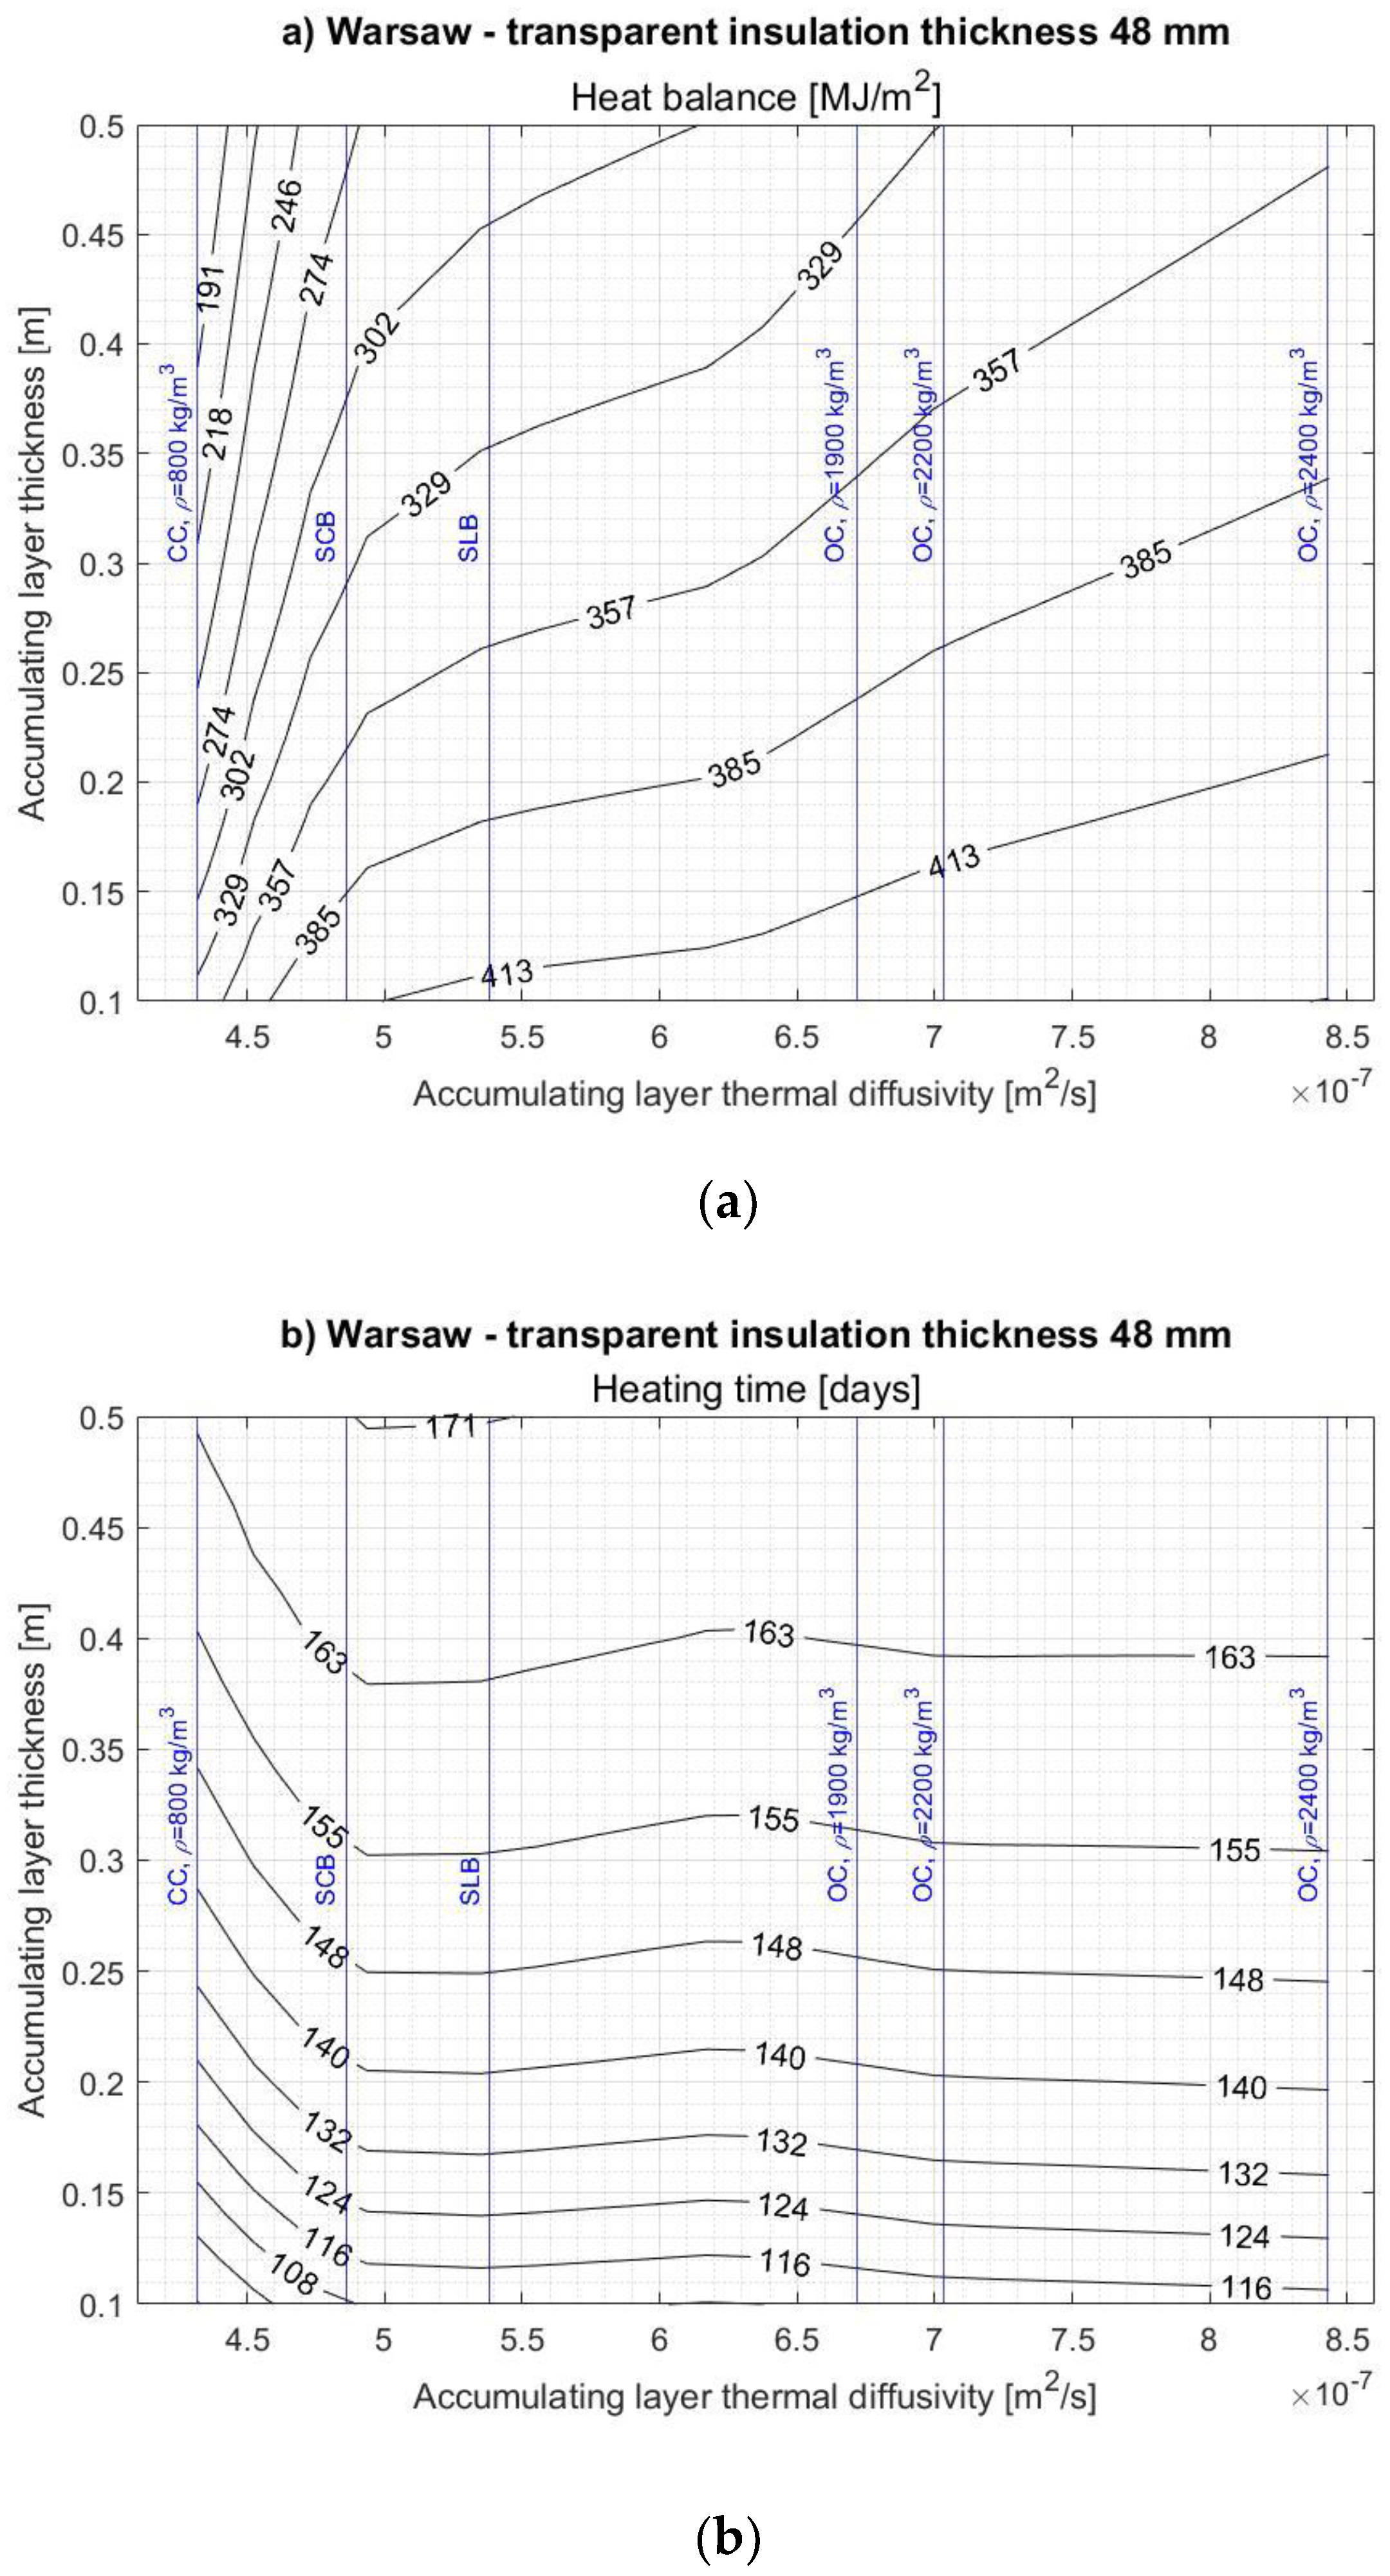
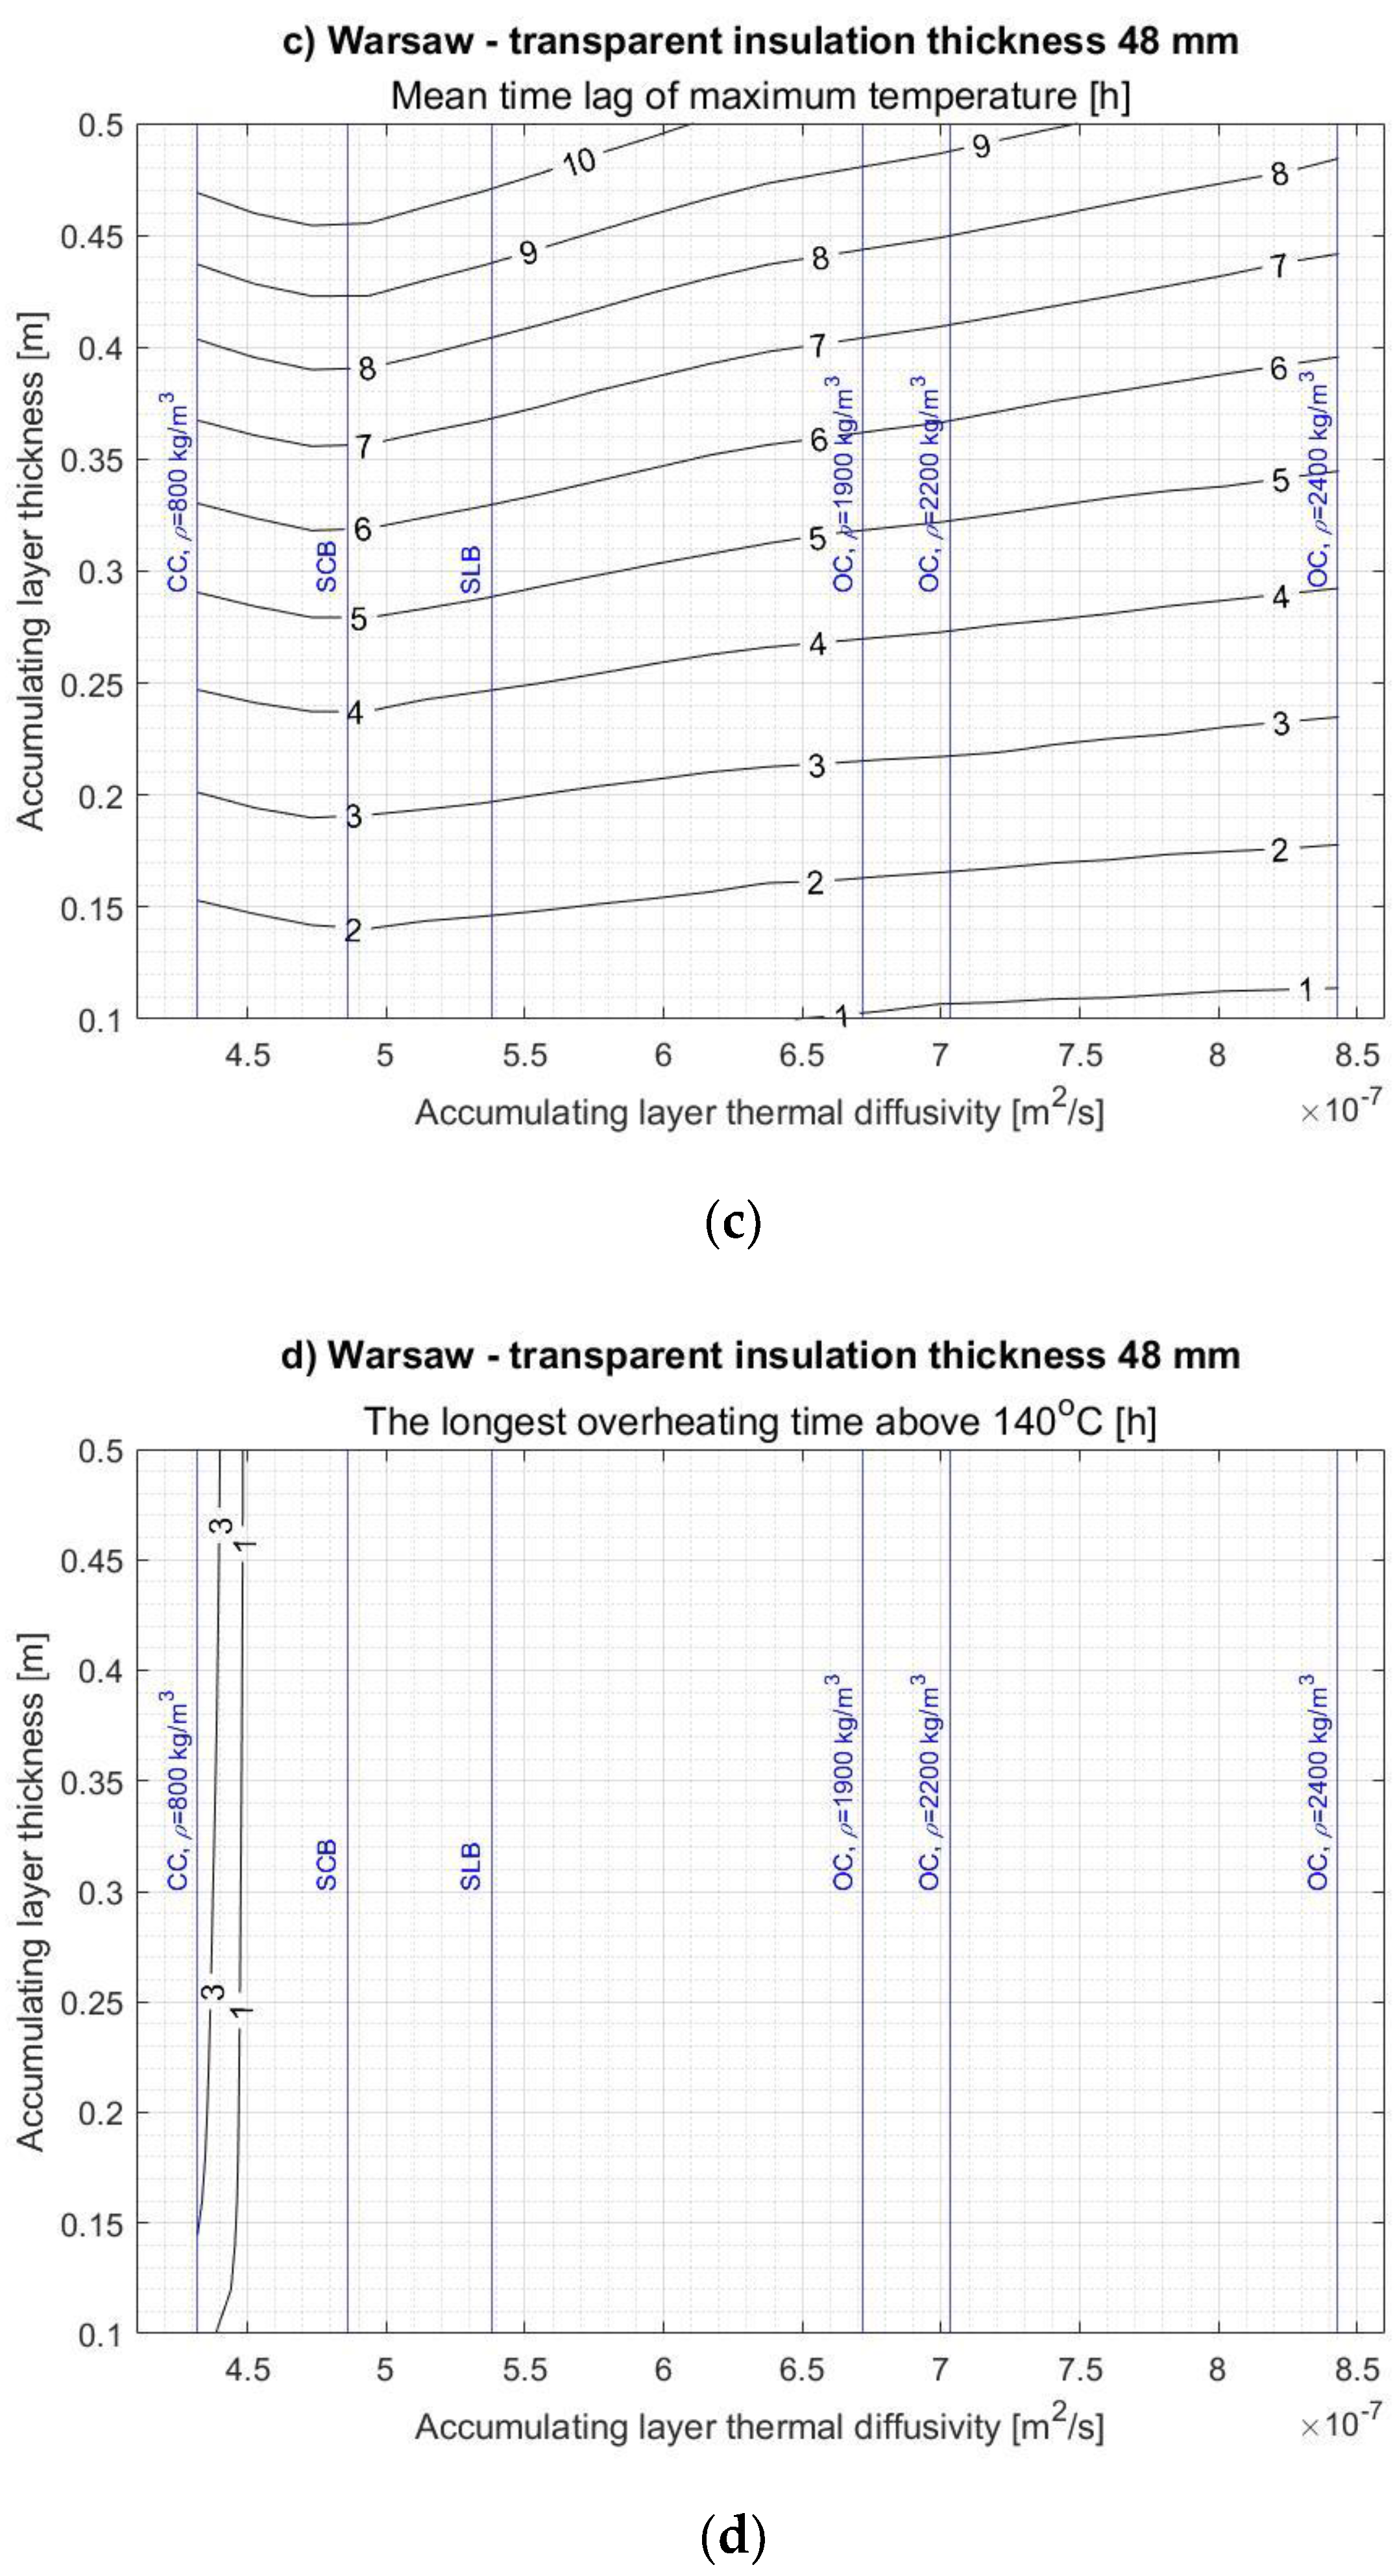
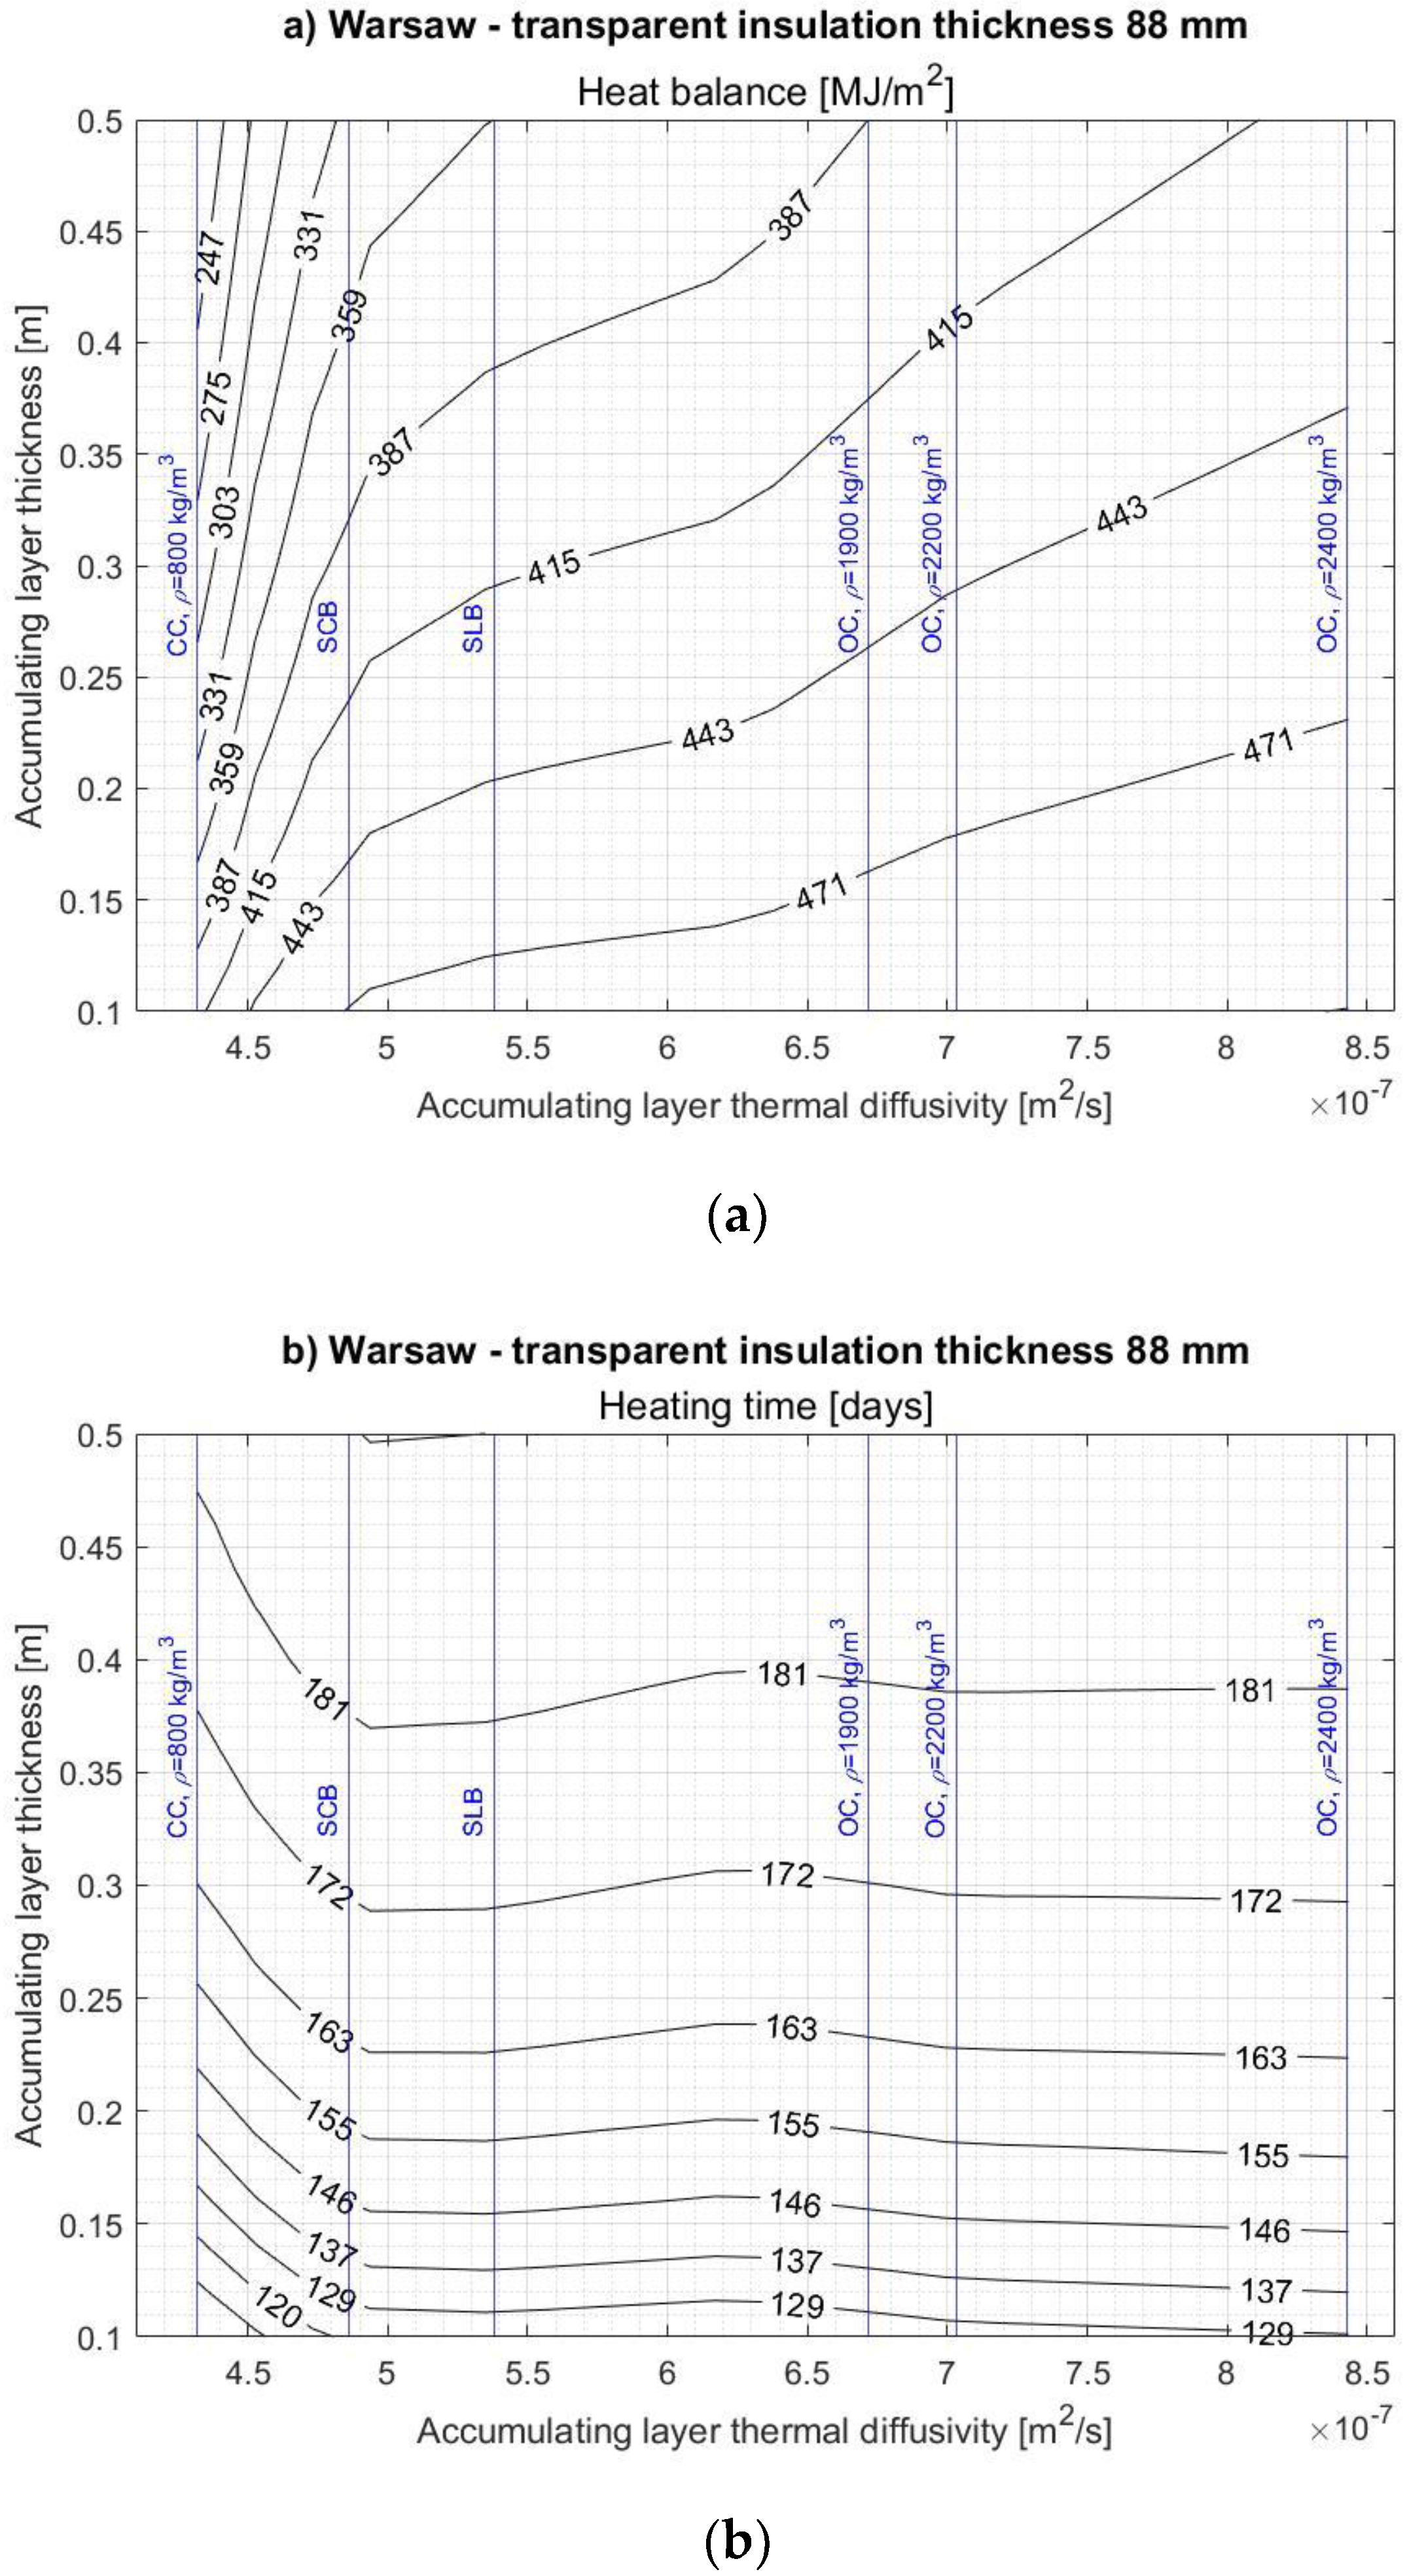
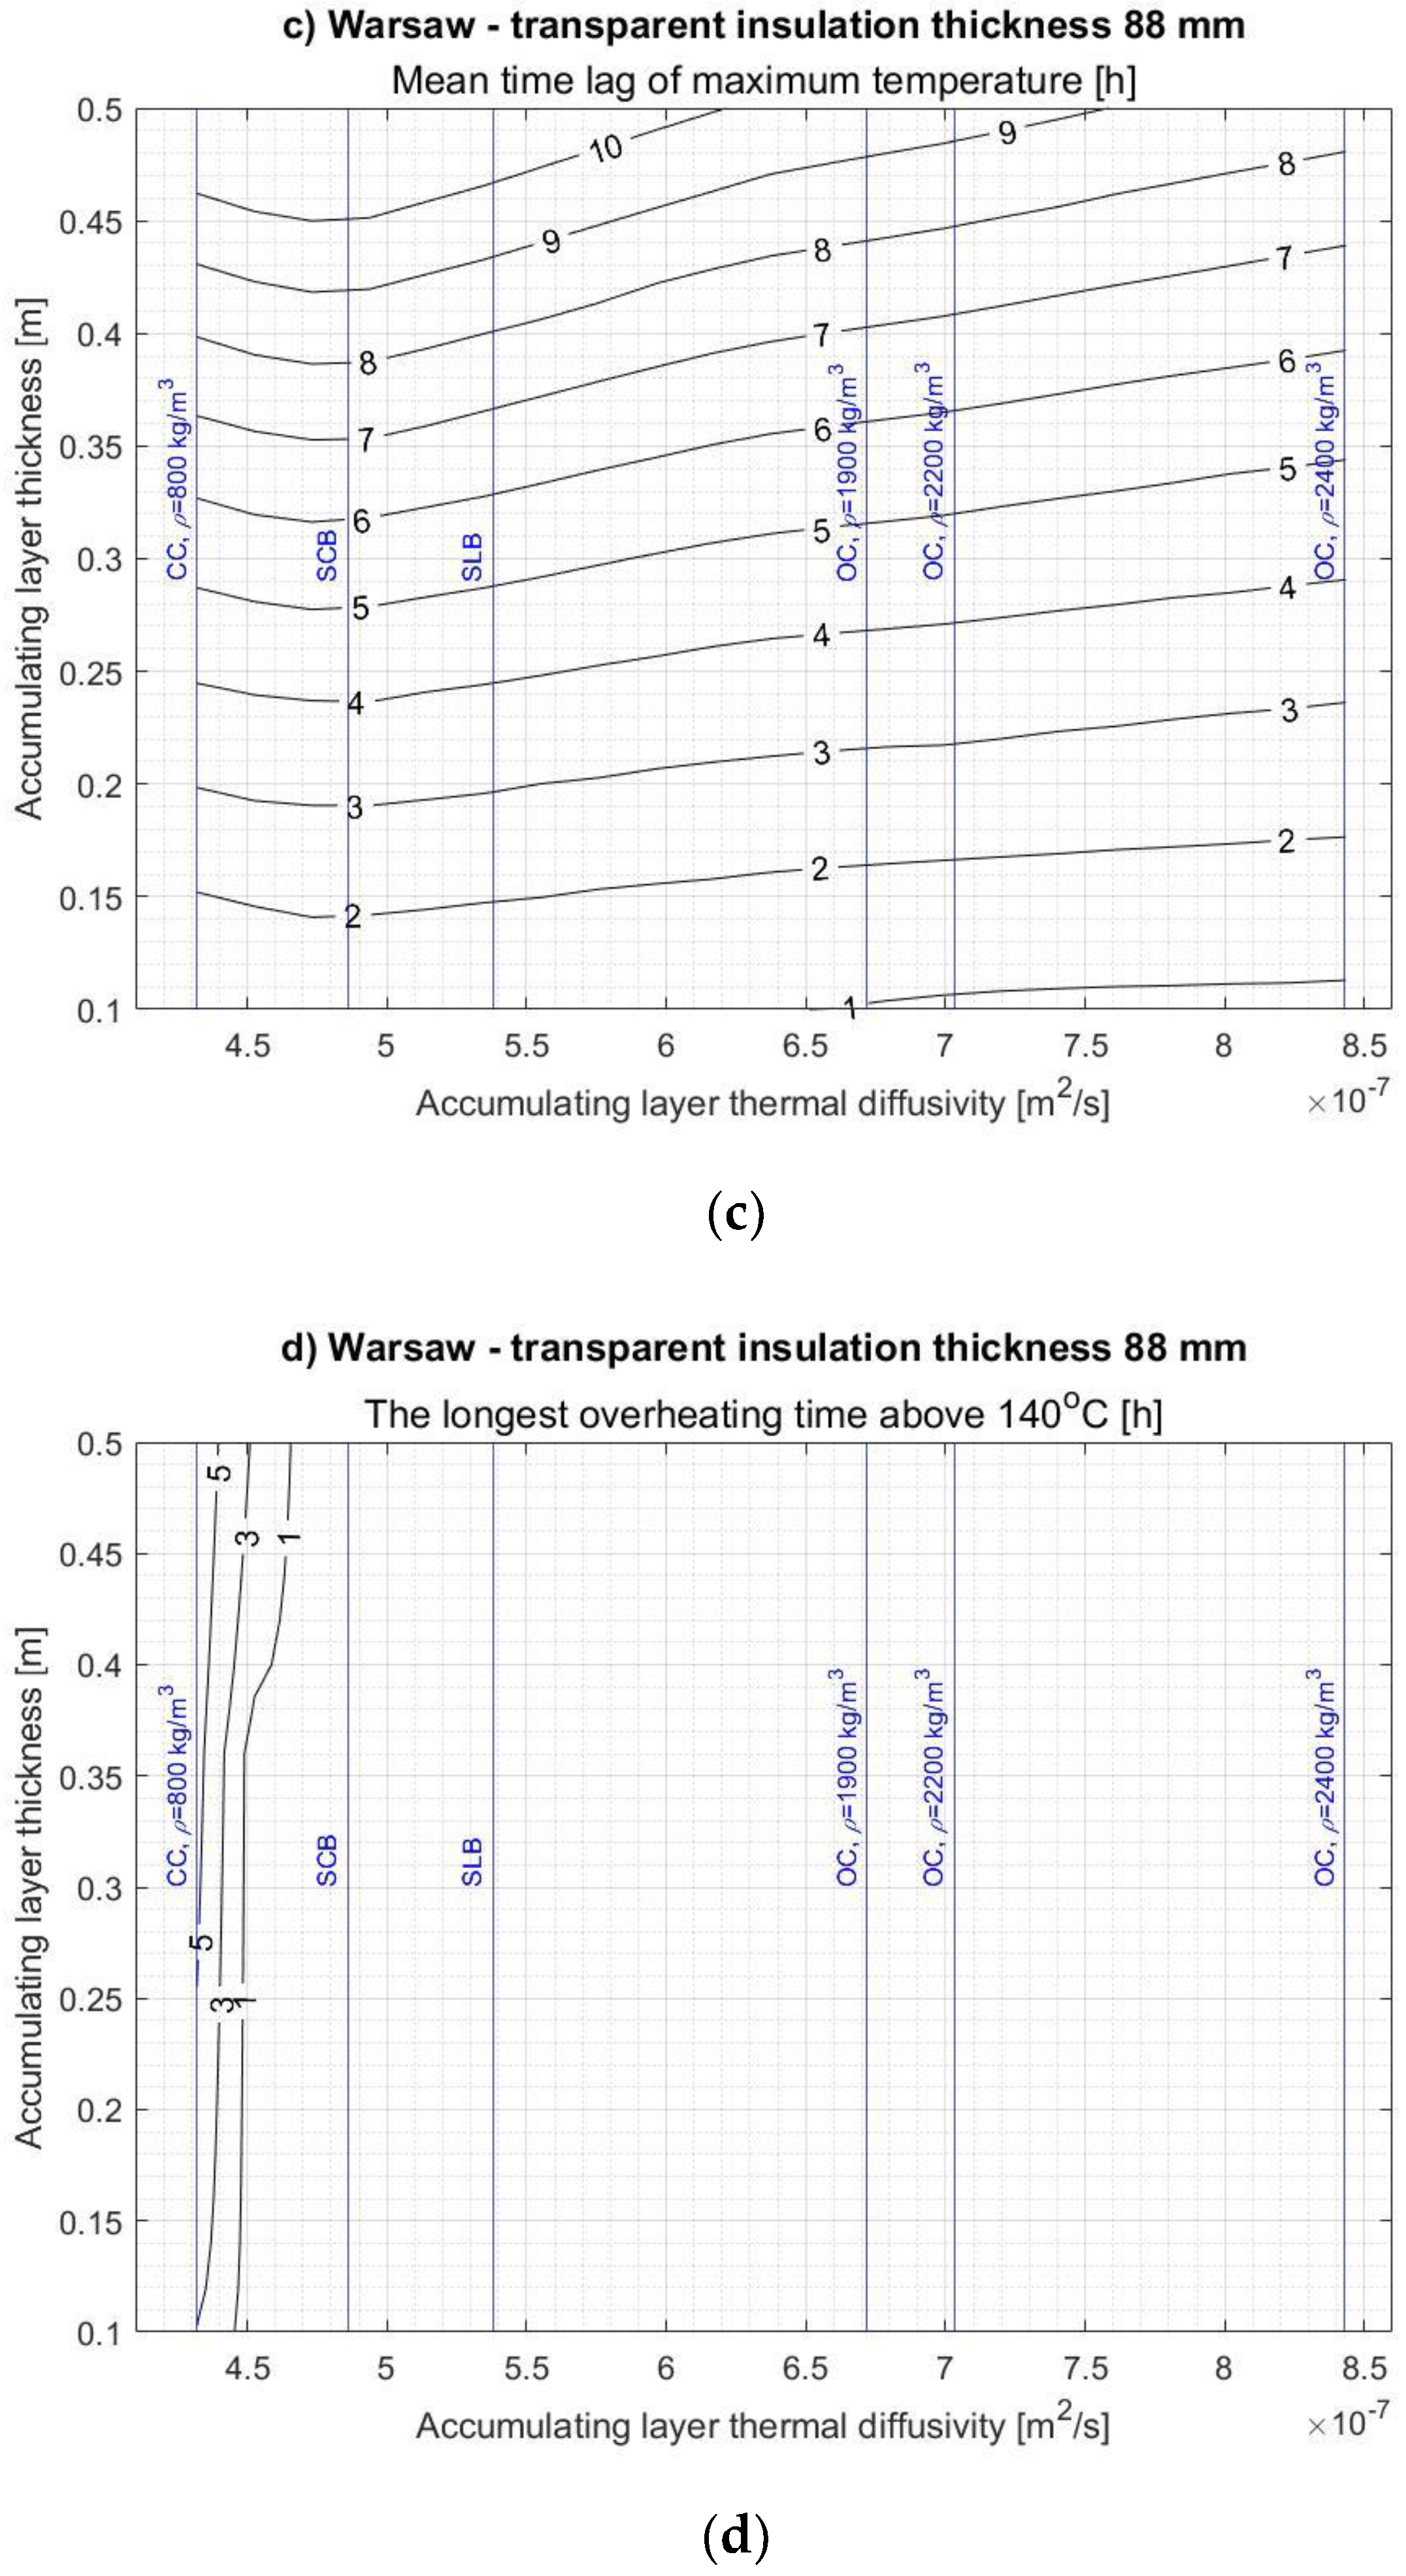
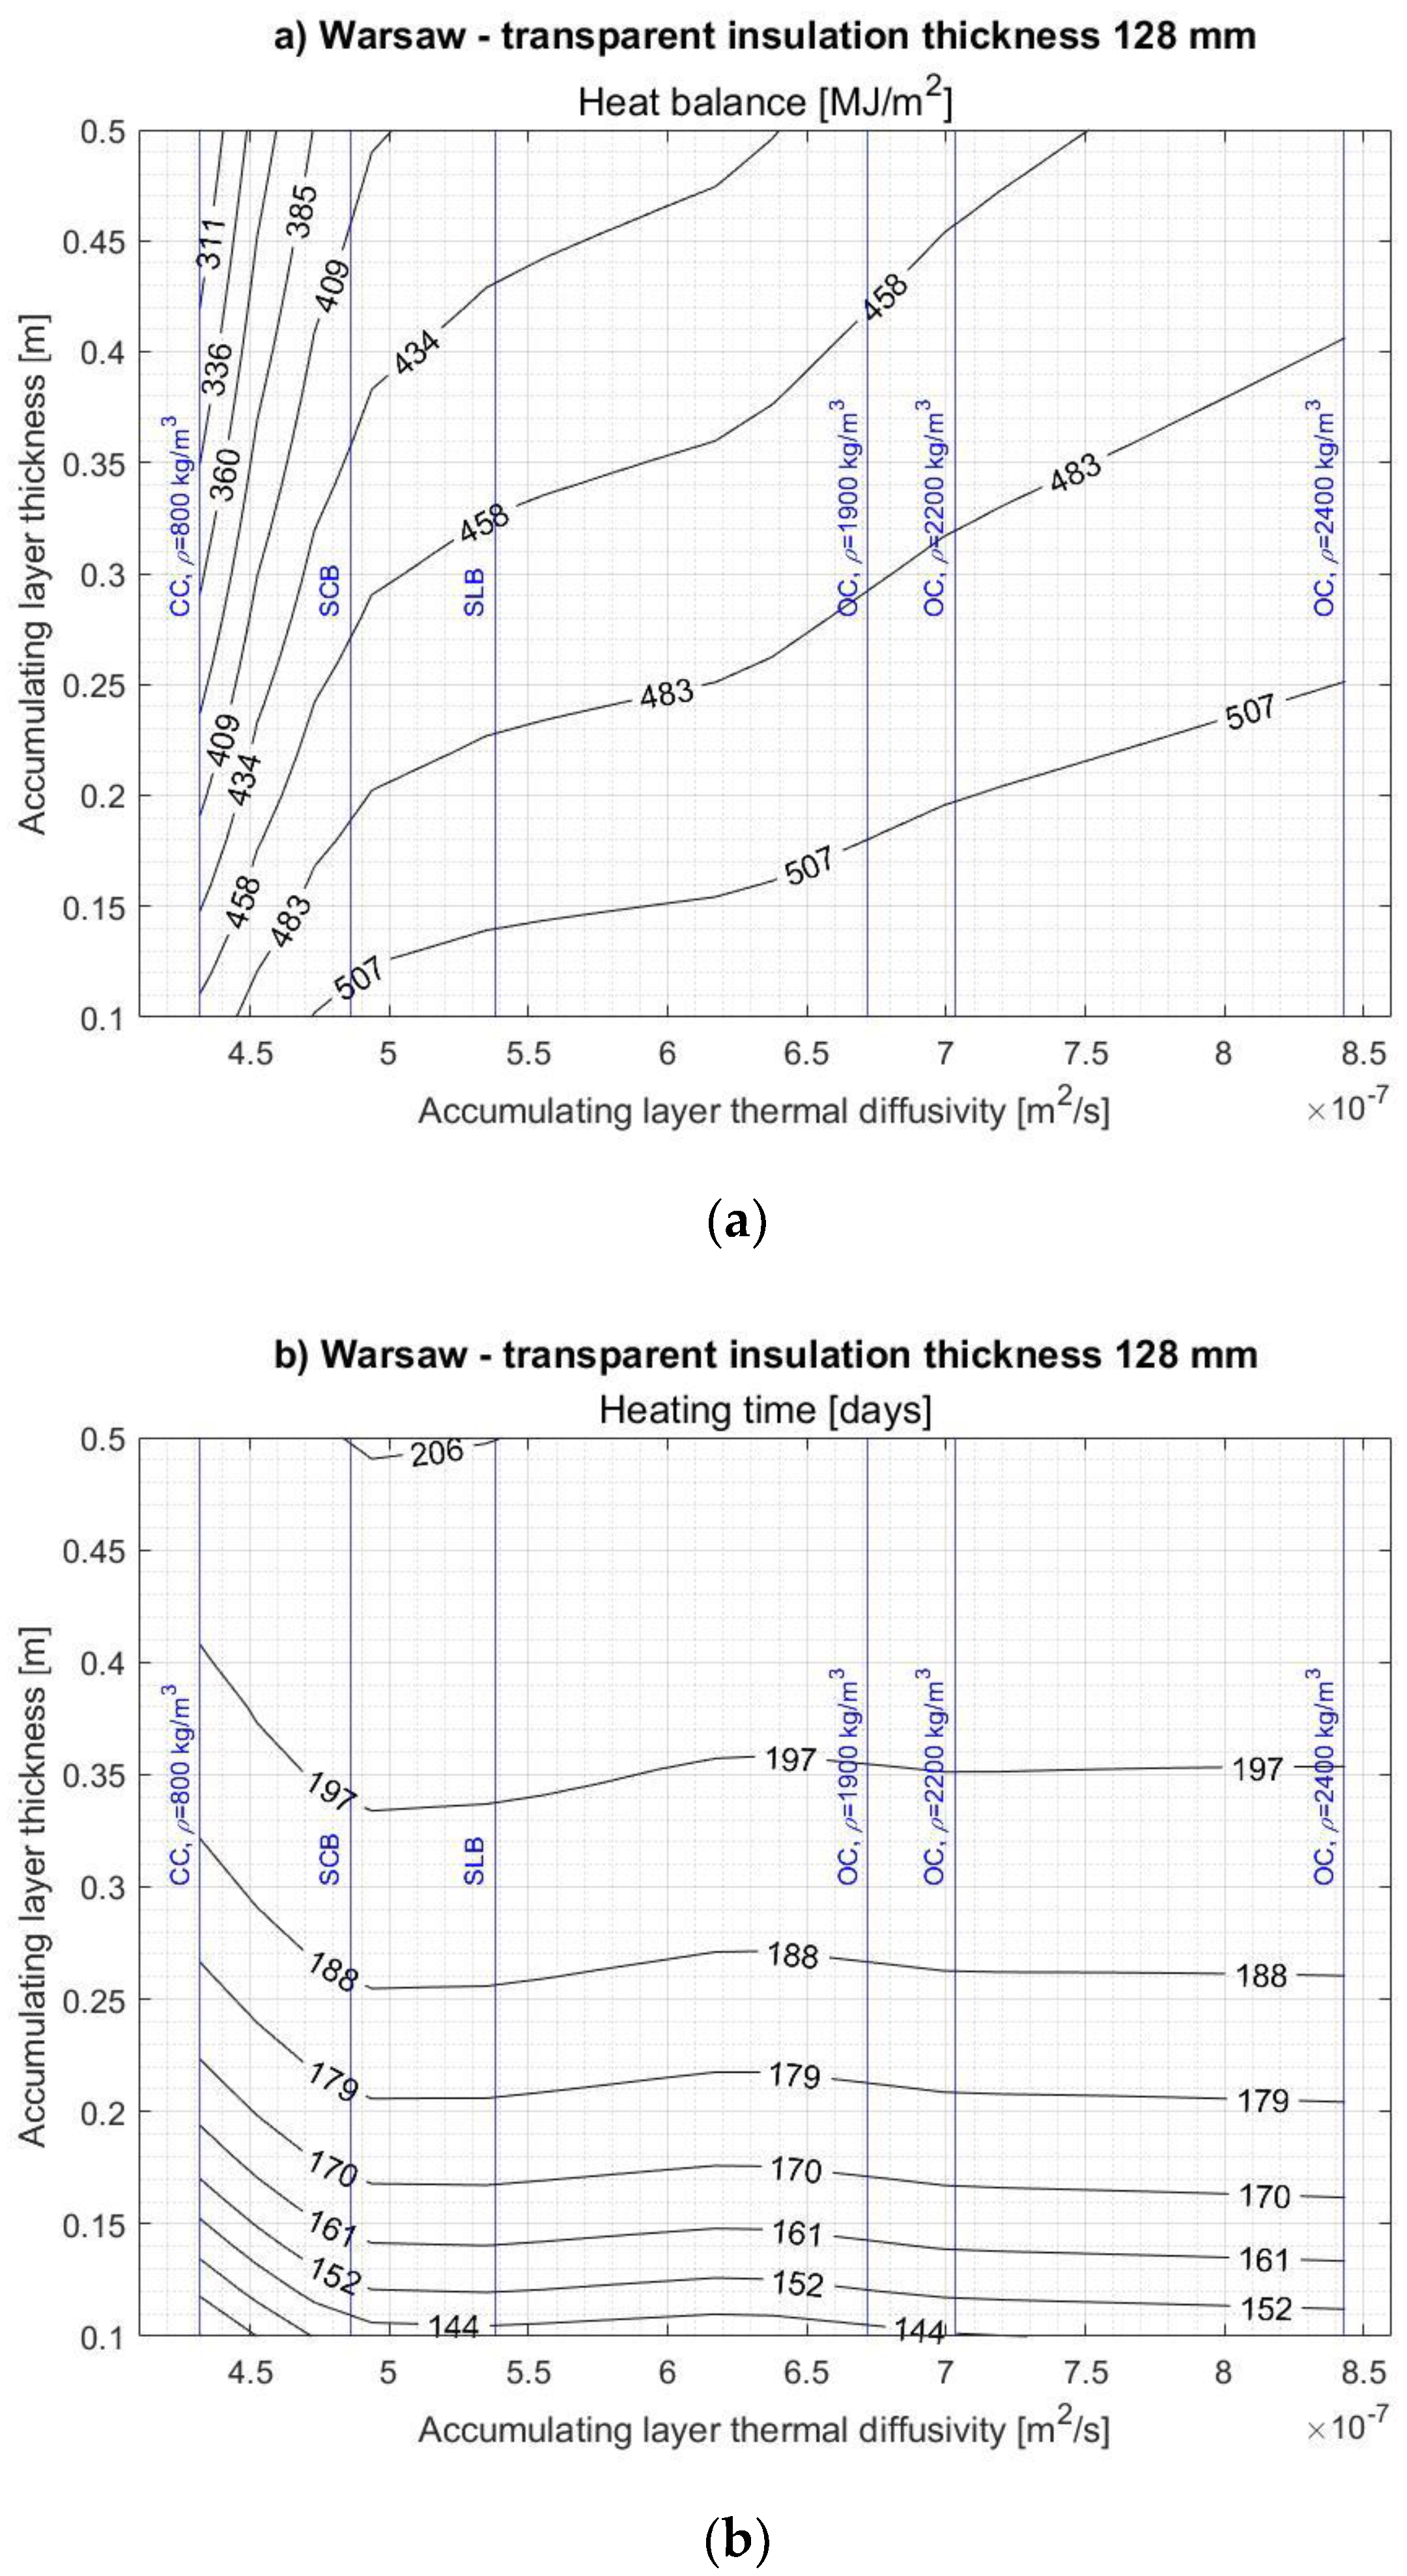
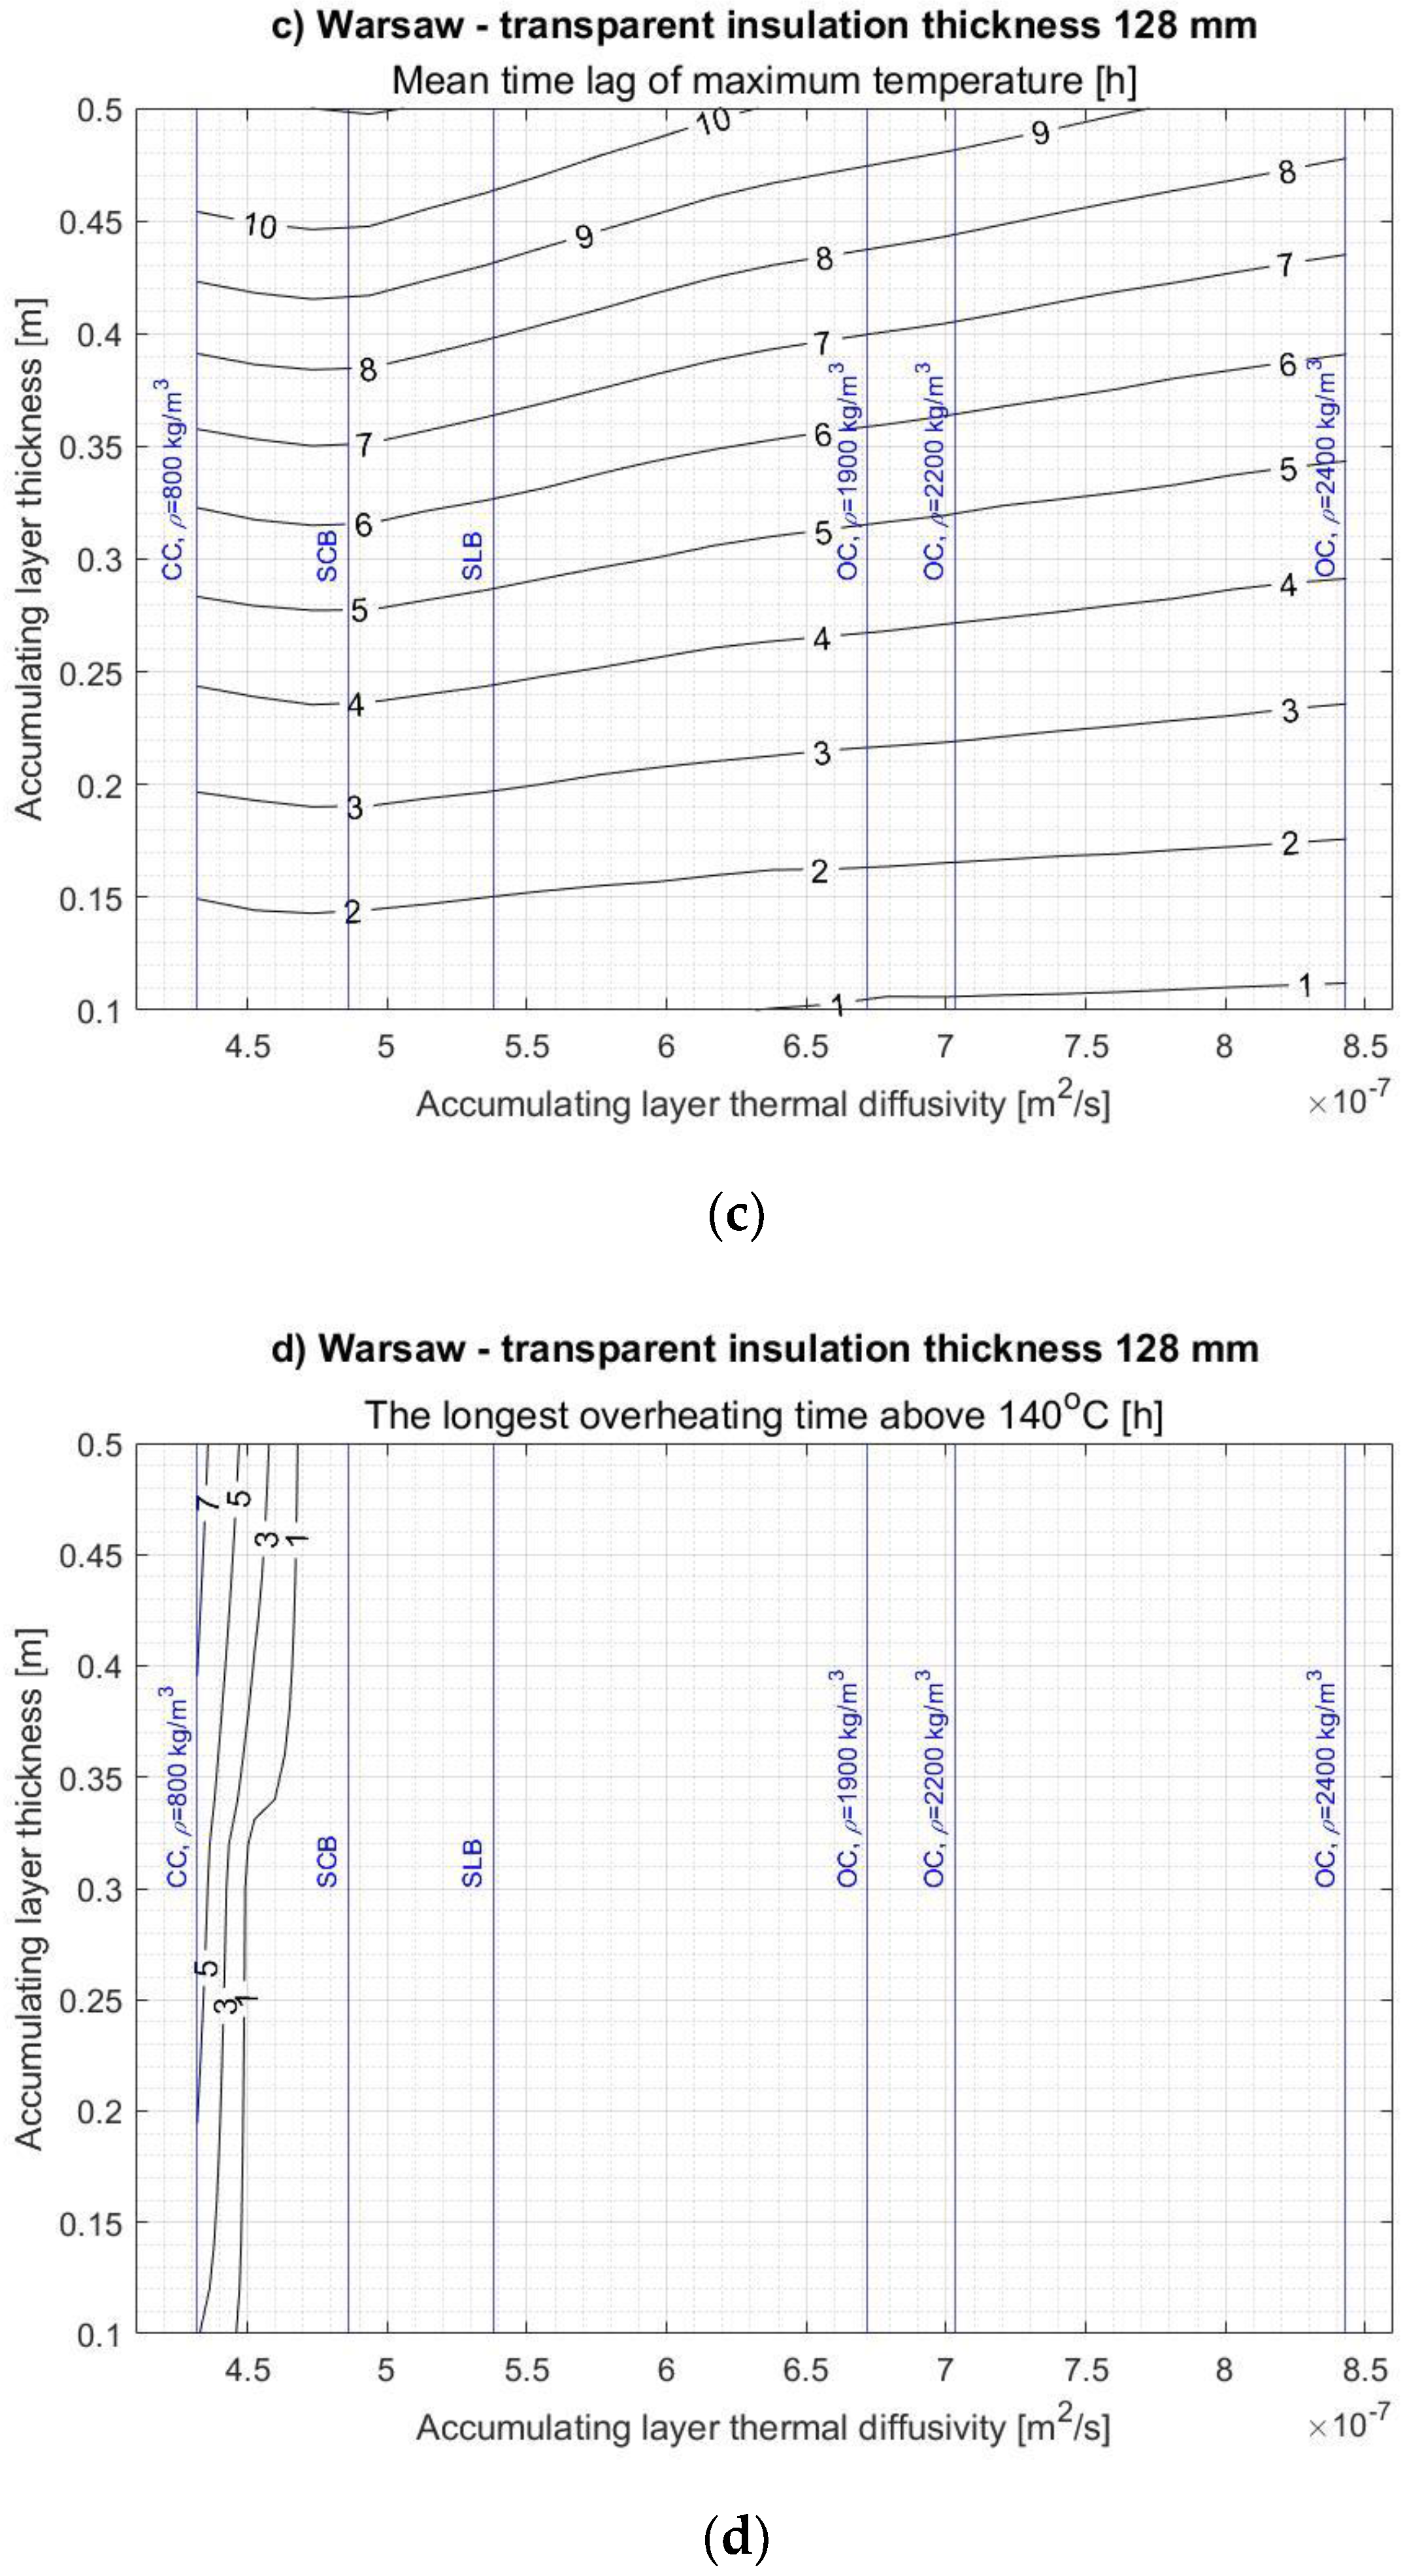
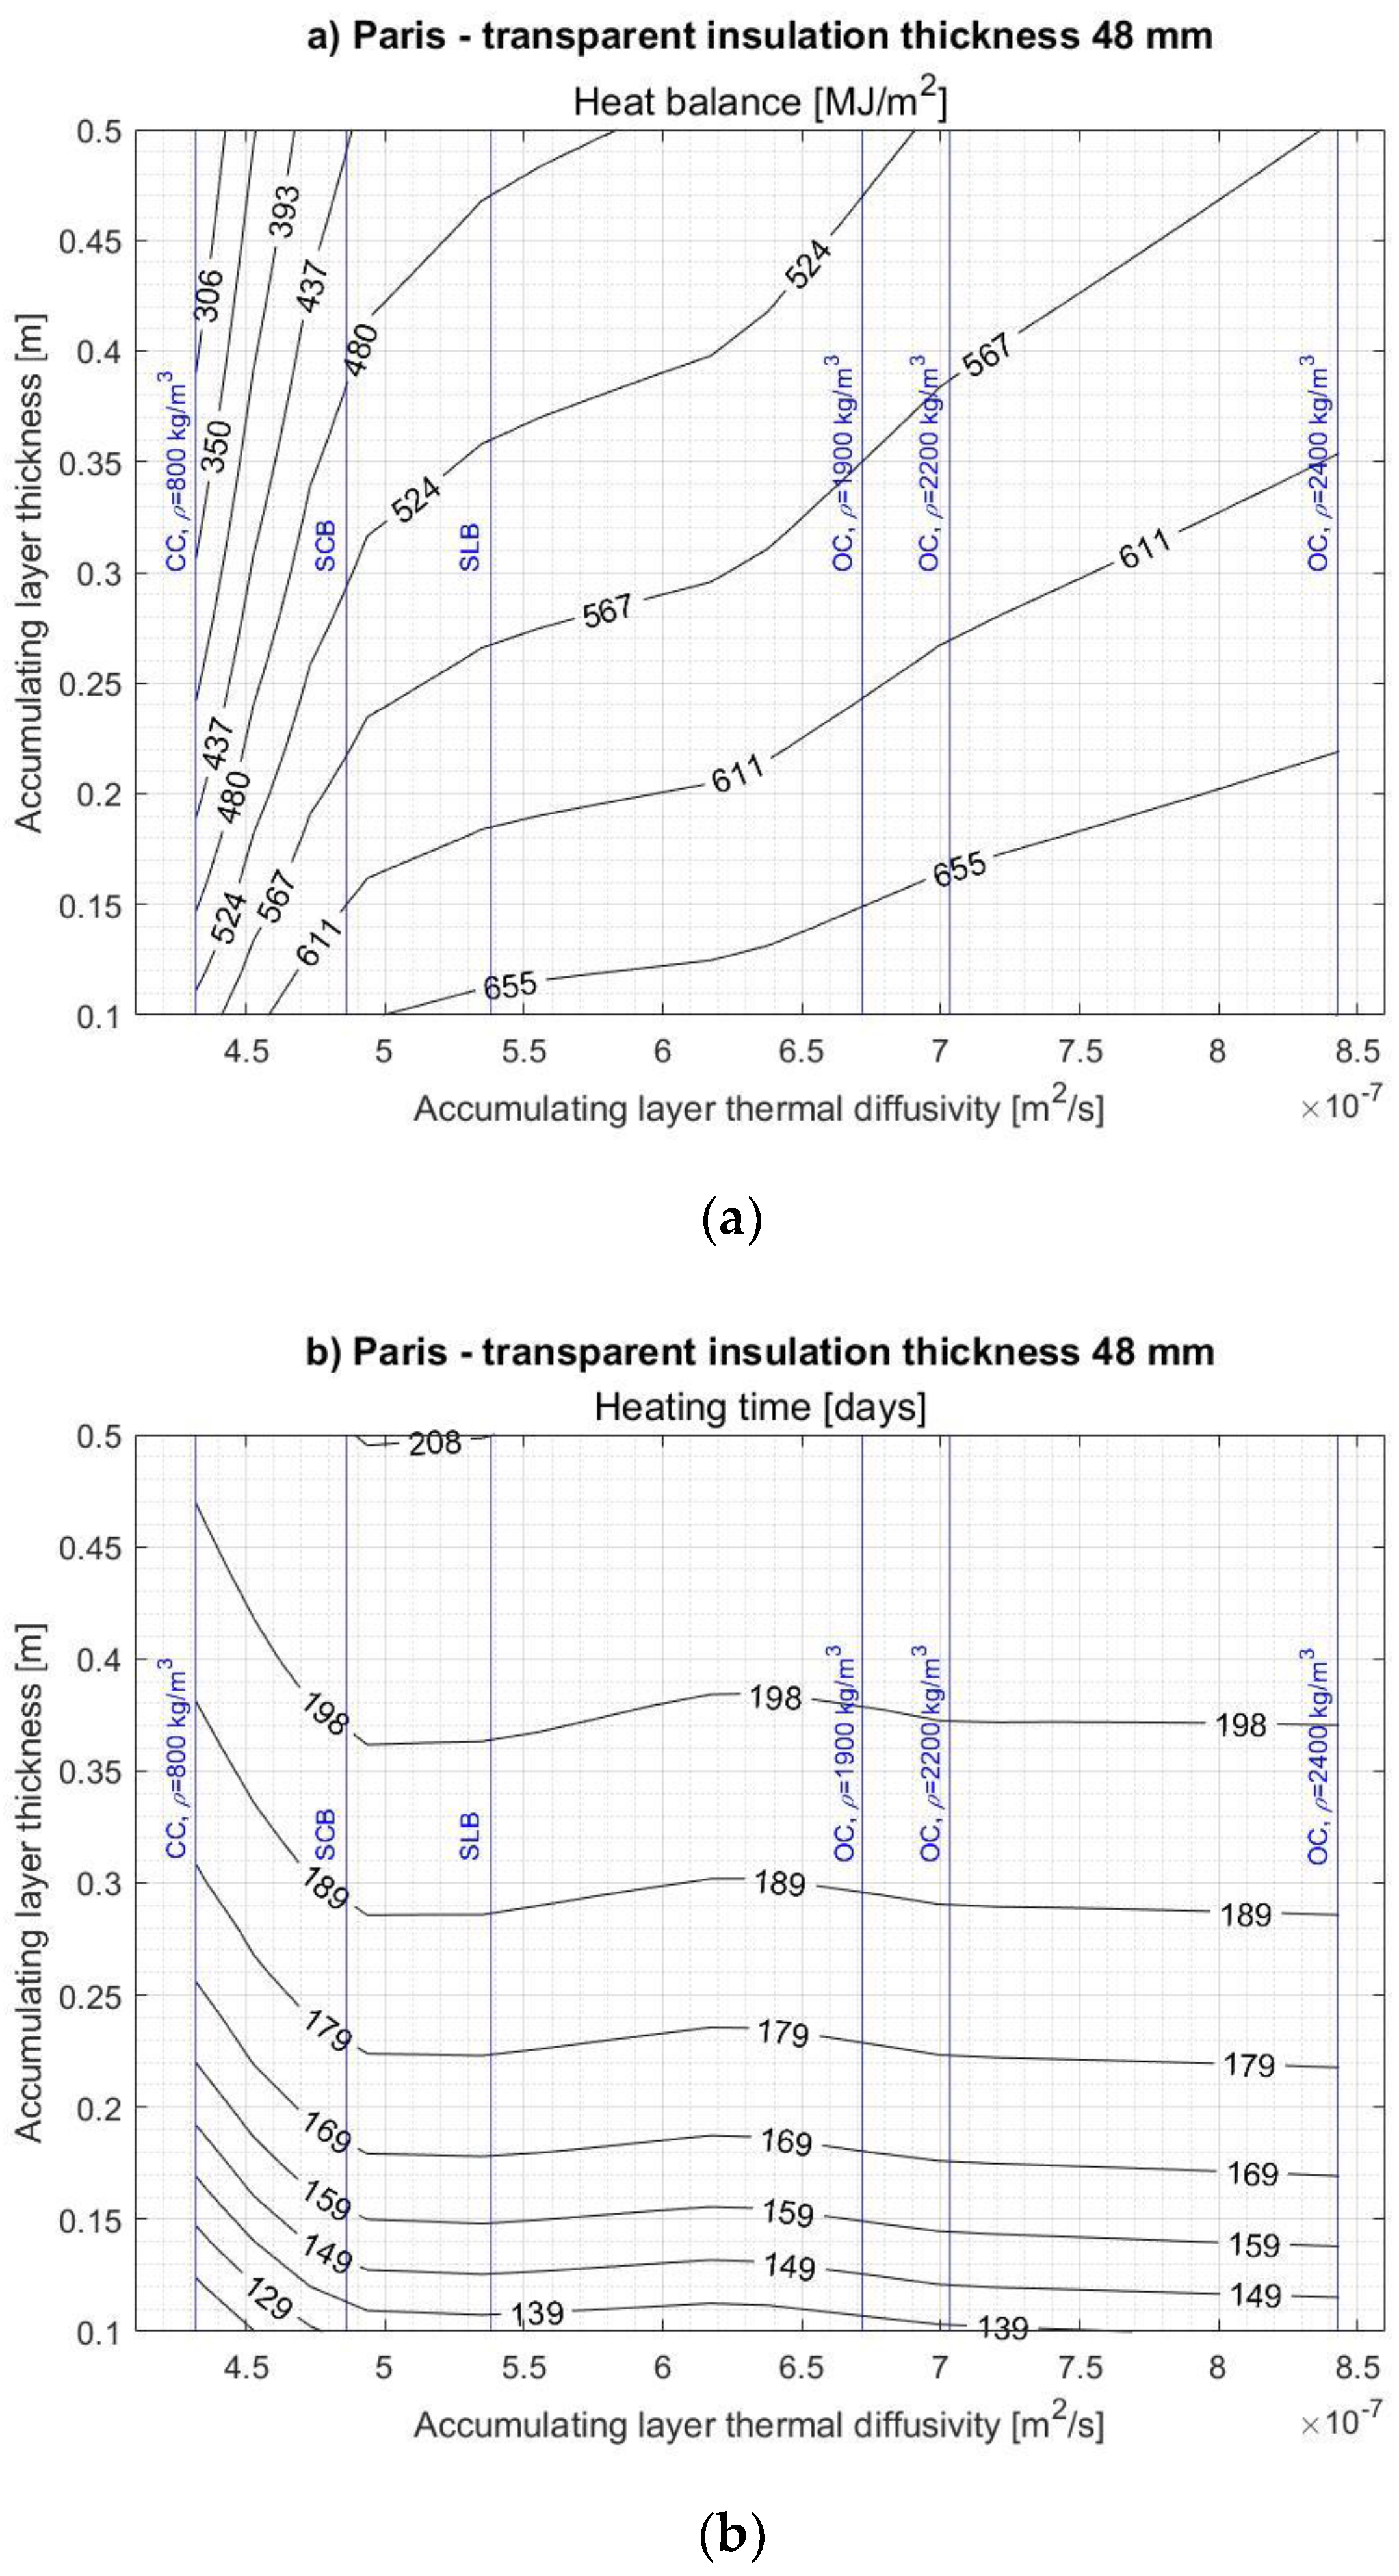
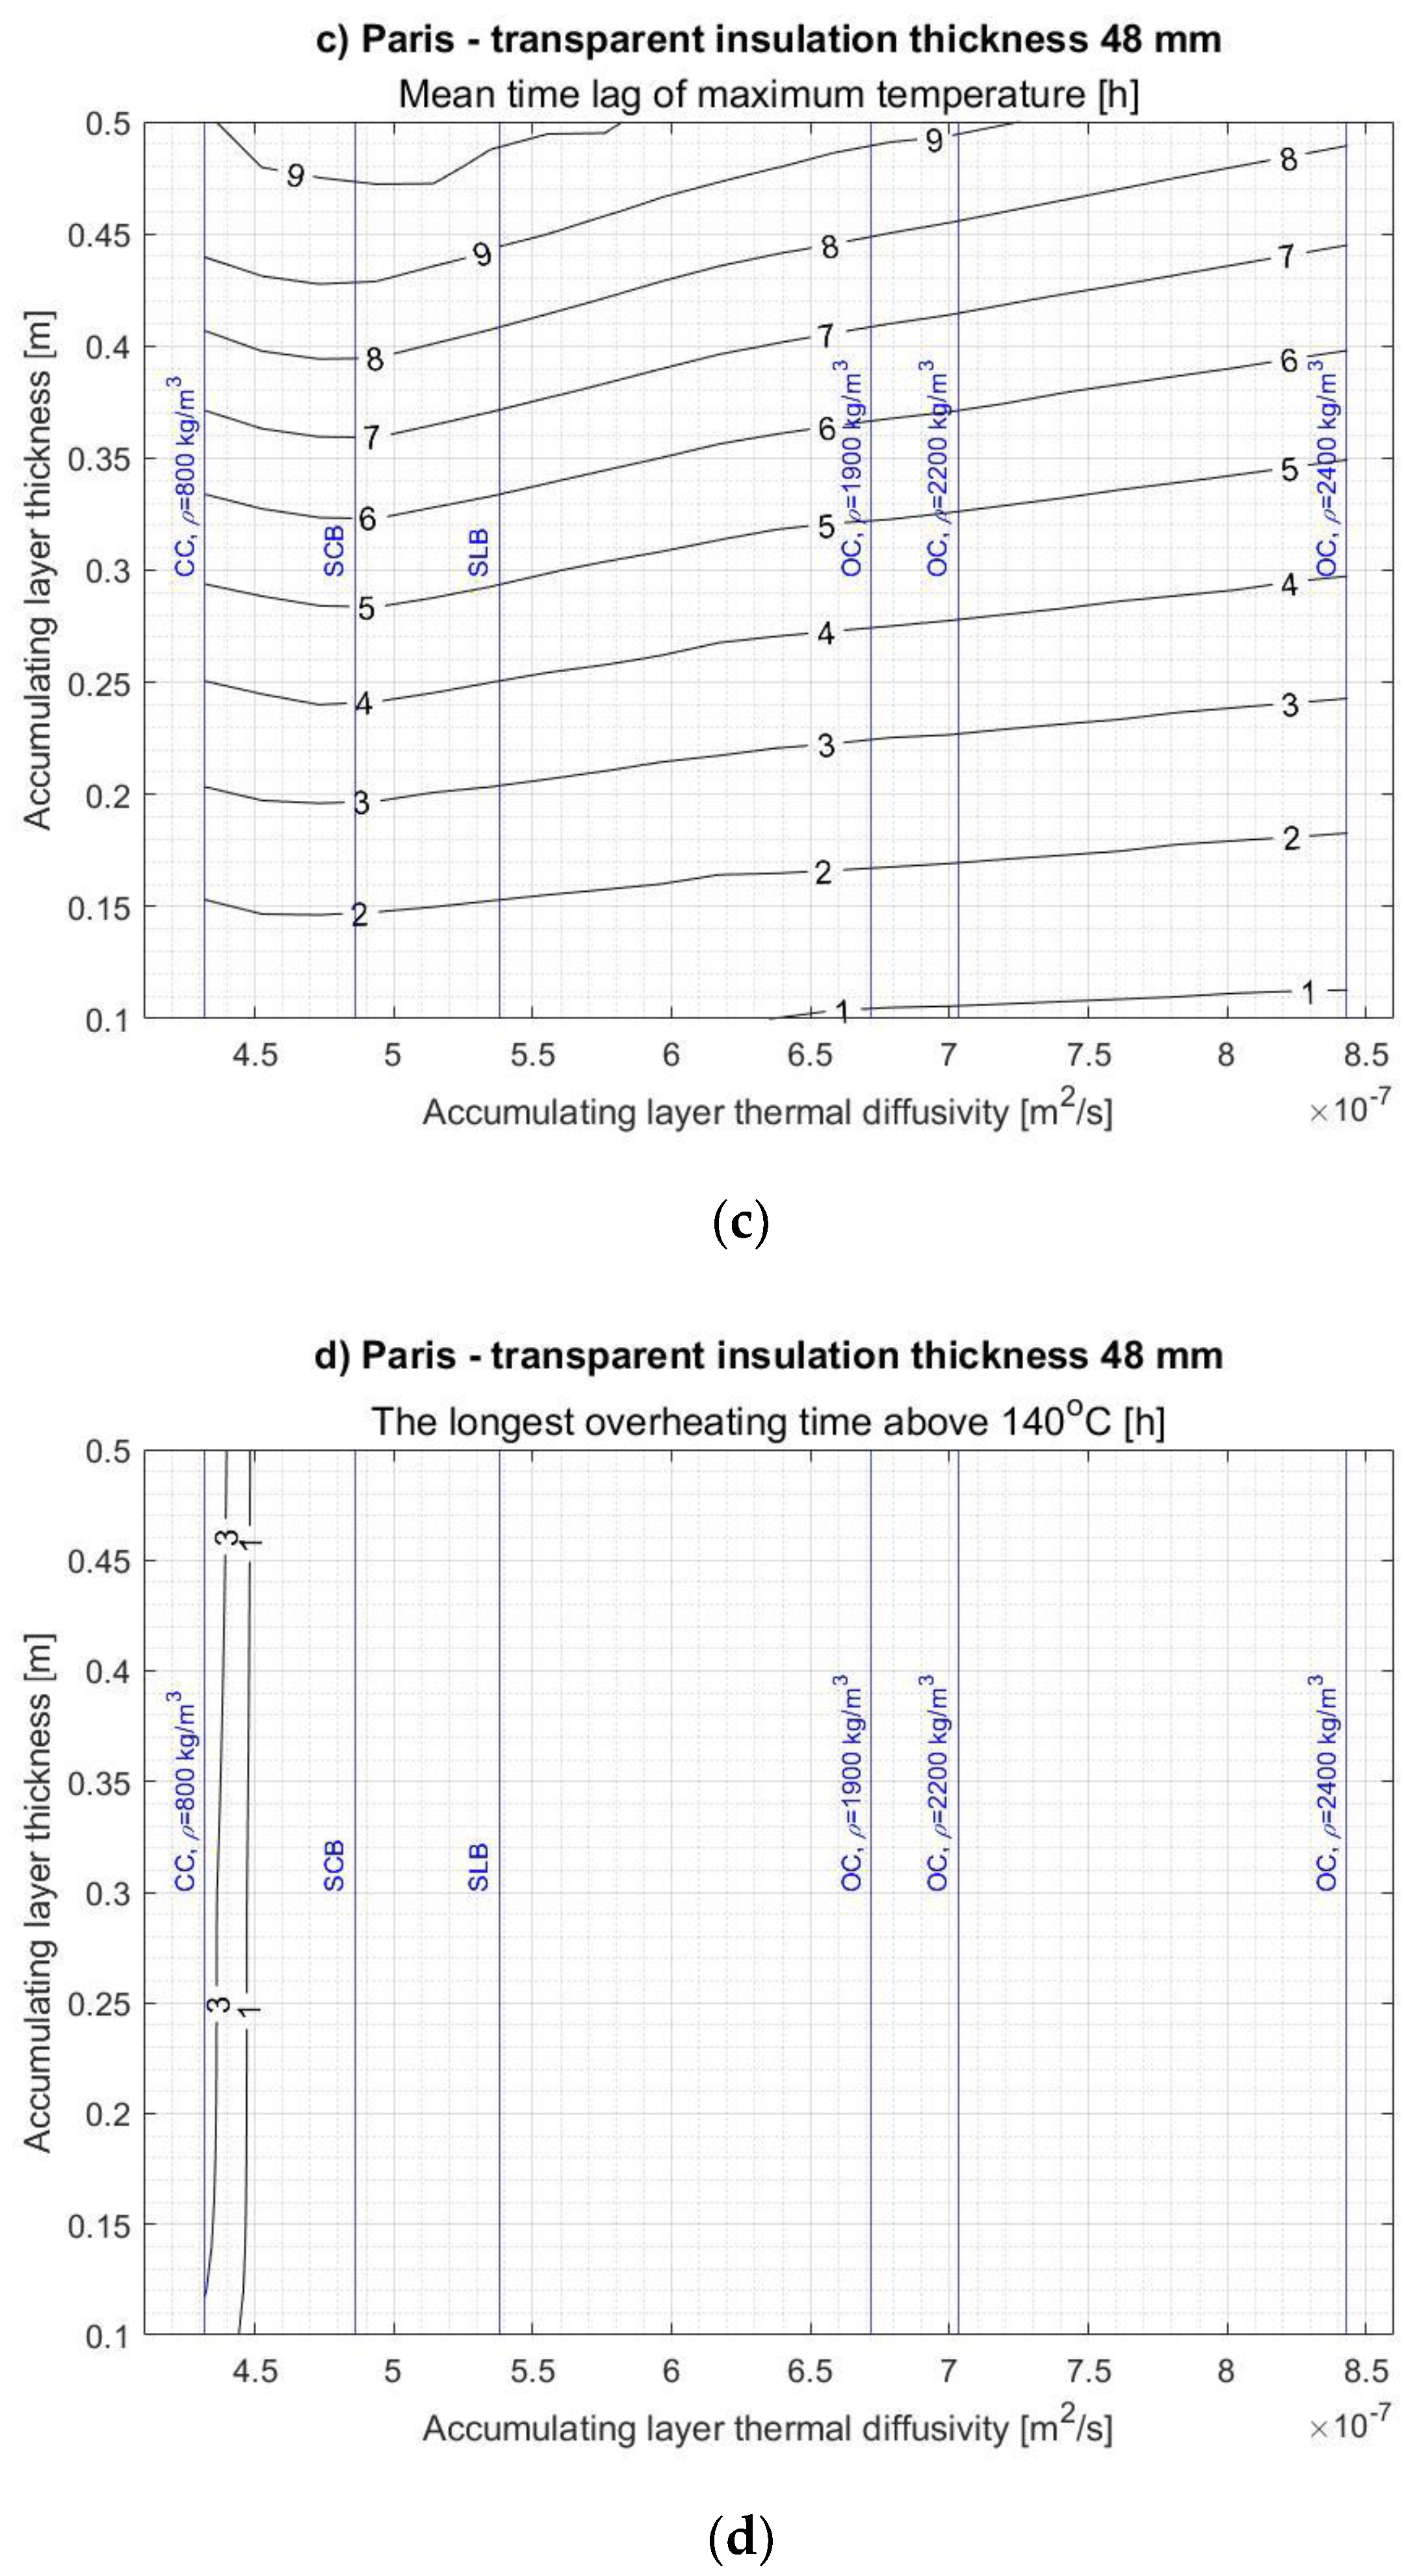
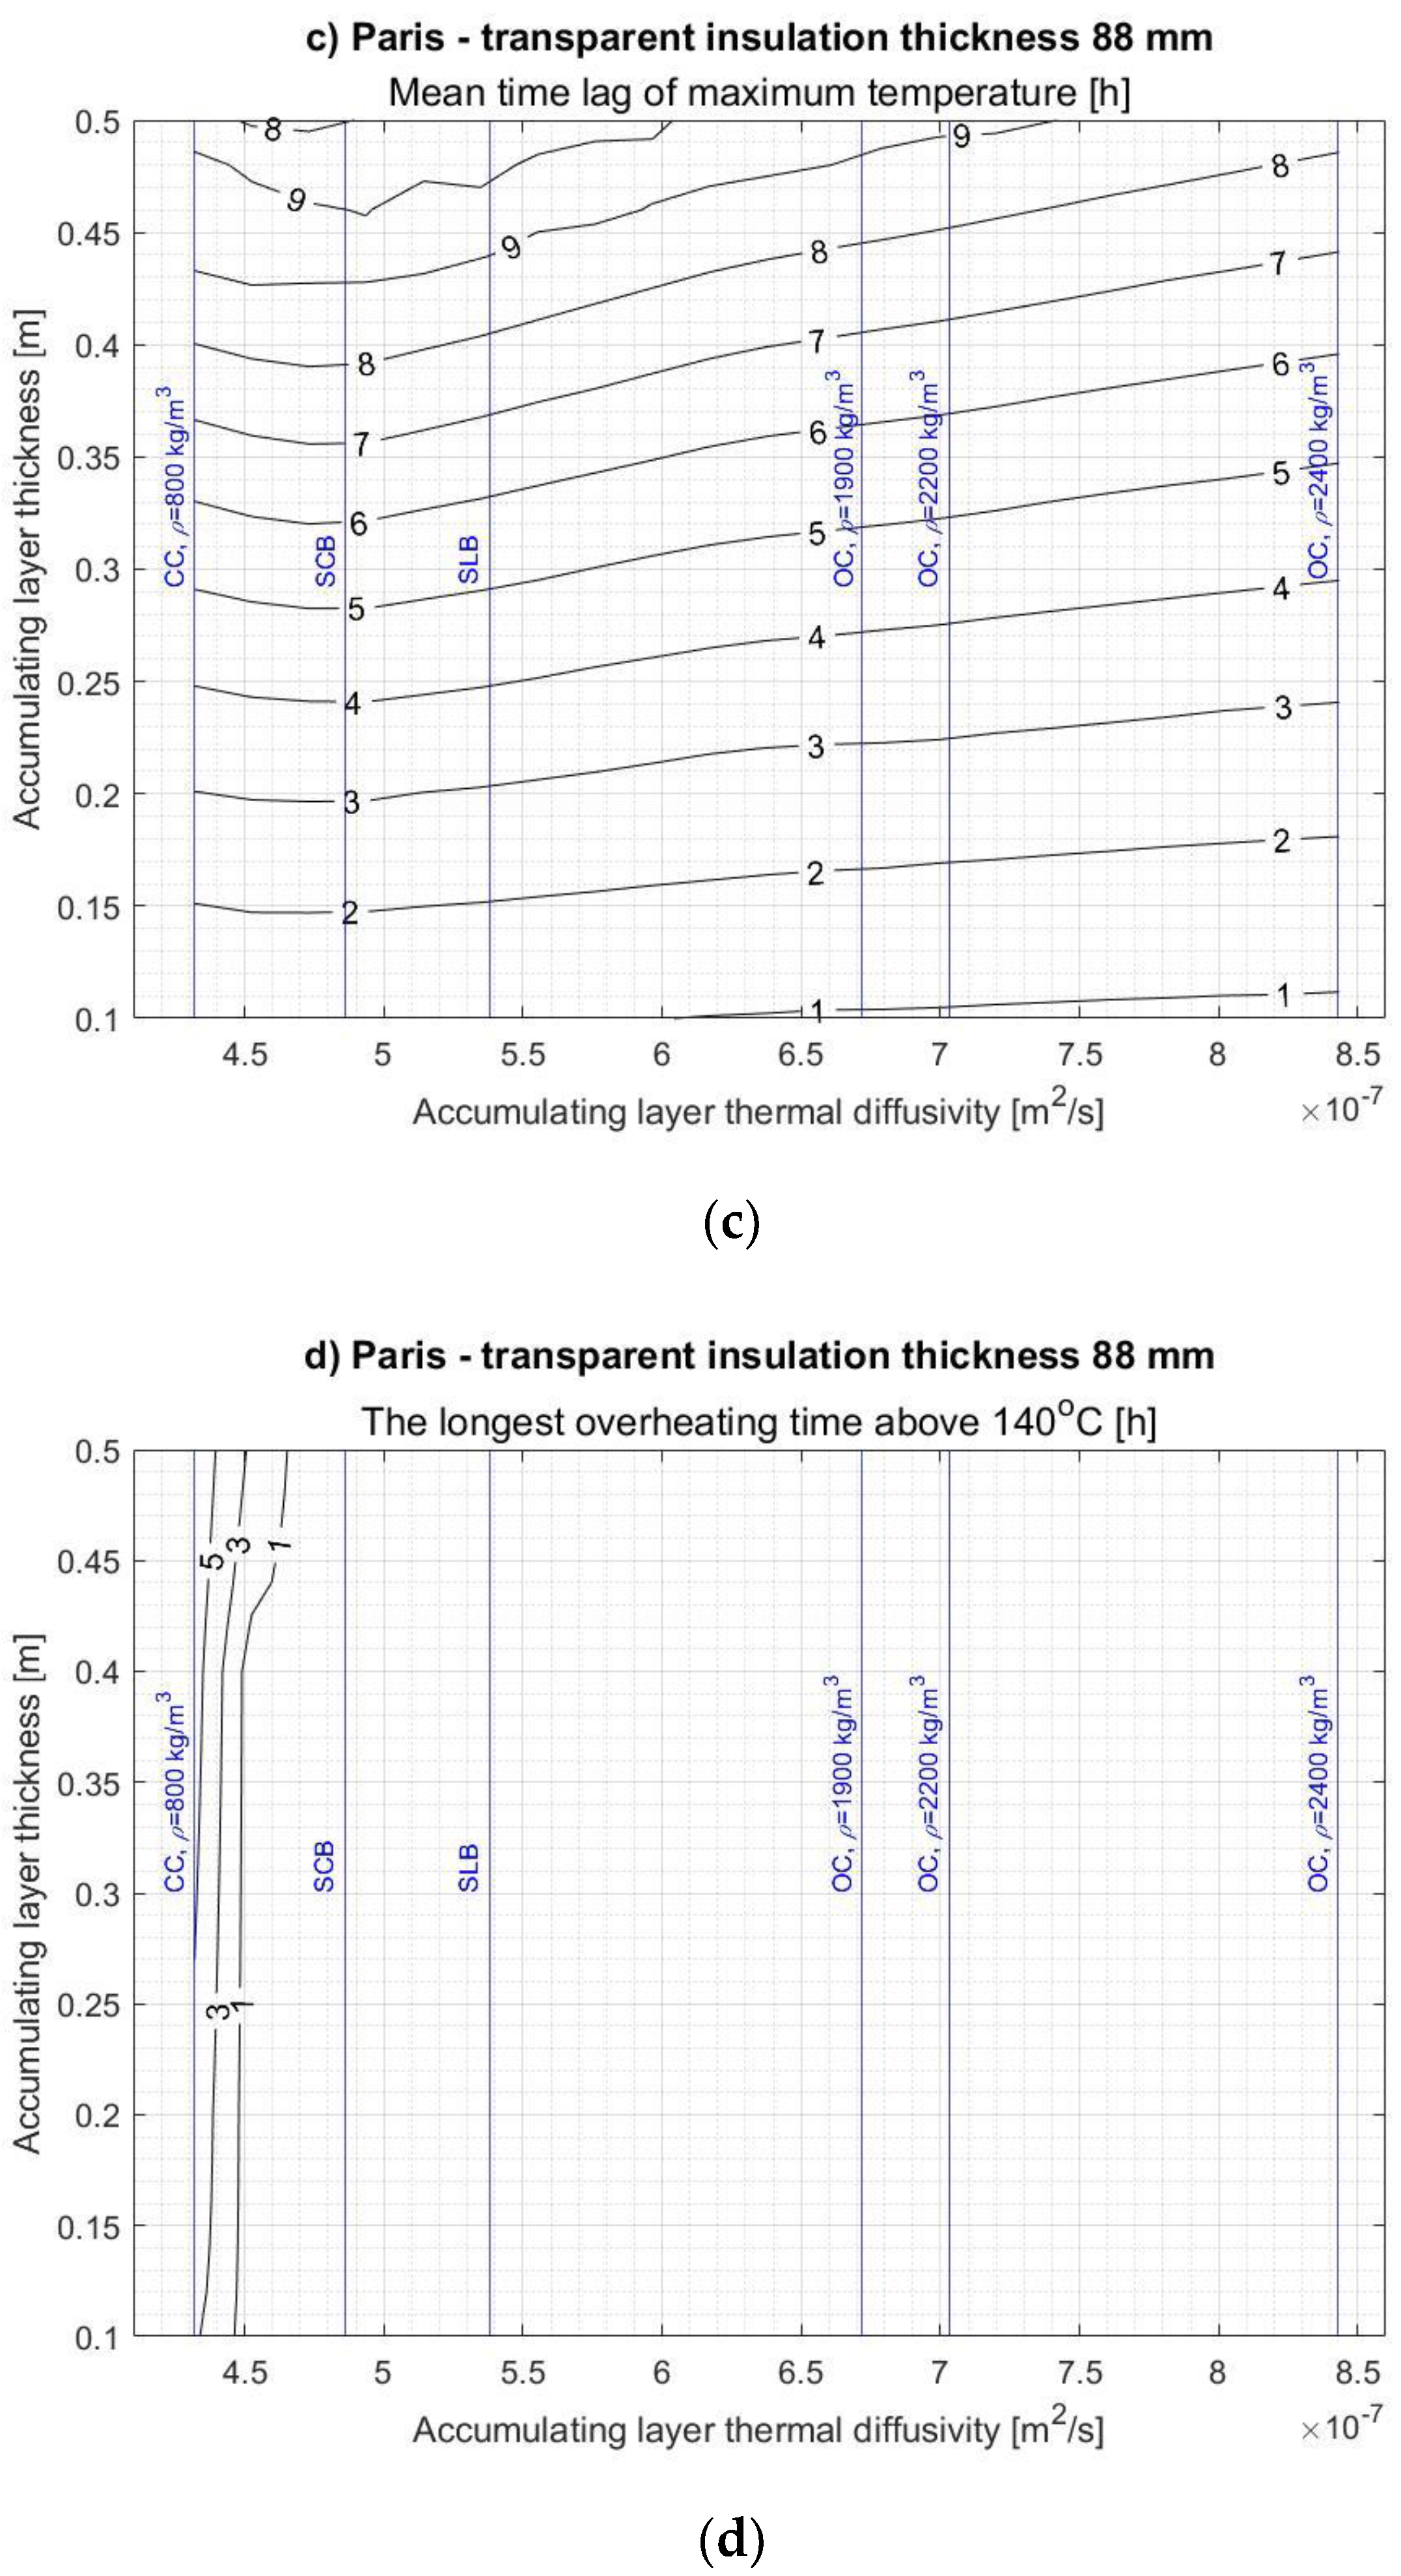
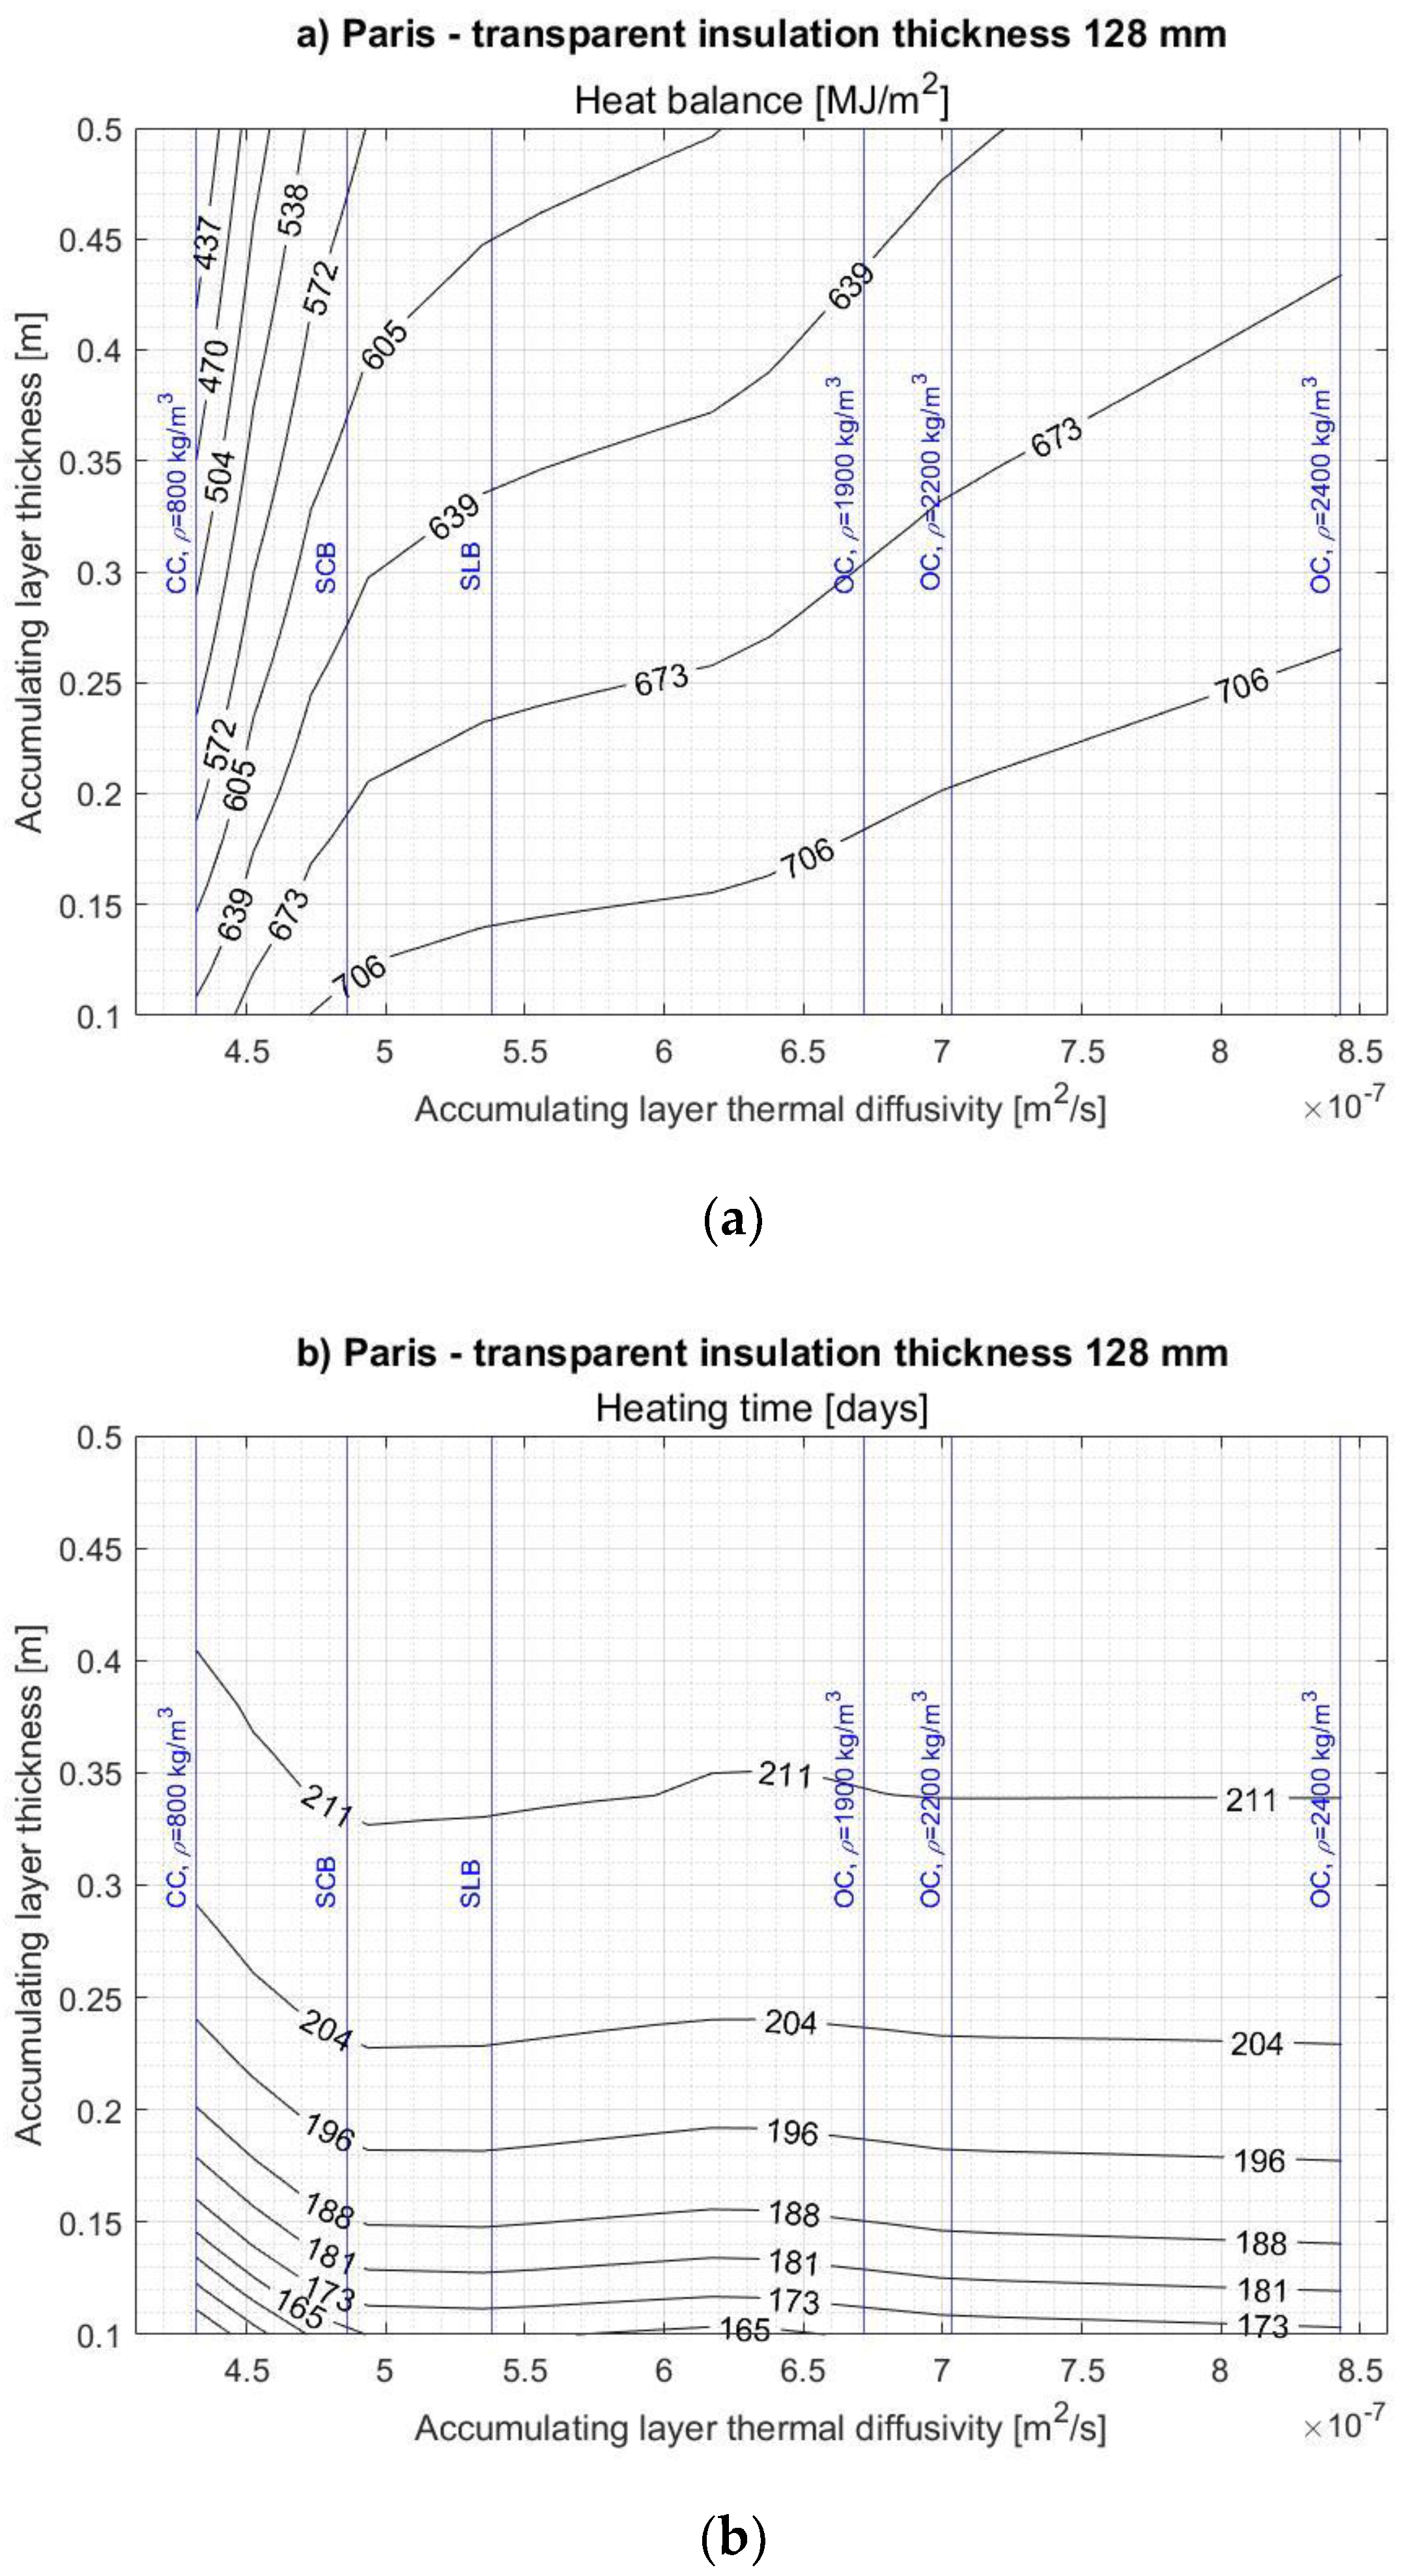
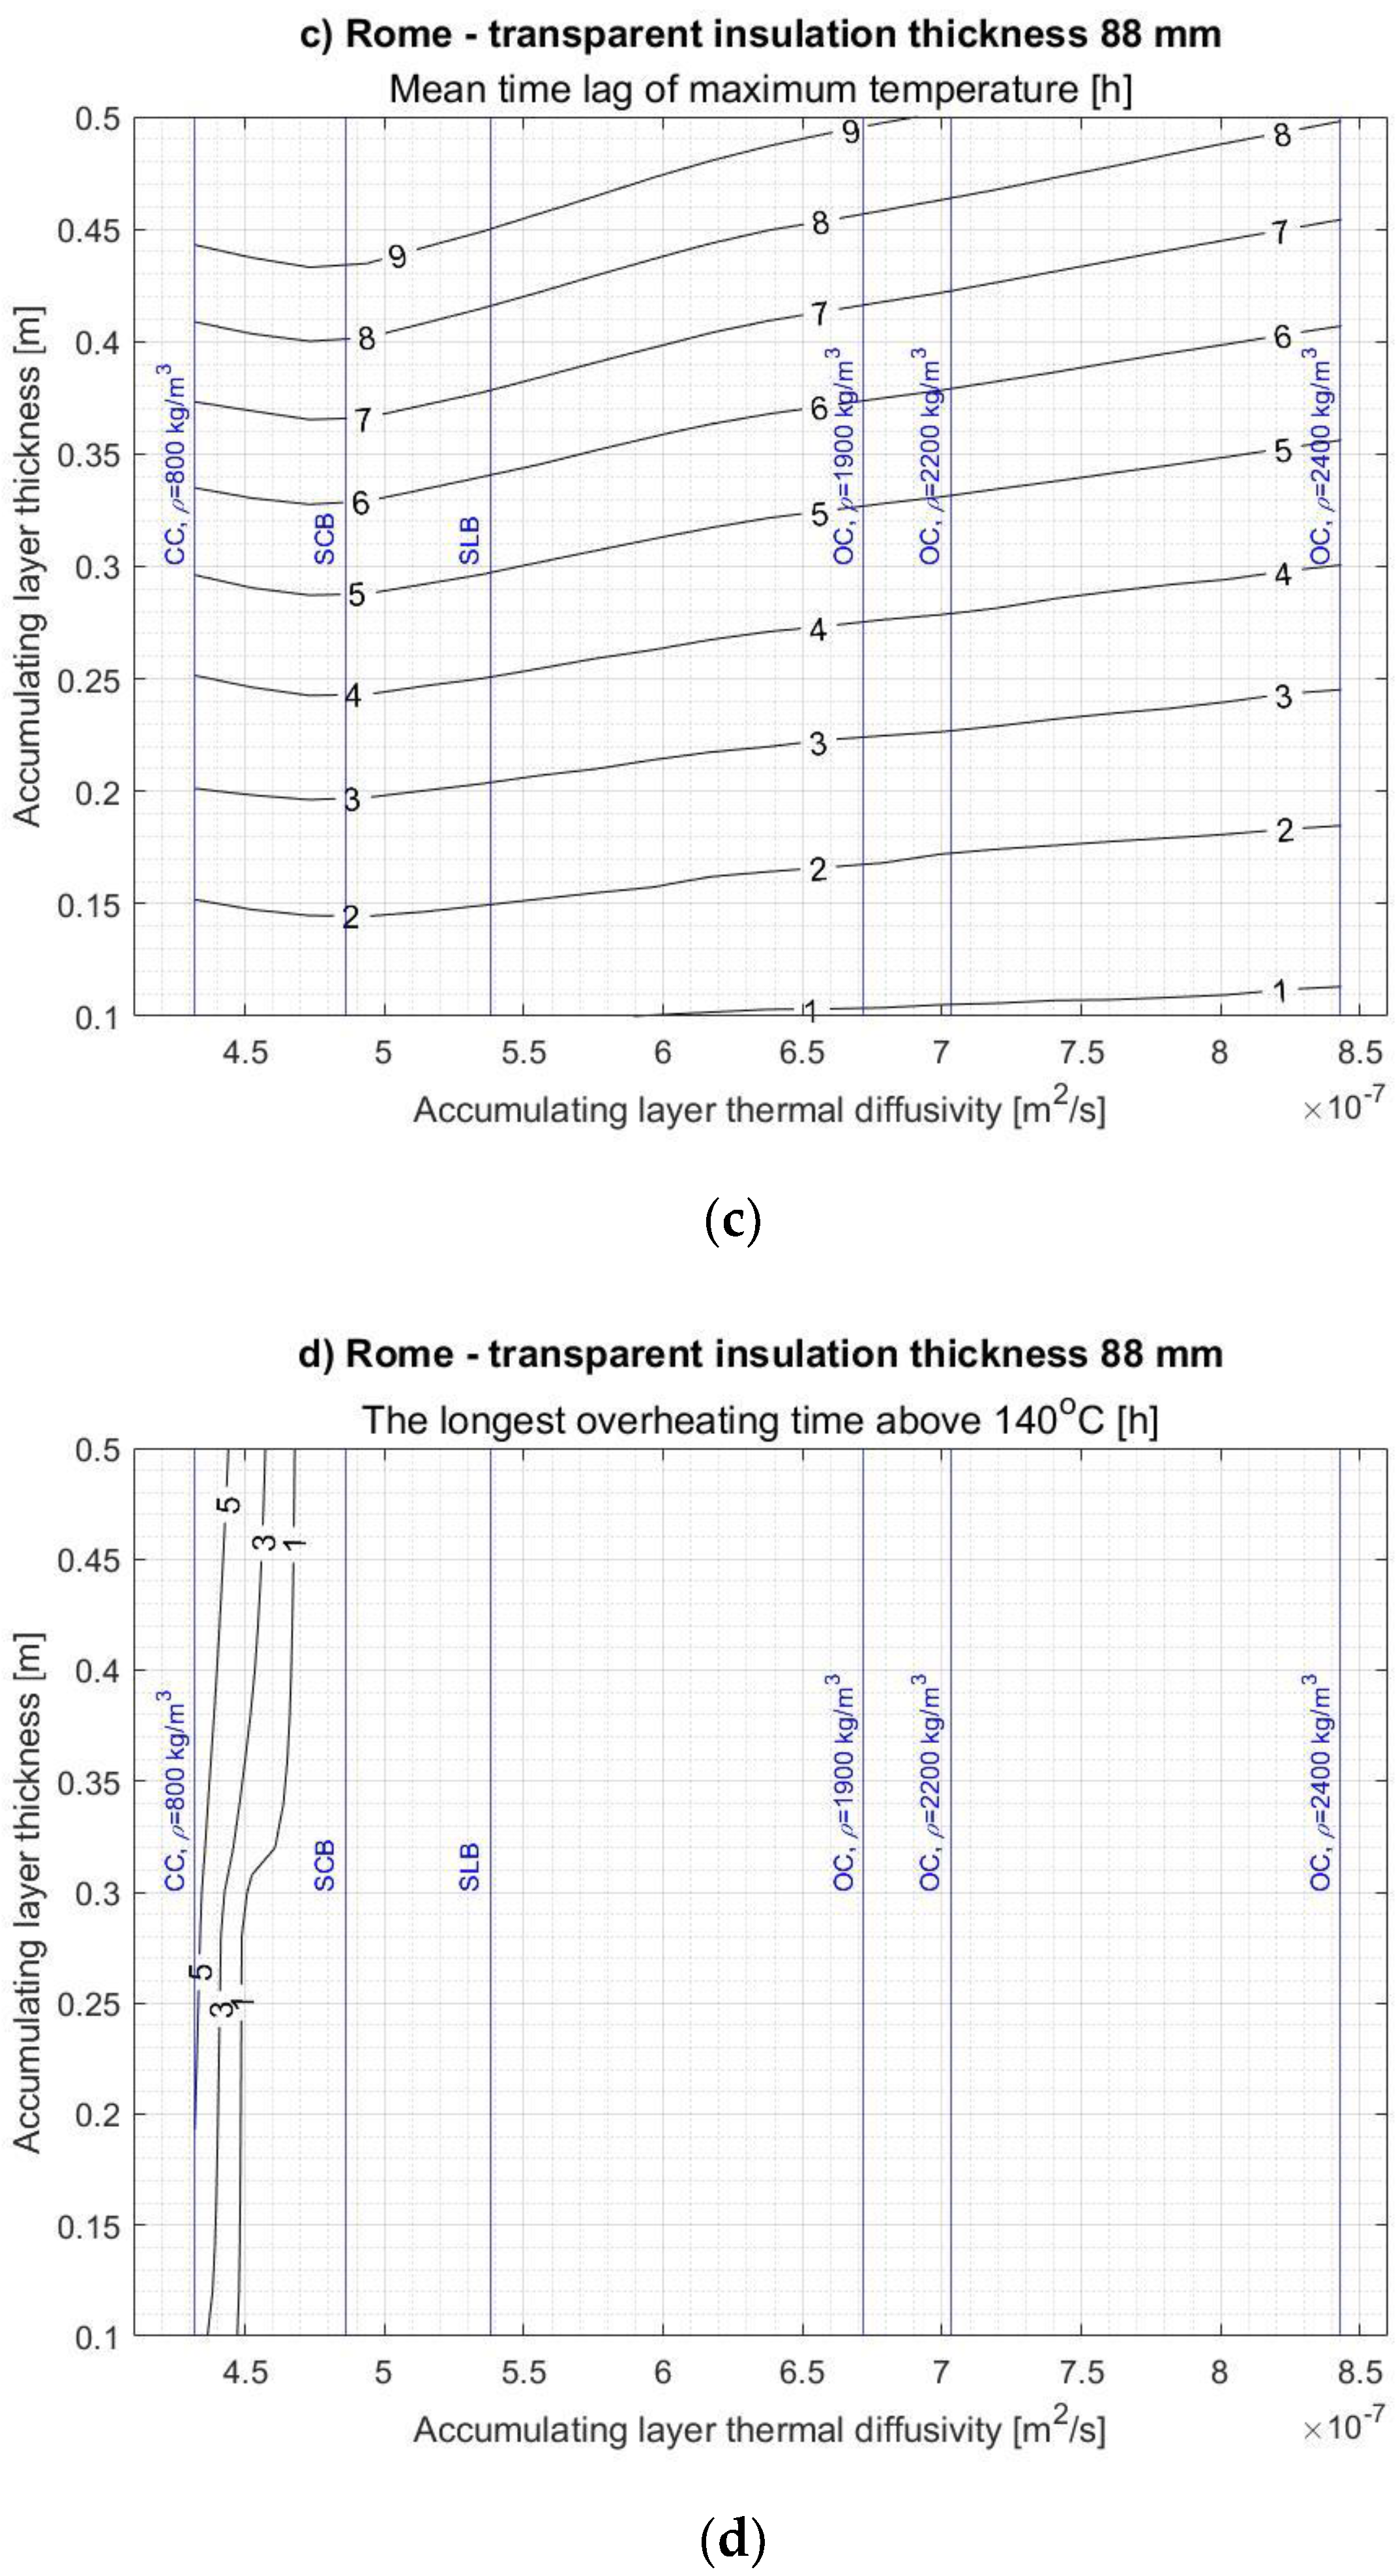
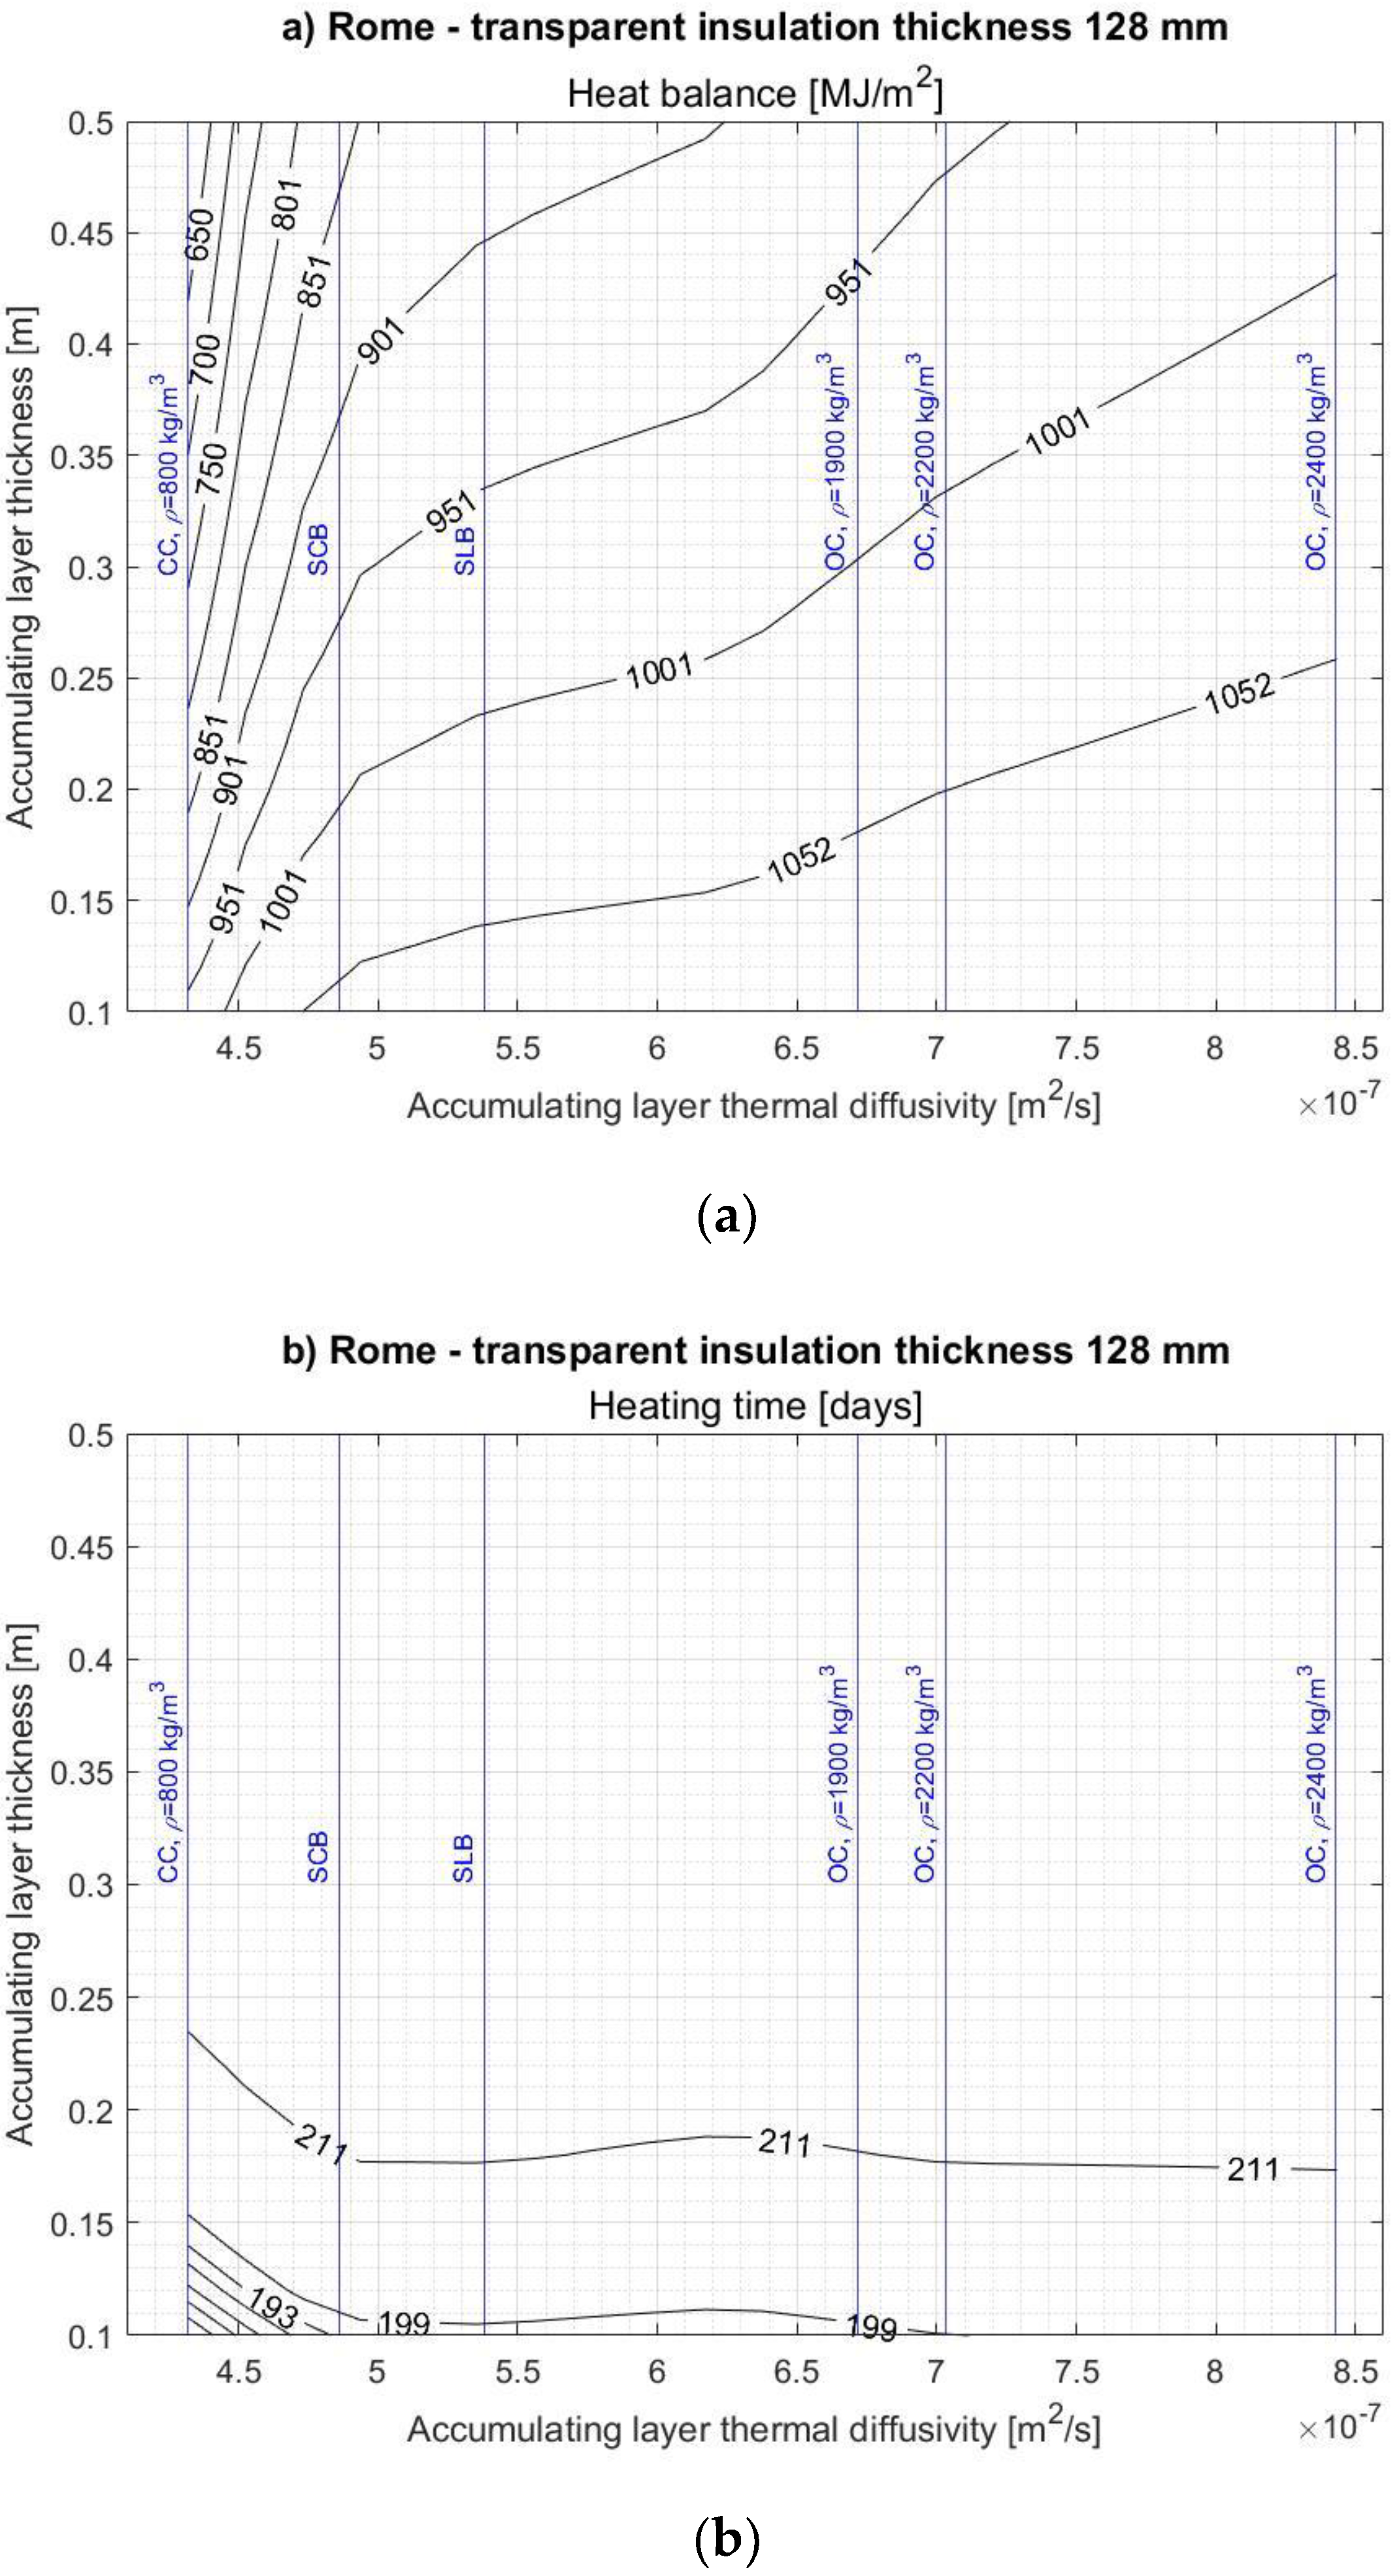
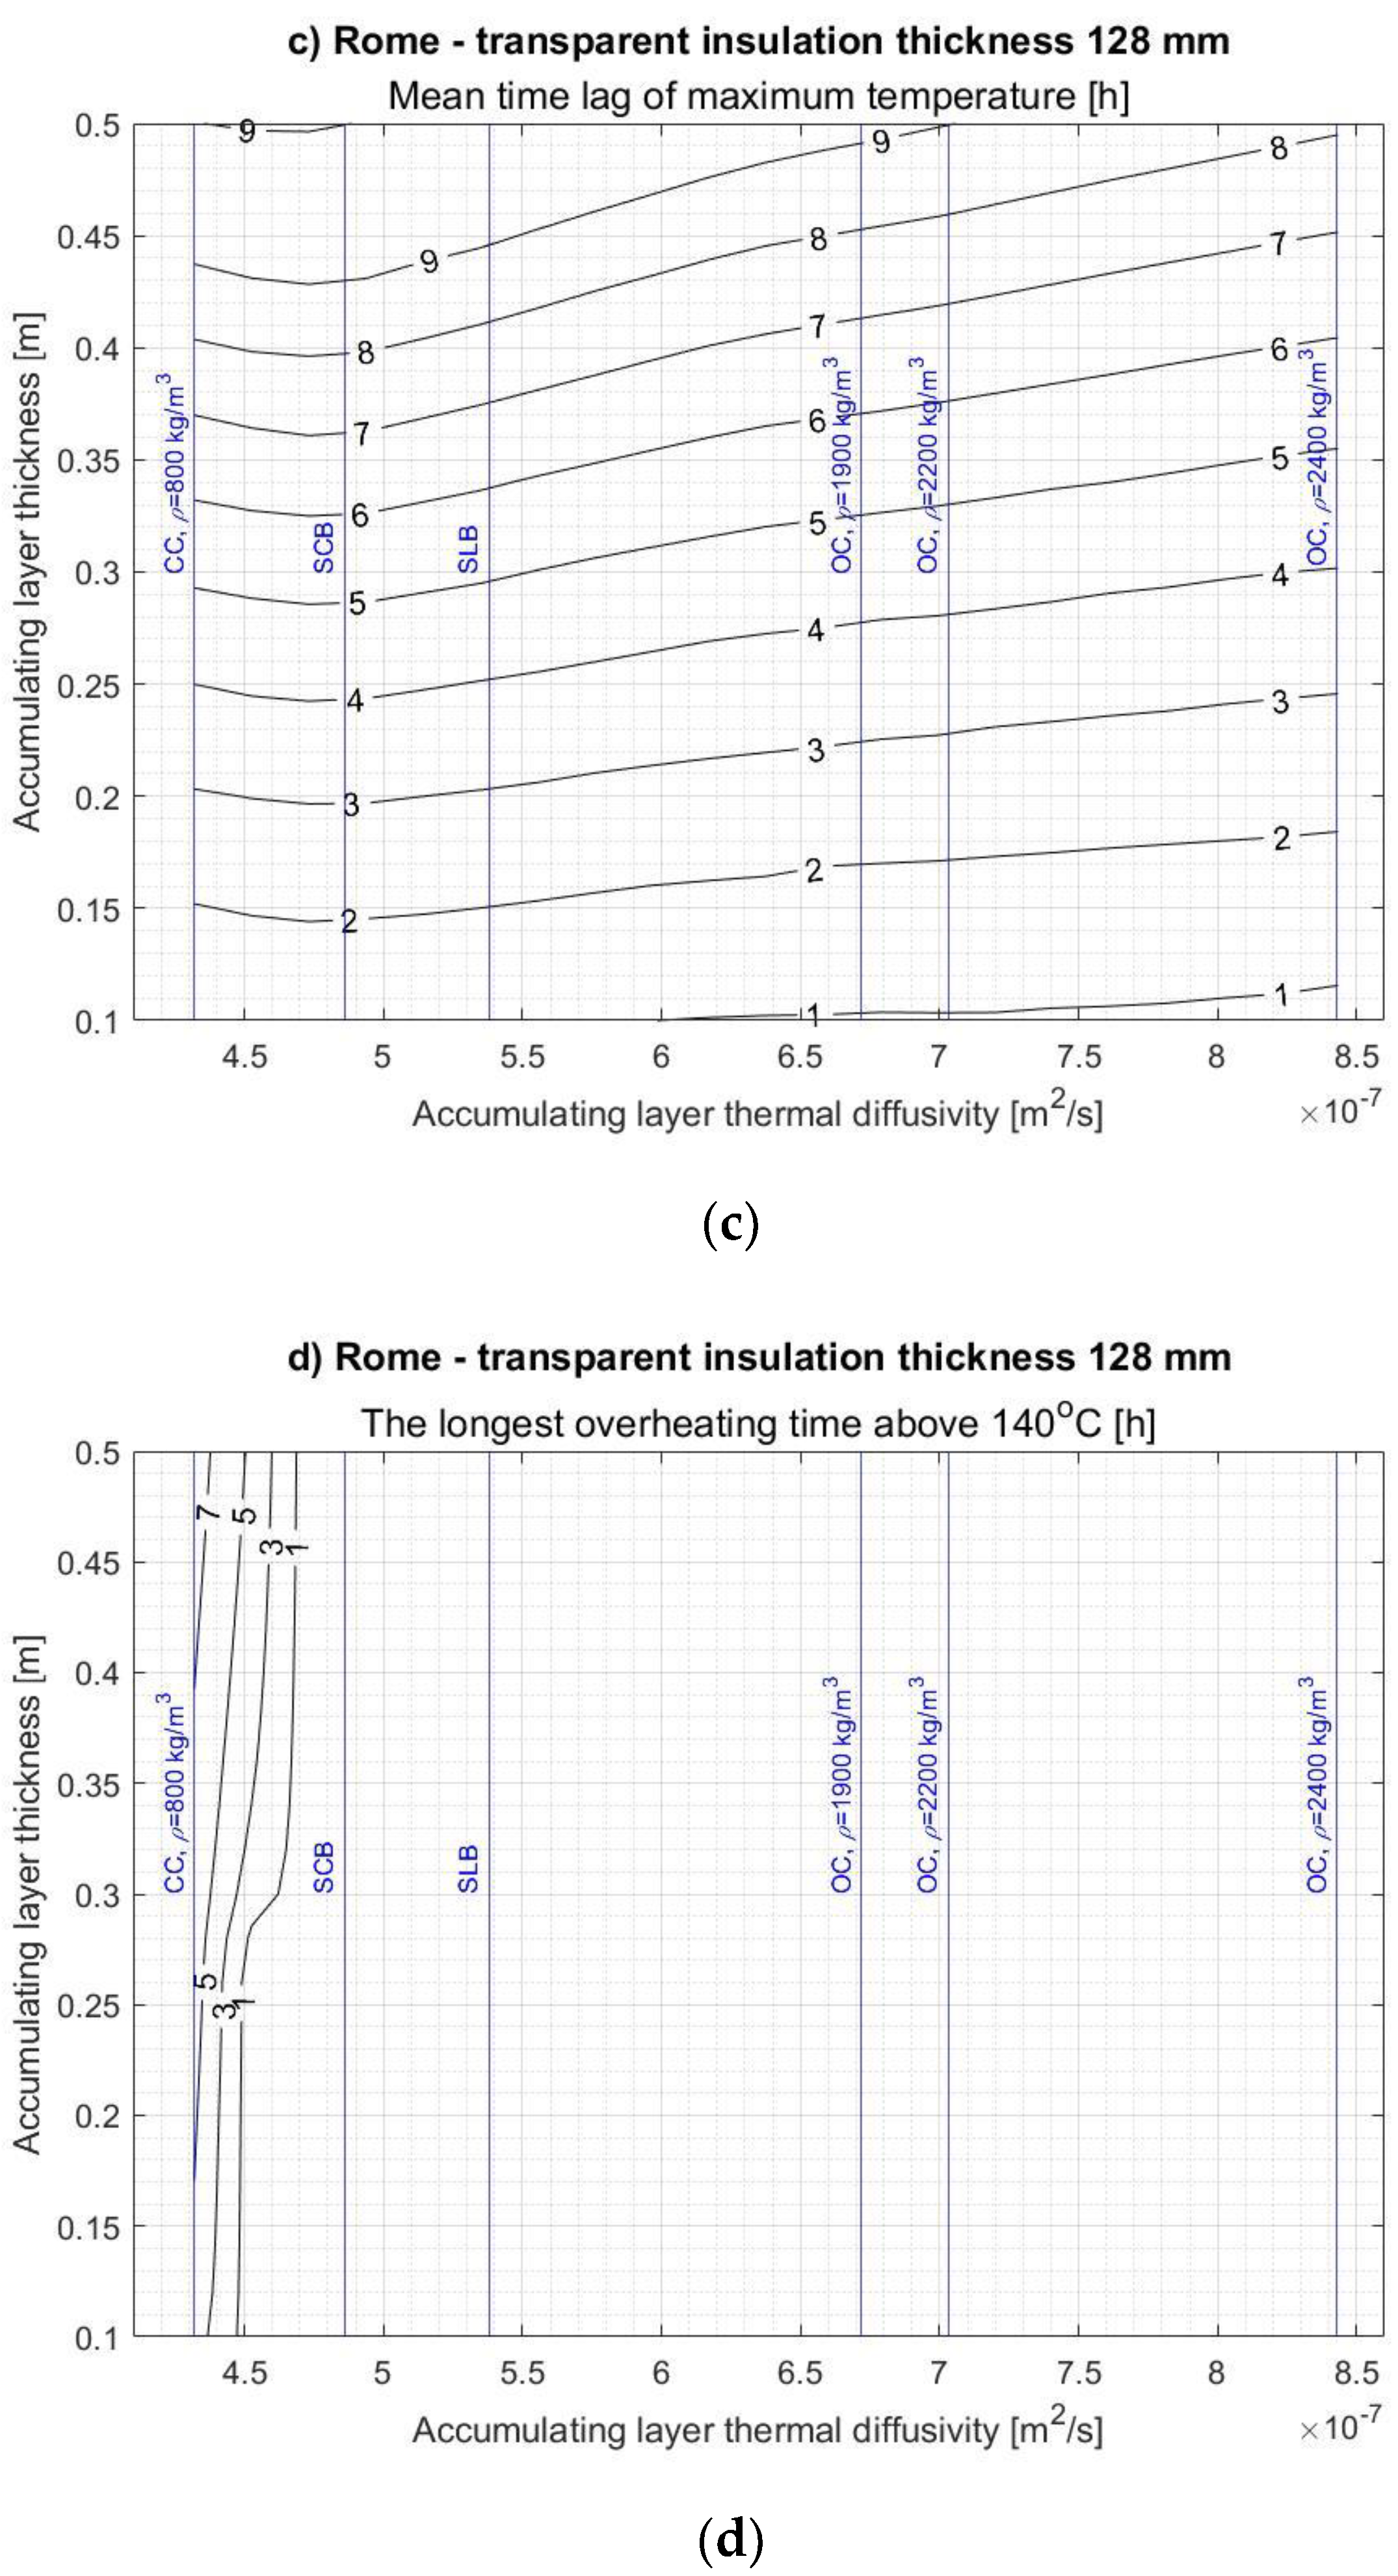
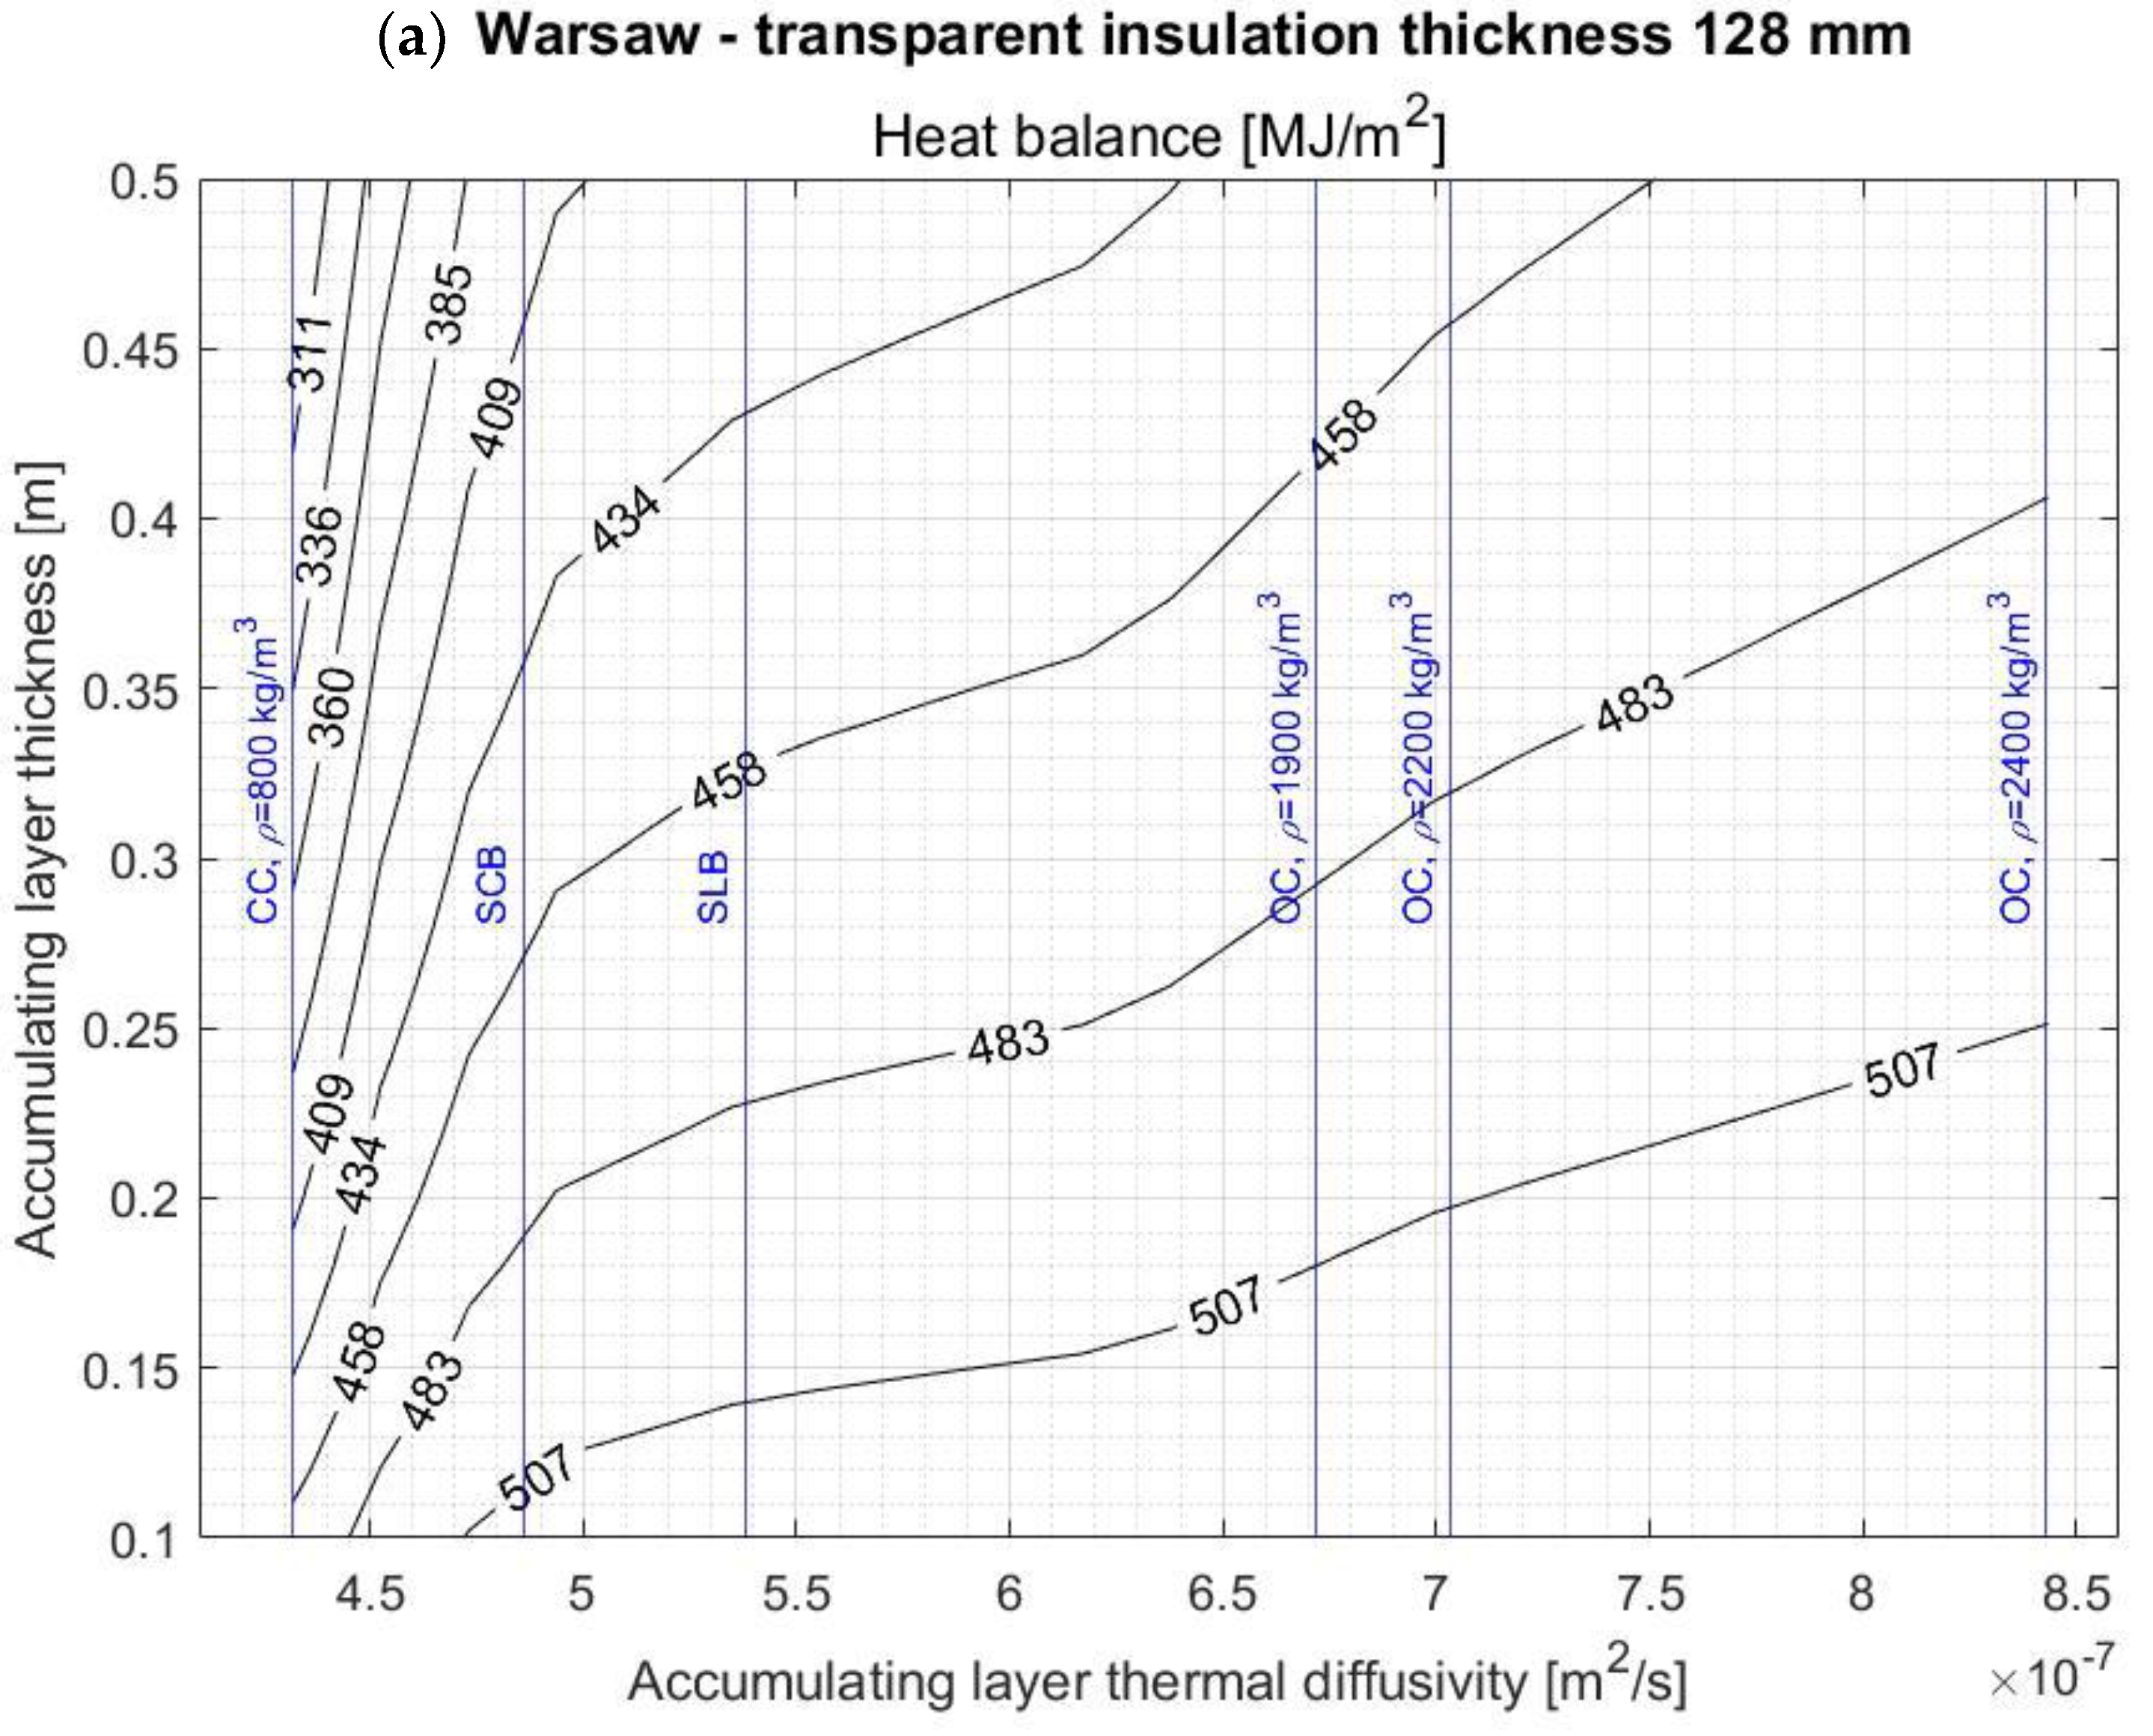
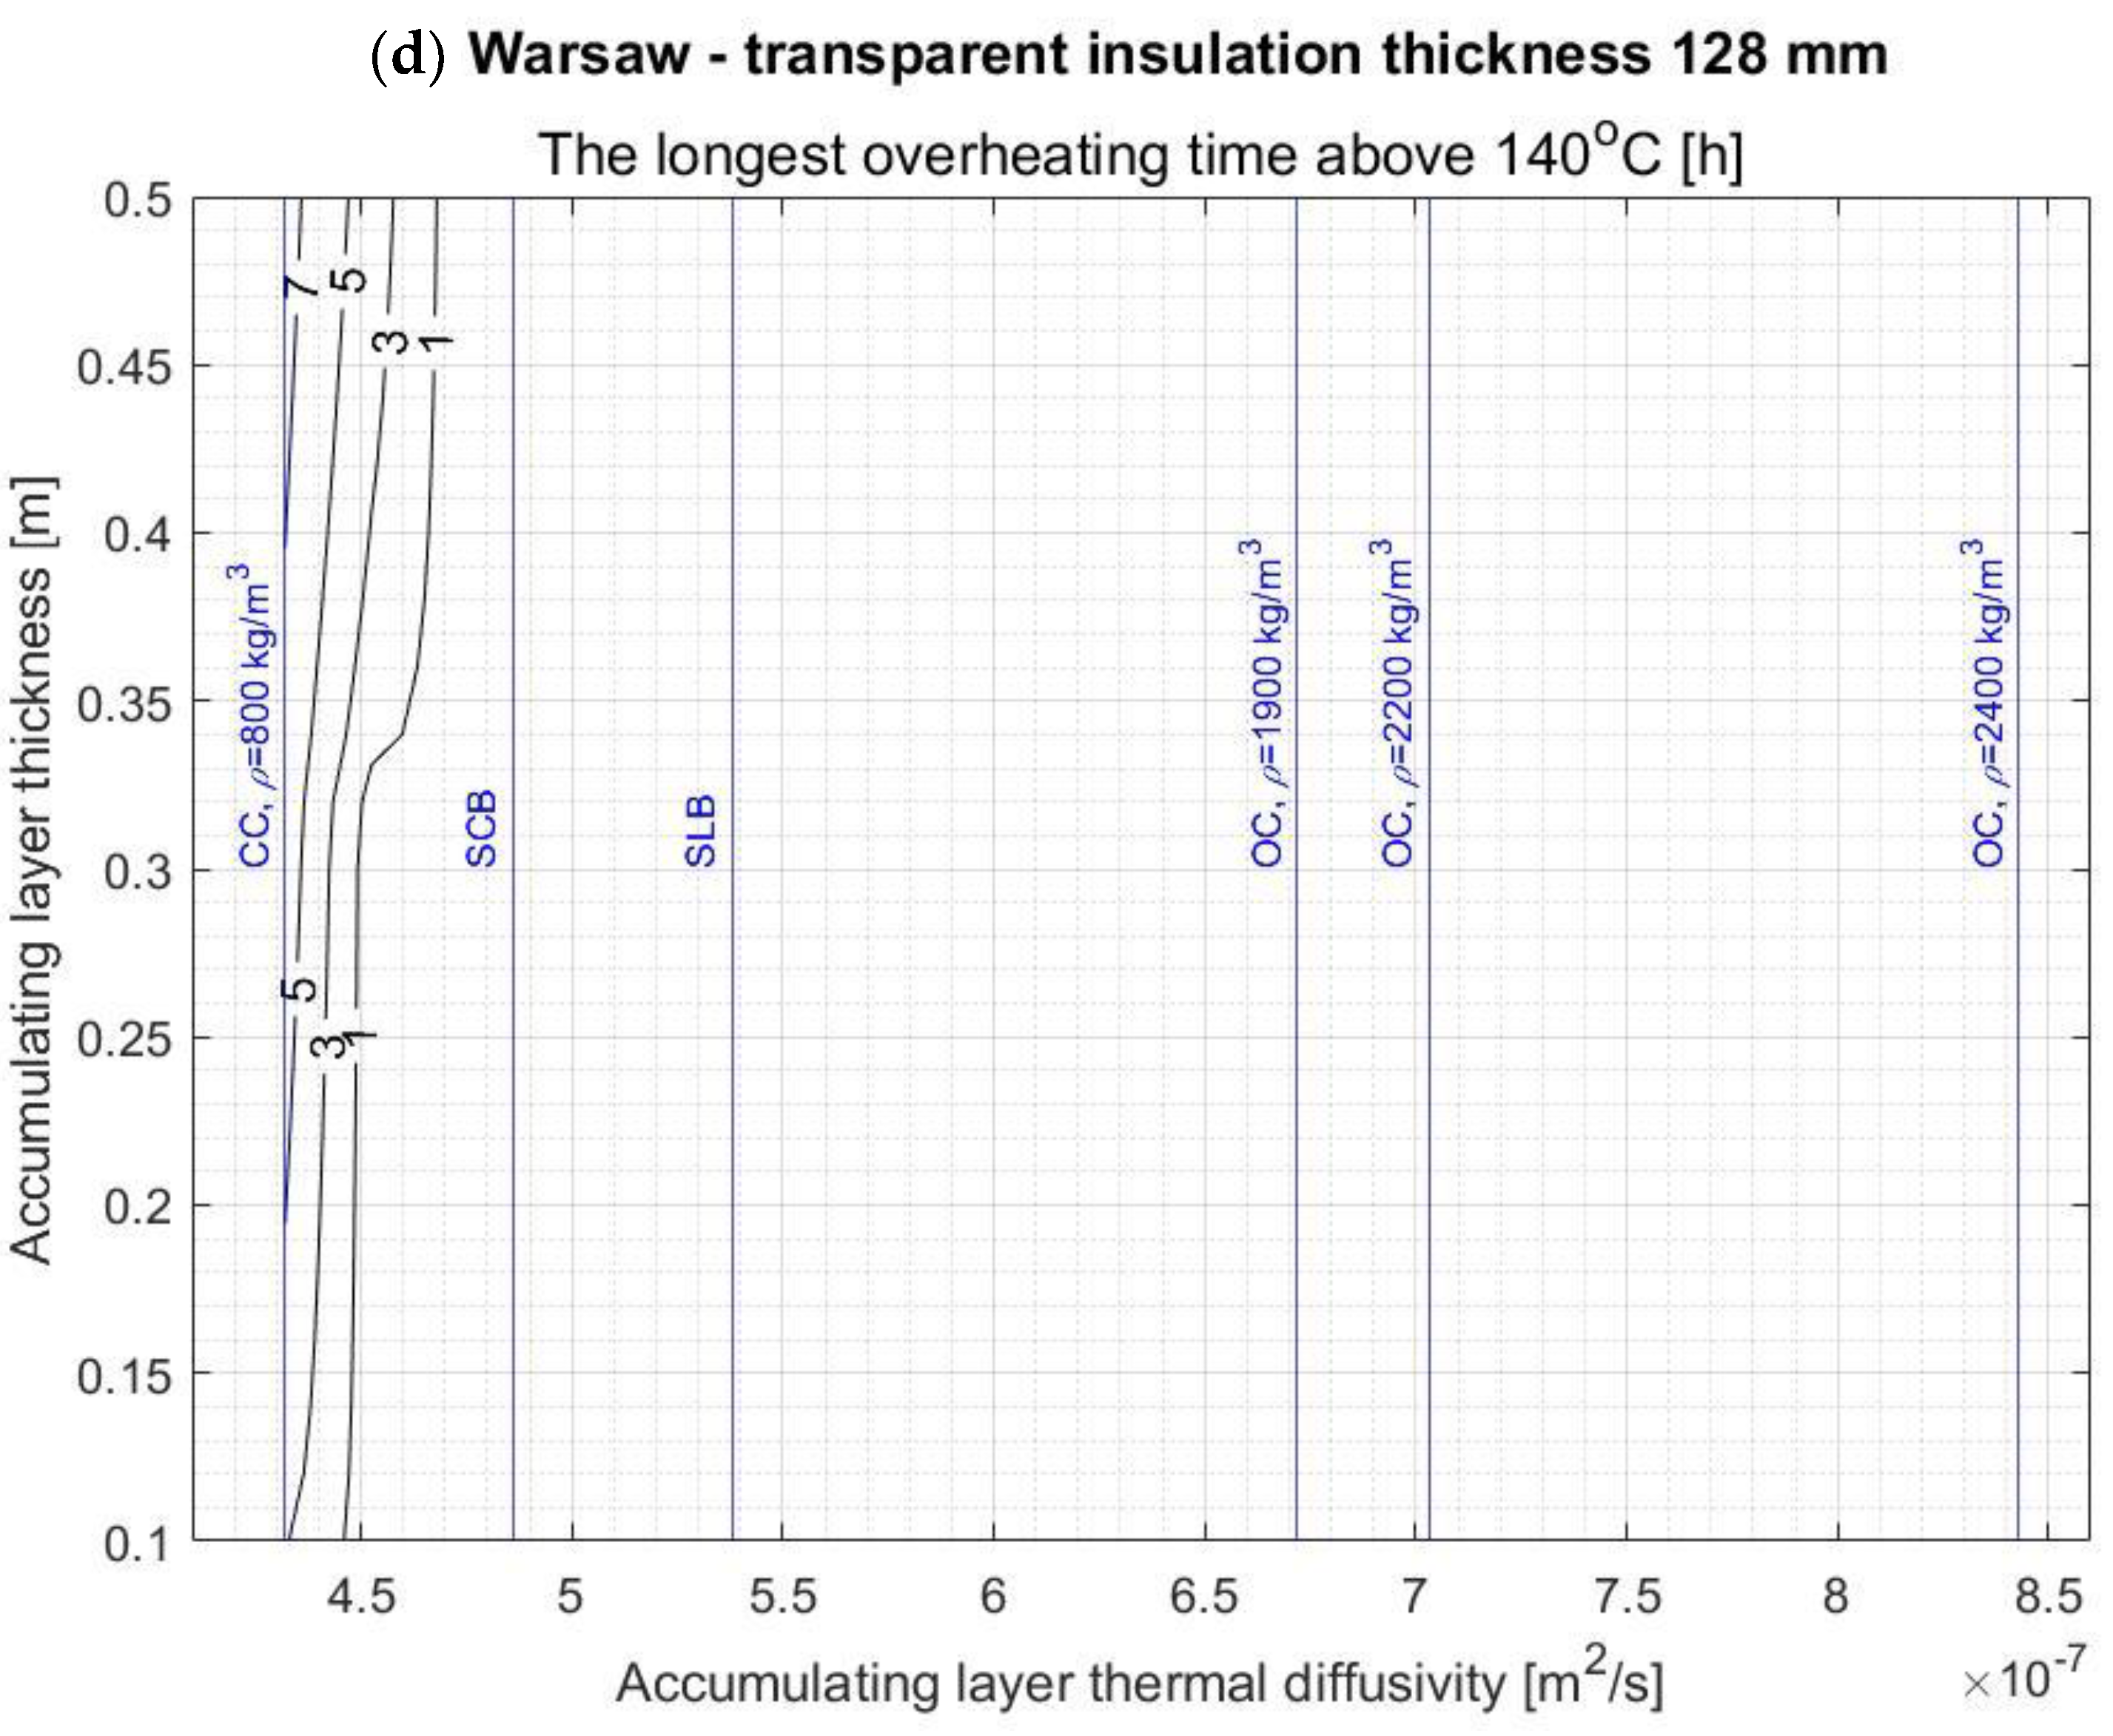
The obtained results allowed the authors of the work to make contour graphs showing the dependence of the seasonal heat balance of the SW on the AL thickness and its thermal diffusivity for each considered TI thickness and SW’s location. Analogous contour graphs were made for the heating time, the longest overheating time above 140 °C in the TI, and the time of the maximum temperature time lag. Examples of such diagrams concerning the SW with 128 mm thick TI and located in Warsaw are shown in
Figure 7. In addition, the graphs show the vertical lines corresponding to the thermal diffusivity of typical construction materials with the aforementioned parameters. The diagrams, relating to the cases of TI with other thickness values and locations can be found in
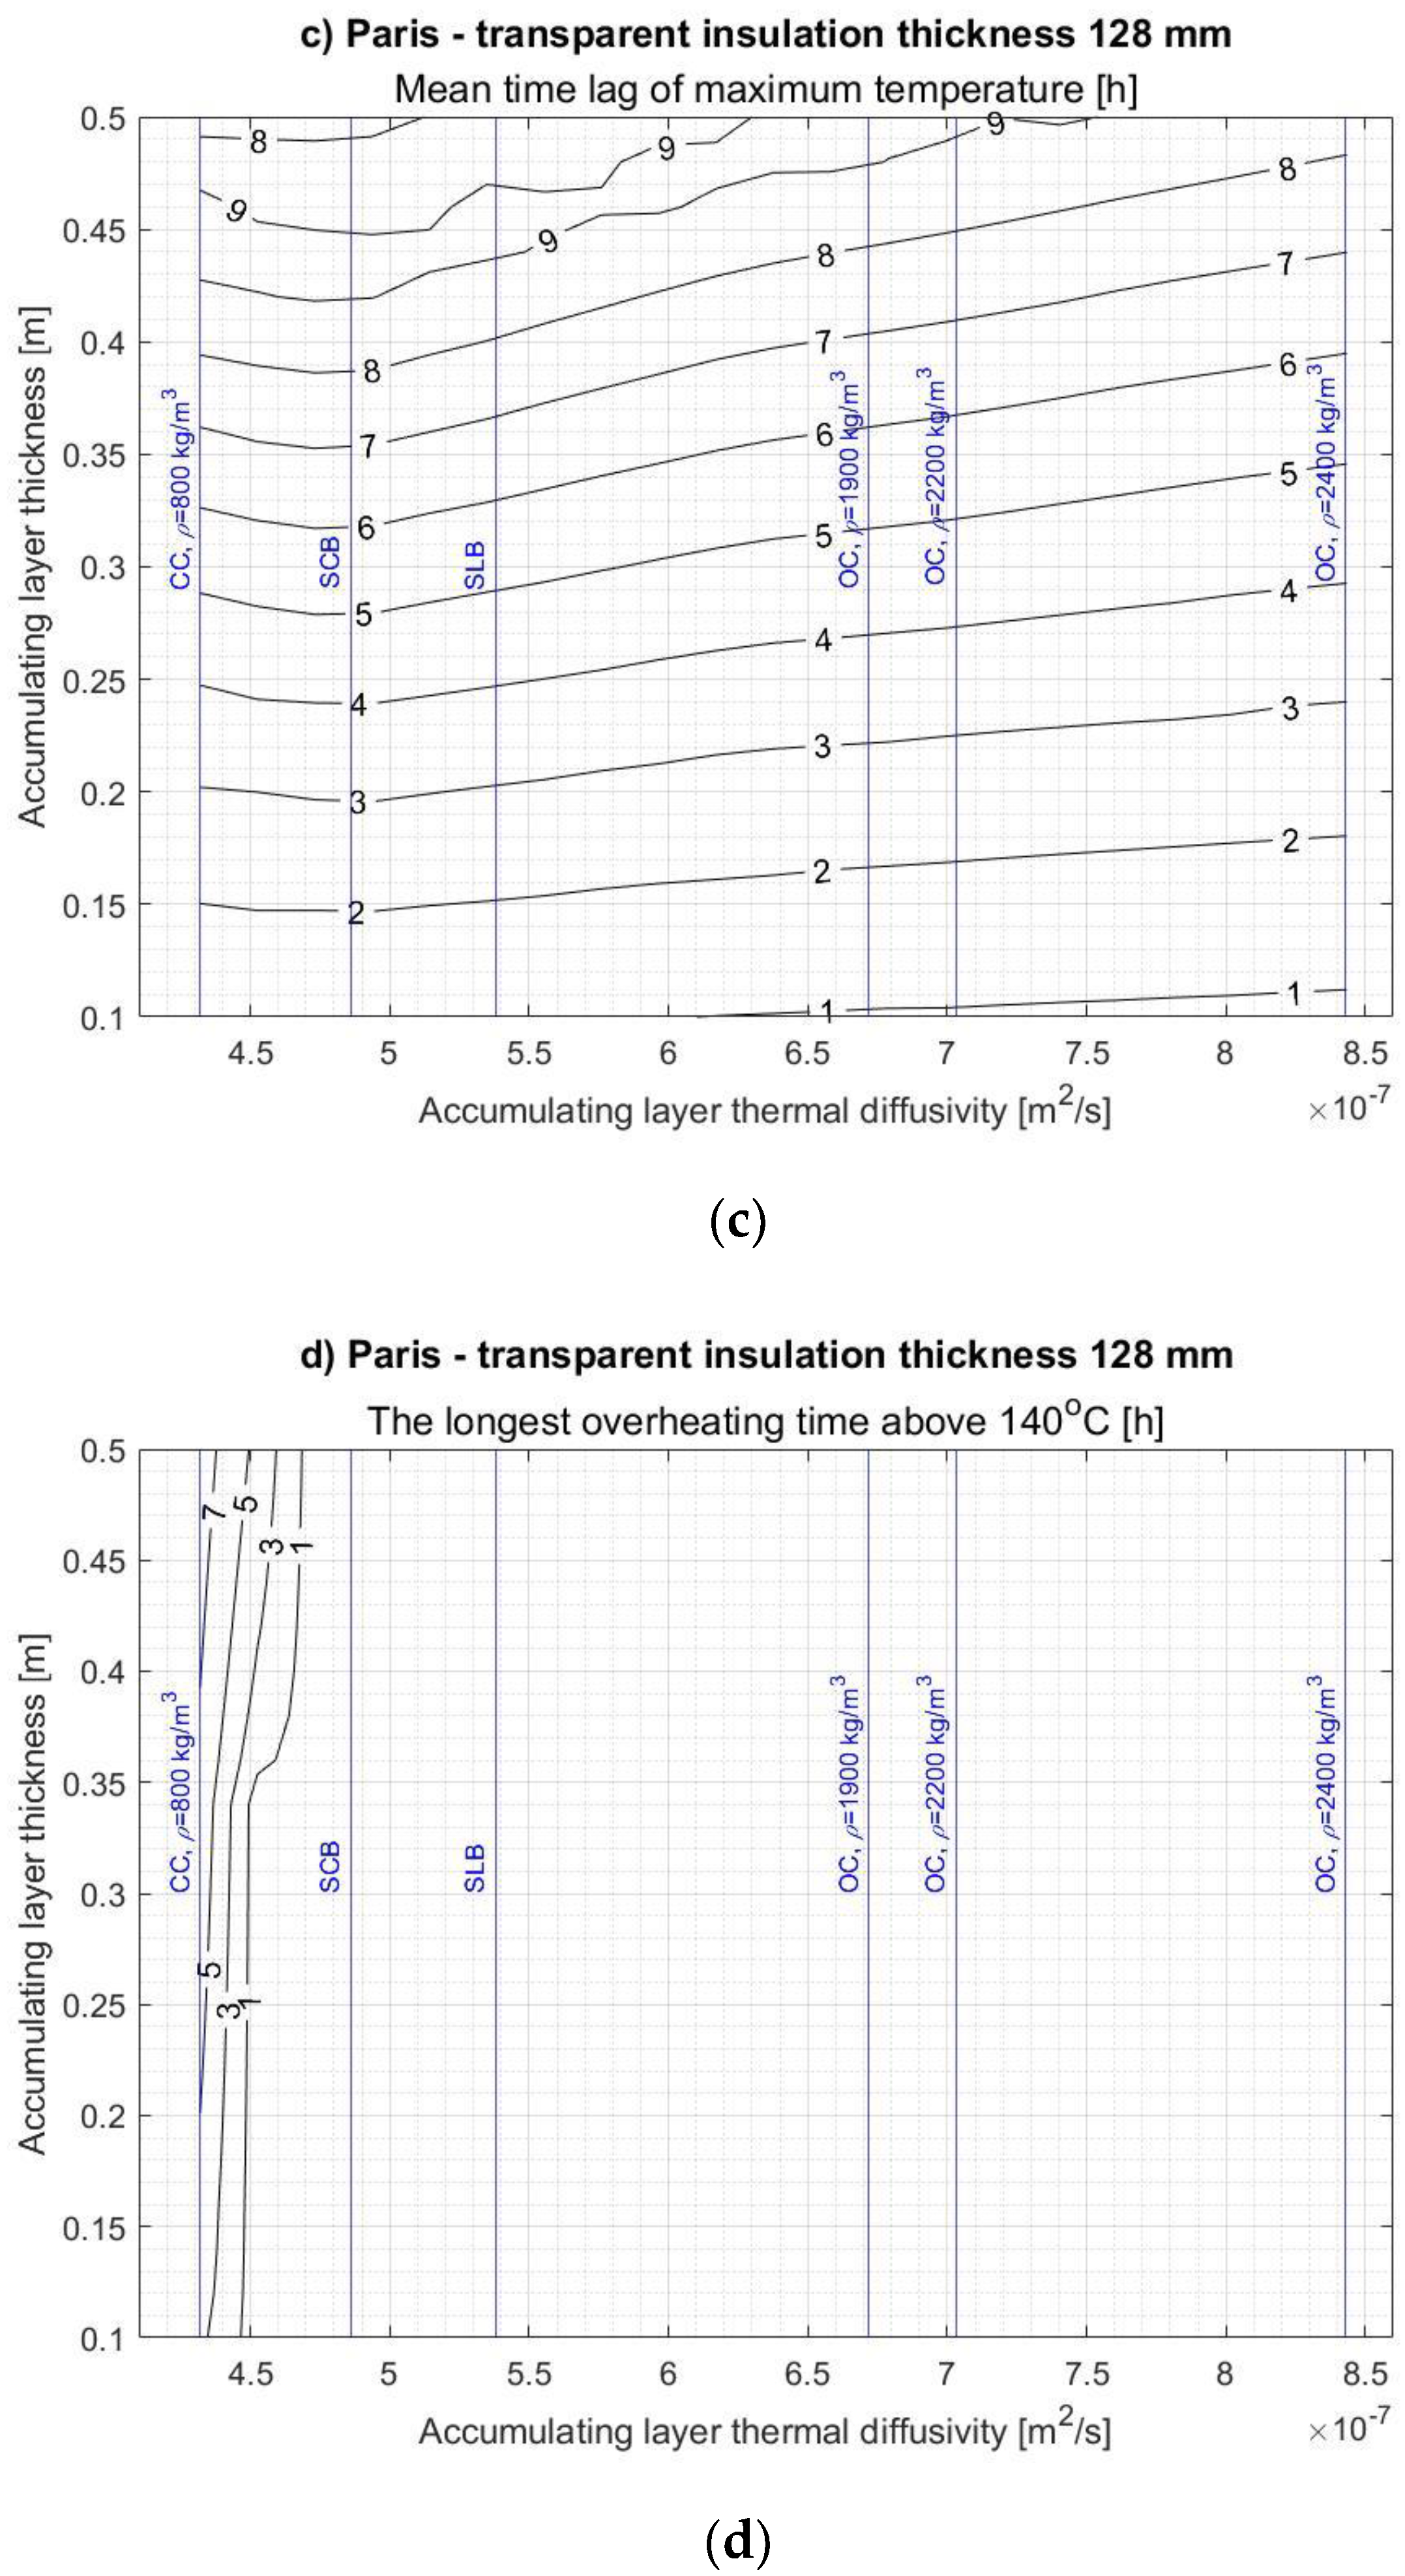
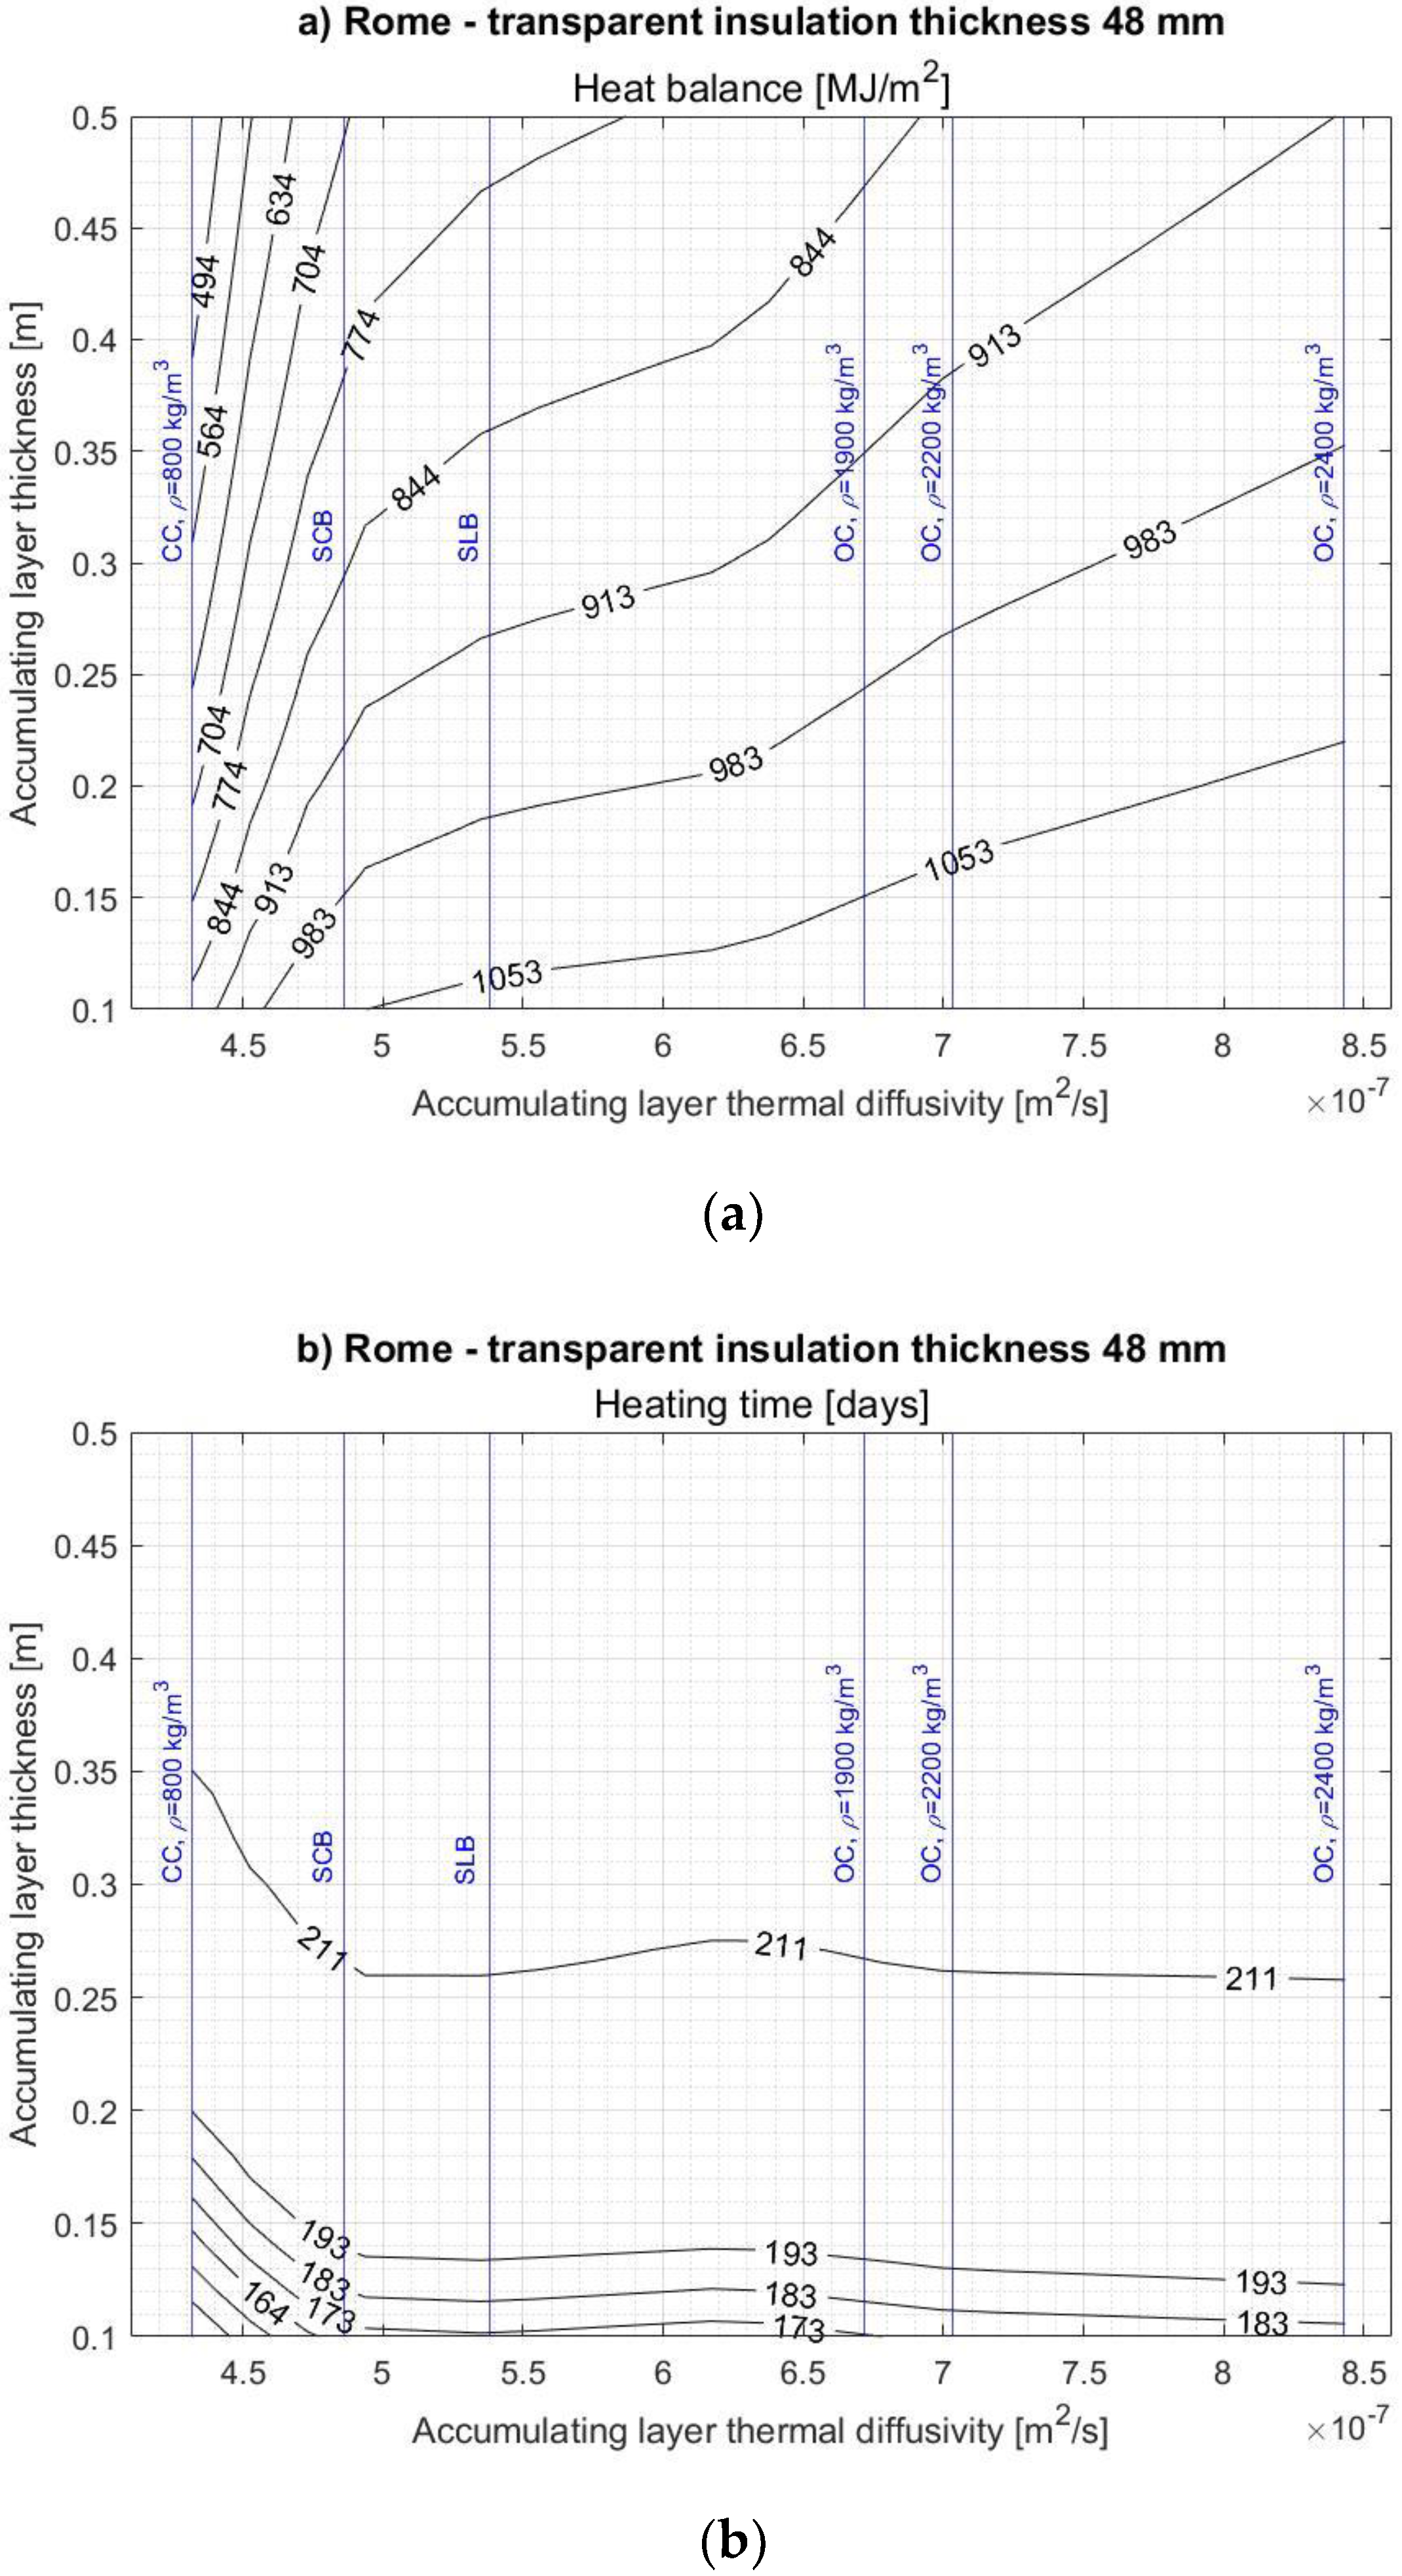
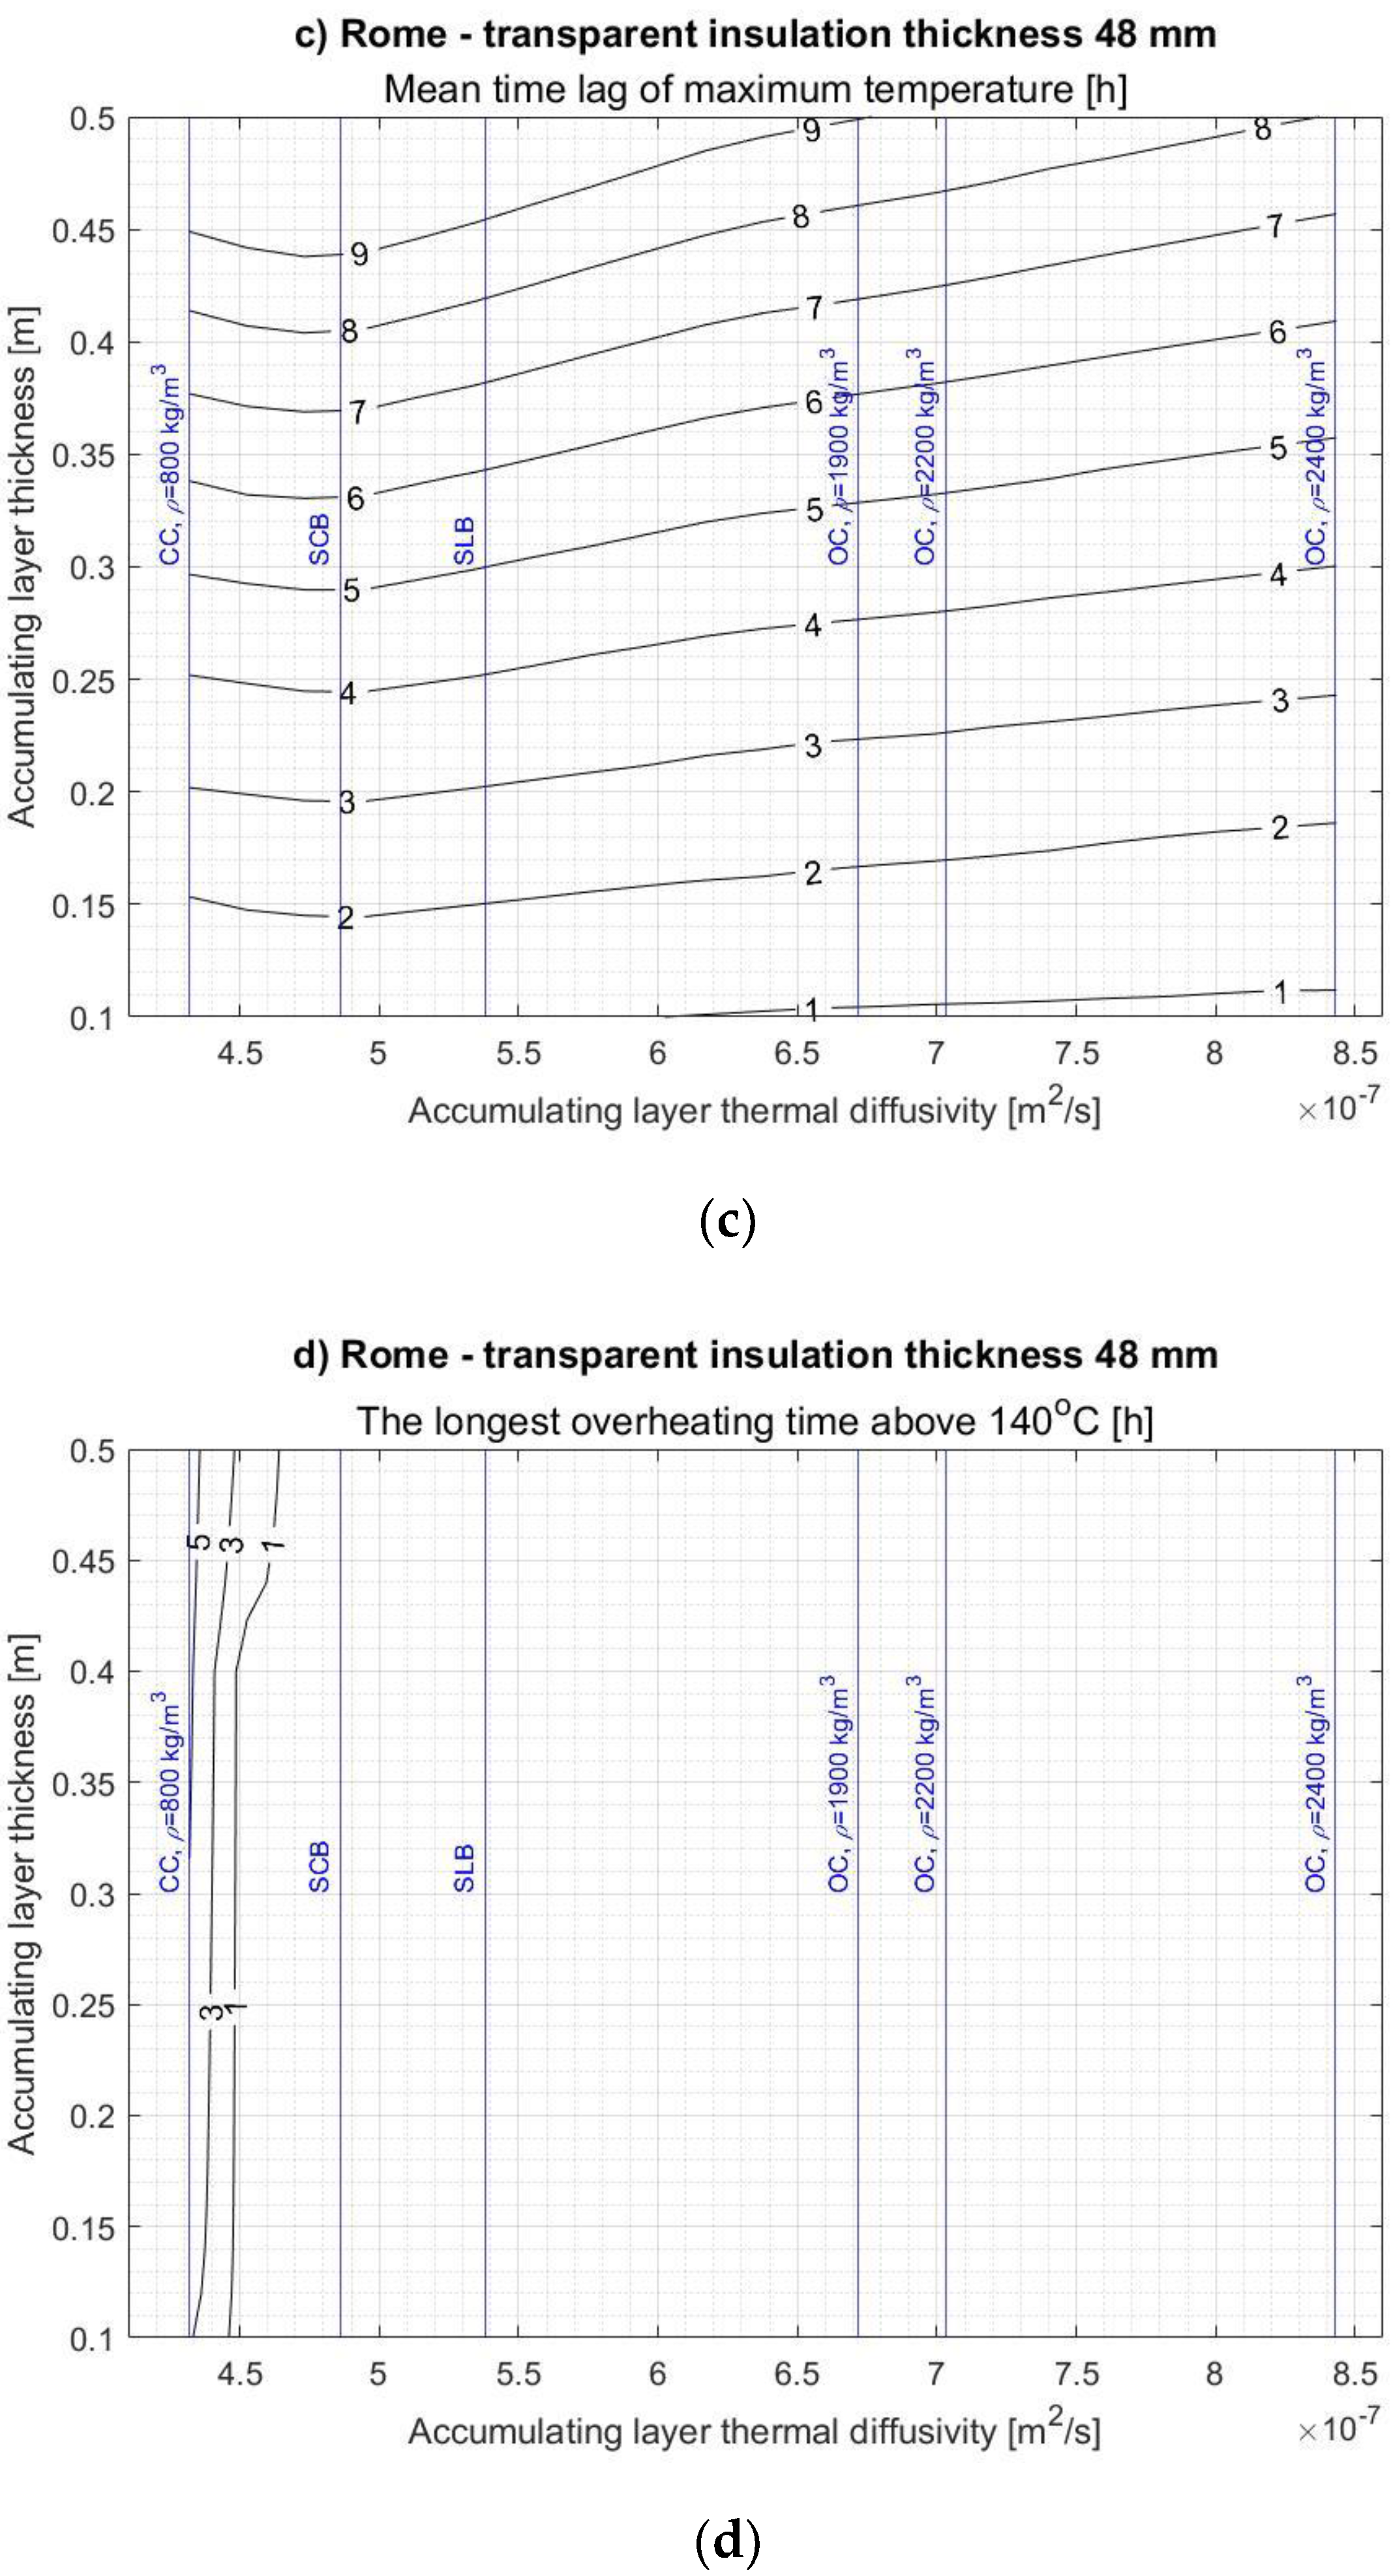
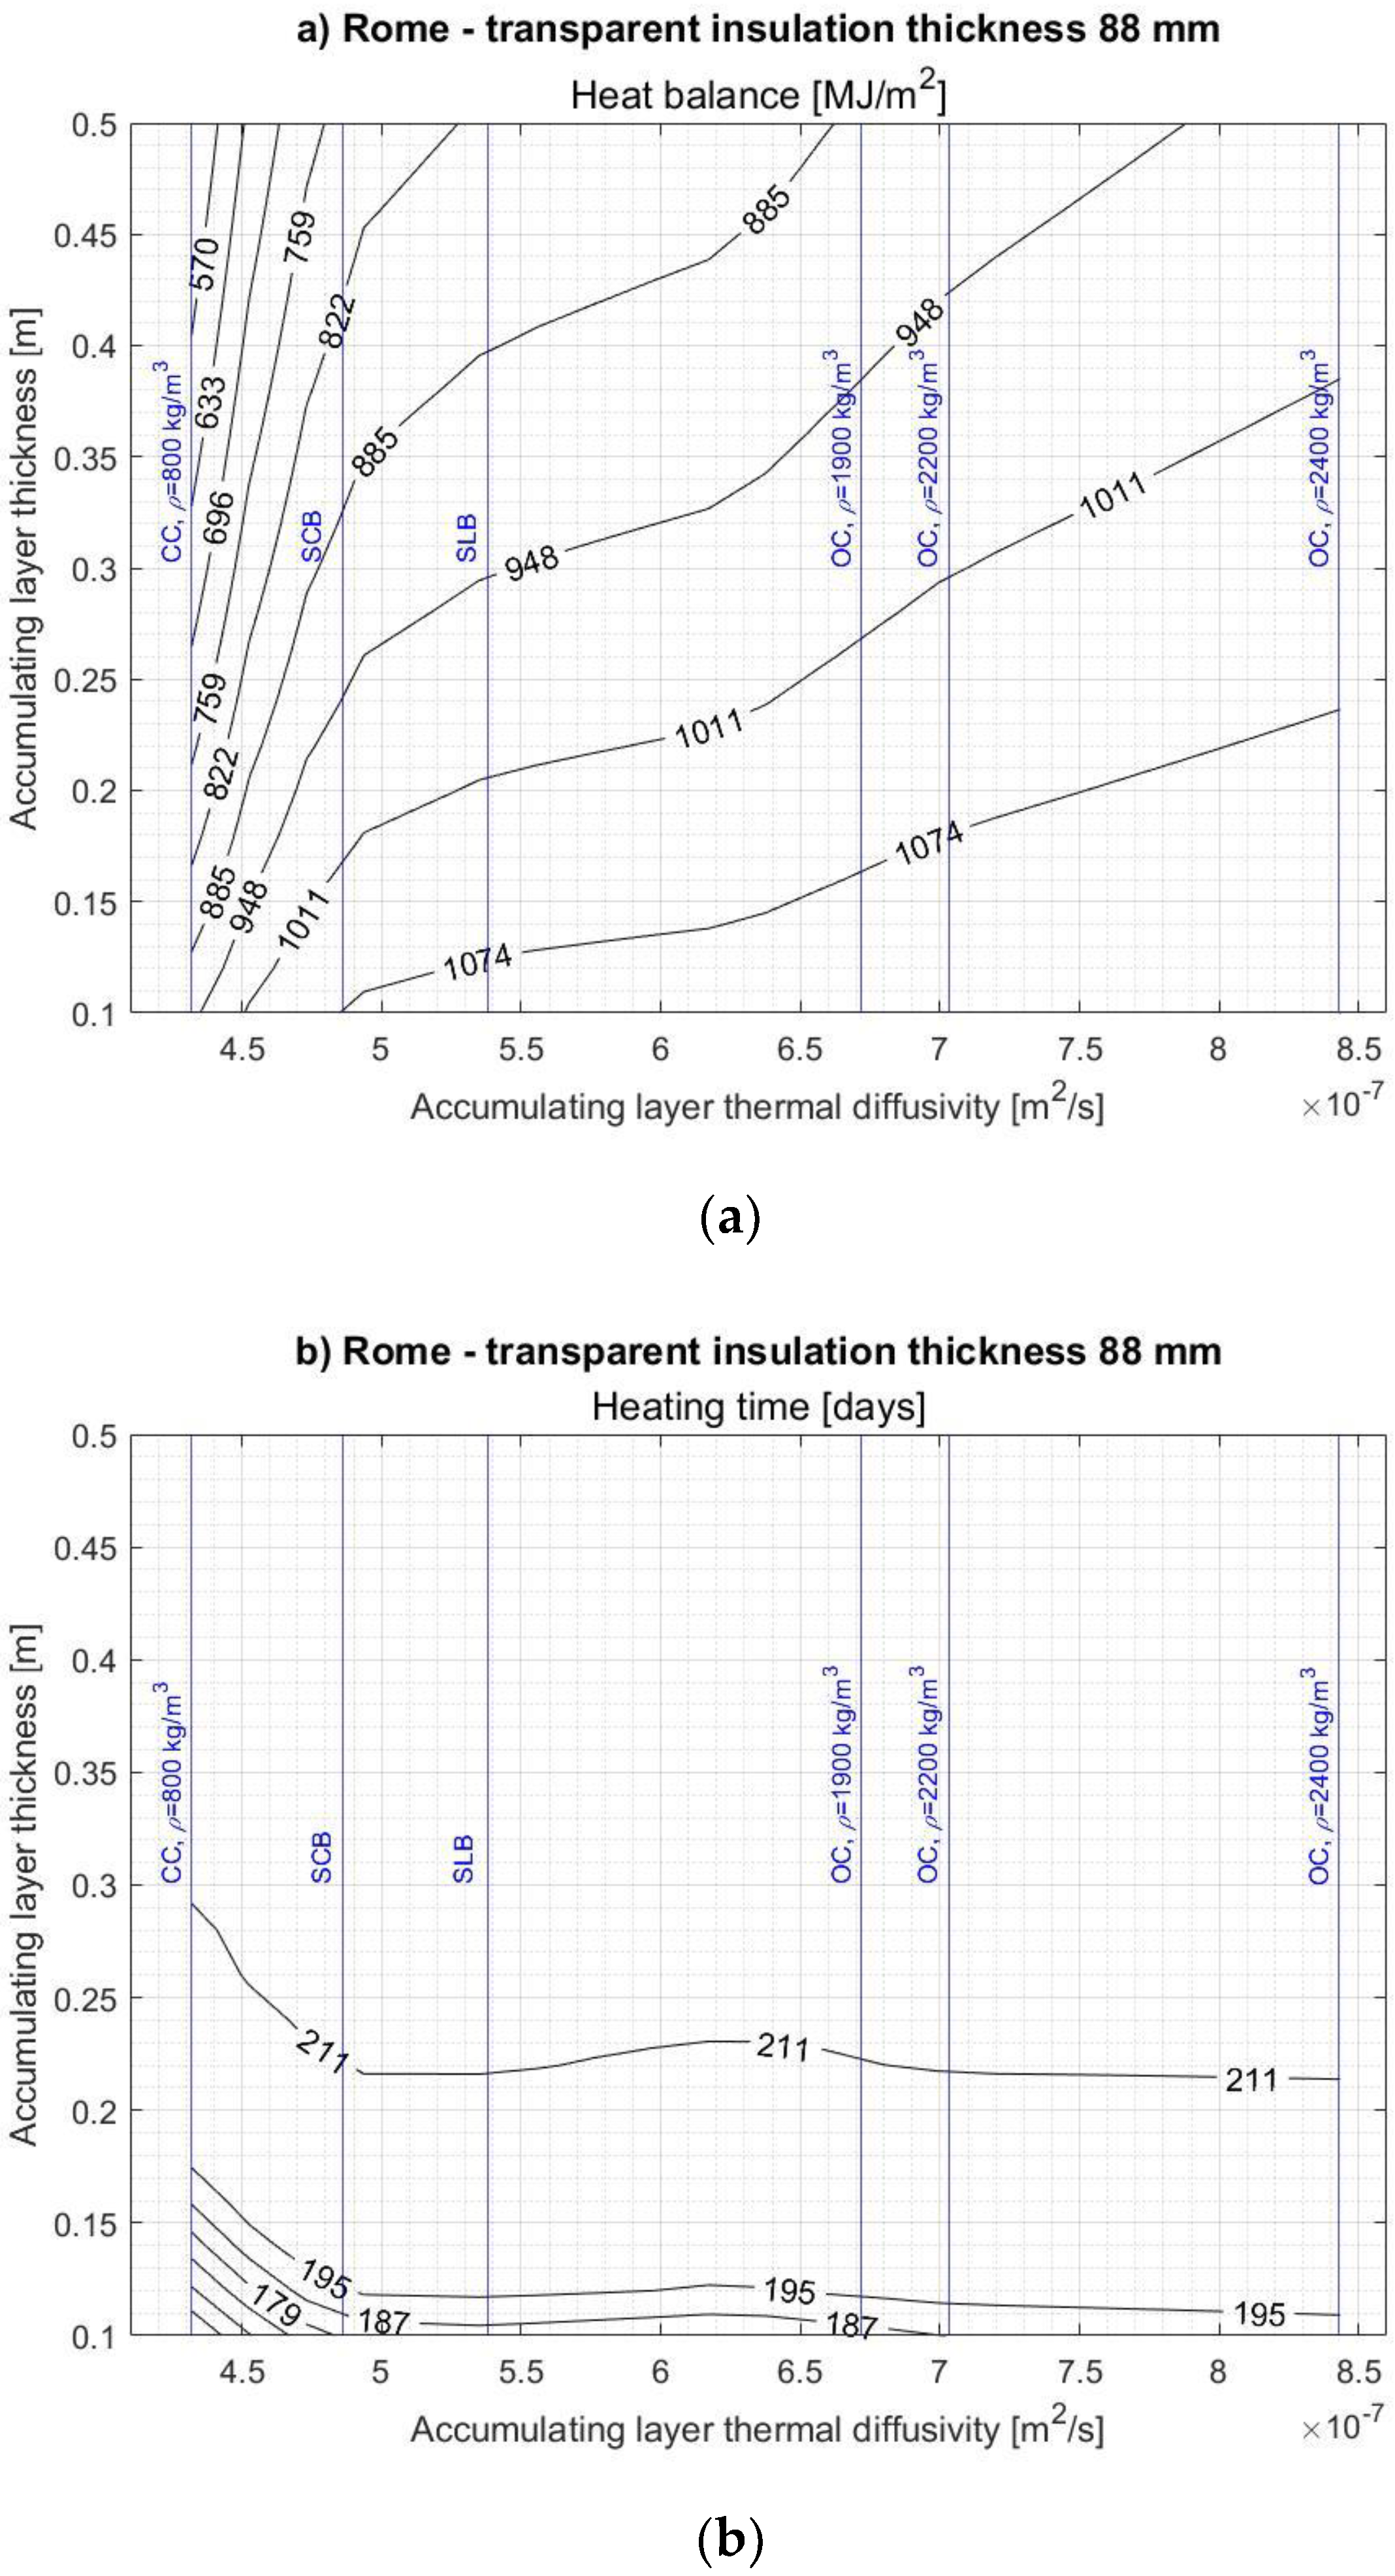
Appendix A.
4. Discussion
The diagrams in
Section 3 and
Appendix A show that a proper selection of AL and TI characteristics is closely related to SWs’ operating parameters we want to obtain, and it depends strongly on the climatic conditions which they are located in. Some limitation in the selection of AL material is also due to the temperature resistance of the TI (see
Figure A1d,
Figure A2d,
Figure A3d,
Figure A4d,
Figure A5d,
Figure A6d,
Figure A7d,
Figure A8d,
Figure A9d,
Figure A10d,
Figure A11d and
Figure A12d), i.e., the acceptable thermal conditions under which the insulation retains its required properties.
On the basis of the diagrams shown in
Figure A1a,
Figure A2a,
Figure A3a,
Figure A4a,
Figure A5a,
Figure A6a,
Figure A7a,
Figure A8a,
Figure A9a,
Figure A10a,
Figure A11a and
Figure A12a we can state that the SWs heat balance obtained during the heating season increases with the increase of thermal diffusivity of the AL and decreases with the increase of this layer thickness. Similar conclusions were reached by the authors of the work [
24], in which it was stated that in the case of an unventilated Trombe wall, the heat gains decrease with the increase in wall thickness. In turn, [
26] shows that the increase in thermal diffusivity of the AL reduces the primary energy demand of a building with a glazed Trombe wall, which is tantamount to an improvement in the seasonal heat balance of such a wall. Different conclusions were reached by the authors of the article [
27] who stated that the heat demand for heating of a building with a Trombe wall decreases with the decrease of AL thermal diffusivity (less demand was obtained using SCB than concrete, and the lowest demand was obtained for the AL made of CC). The obtained results were explained by the fact that the effect of limiting heat loss by a material with lower density (and lower thermal conductivity coefficient) outweighs the effect of reducing solar heat gains due to higher thermal resistance. The different conclusions presented in [
27] may result from the specificity of the climate in which the analyzed building was located (Ancona according to Köppen’s classification belongs to the climate category Cfa—humid subtropical climate), and they cannot be uncritically extended to SWs located in regions with different meteorological data. Both in the study [
26,
27], it was found that increasing the thickness of the AL improves the energy efficiency of Trombe walls (the primary energy demand and the heat demand for heating the building were reduced respectively), which was explained by the increase in the thermal resistance of the system. Since both of these articles analyzed the traditional Trombe glazed walls, this conclusion shows the different behavior of SWs equipped with a glass pane or TI.
When designing an SW, apart from its thermal balance, other parameters must also be taken into account. The time, during which it acts as a heat source in a given climate, is a very important parameter. As shown in
Figure A1b,
Figure A2b,
Figure A3b,
Figure A4b,
Figure A5b,
Figure A6b,
Figure A7b,
Figure A8b,
Figure A9b,
Figure A10b,
Figure A11b and
Figure A12b, this heating time for
m
2/s increases slightly as the AL thermal diffusivity increases, and it remains approximately constant for
m
2/s. On the other hand, it lengthens significantly with increasing the layer thickness. Therefore, in this case, we observe the opposite upward trend than in the case of variability of the thermal balance of the wall—i.e., by increasing the thickness—the thermal balance of the SW is deteriorated, while the time of heating the room by the SW is extended.
As mentioned earlier, from the point of view of the heat balance, it would be most preferably to make a thin AL from a material with high thermal diffusivity. However, then the heat would reach the room so quickly that practically, we would have direct gains, and regardless of the considered climate, the time of the maximum temperature lag, when transferring heat through the wall, would be less than one hour (
Figure A1c,
Figure A2c,
Figure A3c,
Figure A4c,
Figure A5c,
Figure A6c,
Figure A7c,
Figure A8c,
Figure A9c,
Figure A10c,
Figure A11c and
Figure A12c). As it is known, the direct gains cause large temperature fluctuations in rooms, and usually occur at this time of day when they are not most desirable. The idea behind the SWs is to shift the solar heat gains in buildings to the afternoon and evening hours and to spread them over time. According to the authors, the associated minimum time lag of maximum temperature between the absorber and the wall’s internal surface should be between 4 and 5 h depending on the location, which corresponds to the occurrence of maximum solar heat gains in the rooms after 5 to 6 h from the moment the sun passes through the zenith (the maximum temperature on the absorber on a cloudless sunny day usually occurs around one hour after solar noon). For this reason, the authors proposes that the AL optimum thickness should varies between 25 cm and 35 cm depending on the material used. This minimum time of the temperature wave lag was proposed in such a way that at the turn of January and February, the maximum heat gains in the room occur one hour after sunset, hence the time for Stockholm is about 4 h, for Warsaw 4.5 h, for Paris 4.7 h, and for Rome 5 h. It is worth noting at this point that the contour graphs of average temperature time lag are very similar for different locations and different insulation thickness values. Thus, as might be expected, the influence of the weather conditions in the climates under consideration is of secondary importance for this SW characteristic.
In the case of the analyzed TI, an important criterion for the selection of AL parameters is to avoid the possibility of overheating the insulation above 140 °C, which is its short-term thermal resistance. This condition imposes particularly a certain limitation on the lower range of possible AL construction materials thermal diffusivity, while the lower acceptable thermal diffusivity values, in the case of which overheating the insulation has not yet occurred, are slightly larger for thicker insulations (
Figure A1d,
Figure A2d,
Figure A3d,
Figure A4d,
Figure A5d,
Figure A6d,
Figure A7d,
Figure A8d,
Figure A9d,
Figure A10d,
Figure A11d and
Figure A12d). It is worth paying attention to the fact that in the case of all analyzed locations and all thicknesses of TI, the use of CC as AL would cause the TI to overheat. It is also interesting to note that the range of useless thermal diffusivity and AL thickness values is similar in Stockholm and in Rome, even though Stockholm’s climate is colder than that of Rome. This is due to the specific insolation conditions in Stockholm (
Figure 3) where there is a very high intensity of solar irradiance on vertical surfaces with southern orientation in the months of March and April.
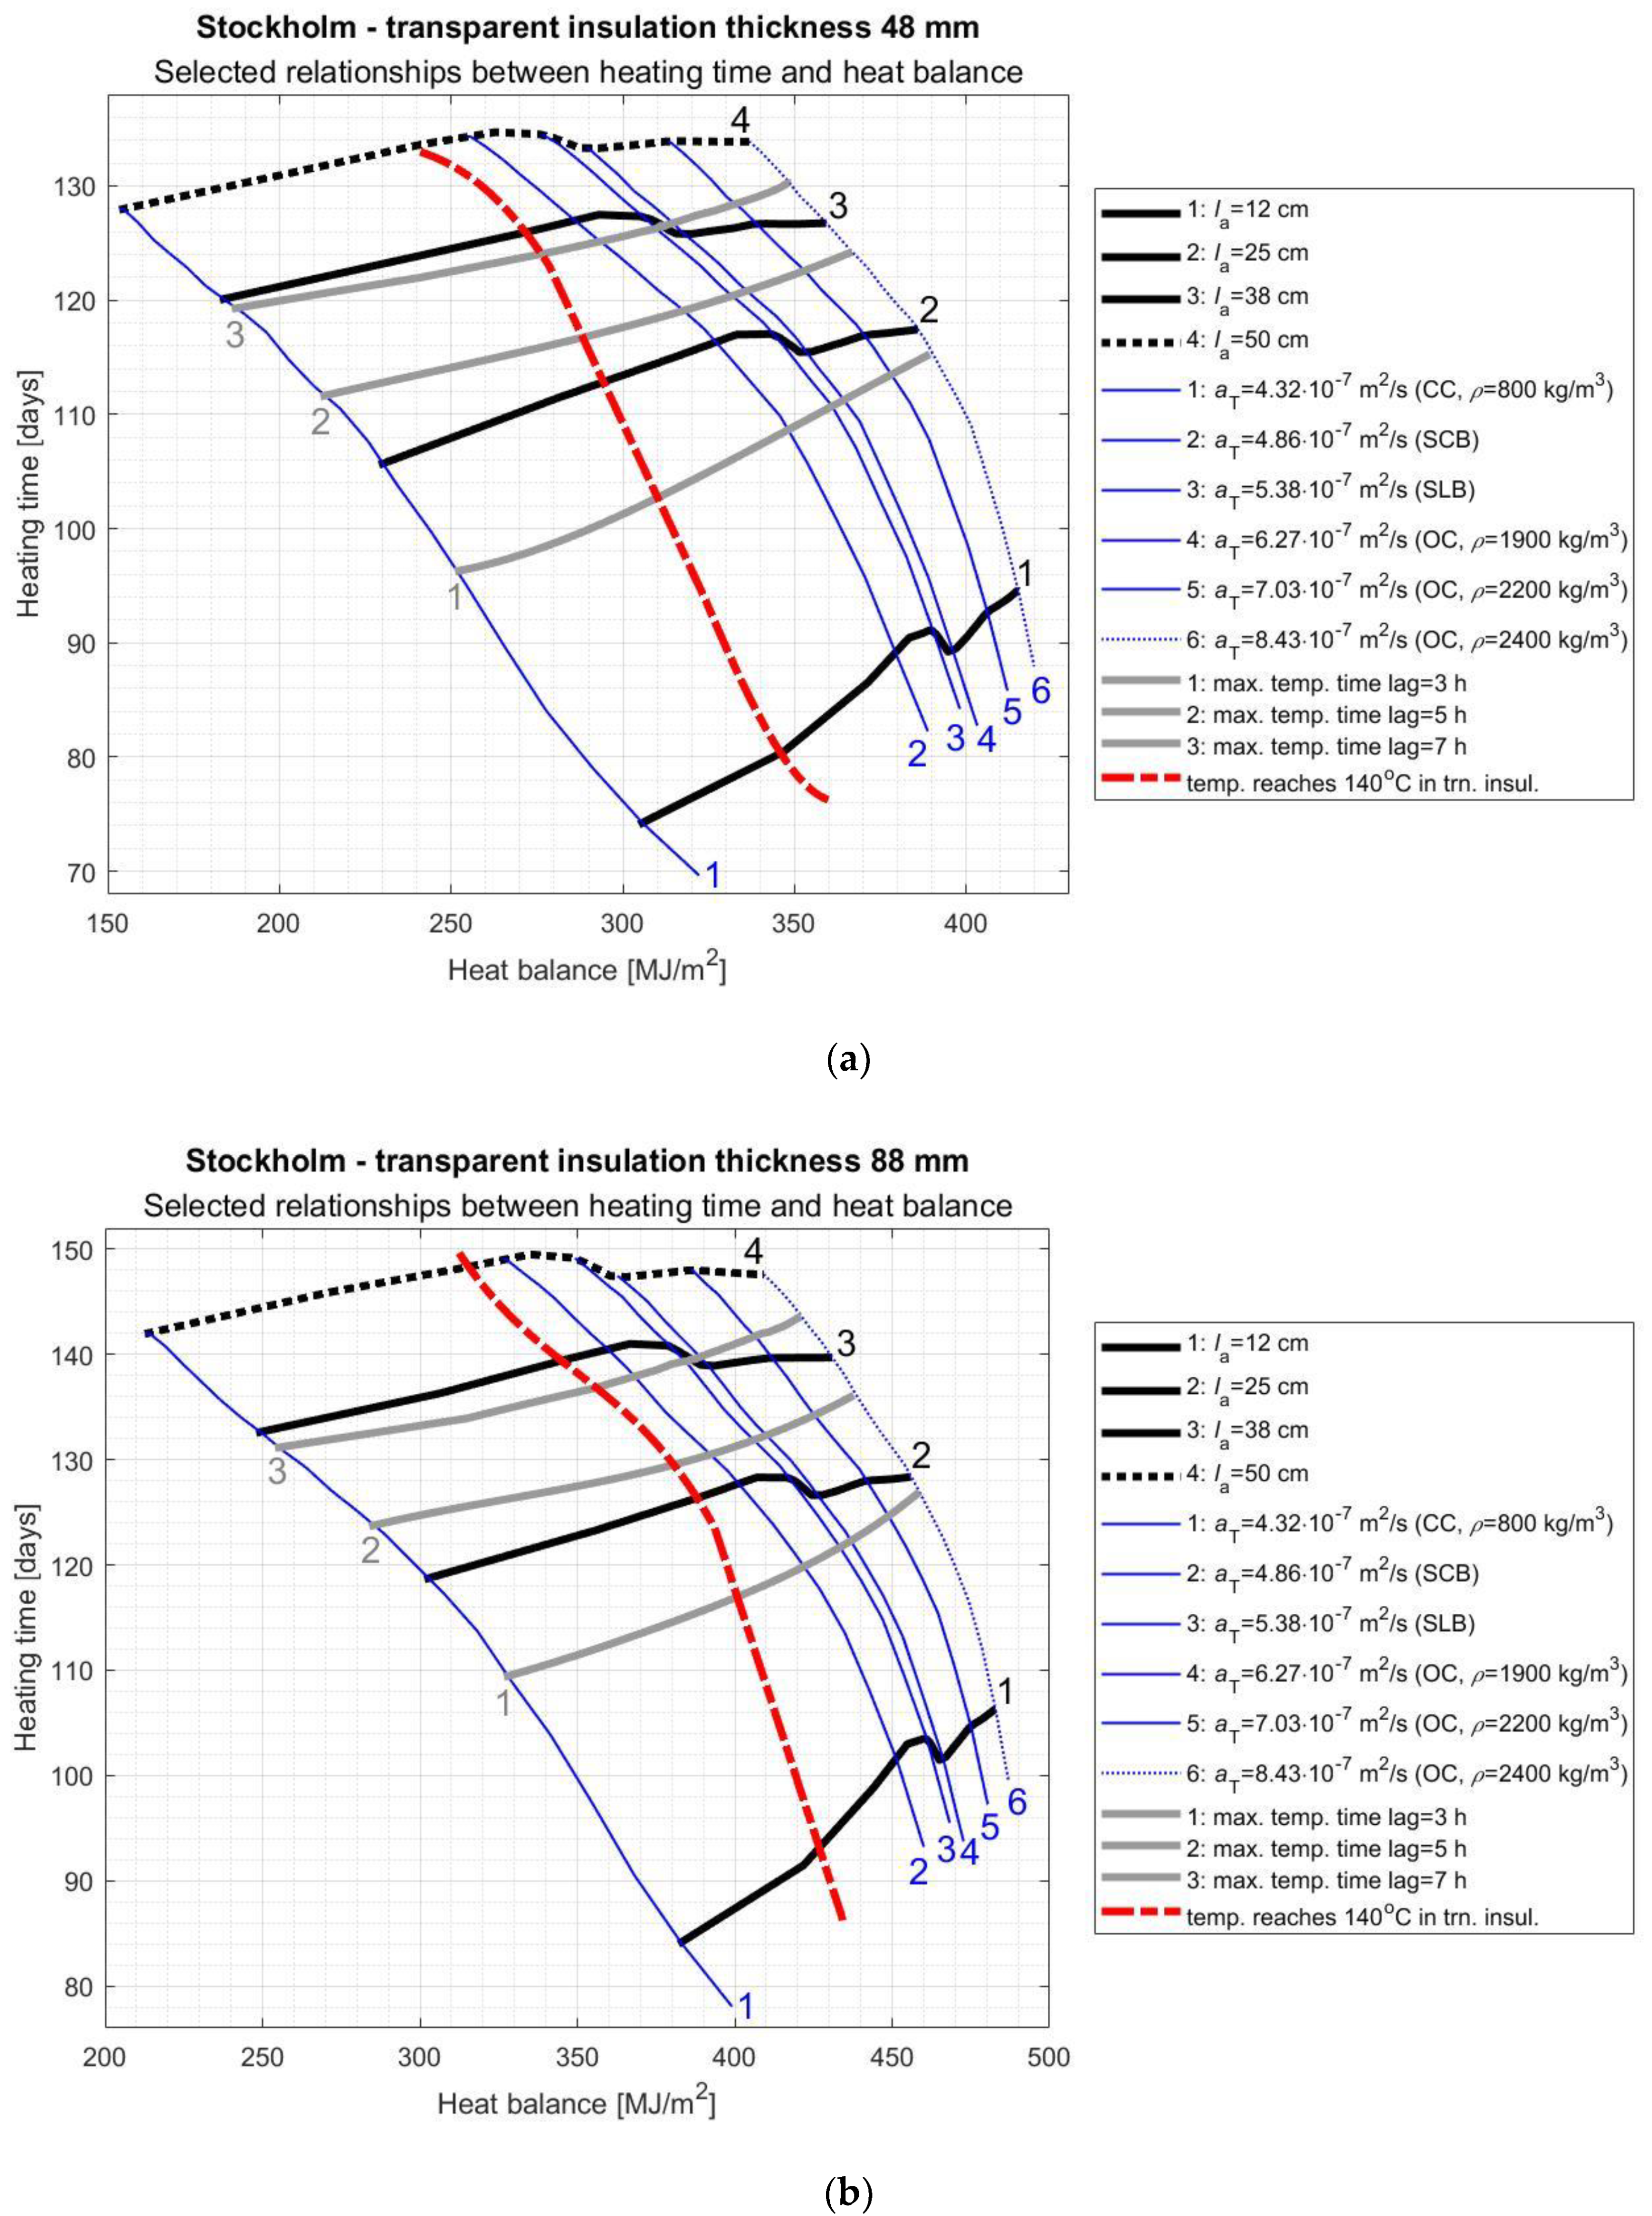
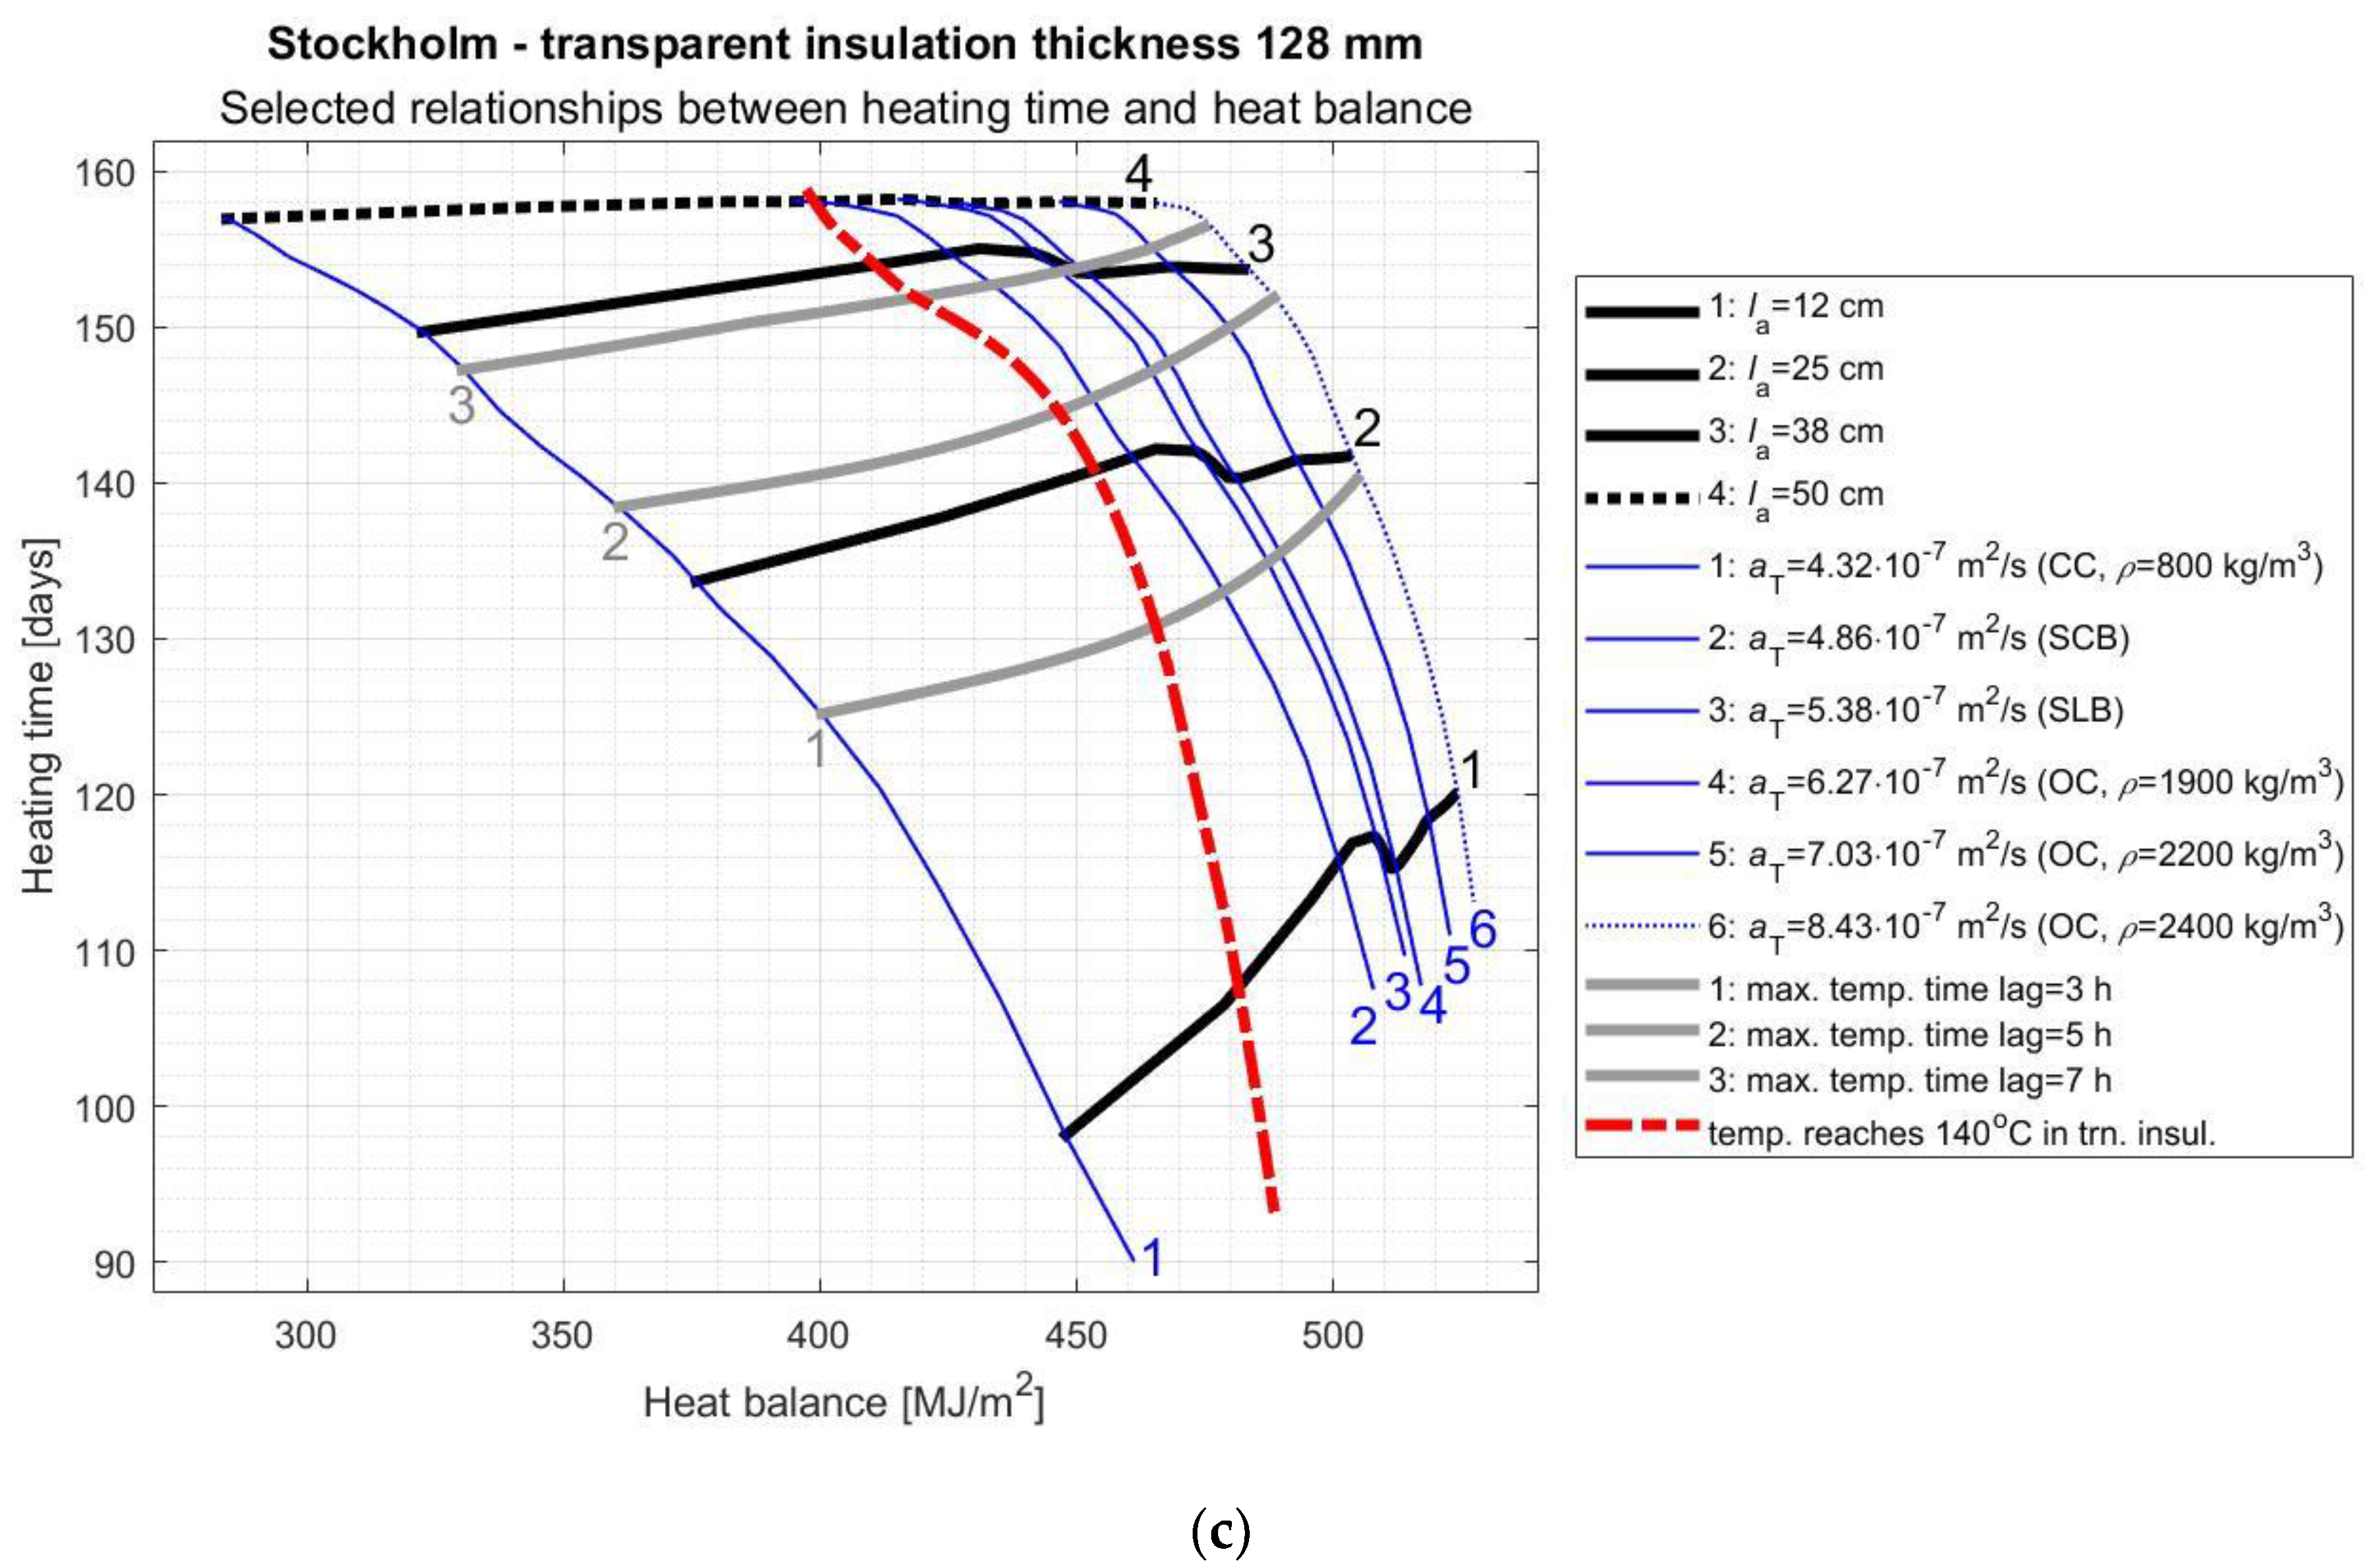
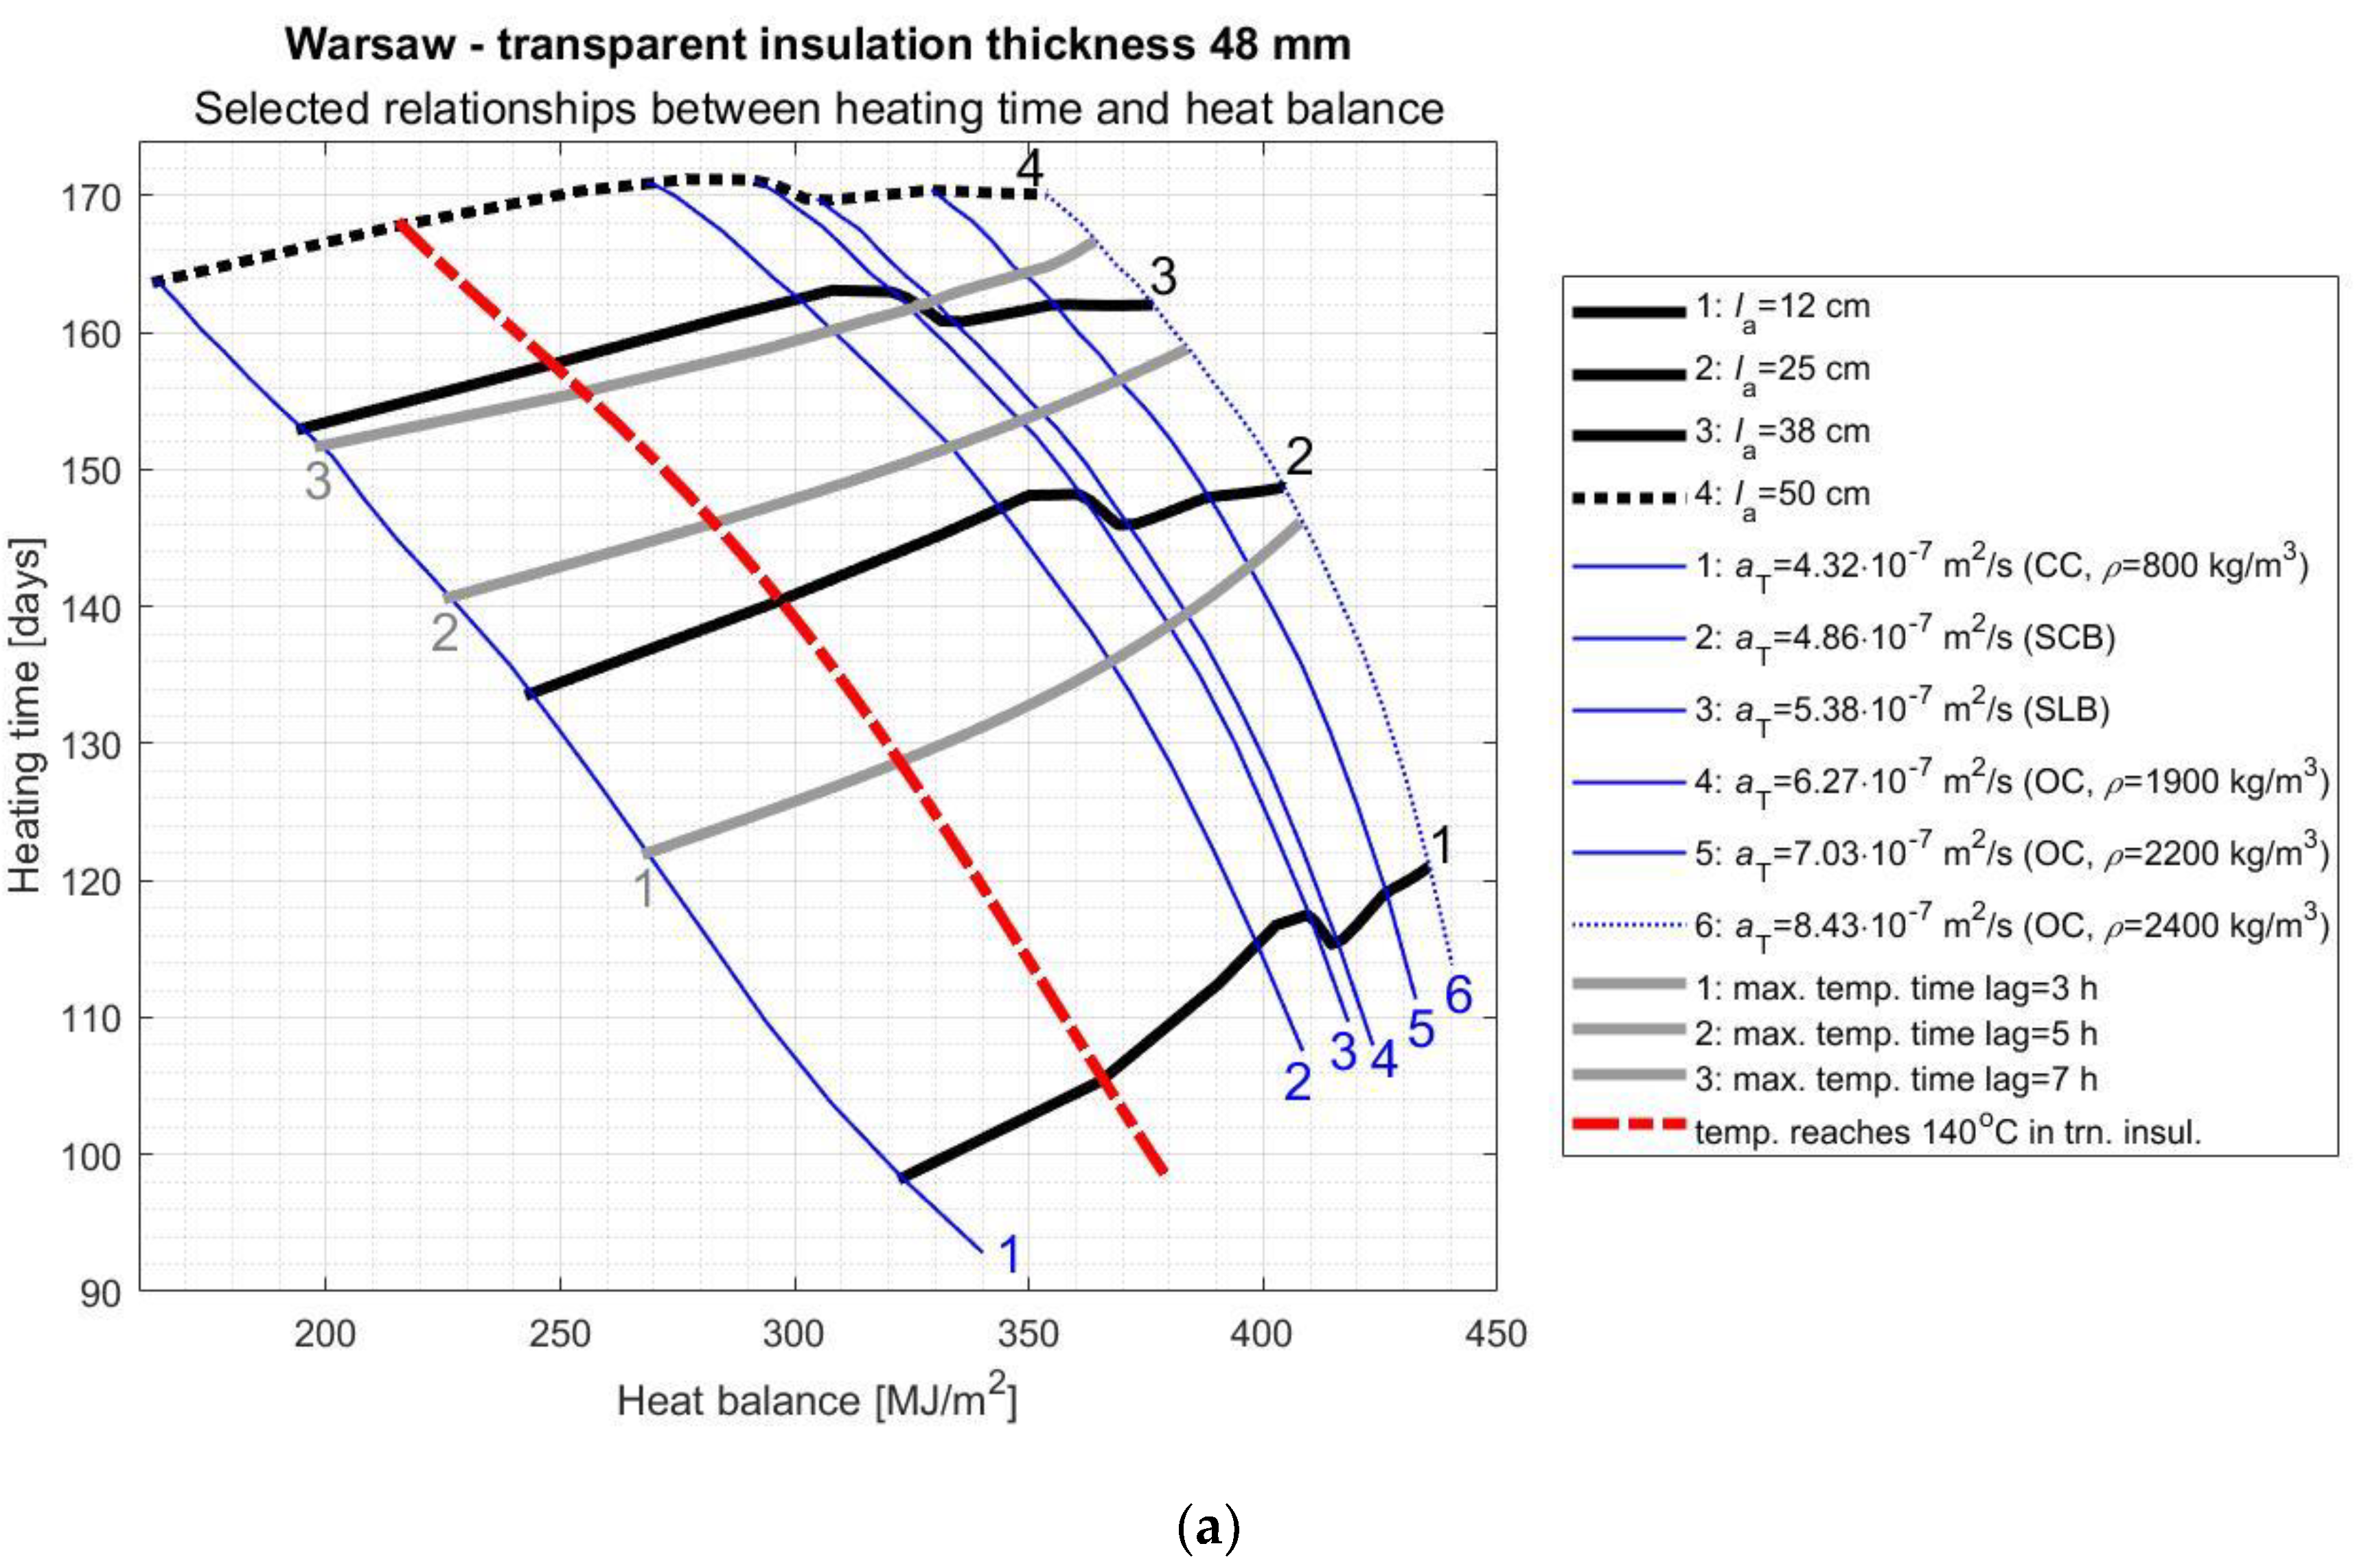
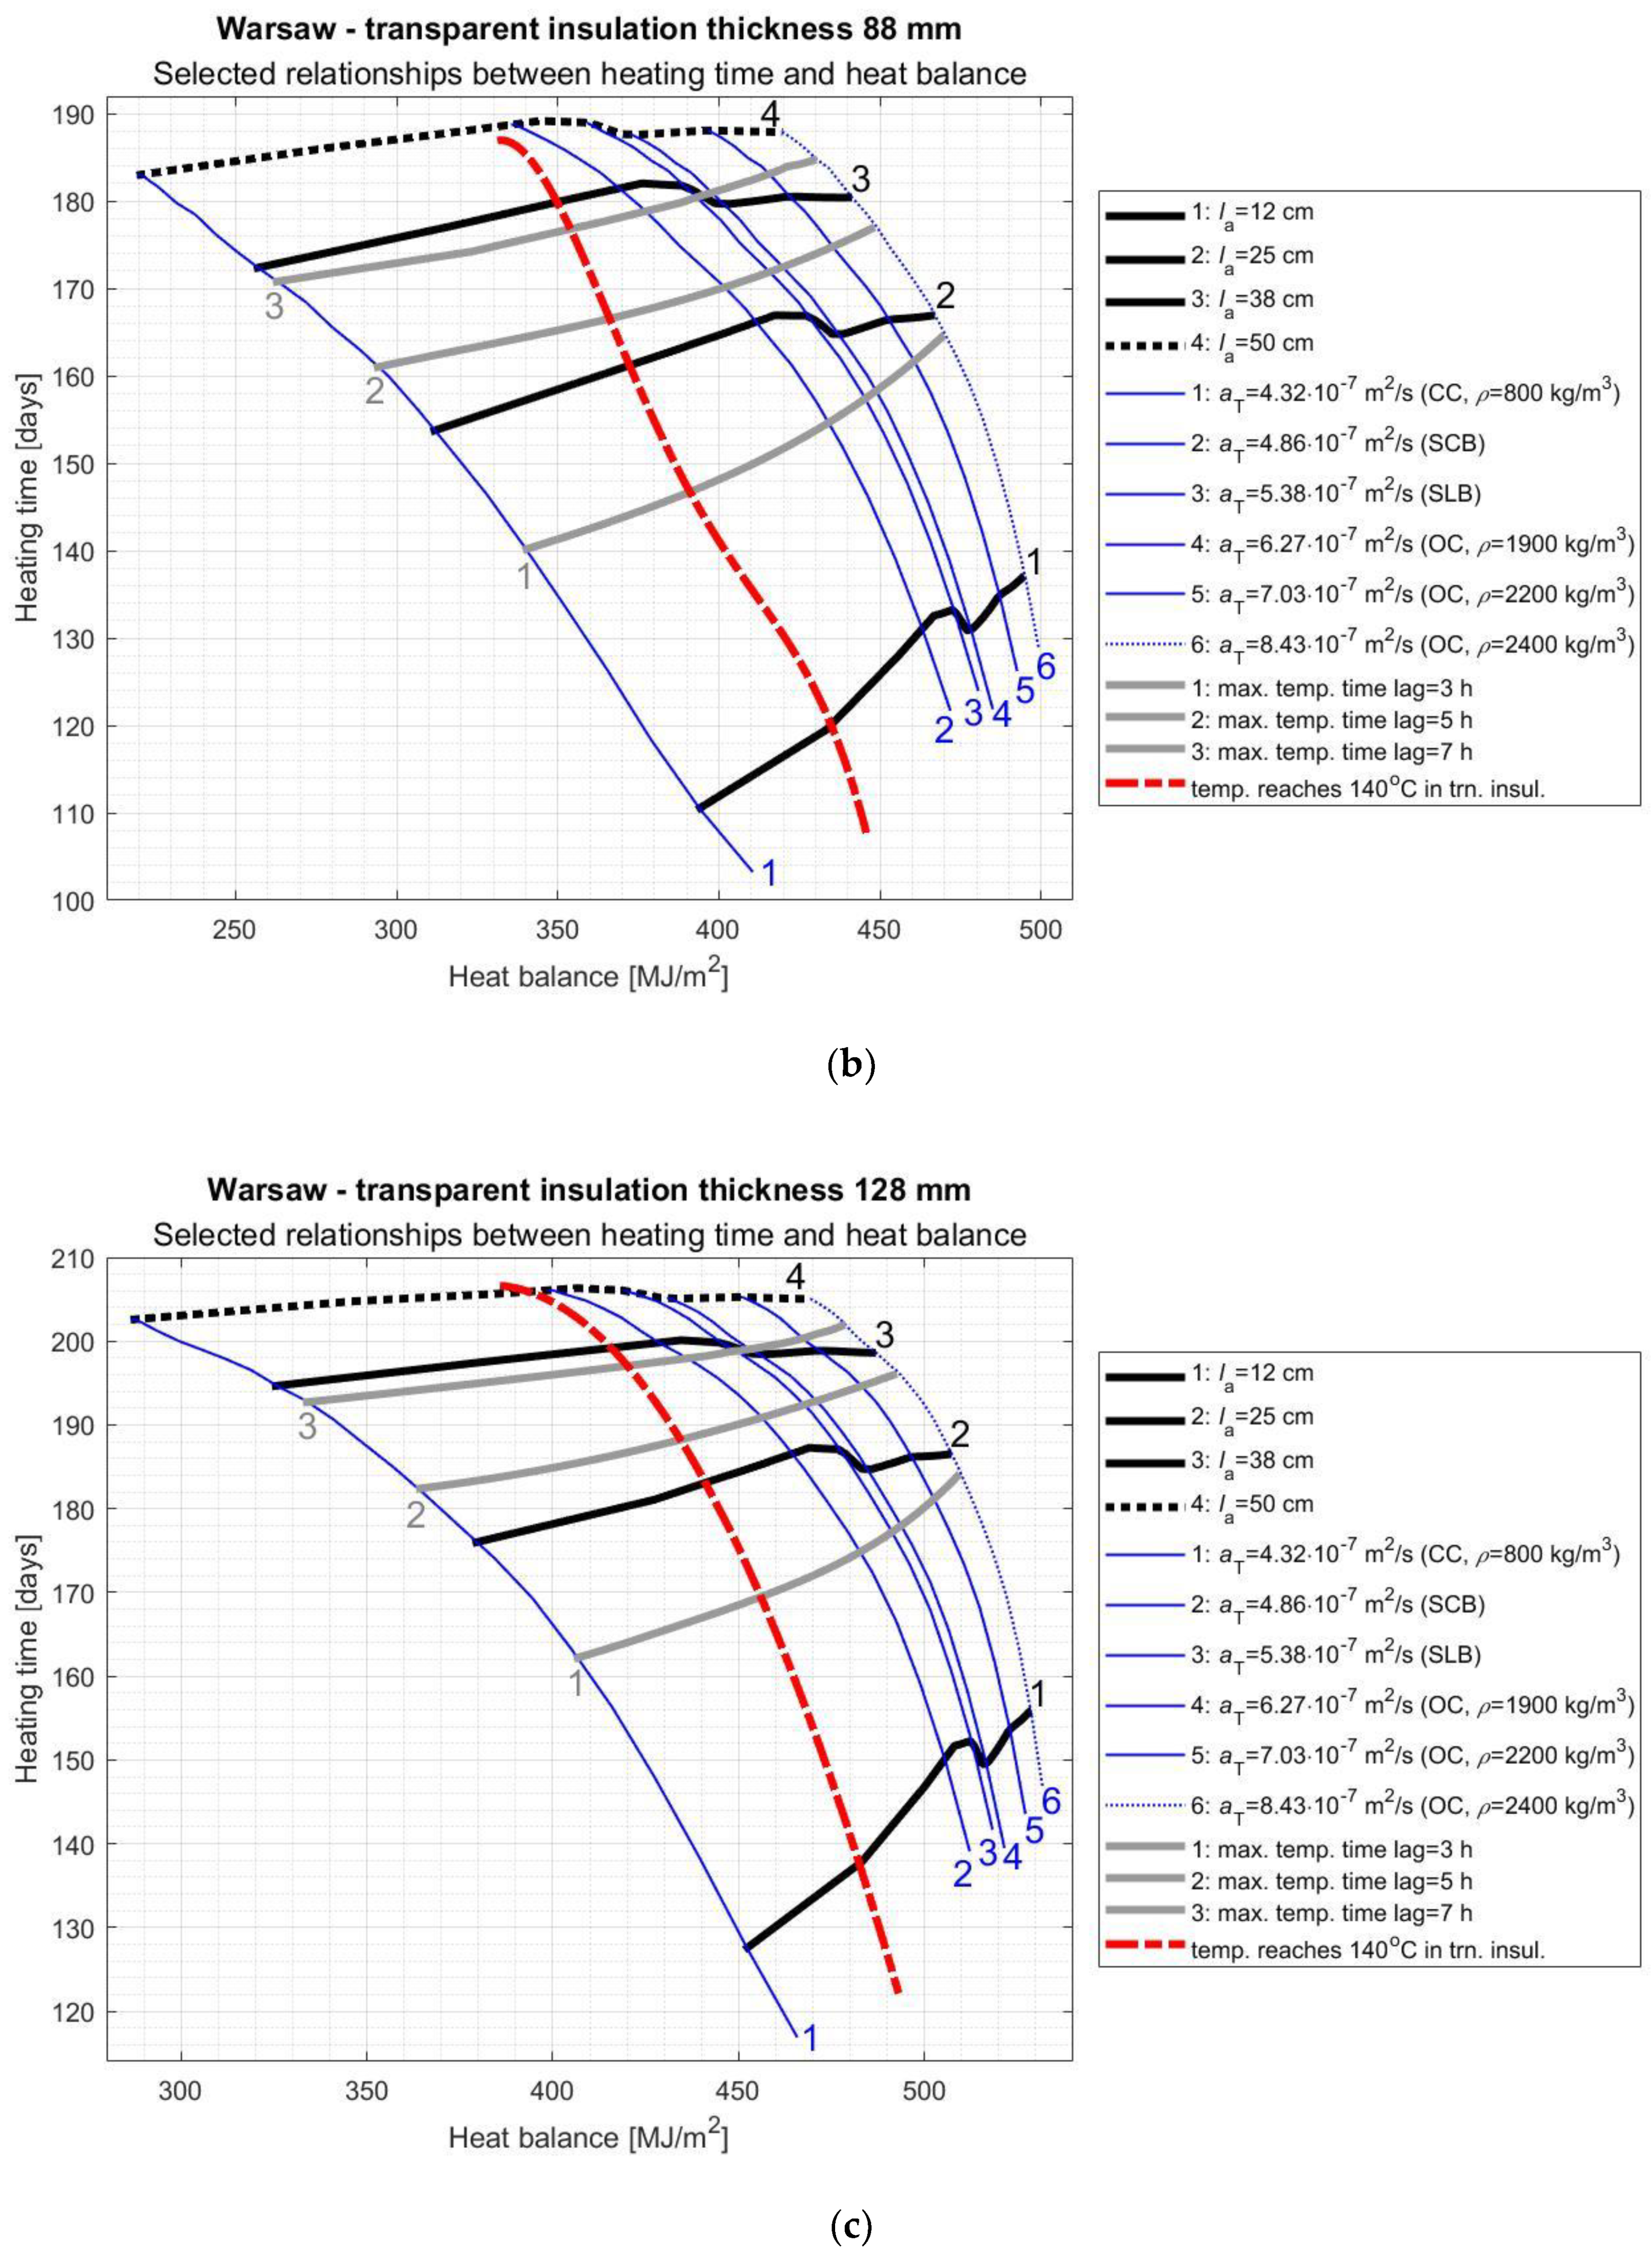
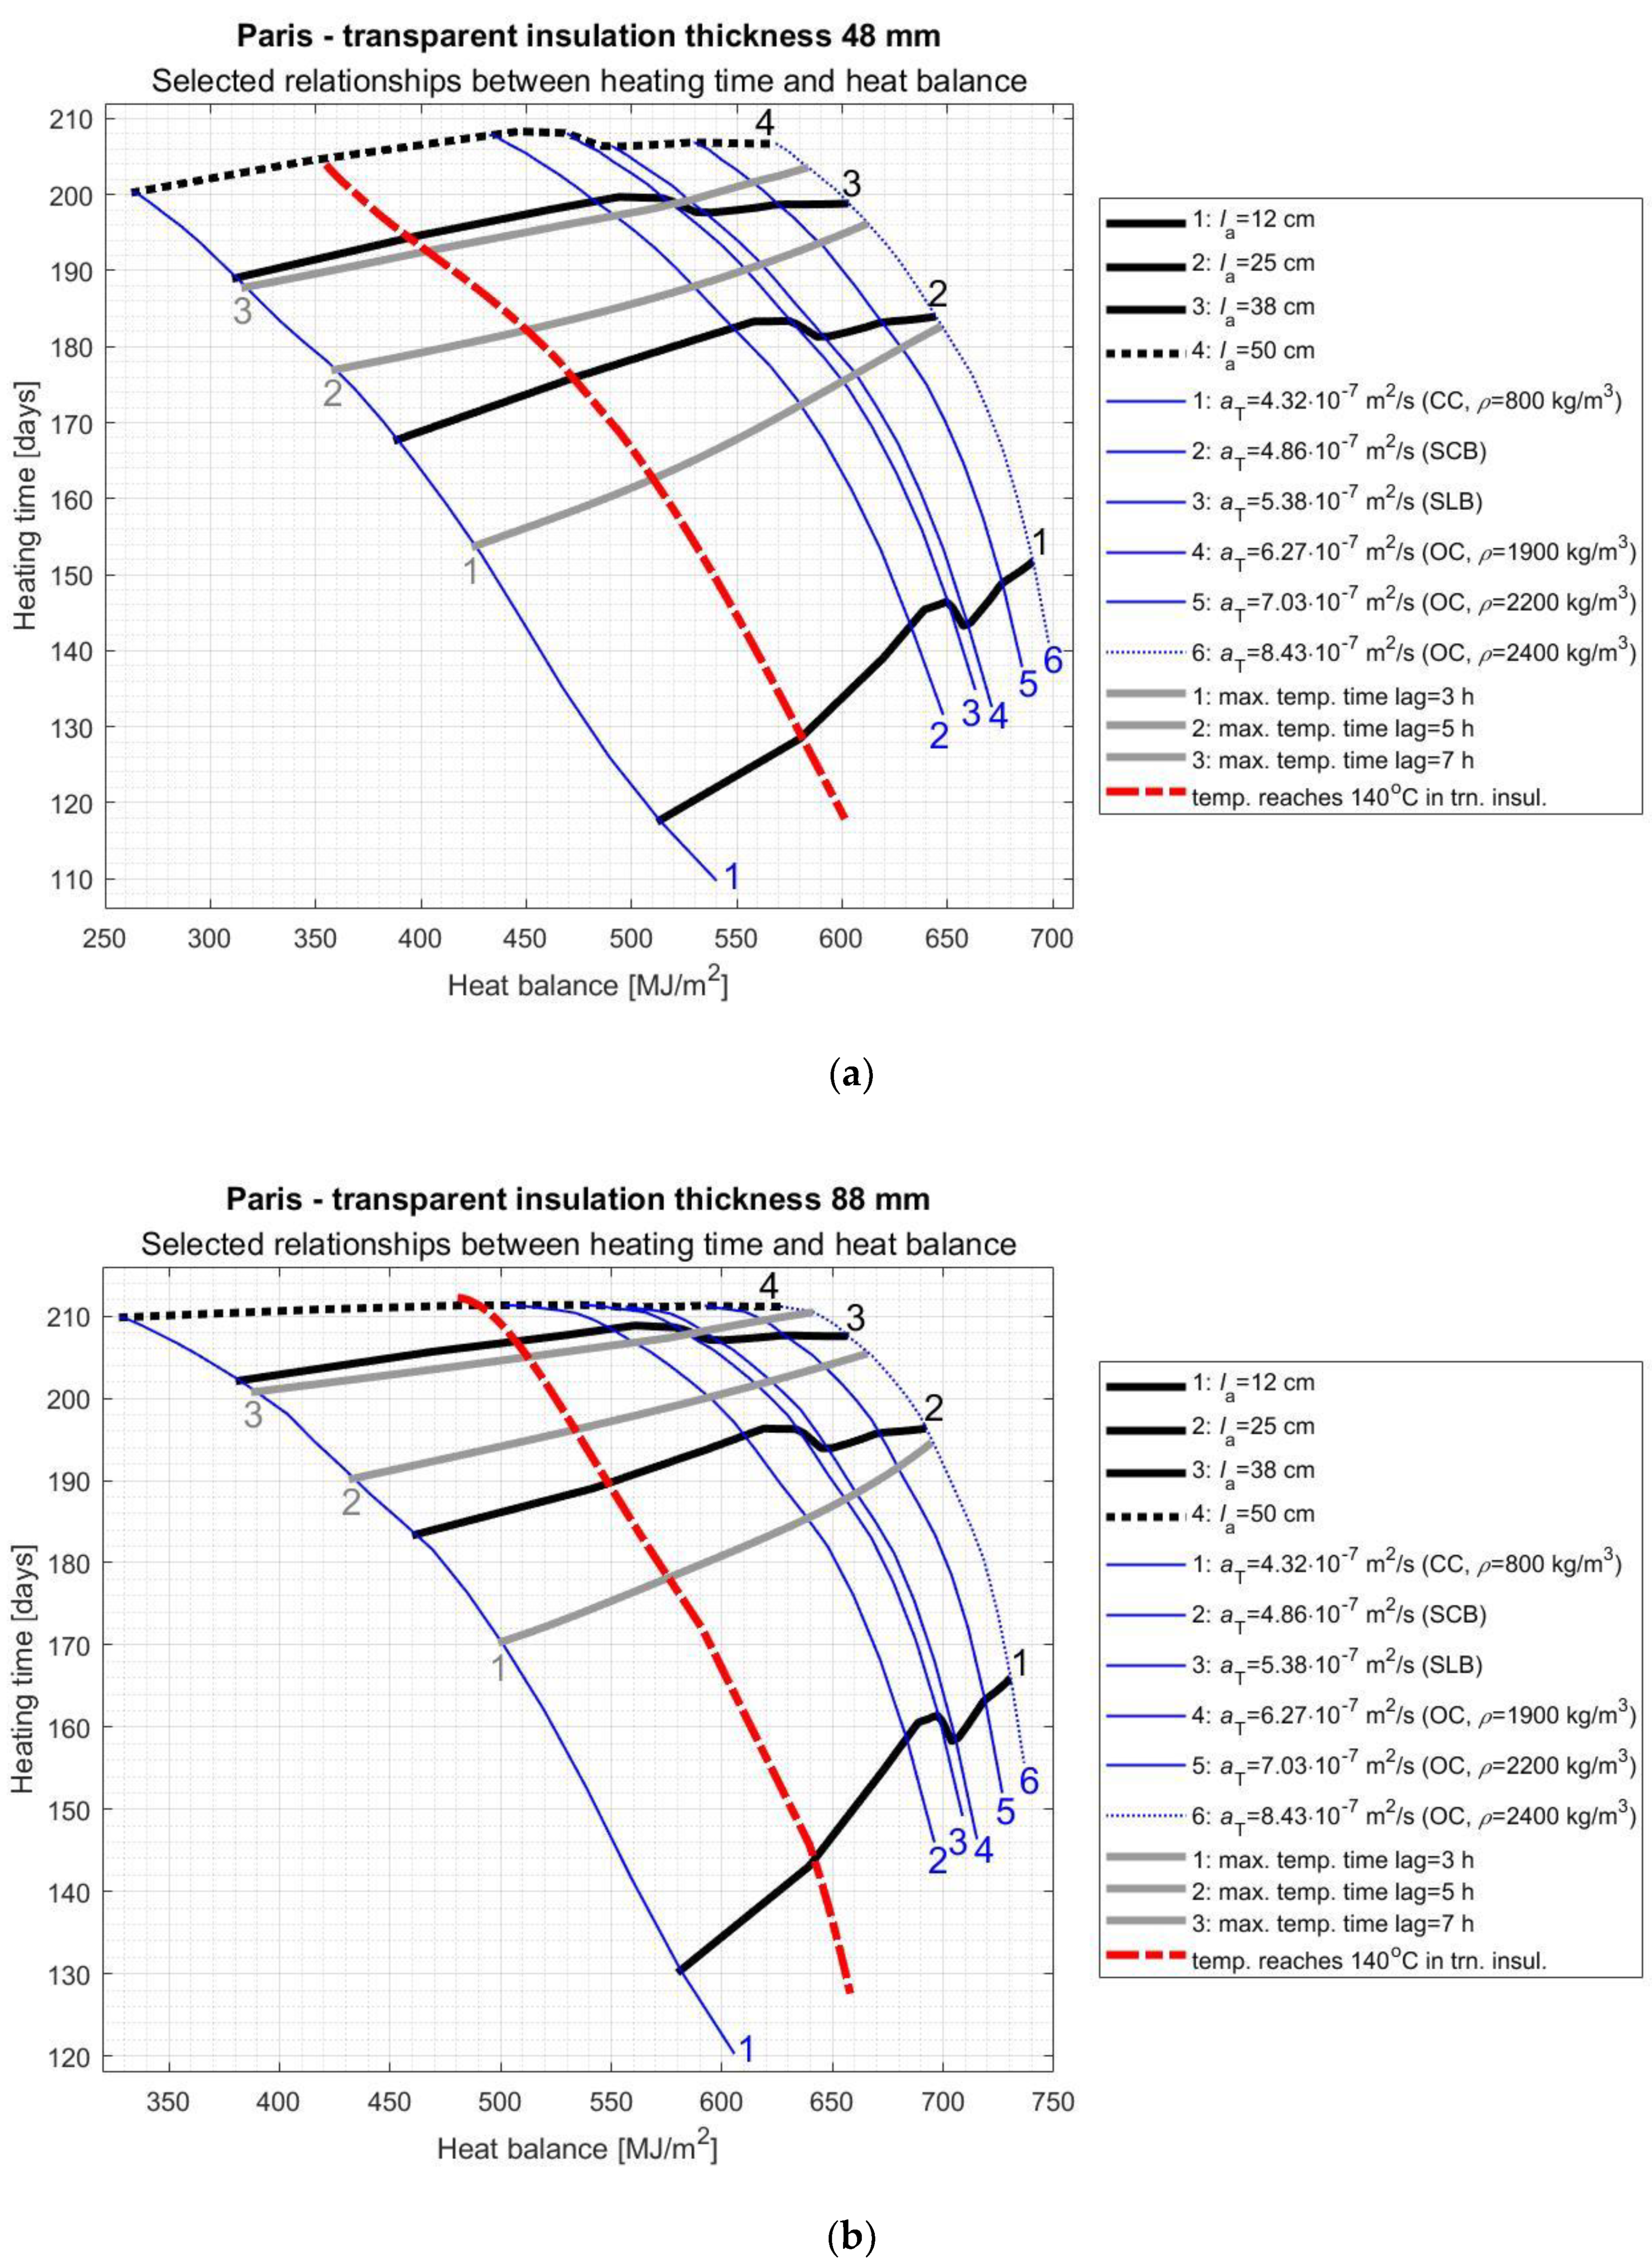
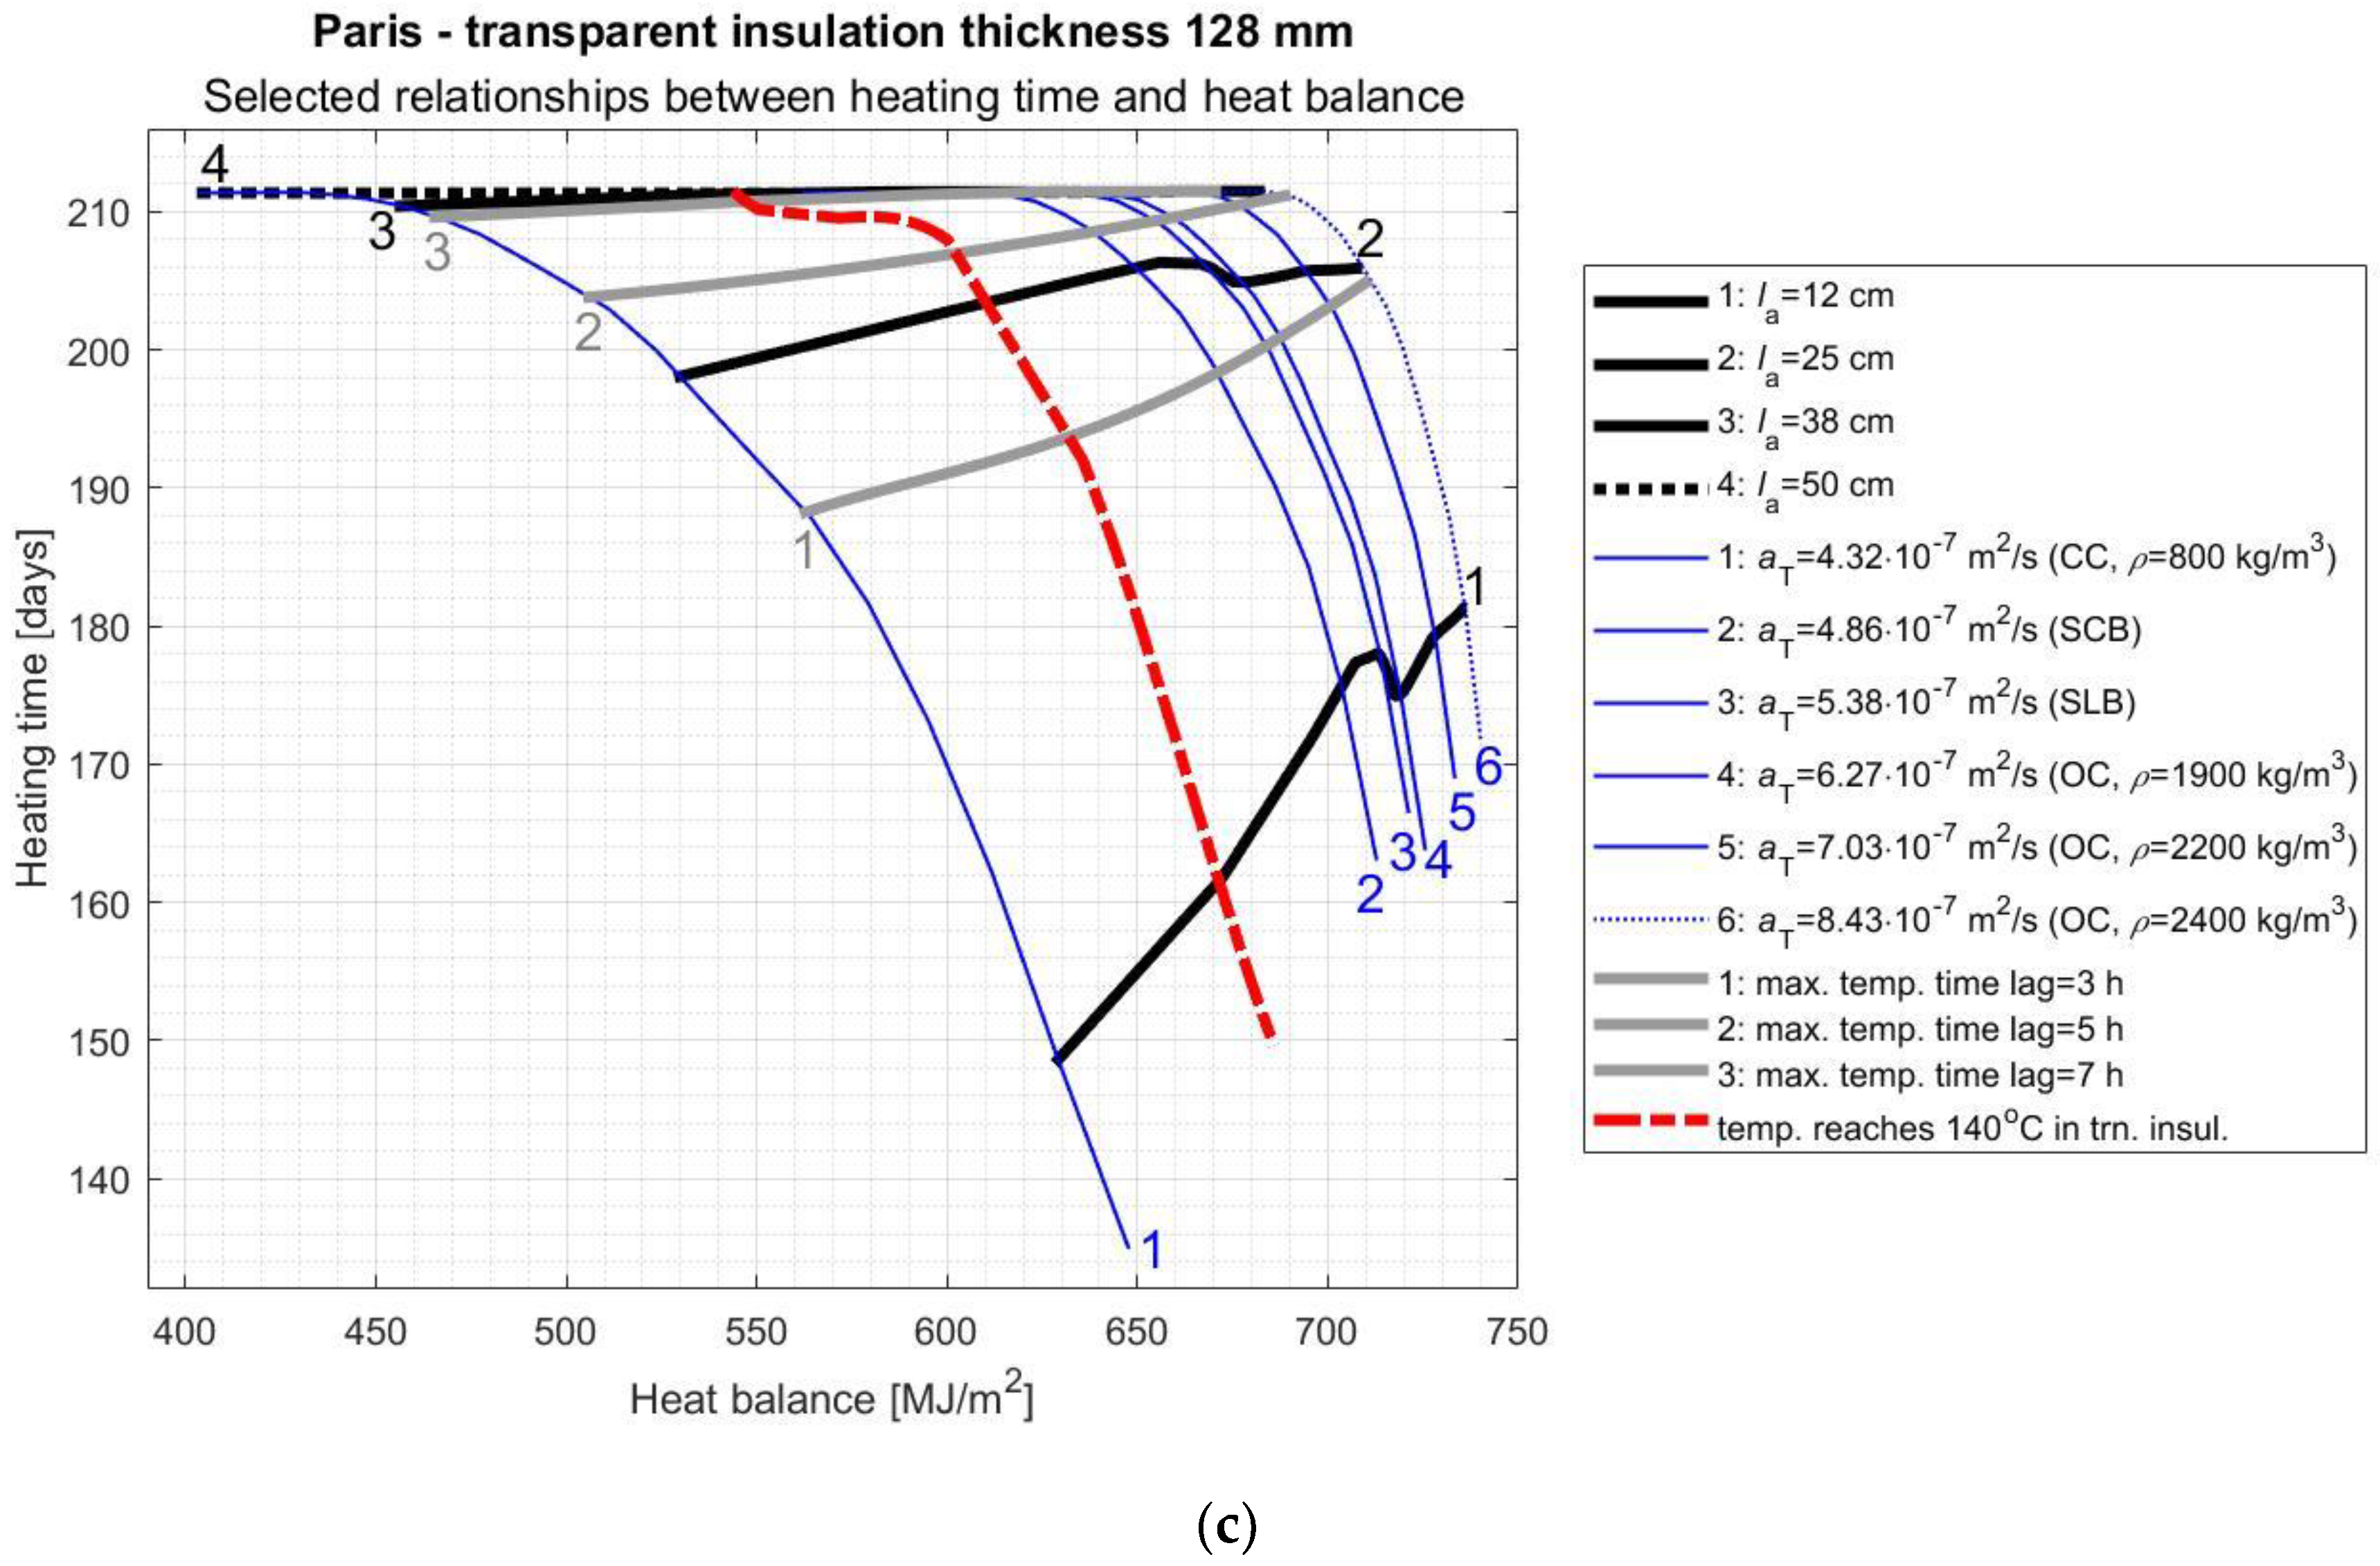
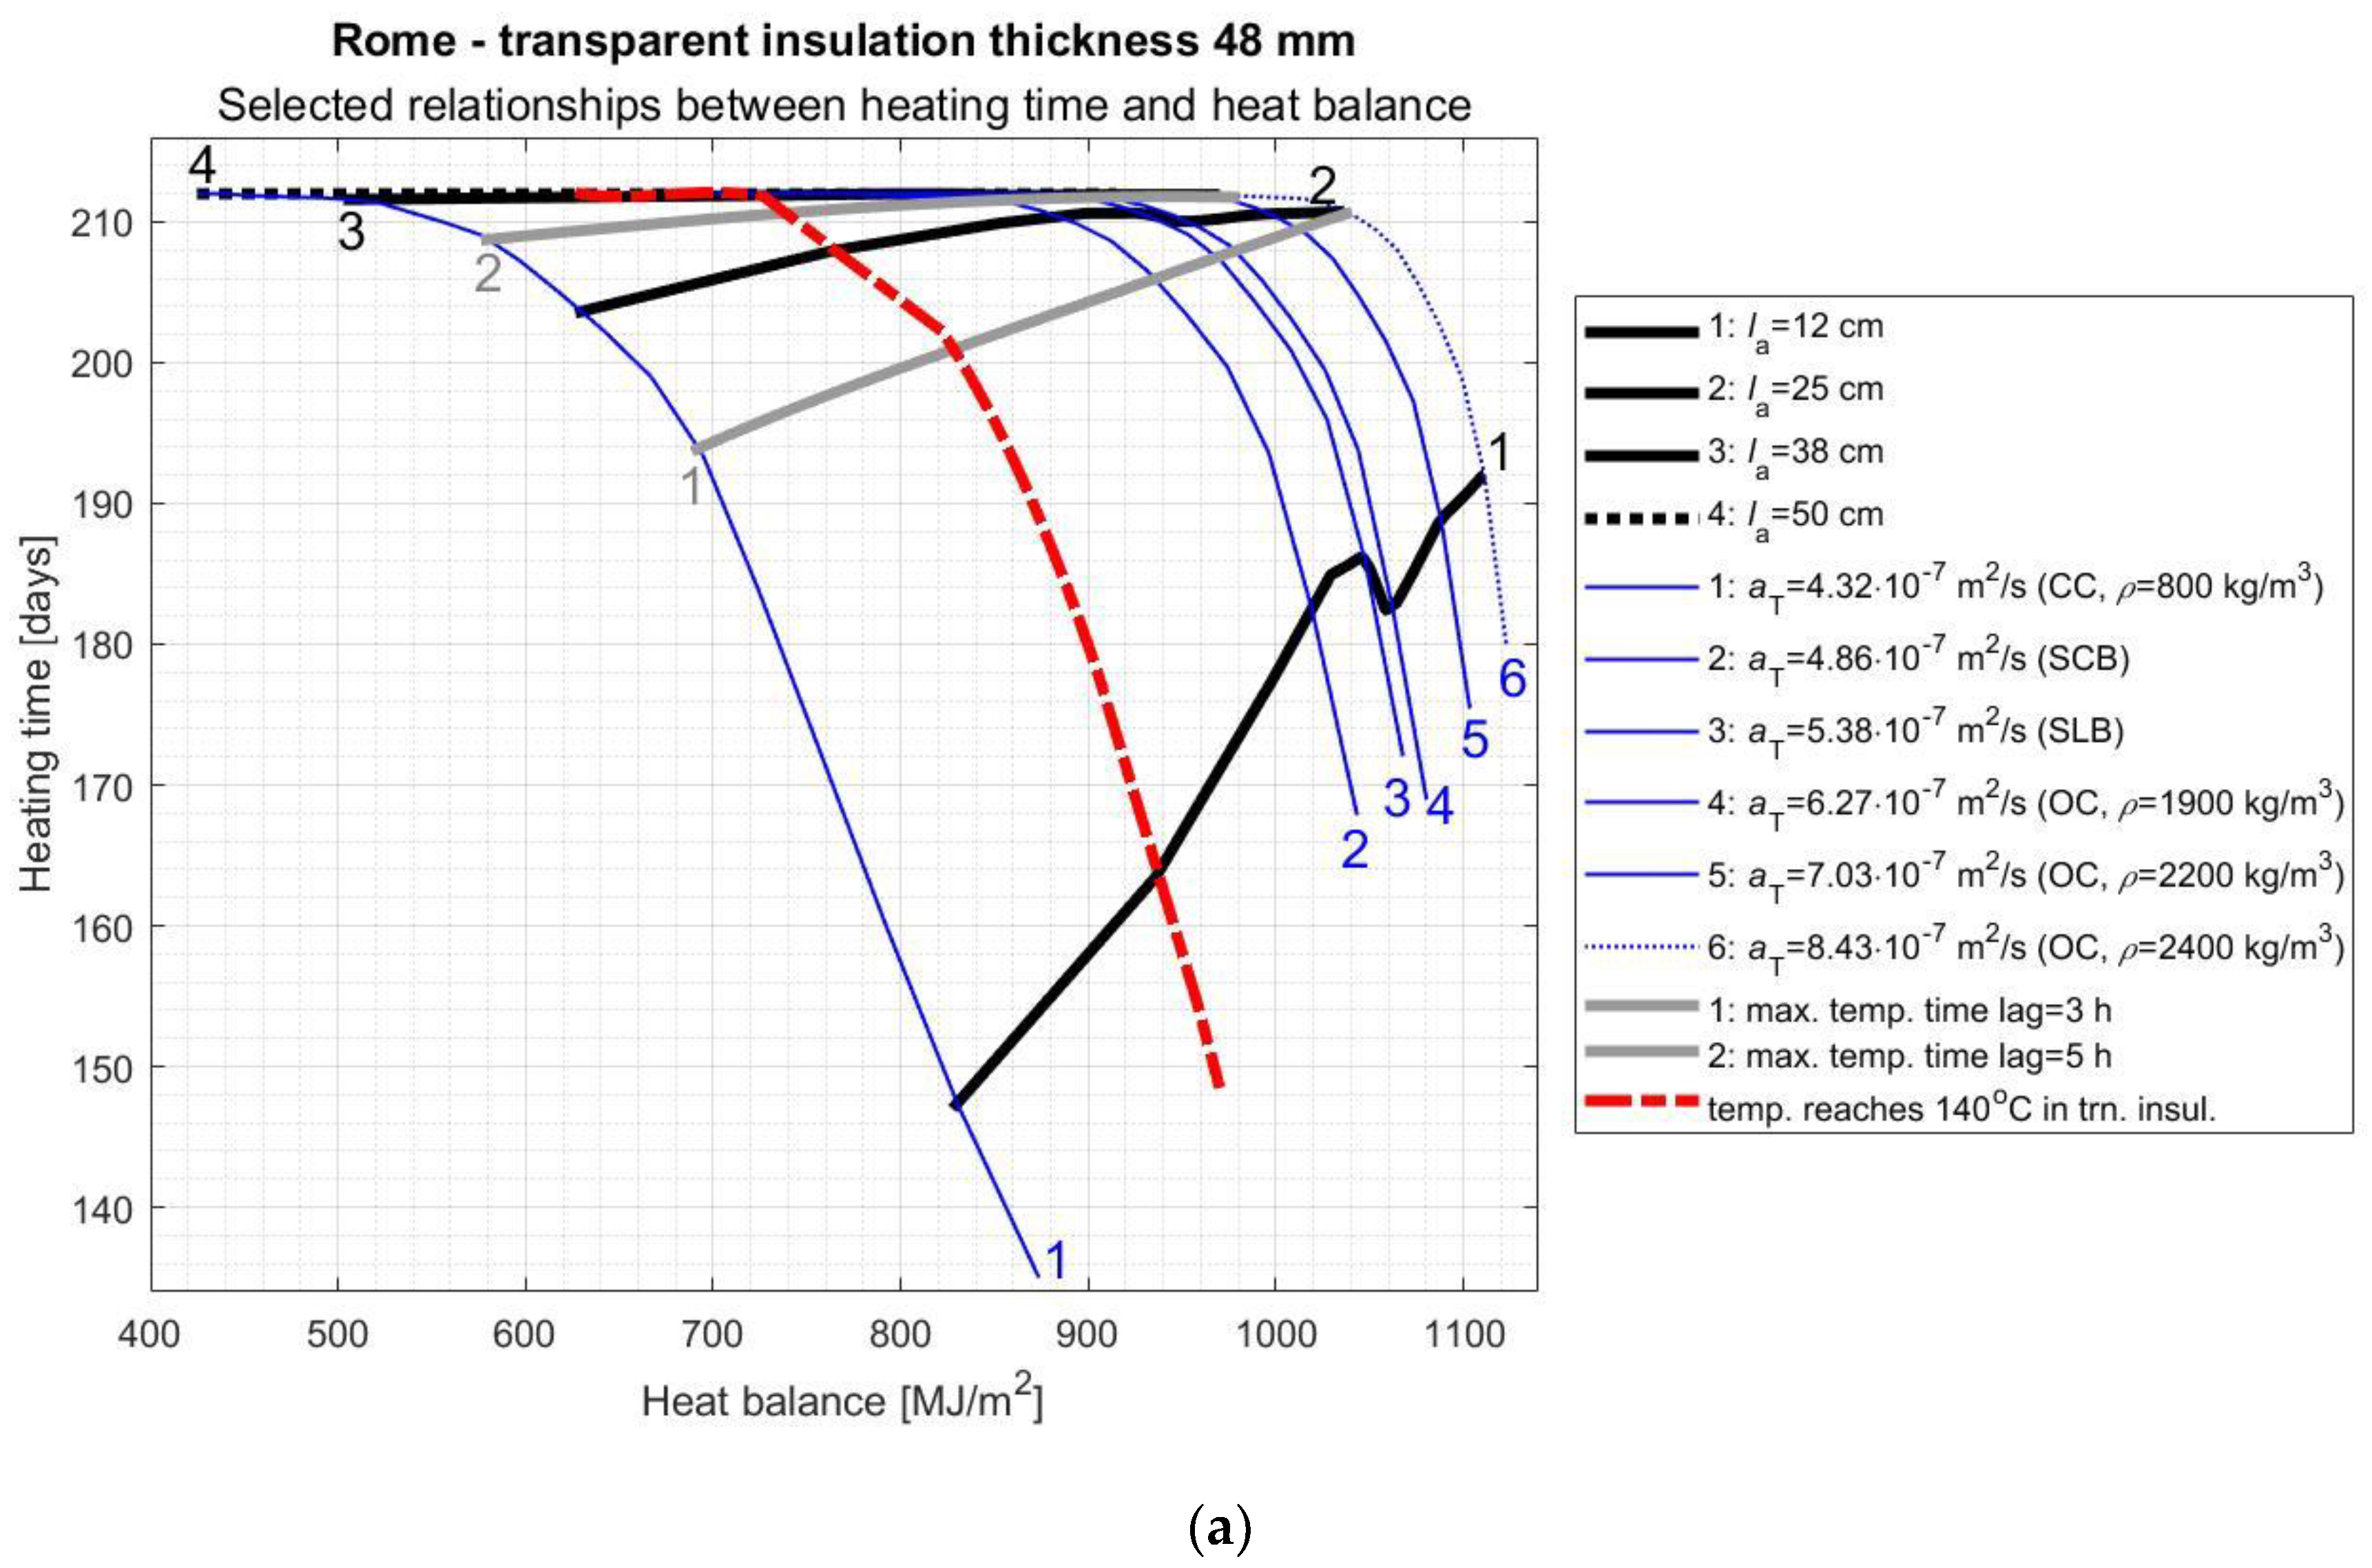
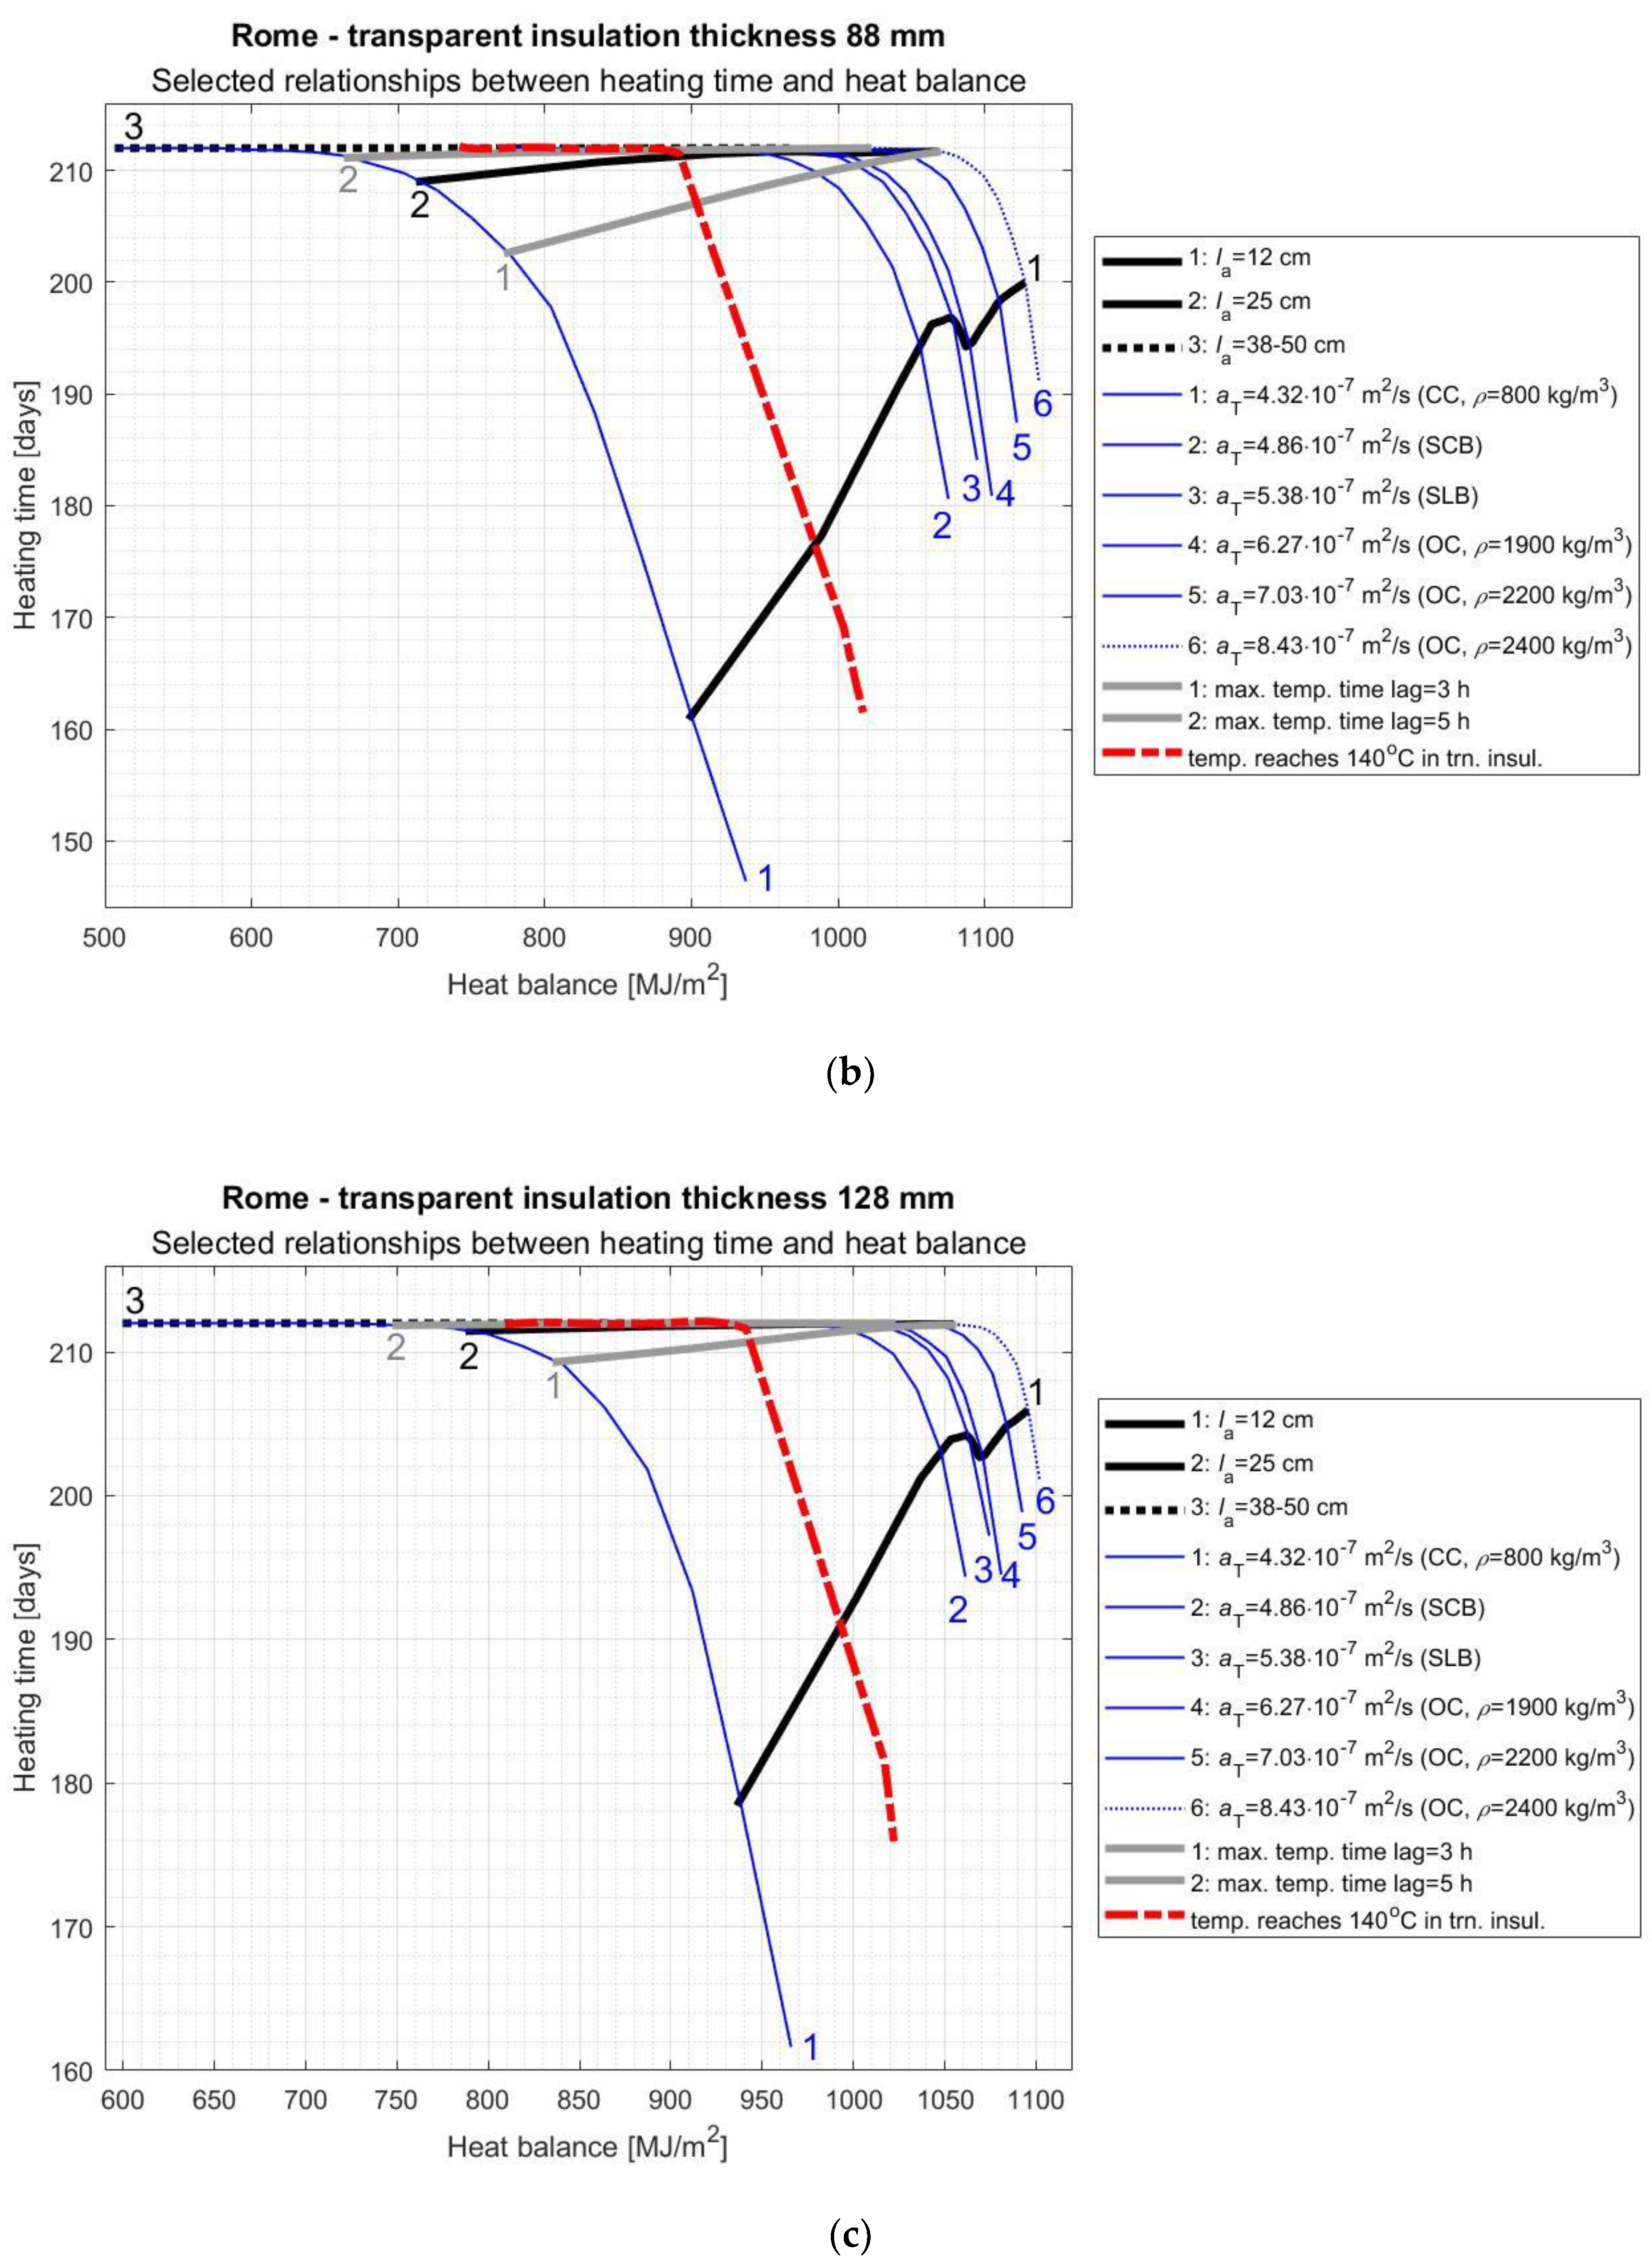
As it results from the above considerations, the proper selection of AL parameters and TI thickness is a complicated task and depends to a large extent on the specific climate in which the SW will be used. In order to facilitate this process, the authors of this study prepared graphs (
Figure 8,
Figure 9,
Figure 10 and
Figure 11) of the variability of the room heating time in function of the SW’s heat balance depending on the selected most important AL features. On these nomograms, the thick black lines correspond to different AL thickness values (
= 12, 25, 38, and 50 cm), the thin blue lines correspond to the individual materials specified in
Section 3, the grey thick lines correspond to different maximum temperature time lags (3, 5, and 7 h), while on the left side of the red dashed line there are solutions that are not acceptable due to overheating the TI.
On the basis of the above nomograms and based on the previous considerations, the authors proposed the following SW structural solutions for the individual locations:
Stockholm: TI—thickness 128 mm; AL—wall made of SLBs, thickness 25 cm; heat balance ~475 MJ/m2; heating time ~135 days; maximum temperature time lag ~4.1 h,
Warsaw: TI—thickness 128 mm; AL—wall made of SLBs, thickness 27 cm; heat balance ~470 MJ/m2; heating time ~189 days; maximum temperature time lag ~4.6 h,
Paris: TI—thickness 88 mm; AL—wall made of SCBs, thickness 27 cm; heat balance ~600 MJ/m2; heating time ~197 days; maximum temperature time lag ~4.7 h,
Rome: TI—thickness 48 mm; AL—wall made of SCBs, thickness 29 cm; heat balance ~840 MJ/m2; heating time ~211 days; maximum temperature time lag ~5.0 h.
When selecting the AL parameters for three different TI thickness values (48, 88, and 128 mm), the following principles were followed:
Adopting the lightest possible AL material for which the criterion of not exceeding 140 °C in the TI is met;
Adopting the smallest possible AL thickness for which the assumed maximum temperature time lag is met.
For this reason, the material thickness values adopted are theoretical ones which may not correspond to the actual dimensions of the masonry elements available on the market in a given region. The estimated values of AL parameters were read on the basis of the nomograms presented in
Figure 8,
Figure 9,
Figure 10 and
Figure 11, and then the thickness of the AL was specified using
Figure A1c,
Figure A2c,
Figure A3c,
Figure A4c,
Figure A5c,
Figure A6c,
Figure A7c,
Figure A8c,
Figure A9c,
Figure A10c,
Figure A11c and
Figure A12c. When selecting the AL parameters, the following principle was also followed: not to use the solutions that are too close to the area on the nomograms where there is a risk of excessive temperature increase in the TI (i.e., that are too close to the red dashed line). In the case of Warsaw, the above rules were slightly changed, and it was decided (due to relatively low temperatures in Warsaw in January) to use SLBs in order to increase the heat gains in the building. Of course, the designer, depending on the technology used for erecting a building, the preferred time lag of temperature wave in a SW, and the required heat balance of a SW, may propose other wall material and geometric solutions for the individual locations based on the diagrams presented in this work.
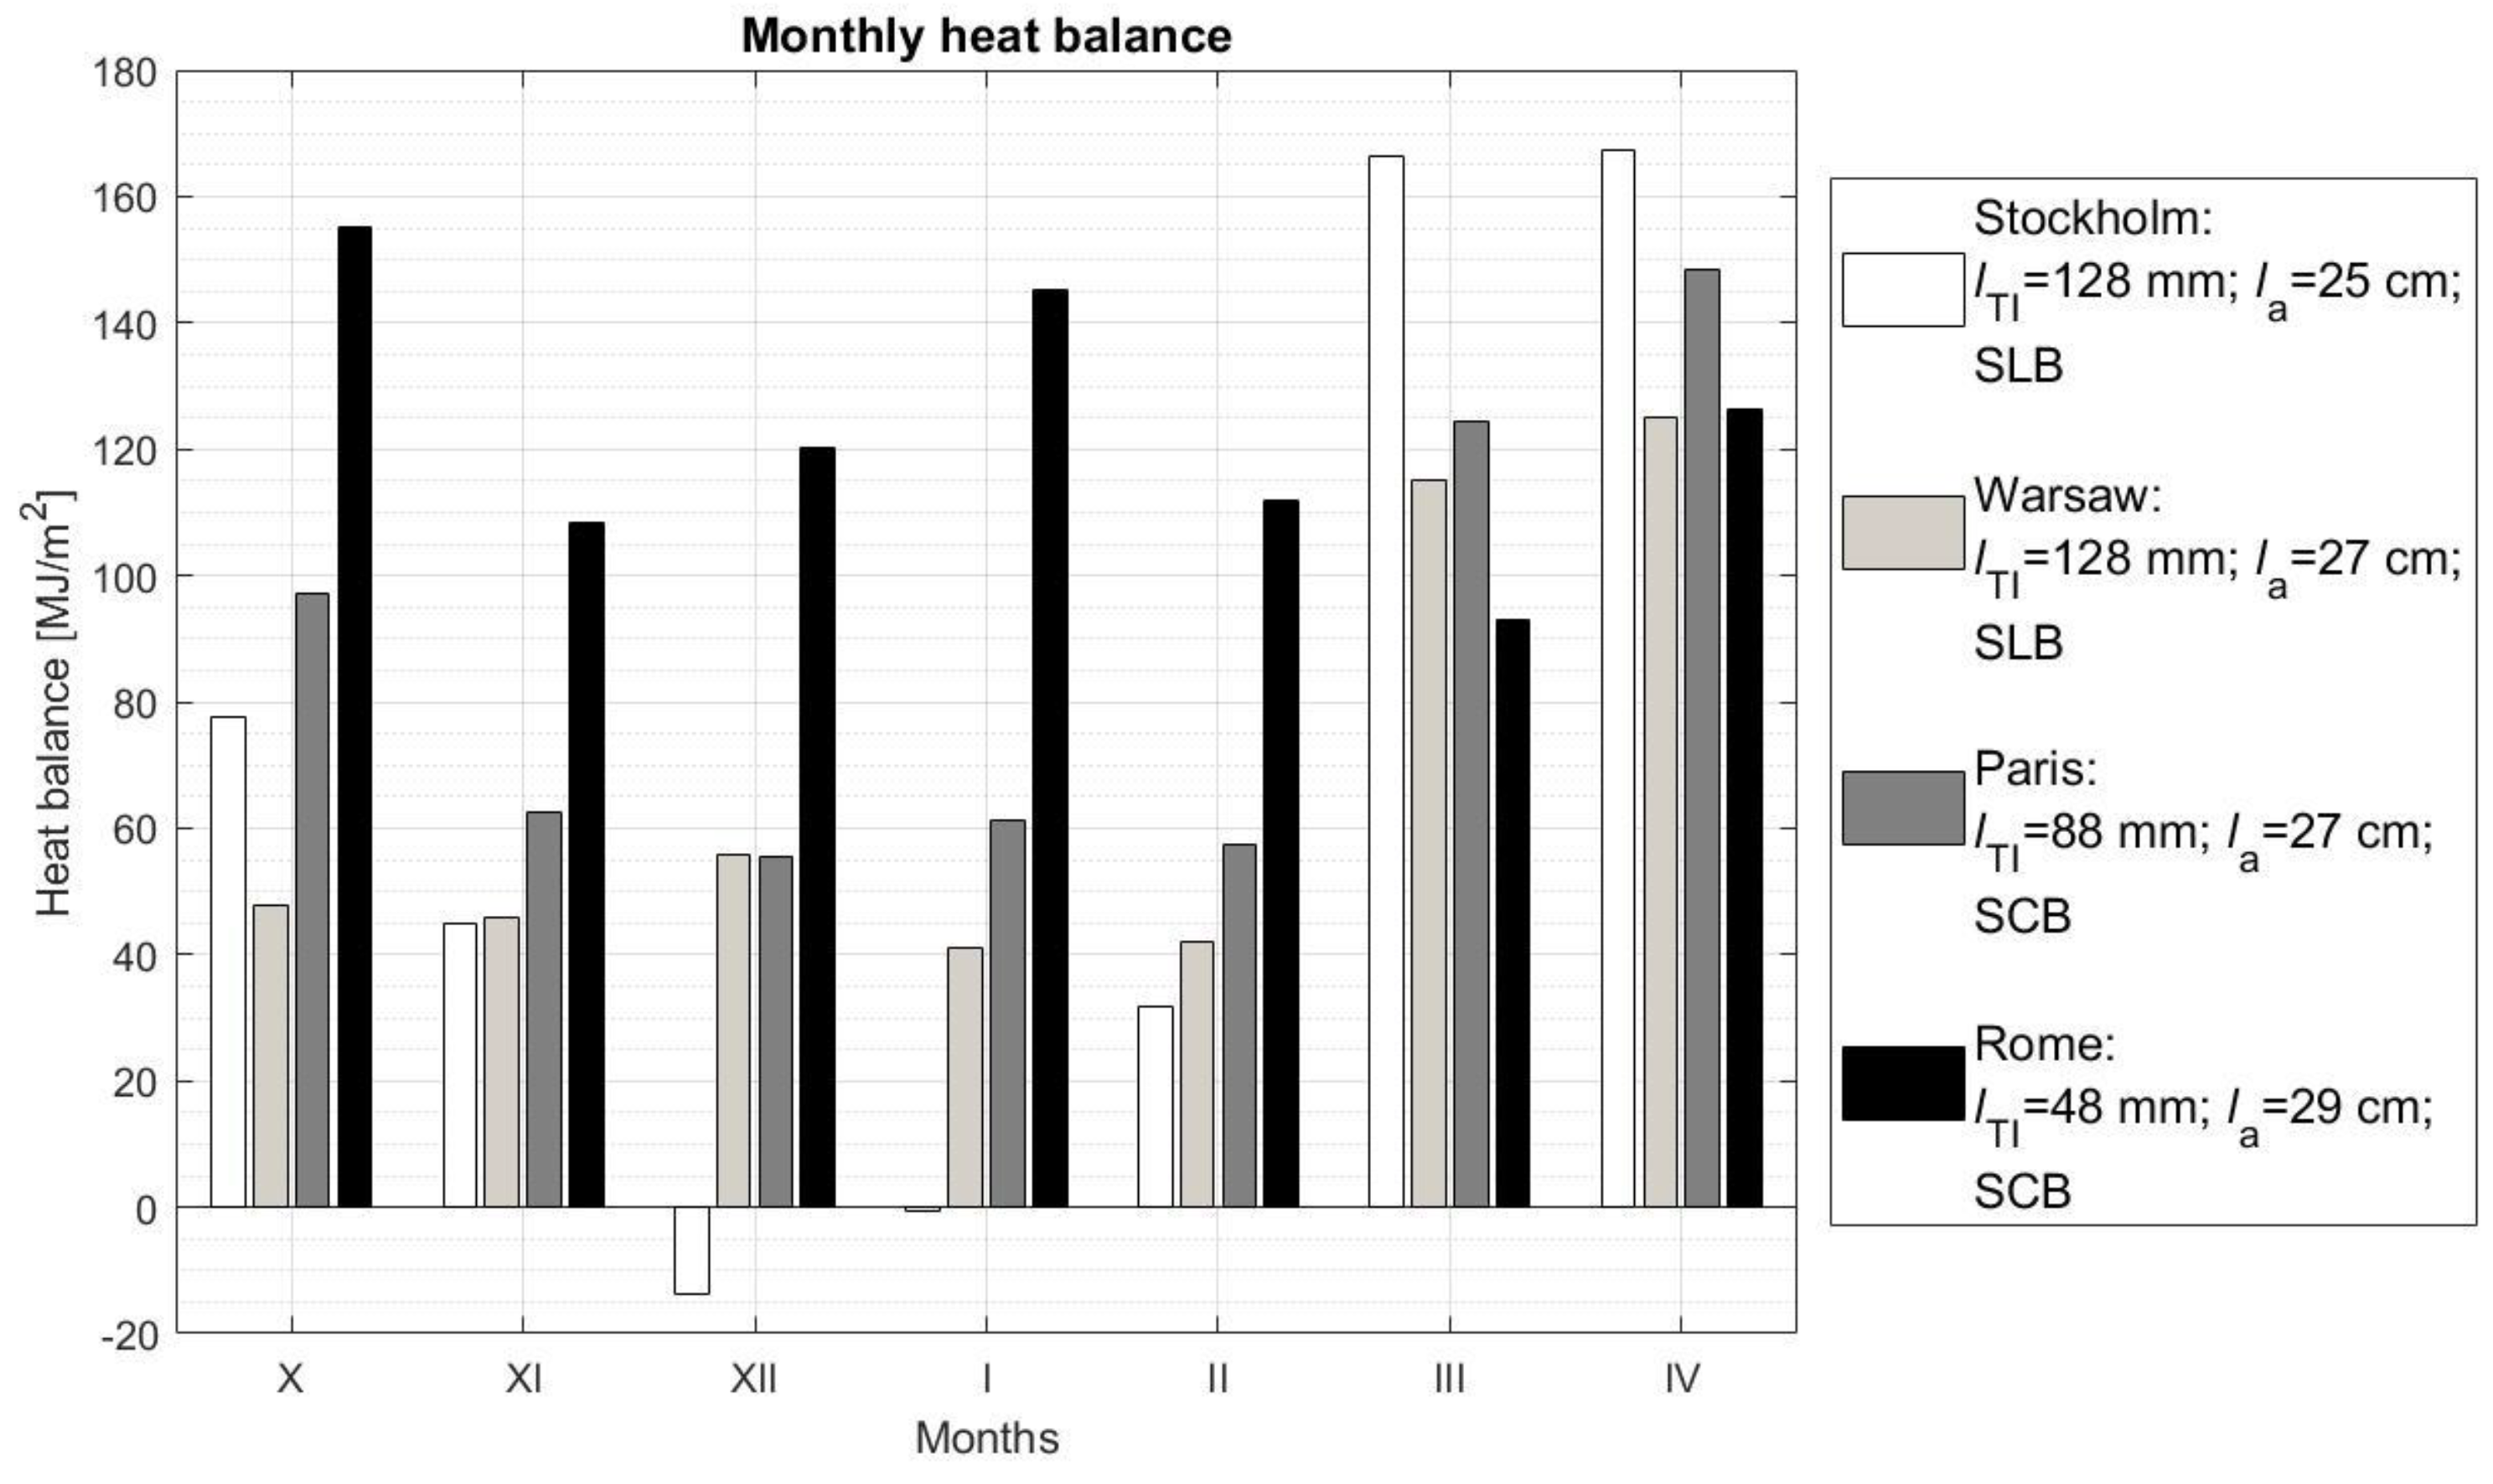
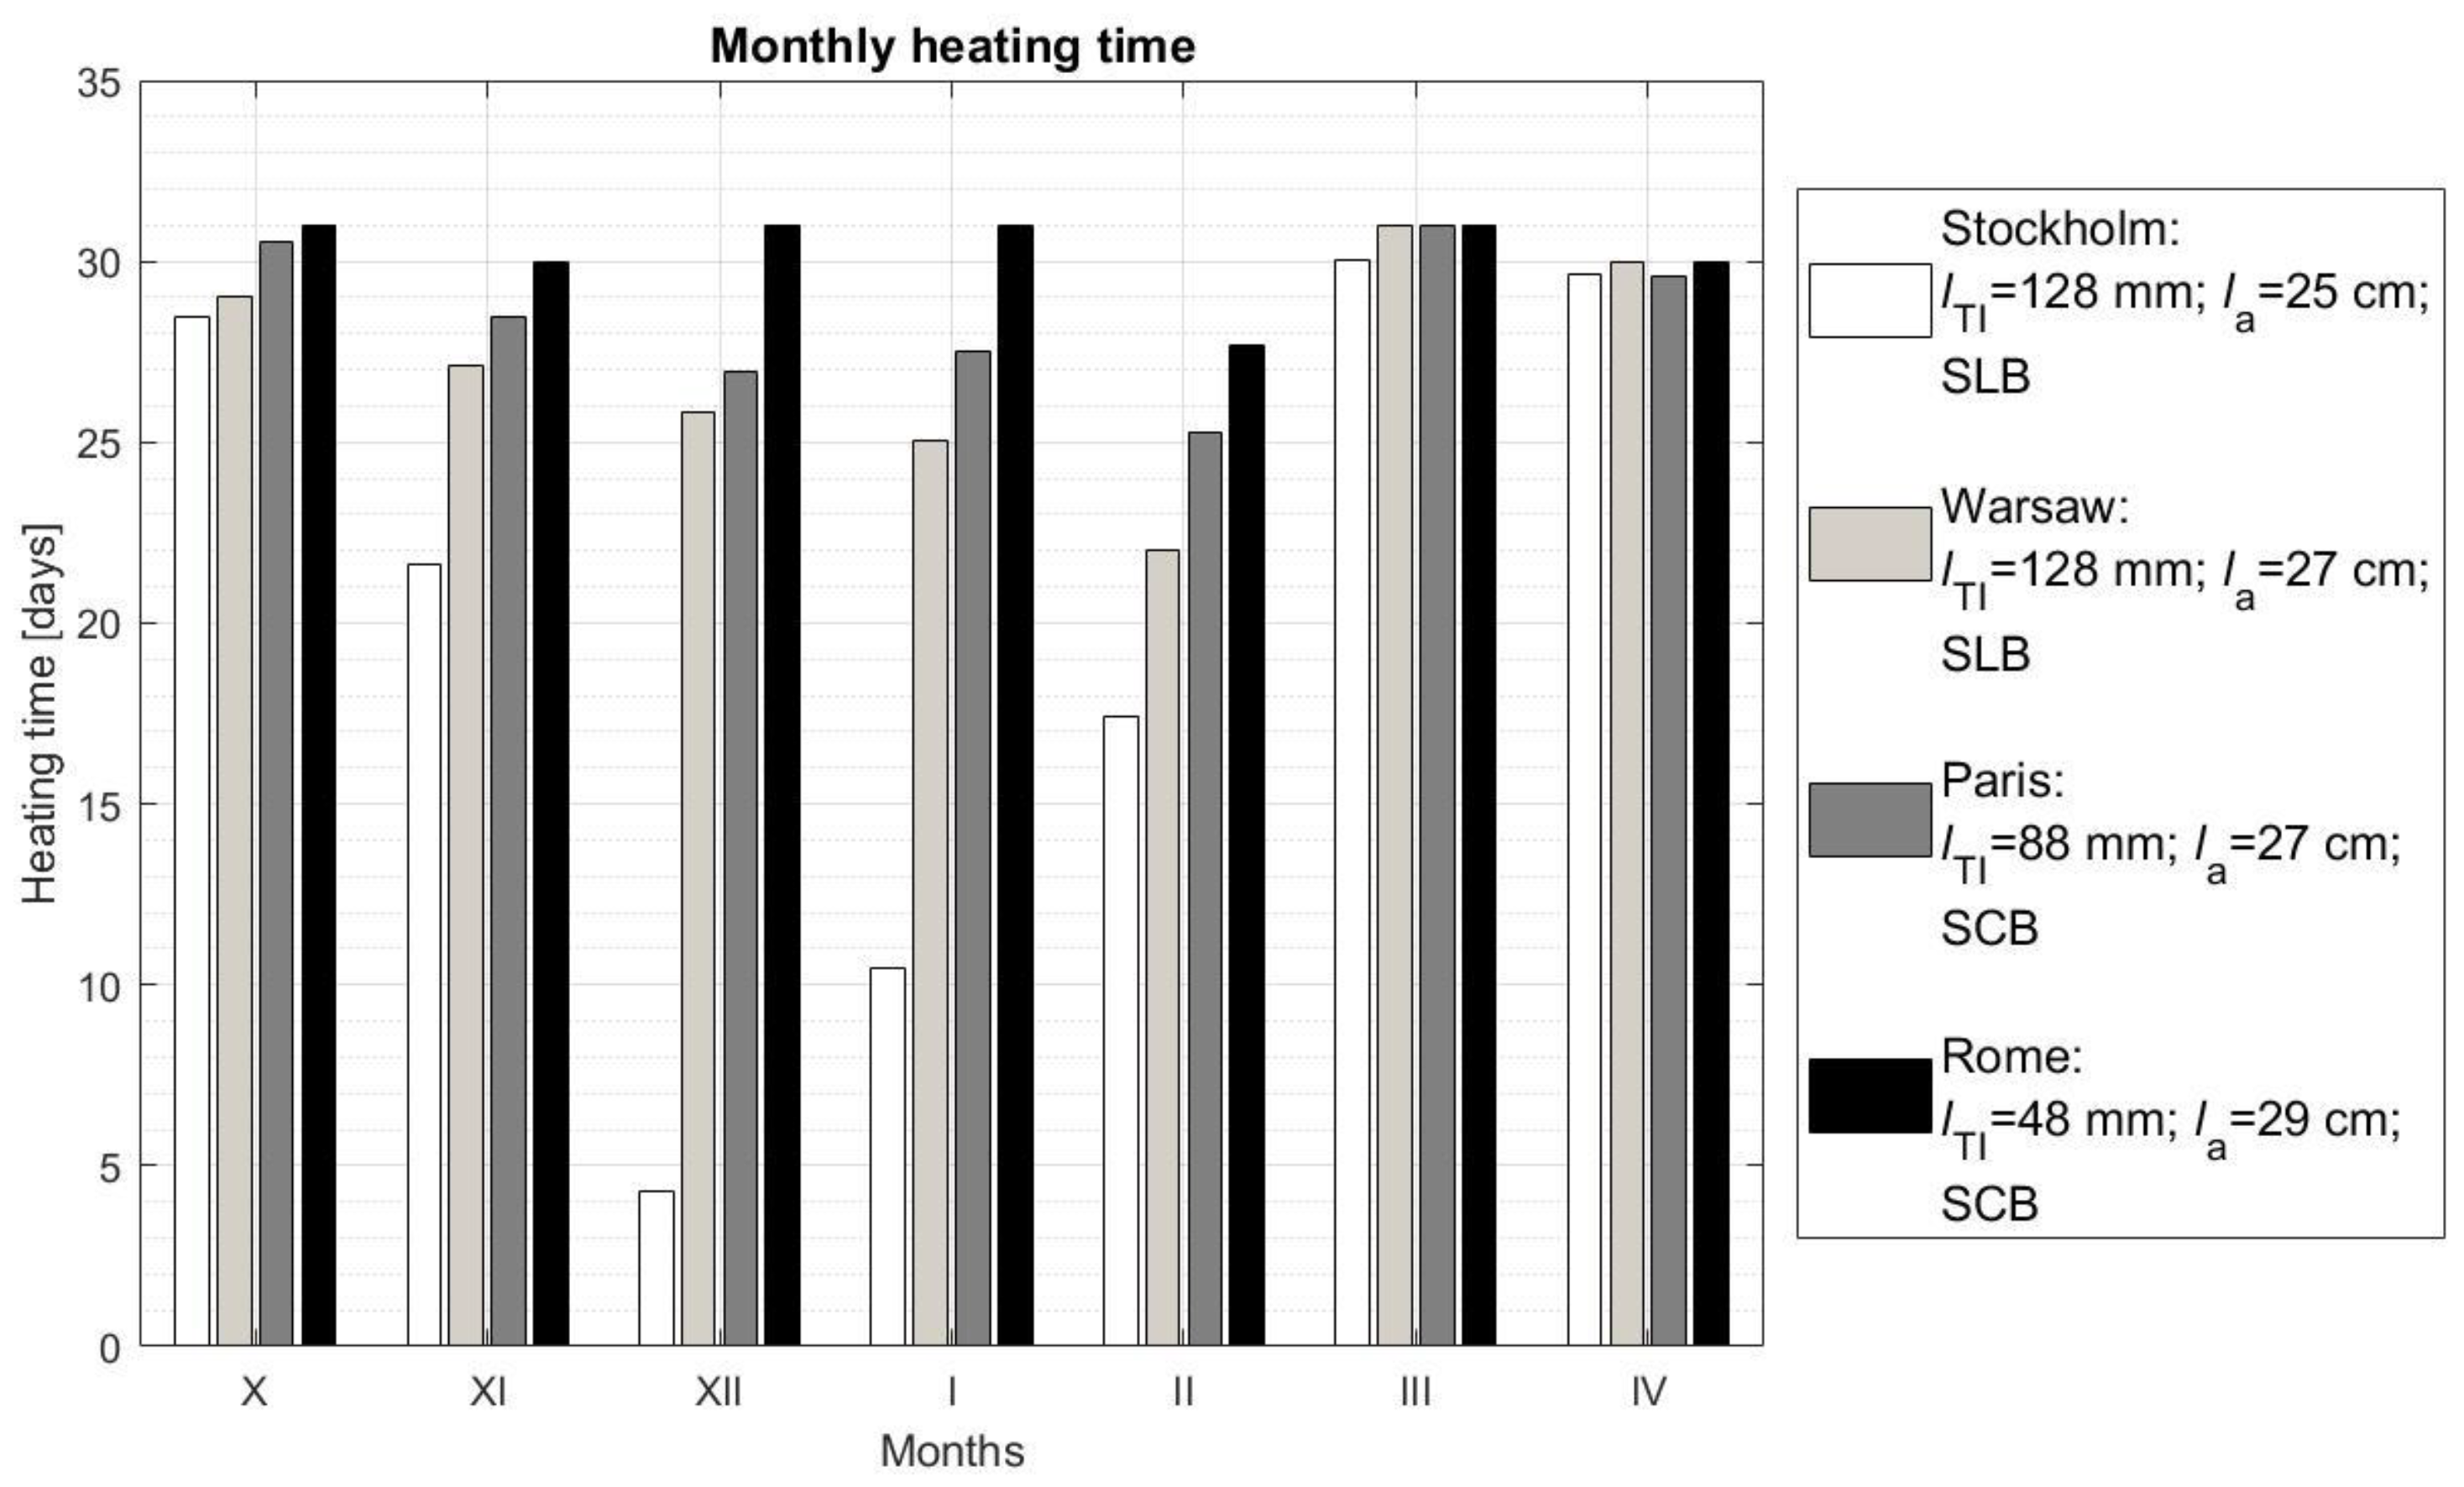
A comparison of monthly heat balances and heating times for the SWs are presented respectively in
Figure 12 and
Figure 13 in the case of AL parameters and materials proposed for the considered locations. As in the case of SW with TI, there is a risk of excessively high temperatures on the internal surface of the wall, and
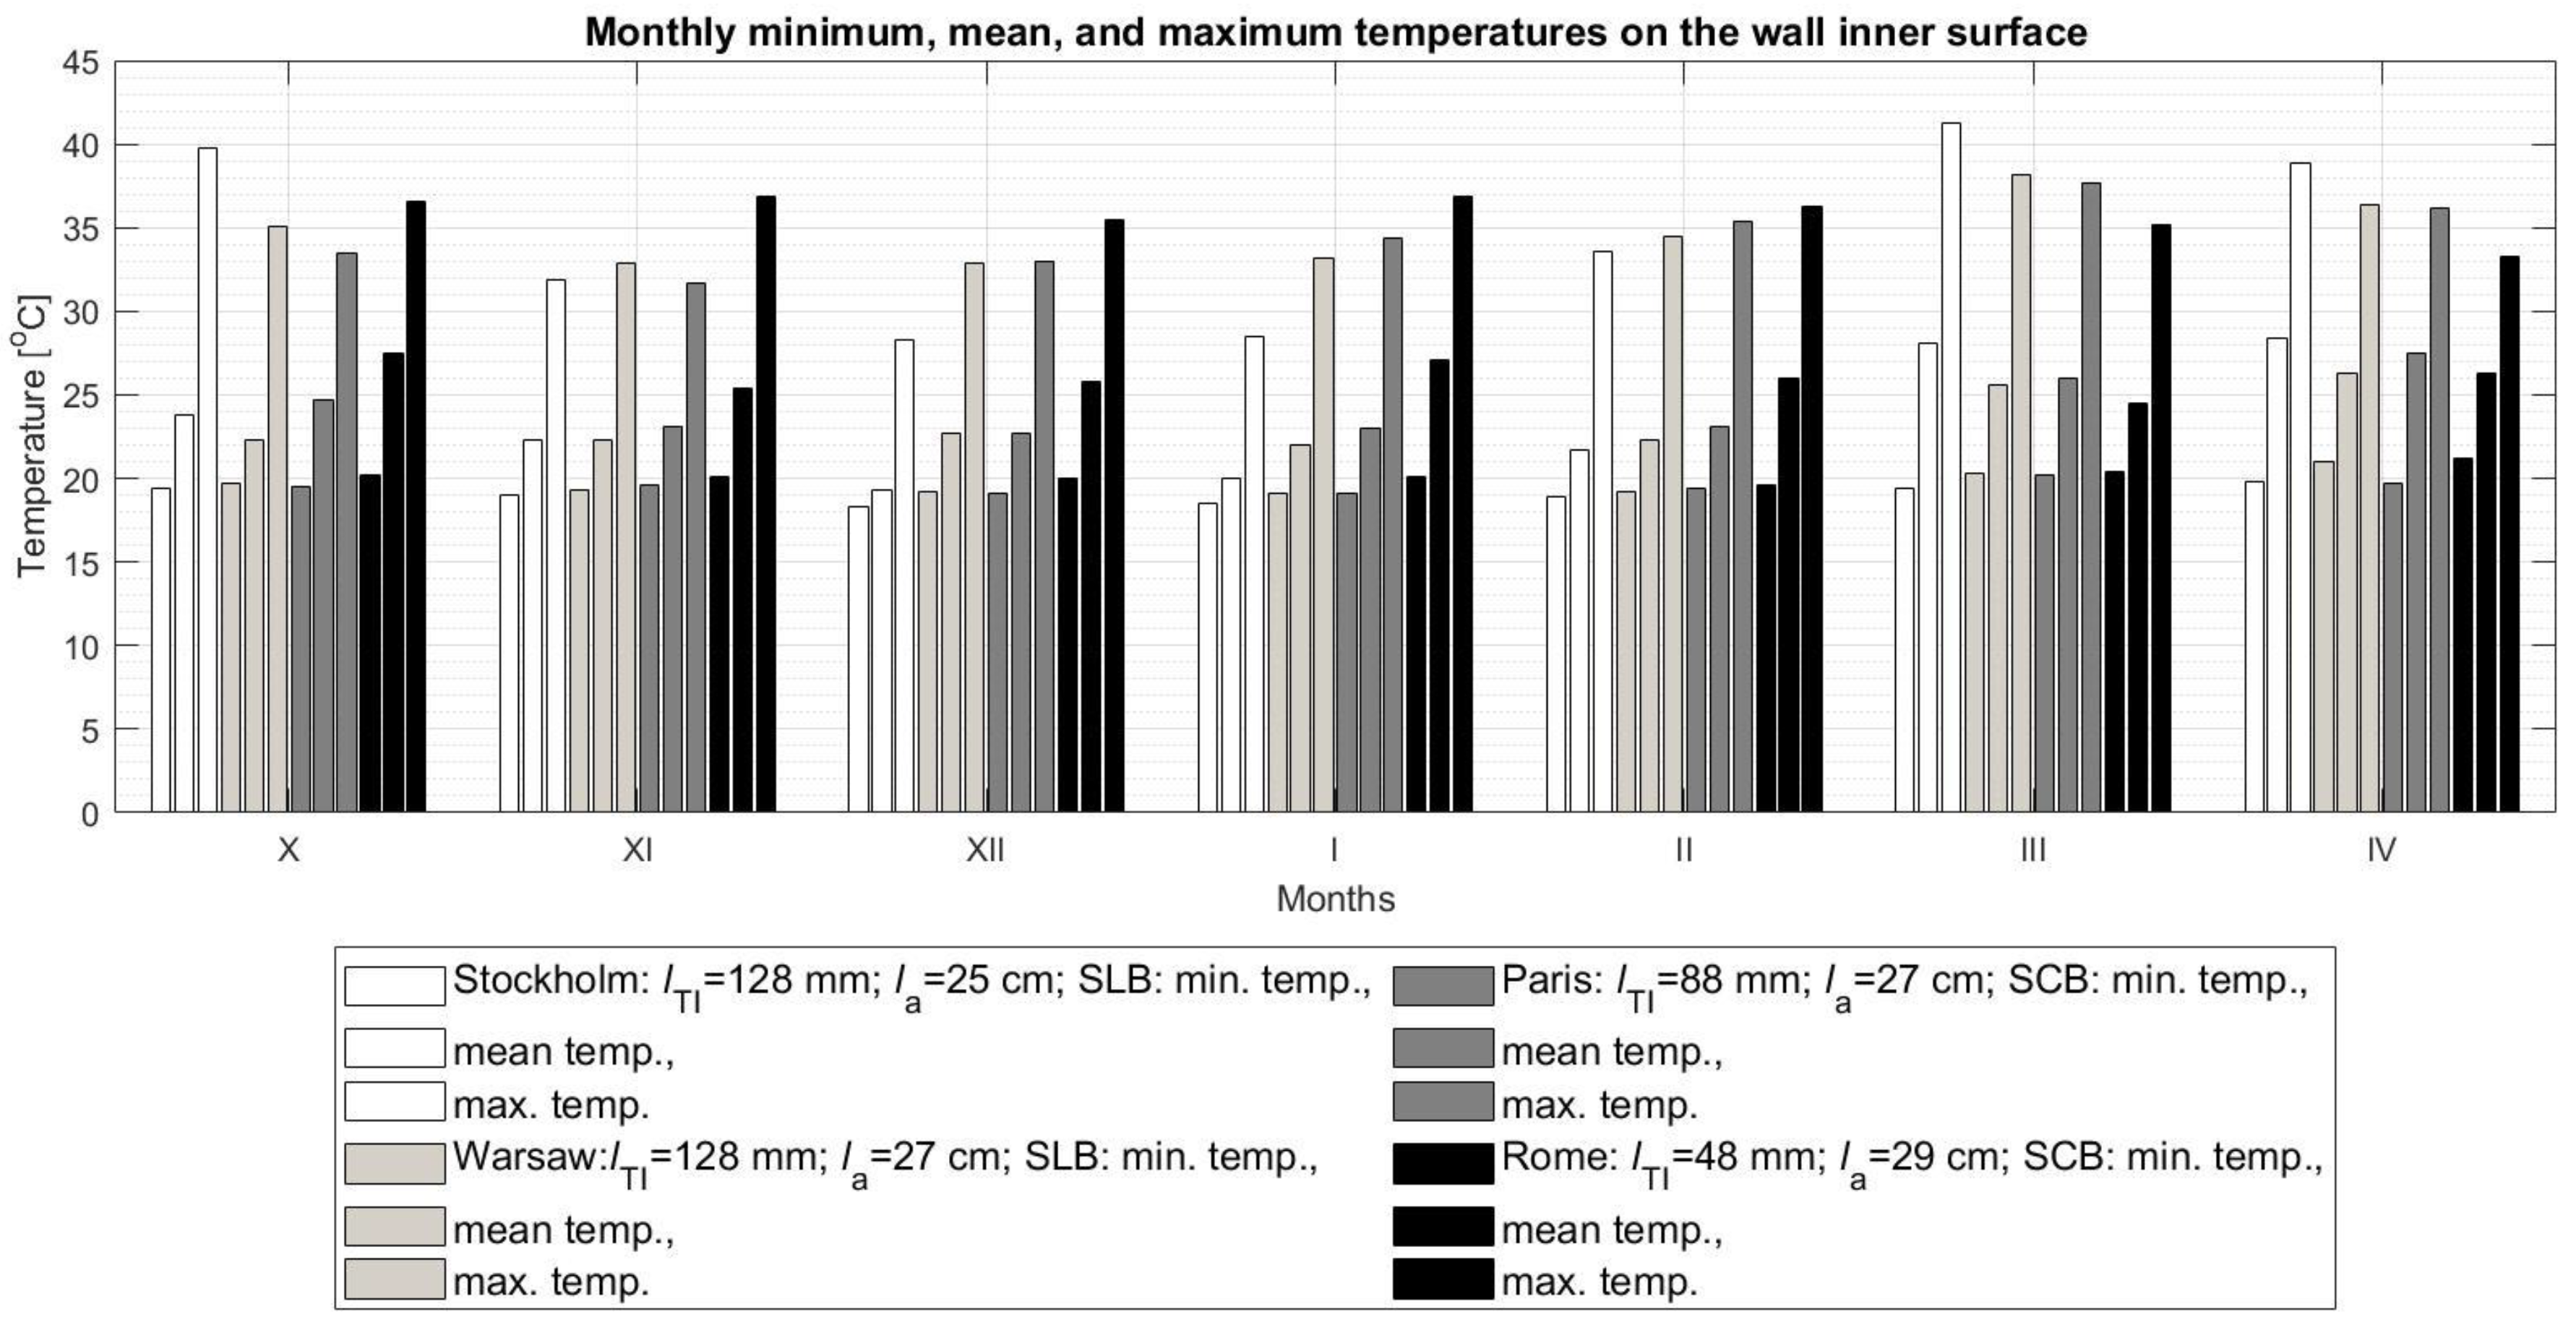
Figure 14 presents additionally the minimum, mean, and maximum temperature of the SW internal surface in the individual months of heating period for all considered locations. On the other hand,
Figure 15 presents a verifying comparison of monthly balances for Stockholm and Rome, calculated numerically and using the quasi-stationary standard method [
31].
As shown in
Figure 12, the SWs with proper AL parameters and TI thickness show a positive heat balance in almost all months of the heating period regardless of their location. The only exception to this is the wall located in Stockholm during December and January. However, regardless of the fact that the heat balance of the SW operating in Stockholm during these months is negative, there are also periods when it constitutes a heat source in the room as shown in
Figure 13 (in December the total heating time is about 4 days, and in January—over 10 days).
Figure 13 also shows that the SW located in Rome will heat up the room for practically the entire heating season (211 days out of 212 days of the heating season). In the case of this wall, in the seasonal climate transition periods, it may be advisable to temporarily lower the TI rolling shutters due to excessive heat gains, especially on days with high insolation in October and April. Also for the SW located in Paris, the time during which it acts as a heat source is quite long (93% of the heating period), but the heat gains obtained by this wall are usually much lower than in the case of the SW located in Rome. The heating time of the SW located in Warsaw is comparable to the heating time of the SW operating in Paris (89% of the heating season); however, heat gains obtained by this wall are about 22% lower than in the case of the SW in Paris. The SW located in Stockholm has the shortest heating time (64% of the heating period), but its heat balance is slightly higher than that of the SW in Warsaw. It can be concluded that SWs in buildings located in the north of Europe will perform their function well, especially during the seasonal climate transition periods (autumn, spring). SWs with TI located in the central regions of Europe will also heat rooms in winter, but their heat gains will not be too high. In contrast, SWs located in southern Europe can perform their function for the entire heating period.
Based on
Figure 14, it can be concluded that the mean monthly temperature of the internal surface of the SWs in all locations does not usually exceed 26 °C. The months: March (28 °C) and April (28.3 °C) in Stockholm; April (26.2 °C) in Warsaw; April (27.6 °C) in Paris; and October (27.5 °C), January (27 °C), and April (26.2 °C) in Rome are here the exceptions. Since the approximate perceived temperature can be calculated as the arithmetic mean of the air temperature in the room (20 °C) and the radiant temperature of wall, it can be concluded that in the vicinity of the designed SW, the thermal conditions will be close to the conditions of thermal comfort which range from 20 °C to 25 °C in the heating period, while it ranges from 23 °C to 26 °C in summer [
53]. Although the temperature on the internal surface of the walls may temporarily increase in the analyzed cases up to 41.3 °C (the SW located in Stockholm in March), it is still the one not exceeding the temperature range acceptable for use in water wall radiators (from 35 °C to 45 °C).
