Abstract
The operating temperatures of photovoltaic (PV) modules can be impacted by the selection of specific packaging materials, e.g., backsheets and encapsulants. This research focuses on the evaluation of operating temperature reduction of one-cell modules by comparing conventional Tedlar/polyester/Tedlar (TPT) backsheet with novel thermally conductive backsheets (TCBs) materials. A large number of one-cell modules with two TCB types (TCB_A and TCB_B) and baseline TPT type were fabricated and installed in three different climatic conditions of the hot-dry desert in Arizona (high and low wind speed locations) and North Carolina (temperate with low wind speed location). In this study, these two TCBs were compared with conventional TPT backsheet in terms of performance, lifetime and levelized cost of energy (LCOE). The field results were analyzed for thermal performance of TCBs compared to TPT at three sites for two and half years. This study concludes that the thermal and electrical performances of the PV modules can be improved by using TCB_A in hot and dry climate sites and TCB_B at temperate climate sites. Therefore, the lifetime of TCB-based modules is expected to be higher than TPT-based modules. Using backsheet-specific power degradation levels and assuming the same cost for both types of backsheets, the LCOE of modules using TCBs is estimated to be lower than that of TPT.
1. Introduction
Improving photovoltaic (PV) module performance is one of the paramount research interests in the industry. Lowering the PV module temperature is one of the best ways of improving the PV module performance and energy output, as it increases efficiency, reduces the degradation rate and increases lifetime, and hence, reduces the levelized cost of energy (LCOE). The performance parameters of PV modules are reported at 25 °C using standard test conditions (STC) in the form of nameplate rating. When PV modules are installed outdoors various environmental factors (ambient temperature, irradiance, wind speed etc.) will impact their operating temperatures, often much higher temperature than the rated value of 25 °C. In hot climatic conditions, the PV modules are obviously expected to operate at temperatures much higher than 25 °C. There are many backsheet degradation mechanisms already studied in the industry through outdoor exposure [1,2], and higher operating temperature-induced early degradation mechanisms can be one of the critical, because many of these degradation mechanisms in PV modules are thermally sensitive [3]. Thus, the increase of module temperatures can increase the temperature stress-associated degradation mechanisms, including encapsulant discoloration and thermomechanical fatigues and thereby higher acceleration factor (AF). This would eventually lead to an increase in the degradation rates and a decrease in lifetime. These factors also cause an overall negative impact on LCOE [4]. Thus, lowering the PV module temperatures is one of the effective ways to increase the impact of PV modules from both performance and economical viewpoints.
Various strategies have been reported for active and passive cooling of PV modules to improve the module performance. Many studies have shown lowered module temperatures through passive cooling approaches, such as using fins [5] and heat sinks [6], or active cooling approaches, such as circulating water on the back of the modules [7] or air [8]. There are also dynamic temperature reduction strategies, such as the use of desiccants [9], use of phase-change materials in different climatic conditions [10], advancements in use of phase change materials [11] or combined technologies [12]. The module operating temperature can also be passively lowered through the use of thermally conductive and electrically insulating EVA composite encapsulant [13]; the use of backsheet with heat reflective additives [14], high thermal conductivity [15] and higher reflectance [16]; selective-spectral and radiative cooling [17], selective-spectral cooling [18], increased radiative cooling of solar cells [19] or increased radiative cooling of solar absorbers [20]. The focus of our study is to reduce the module operating temperatures of PV modules using thermally conductive backsheets (TCBs) and analyzing the performance and lifetime of these TCBs through field-exposed modules.
For our study, one-cell PV modules were fabricated using typical commercially available PV module encapsulation materials and replicated the typical commercial module structure: glass superstrate/ethylene–vinyl acetate copolymer (EVA) encapsulant/cell/EVA encapsulant/backsheet or glass substrate. The fabrication comprised use of exactly identical materials for glass, encapsulant and cells for all modules except the backsheet materials. For this paper, three types of backsheet materials were: conventional Tedlar/polyester/Tedlar (TPT) and two TCBs (TCB_A and TCB_B). In our previous studies, we demonstrated the potential thermal performance benefits of thermally conductive backsheets based on a 30-day data collected in Arizona [21] and a one-year data collected in Arizona and North Carolina along with weather and climate dependence on backsheet temperatures of TCBs [22]. Nominal operating cell temperature (NOCT) was also measured and compared between TPT and TCBs over a period of time and NOCT for TCB_A was observed to be lower than TPT by about 1.2 °C [21]. This paper provides a state-of-the-art performance analysis of the TCBs over a longer time period, namely, two and a half years. During the time of this study, no TCB-based commercial modules were available on the marketplace. Due to limited availability of TCB materials, we could not fabricate 60- or 72-cell modules, and hence, we fabricated nine-cell modules for our study, as it would closely represent the 60-cell or 72-cell commercial modules. Nine-cell modules using identical materials were fabricated, with the center cell surrounded by all cells on the sides for better thermal representation similar to industrial commercial modules and exposed in the field for preliminary analysis as presented in [23]. Nine-cell modules using TCB_A and TCB_B were only installed at AZ-1 site, and it was seen that these TCBs operated at lower cell temperatures than TPT [23]. In [21], we have also published the preliminary thermal modeling results including an empirical model and a 2D ANSYS model to validate the field data for these TCBs. The empirical thermal model using linear regression was used to compare the effects of ambient temperature, wind speed and irradiance on the cell temperature and the simple physical thermal model developed using ANSYS showed that underthe NOCT condition, the cell temperatures using TCB_A is lower than the TPT by about 0.6 °C. The study also showed that the modeled and field measured data were within the acceptable range of each other [21]. The reliability evaluation of these TCBs and TPT were performed based on accelerated stress testing as per IEC 61215 and Beyond Qual Plus standard for backsheets (UV 320 kWh/m2). All these backsheets have successfully passed these standard tests and the results were presented in [24]. The other reliability issues, such as the potential induced degradation (PID) effect, is beyond the scope of this paper, since this paper only focuses on the field thermal performance comparison of TCB and TPT. It is also presented that PID is influenced mainly by glass and not the backsheet material [25,26]. With lower temperatures observed in TCB, PID is expected to be lower, assuming that the ionic conductivities of all backsheet materials are much lower than the glass.
Makrides et al. have recently published [14] the most closely related paper on the influence of different backsheet materials on performance and reliability of PV systems. In their study, they investigated four grid-tied 1.2 kW PV systems with four different backsheets specially fabricated using polyethylene (PE), polyethylene terephthalate (PET) and fluoropolymer. In our study, we have investigated 30 one-cell modules having three different backsheet types (Tedlar–polyethylene terephthalate (PET)–Tedlar, polyvinylidene fluoride (PVDF)/PET/EVA and polyamide (PA)/aluminum/PET/PA) supplied by three different manufacturers. In their study, the influence of backsheet materials on the cell temperature, performance and energy production was evaluated at a single location, Cyprus. In our study, the backsheet materials were evaluated at three different locations, Arizona-1 (hot and low wind speed location), Arizona-2 (hot and high wind speed location) and North Carolina (cool and low wind speed location) to see the effect of different climatic conditions. In their study, they monitored the cell temperature, current, voltage at maximum power and AC energy, whereas, in our study, we monitored the cell temperature, backsheet temperature and open circuit voltage. In their study, they attempted to determine the degradation rate based on the outdoor field data, whereas, in our study, we attempted to determine the degradation rate based on the I-V curve measurements performed before and after the field installation using indoor continuous solar simulator.
As indicated above, in our previous studies, we have covered a short-term outdoor performance comparison between TCB and TPT, preliminary thermal modeling results using empirical and 2D thermal models along with field measurements validation, reliability evaluation of these backsheets per IEC and Beyond Qual Plus standards. In the current study, we demonstrate the thermal performance of fielded modules for extended period of time, lifetime and LCOE benefits of TCBs based on two and a half year data collected in Arizona (two locations; hot-dry desert climates with low and high wind speeds) and North Carolina (one location; temperate climate with low wind speed).
2. Materials and Methods
For this study, 30 one-cell modules were fabricated using three types (TPT, TCB_A and TCB_B) of commercially available PV module backsheet materials. These 30 modules were installed in three locations (6 modules at the AZ-1 site, 12 modules at the AZ-2 site and 12 modules at the NC site) for long-term monitoring and evaluations. The construction details for these one-cell modules are as given below. The structure of one-cell module is similar to the typical commercial PV module assembly: glass superstrate/EVA encapsulant/cell/EVA encapsulant/backsheet. Fast-cure EVA with thickness of 0.46 mm and a low-iron solar glass with thickness of 3.2 mm were used as encapsulant and superstrate, respectively. 156 mm × 156 mm p-type monocrystalline silicon aluminum back-surface field solar cells as used in industry-standard commercial modules were used. Different types of backsheet materials namely one conventional TPT of thickness 0.34 mm and two TCBs from different manufacturers (TCB_A and TCB_B) were used for this study. The baseline conventional backsheet is polyvinyl fluoride (DuPont trade name “Tedlar”)-based backsheet and the structure of all backsheet materials is shown in Table 1.

Table 1.
Thermal conductivities of three different types of backsheet material measured at 24 °C [21].
A total of 30 modules were fabricated for installation at three sites based on varying climatic conditions and the overview is presented in Table 2. Further details on the module construction and lamination processes are given in our previous publication [21]. The radial and axial thermal conductivity of the TCBs selected for our study were measured using the thermal-conductivity meter TPS 2500 S from Hot Disk, already presented in [21]. These values are also reproduced in Table 1 for the convenience of the readers.
Table 2.
Overview of modules at each site.
Site AZ-1 is located in Mesa, Arizona, which has a hot-dry climate with low wind speeds, site AZ-2 is located in Gila Bend, Arizona, which has a hot-dry climate but with high wind speeds, and the NC site is located in Fayetteville, North Carolina, which has a temperate climate with low wind speeds. As shown in Figure 1, these modules were installed on a south-facing and 45°-tilted open rack, with an identical racking system at all three sites. The modules installed at all three sites have calibrated T-type thermocouples (diameter: 0.255 mm) attached to the module backside to measure the backsheet temperature. The modules installed at AZ-1 site has additional thin-thermocouples (diameter: 0.127 mm) attached to the back of the solar cells prior to lamination to measure cell temperatures. A Campbell Scientific CR1000 datalogger was installed at all three sites to collect cell/backsheet temperature as well as weather data, including ambient temperature, wind speed, wind direction and plane-of-array (POA) irradiance measured by a pyranometer. Figure 1 shows the modules installed at all three sites along with weather stations. Light IV (LIV) and dark IV (DIV) were performed before installation and after two and a half years of field exposure. An indoor AAA steady state solar simulator was used to obtain IV curves at STC.
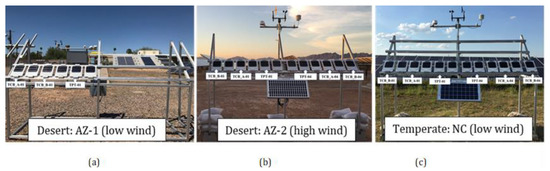
Figure 1.
Installation of 30 one-cell modules at three different sites: (a) 6 modules at the AZ-1 site, which has a hot-dry desert climate and low wind speed; (b) 12 modules at the AZ-2 site, which has a hot-dry desert climate and high wind speed; (c) 12 modules at the NC site, which has a temperate climate and low wind speed.
3. Results
The results obtained on the thermal performance, lifetime and LCOE are presented and discussed in the following sections.
3.1. Thermal Performance
The temperature differences between cells of TPT module and TCB module (ΔTcell) and between the backsheets of the TPT module and TCB module (ΔTbacksheet) were obtained in the field at all three sites over a period of two and half years. The same set of data with an exactly equal number of seasons (10) was monitored at each site and used for comparison of all three sites. For the analysis, an average temperature of two modules per backsheet type for AZ-1 site and an average of four modules per backsheet type was considered for AZ-2 and NC sites. Table 2 shows an overview of the number of modules at each site.
The temperature values were filtered based on the following weather conditions: POA irradiance > 400 W/m2, wind speed > 0.25 m/s and for a time period between 9 am and 3 pm. The wind direction data near (±20°) the east and west directions was removed for this analysis in order to minimize the impact of wind direction. A dataset of a two and a half year period was considered for this study, which was divided into four seasons per year to study the seasonal trends over multiple years. Summer (Sum) season indicates data between 21 June–20 September, fall (Fall) season data between 21 September–20 December, winter (Win) season data between 21 December–20 March and spring (Spr) season data between 21 March–20 June. The field installation and exposure of these modules were initiated in June, therefore, starting with the summer season as Sum Y1. Moreover, post-field exposure I-V measurements were performed on the modules after two and a half years or 10 seasons, chronologically ending in Fall Y3.
Figure 2 represents the ΔTbacksheet values between TPT-TCB_A and TPT-TCB_B for 10 seasons at three sites. The median ΔTbacksheet values between TPT and TCB_A is at least 0.5 °C at AZ-1 site for most seasons (except for Fall and Win Y2). The median ΔTbacksheet values between TPT and TCB_A/TCB_B is not significant at AZ-2 site for most seasons. The median ΔTbacksheet between TPT and TCB_B are at least 0.5 °C at NC site throughout 10 seasons. ΔTbacksheet values between TPT and TCB_A are observed to be as high as 5 °C and between TPT and TCB_B to be as high as 2.5 °C as seen at AZ-1 site certain times of the day.
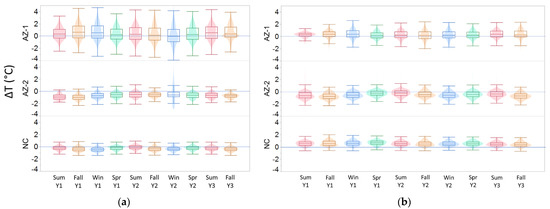
Figure 2.
Violin plots representing ΔTbacksheet seasonal trends over 10 seasons/two and a half year initiating from summer (Sum Y1) to fall (Fall Y3) in one-cell modules installed at three different sites (AZ-1, AZ-2 and NC). (a) TPT-TCB_A and (b) TPT-TCB_B.
The median values from Figure 2 for TPT vs TCB_A and TPT vs TCB_B for all three sites and 10 seasons were also used to analyze whether the observed temperature differences between TPT and TCBs are statistically significant. Paired t-tests, with a null hypothesis assuming that the differences are not statistically significant (H₀: μdifference = 0), were performed for TPT vs TCB_A and TPT vs TCB_B ata 95% confidence level. Two paired t-tests were performed, the first comparing the differences between TPT and TCB_A and the other comparing the differences between TPT and TCB_B. We will fail to reject the null hypothesis (and thus conclude that two entities are not significantly different), if the p-value is less than 0.05 for a given dataset. The p-value obtained for the paired t-test between TPT and TCB_A was 0.051 and between TPT and TCB_B it was 0. The p-value obtained between TPT and TCB_B is clearly less than 0.05, which means that the differences between TPT and TCB_B are statistically significant. To further diagnose the differences between TPT and TCB_A, the absolute t-value was compared with the critical t-value with the following parameters: degree of freedom (the number of independent values which can be assigned to a statistical distribution) = 58, 95% confidence level and two-tail test. Table 3 gives a summary of p-values, absolute and critical t-values for both the t-tests. The absolute t-value (2.04) was greater than the critical t-value (2.002) obtained from the student’s t-distribution table. If the absolute value of the t-value is greater than the critical value, the null hypothesis is rejected. Therefore, the null hypothesis between TPT and TCB_A will be rejected, and we can say that the differences between TPT and TCB_A are statistically significant.
Table 3.
Summary of t-test values between TPT and TCBs (TCB_A and TCB_B).
Figure 3 represents the ΔTcell values between TPT-TCB_A and TPT-TCB_B for 10 seasons at the AZ-1 site. ΔTcell values represent module operating temperatures less likely affected by surrounding conditions. The median ΔTcell values between TPT and TCB_A are about 0.5–1 °C at the AZ-1 site for 10 seasons. The median ΔTcell values between TPT and TCB_B are about 0.2–0.7 °C at the AZ-1 site for 10 seasons. The positive median ΔTcell values between TPT and TCB_A/TCB_B signify that TCBs operate at lower temperatures than TPT at least 50% of the time throughout the 10 seasons. The distribution of the data in violin plots is bimodal usually showing highest peak near median values. Additionally, the violin plots show that ΔTcell values between TPT-TCB_A and TCB_B are near or above the first quartile (Q1), indicating that TCB_A operates at lower temperatures for 75% of the dataset, except Fall and Win Y2.
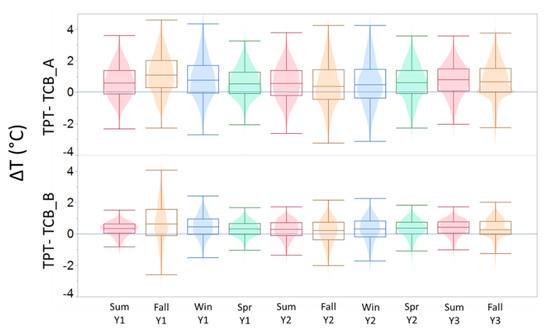
Figure 3.
Violin plots representing ΔTcell (between TPT- TCB_A and TPT-TCB_B) seasonal trends over 10 seasons/two and a half years initiating from summer (Sum Y1) to fall (Fall Y3) in one-cell modules installed at the AZ-1 site.
Figure 4 compares the cell temperature differences between two samples of the same backsheet, i.e., between TPT1 and TPT2 and between TCB_A1 and TCB_A2 with the average temperature difference between TPT and TCB_A. On a seasonal basis, the temperature difference can be as high as 0.8 °C, but on an annual basis, the difference can be as high as 0.4 °C. This assures that the temperature difference seen between TPT and TCB is higher than the measurement uncertainty. As seen in Figure 4, the temperature difference between TPT and TCB is almost always higher than the temperature difference between the same backsheet type modules. This indicates that the measured data are higher than the measurement uncertainty.
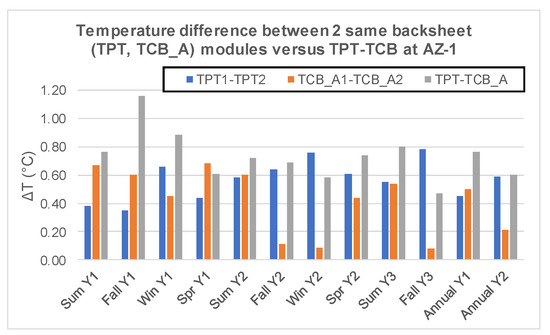
Figure 4.
Comparison of cell temperature differences between modules of the same backsheet (TPT, TCB_A) versus TPT-TCB_A measured at the AZ-1 site.
Instantaneous higher ΔTbacksheet and ΔTcell (TPT-TCB_A) values are observed in the fall and summer seasons at the AZ-1 site, while higher ΔTbacksheet (TPT-TCB_B) are observed in the spring season at the NC site. More detailed instantaneous values are presented in Figure 5. Figure 5 and Figure 6 shows the frequency percentage (the number of times as compared to total data points) of the ΔTbacksheet and ΔTcell values, respectively, between TPT and TCB_A/TCB_B are greater than 0.4 °C, 1 °C, 2 °C and 4 °C at the AZ-1 site over the course of two and a half years. This gives more clarity than just the median values. About 40–50% of the time, ΔTbacksheet (TPT-TCB_A) values are greater than 0.4 °C, but ΔTcell (TPT-TCB_A) values are greater than 0.4 °C at least 50% of the time (as high as 70%). The variation in ΔTbacksheet values is higher due to the ambient conditions, specifically the ambient temperatures (11 °C differences in median values). This stands true with the reported thermal models for the module (backsheet temperatures), where the coefficient dependence for ambient temperatures (0.943) is highest [27]. The ΔTbacksheet (TPT-TCB_B) values are greater than 0.4 °C for about 40–50% of the time at the AZ-1 site.
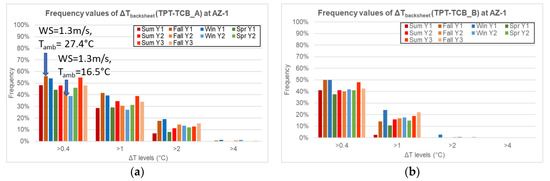
Figure 5.
Frequency percentage of ΔTbacksheet seasonal trends indicating values of >0.4 °C, >1 °C, >2 °C and >4 °C over 10 seasons/two and a half years from summer (Sum Y1) to fall (Fall Y3) in one-cell modules installed at the AZ-1 site. (a) TPT- TCB_A and (b) TPT-TCB_B.
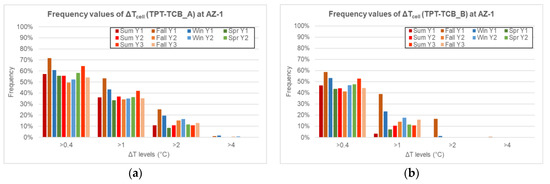
Figure 6.
Frequency percentage of ΔTcell seasonal trends indicating values of >0.4 °C, >1 °C, >2 °C and >4 °C over 10 seasons/two and a half years from summer (Sum Y1) to fall (Fall Y3) in one-cell modules installed at the AZ-1 site. (a) TPT- TCB_A and (b) TPT-TCB_B.
Figure 7 and Figure 8 shows frequency ratio (number of times as compared to total data points) of ΔTbacksheet values between TPT and TCB_A/TCB_B at AZ-2 and NC, respectively. About 50–60% of the time, ΔTbacksheet (TPT-TCB_B) values are greater than 0.4 °C at the NC site. On the other hand, the ΔTbacksheet values between TPT and TCB_A are not significant, while at most 10% of the time, ΔTbacksheet values between TPT and TCB_A are above 0.4 °C at the AZ-2 site. In short, it can be clearly seen that TCB_A operates at a lower temperature than TPT at the AZ-1 site, which experiences hot climates; on the other hand, TCB_B operates at a lower temperature than TPT in temperate climates.
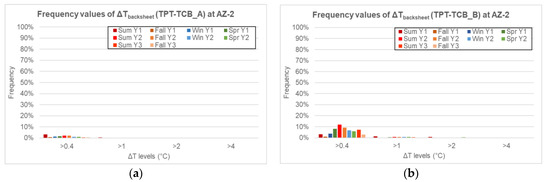
Figure 7.
Frequency percentage of ΔTbacksheet seasonal trends indicating values of >0.4 °C, >1 °C, >2 °C and >4 °C over 10 seasons/two and a half years from summer (Sum Y1) to fall (Fall Y3) in one-cell modules were installed at the AZ-2 site. (a) TPT- TCB_A and (b) TPT-TCB_B.
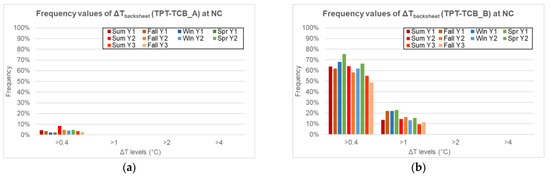
Figure 8.
Frequency percentage of ΔTbacksheet seasonal trends indicating values of >0.4 °C, >1 °C, >2 °C and >4 °C over 10 seasons/two and a half years from summer (Sum Y1) to fall (Fall Y3) in one-cell modules were installed at the NC site. (a) TPT- TCB_A and (b) TPT-TCB_B.
3.2. Lifetime
Series resistance can be affected by solder bond degradation through multiple pathways. To understand the quantitative effect of change in series resistance on lifetime of these modules, the Arrhenius model can be used to calculate the acceleration factor (AF) using activation energy (Ea) values for specific pathways. One form of solder bond degradation is a mechanical degradation due to thermal stresses accrued over time, and the reported value for this mode is 0.35 eV [28]. Other form of solder bond degradation is due to inter-metallic compound (IMC) formation and the reported activation energy ranges from 0.8–1.5 eV [29]. Another pathway for degradation is corrosion, and the reported Ea value is 0.7 eV [30].
As per the Arrhenius model, the AF between higher temperature (T2) and lower temperature (T1) modules can be given as in Equation (1):
where k is Boltzmann’s constant (8.617 × 10⁻⁵ eV/K) and T is in Kelvin.
For this analysis, median temperature of TPT and TCB modules were calculated as per site. Since TCB_A performs better in hot climates, AF and lifetime of TPT vs TCB_A was analyzed for AZ-1 and AZ-2 sites. On the other hand, AF and lifetime of TPT vs TCB_B was analyzed for the NC site, as TCB_B performs the best at this site. In these calculations, three Ea values of 0.35, 0.7 and 1.2 eV were used based on different possible degradation mechanisms [28,29,30]. In Equation (1), the TPT module temperature was used as T2 and the TCB module temperature was used as T1. T1 and T2 were calculated based on median values of module temperatures for one season considering the best-case scenario. A baseline lifetime of 25 years, usually reported by module manufacturers, was used for this analysis and an expected lifetime for TCBs was reported for various Ea values, as shown in Table 4.
Table 4.
Acceleration factor (AF) and lifetime for TCBs vs TPTs based on three Ea values and on the median cell temperature of TPT versus TCB_A for AZ-1 site, on the median backsheet temperature of TPT versus TCB_A for AZ-2 site and on the median backsheet temperature of TPT versus TCB_B for the NC site.
We can see that if a higher Ea (1.2 eV) degradation mechanism is operating as the life-limiting mechanism, the lifetime of TCB_A can be increased by 1.7–4.1 years compared to TPT, while the lifetime of TCB_B can be increased by 2.6 years compared to TPT. To summarize, the lifetime of the modules can be improved by 0.5–4.1 years by using TCB_A (instead of TPT) in Arizona, depending on the degradation mechanism and location (lower the wind speed better the TCB performance), and the lifetime of the modules can be improved by 0.7–2.6 years by using TCB_B (instead of TPT) in North Carolina, depending on the degradation mechanism.
3.3. Levelized Cost of Electricity (LCOE)
Reduction in the module operating temperature leads to increased energy production and service lifetime, and thereby, lower LCOE. In the previous section, we have seen that lower operating temperatures in modules with TCB have improved the lifetime of the module by as long as four years. This section analyzes the impact of using TCB modules on LCOE. An increase in the module-operating temperature leads to a decrease in the bandgap, and thereby, a decrease in efficiency. An increase in temperature also causes an increase in the degradation rate of the modules over a period of time, and thereby, the service lifetime. Efficiency is related to semiconductor issues in the module, while the degradation rate is related to non-semiconductor issues. Therefore, the only variables in this analysis are efficiency, average degradation rate and service lifetime of the backsheet, since all the other materials in the construction of all the modules remain identical.
A comparative Photovoltaic Levelized Cost of Electricity Calculator (Comparative PV LCOE Calculator) developed by NREL was used to calculate LCOE for photovoltaic (PV) systems based on cost, performance and reliability inputs for a baseline and a proposed technology [31]. The preset values assume mono c-Si technology, glass-polymer backsheet, fixed tilt utility scale plant in Phoenix, AZ (for the AZ-1 site) and in Greensboro, NC (for the NC site). All the preset cost values available in the calculator [31] were taken into consideration.
To determine the degradation rate, we attempted to use the I-V performance data measured before and after field exposure. Since the degradation level was too small to be considered to be at an acceptable level (due to only 2.5 years of field exposure) and was within the I-V curve measurement uncertainty (typically, about 3%), the measured I-V data were not used in the degradation ratedetermination. To perform LCOE calculations, we have utilized the degradation rate values reported by Jordan et al., NREL [32]. Based on an extensive field study by Jordan, it has been shown that the median degradation rate/year (%/y) for conventional backsheet modules in desert climate sites is about 0.7%/y and in moderate (temperate) climate sites 0.4%/y [32]. Based on two and a half years of outdoor testing, TCB_ A operates at about a 0.6 °C lower temperature as compared to TPT at AZ-1 site and TCB_B operates at about a 0.55 °C lower temperature as compared to TPT at NC site when all 10 seasons over two and a half years are considered. Note that for LCOE calculation, an average value of 10 seasons is considered instead of using the best-case scenario, as presented in the previous section. This corresponds to a 0.2% and 0.25% increase in efficiency (considering 0.45%/°C temperature coefficient for power), respectively, in TCB_A (AZ-1) and TCB_B (NC) modules as compared to TPT. To account for the effect of the thermal performance in the service lifetime, the acceleration factor is calculated using these ΔT values. Again, using the Arrhenius equation and assuming the activation energy of the degradation mechanism is about 0.7 eV [30], the acceleration factor would be 2(0.6/10) for TCB_A and 2(0.55/10) for TCB_B, which equals to 1.049 and 1.046, respectively. This signifies a 4.2% and 3.9% improvement in degradation rates; therefore, the respective degradation rate/year for TCB_A and TCB_B would be 0.67%/y and 0.38%/y.
Assuming a typical end of life (80% of nameplate power) for the modules and using acceleration factors for TCB_A and TCB_B, a service lifetime of 25 years for TPT would correspond to the respective service lifetimes of 26.2 and 26.1 years for TCB_A and TCB_B. In this approach, the only assumed variables between TPT and TCB_A are degradation rate (0.7%/y vs 0.67%/y), efficiency (19% vs 19.05%) and service lifetime (25 vs 26.2 years). And the assumed variables between TPT and TCB_B are the degradation rate (0.4%/y vs 0.38%/y), efficiency (19% vs 19.05%) and the service lifetime (25 vs 26.1 years). All the other variables are the same as that of TPT, as shown in Table 5.
Table 5.
Impact on various factors used in comparative LCOE analysis.
Based on these values, LCOE analysis parameters are compared between TPT and TCB_A and TCB_B types, as seen in Figure 9. Higher efficiency and a lower degradation rate of TCB due to lower operating temperatures tend to improve the lifetime, as expected, and offer a slightly better LCOE for TCB. The energy yield of 1829 kWh/kW/year as seen in Table 5 corresponds to 1829 MWh/MW/year. Assuming a 25 MW plant installed with TCB modules having 0.1 cents/kWh lower LCOE than TPT, the energy yield of 45,725 MWh/25 MW/year would correspond to a cost saving of approximately $46,000/25 MW/year.
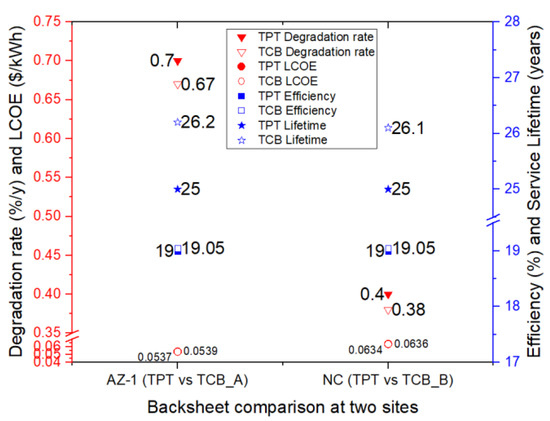
Figure 9.
LCOE analyses’ key parameter comparison for TPT and TCBs at two different sites (red color legend indicates parameters on left y-axis and blue color legend indicates parameters on right y-axis).
4. Discussion
In this study, 30 one-cell modules were fabricated using three types of backsheets, i.e., TPT, TCB_A and TCB_B. These modules were installed and monitored over two and a half years at three sites, AZ-1 (high ambient temperature and low wind speed), AZ-2 (high ambient temperature and high wind speed) and NC (low ambient temperature and low wind speed). In this investigation, the thermal performance, electrical performance, lifetime and LCOE were compared and analyzed between conventional TPT and TCBs (TCB_A, TCB_B).
Thermal performance: This study demonstrates that the operating temperatures of PV modules can be lowered by incorporating appropriate (site-specific) commercially available TCBs in the module construction (TCB_A for AZ-1 and TCB_B for NC). For site AZ-1, TCB_A was determined to be the best performing among all backsheets with more than 0.5 °C median ΔT between TPT and TCB_A. For site AZ-2, TCB is as good as TPT but not better. For site NC, TCB_B is the best performing among all backsheets with more than 0.5 °C median ΔT between TPT and TCB_B. Using t-test, the temperature differences for TPT vs TCB_A and TPT vs TCB_B were shown to be statistically significant. A summary of thermal performance of the backsheets is given in Table 6.
Table 6.
Summary based on field thermal performance of one-cell modules at three locations.
Lifetime and LCOE: The lifetime of the modules can be improved by 0.5–4.1 years by using TCB_A (instead of TPT) at the AZ-1 site and by 0.7–2.7 years by using TCB_B (instead of TPT) at the NC site. Based on the median cell temperatures for AZ-1, the estimated LCOE is in the following order: TCB_A (5.30 cents/kWh) < TPT (5.39 cents/kWh).
5. Conclusions
In this study, the operating temperatures of PV modules with TCB_A were observed to be lower than TPT for hot and dry climate, while with TCB_B the temperatures were observed to be lower than TPT for a temperate climate. TCB_A was determined to be the best performing among all backsheets under a hot and dry climatic condition (with low wind speed), with more than 0.5 °C median ΔT between TPT and TCB_A. On the other hand, for hot and dry climatic conditions (with high wind speed), TCB is as good as TPT, but not better. TCB_B is found to be the best performing among all backsheets under temperate climatic condition, with more than 0.5 °C median ΔT between TPT and TCB_B. These temperature differences between TPT and TCBs were determined to be statistically different and significant at all the three sites investigated in this study. These lower temperatures in TCB modules are expected to improve the module lifetime, compared to TPT, as high as 4.1 years and 2.7 years in TCB_A and TCB_B, respectively. This would lead to a reduction in LCOE values for TCB modules by 1.7% as compared to TPT.
Based on the outdoor field evaluations presented in this paper, the following key conclusions can be made: TCB_A, TCB_B and TPT (or TCB_B) are determined to be the best backsheets for the AZ-1, NC and AZ-2 sites, respectively. The long-term durability and reliability of these TCBs compared to TPT will be determined after the completion of the ongoing indoor accelerated testing program (DuPont’s long-term MAST test program) at ASU-PRL. An extended part of this study, using nine-cell modules, showed that TCBs still operate at lower temperatures compared to TPT. Due to a lack of sufficient TCB materials, we could not fabricate full-size 72-cell modules. However, the nine-cell module construction, consisting of a center cell surrounded by neighboring cells, is expected to closely represent the commercial module’s thermal environment. Though not proven yet, we anticipate that the full-size modules would still show the lower temperature based on the analysis from the nine-cell module’s temperature differences between TPT and TCB. It is to be clearly stated that we have not fully investigated the relationship between ΔT, wind direction and the experimental test setup (relative positions of the TPT and TCB modules on the test rack) using the NOCT data filtering approach. Since the one-cell modules in the experimental test setup were not surrounded by dummy modules to avoid the uneven convection losses, it is possible that the observed ΔT values could have been influenced by the wind direction and relative position of the TPT and TCB modules and it will be a subject of future investigation.
Author Contributions
Conceptualization, G.T.; methodology, G.T.; validation, A.P., J.O. and G.T.; formal analysis, A.P. and J.O.; investigation, A.P. and J.O.; data curation, A.P.; writing—original draft preparation, A.P.; writing—review and editing, A.P. and J.O.; visualization, A.P. and J.O.; supervision, G.T.; funding acquisition, G.T. All authors have read and agreed to the published version of the manuscript.
Funding
This research was funded by the U.S. Department of Energy’s the Photovoltaic Research and Development (PVRD) program, grant number DE-EE0007548.
Institutional Review Board Statement
Not applicable.
Informed Consent Statement
Not applicable.
Data Availability Statement
The data presented in this study are available on request from the corresponding author. The data are not publicly available due to NDA signed with the project supporting entities.
Acknowledgments
We would like to acknowledge Sai Tatapudi from ASU-PRL for the support in the installation of these stations and the integration of the data acquisition system. We would also like to acknowledge Joseph Kuitche for providing inputs on the statistical analysis.
Conflicts of Interest
The authors declare no conflict of interest. The funders had no role in the design of the study; in the collection, analyses or interpretation of data; in the writing of the manuscript.
References
- Fairbrother, A.; Boyd, M. Differential degradation patterns of photovoltaic backsheets at the array level. Sol. Energy 2018, 163, 62–69. [Google Scholar] [CrossRef]
- Lin, C.; Lyu, Y. Correlation between mechanical and chemical degradation after outdoor and accelerated laboratory aging for multilayer photovoltaic backsheets. In Proceedings of the SPIE Reliability of Photovoltaic Cells, Modules, Components, and Systems IX, San Diego, CA, USA, 28–19 August 2016. [Google Scholar] [CrossRef]
- Kurtz, S.; Whitfield, K. Evaluation of high-temperature exposure of photovoltaic modules. Prog. Photovolt. Res. Appl. 2011, 19, 954–965. [Google Scholar] [CrossRef]
- Tamizhmani, G.; Kuitche, J. Accelerated Lifetime Testing of PV Modules. Solar America Board for Codes and Standards Report. 2013. Available online: https://www.google.com/url?sa=t&rct=j&q=&esrc=s&source=web&cd=&ved=2ahUKEwi65uGlk4TvAhUOfd4KHT_ZCgIQFjABegQIBBAD&url=http%3A%2F%2Fwww.solarabcs.org%2Fabout%2Fpublications%2Freports%2Facceleratedtesting%2Fpdfs%2FSolarABCs-33-2013.pdf&usg=AOvVaw345ulzLhs3eT8Ysz5HDX-_ (accessed on 14 January 2021).
- Kim, J.; Bae, S. Experimental and Numerical Study on the Cooling Performance of Fins and Metal Mesh Attached on a Photovoltaic Module. Energies 2020, 13, 85. [Google Scholar] [CrossRef]
- Hernandez-Perez, J.; Carrillo, J. A new passive PV heatsink design to reduce efficiency losses: A computational and experimental evaluation. Renew. Energy 2020, 147, 1209–1220. [Google Scholar] [CrossRef]
- Hussien, H.A.; Numan, A.H. Improving of the photovoltaic/thermal system performance using water cooling technique. IOP Conf. Ser.: Mater. Sci. Eng. 2015, 78, 012020. [Google Scholar] [CrossRef]
- Teo, H.; Lee, P. An active cooling system for photovoltaic modules. Appl. Energy 2012, 90, 309–315. [Google Scholar] [CrossRef]
- Simpson, L.J.; Woods, J. Passive Cooling of Photovoltaics with Desiccants. In Proceedings of the IEEE 44th Photovoltaic Specialist Conference (PVSC), Washington, DC, USA, 25–30 June 2017; pp. 1893–1897. [Google Scholar] [CrossRef]
- Khanna, S.; Reddy, K. Climatic Behavior of Solar Photovoltaic Integrated with Phase Change Material. Energy Convers. Manag. 2018, 166, 590–601. [Google Scholar] [CrossRef]
- Ali, H. Recent advancements in PV cooling and efficiency enhancement integrating phase change materials-based systems—A comprehensive review. Solar Energy 2020, 197, 163–198. [Google Scholar] [CrossRef]
- Rajvikram, M.; Sivasankar, G. Experimental study conducted for the identification of best heat absorption and dissipation methodology in solar photovoltaic panel. Solar Energy 2019, 193, 283–292. [Google Scholar] [CrossRef]
- Lee, B.; Liu, J.Z. Thermally conductive and electrically insulating EVA composite encapsulant for solar photovoltaic (PV) cell. Express Polym. Lett. 2008, 2, 357–363. [Google Scholar] [CrossRef]
- Makrides, G.; Theristis, M. Five-year performance and reliability analysis of monocrystalline photovoltaic modules with different backsheet materials. Solar Energy 2018, 171, 491–499. [Google Scholar] [CrossRef]
- Kim, N.; Kim, D. Improved heat dissipation in a crystalline silicon PV module for better performance by using a highly thermal conducting backsheet. Energy 2016, 113, 515–520. [Google Scholar] [CrossRef]
- Oreski, G.; Eder, G.C. Performance of PV modules using co-extruded backsheets based on polypropylene. Sol. Energy Mater. Sol. Cells 2021, 223. [Google Scholar] [CrossRef]
- Sun, X.; Silverman, T. Optics-based approach to thermal management of photovoltaics: Selective-spectral and radiative cooling. IEEE J. Photovolt. 2017, 7, 566–574. [Google Scholar] [CrossRef]
- Silverman, T.; Deceglie, M. Reducing operating temperature in photovoltaic modules. IEEE J. Photovolt. 2018, 8, 532–540. [Google Scholar] [CrossRef]
- Zhu, L.; Raman, A. Radiative cooling of solar cells. Optica 2014, 1, 32–38. [Google Scholar] [CrossRef]
- Zhu, L.; Raman, A.P. Radiative cooling of solar absorbers using a visibly transparent photonic crystal thermal blackbody. Proc. Natl. Acad. Sci. USA 2015, 112, 12282–12287. [Google Scholar] [CrossRef]
- Oh, J.; Rammohan, B. Reduction of PV module temperature using thermally conductive backsheets. IEEE J Photovolt. 2019, 8. [Google Scholar] [CrossRef]
- Pavgi, A.; Oh, J. Comparison of TPT and thermally conductive backsheets in one-cell modules: Weather and climate dependence. In Proceedings of the 46th IEEE PVSC Conference, Chicago, IL, USA, 16–21 June 2019; pp. 0550–0554. [Google Scholar] [CrossRef]
- Pavgi, A.; Oh, J. Reduction of Operating Temperatures of PV Modules using Thermally Conductive Backsheets: Site Dependence. In Proceedings of the 46th IEEE PVSC Conference, Chicago, IL, USA, 16–21 June 2019; pp. 0544–0549. [Google Scholar] [CrossRef]
- Pavgi, A.; Oh, J. Performance and Reliability of Thermally Conductive Backsheets (TCB). In Proceedings of the 47th IEEE PVSC Conference, Calgary, AB, Canada, 15 June–21 August 2020; pp. 0775–0780. [Google Scholar] [CrossRef]
- Kutzer, M.; Raykov, A. Towards a Root Cause Model for the Potential-Induced Degradation in Crystalline Silicon Photovoltaic Cells and Modules. In Proceedings of the 28th European Photovoltaic Solar Energy Conference and Exhibition, Villepinte, France, 30 September–4 October 2013. [Google Scholar] [CrossRef]
- Virtuani, A.; Annigoni, E. Preventing Potential-Induced Degradation in Crystalline Silicon PV Modules: Relationship Between Degradation and Bill of Material. In Proceedings of the IEEE 44th Photovoltaic Specialist Conference (PVSC), Washington, DC, USA, 25–30 June 2017; pp. 1395–1399. [Google Scholar] [CrossRef]
- TamizhMani, G.; Ji, L. Photovoltaic module thermal-wind performance: Long-term monitoring and model development for energy rating. In Proceedings of the NCPV and Solar Program Review Meeting, Denver, CO, USA, 24–26 March 2003. [Google Scholar]
- Gopalakrishna, H.; Sinha, A. Activation energy for end-of-life solder bond degradation: Thermal cycling of field-aged PV modules. IEEE J Photovolt. 2020, 10. [Google Scholar] [CrossRef]
- Geipel, T.; Moeller, M. Intermetallic compounds in solar cell interconnections: Microstructure and growth kinetics. Sol. Energy Mater. Sol. Cells 2017, 159, 370–388. [Google Scholar] [CrossRef]
- Sinha, A.; Pore, S. Acceleration factor modeling for degradation rate prediction of photovoltaic encapsulant discoloration. In Proceedings of the 7th World Conference on Photovoltaic Energy Conversion (WCPEC), Waikoloa Village, HI, USA, 10–15 June 2018; pp. 1342–1346. [Google Scholar] [CrossRef]
- NREL Website. Available online: https://www.nrel.gov/pv/lcoe-calculator (accessed on 14 January 2021).
- Jordan, D.; Kurtz, S. Compendium of photovoltaic degradation rates. Prog. Photovolt. Res. Appl. 2016, 24, 978–989. [Google Scholar] [CrossRef]
Publisher’s Note: MDPI stays neutral with regard to jurisdictional claims in published maps and institutional affiliations. |
© 2021 by the authors. Licensee MDPI, Basel, Switzerland. This article is an open access article distributed under the terms and conditions of the Creative Commons Attribution (CC BY) license (http://creativecommons.org/licenses/by/4.0/).