Article

A Case Study on Data Mining Application in a Virtual Power Plant: Cluster Analysis of Power Quality Measurements

1
Faculty of Electrical Engineering, Wroclaw University of Science and Technology, 50-370 Wroclaw, Poland
2
TAURON Ekoenergia Ltd., 58-500 Jelenia Góra, Poland
3
Faculty of Mechanical and Power Engineering, Wroclaw University of Science and Technology, 50-370 Wroclaw, Poland
*
Authors to whom correspondence should be addressed.
Energies 2021, 14(4), 974; https://doi.org/10.3390/en14040974
Submission received: 2 January 2021 / Revised: 8 February 2021 / Accepted: 9 February 2021 / Published: 12 February 2021
(This article belongs to the Special Issue Machine Learning and Data Mining Applications in Power Systems)

Abstract

:
One of the recent trends that concern renewable energy sources and energy storage systems is the concept of virtual power plants (VPP). The majority of research now focuses on analyzing case studies of VPP in different issues. This article presents the investigation that is based on a real VPP. That VPP operates in Poland and consists of hydropower plants (HPP), as well as energy storage systems (ESS). For specific analysis, cluster analysis, as a representative technique of data mining, was selected for power quality (PQ) issues. The used data represents 26 weeks of PQ multipoint synchronic measurements for 5 related to VPP points. The investigation discusses different input databases for cluster analysis. Moreover, as an extension to using classical PQ parameters as an input, the application of the global index was proposed. This enables the reduction of the size of the input database with maintaining the data features for cluster analysis. Moreover, the problem of the optimal number of cluster selection is discussed. Finally, the assessment of clustering results was performed to assess the VPP impact on PQ level.

1. Introduction

Currently, in electrical power networks (EPN), the number of renewable energy sources (RES) and energy storage systems (ESS) are scientifically increasing [1]. Thus, different approaches that enable to control them are highly desirable [2,3]. Commonly known are microgrids and virtual power plants (VPP) [4]. Generally, virtual power plants are autonomous units, that are equipped with systems for effective power flow control. VPPs consist of different units that are integrated with the distribution network. The used elements are, e.g., generators, loads, as well as energy storage systems [5]. Thus, the current literature analyzes the real cases of VPPs. The international examples are in, e.g., United Kingdom [6], Denmark [7], Ireland [8], Greece [9], Germany [10], China [11], India [12], Australia [13], and South Korea [14]. The range of VPP functioning is wide. Thus, there is a possibility of indicating different research trends that concerns VPP, e.g., network voltage control by renewable energy sources integrated [15,16,17,18], power flow control and analysis [19,20,21,22], playing a role on the energy market [23,24,25,26], energy management in a VPP [27,28,29,30], optimal active and reactive power scheduling [31,32,33,34], and ESS sizing, localization, and management in VPP [35,36,37,38].
One of the elements that concerns VPP is power quality (PQ) issues. Reference [39] introduces the virtual power plant as vehicles to facilitate cost-efficient integration of distributed energy sources into the existing power system (PS). This research also includes a demonstration of the application of the test system. The analysis of the system performance concerns energy efficiency, power quality, and security. Reference [40] proposes the extensions of the standard International Electrotechnical Commission (IEC) 61850 as a solution to enhance the interaction between the virtual power plant controller and the distributed energy resources. This research concerns the implementation of virtual power plant communication and control architecture as a real case study. The presented case concerns the power quality recorders issues and demands presented in IEC 61850. Reference [41] presents virtual power plant management with the priority requirements optimized by the compromised methods. The model of operation optimization of a VPP was based on fuzzy multiple objective optimization problems. The indicated optimization problem concerns the satisfaction of both customers and suppliers, system stability, power quality, as well as the costs of operation limitations. The presented method was verified in a test system. Reference [42] attempts to assure the applicable framework for harmonizing operations of different units of the virtual power plant. The authors concluded that decisions and obtaining profits, although complying with the required power quality levels and real network constraints, are a crucial part of virtual power plant strategies. Reference [43] concerns simulations when a virtual power plant is in islanded grid mode with a thermal power plant for baseload. The presented virtual power plant consists of 0.2 GW wind power, 0.1 GW photovoltaic power, and ±0.25 GW pumped storage. The research results include different control strategies of the storage plant to highlight the impact of a virtual power plant on PQ. Reference [44] presents the coordinative operation problem of multi-energy virtual power plants. The bi-objective dispatch model was proposed for the optimization of the performance of a multi-energy virtual power plant in terms of economic issues and power quality. The presented case study was based on Hongfeng Eco-town in China.
Additionally, literature from 2019 and 2020 also present recent applications of clustering methods to virtual power plant issues. Reference [45] proposes the application of a robust stochastic optimal dispatching method for solving the scheduling problem. In this research, the K-medoids clustering is used to obtain typical scenes of different units integrated into VPP. Reference [46] proposes the virtual power plant multi-timescale scheduling that contains day-ahead bidding and real-time operation. The models are based on the deferrable loads’ aggregation model with the k-mean clustering approach. The introduced strategy helps to obtain efficient management of massive deferrable loads to reduce the energy management complexity as well as to increase the general economics, which seems a promising application in the virtual power plant economic scheduling. Reference [47] presents a data-mining-driven incentive-based demand response scheme to model electricity trading between a virtual power plant and its participants. In this article, cluster analysis is used to divide consumers into different categories by their bid-offers. The algorithm applied in this article was based on ordering points to identify the clustering structure (OPTICS) algorithm. Reference [48] presents a virtual power plant load curve cluster analysis approach based on principal-component dimension-reduced analysis, aggregation level clustering, and fc-means clustering. The principal component analysis method is used to define the specific different loads in the virtual power plant aggregation. Then aggregation hierarchical clustering and fc-means clustering are used to realize the division of all load output curves participating in the aggregation. As a result, load curve clusters of the same class are obtained. Finally, the cluster analysis results are analyzed to establish an evaluation system.
Also, the concept of “global/synthetic/unified/total” power quality indices are indicated in the literature, such as total power quality index [49,50], synthetic power quality index [51,52], unified power quality index [53,54], or global power quality index [55,56]. All of these approaches are aimed toward reducing the number of analyzing power quality data. However, in the literature, there is a lack of research that uses the global indexes as an input to data-mining techniques to reduce the size of the input database. This investigation therefore verifies whether this approach is possible. The verification is based on real long-term PQ data obtained from VPP.
This research concerns a case study of a VPP that operates in Poland. The analyzed VPP is a part of both low-voltage (LV) and medium-voltage (MV) distribution networks. The main units of the VPP are a hydropower plant (HPP), a photovoltaic system (PV), and energy storage systems (ESS). This article aims to analyze a fragment of this virtual power plant that consists of 1.25 MW HPP and associates 0.5 MW ESS as well as LV loads. The presented research is based on PQ measurements. These measurements were realized synchronically in five measurement points. The observed measurement points are HPP, ESS, associated MV line, and two LV loads. The measurements were conducted from 1 May to 28 October 2020. Thus, the measurement period of time was 26 weeks (182 days). The analysis for full weeks is used as in classical PQ assessment [57]. From such a big amount of data, different datasets may be prepared. Thus, in this article, different databases were obtained. Those databases consist of classic PQ parameters as well as an application of the global index. Then, these databases were used as an input to data-mining algorithms. The selected algorithm was k-mean with Euclidean distance. A comparison of the results and effectiveness was performed. Additionally, the solution for defining the optimal number of clusters was performed using the v-fold cross-validation test. Finally, the qualitative assessment of clustering results was presented to respond to the different working conditions of VPP. All calculations were performed in Statistica 13 software (StatSoft Polska, Kraków, Poland).
To summarize the contributions of this article:
  • The data that were used in this article were based on multipoint, synchronic, and long-term measurement performed in real VPP.
  • The different input databases in point of power quality were proposed. The databases consisted of classic PQ parameters as well as global index values.
  • The application of PQ global index enabled the reduction of the size of the input database while maintaining a similar division of data.
  • The article investigated different PQ datasets and proposed a solution to define the optimal number of clusters selection.
  • Application of CA enabled the definition of the different working conditions of the VPP based on data features. Additionally, the assessment of these working conditions was realized using the PQ global index.
To realize those contributions, the article is organized into 6 sections. In Section 2, the clustering methods, global index proposition, and virtual power plant description are presented. Section 3 presents the construction of different datasets and a comparison between them. Section 4 presents the optimal number of cluster selection and a qualitative assessment of the final classification. Section 5 is a discussion of the obtained results. Section 6 presents the conclusions.

2. Methodology and Research Object Description

This section is based on three main elements of this article. In Section 2.1, the cluster analysis algorithm is introduced as a representant of the data-mining technique. The justification of the k-mean algorithm for long-term data is included. Also, methods for obtaining the optimal number of clusters are presented. Then, the definition of the global index is proposed. The global index is proposed to minimize the number of parameters that represent power quality while retaining their features. Finally, the description of the real virtual power plant is presented. That VPP was used as a source to obtain multipoint synchronic power quality data.

2.1. Cluster Analysis

Cluster analysis (CA) is one of the data-mining techniques [58]. Generally, the aim of cluster analysis is to divide data in the point of their features [59]. Clustering may be realized in a hierarchical or nonhierarchical approach. The hierarchical methods constitute x classes of y observations. The nonhierarchical approach is based on assigning all observations to the earlier known number of clusters. The non-hierarchical clustering is not a tree as in the case of the hierarchical clustering. It assures the division into groups of the data in order to maximize/minimize some evaluation criteria [60]. The nonhierarchical methods most used in the literature are based on, e.g., k-mean algorithm, k-median algorithm, or expectation maximization (EM) algorithm [61,62]. In this paper, the authors suggest using the nonhierarchical with the k-mean algorithm with Euclidean distance. The Euclidean distance was selected because it is not sensitive to the changeability of a single measurement [63]. It assures the general information about the data difference, especially for multiparameter input [64].
The k-mean algorithm’s goal is to find the extremum of the objective function. The k-mean algorithm function with Euclidean distance is defined as [65]:
J   ( U ,   M ) = i = 1 m j = 1 k u i j * i ( x i y i ) 2 ,
where:
J—objective function,
U—matrix of the object belonging to a cluster,
M—matrix in which a row vector represents the centroids of clusters,
i = 1,2,3,…,m—number of objects,
j = 1,2,3…,k—number of classes (clusters),
uij—element indicating the fact of assignment of i-th object to the j-th class (cluster),
xi—vector of observations belonging to cluster x,
yi—vector of observations belonging to cluster y.
However, the main disadvantage is that for the nonhierarchical approach, there is a need to define the final number of clusters for which data may be divided. There are different approaches to realize this optimal number of cluster selection, e.g., an entropy-based initialization method [66], gap statistic [67], u-control chart [68], or k-fold cross-validation test [69]. In this research, the k-fold cross-validation test was selected. This type of cross-validation is useful for the situation where there is no known test sample: The user-specified ‘v’ value for v-fold cross-validation. Normally, the v is equal to 3. The v value determines the number of random subsamples that are used for the learning sample. Then, the tree of the specified size is computed v times. After each iteration, it leaves out one of the subsamples from the computations. Then, these subsamples are used as a test sample for cross-validation. The cross-validation cost is computed for each of the v test samples that are then averaged to give the v-fold estimate of the cross-validation costs [69]. Then, on the basis of cross-validation cost, the optimal number of clusters is selected.

2.2. Global Power Quality Index

One of the current trends in PQ is using global indexes. Thus, in this article, there is a proposition of using the synthetic (global) index. The selected index was called the aggregated data index (ADI) [55,70]. The selected index consists of five classic 10 min PQ parameters (frequency, voltage, flicker severity, asymmetry, harmonic distortion in voltage), and two extremal (envelope of voltage deviation and maximum harmonic distortion).
However, it was decided to exclude frequency as a customization step of the index to VPP issues. Thus, the index corresponds to:
  • Voltage—U,
  • An envelope of voltage deviation obtained by the difference between the maximum and minimum of 200 millisecond U values identified during the 10 min aggregation interval—∆U,
  • Short-term flicker severity—Pst,
  • Asymmetry factor—ku2,
  • Total harmonic distortion in voltage—THDu,
  • A maximum of the 200 millisecond value of THDu, identified in the 10 min aggregation interval—THDumax [71].
Selected parameters correspond to the demands of the standard IEC 61000-4-30 [72]. Additionally, the mean value of three phase values is used as a representative. All factors that are included in the ADI are based on the differences between the measured 10 min aggregated power quality data and the recommended limits of the selected standard. In this article, the European standard EN 50160 [73] was selected to obtain global values. The applied limits based on EN 50160 [73] are presented in Table 1.

2.3. Investigated VPP

The investigated VPP is based on a fragment of the distribution network in the Lower Silesia region in Poland [32]. It is supplied by two substations, 110/20 kV. The mentioned substations are connected to a 110 kV electrical power system of Poland [74]. However, in this research, only one substation area was selected. The investigated 20 kV network fed from the station is an overhead-cable network. The selected MV network fed from the second station is mainly an urban cable network. This network has earth fault current compensation. Connected distributed energy resources to the VPP are a 1.25 MW hydro power plant and a 0.5 MW battery energy storage system. Those resources are connected to a MV level.
The simplified scheme of the investigated fragment of the virtual power plant area is presented in Figure 1. It consists of a 20 kV distribution network with 1.25 MW hydropower plant and an 0.5 MW battery energy storage system (ESS) connected with the HV/MV substation by MV line (1—MV). HPP and ESS are connected to the same node of the network. Also, two additional low-voltage loads are indicated: 3—LV and 4—LV. 3—LV is connected with indicated MV-associated lined. 4—LV is connected with the node of the HPP and ESS. Power quality recorders are denoted as a “R” and are also presented in Figure 1. Due to that, the hydro power plant and electric energy storage are connected to one node and their PQ recorders use the same voltage transformer. In further research, they are treated as one point indicated as 2 for PQ issues but the active power level is treated separately as 2-HPP and 2-ESS.

3. Power Quality Data as an Input to Cluster Analysis Techniques

In this section, the power quality data from VPP were used to prepare three different input databases. The proposed databases consist of classical power quality measurement and active power level as well as global power quality index, which was proposed in Section 2.2. Then, in Section 3.2, the comparison of cluster analysis with the k-mean algorithm and Euclidean distance was performed for those different input databases.

3.1. Input Databases Describtion

Under this investigation, three different databases were included. Each of the parameters are represented as one value from a 10 min time interval. The indicated databases are:
  • Database I—Raw PQ data + Pphase: consists of classical PQ parameters and active power level for each phase separately. This database consists of 22 variables that describe each 10 min data point.
  • Database II—PQ Global Indicators + Psum: consists of ADI components and active power level as a sum of each phase. This database consists of 7 variables that describe each 10 min data point.
  • Database III—Global PQ Index + Psum: consists of ADI and active power level as a sum of each phase. This database consists of 2 variables that describe each 10 min data point.
The first database (Raw PQ data + Pphase) consists of classic power quality parameters:
  • Three phase values of voltage,
  • Three phase values of 200 ms minimal values of voltage,
  • Three phase values of 200 ms maximal values of voltage,
  • Three phase values of short-term flicker severity,
  • One value of voltage unbalance,
  • Three phase values of total harmonic distortion in voltage,
  • Three phase values of 200 ms maximal values of total harmonic distortion in voltage,
  • Three phase values of active power level.
The second database (PQ Global Indicators + Psum) consists of ADI index components and sum of active power from all phases:
  • One value that represents voltage,
  • One value that represents 200 ms minimal and maximal values of voltage,
  • One value that represents short-term flicker severity,
  • One value that represents voltage unbalance,
  • One value that represents total harmonic distortion in voltage,
  • One value that represents 200 ms maximal values of total harmonic distortion in voltage,
  • One value that represents active power level: sum from three phases.
The third database (Global PQ Index + Psum) consists of ADI index and sum of active power from all phases:
  • One value that represents power quality: ADI,
  • One value that represents active power level: sum from three phases.
To summarize database construction, the simplified scheme is presented in Figure 2.

3.2. Selection of Optimal Database—Results for 26-Week Measurements

In this section, the measurement from five PQ recorders localized as indicated in Section 2.2 was used. The observed time was selected from 1 May to 29 October 2020, which represents 26 weeks of the measurements. Thus, in point of PQ assessment, there is an analysis of 26,208 single 10 min data points. However, for such a long period of multipoint measurements, the coverage of data is equal to 97.7%, thus 25,069 data points were used [71]. Also, as a preprocessing of PQ data, the data that come from the time when a voltage event occurred were excluded, as suggested in Reference [62]. So, the final number of 10 min data points was equal to 24,612.
Then, for such a defined measurement dataset, the input databases for cluster analysis were prepared. The database was a matrix that has 24,612 rows and a different number of columns. The number of columns was connected with five measurements and features of the database (check Figure 2). The size of each database set is as follows:
  • Dataset I: matrix 24,612 × 91, so concerns 2,421,692 single cells,
  • Dataset II: matrix 24,612 × 29, so concerns 713,748 single cells,
  • Dataset III: matrix 24,612 × 9, so concerns 221,508 single cells.
The next step of the investigation was to conduct a cluster analysis of the indicated power quality measurement. The aim was to verify if it is possible to use global indicators in place of classic PQ parameters to minimize the size of the dataset. As the main representant, the k-mean algorithm with Euclidean distance was selected. The final number of clusters was equal to 2. The results of this data-mining process in the time domain are presented in Figure 3.
To summarize the results of cluster analysis for those three input databases, Table 2 was prepared. In this table, the number of data that were connected to each cluster is given. Additionally, to compare the results of the clustering for different databases, the number of single cells that were included in different clusters compared to database I were calculated. As it can be observed, generally, the final classification for the k-mean algorithm with Euclidean distance for each dataset is similar. The difference between classification is no more than 111 single data, which is only 0.5% of the difference. It is important to notice that the final classification was obtained with 99.5% similarity and the reduction of the dataset was at 90%. Thus, the application of the global index as an input to cluster analysis for general issues is desirable.

4. Cluster Analysis for Identification of Different Working Conditions of Virtual Power Plant

The previous section indicated that database III is suitable for cluster analysis. The database uses a global index and sum of active power level for each observed measurement point. However, the division into two clusters of such a big database may not be sufficient. Thus, in this section, the investigation of the selection of the optimal number of clusters using the v-fold cross-validation scheme is performed. Then, for the selected number of the cluster, the qualitative assessment is realized to compare different working conditions of VPP.

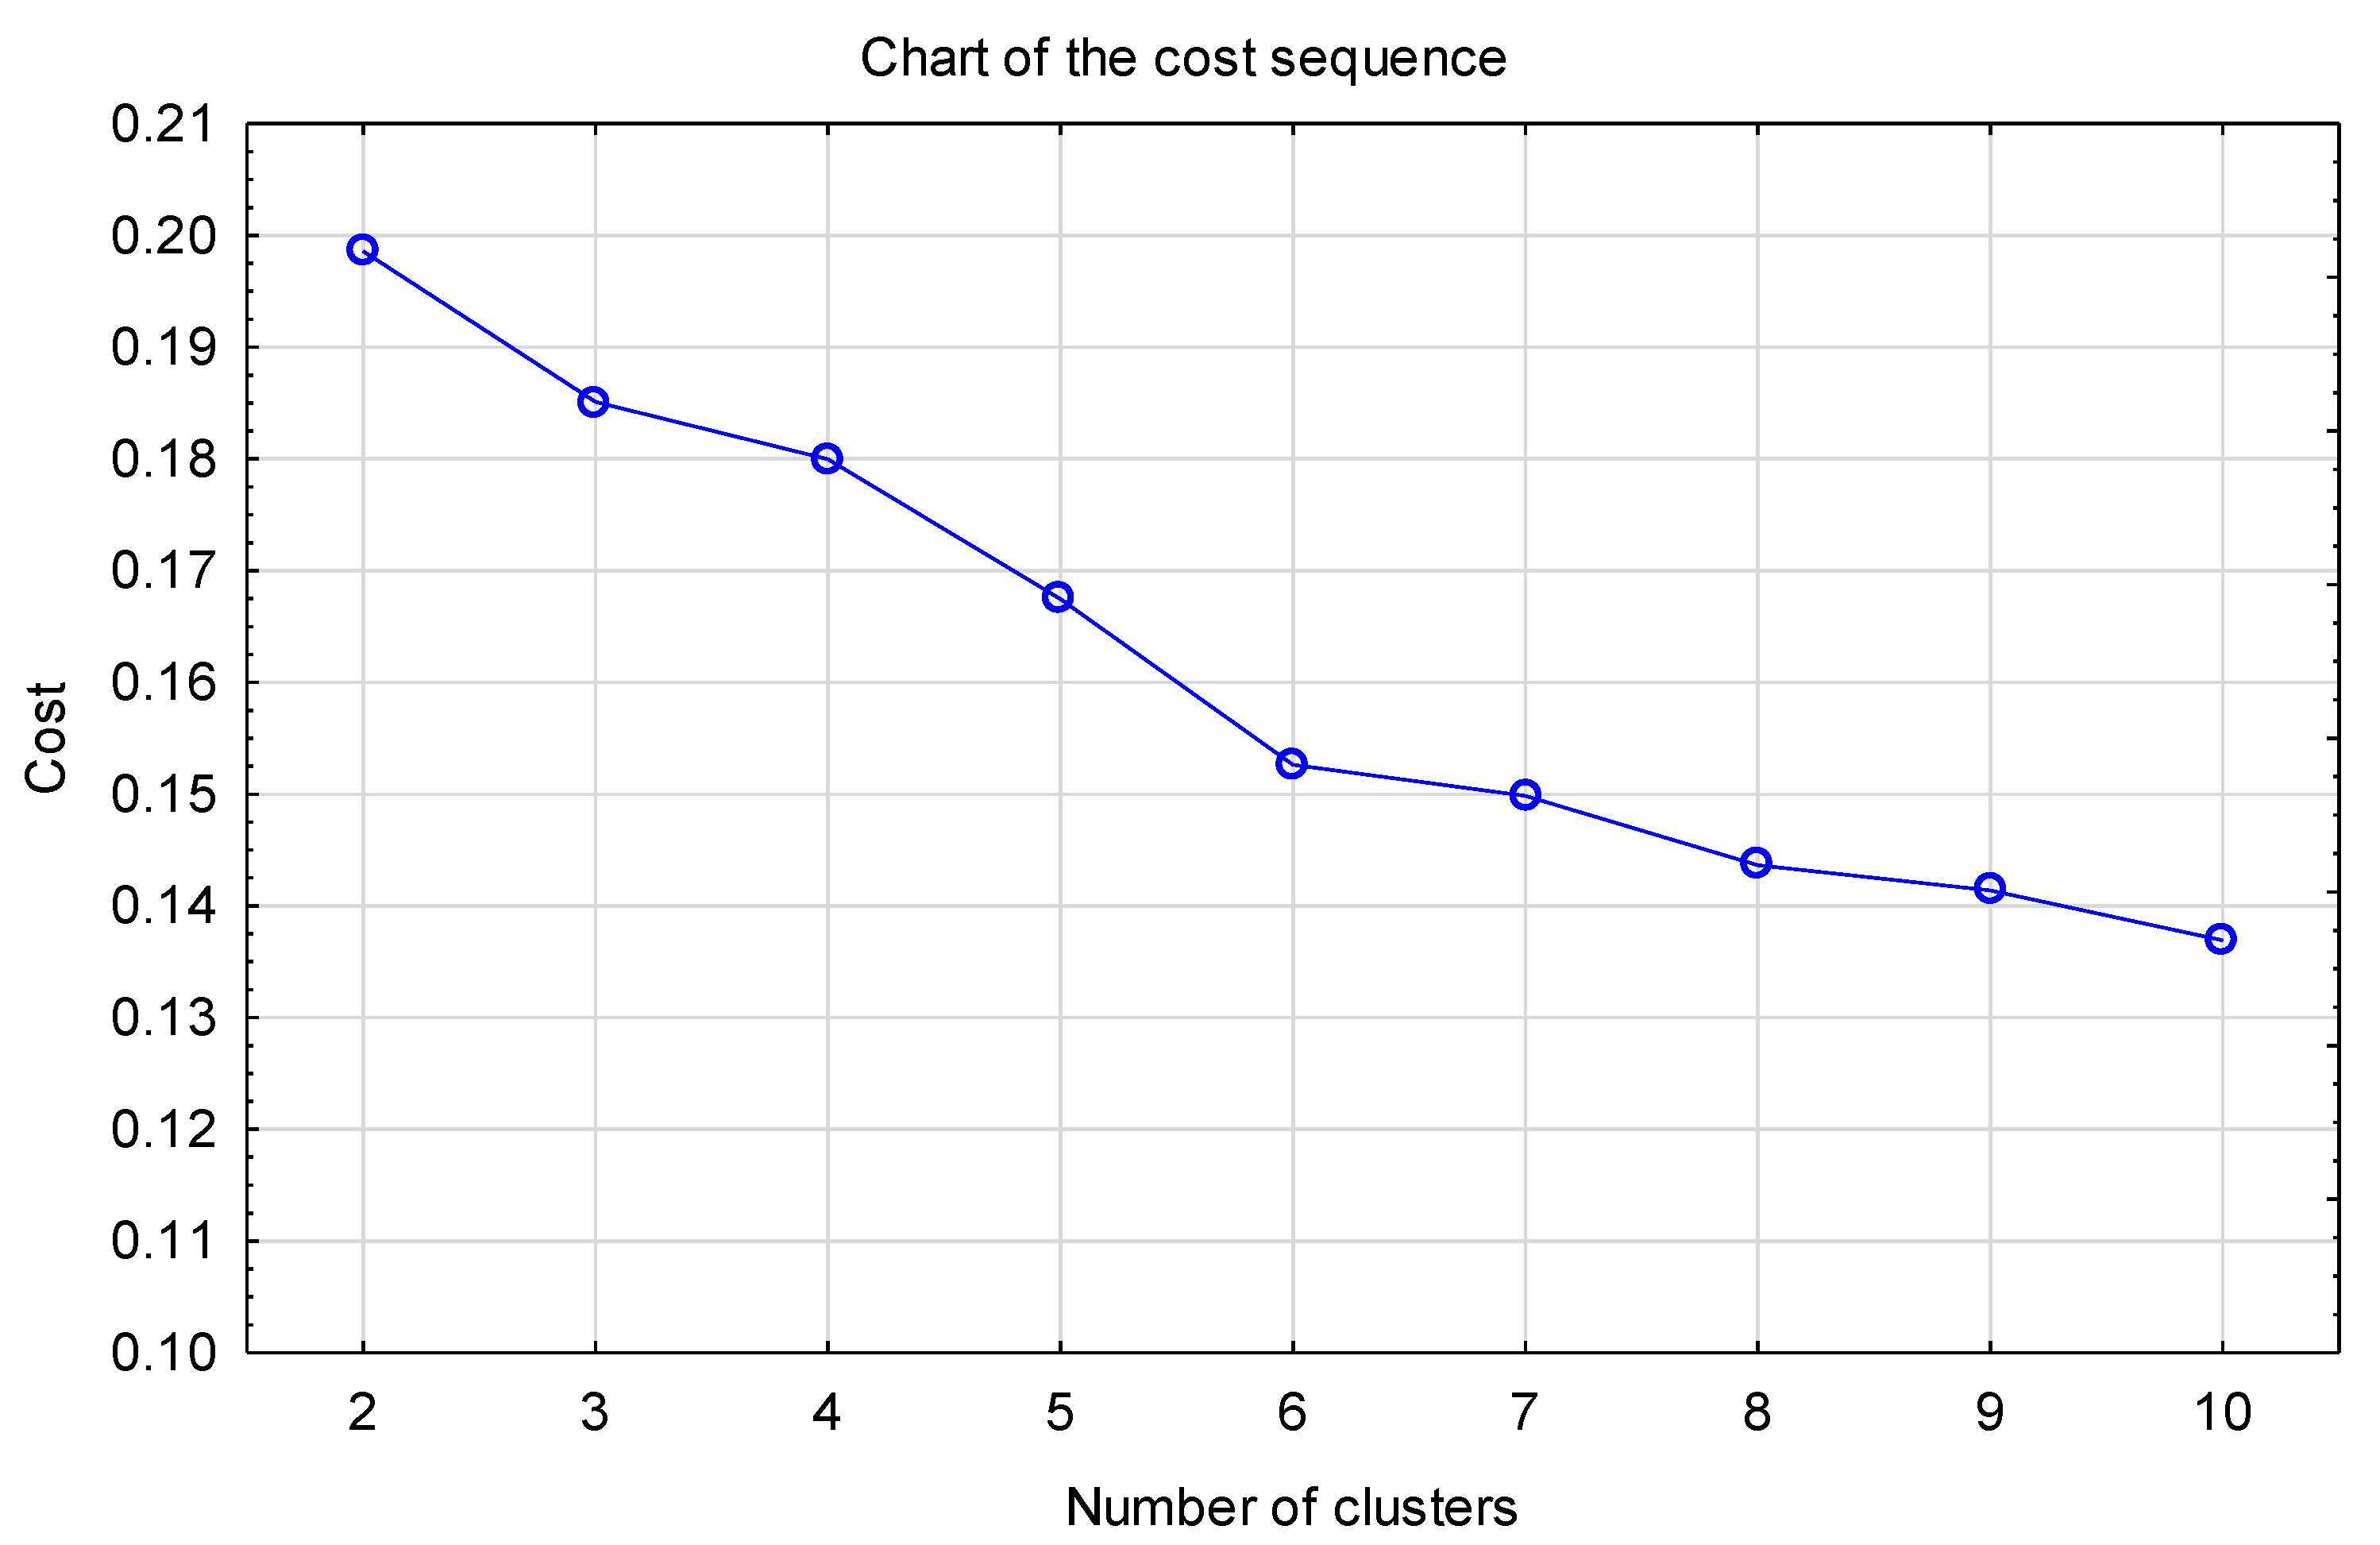
4.1. Optimal Number of Clusters

As it was indicated in Section 3.2, the selected input database for PQ issues was database III, which represents global indexes for measurement points and active power level. However, the cluster analysis for this dataset was realized for the previously determined number of clusters (2 clusters). But, to analyze the long-term data, the adequate number of final clusters is unknown at the beginning. Thus, there is a need for the introduction of other methods to obtain this. One of the known solutions is the application of the v-fold cross-validation.
Thus, the application of v-fold cross-validation was realized for dataset III. As a result, the chart of the cost sequence was obtained and is presented in Figure 4. The circumstances for this test were performed for the minimal number of clusters equal to 2 and maximal equal to 10. The maximal value equal to 10 is then justified and indicated, e.g., as in References [75,76].
However, to analyze this cost chart, the minimal percentage decrease was calculated. The results of these calculations are indicated in Table 3. In the literature, the most commonly used value of the range of minimal decrease is equal to 5% [69]. Thus, for the observed measurement data applied for database III, the optimal number of clusters is 3.

4.2. Qualitative Assessment of Clusters

As indicated in the previous subsection, the optimal number of clusters using v-fold cross-validation is equal to 3. Thus, in this section, the qualitative comparison is realized for each cluster. The results are presented in Table 4. Additionally, using the knowledge about the operation schedule of HPP and ESS, the main feature for each cluster was indicated.
Generally, the cluster analysis indicated one major working condition (cluster 1). Cluster 1 presents a time when HPP is switched off and ESS is not working with high power. As it can be observed, these conditions last for around 72% of the time. Cluster 2 corresponds to a time when HPP is generally working with high power that takes around 22% of the time, and during this time, ESS is charged/discharged with low power. Cluster 3 represents a time when ESS is discharged with high power. In point of power quality level, the most positive working condition is cluster 3, which represents the lowest value for the global index in each measurement point.

5. Discussion

This research demonstrated a case study of a virtual power plant that operates in the Lower Silesia in Poland. The presented virtual power plant operates at both low-voltage (LV) and medium-voltage (MV) levels of the distribution network. The investigation concerned synchronic measurements from 5 PQ recorders. The measurements were realized at both MV and LV levels. The measurements were based on 26 weeks (from 1 May to 28 October 2020). Thus, they represent long-term data when different working conditions may occur, but defining this working condition a priori would lead to missing some specific data. The solution for this is an application of cluster analysis that assures the division of data into clusters (that represent different working conditions) based on data features.
The indicated measurements were used as the sources for different databases. The used parameters were classical PQ parameters, proposed global indices, as well as the level of active power. Database I consists of classical PQ parameters and active power level for each phase, separately (22 variables for each measurement point). Database II consists of ADI components separately and active power level as a sum of each phase (7 variables for each measurement point). Database III consists of ADI and active power level as a sum of each phase (2 variables for each measurement point).
The cluster analysis for the k-mean algorithm with Euclidean distance for the three different databases generally indicated the same final classification for 2 clusters. The similarity of data clustering results was higher than 99.5%. So, applying the global index, which represents PQ level, reduced the size of the database by around 90% for the multipoint approach.
Another element of investigation was the proposition of selecting the optimal number of clusters. This step is always an important element of the research. In this article, the v-fold cross-validation was selected. Based on the cost sequence chart, the optimal number of clusters was equal to 3. However, the 6 and 9 clusters also were indicated if the cost sequence would be selected as 2% or 1%.
The final element of the investigation was the qualitative assessment of obtained cluster results. The qualitative comparison was realized for the number of clusters equal to 3, as indicated by the v-fold cross-validation test. The assessment was realized using the global index ADI [55,70]. The standard used to apply limits to the global value was EN 50160 [73]. The results of clustering were related to the working conditions of VPP units. The indicated results were described as a time when HPP and ESS are not working with high power (less than half of the nominal values), HPP is working with high power, and ESS is working with high power. The result of comparison in point of global index indicated that the most positive working condition was cluster 3 (ESS is working with high power). This result means that values of PQ parameter were closer to nominal (e.g., nominal voltage) or the smallest (e.g., asymmetry level).
The analysis of a single point for single PQ parameters seems more vulnerable. But for long-term assessment, such analysis is time-consuming. Additionally, the main purpose of the VPP is generally to achieve economic profits, and technical issues are mostly omitted. So, the proposition of using cluster analysis for the global index database seems interesting to extend the assessment of VPP in a long-term approach.
Finally, it is important to notice that the research was realized in a VPP that operates in Poland, but it may also be applied to other VPPs. Additionally, the proposed solution may also be applied only if long-term power quality data would be available and the different working conditions of monitored objects occur.

6. Conclusions

This article proposed the application of cluster analysis in a virtual power plant. Power quality measurements were used as input to prepare different databases. The databases consisted of classic parameters as well as the global indexes. The selected index (ADI) enabled simplifying the assessment from the number of classical PQ parameters to one global value as a representant of each measurement point. But, on the other hand, including extreme 200 ms values of voltage and harmonics parameters represents the extension to the classical methods. Thus, the global index approach simplifies the assessment and increases the range of used parameters during analysis.
The application of the global index as an input to the cluster analysis dataset enables to reduce the size to around 90% for clustering into 2 clusters. The results for 26 weeks of clustering were similar, with a level over 99.5%. Thus, such applications seem interesting.
The cluster analysis for the global index as an input database was indicated as useful for the identification of working conditions in point of PQ. Also, it enables to simplify the assessment between those working conditions, but using this global value does not enable to define the reason for this situation. However, it is a good first step for deep analysis.

Author Contributions

Conceptualization, M.J. and T.S.; methodology, M.J. and T.S.; software, M.J. and T.S.; validation, D.K., J.R. and V.S.; formal analysis, M.J., T.S., D.K. and J.R.; investigation, M.J. and T.S.; resources, P.K., P.J., J.B. and P.P.; data curation, V.S. and J.S.; writing—original draft preparation M.J. and T.S.; writing—review and editing, D.K. and J.R.; visualization, D.K. and J.R.; supervision, T.S., J.R. and Z.L.; project administration, T.S. and P.J.; funding acquisition, T.S. and P.J. All authors have read and agreed to the published version of the manuscript.

Funding

This research was funded by the National Center of Research and Development in Poland, the project “Developing a platform for aggregating generation and regulatory potential of dispersed renewable energy sources, power retention devices and selected categories of controllable load” supported by European Union Operational Programme Smart Growth 2014–2020, Priority Axis I: Supporting R & D carried out by enterprises, Measure 1.2: Sectoral R & D Programmes, POIR.01.02.00-00-0221/16, performed by TAURON Ekoenergia Ltd.

Institutional Review Board Statement

Not applicable.

Informed Consent Statement

Not applicable.

Data Availability Statement

The data are not publicly available due to policy of associate company.

Conflicts of Interest

The authors declare no conflict of interest.

References

  1. Li, Y.; Gao, D.W.; Gao, W.; Zhang, H.; Zhou, J. Double-mode energy management for multi-energy system via distributed dynamic event-triggered Newton-Raphson algorithm. IEEE Trans. Smart Grid 2020, 11, 5339–5356. [Google Scholar] [CrossRef]
  2. Li, Y.; Zhang, H.; Liang, X.; Huang, B. Event-triggered-based distributed cooperative energy management for multienergy systems. IEEE Trans. Ind. Inform. 2019, 15, 2008–2022. [Google Scholar] [CrossRef]
  3. Yushuai, L.; Gao, W.; Gao, W.; Zhang, H.; Zhou, J. A distributed double-Newton descent algorithm for cooperative energy management of multiple energy bodies in energy internet. IEEE Trans. Ind. Inform. 2020, 1. [Google Scholar] [CrossRef]
  4. Yavuz, L.; Önen, A.; Muyeen, S.; Kamwa, I. Transformation of microgrid to virtual power plant–a comprehensive review. IET Gener. Transm. Distrib. 2019, 13, 1994–2005. [Google Scholar] [CrossRef]
  5. Lis, R.; Czechowski, R. Transformation of microgrid to virtual power plant. In Variability, Scalability and Stability of Microgrids; Institution of Engineering and Technology (IET): Stevenage, UK, 2019; pp. 99–142. [Google Scholar]
  6. Jenkins, A.; Patsios, C.; Taylor, P.; Khayrullina, A.; Chirkin, V. Optimising virtual power plant response to grid service requests at newcastle science central by coordinating multiple flexible assets. CIRED Workshop 2016 2016, 4, 212. [Google Scholar] [CrossRef] [Green Version]
  7. Gabderakhmanova, T.; Engelhardt, J.; Zepter, J.M.; Sorensen, T.M.; Boesgaard, K.; Ipsen, H.H.; Marinelli, M. Demonstrations of DC microgrid and virtual power plant technologies on the Danish island of Bornholm. In Proceedings of the 2020 55th International Universities Power Engineering Conference (UPEC), Torino, Italy, 1–4 September 2020; pp. 1–6. [Google Scholar]
  8. Van Summeren, L.F.; Wieczorek, A.J.; Bombaerts, G.J.; Verbong, G.P. Community energy meets smart grids: Reviewing goals, structure, and roles in Virtual Power Plants in Ireland, Belgium and the Netherlands. Energy Res. Soc. Sci. 2020, 63, 101415. [Google Scholar] [CrossRef]
  9. Nikolaou, T.; Stavrakakis, G.S.; Tsamoudalis, K. Modeling and optimal dimensioning of a pumped hydro energy storage system for the exploitation of the rejected wind energy in the non-interconnected electrical power system of the Crete island, Greece. Energies 2020, 13, 2705. [Google Scholar] [CrossRef]
  10. Heimgaertner, F.; Schur, E.; Truckenmueller, F.; Menth, M. A Virtual power plant demonstration platform for multiple optimization and control systems. In Proceedings of the International ETG Congress 2017, Bonn, Germany, 28–29 November 2017; pp. 1–6. [Google Scholar]
  11. Zhao, H.; Wang, B.; Pan, Z.; Sun, H.; Guo, Q.; Xue, Y. Aggregating additional flexibility from quick-start devices for multi-energy virtual power plants. IEEE Trans. Sustain. Energy 2020, 1, 646–658. [Google Scholar] [CrossRef]
  12. Sharma, H.; Mishra, S. Techno-economic analysis of solar grid-based virtual power plant in Indian power sector: A case study. Int. Trans. Electr. Energy Syst. 2020, 30. [Google Scholar] [CrossRef]
  13. Behi, B.; Baniasadi, A.; Arefi, A.; Gorjy, A.; Jennings, P.; Pivrikas, A. Cost–benefit analysis of a virtual power plant including solar PV, flow battery, heat pump, and demand management: A western australian case study. Energies 2020, 13, 2614. [Google Scholar] [CrossRef]
  14. Jeon, W.; Cho, S.; Lee, S. Estimating the impact of electric vehicle demand response programs in a grid with varying levels of renewable energy sources: Time-of-use tariff versus smart charging. Energies 2020, 13, 4365. [Google Scholar] [CrossRef]
  15. Moutis, P.; Georgilakis, P.S.; Hatziargyriou, N.D. Voltage regulation support along a distribution line by a virtual power plant based on a center of mass load modeling. IEEE Trans. Smart Grid 2018, 9, 3029–3038. [Google Scholar] [CrossRef]
  16. Dall’Anese, E.; Guggilam, S.S.; Simonetto, A.; Chen, Y.C.; Dhople, S.V. Optimal regulation of virtual power plants. IEEE Trans. Power Syst. 2018, 33, 1868–1881. [Google Scholar] [CrossRef]
  17. Paternina, J.L.; Contreras, L.; Trujillo, E.R. Study of voltage stability in a distribution network by integrating distributed energy resources into a virtual power plant. Contemp. Eng. Sci. 2017, 10, 1441–1455. [Google Scholar] [CrossRef]
  18. Ishihara, H.; Nada, K.; Tanaka, M.; Inoue, S.; Kuwata, A.; Takano, T. A Voltage control method for power distribution lines utilizing dispersed customer resources. In Proceedings of the 2020 22nd European Conference on Power Electronics and Applications (EPE’20 ECCE Europe), Lyon, France, 7–11 September 2020; pp. 1–8. [Google Scholar]
  19. Konara, K.; Kolhe, M.; Sharma, A. Power flow management controller within a grid connected photovoltaic based active generator as a finite state machine using hierarchical approach with droop characteristics. Renew. Energy 2020, 155, 1021–1031. [Google Scholar] [CrossRef]
  20. Haque, M.M.; Wolfs, P.; Alahakoon, S. Active power flow control of three-port converter for virtual power plant applications. In Proceedings of the 2020 IEEE International Conference on Power Electronics, Smart Grid and Renewable Energy (PESGRE2020), Cochin, India, 20 April 2020; pp. 1–6. [Google Scholar]
  21. Pudjianto, D.; Djapic, P.; Strbac, G.; Stojkovska, B.; Ahmadi, A.R.; Martinez, I. Integration of distributed reactive power sources through Virtual Power Plant to provide voltage control to transmission network. In Proceedings of the CIRED 2019 Conference, Madrid, Spain, 3–6 June 2019. [Google Scholar]
  22. Kaczorowska, D.; Rezmer, J.; Sikorski, T.; Janik, P. Application of PSO algorithms for VPP operation optimization. Renew. Energy Power Qual. J. 2019, 17, 91–96. [Google Scholar] [CrossRef]
  23. Candra, D.I.; Hartmann, K.; Nelles, M. Economic Optimal Implementation of Virtual Power Plants in the German Power Market. Energies 2018, 11, 2365. [Google Scholar] [CrossRef]
  24. Moreno, B.; Díaz, G. The impact of virtual power plant technology composition on wholesale electricity prices: A comparative study of some European Union electricity markets. Renew. Sustain. Energy Rev. 2019, 99, 100–108. [Google Scholar] [CrossRef]
  25. Sikorski, T.; Jasiński, M.; Sobierajski, M.; Szymańda, J.; Bejmert, D.; Janik, P.; Ropuszyńska-Surma, E.; Węglarz, M.; Kaczorowska, D.; Kostyła, P.; et al. A case study on distributed energy resources and energy-storage systems in a virtual power plant concept: Economic aspects. Energies 2019, 12, 4447. [Google Scholar] [CrossRef] [Green Version]
  26. Foroughi, M.; Pasban, A.; Moeini-Aghtaie, M.; Fayaz-Heidari, A. A bi-level model for optimal bidding of a multi-carrier technical virtual power plant in energy markets. Int. J. Electr. Power Energy Syst. 2021, 125, 106397. [Google Scholar] [CrossRef]
  27. Rahimiyan, M.; Baringo, L. Real-time energy management of a smart virtual power plant. IET Gener. Transm. Distrib. 2019, 13, 2015–2023. [Google Scholar] [CrossRef]
  28. Othman, M.M.; Hegazy, Y.; Abdelaziz, A.Y. Electrical energy management in unbalanced distribution networks using virtual power plant concept. Electr. Power Syst. Res. 2017, 145, 157–165. [Google Scholar] [CrossRef]
  29. Mears, A.; Martin, J. Fully flexible loads in distributed energy management: PV, batteries, loads, and value stacking in virtual power plants. Engineering 2020, 6, 736–738. [Google Scholar] [CrossRef]
  30. Maanavi, M.; Najafi, A.; Godina, R.; Mahmoudian, M.; Rodrigues, E.M.G. Energy management of virtual power plant considering distributed generation sizing and pricing. Appl. Sci. 2019, 9, 2817. [Google Scholar] [CrossRef] [Green Version]
  31. Jha, B.K.; Singh, A.; Kumar, A.; Misra, R.K.; Singh, D. Phase unbalance and PAR constrained optimal active and reactive power scheduling of Virtual Power Plants (VPPs). Int. J. Electr. Power Energy Syst. 2021, 125, 106443. [Google Scholar] [CrossRef]
  32. Sikorski, T.; Jasiński, M.; Sobierajski, M.; Szymańda, J.; Bejmert, D.; Janik, P.; Solak, B.; Ropuszyńska-Surma, E.; Węglarz, M.; Kaczorowska, D.; et al. A case study on distributed energy resources and energy-storage systems in a virtual power plant concept: Technical aspects. Energies 2020, 13, 3086. [Google Scholar] [CrossRef]
  33. Sun, H.; Meng, J.; Peng, C. Coordinated optimization scheduling of multi-region virtual power plant with wind-power/Photovoltaic/Hydropower/Carbon-capture units. Dianwang Jishu/Power Syst. Technol. 2019, 43, 4040–4049. [Google Scholar] [CrossRef]
  34. Jiao, F.; Deng, Y.; Li, D.; Wei, B.; Yue, C.; Cheng, M.; Zhang, Y.; Zhang, J. A self-scheduling strategy of virtual power plant with electric vehicles considering margin indexes. Arch. Electr. Eng. 2020, 69, 907–920. [Google Scholar] [CrossRef]
  35. Sun, J.; Li, X.; Ma, H. Study on optimal capacity of multi-type energy storage system for optimized operation of virtual power plants. In Proceedings of the 2018 China International Conference on Electricity Distribution (CICED), Tianjin, China, 31 December 2018; pp. 2989–2993. [Google Scholar]
  36. Han, N.; Wang, X.; Chen, S.; Cheng, L.; Liu, H.; Liu, Z.; Mao, Y. Optimal configuration of energy storage systems in virtual power plants including large-scale distributed wind power. IOP Conf. Series: Earth Environ. Sci. 2019, 295, 042072. [Google Scholar] [CrossRef]
  37. Sadeghian, O.; Oshnoei, A.; Khezri, R.; Muyeen, S. Risk-constrained stochastic optimal allocation of energy storage system in virtual power plants. J. Energy Storage 2020, 31, 101732. [Google Scholar] [CrossRef]
  38. Kim, S.; Kwon, W.-H.; Kim, H.-J.; Jung, K.; Kim, G.S.; Shim, T.; Lee, D. Offer curve generation for the energy storage system as a member of the virtual power plant in the day-ahead market. J. Electr. Eng. Technol. 2019, 14, 2277–2287. [Google Scholar] [CrossRef]
  39. Pudjianto, D.; Ramsay, C.; Strbac, G. Microgrids and virtual power plants: Concepts to support the integration of distributed energy resources. Proc. Inst. Mech. Eng. Part. A: J. Power Energy 2008, 222, 731–741. [Google Scholar] [CrossRef]
  40. Etherden, N.; Vyatkin, V.; Bollen, M.H.J. Virtual power plant for grid services using IEC 61850. IEEE Trans. Ind. Inform. 2016, 12, 437–447. [Google Scholar] [CrossRef]
  41. Gong, J.; Xie, D.; Jiang, C.; Zhang, Y. Multiple objective compromised method for power management in virtual power plants. Energies 2011, 4, 700–716. [Google Scholar] [CrossRef]
  42. Caldon, R.; Patria, A.; Turri, R. Optimal control of a distribution system with a virtual power plant. In Proceedings of the Bulk Power System Dynamics and Control VI, Cortina d, ’AmpezzoItaly, 22–27 April 2004; pp. 278–284. [Google Scholar]
  43. Beguin, A.; Nicolet, C.; Kawkabani, B.; Avellan, F. Virtual power plant with pumped storage power plant for renewable energy integration. In Proceedings of the 2014 International Conference on Electrical Machines (ICEM), Berlin, Germany, 2–5 September 2014; pp. 1736–1742. [Google Scholar]
  44. Zhang, J.; Xu, Z.; Xu, W.; Zhu, F.; Lyu, X.; Fu, M. BI-objective dispatch of multi-energy virtual power plant: Deep-learning-based prediction and particle swarm optimization. Appl. Sci. 2019, 9, 292. [Google Scholar] [CrossRef] [Green Version]
  45. Kong, X.; Xiao, J.; Liu, D.; Wu, J.; Wang, C.; Shen, Y. Robust stochastic optimal dispatching method of multi-energy virtual power plant considering multiple uncertainties. Appl. Energy 2020, 279, 115707. [Google Scholar] [CrossRef]
  46. Yi, Z.; Xu, Y.; Gu, W.; Wu, W. A multi-time-scale economic scheduling strategy for virtual power plant based on deferrable loads aggregation and disaggregation. IEEE Trans. Sustain. Energy 2019, 11, 1332–1346. [Google Scholar] [CrossRef]
  47. Luo, Z.; Hong, S.; Ding, Y. A data mining-driven incentive-based demand response scheme for a virtual power plant. Appl. Energy 2019, 239, 549–559. [Google Scholar] [CrossRef]
  48. Ai, X.; Yang, Z.; Hu, H.; Wang, Z.; Peng, D.; Zhao, Z. A load curve clustering method based on improved k-means algorithm for virtual power plant and its application. Dianli Jianshe/Electric Power Constr. 2020, 41, 28–36. [Google Scholar] [CrossRef]
  49. Raptis, T.; Vokas, G.; Langouranis, P.; Kaminaris, S. Total power quality index for electrical networks using neural networks. Energy Procedia 2015, 74, 1499–1507. [Google Scholar] [CrossRef] [Green Version]
  50. Langouranis, P.; Kaminaris, S.; Vokas, G.; Raptis, T.; Ioannidis, G. Fuzzy total power quality index for electric networks. MedPower 2014, 81. [Google Scholar] [CrossRef]
  51. Ge, B.; Pan, T.; Li, Z. Synthetic assessment of power quality using relative entropy theory. J. Comput. Inf. Syst. 2015, 11, 1323–1331. [Google Scholar] [CrossRef]
  52. De Capua, C.; De Falco, S.; Liccardo, A.; Romeo, E. Improvement of new synthetic power quality indexes: An original approach to their validation. In Proceedings of the 2005 IEEE Instrumentation and Measurement Technology Conference, Ottawa, ON, Canada, 13 March 2006; Volume 2, pp. 819–822. [Google Scholar]
  53. Lee, B.; Sohn, D.; Kim, K.M. Development of power quality index using ideal analytic hierarchy process. Lect. Notes Electr. Eng. 2016, 376, 783–793. [Google Scholar] [CrossRef]
  54. Serpak, M. A unified index and system indicator for global power quality assessment. Sci. Int. 2016, 28, 1131–1136. [Google Scholar]
  55. Jasiński, M.; Sikorski, T.; Kostyła, P.; Leonowicz, Z.; Borkowski, K. Combined cluster analysis and global power quality indices for the qualitative assessment of the time-varying condition of power quality in an electrical power network with distributed generation. Energies 2020, 13, 2050. [Google Scholar] [CrossRef] [Green Version]
  56. Nourollah, S.; Moallem, M. A data mining method for obtaining global power quality index. In Proceedings of the 2011 2nd International Conference on Electric Power and Energy Conversion Systems (EPECS), Sharjah, United Arab Emirates, 12 January 2011; pp. 1–7. [Google Scholar]
  57. Klajn, A.; Bątkiewicz-Pantua, M. Application Note–Standard EN 50 160: Voltage Characteristics of Electricity Supplied by Public Electricity Networks; European Copper Institute: Woluwe-Saint-Pierre, Belgium, 2017. [Google Scholar]
  58. Roiger, R.J. Data Mining; Chapman and Hall/CRC: London, UK, 2017; ISBN 9781315382586. [Google Scholar]
  59. Vehkalahti, K.; Everitt, B.S. Multivariate Analysis for the Behavioral Sciences, 2nd ed.; CRC Press: Boca Raton, FL, USA, 2019; ISBN 9781351202275. [Google Scholar]
  60. Filzmoser, P.; Hron, K.; Templ, M. Applied Compositional Data Analysis; Springer Series in Statistics; Springer International Publishing: Cham, China, 2018; ISBN 978-3-319-96420-1. [Google Scholar]
  61. Wierzchoń, S.; Kłopotek, M. Modern Algorithms of Cluster Analysis; Studies in Big Data; Springer International Publishing: Cham, Switzerland,, 2018; Volume 34, ISBN 978-3-319-69307-1. [Google Scholar]
  62. Jasiński, M.; Sikorski, T.; Borkowski, K. Clustering as a tool to support the assessment of power quality in electrical power networks with distributed generation in the mining industry. Electr. Power Syst. Res. 2019, 166, 52–60. [Google Scholar] [CrossRef]
  63. Kapil, S.; Chawla, M. Performance evaluation of K-means clustering algorithm with various distance metrics. In Proceedings of the 2016 IEEE 1st International Conference on Power Electronics, Intelligent Control and Energy Systems (ICPEICES), Delhi, India, 16 February 2016; pp. 1–4. [Google Scholar]
  64. Faber, P.; Fisher, R. Pros and cons of Euclidean fitting. Computer Vis. 2001, 2191, 414–420. [Google Scholar] [CrossRef]
  65. Wierzchoń, S.; Kłopotek, M. Algorithms of Cluster Analysis; Institute of Computer Science Polish Academy of Sciences: Warsaw, Poland, 2015; Volume 3, ISBN 9789638759627. [Google Scholar]
  66. Chowdhury, K.; Chaudhuri, D.; Pal, A.K. An entropy-based initialization method of K-means clustering on the optimal number of clusters. Neural Comput. Appl. 2020, 1–18. [Google Scholar] [CrossRef]
  67. Yang, J.; Lee, J.-Y.; Choi, M.; Joo, Y. A New Approach to Determine the Optimal Number of Clusters Based on the Gap Statistic. In Machine Learning for Networking; Springer International Publishing: New York, NY, USA, 2020; pp. 227–239. [Google Scholar] [CrossRef]
  68. Silva, J.; Lezama, O.B.P.; Varela, N.; Guiliany, J.G.; Sanabria, E.S.; Otero, M.S.; Rojas, V. Álvarez U-control chart based differential evolution clustering for determining the number of cluster in k-means. Computer Vis. 2019, 31–41. [Google Scholar] [CrossRef]
  69. Statsoft Polska. StatSoft Electronic Statistic Textbook. Available online: http:www.statsoft.pl/textbook/stathome.html (accessed on 15 December 2020).
  70. Jasinski, M.; Sikorski, T.; Kostvla, P.; Borkowski, K. Global power quality indices for assessment of multipoint Power quality measurements. In Proceedings of the 2018 10th International Conference on Electronics, Computers and Artificial Intelligence (ECAI), Iasi, Romania, 28–30 June 2018; pp. 1–6. [Google Scholar]
  71. Jasiński, M.; Sikorski, T.; Kaczorowska, D.; Rezmer, J.; Suresh, V.; Leonowicz, Z.; Kostyla, P.; Szymańda, J.; Janik, P. A case study on power quality in a virtual power plant: Long term assessment and global index application. Energies 2020, 13, 6578. [Google Scholar] [CrossRef]
  72. International Electrotechnical Commission (IEC) 61000 4-30. Electromagnetic Compatibility (EMC)–Part 4-30: Testing and Measurement Techniques–Power Quality Measurement Methods; IEC: Geneva, Switzerland, 2015. [Google Scholar]
  73. European Standards EN 50160. Voltage Characteristics of Electricity Supplied by Public Distribution Network 2010. Available online: http://copperalliance.org.uk/uploads/2018/03/542-standard-en-50160-voltage-characteristics-in.pdf (accessed on 15 December 2020).
  74. Jasinski, M.; Sikorski, T.; Kaczorowska, D.; Kostyla, P.; Leonowicz, Z.; Rezmer, J.; Janik, P.; Bejmert, D. Global power quality index application in virtual power plant. In Proceedings of the 2020 12th International Conference and Exhibition on Electrical Power Quality and Utilisation (EPQU), Kraków, Poland, 14–15 September 2020; pp. 1–6. [Google Scholar]
  75. Kang, J.; Lee, J.-H. Electricity customer clustering following experts’ principle for demand response applications. Energies 2015, 8, 12242–12265. [Google Scholar] [CrossRef] [Green Version]
  76. Claeys, R.; Azaioud, H.; Cleenwerck, R.; Knockaert, J.; Desmet, J. A novel feature set for low-voltage consumers, based on the temporal dependence of consumption and peak demands. Energies 2020, 14, 139. [Google Scholar] [CrossRef]
Figure 1. Investigated part of VPP with the placement of PQ recorders. Where: 1—MV: medium-voltage line; 2HPP—MW: medium-voltage hydro power plant; 2EES—MW: medium-voltage electric energy storage; 3—LV: low-voltage load related with MV line; 4—LV: low-voltage load related with hydro power plant substation.
Energies 14 00974 g001
Figure 2. Simplified scheme of the proposed input databases.
Energies 14 00974 g002
Figure 3. Results of cluster analysis for different input databases. (a) Database I: raw PQ data + Pphase, (b) Database II: ADI components separately + Psum, (c) Database III: ADI + Psum.
Energies 14 00974 g003
Figure 4. Cost sequence in relation for the number of clusters for v-fold cross-validation for database III and k-mean algorithm with Euclidean distance.
Energies 14 00974 g004
Table 1. Acceptable values base on standard EN 50160 [73] used for the global index.
ParameterValue
voltage10% of declared voltage
short-term flicker severity1.0
asymmetry2%
total harmonic distortion in voltage8%
Table 2. The number of 10 min data points in each cluster for different input databases, and simplified comparison.
DatabaseCluster 1Cluster 2Difference to Basic Database
Database I: raw PQ data + Pphase657918,034-
Database II: ADI components separately + Psum648318,129108
Database III: ADI + Psum666117,951111
Table 3. The calculations of minimal decrease for v-fold cross-validation test results.
Range of minimal decrease1%2%3–6%≤7%
Optimal number of clusters9 clusters6 clusters3 clusters2 clusters
Table 4. Qualitative assessment between clusters and main defining feature.
ClusterGlobal IndexMain Feature of Dataset in Point of VPPNumber of 10 min Data Points
1-G2-G3-G4-G
10.0810.0680.0770.088ESS and HPP are not working with high power17,765
20.0760.0730.0790.087HPP is working with high power5432
30.0730.0670.0680.084ESS is discharging with high power1415
Publisher’s Note: MDPI stays neutral with regard to jurisdictional claims in published maps and institutional affiliations.

