Article

Impact of Harmonic Currents of Nonlinear Loads on Power Quality of a Low Voltage Network–Review and Case Study

Faculty of Electrical Engineering, Wroclaw University of Science and Technology, 50-370 Wroclaw, Poland
*
Author to whom correspondence should be addressed.
Energies 2021, 14(12), 3665; https://doi.org/10.3390/en14123665
Submission received: 10 May 2021 / Revised: 6 June 2021 / Accepted: 16 June 2021 / Published: 19 June 2021
(This article belongs to the Special Issue Machine Learning and Data Mining Applications in Power Systems)

Abstract

:
The paper presents a power-quality analysis in the utility low-voltage network focusing on harmonic currents’ pollution. Usually, to forecast the modern electrical and electronic devices’ contribution to increasing the current total harmonic distortion factor ( T H D I ) and exceeding the regulation limit, analyses based on tests and models of individual devices are conducted. In this article, a composite approach was applied. The performance of harmonic currents produced by sets of devices commonly used in commercial and residential facilities’ nonlinear loads was investigated. The measurements were conducted with the class A PQ analyzer (FLUKE 435) and dedicated to the specialized PC software. The experimental tests show that the harmonic currents produced by multiple types of nonlinear loads tend to reduce the current total harmonic distortion factor ( T H D I ) . The changes of harmonic content caused by summation and/or cancellation effects in total current drawn from the grid by nonlinear loads should be a key factor in harmonic currents’ pollution study. Proper forecasting of the level of harmonic currents injected into the utility grid helps to maintain the quality of electricity at an appropriate level and reduce active power losses, which have a direct impact on the price of electricity generation.

1. Introduction

Power electronics components and microprocessors are the key entities of the evolution of nonlinear loads and smart devices/systems in commercial and household environments [1,2]. On one hand, due to their nonlinear V–I characteristics, these devices introduce power quality (PQ) problems in the electric power distribution system, and on the other hand they are sensitive to the PQ level. In the case of electrical energy billing, even the revenue meters that measure electrical quantities may be not immune enough to the impact generated by disturbing devices [3,4,5]. Since the intensified integration of nonlinear components, PQ monitoring is essential to improving the performance of both power system equipment and the end-user loads. [6,7] Thus, the PQ disturbances are the responsibility of not only utilities but also end-users, manufacturers as well as researchers, and engineers. [8,9] The remarkable growth in research and development work on identifying the avoidable energy losses caused by poor PQ has been observed in recent years [10,11,12,13,14,15,16]. The proper measurements and analysis of the distribution system and implementation of the evolving methods and techniques to improve the condition of the supply system are developing areas of present-day electrical engineering [17,18,19].
Due to the nonlinearity of the electrical devices, the major fault in PQ is observed as harmonic pollution. The severity of harmonic disturbances contained in the current signal can be specified collectively by the current total harmonic distortion factor ( T H D I ), which can be calculated according to the formula:
T H D I = h = 2 I h 2 I 1 · 100 % ,
where,
  • I h ∔RMS value of the individual harmonic component of order h for current,
  • I 1 ∔RMS value of the fundamental harmonic (a component of order 1 ) for current.
To forecast how increased nonlinear loads will contribute to the T H D I level and when they may exceed the regulation limit, harmonic impact and propagation studies of the distribution network need to be performed for future scenarios [20,21,22]. Distribution system operators can use these analyses and simulations to take preventive steps to avoid deterioration and improve the PQ level [23].
Currently, the increase of new technologies and the changing of conventional appliances to power electronic-driven appliances can be observed in residential and commercial buildings feeding from the LV distribution networks [18,24]. Modern power electronic-driven appliances can be divided into four groups (Figure 1).
This nonlinear electrical equipment which, indeed, forms the power system is one of the main causes of harmonic distortion. Since its AC circuit topology draws, often in a pulsed manner, a distorted current whose waveform shape does not resemble the applied voltage waveform shape for the considered cycle, it is non–sinusoidal [21,25].

2. Review

2.1. Problems Caused by Harmonic Currents

The first and major problems caused by harmonic currents in the mains feeding residential and commercial buildings are those caused by voltage waveform distortion [18]. Due to the propagation of harmonic currents through a finite system impedance, the vector sum of all individual voltage drops results in the increased voltage total harmonic distortion factor ( T H D V ), which contributes to significant deterioration of power quality and affects the effective performance of consumers’ devices connected to the same point of common coupling (PCC).
Figure 2 shows the power system where multiple customers are connected at PCC with different operating and load conditions. Because of the significantly distorted supply voltage waveform, all electrical devices (also linear ones) will generate nonlinear currents (in different degrees) [25].
The levels of harmonic currents which the customers are allowed to inject into the power network at the PCC are limited by standards [26,27].
The second problem caused by harmonic currents is associated with the harmonic currents themselves [28]. The harmonic currents injected into distribution networks cause high disturbances [22,29], such as:
  • overheating and failure of transformers and other power equipment;
  • false tripping of protection relays;
  • overcurrent on equipment-neutral connection wiring;
  • errors in the operation and control of sensitive devices (e.g., microprocessors); and
  • interference with communication signals (digital technology), and others.

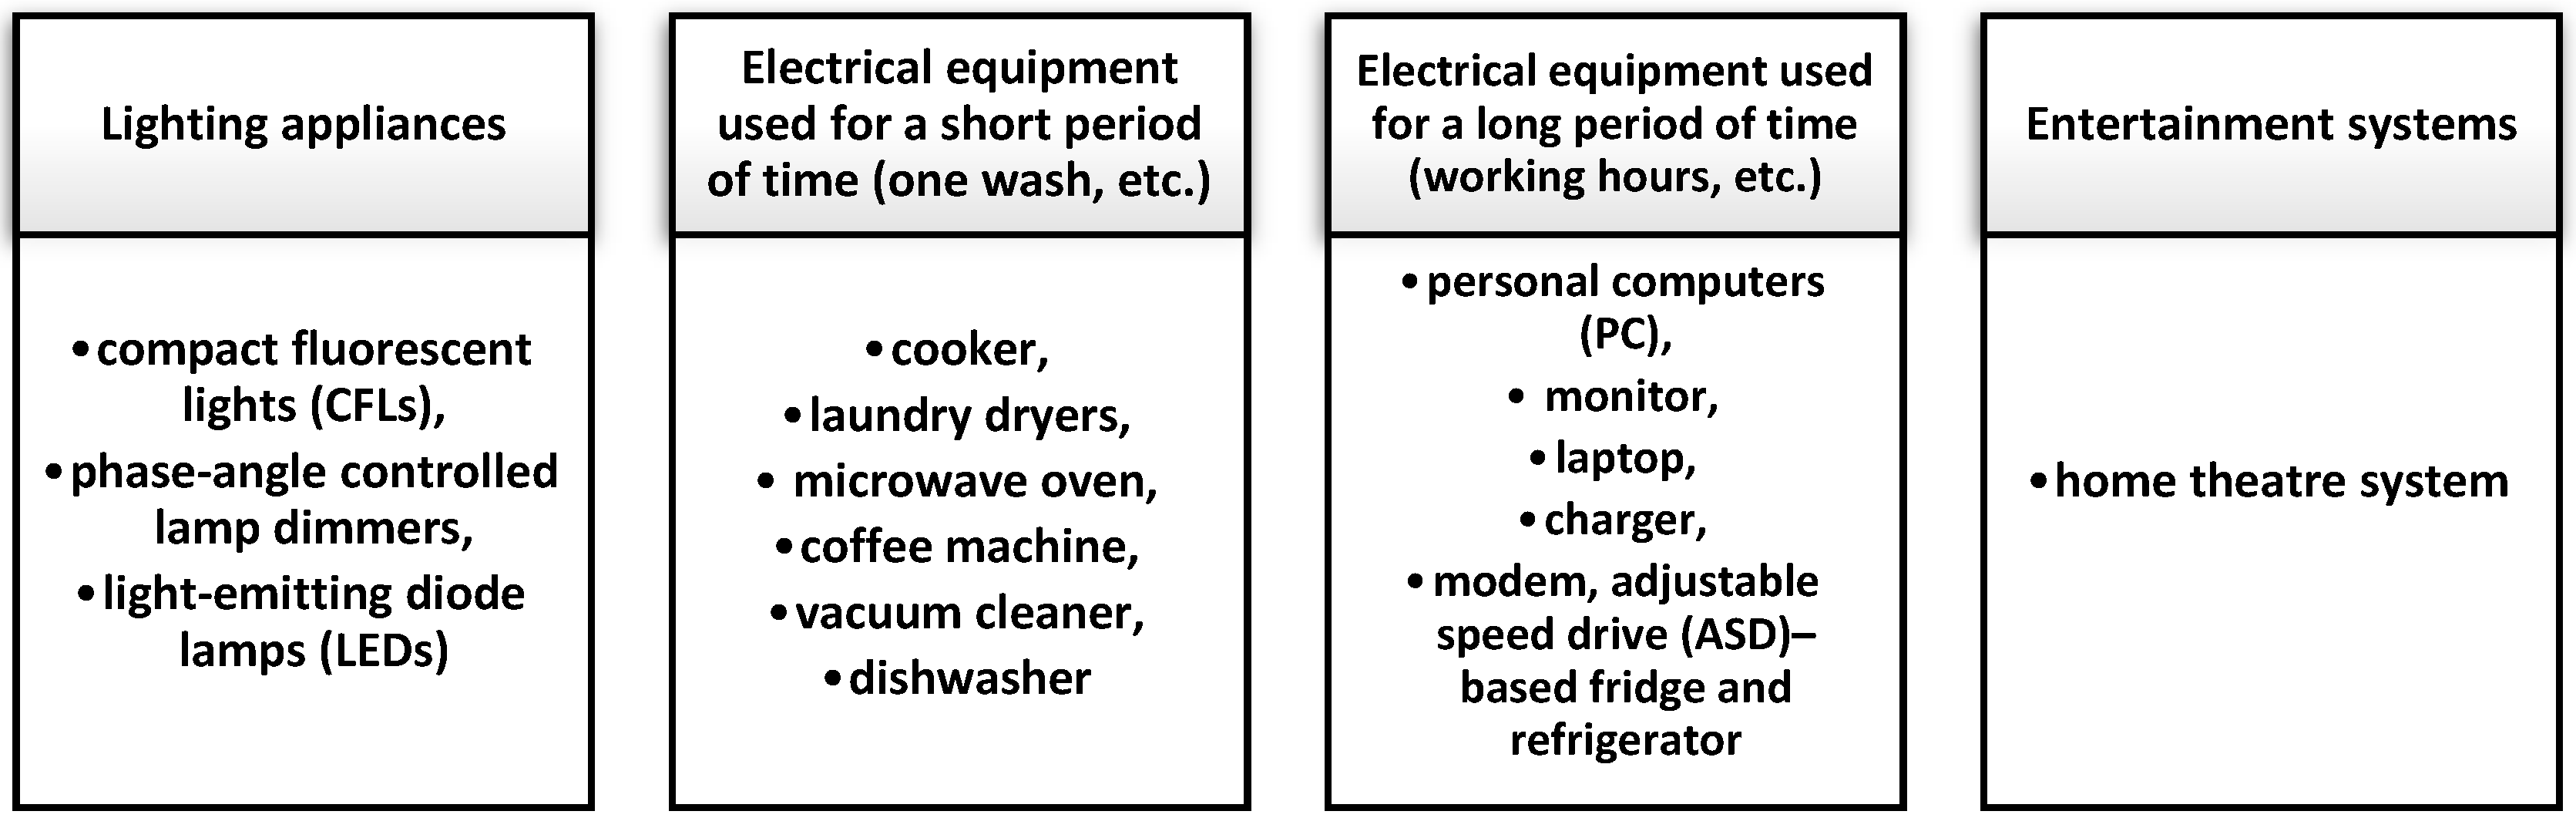
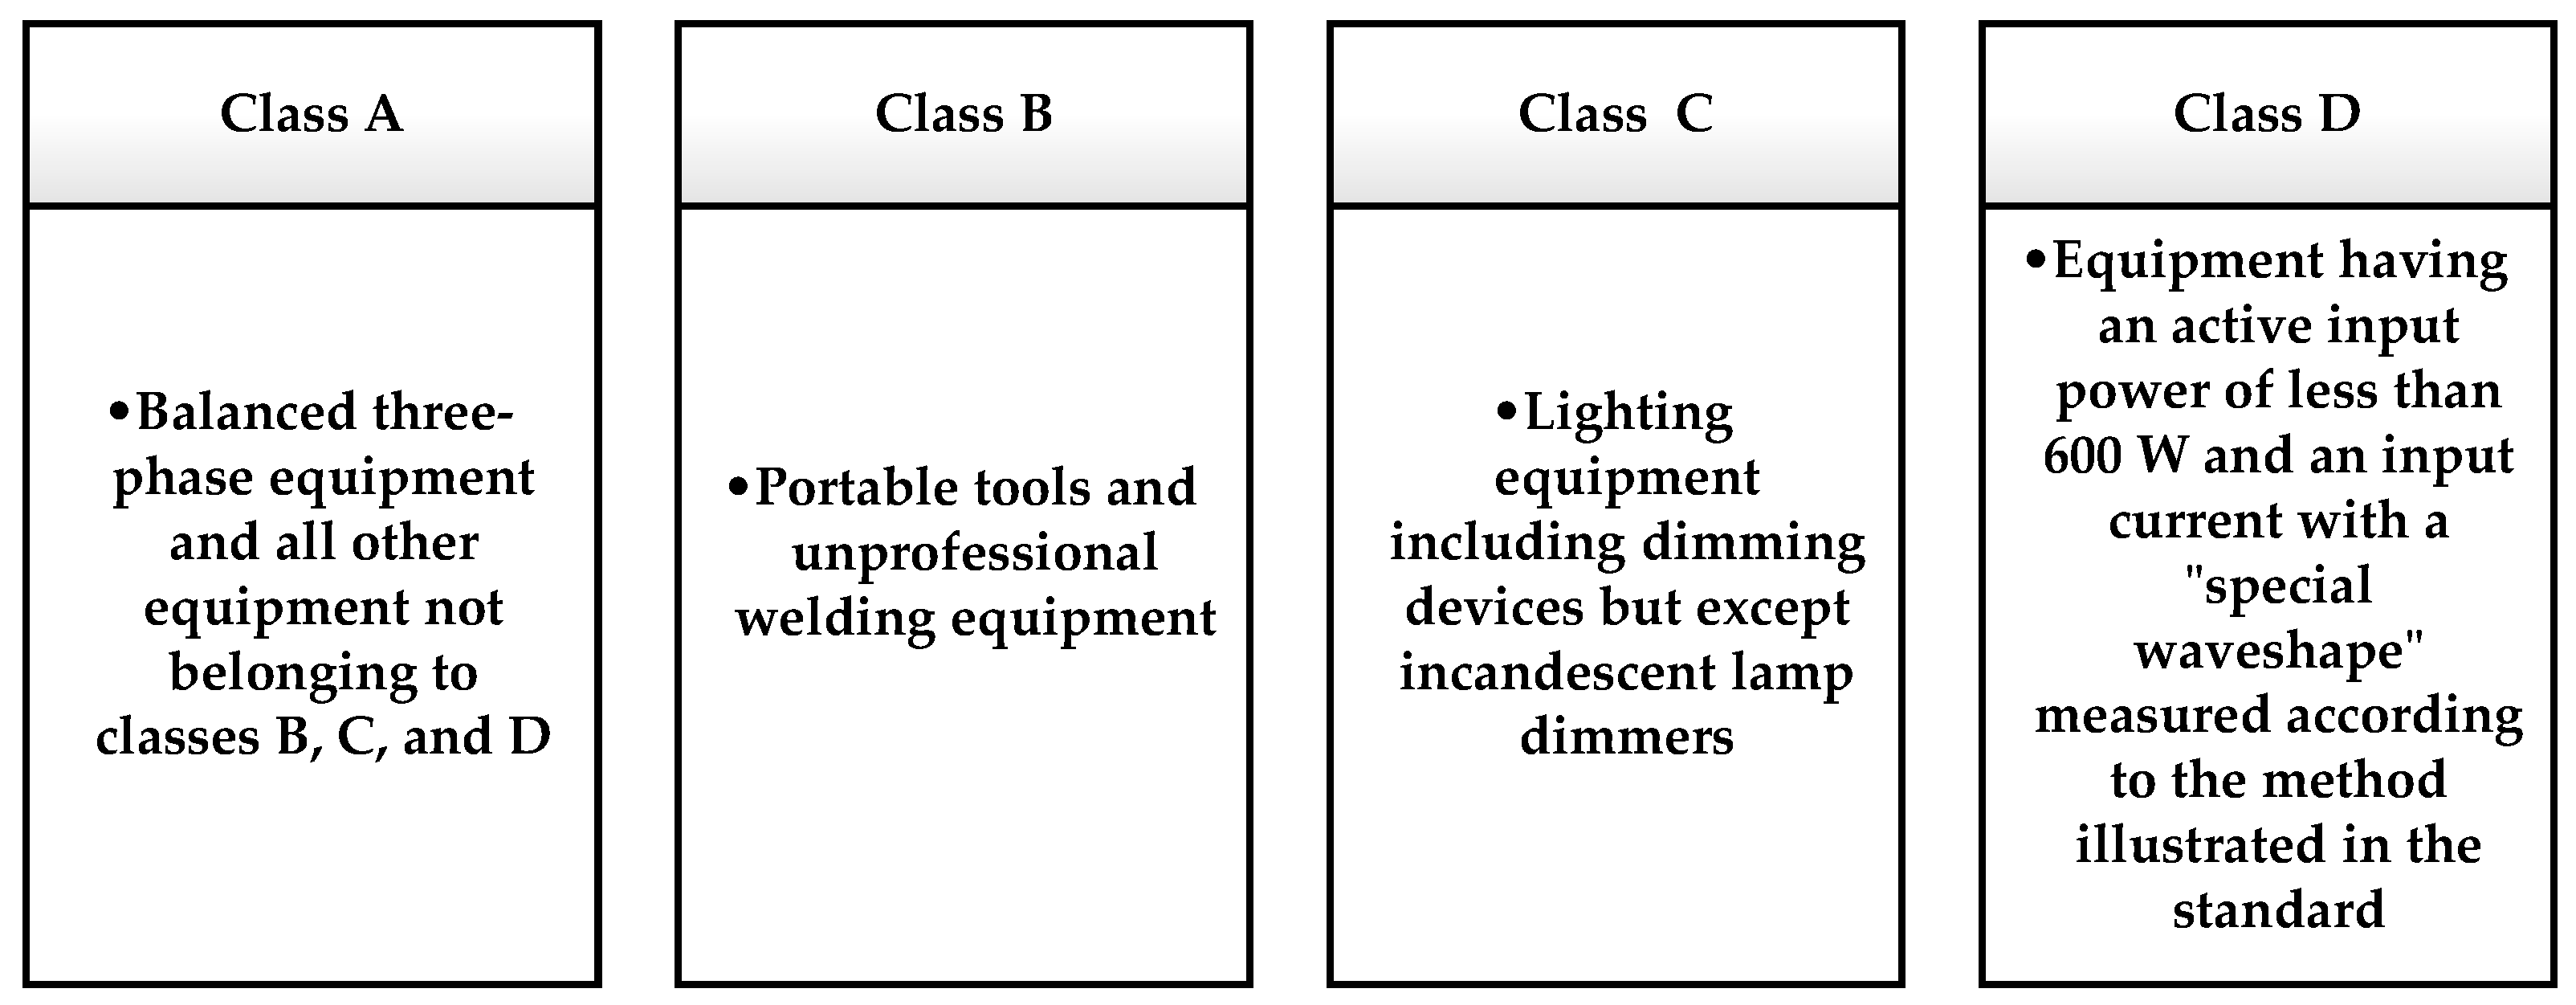
2.2. Recent Research

The equipment within domestic as well as commercial installations is increasingly sensitive to some type of electromagnetic interference, both from internal and external sources [1,18]. Therefore, there is a need to control the electromagnetic environment, namely by limiting the harmonic pollutions caused by any type of electrical appliance. Thus, the IEC 61000–3–2 standard [30] classifies all electrical equipment into four categories, that are presented in Figure 3.
Unlike IEC limits [30] that can be applied to all systems, irrespective of their stiffness, the IEEE standards (according to IEEE Std 519) [31] introduce the harmonics current distortion criteria limits (individual harmonic distortion as well as T H D I factors), which are a function of maximum short circuit current I S C to maximum demand load current I L at PCC [32,33].
From past literature reviews [34,35,36], it was found that many harmonic current impact studies were performed with individual usage of a specific type of nonlinear device or groups of devices used for the same purpose, often for sinusoidal conditions of the supply voltage [37].
The effects of harmonics current for fluorescent lamps (FLs) with different ballasts are studied in [38]. Various configurations of the fluorescent T8 and T5 tube lamps from different commercial brands were used. The results indicate that with the increased number of fluorescent T8 lamp (from 4 lamps to 10 lamps) with electromagnetic as well as electronic ballasts, the percentage of the total harmonic current distortion factor ( T H D I ) has little change, approximately 0.5–1%, while the consumed power increases significantly. For T8 FLs with electromagnetic ballast, the T H D I 9 % , whereas for the T8 FLs with electronic ballasts the   T H D I 10 % . The newer technology, fluorescent T5 lamps with electronic ballasts, generates much more distorted current waveforms (selected in the experiment low-class lamps). Four T5 FLs show the T H D I = 23.7 % and 10 T5 FLs demonstrate the T H D I = 27.2 % . The authors also present the high class T5 type lighting devices with electronic ballast, which indicate the current total harmonic distortion factor even less (3–5%) than the tested electromagnetic ballast for the T8 lamp.
The comprehensive overview conducted by several researchers investigating the harmonic performance of the utility grid when employing compact fluorescent lamps (CFLs) on a large sczzale is reviewed in [39]. The authors conclude that power quality is affected significantly by CFLs. For a typical CFL tested in [39], the T H D I is as high as about 75%. However, in [40] the lamps were tested in varying the RMS terminal voltage conditions. The results show that the   T H D I for 12 CFLs of the different manufacturers is practically constant ( T H D I   110 % ) in the operation range between 80% to 100% of the nominal voltage of the CFLs. The next research [41] signifies that when connecting subsequent CFLs, the harmonic content is expected to increase as the more distorted current is drawn. To anticipate the problems generated by a massive insertion of small nonlinear loads, several investigations focused on modeling, characterizing, and predicting the increase of harmonic currents due to the CFLs [40,41]. The results of the research on the cancellation of harmonics between groups of compact fluorescent lamps are demonstrated in [42].
Light-emitting diodes (LEDs) and another solid-state lighting (SSL) system’s impact on power quality is studied in [12,43,44]. For these types of lighting, the individual current harmonic components as well as the T H D I   values often exceed the limits set by the IEEE standard 519 [26]. According to [44], the LED and micro-LED lamps show moderated harmonic current pollutions. As indicated in [12], as a greater number of LED lamps are connected to the grid, their performance improves both in terms of power factor and harmonic distortion. In [45] it is shown that there is a relevant difference in harmonic pollution behavior of CFLs and LED lamps, not only between the two types of lamps but also within the same type. Thus, it seems to be sensible to utilize some lamp combinations to keep harmonic distortion within permissible limits.
Besides the lighting devices, the literature has documented measurements of other commercial as well as household appliances such as TV sets, personal computers, monitors, printers, laptops, chargers, etc. [18,41,46]. The conventional main interface of these electrical devices consists of a diode bridge rectifier followed by a large DC capacitor. In this case, the current drawn from the AC supply is relatively linear [21]. However, in the newer technology, switch-mode power supply (SMPS) systems, the rectifier is usually followed by a converter that can be controlled in different modes to achieve a smooth DC output. The input current waveform is highly nonlinear and often comes to the load in very short pulses [47]. Today, single-phase electronic equipment almost universally employs SMPSs [21,47,48]. Although individual consumption is small, the collective effect can be significant because many of them are often connected to the same PCC. Additionally, to satisfy harmonic standards’ requirements, the latest SMPSs utilize complex circuits with active power factor correction (PFC) and usually change the equipment classification to Class A according to the mentioned IEC standard [30]. In [49,50], three main circuit topologies of these devices are proposed: without PFC, with passive PFC, and with active PFC. The result is low pollution in the case of sinusoidal supply voltage but often also increased harmonic currents’ pollution, which then increases the distortion of the supply voltage as already described.
The experimental measurements of harmonic currents’ generation by a cluster of desktop personal computers (20 PCs during different operating modes) are described in [41,51,52]. Generally, the connecting subsequent number of PCs decrease the current total harmonic distortion factor ( T H D I ) . The main reason is the attenuation phenomenon for the 3rd, 5th, and 7th harmonics [52]. Interestingly, the obtained result shows that when the number of PCs is increased from 1 to 124, the 3rd current harmonic is reduced from 76% to 24% [41]. Other results [51] provide insight into PC harmonic behavior in different conditions. Due to voltage change, the T H D I of 20 PCs is about 7% lower than that of a single PC. When a group of 20 PCs is fed from the same supply, the T H D I decreases by more than 15% (in comparison to a single PC) for maximum system impedance. Even with a group of PCs connected to a single supply, changing the system frequency in the range 50 Hz ± 1% has almost no effect on the generated harmonics. Moreover, the studies [51] focused on attenuation and diversity phenomena in PC clusters indicate that diversity effects have a minor impact on the harmonics produced by a cluster of PCs but some kind of harmonic compensation may occur. Also highlighted is that presented factors affecting produced harmonics are related to each other, and if nonlinear devices are supplied by different power systems their harmonics generation and other power quantity levels will be different [52]. This as well as other relevant experimental data can be useful in harmonic characterization studies.
In [47], the energy efficiency of power electronic-based home appliances was analyzed. The authors underline that although most energy-efficient loads based on power electronics consume considerably less power than their older counterparts, they are harmonic polluters and inject a relatively large number of harmonic currents into the power grid relative to their power demand.

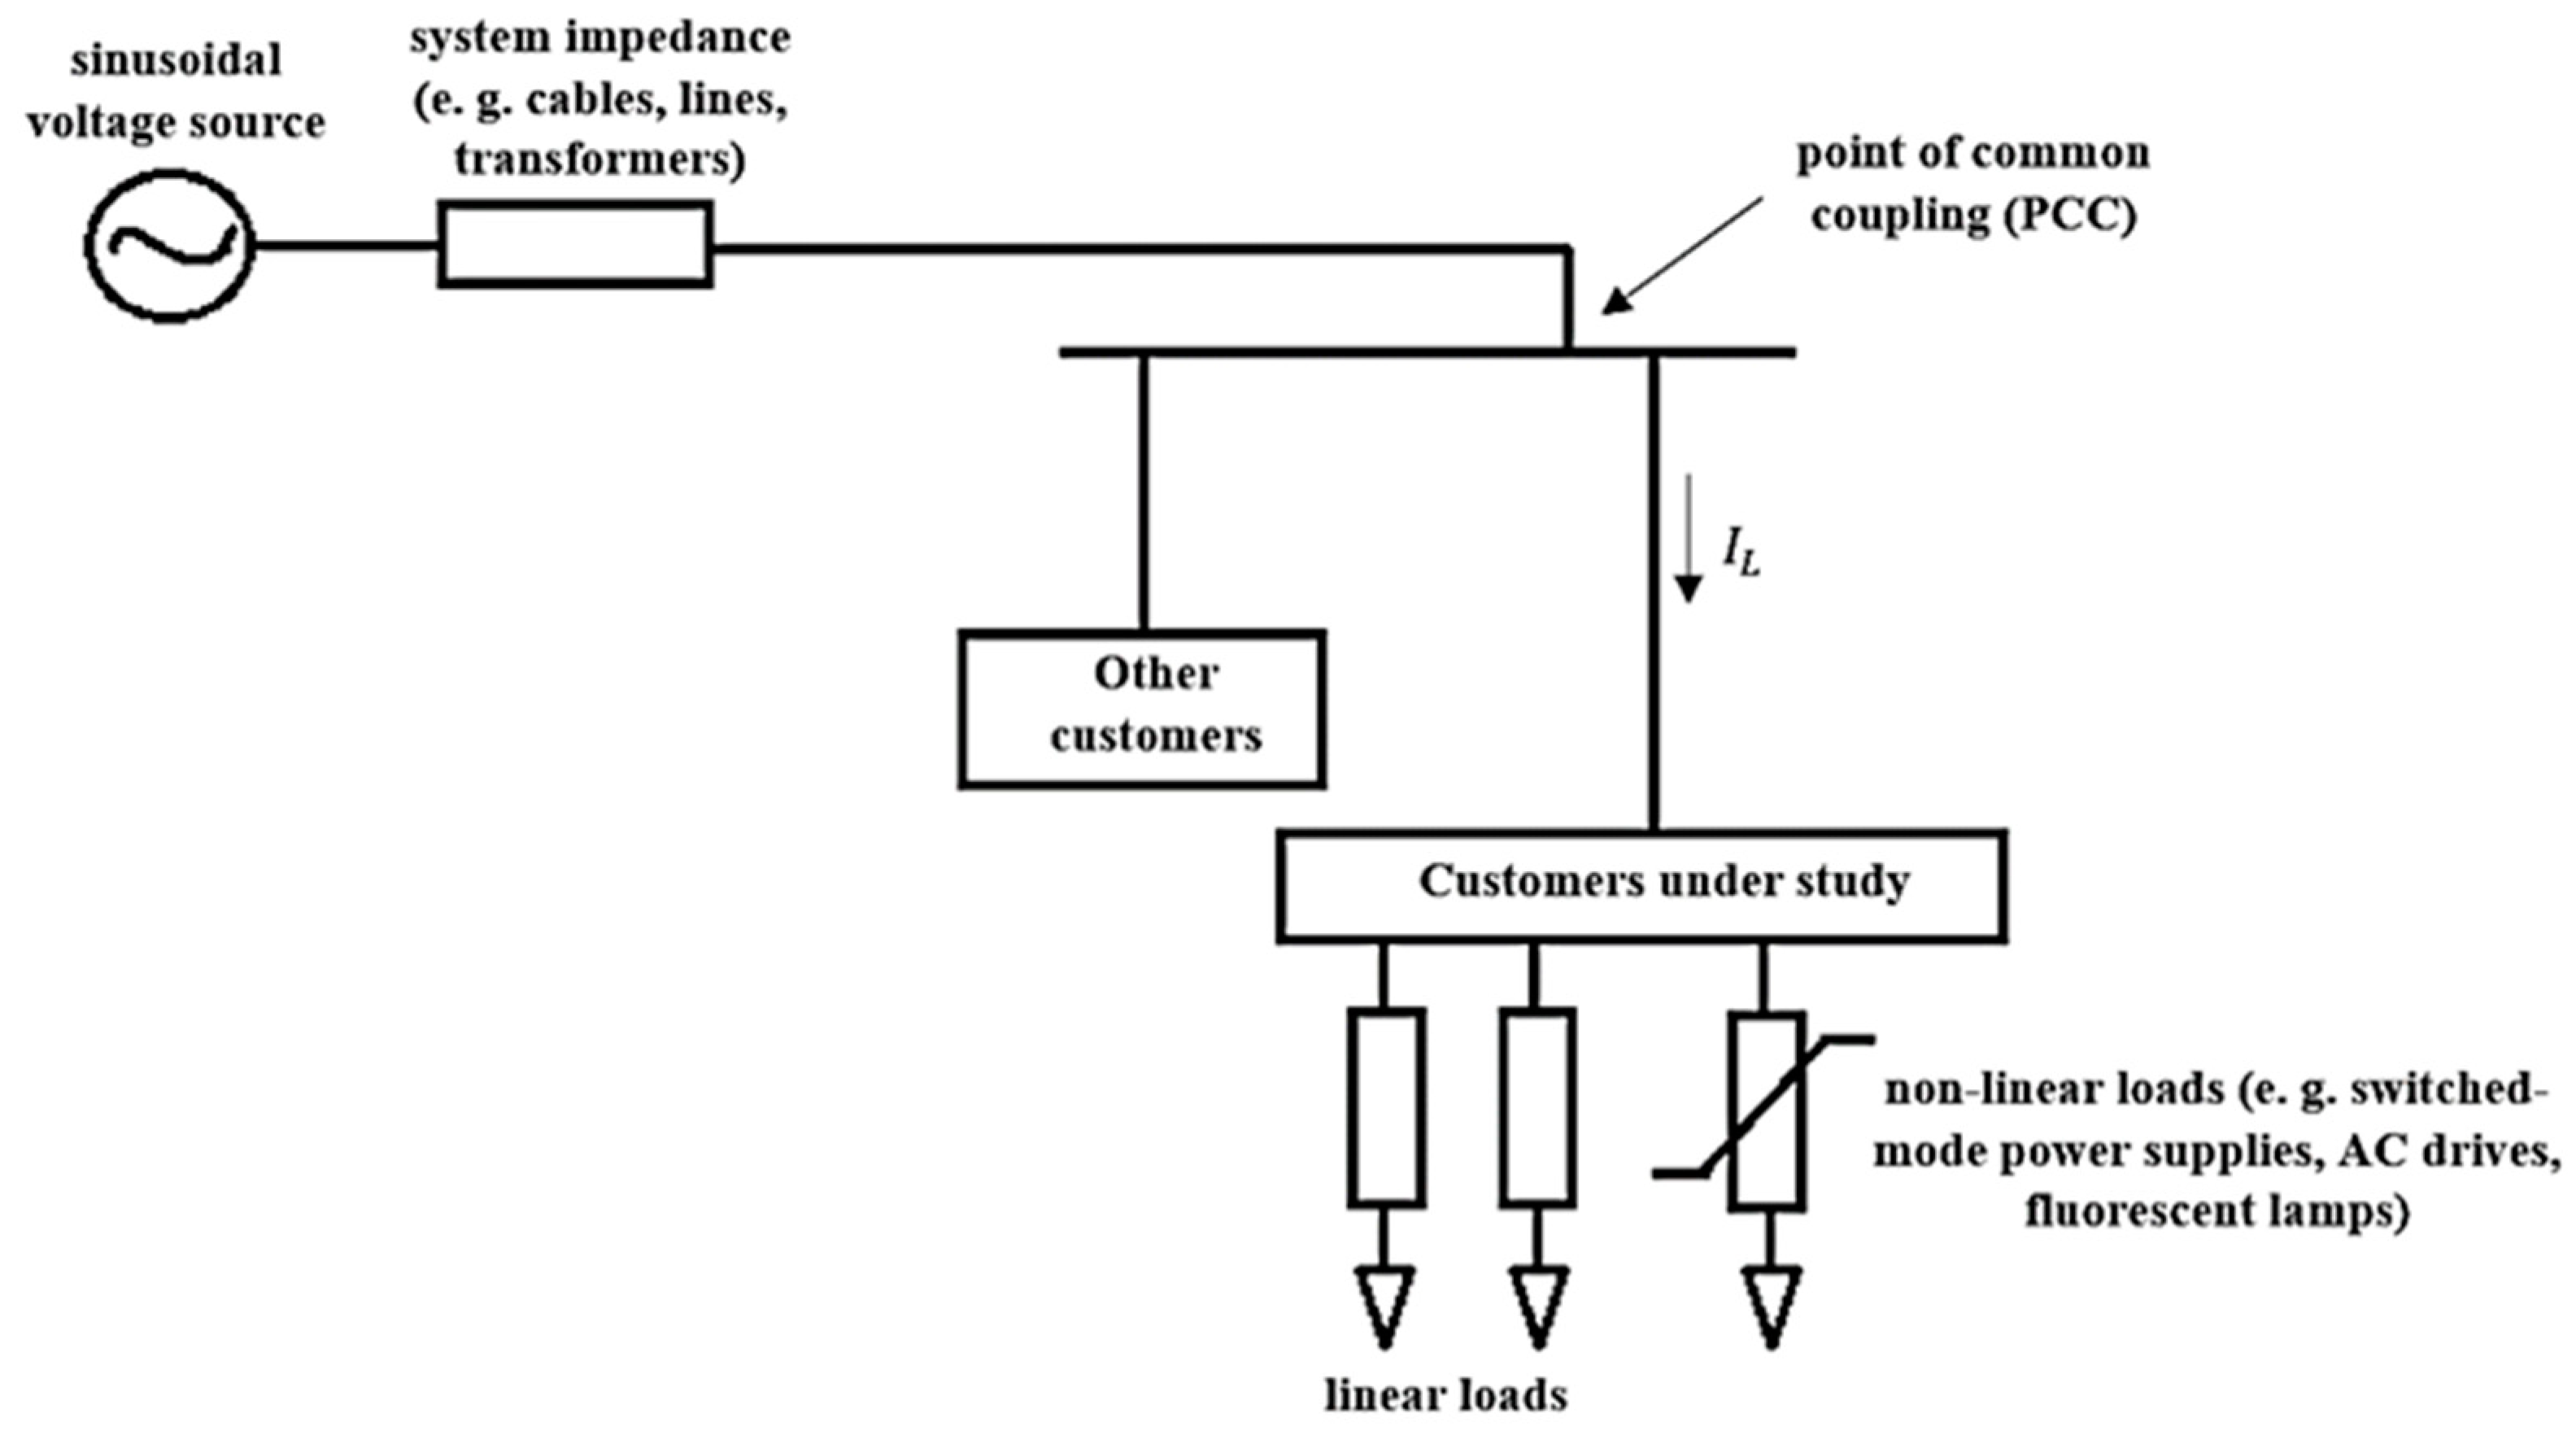
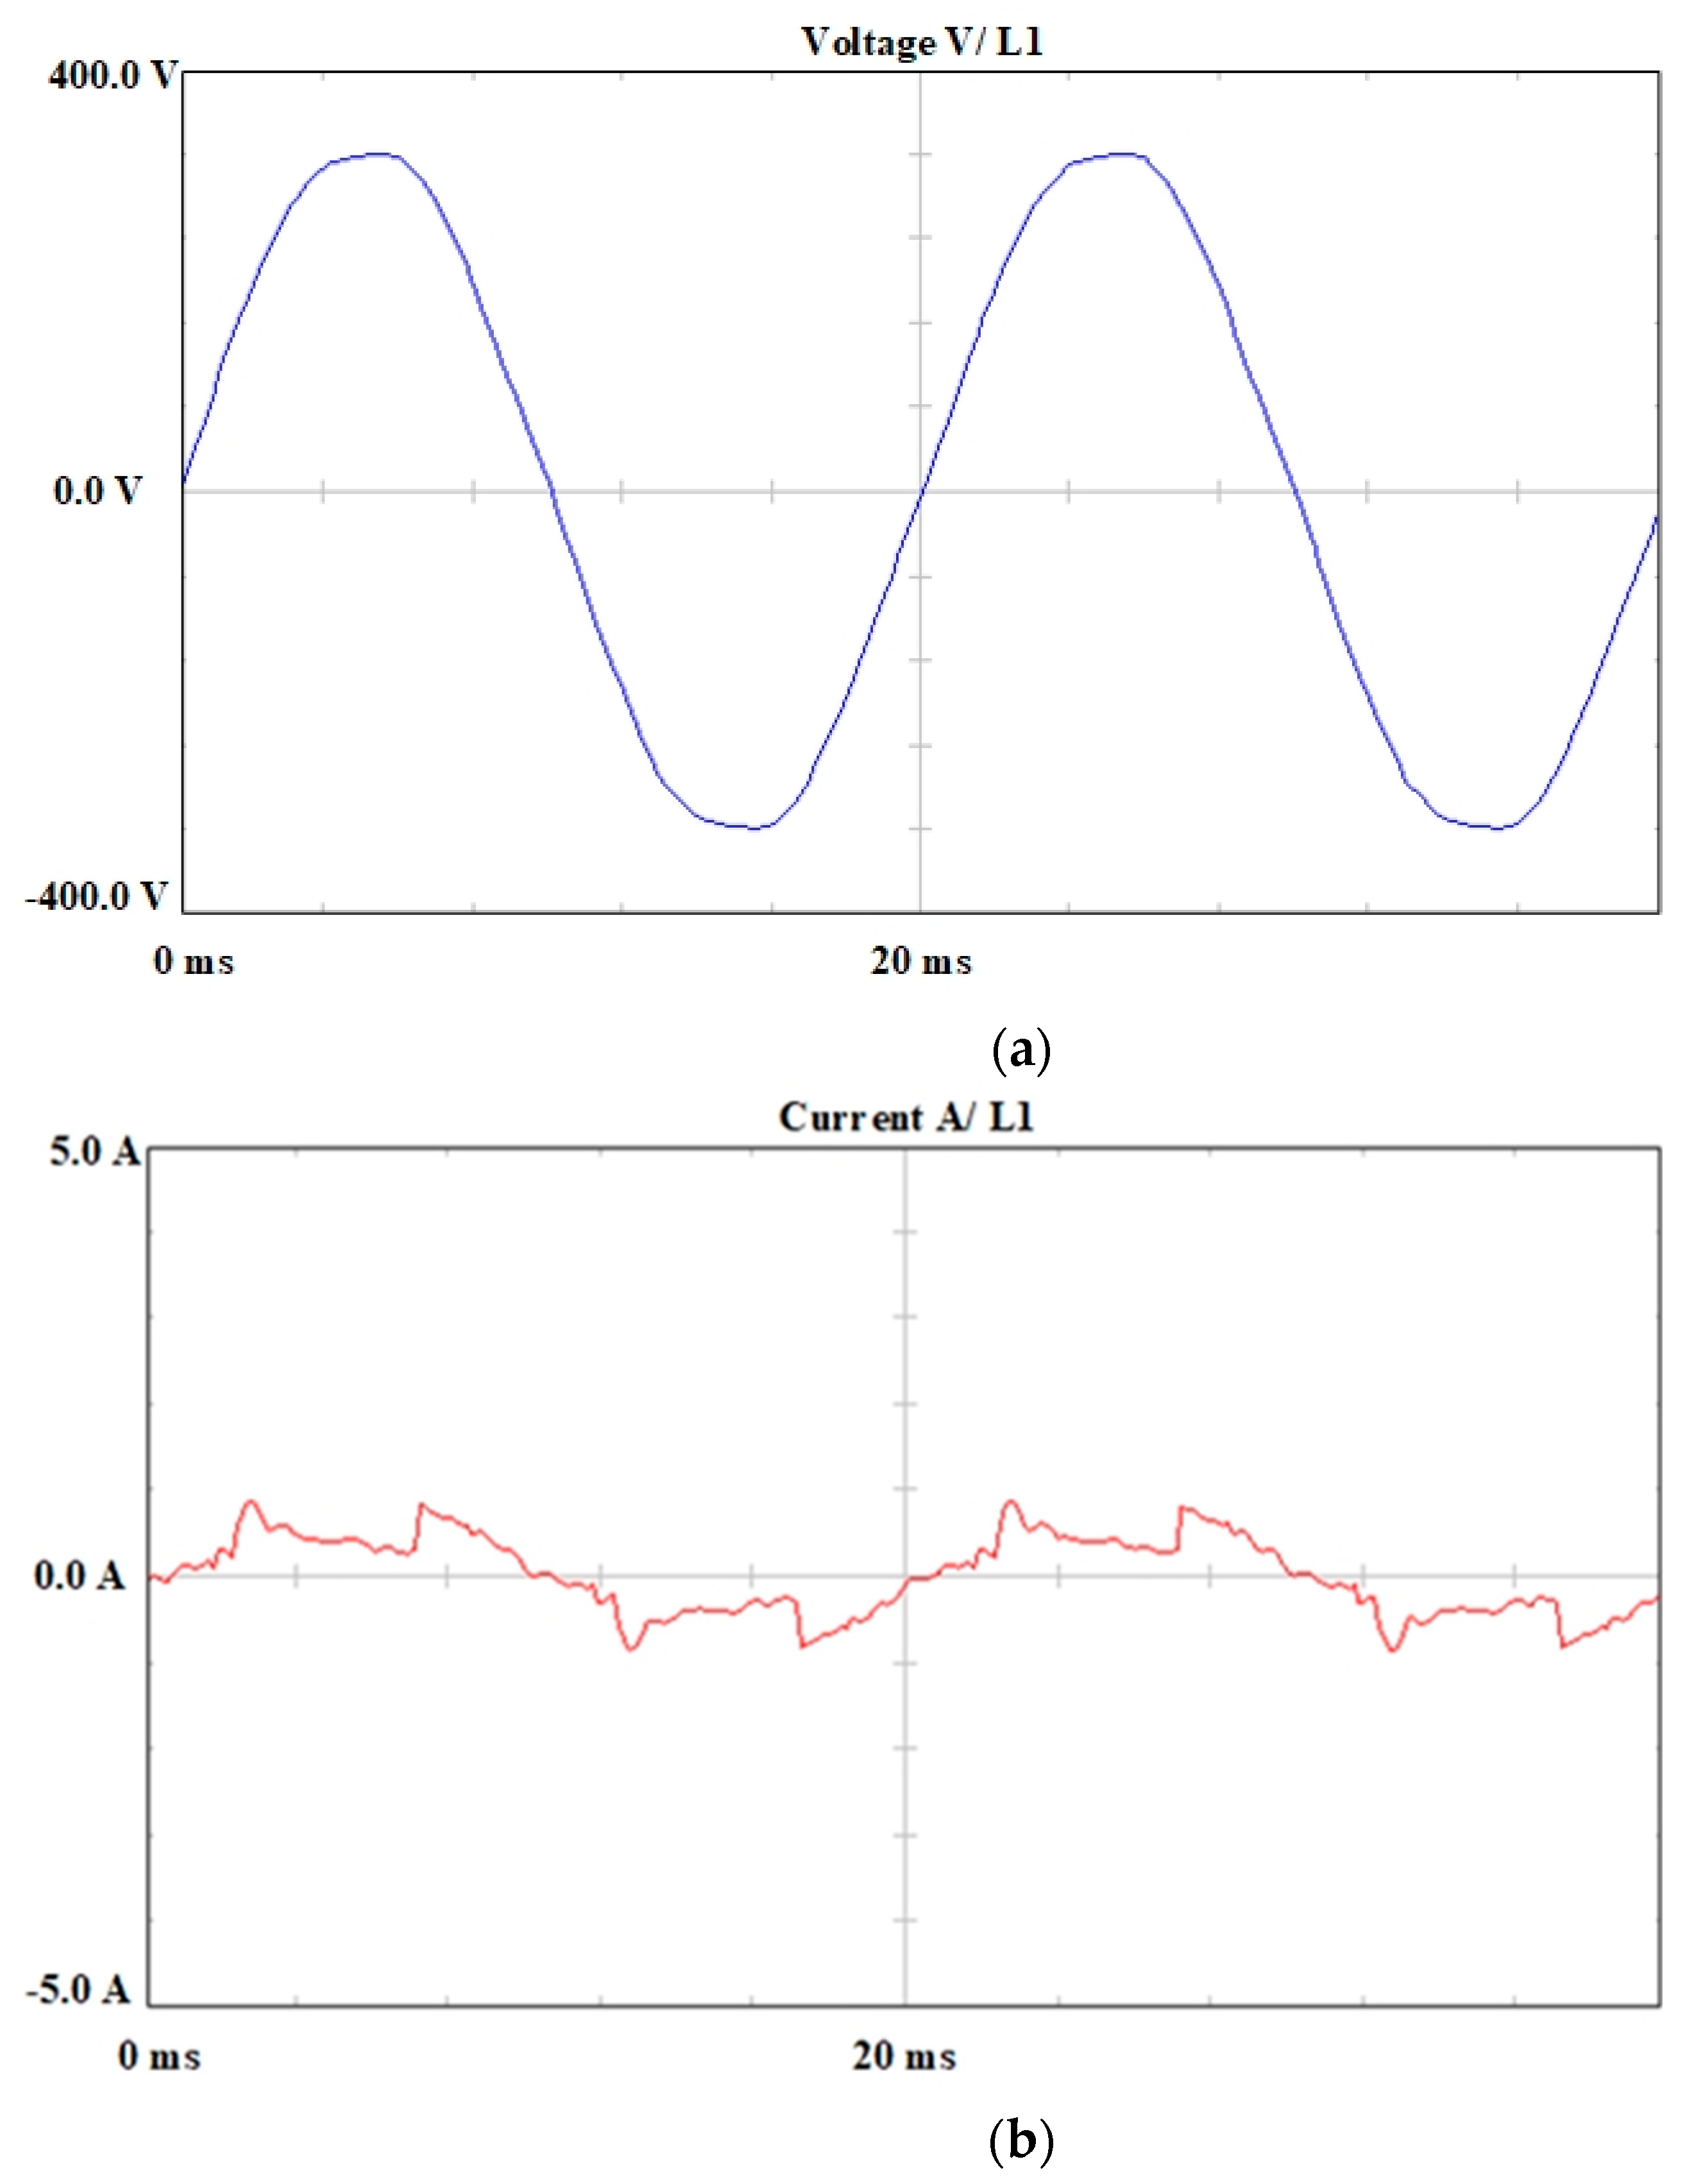
2.3. Problem Description

Most of the presented research focuses on the harmonic generated by one type of commonly used nonlinear loads (NLLs), often in sinusoidal conditions of the supply voltage. The main general properties of all NLLs can be distinguished as follows [41,42,53]:
  • the current harmonic pollutions generated by a load depend on the voltage harmonics’ magnitudes and phase angles. The T H D I and individual harmonic currents for a group of NLLs vary due to the background voltage distortion variations within the recommended standards limits. This means that changes in one voltage harmonic lead to changes in multiple current harmonics;
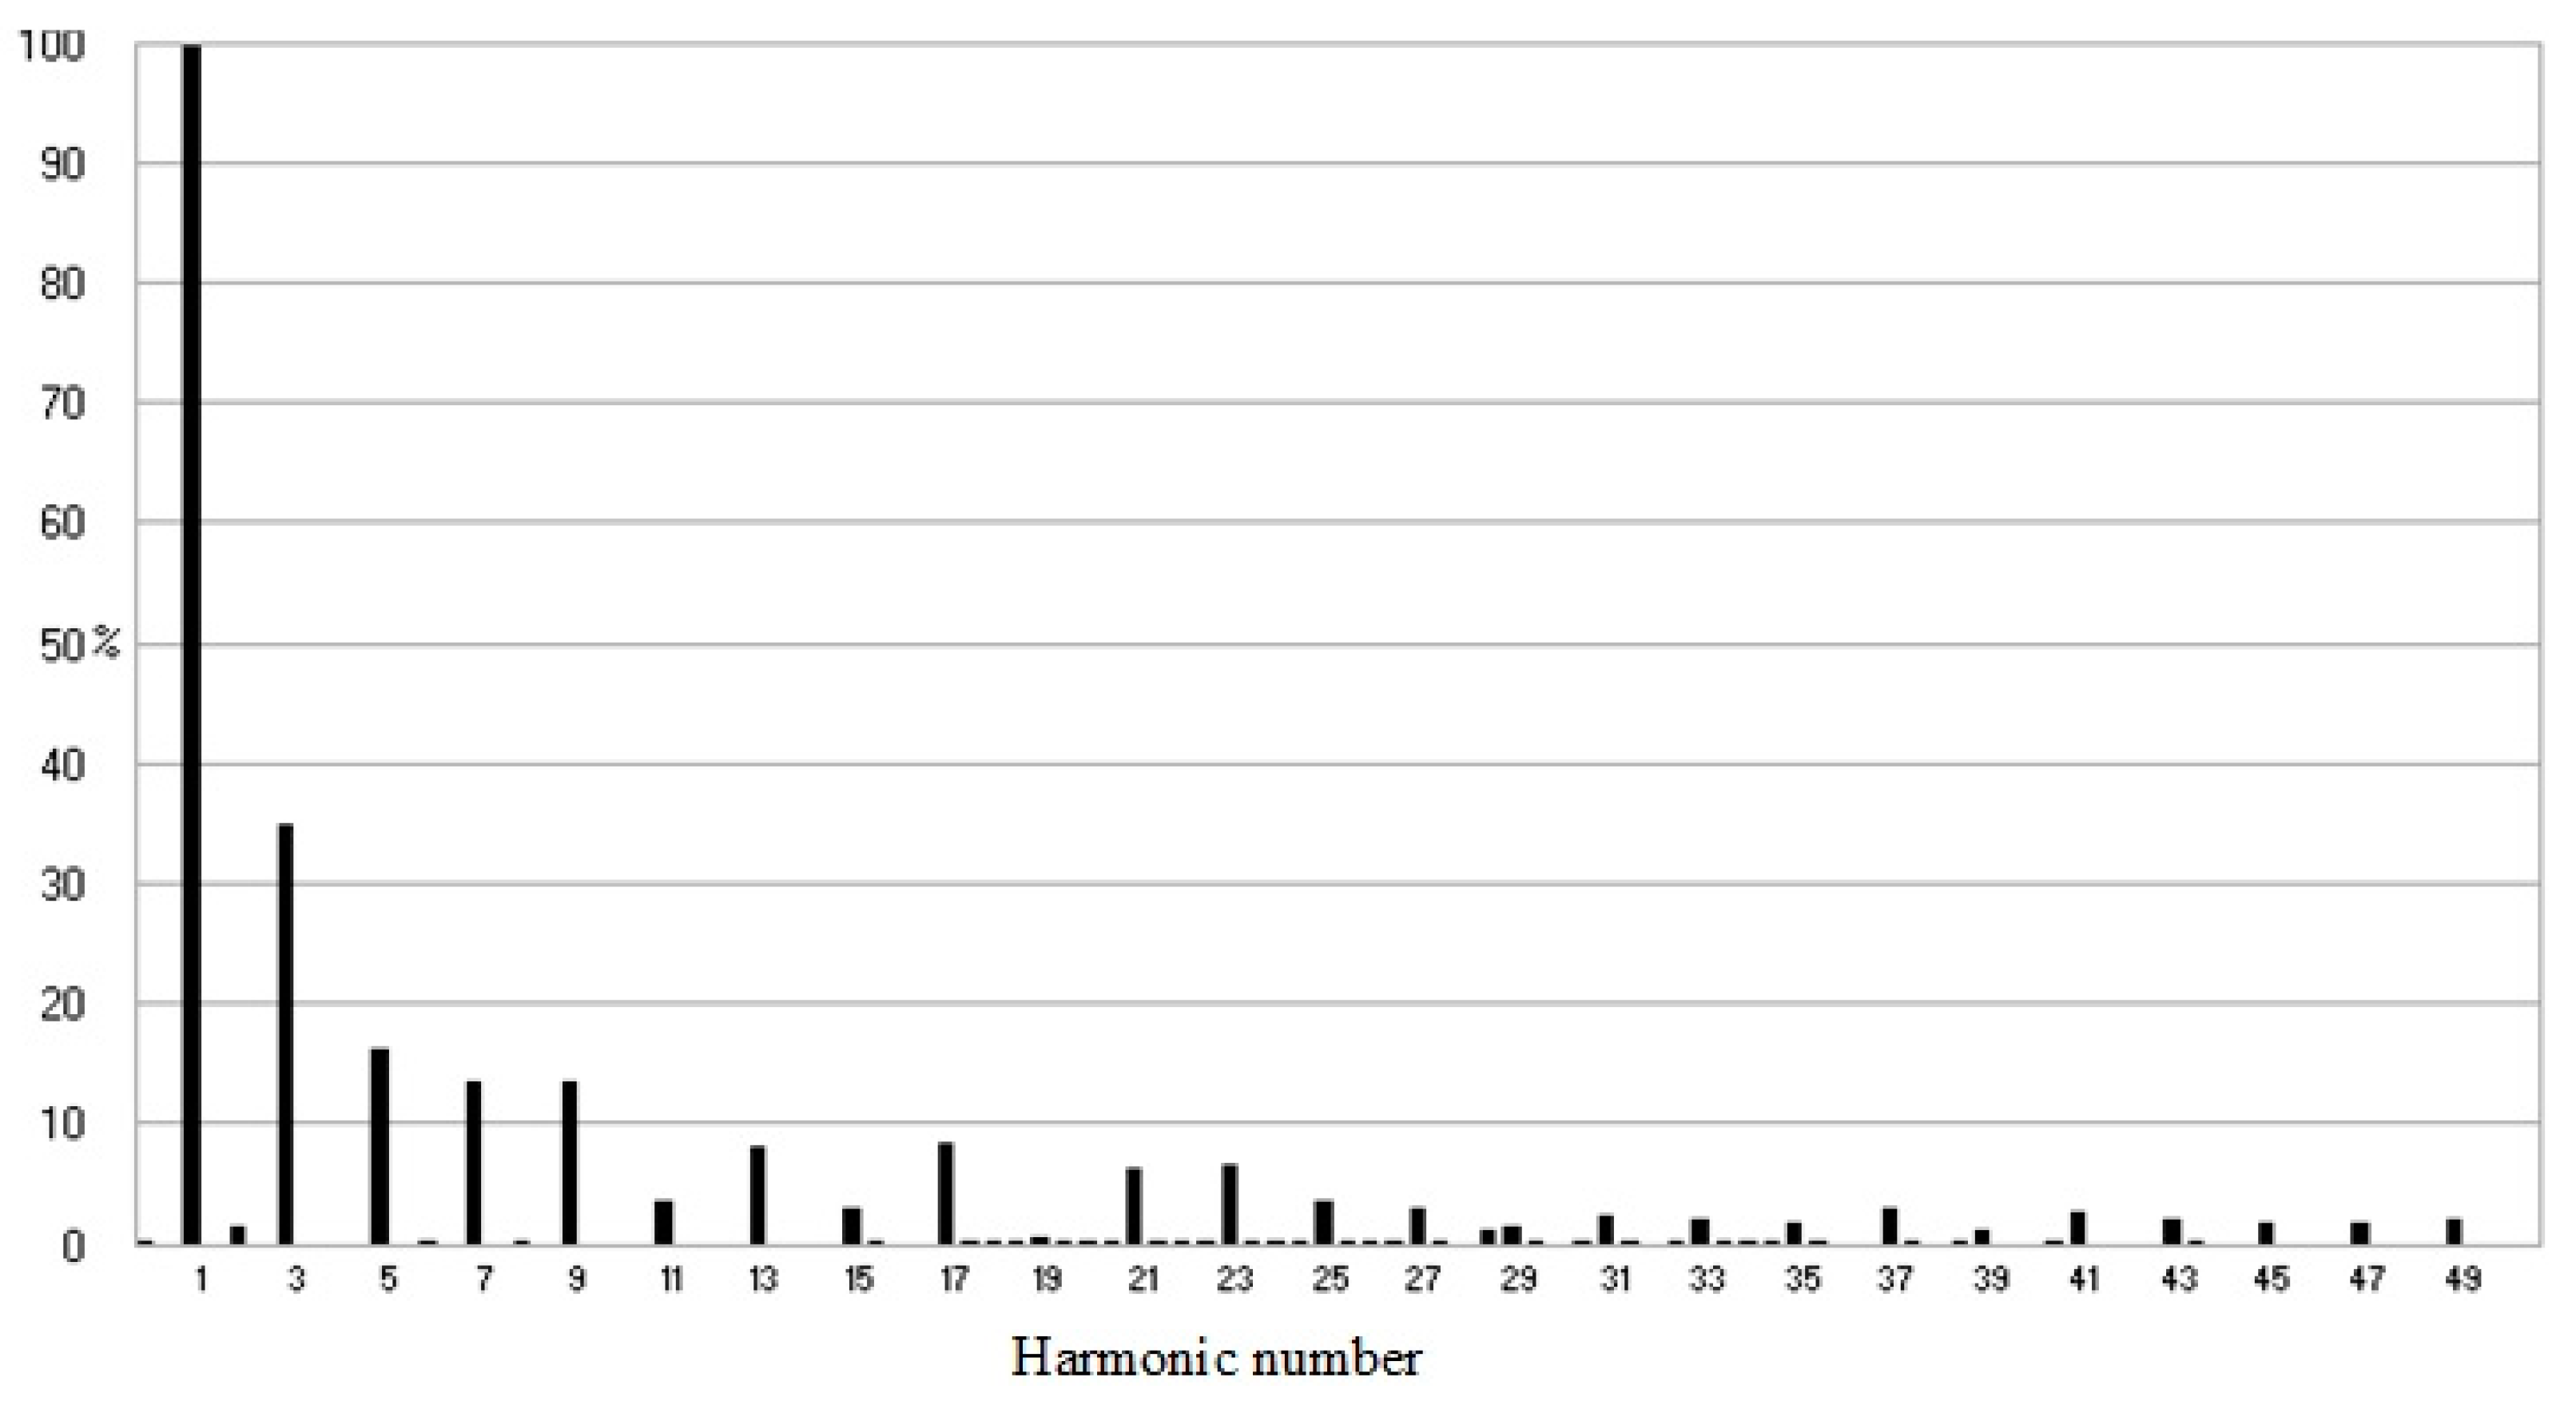
  • there are no even harmonics if the waveform has half-wave symmetry; and
  • domination in the amplitude of the lower-order harmonics (sequentially, the 3rd, 5th, and 7th order) is noticeable.
When large amounts of such appliances operate in power distribution systems, the collective effect on the feeder power quality [54,55] has become a large concern to utilities. For predicting the harmonic current injection to the utility grid and implementing compensation technique, several theoretical models and simulations of nonlinear loads were conducted in the past decades [24]. The level of injected harmonic pollutions from a group of nonlinear loads of the same type operating simultaneously can be predicted by scaling the typical harmonic current spectrum of one load in proportion to total load power [52].
However, we seldom must deal with such a situation in real life because many different types of harmonic sources are almost always connected to one point of common coupling (PCC) [56]. Thus, the simple combined approach for forecasting the level of harmonic current injection to the utility grid is not proper anymore [57]. Therefore, a composite approach is required, which takes into account different nonlinear load types placed in the PCC at the same time [58].
By applying such an approach, not only can the addition effect of many harmonic sources be assessed, but the attenuation outcome of future harmonic distortion in the network can also be better estimated [59]. The main purpose of the experimental tests presented in this paper is to create a first baseline study for office and domestic environments in case of deterioration of PQ by harmonic currents.

3. Case study

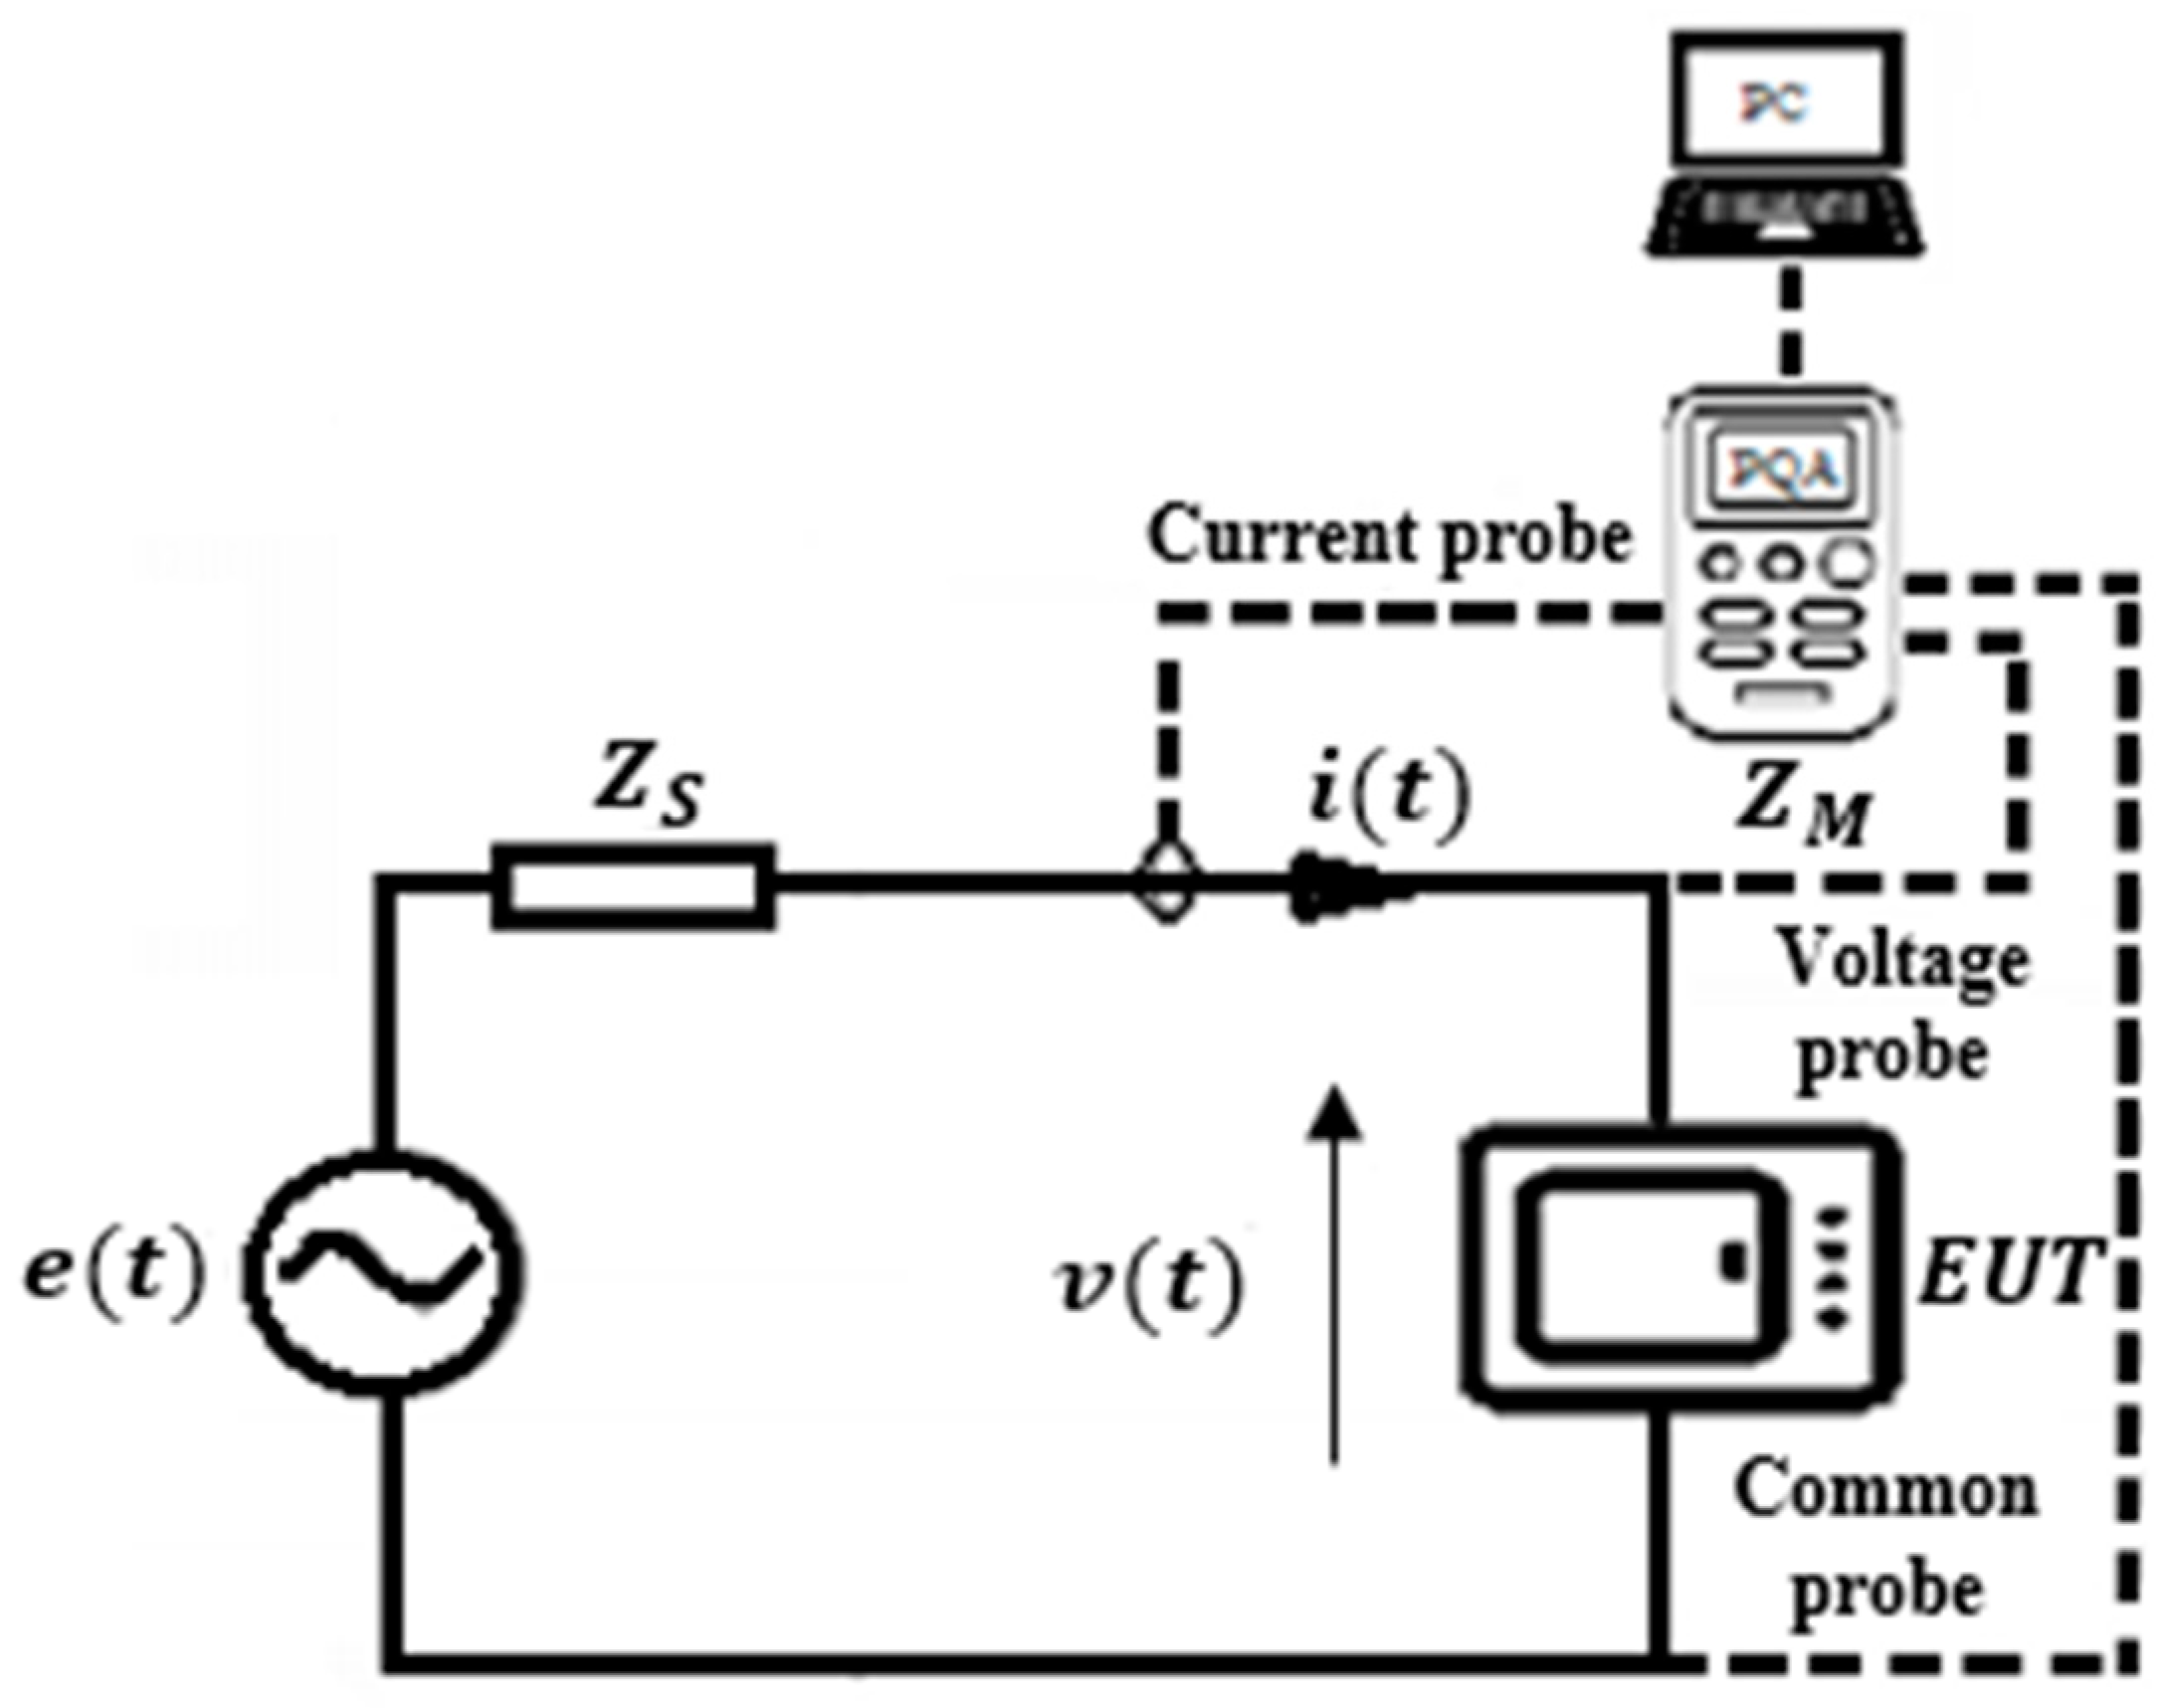
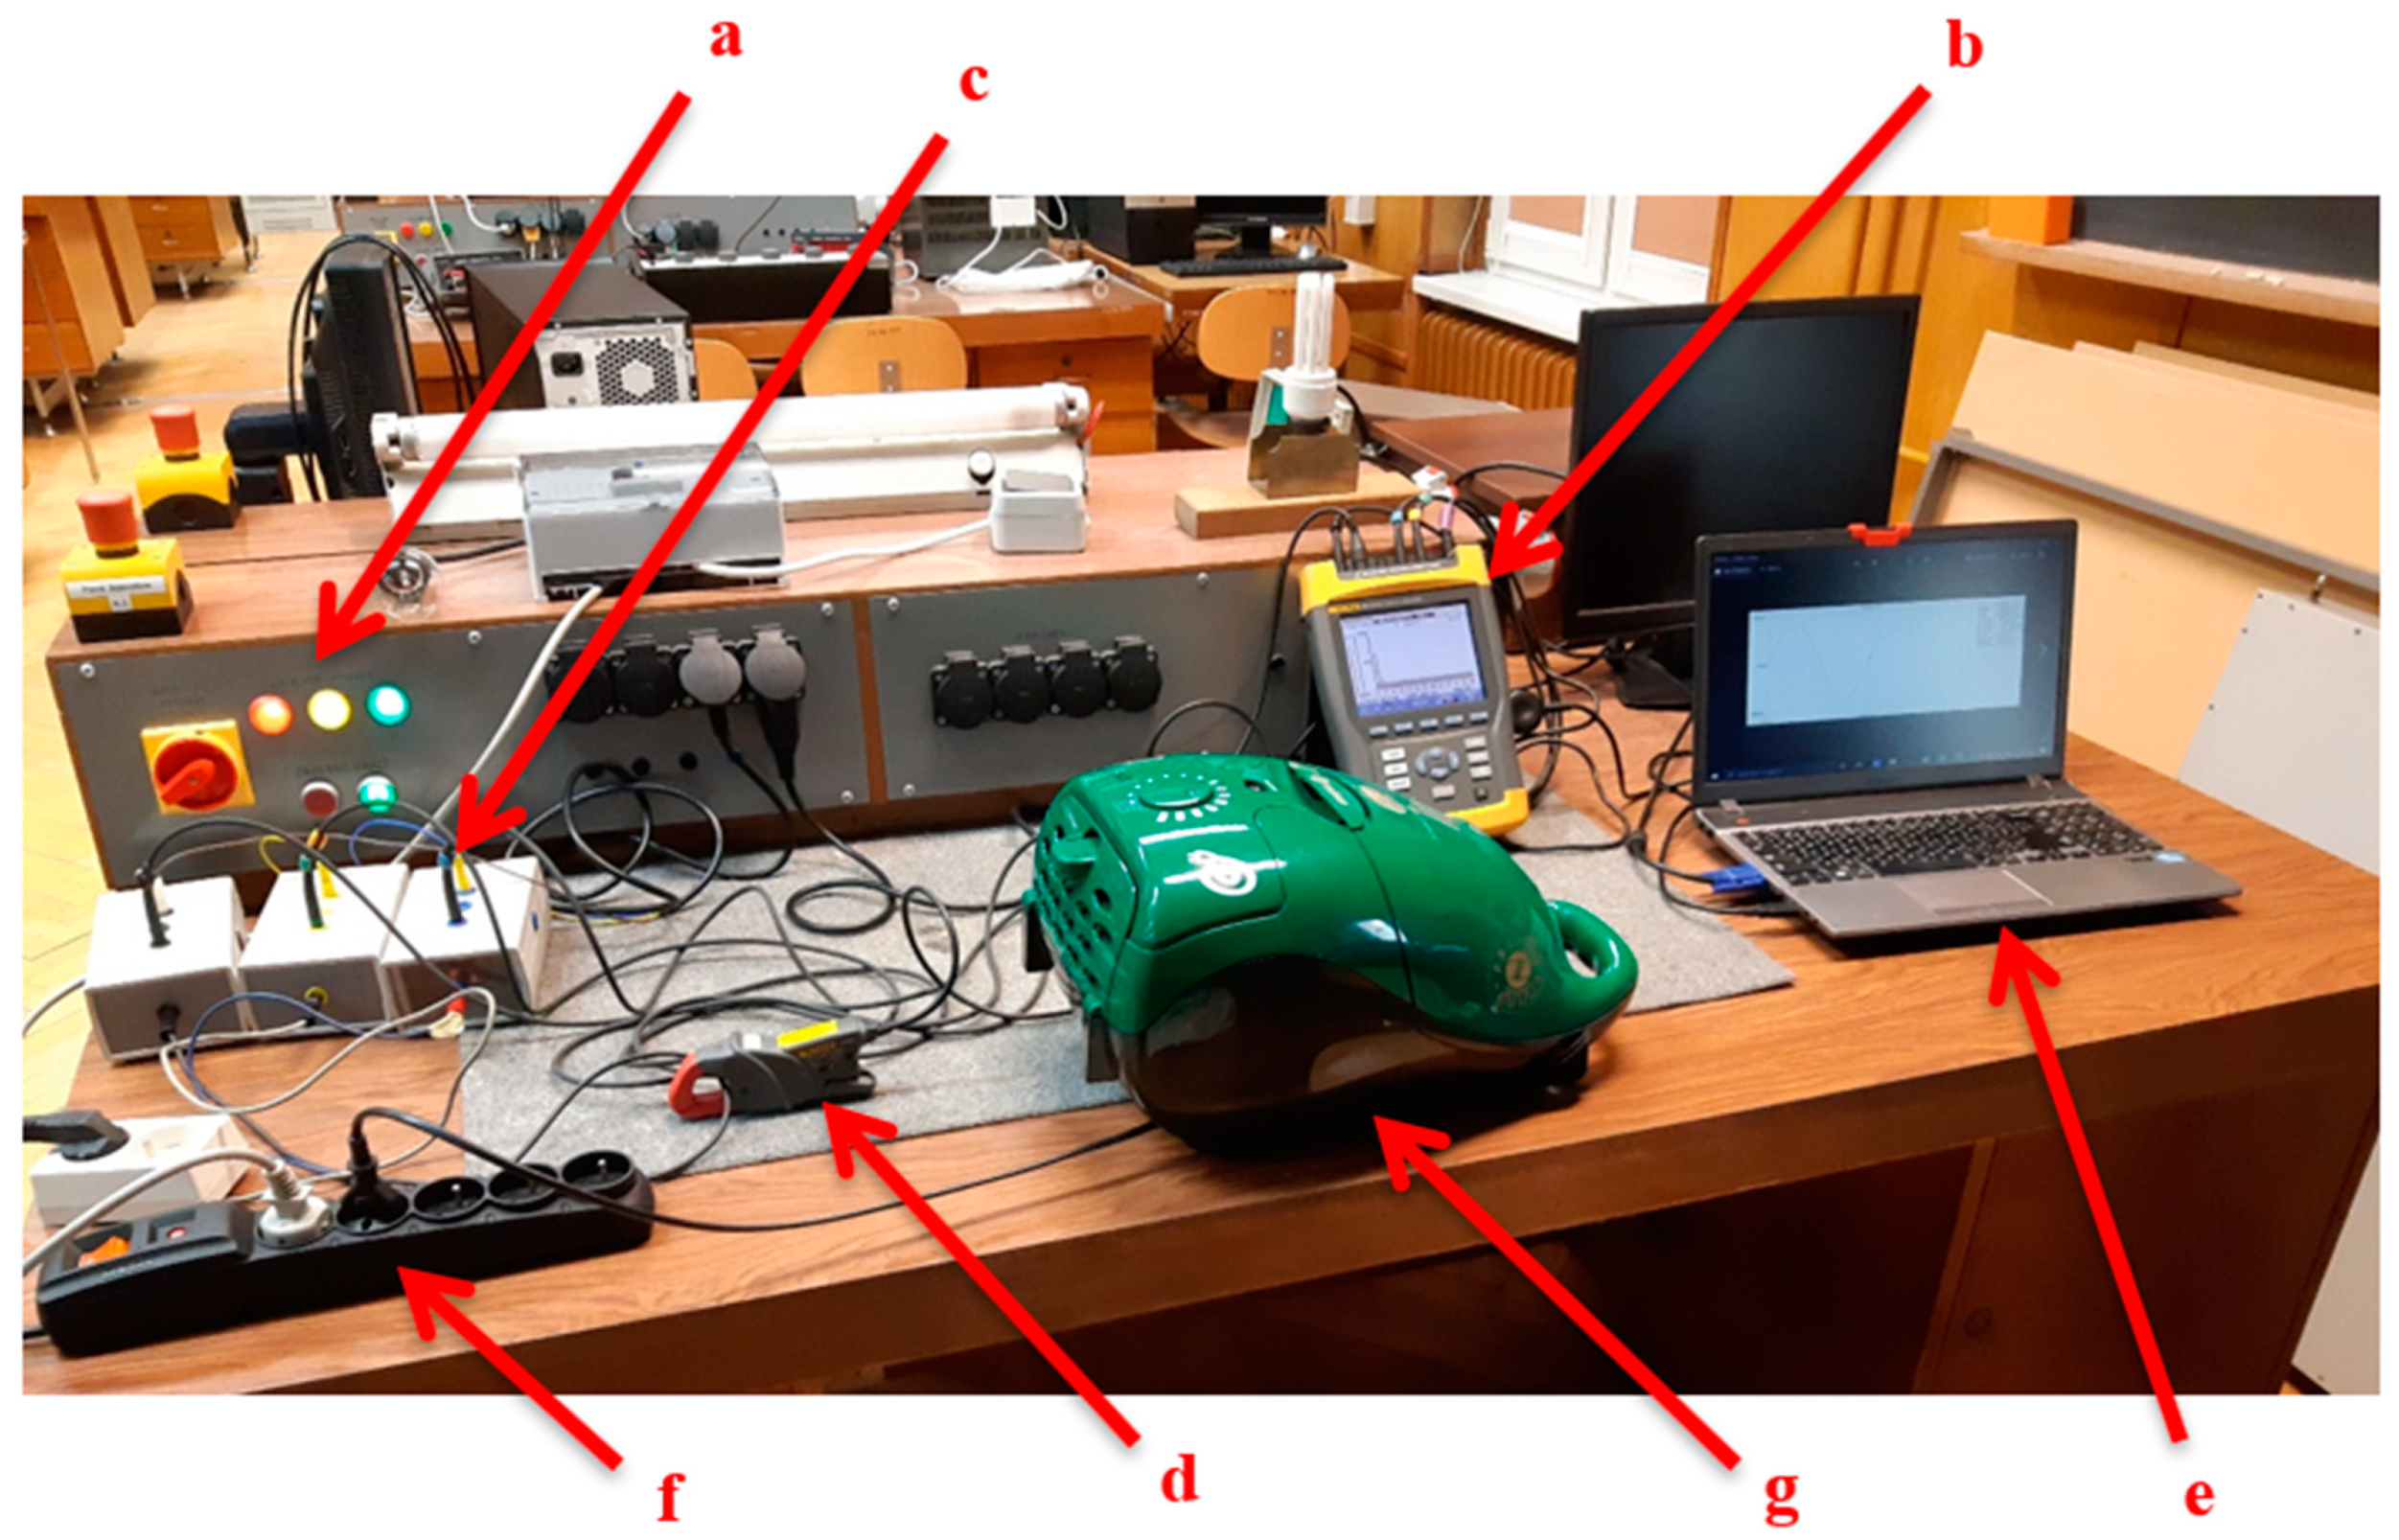
3.1. Methodology for Case Study

In Stage 1, the problem was defined and detailed, based on the collected knowledge of the subject, and a description was delivered. The theory of the power quality deterioration phenomenon associated with the operation of nonlinear loads was provided in the Introduction section of this paper.
Stage 2 determined relevant aspects to be included in the study and its scope. For the analysis of the deterioration level of PQ caused by harmonic currents, some sets of various commercial and residential electrical appliances with different technical specifications were tested. For comparison, the research was conducted for selected individual devices as well as for sets of diverse appliances.
Table 1 shows the technical specification of the selected nonlinear loads. The power value included in the table is the value that the manufacturer declares the device consumes. All devices are supplied from a single-phase LV network, in a voltage range of 230–240 V, with a frequency of 50 Hz.
The accuracy of the measurements conducted by PQ Analyser Fluke 435 is as follows:
  • T H D I measurement: ± 2.5 %
  • % f measurement: ±0.1% ± n × 0.1%
  • % r measurement: ±0.1% ± n × 0.4%
For each set of devices, the same parameters as those obtained for the appliances individually are measured. One of these sets consists of some typical domestic electrical loads used for a short and long time. For the second test, the office electrical equipment is selected. The third test is conducted for a set of lighting equipment (including an incandescent lamp dimmer) that can be used in both commercial and residential spaces. According to the IEC 61000–3–2 standards [30], incandescent lamp dimmers are not classified into Class C (lighting equipment) in the case of the injection of high-order harmonic currents to the grid, but to Class A, which include difficult-to-classify devices. Thus, the level of harmonic contained in the current drawn from the LV grid by incandescent lamp dimmers is not so strictly limited as other lighting equipment. Table 2 shows the type of set and the appliances that constitute it.
After the selection of the appliances, the laboratory test stand to assess the impact of various nonlinear electrical equipment on PQ were constructed. The diagram and photo of the prepared test stand are shown in Figure 4 and Figure 5.
In Stage 3, the indicators of the impact on power quality associated with their operation were collected. Hence, the current harmonics distortion rate of each of the devices as well three different sets of them are measured. To conduct the measurements, the class A PQ analyzer (FLUKE 435) and the associated equipment were used, including 5 A and 20 A precision current clamps.
In this work, the steady-state operation and respective harmonic pollution of devices are considered. The power quality analysis was performed by the assessment of the current distortion level, which was evaluated via the current total harmonic distortion factor ( T H D I )   in percentage. The power quality analyzer allows the recording of harmonics up to the 50th order. Thus, the current distortion rate was calculated according to the expression shown in Equation (2), as defined in IEC 61000–2–2 standard [60].
T H D I = h = 2 50 I h 2 I 1 · 100 %
For organization of the data, Stage 4 in systematic methodology was conducted using the simple mouse-controlled PC software FlukeView (version 3.2), which communicates with the PQ analyzer via the optically isolated OC4USB adapter/cable connected to the USB of the PC. The software enables saving, opening, and printing the data collected by the PQ analyzer, or exporting it to other programs.
The next section of this paper presents the obtained measurement results. It is followed by the discussion section, where the analysis and interpretation of the results are provided (Stage 5).

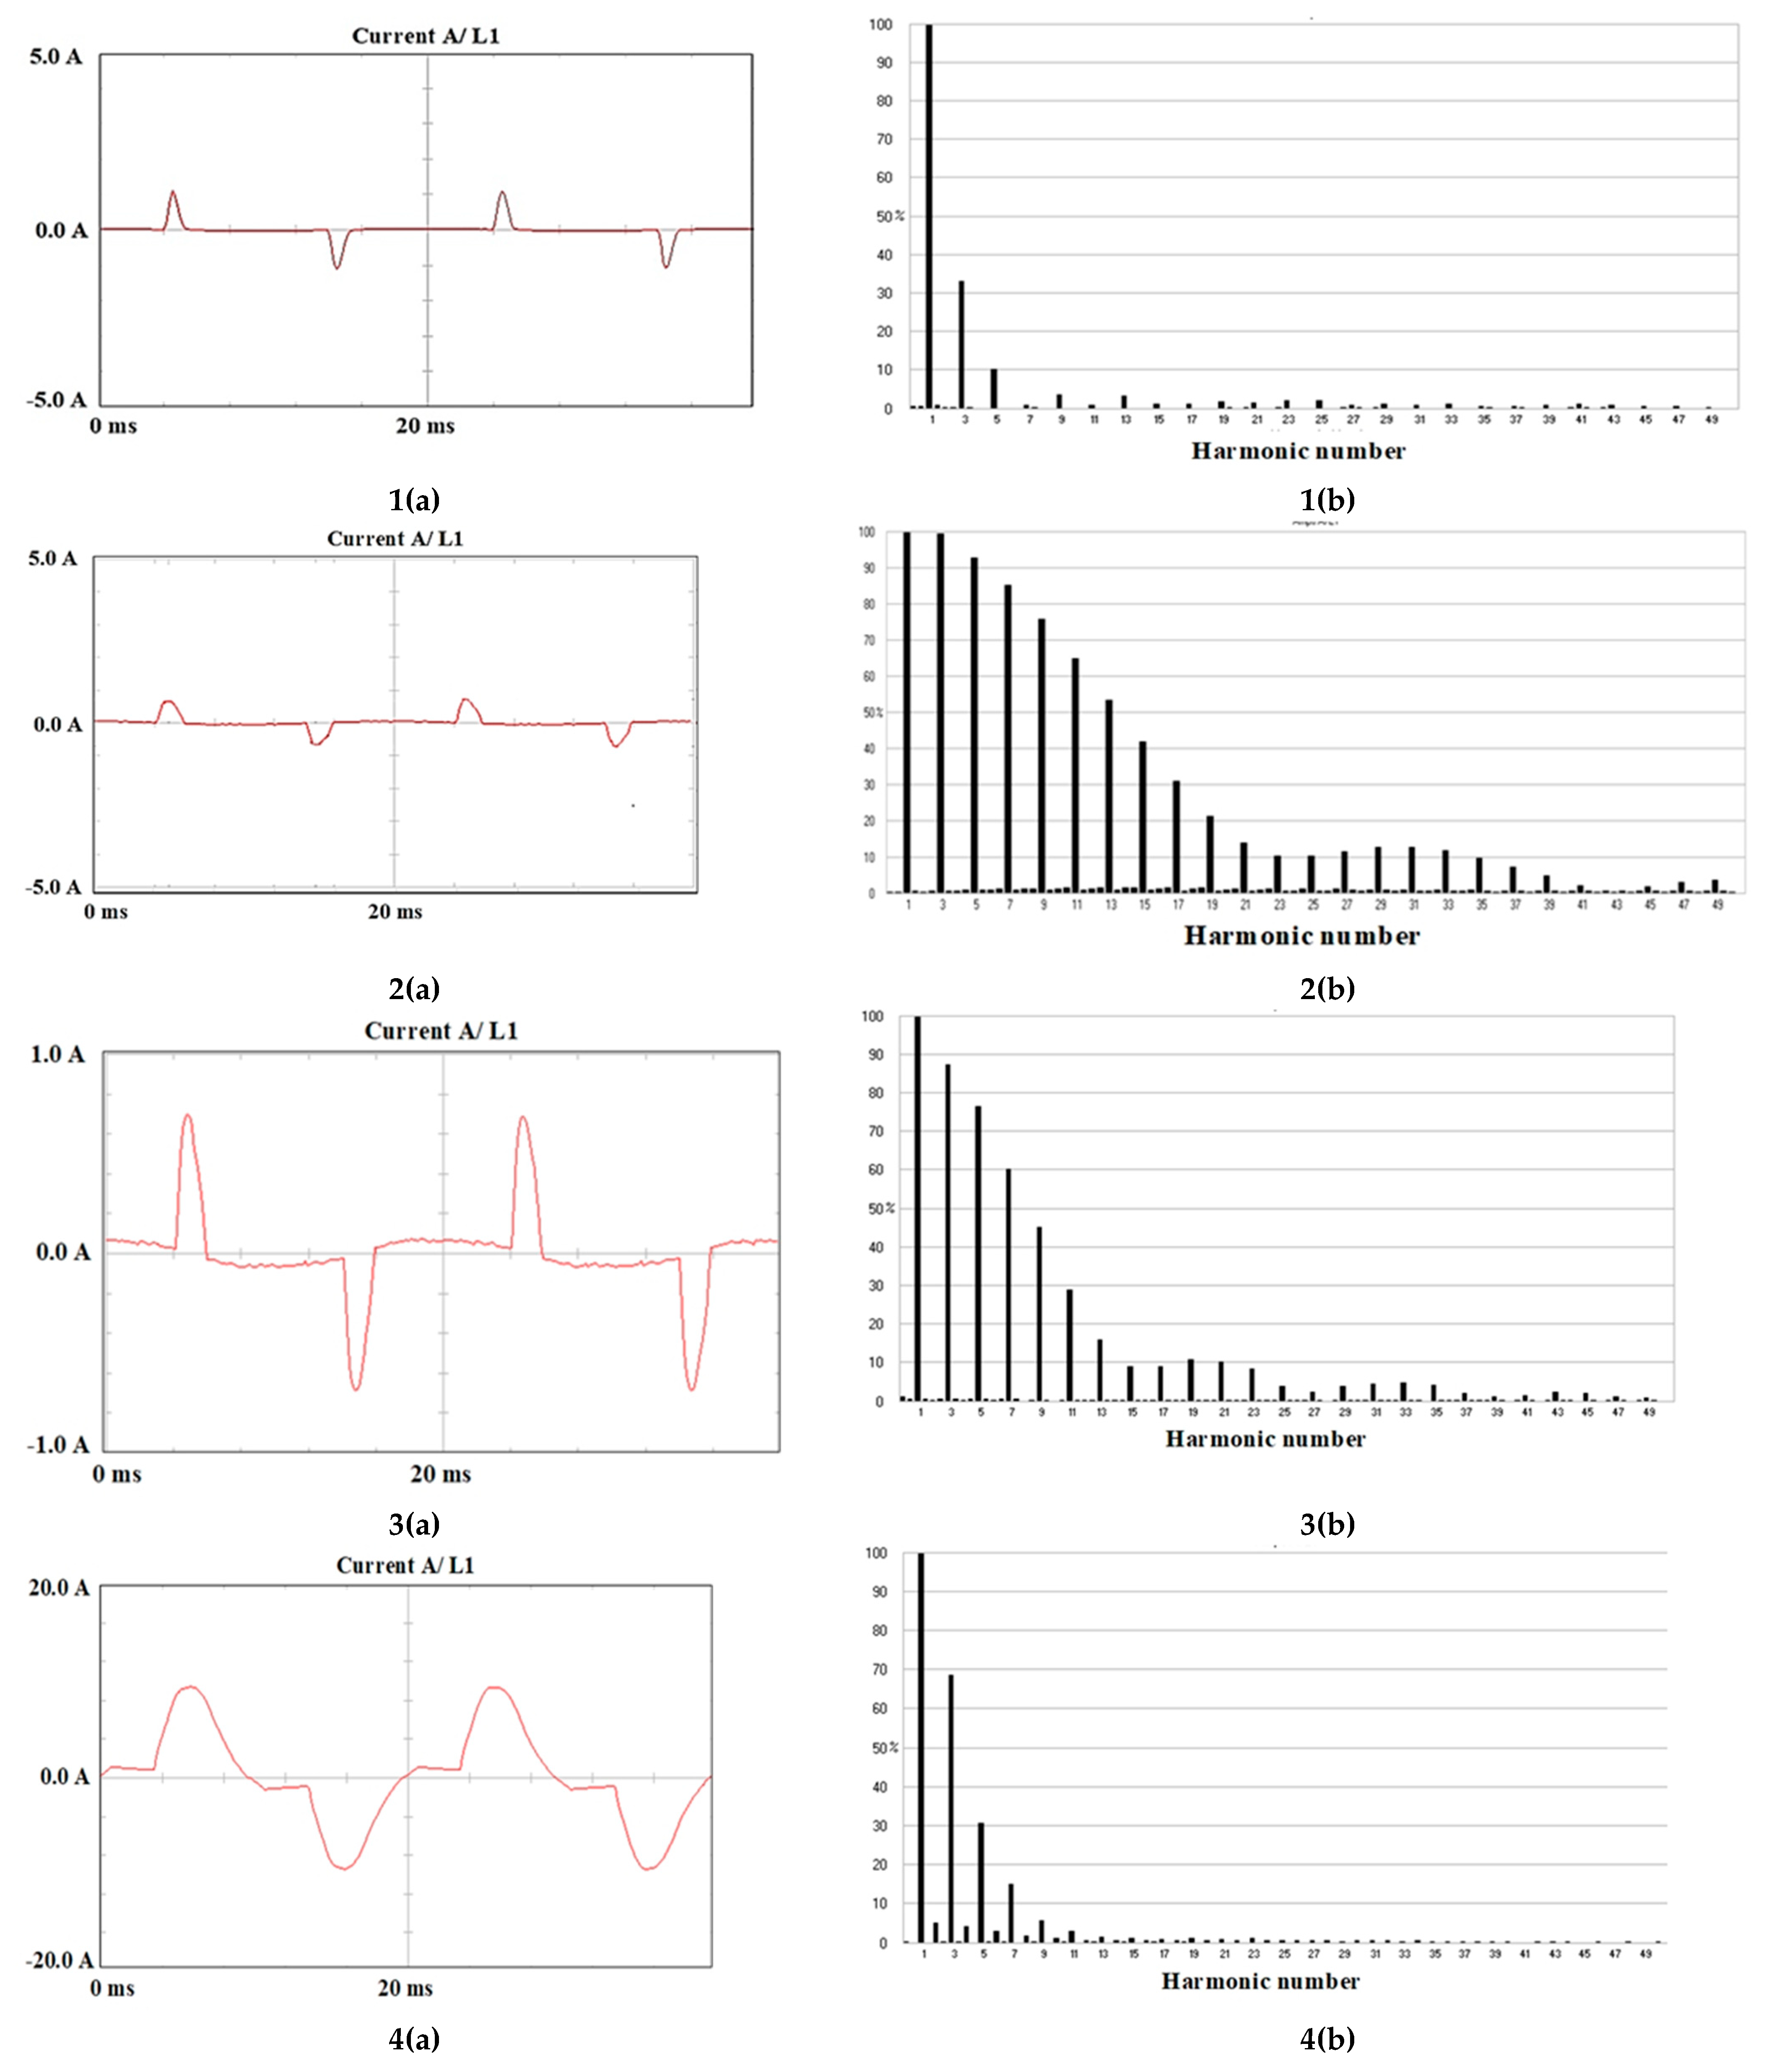
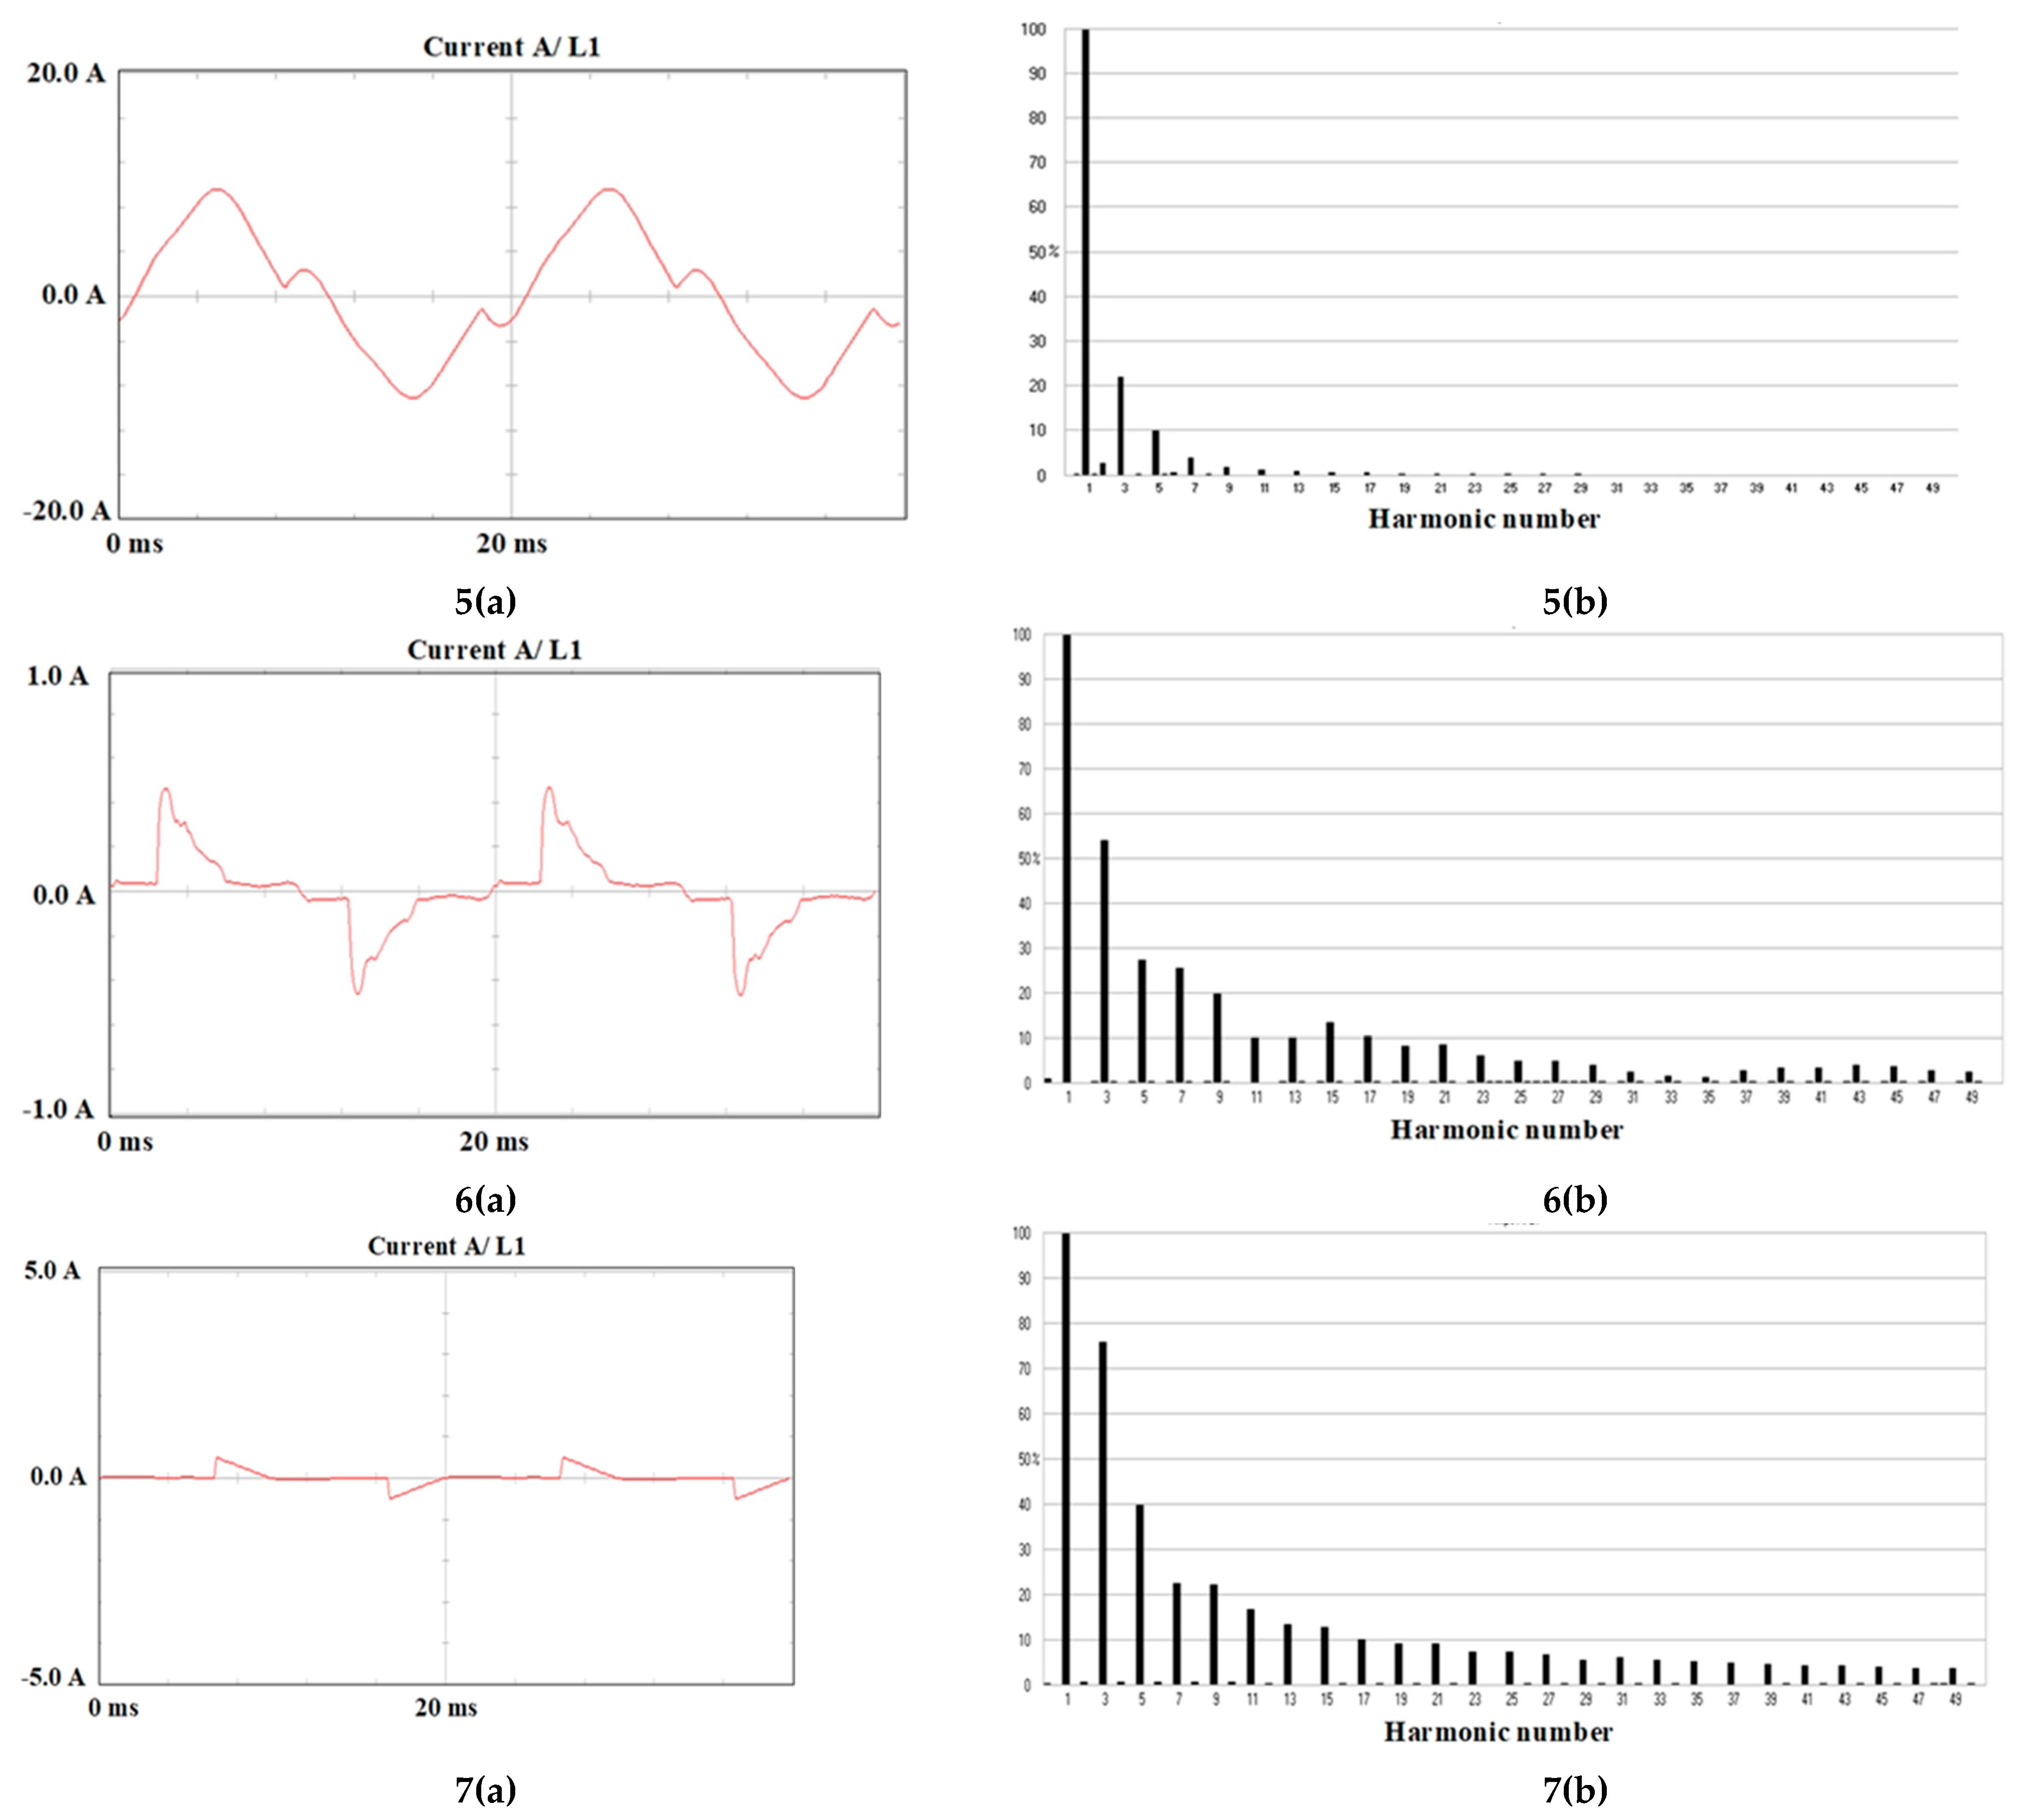
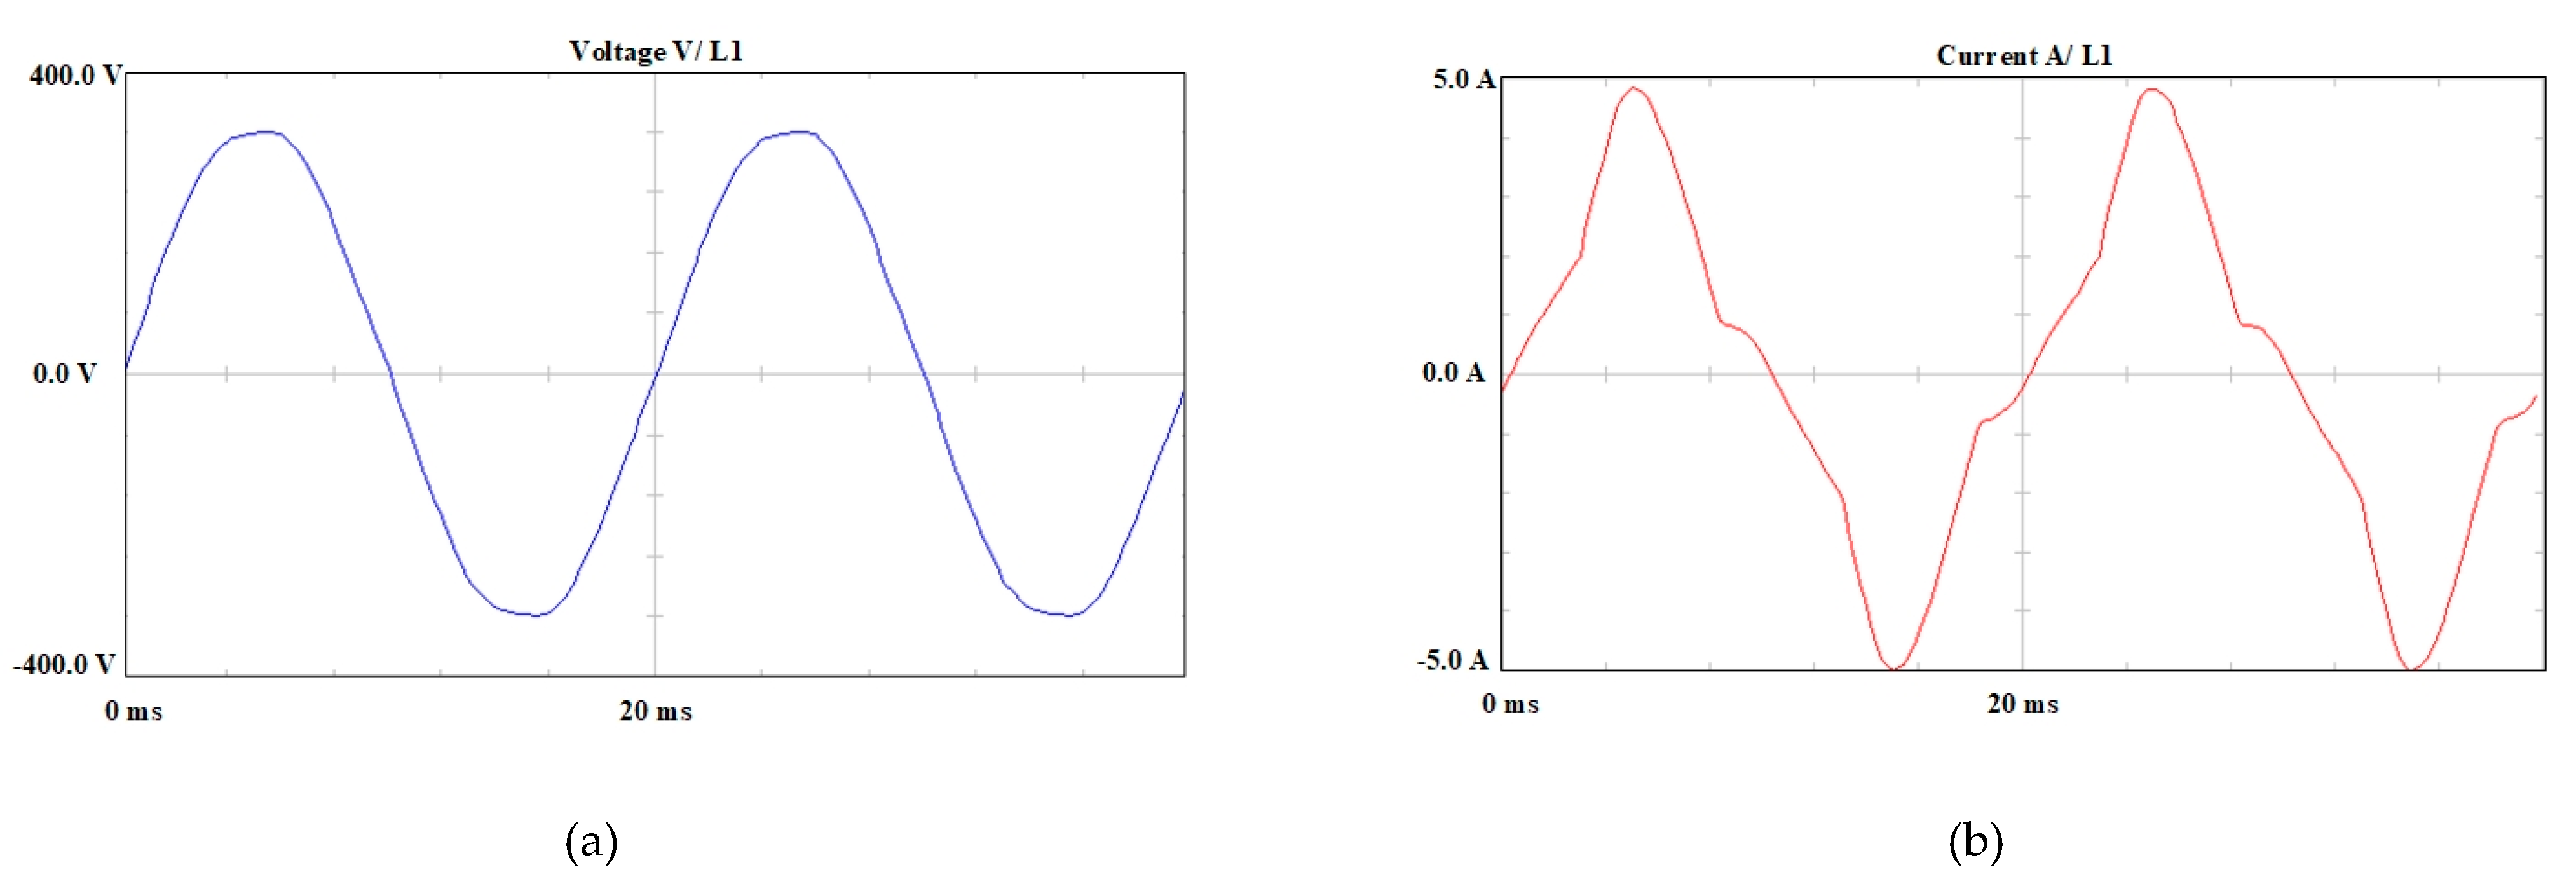
3.2. Results of Case Study

This section presents the measurement results that were conducted in a laboratory environment with the class A PQ analyzer (FLUKE 435) on the commonly used residential and commercial appliances to assess their impact on PQ.
In Figure 6, the measurement results for the appliances tested individually are presented. The input current waveforms are shown in a time domain, the harmonic spectra are represented up to the 50th harmonic, and the current total harmonic distortion factor   ( T H D I )   is obtained in percentage. Additionally, Table 3 was prepared to sum up the information about appliances and results of T H D I .
The input current waveforms in all cases are highly non-sinusoidal in each cycle. They are in different shapes and often flow in a pulsed manner, which indicates a relevant harmonic content in the signals. The level of harmonic distortion is graphically represented by bars that represent the individual harmonic magnitudes (as a percentage of the fundamental component). In all harmonic spectra, there is visible a clear advantage of the odd harmonics (gradually decreasing for larger orders) over even harmonics, which suggests that positive and negative half-cycles of the signals are symmetrical.
Analyzing the numerical indicator of harmonic current distortions   ( the   T H D I ) for each device, it can be seen that all of these values are excessively high, which implies that harmonic pollution injected into the network is very significant. The highest measured current distortion rate is equal to 207.3% for the adaptive fast smartphone charger. It is not difficult to imagine the negative impact of a huge number of these devices, which is adequate to the number of smartphones, on the distribution network. The smallest T H D I is noticed for the microwave oven, and it is equal to 24.6%.
As established in the IEC 61000–3–2 standards [30], the equipment with a rated current not greater than or equal to 16 A must not breach specified limits for harmonic current pollution. The literature [28,30,35] studies in detail whether the commercial and residential nonlinear loads supplied from the low-voltage utility grids meet the established criteria or not. This paper presents results that only support the hypothesis that nonlinear electrical loads are one of the main causes of electrical power quality deterioration and require appropriate analysis to evaluate their negative impact on the AC power distribution system.
In subsections below (Section 3.2.1, Section 3.2.2 and Section 3.2.3), the results of experimental tests for sets of devices are presented. The same parameters as those obtained for the appliances individually are measured.

3.2.1. Experimental Test 1: Set of household equipment

The set consists of some typical domestic electrical loads used for a short and long time, such as an LCD monitor–20″, coffee machine, compact fluorescent lamp, microwave oven, AC power adapter (laptop charger), and vacuum cleaner.
Figure 7 shows the waveforms of applied voltage and current drawn by the set of household equipment when connected collectively to the single-phase utility LV network, in the voltage range of 230–240 V. Due to the nonlinear behavior of all connected devices (see Figure 8) the total current drawn from the grid is significantly distorted by high-order harmonic currents, while the supplying voltage waveform is almost sinusoidal in shape.
The obtained harmonic spectrum (Figure 8) consists mainly of third ( 25%), fifth ( 7%), and seventh harmonics ( 4%). The values in brackets indicate the magnitude of the harmonic current components in percentages of the magnitude of the fundamental component. The individual amplitudes decrease for larger orders. The T H D I factor is equal to 25. 7%, which means a relatively low impact on PQ.
As previously mentioned, harmonic cancellation and attenuation phenomena in low-voltage networks occur. The first is due to phase angle diversity between the same-order harmonics produced by different nonlinear loads; the second is due to system impedance and the corresponding voltage distortion.
Thus, the current flowing through the sockets adapter (Figure 6f) has a lower current total harmonic distortion than each piece of previously individually tested household equipment.

3.2.2. Experimental Test 2: Set of Office Equipment

The set consists of some typical office electrical equipment used for a short and long time, such as an LCD monitor–20″, fluorescent lamp type T8, compact fluorescent lamp, desktop copier, AC power adapter (laptop charger), and adaptive fast smartphone charger.
The combination of lighting and office equipment also features the harmonic currents’ cancellation and attenuation effects in the low-voltage network. Figure 9 shows that the total current drawn in a pulsed manner by the second set of nonlinear loads is strongly distorted, while supplying voltage is almost free from distortion.
The visible bars in Figure 10 represent the odd harmonic currents’ magnitudes (as a percentage of the fundamental component). These results demonstrate that the devices operating simultaneously produce less current distortion ( T H D I   = 74.7%) than individually, e.g., or one adaptive fast smartphone charger the T H D I   = 207.3% (Figure 6).

3.2.3. Experimental Test 3: Set of Lighting Equipment

The set consists of some lighting equipment that can be used in both commercial and residential spaces, such as a: compact fluorescent lamp, fluorescent lamp type T8, high–intensity discharge lamp, dimmer and incandescent lamp.
Analyzing the harmonics spectrum (Figure 11) for the set of lighting equipment supplied from one socket adapter, it is evident again that the harmonic currents of different nonlinear loads are vectorially superposed. The higher magnitude reaches the third harmonic (c. 35% of the fundamental component). The amplitudes of successive odd harmonics are lower and do not decrease proportionally (the 17th harmonic     9%, whereas the 19th harmonic   1 %, and then the 21st harmonic   7 %). The current total harmonic distortion factor ( T H D I ) is equal to 46. 3%, and it is reflected in the oscillatory current waveform shape (Figure 12). This leads to the conclusion that the set of different types of lighting equipment has less impact on PQ than, e.g., the T H D I   factor equal to 73.8% for the CFL operating individually (see Figure 6). However, in general, the harmonic currents for CFLs are additive in behavior [51].

4. Discussion

The laboratory experiments demonstrated that the harmonic currents produced by multiple types of nonlinear loads were reduced. This effect is often less significant for the 3rd and 5th and 7th harmonics but becomes important for higher-current harmonics. Thus, the current total harmonic distortion factors ( T H D I )   for the combination of different residential, commercial, or lighting receivers were typically lower than for the individually tested units.
Although the results were based on a relatively small sample of electrical appliances, the obtained results are highly useful. For example, adding from 2 to even 10 CFLs to the set of different types of lighting sources in a typical house is not as harmonically harmful as one may expect.
In the obtained results, there were harmonic current summation and cancellation effects between individual loads working on the same network caused by phase angle diversity as well as a system impedance and the voltage distortions corresponding to them. This statement is in accord with harmonic studies about the impact of electric equipment on the utility grid [26,33,36,41].
Causes of summation and cancellation phenomena are other aspects of the presented analysis that will be investigated in future work, together with considering the interactions between different types of loads typically found in the residential and commercial sectors.
In all the different load groups analyzed, it was found that although there is a slight improvement, the distortion effect on the currents is still high.
There are considerable financial losses associated with poor PQ, and thus associated with harmonics [61,62]. The harmonic currents generated by nonlinear loads decrease the power factor, which can be considered an indicator of the quality of the device’s energy conversion and consequently distortion power. The reactive power and distortion power lead to actual energy consumption required for these loads’ proper operation that is higher than declared by the manufacturer. The losses associated with harmonics constantly vary with the change of the T H D I   factor and thus with connected and disconnected electrical equipment. Even if the amount of wasted energy in one residential area may be negligible, the total amount of energy that is used in the residential and commercial sector is relevant and the losses cannot be neglected anymore.
Working in accordance with the standards often requires some assumptions to be made. In the conducted experimental tests described in this paper, it is simplified that the voltage stays undistorted (sinusoidal, without harmonics); however, in the real low-voltage grid conditions the T H D V changed continuously in respect to time and location. Thus, the same loads put in two different places in the power system may result in various harmonic characteristics because of two different distortion values in supplying voltage [63,64].
Often, the additional difficulty is to measure harmonic characteristics for many nonlinear receivers in laboratory conditions due to lack of space and costs. Thus, to simulate harmonic currents generated by sets of large–scale nonlinear loads and to assess their impact on power quality, different software packages such as MATLAB, ETAP, CYME, PSCAD are often used [29]. Some of the research related to the simulation of harmonic character by using this software is presented in [42,49].
There are typical mitigation techniques used in industry today to reduce harmonic loading in a system [65]. They include active filtering, series and shunt passive filtering, multiple pulse rectifiers, and isolation transformers. Each type of these solutions has its advantages and disadvantages, which are described in more detail in [66,67,68].
The PQ problems and their mitigation techniques are playing a very important role in future electrical engineering. Thus, this area requires a continuous process for research and development.

5. Conclusions

The appliances commonly used in commercial and residential facilities can be significant sources of harmonic currents. This is particularly true when the simple approach for forecasting the level of harmonic current injection to the utility grid is taken into account. The composite approach also contributes to the harmonic-producing characteristics of electrical equipment.
The objective of this paper was to present a comparative study on both approaches. The measurements were conducted for different nonlinear load types served from the same feeder at the same time. The study indicates that harmonics in the current waveforms strongly deteriorate the quality of the electricity. The current harmonic pollution at PCC depends on the summation and/or cancellation effects in total current drawn from the grid by nonlinear loads. This should be a key factor used to determine the guidelines that limit current harmonic pollution in the distribution system.
Another value of this work is the establishment of a framework for comparing the harmonic effect of various appliances consistently. The next effort is to increase the number of appliance types measured so a useful database can be established.

Author Contributions

Conceptualization, Ł.M. and M.J.; methodology, M.J.; software, Ł.M.; validation, T.S., Ł.J., V.S. and Z.L.; formal analysis, Ł.M., M.J. and T.S.; investigation, Ł.M. and M.J.; resources, Ł.M.; data curation, Ł.M. and M.J.; writing—original draft preparation, Ł.M.; writing—review and editing, M.J.; visualization, Ł.M., Ł.J. and V.S.; supervision, M.J., T.S. and Z.L.; project administration, M.J.; funding acquisition, Z.L. All authors have read and agreed to the published version of the manuscript.

Funding

The research was founded by the Chair of Electrical Engineering Fundamentals K38W05D02, Wroclaw University of Science and Technology.

Data Availability Statement

Data will be sent on request by correspondence author.

Acknowledgments

This research was founded by the K38W05D02 of Wroclaw University of Science and Technology.

Conflicts of Interest

The authors declare no conflict of interest.

References

  1. Rüstemli, S.; Okuducu, E.; Almalı, M.N.; Efe, S.B. Reducing the effects of harmonics on the electrical power systems with passive filters. Bitlis Eren Univ. J. Sci. Technol. 2015, 5. [Google Scholar] [CrossRef] [Green Version]
  2. Singh, B.; Chandra, A.; Al-Haddad, K. Power Quality Problems and Mitigation Techniques; Wiley: Hoboken, NJ, US, 2014; Volume 9781118922. [Google Scholar]
  3. Milankov, R.; Radić, M. Harmonics: Examples of negative impacts. In Proceedings of the International Conference on Harmonics and Quality of Power, ICHQP, Bucharest, Romania, 25–28 May 2014. [Google Scholar]
  4. Da Silva, R.P.B.; Quadros, R.; Shaker, H.R.; Da Silva, L.C.P. Analysis of the electrical quantities measured by revenue meters under different voltage distortions and the influences on the electrical energy billing. Energies 2019, 12, 4757. [Google Scholar] [CrossRef] [Green Version]
  5. Nassar, S.R.; Eisa, A.A.; Saleh, A.A.; Farahat, M.A.; Abdel-Gawad, A.F. Evaluating the Impact of Connected Non Linear Loads on Power Quality- a Nuclear Reactor case study. J. Radiat. Res. Appl. Sci. 2020, 13. [Google Scholar] [CrossRef]
  6. Jasiński, M.; Sikorski, T.; Kostyła, P.; Kaczorowska, D.; Leonowicz, Z.; Rezmer, J.; Szymańda, J.; Janik, P.; Bejmert, D.; Rybiański, M.; et al. Influence of Measurement Aggregation Algorithms on Power Quality Assessment and Correlation Analysis in Electrical Power Network with PV Power Plant. Energies 2019, 12, 3547. [Google Scholar] [CrossRef] [Green Version]
  7. Song, J.; Xie, Z.; Zhou, J.; Yang, X.; Pan, A. Power Quality Indexes Prediction Based on Cluster Analysis and Support Vector Machine. In Proceedings of the 24th International Conference on Electricity Distribution, Glasgow, UK, 12–15 June 2017; pp. 12–15. [Google Scholar]
  8. Liu, Y.; Xu, L.; Zhou, S.; Yang, L.; Li, Y.; Feng, D. Identification of Major Power Quality Disturbance Sources in Regional Grid based on Monitoring Data Correlation Analysis. In Proceedings of the 2018 International Conference on Power System Technology (POWERCON), Guangzhou, China, 6–9 November 2018; pp. 4257–4263. [Google Scholar]
  9. Vinogradov, A.; Vinogradova, A.; Bolshev, V. Analysis of the quantity and causes of outages in LV/MV electrical grids. CSEE J. Power Energy Syst. 2020. [Google Scholar] [CrossRef]
  10. Zhang, J.; Cheng, Y.; Du, J.; Zhou, F.; Xiao, J.; Chang, S. Non-intrusive load monitoring and power quality optimization technology of major power customer basing on RFID. In Proceedings of the IOP Conference Series: Earth and Environmental Science; IOP Publishing LTD: Bristol, UK, 2020; Volume 440. [Google Scholar]
  11. Nazirov, K.B.; Ganiev, Z.S.; Dzhuraev, S.D.; Ismoilov, S.T.; Rahimov, R.A. Elaboration of the Method for Providing the Level of Power Quality in the Nodes of the Energy System while Power Quality Monitoring. In Proceedings of the 2020 IEEE Conference of Russian Young Researchers in Electrical and Electronic Engineering, EIConRus 2020, St. Petersburg and Moscow, Russia, 27–30 January 2020. [Google Scholar]
  12. Mahaddalkar, S.L.; Shet, V.N. Real Time Monitoring of LED Lighting Loads—A study assessing Power Quality. In Proceedings of the International Conference on Emerging Trends in Information Technology and Engineering, ic-ETITE 2020, Vellore, India, 24–25 February 2020. [Google Scholar]
  13. Sinvula, R.; Abo-Al-Ez, K.M.; Kahn, M.T. Harmonic Source Detection Methods: A Systematic Literature Review. IEEE Access 2019, 7, 74283–74299. [Google Scholar] [CrossRef]
  14. Olivares-Galván, J.C.; Georgilakis, P.S.; Ocon-Valdez, R. A review of transformer losses. Electr. Power Compon. Syst. 2009, 37, 1046–1062. [Google Scholar] [CrossRef]
  15. Khan, S.; Maximov, S.; Escarela-Perez, R.; Olivares-Galvan, J.C.; Melgoza-Vazquez, E.; Lopez-Garcia, I. Computation of stray losses in transformer bushing regions considering harmonics in the load current. Appl. Sci. 2020, 10, 3527. [Google Scholar] [CrossRef]
  16. Song, W.; Fang, J.; Jiang, Z. Numerical AC Loss Analysis in HTS Stack Carrying Nonsinusoidal Transport Current. IEEE Trans. Appl. Supercond. 2019, 29. [Google Scholar] [CrossRef]
  17. 2020 19th InternaOonal Conference on Harmonics and Quality of Power (ICHQP). In Proceedings of the International Conference on Harmonics and Quality of Power, ICHQP, Dubai, United Arab Emirates, 6–7 July 2020.
  18. Ojo, A.; Awodele, K.; Sebitosi, A. Power Quality Monitoring and Assessment of a Typical Commercial Building. In Proceedings of the IEEE Africon Conference, Accra, Ghana, 25–27 September 2019; Volume 2019-Septe. [Google Scholar]
  19. Song, W.; Fang, J.; Jiang, Z.; Staines, M.; Badcock, R. AC Loss Effect of High-Order Harmonic Currents in a Single-Phase 6.5 MVA HTS Traction Transformer. IEEE Trans. Appl. Supercond. 2019, 29. [Google Scholar] [CrossRef]
  20. Khelifa, R.F.; Jelassi, K. An energy and power quality monitoring system of a power distribution. In Proceedings of the 2016 International Conference on Electrical Sciences and Technologies in Maghreb, CISTEM 2016, Marrakech & Bengrir, Morocco, 26–28 October 2017. [Google Scholar]
  21. De La Rosa, F.C. Harmonics, Power Systems and Smart Grids, 2nd ed.; CRC Press: Boca Raton, FL, USA, 2015. [Google Scholar]
  22. Ghorbani, M.J.; Mokhtari, H. Impact of harmonics on power quality and losses in power distribution systems. Int. J. Electr. Comput. Eng. 2015, 5, 166–174. [Google Scholar] [CrossRef]
  23. Vinogradov, A.; Vasiliev, A.; Bolshev, V.; Semenov, A.; Borodin, M. Time Factor for Determination of Power Supply System Efficiency of Rural Consumers. In Handbook of Research on Renewable Energy and Electric Resources for Sustainable Rural Development; IGI Global: Hershey, PA, USA, 2018; pp. 394–420. ISBN 9781522538677. [Google Scholar]
  24. Constantinescu, F.; Gheorghe, A.G.; Marin, M.E.; Taus, O.S. Harmonic balance analysis of home appliances power networks. In Proceedings of the 2017 14th International Conference on Engineering of Modern Electric Systems, EMES 2017, Oradea, România, 1–2 June 2017. [Google Scholar]
  25. Sivaraman, P.; Sharmeela, C. Power system harmonics. In Power Quality in Modern Power Systems; Academic Press: London, UK, 2021. [Google Scholar]
  26. Committee, D.; Power, I.; Society, E. IEEE Std 519-2014 (Revision IEEE Std 519-1992). In Proceedings of the 2017 IEEE Power & Energy Society General Meeting, Chicago, IL, USA, 16–20 July 2014; Volume 2014. [Google Scholar]
  27. International Electrotechnical Commission. Electromagnetic Compatibility (EMC) Part 3-6: Limits—Assessment of Emission Limits for the Connection of Distorting Installations to MV, HV and EHV Power Systems; International Electrotechnical Commission: Geneva, Switzerland, 2008. [Google Scholar]
  28. Liang, X.; Andalib -Bin- Karim, C. Harmonics and Mitigation Techniques Through Advanced Control in Grid-Connected Renewable Energy Sources: A Review. IEEE Trans. Ind. Appl. 2018, 54, 3100–3111. [Google Scholar] [CrossRef]
  29. Collocott, C.L.; Awodele, K.O.; Adebayo, A.V. Harmonic emission of non-linear loads in distribution systems—A computer laboratory case study. In Proceedings of the 2020 International SAUPEC/RobMech/PRASA Conference, SAUPEC/RobMech/PRASA 2020, Cape Town, South Africa, 29–31 January 2020. [Google Scholar]
  30. Abidin, M.N.Z. IEC. In 61000-3-2 Harmonics Standards Overview; Schaffner EMC Inc.: Edsion, NJ, USA, 2014. [Google Scholar]
  31. Wang, Z.; Li, Q.; Tang, Y.; Liu, S.; Dai, S. Comparison of harmonic limits and evaluation of the international standards. MATEC Web Conf. 2019, 277, 03009. [Google Scholar] [CrossRef]
  32. Cho, N.; Lee, H.; Bhat, R.; Heo, K. Analysis of Harmonic Hosting Capacity of IEEE Std. 519 with IEC 61000-3-6 in Distribution Systems. In Proceedings of the 2019 IEEE PES GTD Grand International Conference and Exposition Asia (GTD Asia), Bangkok, Thailand, 21–23 March 2019; IEEE: Piscataway, NJ, USA, 2019; pp. 730–734. [Google Scholar]
  33. Dartawan, K.; Najafabadi, A.M. Case study: Applying IEEE Std. 519-2014 for harmonic distortion analysis of a 180 MW solar farm. In Proceedings of the 2017 IEEE Power & Energy Society General Meeting, Chicago, IL, USA, 16–20 July 2017; pp. 1–5. [Google Scholar]
  34. Mishra, A.; Tripathi, P.M.; Chatterjee, K. A review of harmonic elimination techniques in grid connected doubly fed induction generator based wind energy system. Renew. Sustain. Energy Rev. 2018, 89, 1–15. [Google Scholar] [CrossRef]
  35. Vinayagam, A.; Aziz, A.; PM, B.; Chandran, J.; Veerasamy, V.; Gargoom, A. Harmonics assessment and mitigation in a photovoltaic integrated network. Sustain. Energy Grids Netw. 2019, 20, 100264. [Google Scholar] [CrossRef]
  36. Gong, J.; Li, D.; Wang, T.; Pan, W.; Ding, X. A comprehensive review of improving power quality using active power filters. Electr. Power Syst. Res. 2021, 199, 107389. [Google Scholar] [CrossRef]
  37. Montoya, F.G.; Baños, R.; Alcayde, A.; Arrabal-Campos, F.M. A new approach to single-phase systems under sinusoidal and non-sinusoidal supply using geometric algebra. Electr. Power Syst. Res. 2020, 189, 106605. [Google Scholar] [CrossRef]
  38. Chiradeja, P.; Ngaopitakkul, A.; Jettanasen, C. Energy savings analysis and harmonics reduction for the electronic ballast of T5 fluorescent lamp in a building’s lighting system. Energy Build. 2015, 97. [Google Scholar] [CrossRef]
  39. Alammari, R.; Islam, M.S.; Chowdhury, N.A.; Sakil, A.K.; Iqbal, A.; Khandakar, A. Impact on power quality due to large-scale adoption of compact fluorescent lamps–a review. Int. J. Ambient Energy 2017, 38. [Google Scholar] [CrossRef]
  40. Henao-Muñoz, A.C.; Herrera-Murcia, J.G.; Saavedra-Montes, A.J. Experimental characterization of compact fluorescent lamps for harmonic analysis of power distribution systems. TecnoLógicas 2018, 21. [Google Scholar] [CrossRef] [Green Version]
  41. Mathwai, T.; Awodele, K.; Ojo, A. Power quality evaluation of electrical loads in a typical commercial building. In Proceedings of the 2020 International SAUPEC/RobMech/PRASA Conference, SAUPEC/RobMech/PRASA 2020, Cape Town, South Africa, 29–31 January 2020. [Google Scholar]
  42. Blanco, A.M.; Yanchenko, S.; Meyer, J.; Schegner, P. Impact of supply voltage distortion on the current harmonic emission of non-linear loads. DYNA 2015, 82. [Google Scholar] [CrossRef]
  43. Graña-López, M.Á.; Filgueira-Vizoso, A.; Castro-Santos, L.; García-Diez, A.I. Analysis of the real energy consumption of energy saving lamps. Appl. Sci. 2020, 10, 8446. [Google Scholar] [CrossRef]
  44. Montoya, F.G.; Castillo, J. Power quality in modern lighting: Comparison of LED, microLED and CFL lamps. Renew. Energy Power Qual. J. 2016, 1. [Google Scholar] [CrossRef]
  45. Gil-De-Castro, A.; Medina-Gracia, R.; Ronnberg, S.K.; Blanco, A.M.; Meyer, J. Differences in the performance between CFL and LED lamps under different voltage distortions. In Proceedings of the International Conference on Harmonics and Quality of Power, ICHQP, Ljubljana, Slovenia, 13–16 May 2018. [Google Scholar]
  46. Nikum, K.; Saxena, R.; Wagh, A. Power Quality Issues in Commercial Load—Impact and Mitigation Difficulties in Present Scenario. In Proceedings of the Lecture Notes in Electrical Engineering; Springer: Singapore, 2021; Volume 698. [Google Scholar]
  47. Ahir, J.; Upadhyay, C. Harmonic Analysis and Mitigation for Modern Home Appliances. In Proceedings of the 4th International Conference on Electrical Energy Systems, ICEES 2018; Institute of Electrical and Electronics Engineers Inc.: Piscataway, NJ, USA, 2018; pp. 218–223. [Google Scholar]
  48. Manias, S.N. Power Electronics and Motor Drive Systems; Academic Press: London, UK, 2016. [Google Scholar]
  49. Djokic, S.Z.; Collin, A.J. Cancellation and attenuation of harmonics in low voltage networks. In Proceedings of the International Conference on Harmonics and Quality of Power, ICHQP, Bucharest, Romania, 25–28 May 2014. [Google Scholar]
  50. Blanco, A.M.; Gupta, M.; Gil de Castro, A.; Ronnberg, S.; Meyer, J. Impact of flat-top voltage waveform distortion on harmonic current emission and summation of electronic household appliances. Renew. Energy Power Qual. J. 2018, 1, 698–703. [Google Scholar] [CrossRef]
  51. Rawa, M.J.H.; Thomas, D.W.P.; Sumner, M. Factors affecting the harmonics generated by a cluster of personal computers. In Proceedings of the International Conference on Harmonics and Quality of Power, ICHQP, Bucharest, Romania, 25–28 May 2014. [Google Scholar]
  52. Mesas, J.J.; Sainz, L.; Sala, P. Statistical study of personal computer cluster harmonic currents from experimental measurements. Electr. Power Components Syst. 2015, 43. [Google Scholar] [CrossRef] [Green Version]
  53. Rawa, J.H.; Factors, M. Affecting the Harmonics Generated by a Group of CFLs: Experimental Measurements. Am. J. Electr. Power Energy Syst. 2015, 4. [Google Scholar] [CrossRef] [Green Version]
  54. Ghanbari, T.; Farjah, E.; Naseri, F. Power quality improvement of radial feeders using an efficient method. Electr. Power Syst. Res. 2018, 163, 140–153. [Google Scholar] [CrossRef]
  55. Santha Kumar, C.; Ramesh, P.; Kasilingam, G.; Ragul, D.; Bharatiraja, C. The power quality measurements and real time monitoring in distribution feeders. Mater. Today Proc. 2021, 45, 2987–2992. [Google Scholar] [CrossRef]
  56. Ujile, A.; Ding, Z. A dynamic approach to identification of multiple harmonic sources in power distribution systems. Int. J. Electr. Power Energy Syst. 2016, 81, 175–183. [Google Scholar] [CrossRef]
  57. Çiçek, A.; Erenoğlu, A.K.; Erdinç, O.; Bozkurt, A.; Taşcıkaraoğlu, A.; Catalão, J.P.S. Implementing a demand side management strategy for harmonics mitigation in a smart home using real measurements of household appliances. Int. J. Electr. Power Energy Syst. 2021, 125, 106528. [Google Scholar] [CrossRef]
  58. Pérez Vallés, A.; Salmerón Revuelta, P. A new distributed measurement index for the identification of harmonic distortion and/or unbalance sources based on the IEEE Std. 1459 framework. Electr. Power Syst. Res. 2019, 172, 96–104. [Google Scholar] [CrossRef]
  59. Kalair, A.R.; Stojcevski, A.; Seyedmahmoudian, M.; Abas, N.; Kalair, A.; Khan, N.; Saleem, M.S. Steady-state and time-varying harmonics in distribution system. In Uncertainties in Modern Power Systems; Elsevier: Amsterdam, The Netherlands, 2021; pp. 485–539. [Google Scholar]
  60. IEC. IEC 61000-2-2: Electromagnetic Compatibility (EMC)—Part 2-2: Environment—Compatibility Levels for Low-Frequency Conducted Disturbances and Signalling in Public Low-Voltage Power Supply Systems; IEC Comission: New York, NY, USA, 2002. [Google Scholar]
  61. Yanchenko, S.; Kulikov, A.; Tsyruk, S. Modeling harmonic amplification effects of modern household devices. Electr. Power Syst. Res. 2018, 163. [Google Scholar] [CrossRef]
  62. Qingliang, W.; Shuaiqi, T.; Zhengdong, H.; Qian, N. Calculation and Analysis of Transformer Loss Cost under Harmonic Environment. In Proceedings of the 2019 IEEE 2nd International Conference on Electronics and Communication Engineering (ICECE), Xi’an, China, 9–11 December 2019; pp. 392–396. [Google Scholar]
  63. Moradi, A.; Yaghoobi, J.; Alduraibi, A.; Zare, F.; Kumar, D.; Sharma, R. Modelling and prediction of current harmonics generated by power converters in distribution networks. IET Gener. Transm. Distrib. 2021, gtd2.12166. [Google Scholar] [CrossRef]
  64. Almutairi, M.S.; Hadjiloucas, S. Harmonics Mitigation Based on the Minimization of Non-Linearity Current in a Power System. Designs 2019, 3, 29. [Google Scholar] [CrossRef] [Green Version]
  65. Yazdani-Asrami, M.; Sadati, S.M.B.; Samadaei, E. Harmonic study for MDF industries: A case study. In Proceedings of the 2011 IEEE Applied Power Electronics Colloquium (IAPEC), Johor Bharu, Malaysia, 18–19 April 2011; pp. 149–154. [Google Scholar]
  66. Senthil Kumar, R.; Surya Prakash, R.; Yokesh Kiran, B.; Sahana, A. Reduction and elimination of harmonics using power active harmonic filter. Int. J. Recent Technol. Eng. 2019, 8. [Google Scholar] [CrossRef]
  67. Park, B.; Lee, J.; Yoo, H.; Jang, G. Harmonic Mitigation Using Passive Harmonic Filters: Case Study in a Steel Mill Power System. Energies 2021, 14, 2278. [Google Scholar] [CrossRef]
  68. Lumbreras, D.; Gálvez, E.; Collado, A.; Zaragoza, J. Trends in Power Quality, Harmonic Mitigation and Standards for Light and Heavy Industries: A Review. Energies 2020, 13, 5792. [Google Scholar] [CrossRef]
Figure 1. Groups of modern power electronic-driven appliances.
Energies 14 03665 g001
Figure 2. The typical model of the customer’s loads supply system.
Energies 14 03665 g002
Figure 3. Classification of electrical equipment to limit harmonic pollution.
Energies 14 03665 g003
Figure 4. Diagram of the measurement system.
Energies 14 03665 g004
Figure 5. Laboratory measurement stand for testing the impact of nonlinear devices on power quality: (a) power supply AC 230 V 50 Hz; (b) power quality analyzer Fluke 435; (c) adapter for measuring voltage in a single-phase circuit; (d) measuring clamp; (e) PC with FlukeView software; (f) adapter for testing a set of electrical equipment; (g) electrical equipment under test.
Energies 14 03665 g005
Figure 6. Measurements obtained for individual devices: (a) current waveform; (b) harmonic spectrum; 1—AC Power Adapter, 2—Adaptive Fast Smartphone Charger, 3—LCD monitor–20″, 4—Vacuum cleaner, 5—Microwave oven, 6—Compact fluorescent lamp, 7—Dimmer and incandescent lamp.
Energies 14 03665 g006aEnergies 14 03665 g006b
Figure 7. Set of household equipment: (a) input voltage waveform; (b) input current waveform.
Energies 14 03665 g007
Figure 8. Set of household equipment: harmonic spectrum and current total harmonic distortion factor. THDI = 25.7%.
Energies 14 03665 g008
Figure 9. Set of office equipment: (a) input voltage waveform, (b) input current waveform.
Energies 14 03665 g009aEnergies 14 03665 g009b
Figure 10. Set of office equipment: harmonic spectrum and current total harmonic distortion factor. THDI = 74.7%.
Energies 14 03665 g010
Figure 11. Set of lighting equipment: (a) input voltage waveform, (b) input current waveform.
Energies 14 03665 g011
Figure 12. Set of lighting equipment: harmonic spectrum and current total harmonic distortion factor. THDI = 46.3%.
Energies 14 03665 g012
Table 1. Technical specifications of the selected equipment.
No.TypeBrandModelI (A)P (W)
1Laptop charger (AC Power Adapter)SamsungA10–090P1A1.590
2Smartphone ChargerSamsungEP–TA20EWE0.50.1
3Desktop Copier (standby mode)CanonIR20162.53.6
4LCD monitor–20″LGL204WT1.045
5Vacuum cleanerZelmer321.0.E01E6.01200
6Coffee machineKrupsEA815.51450
7Microwave ovenFIFMD 420356.5800
8Compact fluorescent lampOSRAM20 W/8650.220
9Fluorescent lamp type T8PhilipsTLD 18 W 8300.3618
10High intensity discharge lampPhilipsML 160W E270.73160
11Dimmer and incandescent lampF&FSCO–8121.560
Table 2. Selected sets of equipment.
No.Type of LoadsGroup of Loads
1HouseholdLCD monitor–20″
Caffe machine
Compact fluorescent lamp
Microwave
AC Power Adapter (Charger)
Vacuum cleaner
2OfficeLCD monitor–20″
Fluorescent lamp type T8
Compact fluorescent lamp
Desktop Copier
AC Power Adapter (Charger)
Adaptive Fast Smartphone Charger
3LightingCompact fluorescent lamp
Fluorescent lamp type T8
High–intensity discharge lamp
Dimmer and incandescent lamp
Table 3. Current total harmonic distortion factor ( T H D I )   measurements obtained for individual devices.
No.Appliance T H D I
1AC Power Adapter 35.3 %
2Smartphone Charger 207.3 %
3LCD monitor–20″ 145.3 %
4Vacuum cleaner 75.9 %
5Microwave oven 24.6 %
6Compact fluorescent lamp 73.5 %
7Dimmer and incandescent lamp 97.7 %
Publisher’s Note: MDPI stays neutral with regard to jurisdictional claims in published maps and institutional affiliations.

