
Correlations between the Composition of Liquid Fraction of Full-Scale Digestates and Process Conditions

 , , , and
Abstract
1. Introduction
2. Materials and Methods
2.1. Digestate Collection and Storage
2.2. Categorization of Substrates
2.3. Operating Conditions of the Anaerobic Plants
2.4. Filtration and Size Fractionation of Liquid Fractions of Digestates
2.5. Analytical Methods (Chemical, Physical and Biological)
2.6. Determination of Solid–liquid Separation Efficiency
2.7. Statistical Analysis
3. Results and Discussion
3.1. Correlation between Parameters
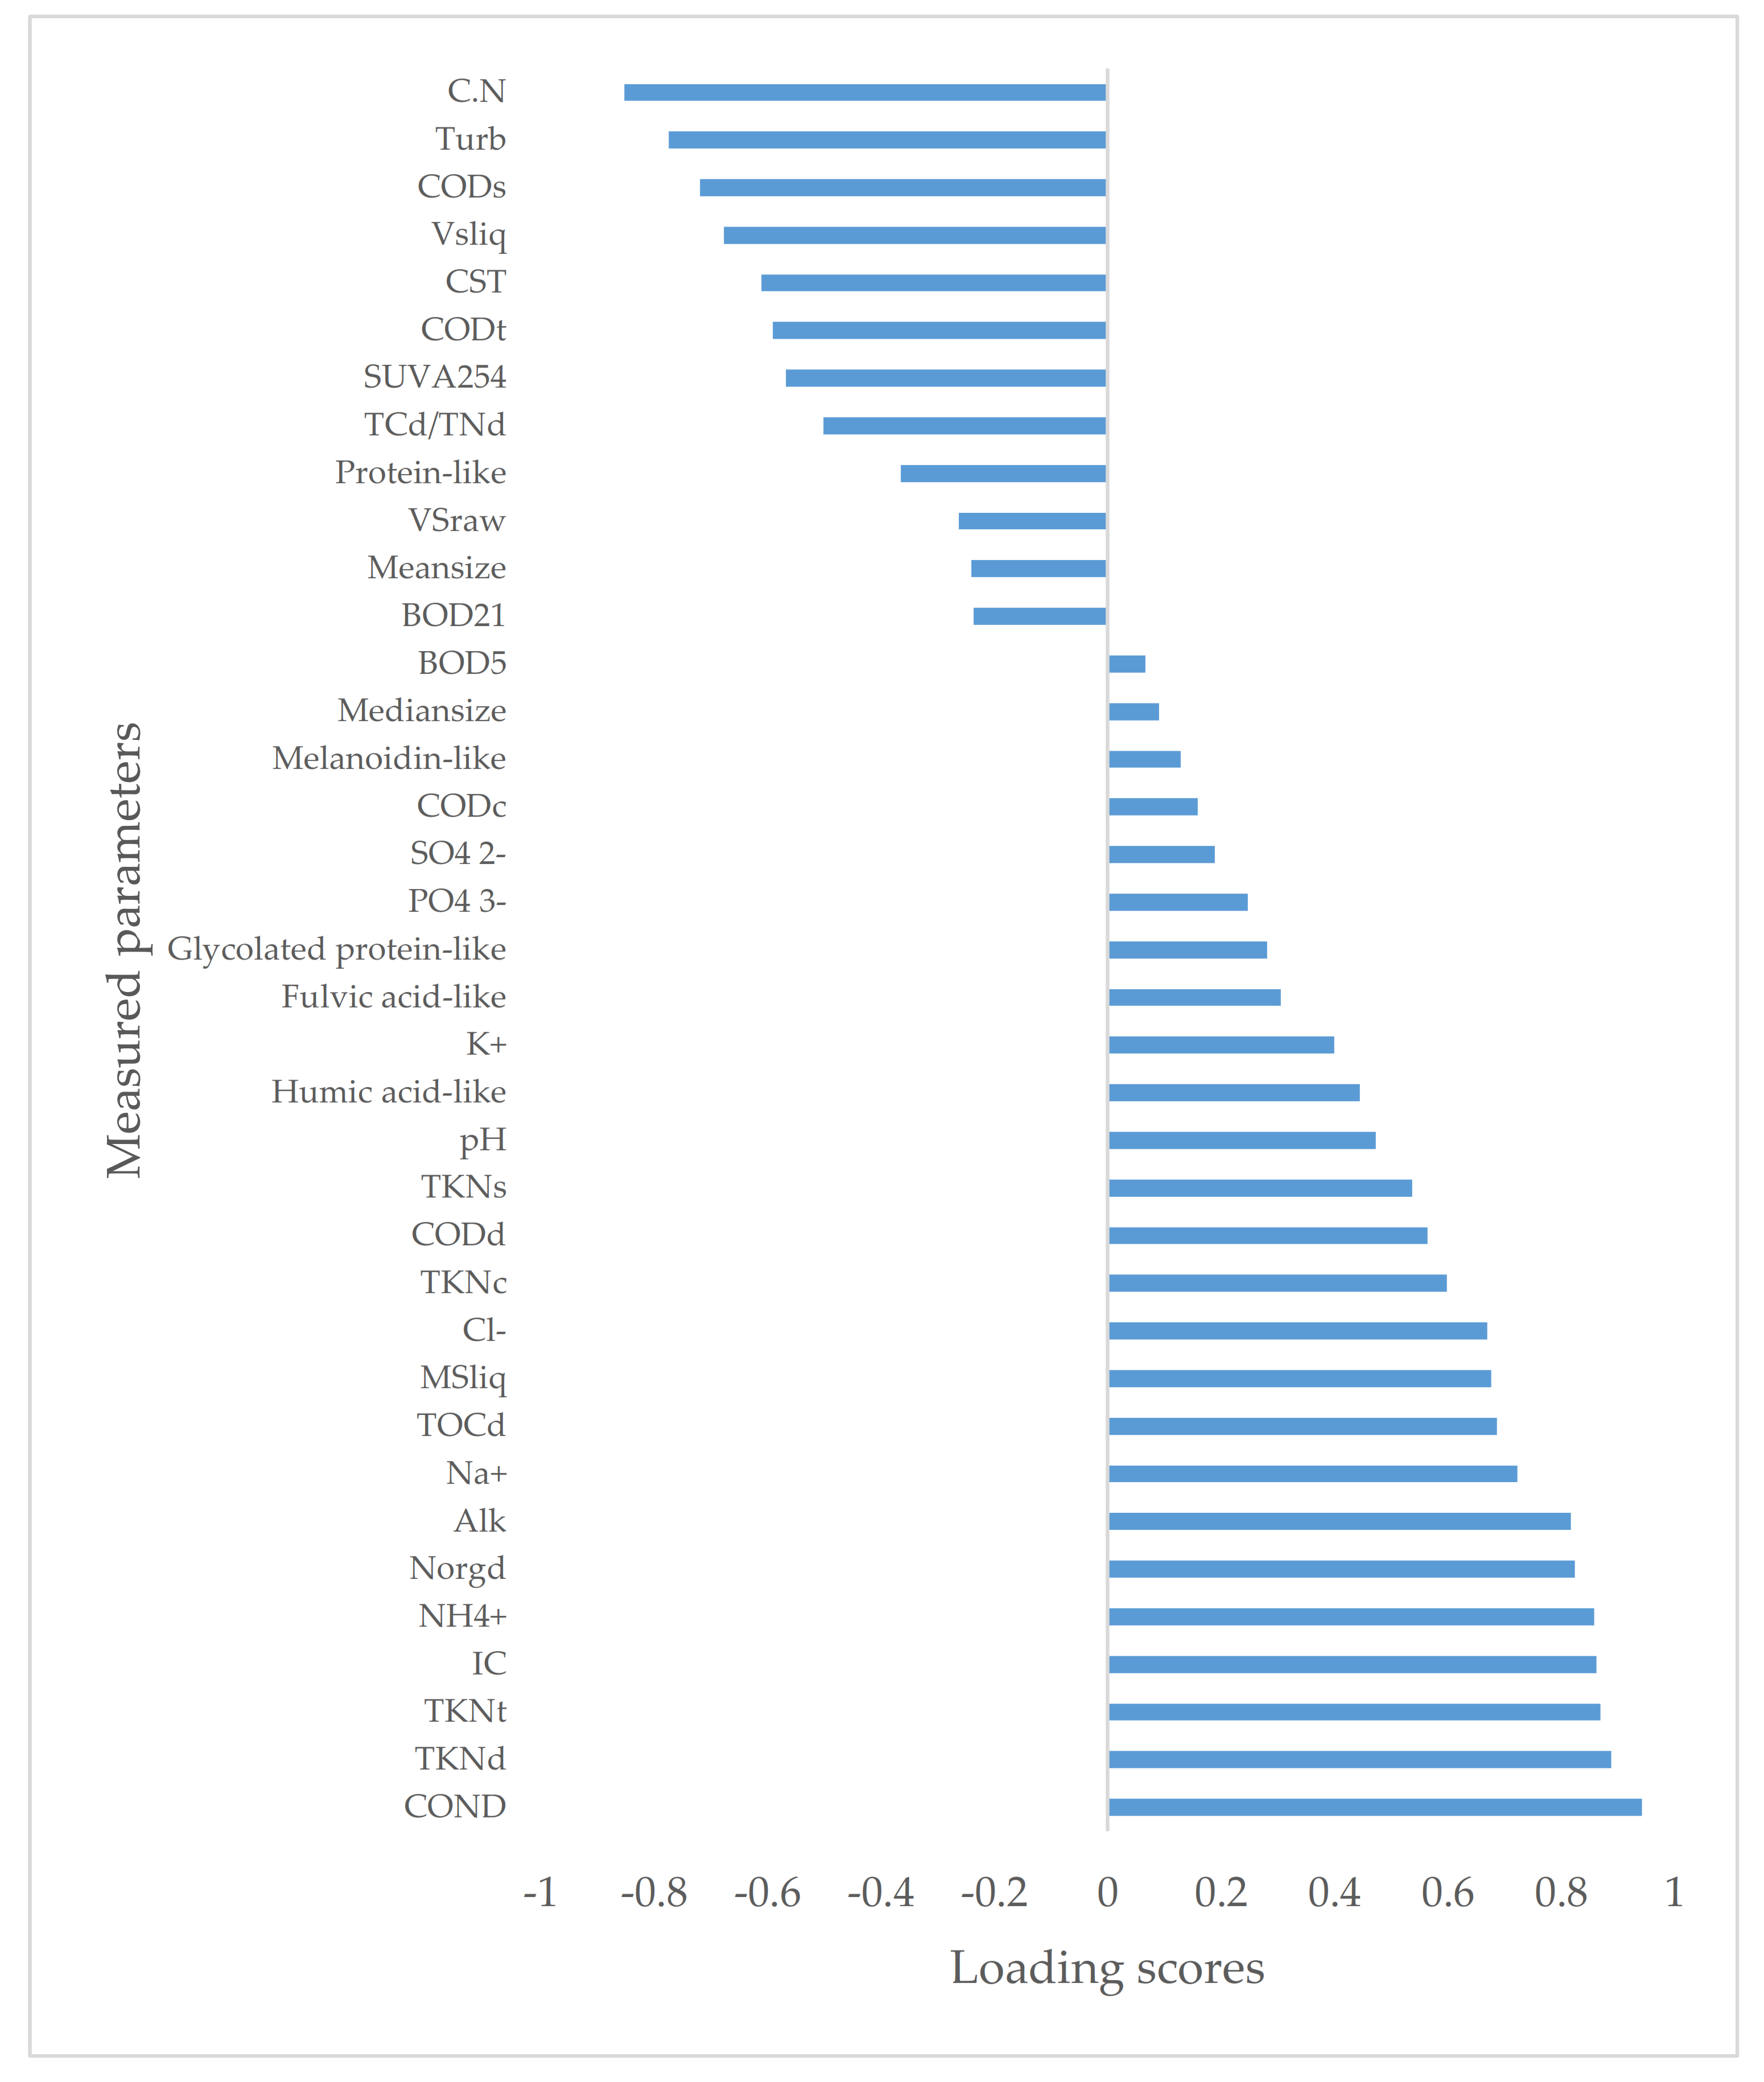
3.2. Multivariate Analysis via Principal Component Analysis (PCA): Impact of Solid–Liquid Separation Techniques
3.3. Influence of Feedstock Composition on Digestate Characteristics
3.4. Influence of Anaerobic Digestion Operating Parameters on Digestate Characteristics: Impact of HRT on Liquid Fractions of Digestates
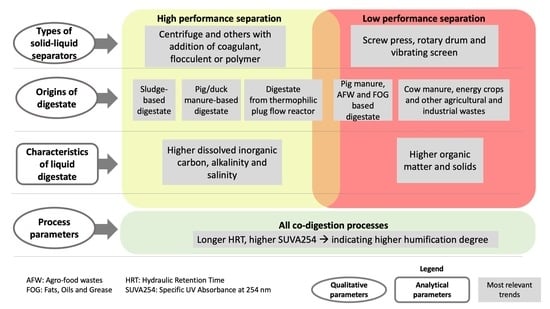
3.5. Outcome of the Work
- -
- Digestates from sewage sludge, pig manure and from thermophilic plug-flow reactor whose phase separation is carried out by high efficiency techniques (e.g., centrifugation, and other techniques using flocculant or coagulants) and
- -
- Digestates from agricultural fibrous feedstocks which are processed by low efficiency technique processes (e.g., screw presses, vibrating screens and rotary drums). In particular, cow manure content in the feedstock was found to have high impact on the remaining COD in the liquid fraction of digestate.
4. Conclusions
Author Contributions
Funding
Institutional Review Board Statement
Informed Consent Statement
Acknowledgments
Conflicts of Interest
Appendix A

| Substrate Category | Substrates at the Input |
|---|---|
| Sewage sludge (SS) | Sludge, solid sludge, liquid sludge, waste activated sludge, cheese plant sludge, contents from septic tanks (and garbage), wastewater |
| Manure (Mnr) | Animal manures and slurry |
| Energy crops (EnCr) | Energy crops, catch crop, corn silage, grass silage, grass, energy crop silage, whole grain plants, sorghum silage, barley, rye |
| Crop residues (CrR) | Crop residues, corn withers, sweetcorn cobs, tomato leaves, apple pomace |
| Cereal residues (Cer) | Cereal residues, crushed grain |
| Fats, oil and grease (FOG) | Fats, oil, grease |
| Agro-food wastes (AFW) | Food wastes, fruit and vegetable wastes, municipal biowastes, biowastes, glucose, cattle feed residues, pet food, milk industry residues, mixture of cream milk, slaughterhouse wastes, blood, glycerin, whey |
| Raw Digestate | Solid Fraction of Digestate | Liquid Fraction of Digestate | |||||||||||||||||||
|---|---|---|---|---|---|---|---|---|---|---|---|---|---|---|---|---|---|---|---|---|---|
| Plant | TS (g/kg) | VS (g/kg) | MS (g/kg) | VS/TS (%) | TS (g/kg) | VS (g/kg) | MS (g/kg) | VS/TS (%) | TS (g/kg) | VS (g/kg) | MS (g/kg) | VS/TS (%) | pH | Alkalinity (gCaCO3/L) | Turbidity (NTU) | CST CST10g TS/kg) (s) | 0.375–50 µm | 50–100 µm | 100–500 µm | 500–1000 µm | 1000–2000 µm |
| A | 70.9 | 43.0 | 27.9 | 61% | 234.8 | 208.0 | 26.8 | 89% | 56.8 | 31.8 | 25.0 | 56% | 8.22 | 24.8 | 43,300 | 242.3 | 72% | 18% | 10% | 0% | 0% |
| B | 107.5 | 74.1 | 33.4 | 69% | 229.2 | 182.6 | 46.6 | 80% | 80.9 | 52.3 | 28.6 | 65% | 7.88 | 17.1 | 51,400 | 454.6 | 50% | 12% | 32% | 6% | 0% |
| C | 14.4 | 5.4 | 9.0 | 37% | 173.2 | 161.1 | 12.2 | 93% | 13.7 | 4.7 | 9.0 | 35% | 8.14 | 7.4 | 6160 | 58.9 | 89% | 2% | 8% | 0% | 0% |
| E | 55.9 | 27.3 | 28.5 | 49% | 238.9 | 117.3 | 121.5 | 49% | 16.7 | 7.5 | 9.2 | 45% | 8.42 | 21.5 | 3780 | 46.9 | 35% | 26% | 39% | 0% | 0% |
| F | 104.8 | 64.4 | 40.4 | 61% | 309.9 | 243.3 | 66.6 | 79% | 82.7 | 44.5 | 38.1 | 54% | 8.30 | 23.6 | 49,400 | 319.2 | 53% | 14% | 29% | 3% | 0% |
| H | 54.6 | 36.2 | 18.5 | 66% | 179.5 | 119.1 | 60.5 | 66% | 10.3 | 6.0 | 4.3 | 58% | 8.25 | 14.1 | 2960 | 34.0 | 54% | 32% | 14% | 0% | 0% |
| I | 227.2 | 115.4 | 111.8 | 51% | 416.2 | 198.9 | 217.2 | 48% | 37.9 | 22.6 | 15.3 | 60% | 8.08 | 13.8 | 12,840 | 16.3 | 27% | 19% | 45% | 5% | 4% |
| J | 94.4 | 74.0 | 20.4 | 78% | 296.2 | 239.8 | 56.4 | 81% | 32.1 | 20.9 | 11.3 | 65% | 8.19 | 13.2 | 7590 | 16.7 | 40% | 17% | 43% | 0% | 0% |
| K | 63.7 | 40.9 | 22.8 | 64% | 264.8 | 218.5 | 46.3 | 83% | 60.5 | 38.0 | 22.4 | 63% | 7.61 | 14.0 | 41,800 | 225.4 | 70% | 13% | 13% | 4% | 0% |
| L | 44.4 | 28.3 | 16.1 | 64% | 323.9 | 272.4 | 51.5 | 84% | 40.6 | 24.5 | 16.1 | 60% | 8.25 | 22.6 | 29,640 | 319.3 | 39% | 9% | 32% | 19% | 2% |
| M | 44.4 | 34.4 | 10.0 | 77% | 99.2 | 87.6 | 11.5 | 88% | 38.4 | 28.7 | 9.7 | 75% | 8.15 | 9.0 | 38,160 | 416.2 | 53% | 13% | 21% | 8% | 4% |
| G | 30.5 | 17.6 | 12.8 | 58% | 276.0 | 156.6 | 119.3 | 57% | 2.1 | 1.2 | 1.0 | 0.55 | 7.95 | 3.7 | 947 | 12.1 | 59% | 16% | 20% | 5% | 0% |
| N | 93.2 | 62.3 | 30.9 | 67% | 218.2 | 189.0 | 29.2 | 87% | 76.7 | 46.0 | 30.7 | 60% | 8.12 | 24.0 | 67,067 | 314.9 | 76% | 9% | 15% | 0% | 0% |
| O | 33.8 | 21.0 | 12.8 | 62% | 276.7 | 164.9 | 111.8 | 60% | 13.1 | 7.1 | 6.0 | 54% | 8.39 | 10.3 | 6835 | 70.8 | 93% | 7% | 0% | 0% | 0% |
| P | 68.0 | 39.1 | 28.8 | 58% | 202.4 | 163.0 | 39.4 | 81% | 61.6 | 34.6 | 27.0 | 56% | 7.7 | 10.0 | 33,552 | 271.8 | 56% | 12% | 24% | 8% | 0% |
| Q | 71.2 | 43.1 | 28.1 | 61% | 267.3 | 202.5 | 64.8 | 76% | 72.6 | 48.1 | 24.4 | 66% | 7.93 | 23.3 | 48,940 | 198.1 | 41% | 9% | 33% | 16% | 1% |
| R | 47.4 | 33.4 | 14.0 | 70% | 247.1 | 151.2 | 95.9 | 61% | 26.7 | 18.6 | 8.0 | 70% | 7.82 | 16.3 | 20,712 | 424.7 | 87% | 5% | 8% | 0% | 0% |
| S | 48.4 | 31.4 | 16.9 | 65% | 187.6 | 114.5 | 73.1 | 61% | 6.7 | 3.0 | 3.7 | 45% | 8.08 | 13.8 | 1409 | 15.0 | 77% | 15% | 8% | 0% | 0% |
| T | 71.6 | 42.1 | 29.5 | 59% | 893.9 | 537.5 | 356.4 | 60% | 46.9 | 27.3 | 19.5 | 58% | 8.49 | 31.4 | 25,160 | 402.7 | 67% | 13% | 20% | 0% | 0% |
| U | 78.0 | 42.0 | 36.0 | 54% | 243.7 | 173.4 | 70.3 | 71% | 66.2 | 41.7 | 24.5 | 63% | 8.04 | 23.4 | 42,030 | 395.3 | 79% | 11% | 10% | 0% | 0% |
| V | 73.8 | 44.8 | 28.9 | 61% | 179.9 | 124.7 | 55.2 | 69% | 54.3 | 32.1 | 22.3 | 59% | 7.92 | 27.6 | 36,260 | 448.7 | 56% | 13% | 30% | 2% | 0% |
| W | 81.8 | 57.7 | 24.1 | 71% | 244.4 | 209.0 | 35.5 | 85% | 56.5 | 41.1 | 15.4 | 73% | 8.2 | 20.2 | 30,015 | 820.0 | 58% | 13% | 29% | 0% | 0% |
| X | 94.7 | 58.6 | 36.1 | 62% | 208.8 | 166.4 | 42.4 | 80% | 85.5 | 51.3 | 34.2 | 60% | 8.32 | 29.1 | 60,800 | 665.4 | 55% | 13% | 31% | 1% | 0% |
| Y | 52.7 | 33.7 | 19.0 | 64% | 374.0 | 267.4 | 106.6 | 71% | 44.6 | 26.2 | 18.3 | 59% | 8.51 | 26.0 | 27,000 | 714.6 | 58% | 13% | 25% | 4% | 0% |
| Z | 117.9 | 78.7 | 39.2 | 67% | 246.2 | 204.9 | 41.3 | 83% | 67.3 | 41.2 | 26.1 | 61% | 7.99 | 29.0 | 42,420 | 404.7 | 45% | 12% | 34% | 8% | 1% |
| I2 | 282.8 | 97.9 | 185.0 | 35% | 439.7 | 166.8 | 272.9 | 38% | 37.2 | 20.7 | 16.5 | 56% | 8.24 | 12.7 | 10,100 | 17.5 | 20% | 13% | 43% | 14% | 11% |
| AA | 61.5 | 39.9 | 21.6 | 65% | 314.2 | 256.3 | 57.9 | 82% | 34.5 | 22.1 | 12.4 | 64% | 8.28 | 18.1 | 20,027 | 250.7 | 82% | 6% | 12% | 0% | 0% |
| AB | 67.4 | 36.6 | 30.9 | 54% | 296.7 | 202.6 | 94.1 | 68% | 46.3 | 23.4 | 22.8 | 51% | 7.89 | 20.4 | 23,093 | 192.6 | 65% | 7% | 22% | 6% | 0% |
| AC | 31.7 | 19.7 | 12.0 | 62% | 315.4 | 212.9 | 102.6 | 67% | 16.1 | 8.7 | 7.4 | 54% | 8.02 | 12.0 | 10,367 | 98.1 | 85% | 8% | 7% | 0% | 0% |
| AD | 18.9 | 8.7 | 10.2 | 46% | 879.6 | 425.9 | 453.7 | 48% | 7.8 | 2.9 | 4.9 | 37% | 9.09 | 2.3 | 12 | 5.8 | 19% | 41% | 40% | 0% | 0% |
| Plant | Mean (µm) | Median (µm) | IC (g/L) | TOCd (g/L) | TCd (g/L) | CODt (g/L) | CODs (g/L) | CODc (g/L) | CODd (g/L) | CODd/TOCd | TKNt (g/L) | TKNs (g/L) | TKNc (g/L) | TKNd (g/L) | Norgd (g/L) | NH4+ (g/L) | Cd/Nd | Na+ (g/L) | K+ (g/L) | Cl− (g/L) | PO43− (g/L) | SO42− (g/L) | CONDd (mS/cm) |
|---|---|---|---|---|---|---|---|---|---|---|---|---|---|---|---|---|---|---|---|---|---|---|---|
| A | 48.2 | 30.0 | 2.3 | 0.5 | 2.8 | 47.3 | 44.5 | 1.3 | 1.5 | 3.2 | 6.5 | 3.1 | 0.7 | 2.7 | 0.1 | 2.6 | 1.1 | 0.5 | 1.8 | 0.9 | 0.1 | 0.7 | 25.8 |
| B | 137.6 | 53.0 | 2.7 | 1.5 | 4.2 | 78.0 | 67.3 | 6.4 | 4.3 | 2.8 | 4.7 | 2.6 | 0.4 | 1.7 | 0.3 | 1.3 | 2.5 | 0.5 | 4.7 | 1.3 | 0.9 | 0.1 | 28.6 |
| C | 30.6 | 14.0 | 1.3 | 0.8 | 2.1 | 9.2 | 8.5 | 0.2 | 0.5 | 0.6 | 1.5 | 0.7 | 0.1 | 0.7 | 0.2 | 0.6 | 2.8 | 0.1 | 3.2 | 1.1 | 0.0 | 0.1 | 14.3 |
| E | 76.0 | 89.0 | 3.2 | 3.2 | 6.3 | 12.1 | 8.1 | 1.7 | 2.2 | 0.7 | 5.1 | 1.6 | 0.5 | 3.0 | 1.0 | 2.1 | 2.1 | 3.0 | 2.0 | 1.0 | 2.1 | 0.1 | 30.6 |
| F | 105.2 | 44.0 | 3.6 | 2.7 | 6.2 | 70.3 | 57.2 | 4.5 | 8.6 | 3.2 | 5.8 | 2.7 | 0.4 | 2.7 | 0.3 | 2.3 | 2.3 | 1.1 | 4.7 | 1.8 | 0.8 | 0.0 | 38.0 |
| H | 60.8 | 49.0 | 2.4 | 1.2 | 3.6 | 9.8 | 7.2 | 1.3 | 1.4 | 1.1 | 4.3 | 0.5 | 0.4 | 3.4 | 0.3 | 3.1 | 1.1 | 0.4 | 1.0 | 1.6 | 0.1 | 0.0 | 27.4 |
| I | 208.0 | 112.0 | 2.3 | 1.5 | 3.7 | 39.5 | 28.1 | 7.1 | 4.4 | 3.0 | 4.4 | 1.7 | 0.6 | 2.1 | 0.3 | 1.8 | 1.8 | 1.3 | 2.5 | 2.3 | 0.2 | 0.1 | 30.0 |
| J | 120.8 | 80.0 | 2.4 | 1.7 | 4.1 | 36.6 | 21.4 | 9.9 | 5.2 | 3.0 | 4.6 | 1.5 | 0.9 | 2.1 | 0.3 | 1.8 | 1.9 | 0.1 | 5.5 | 3.8 | 0.1 | 0.1 | 35.3 |
| K | 82.4 | 30.0 | 1.6 | 0.5 | 2.0 | 61.7 | 59.4 | 1.3 | 1.0 | 2.1 | 4.6 | 2.7 | 0.6 | 1.3 | 0.3 | 1.1 | 1.5 | 0.4 | 1.3 | 0.5 | 0.6 | 0.1 | 16.3 |
| L | 257.2 | 116.0 | 2.9 | 1.1 | 4.0 | 22.2 | 16.3 | 2.7 | 3.2 | 2.9 | 5.2 | 3.0 | 0.4 | 1.8 | 0.4 | 1.4 | 2.3 | 1.0 | 4.3 | 1.8 | 0.8 | 0.7 | 32.8 |
| M | 179.4 | 46.0 | 1.7 | 1.2 | 2.9 | 52.1 | 47.2 | 1.6 | 3.4 | 2.8 | 2.9 | 1.9 | 0.3 | 0.8 | 0.3 | 0.5 | 3.8 | 0.6 | 3.9 | 1.4 | 0.6 | 0.1 | 16.0 |
| G | 100.7 | 40.0 | 0.5 | 0.3 | 0.8 | 1.7 | 1.4 | 0.1 | 0.2 | 0.8 | 1.1 | 0.2 | 0.2 | 0.7 | 0.1 | 0.6 | 1.2 | 0.1 | 0.1 | 0.1 | 0.0 | 0.0 | 4.9 |
| N | 53.3 | 21.3 | 2.7 | 0.9 | 3.6 | 88.3 | 82.7 | 3.0 | 2.6 | 2.7 | 6.3 | 3.2 | 0.3 | 2.8 | 0.6 | 2.2 | 1.3 | 0.4 | 3.5 | 1.0 | 0.4 | 0.9 | 33.4 |
| O | 26.2 | 23.7 | 1.6 | 1.0 | 2.6 | 12.7 | 10.5 | 0.6 | 1.6 | 1.6 | 2.7 | 0.7 | 0.1 | 1.8 | 0.6 | 1.2 | 1.4 | 0.8 | 1.6 | 1.0 | 0.1 | 0.3 | 20.0 |
| P | 125.2 | 42.4 | 1.3 | 0.6 | 1.9 | 63.1 | 60.5 | 0.6 | 2.1 | 3.3 | 3.0 | 2.0 | 0.4 | 0.6 | 0.2 | 0.5 | 3.0 | 0.7 | 2.5 | 0.9 | 0.8 | 0.1 | 15.9 |
| Q | 240.5 | 103.4 | 2.1 | 0.9 | 3.0 | 56.7 | 51.9 | 2.3 | 2.5 | 2.7 | 3.8 | 2.0 | 0.2 | 1.6 | - | 1.7 | 1.8 | 0.6 | 3.6 | 1.2 | 0.5 | 0.2 | 24.9 |
| R | 30.7 | 20.5 | 1.7 | 0.9 | 2.5 | 32.2 | 28.0 | 1.5 | 2.6 | 3.0 | 3.2 | 1.3 | 0.1 | 1.8 | 0.2 | 1.6 | 1.4 | 0.3 | 2.8 | 1.0 | 0.5 | 0.0 | 20.5 |
| S | 38.0 | 26.9 | 1.8 | 0.4 | 2.1 | 4.4 | 2.6 | 0.7 | 1.0 | 2.9 | 3.9 | 0.8 | 0.2 | 2.9 | 0.7 | 2.2 | 0.7 | 0.5 | 1.4 | 1.9 | 0.1 | 0.0 | 21.7 |
| T | 62.0 | 30.1 | 3.7 | 1.6 | 5.3 | 48.1 | 41.9 | 3.3 | 2.9 | 1.8 | 8.3 | 2.8 | 0.2 | 5.2 | 0.6 | 4.7 | 1.0 | 1.4 | 3.3 | 2.9 | 0.4 | 0.0 | 46.3 |
| U | 35.1 | 14.8 | 3.7 | 1.3 | 5.0 | 67.9 | 56.5 | 5.5 | 5.9 | 4.4 | 5.7 | 2.2 | 0.3 | 3.3 | 0.6 | 2.7 | 1.5 | 0.3 | 6.7 | 1.7 | 1.0 | 0.2 | 39.0 |
| V | 105.1 | 38.1 | 2.5 | 0.9 | 3.4 | 54.7 | 48.0 | 3.4 | 3.3 | 3.8 | 4.3 | 2.0 | 0.2 | 2.1 | 0.4 | 1.8 | 1.6 | 0.2 | 5.4 | 1.5 | 0.9 | 0.2 | 28.9 |
| W | 82.8 | 36.5 | 3.7 | 1.1 | 4.8 | 70.2 | 59.4 | 4.4 | 6.4 | 5.6 | 5.7 | 2.4 | 0.4 | 2.9 | - | 3.0 | 1.7 | 0.1 | 5.0 | 1.0 | 0.4 | 0.3 | 36.0 |
| X | 98.4 | 43.2 | 4.4 | 1.4 | 5.8 | 90.1 | 73.1 | 8.8 | 8.2 | 5.9 | 7.6 | 4.0 | 0.5 | 3.1 | - | 3.2 | 1.9 | 0.2 | 7.1 | 1.0 | 0.8 | 0.2 | 40.8 |
| Y | 103.7 | 36.2 | 3.2 | 0.8 | 4.0 | 41.3 | 36.0 | 3.0 | 2.4 | 2.8 | 7.7 | 3.0 | 0.5 | 4.2 | 1.1 | 3.1 | 1.0 | 2.4 | 2.8 | 3.8 | 0.5 | 0.3 | 43.0 |
| Z | 174.2 | 69.4 | 2.9 | 1.3 | 4.2 | 66.7 | 58.1 | 4.9 | 3.7 | 2.8 | 5.2 | 2.1 | 0.4 | 2.7 | 0.5 | 2.2 | 1.5 | 0.5 | 5.2 | 1.5 | 0.6 | 0.08 | 33.3 |
| I2 | 388.1 | 199.1 | 2.0 | 1.5 | 3.5 | 28.9 | 20.3 | 3.9 | 4.7 | 3.0 | 3.6 | 1.4 | 0.3 | 1.9 | 0.3 | 1.6 | 1.8 | 1.2 | 3.6 | 2.3 | 0.2 | 0.1 | 27.5 |
| AA | 30.2 | 7.6 | 2.8 | 1.2 | 4.0 | 40.1 | 32.4 | 4.3 | 3.3 | 2.7 | 5.0 | 1.5 | 0.3 | 3.1 | 1.1 | 2.0 | 1.3 | 0.7 | 4.3 | 2.1 | 0.4 | 0.1 | 33.9 |
| AB | 113.7 | 27.6 | 2.9 | 0.8 | 3.6 | 33.7 | 29.9 | 1.4 | 2.4 | 3.1 | 4.8 | 2.2 | 0.1 | 2.5 | 0.5 | 2.0 | 1.5 | 3.3 | 3.9 | 3.8 | 0.6 | 0.0 | 38.9 |
| AC | 23.9 | 7.3 | 1.7 | 1.0 | 2.7 | 15.4 | 12.5 | 1.2 | 1.6 | 1.7 | 2.8 | 0.9 | 0.0 | 1.9 | 0.3 | 1.5 | 1.5 | 0.8 | 2.5 | 1.3 | 0.1 | 0.1 | 21.1 |
| AD | 91.4 | 97.0 | 0.5 | 0.1 | 0.6 | 0.8 | 0.0 | 0.0 | 0.8 | - | 1.3 | 0.0 | 0.1 | 1.3 | 0.3 | 1.0 | 0.5 | 1.3 | 0.5 | 4.4 | 0.0 | 0.0 | 17.4 |
| Plant | SUVA254 | BOD5 (g/L) | BOD21 (g/L) | BOD5/ COD | BOD21/ COD | Protein-Like | Fulvic Acid-Like | Glycolated Protein-Like | Melanoidin-Like | Humic Acid-Like |
|---|---|---|---|---|---|---|---|---|---|---|
| A | 1.6 | 7.4 | 23.2 | 0.2 | 0.5 | 47% | 33% | 12% | 7% | 1% |
| B | 2.6 | 5.6 | 12.9 | 0.1 | 0.2 | 37% | 36% | 15% | 10% | 2% |
| C | 0.2 | 1.7 | 3.1 | 0.2 | 0.3 | 52% | 27% | 12% | 7% | 2% |
| E | 0.0 | 1.9 | 4.3 | 0.2 | 0.4 | 50% | 27% | 13% | 6% | 4% |
| F | 1.6 | 3.7 | 9.8 | 0.1 | 0.1 | 50% | 30% | 12% | 7% | 2% |
| H | 0.4 | 3.7 | 5.3 | 0.4 | 0.5 | 41% | 33% | 15% | 7% | 4% |
| I | 1.9 | 7.3 | 18.1 | 0.2 | 0.5 | 43% | 33% | 14% | 8% | 2% |
| J | 2.6 | 8.6 | 22.5 | 0.2 | 0.6 | 45% | 30% | 14% | 9% | 2% |
| K | 1.9 | 9.4 | 32.2 | 0.2 | 0.5 | 54% | 28% | 11% | 6% | 1% |
| L | 2.4 | 4.8 | 11.1 | 0.2 | 0.5 | 54% | 27% | 11% | 6% | 2% |
| M | 3.0 | 5.0 | 14.3 | 0.1 | 0.3 | 54% | 28% | 11% | 6% | 2% |
| G | 0.5 | 0.4 | 1.0 | 0.2 | 0.6 | 41% | 36% | 14% | 8% | 2% |
| N | 2.7 | 13.9 | 42.6 | 0.2 | 0.5 | 43% | 33% | 14% | 8% | 2% |
| O | 1.6 | 0.3 | 1.3 | 0.0 | 0.1 | 50% | 30% | 12% | 7% | 2% |
| P | 2.9 | 3.7 | 27.8 | 0.1 | 0.4 | 46% | 32% | 12% | 8% | 2% |
| Q | 2.8 | 7.4 | 18.2 | 0.1 | 0.3 | 45% | 34% | 13% | 7% | 1% |
| R | 2.6 | 9.6 | 20.7 | 0.3 | 0.6 | 44% | 36% | 12% | 6% | 1% |
| S | 2.4 | 1.9 | 2.9 | 0.4 | 0.7 | 43% | 37% | 11% | 6% | 2% |
| T | 1.5 | 13.1 | 28.3 | 0.3 | 0.6 | 41% | 38% | 12% | 6% | 3% |
| U | 5.0 | 13.0 | 30.6 | 0.2 | 0.5 | 49% | 29% | 13% | 7% | 2% |
| V | 3.7 | 12.0 | 28.2 | 0.2 | 0.5 | 46% | 31% | 14% | 7% | 2% |
| W | 5.4 | 16.6 | 35.6 | 0.2 | 0.5 | 45% | 31% | 14% | 7% | 3% |
| X | 4.4 | 30.1 | 54.2 | 0.3 | 0.6 | 45% | 29% | 16% | 6% | 4% |
| Y | 2.4 | 16.2 | 26.0 | 0.4 | 0.6 | 34% | 40% | 14% | 8% | 3% |
| Z | 3.0 | 14.5 | 35.0 | 0.2 | 0.5 | 39% | 35% | 16% | 8% | 2% |
| I2 | 2.6 | 9.6 | 17.8 | 0.3 | 0.6 | 45% | 32% | 14% | 7% | 2% |
| AA | 2.6 | 7.2 | 17.6 | 0.2 | 0.4 | 46% | 31% | 12% | 8% | 2% |
| AB | 2.4 | 11.4 | 25.4 | 0.3 | 0.8 | 48% | 29% | 13% | 6% | 3% |
| AC | 1.1 | 3.7 | 8.0 | 0.2 | 0.5 | 45% | 32% | 13% | 8% | 2% |
| AD | 2.2 | 0.1 | 0.4 | 0.1 | 0.4 | 24% | 41% | 21% | 11% | 3% |
References
- European Biogas Association (EBA). Statistical Report of the European Biogas Association 2018; EBA: Brussels, Belgium, 2018. [Google Scholar]
- Akhiar, A.; Ahmad Zamri, M.F.M.; Torrijos, M.; Shamsuddin, A.H.; Battimelli, A.; Roslan, E.; Mohd Marzuki, M.H.; Carrere, H. Anaerobic digestion industries progress throughout the world. IOP Conf. Ser. Earth Environ. Sci. 2020, 476, 012074. [Google Scholar] [CrossRef]
- Battista, F.; Frison, N.; Bolzonella, D. Energy and Nutrients’ Recovery in Anaerobic Digestion of Agricultural Biomass: An Italian Perspective for Future Applications. Energies 2019, 12, 3287. [Google Scholar] [CrossRef]
- Herbes, C.; Dahlin, J.; Kurz, P. Consumer Willingness To Pay for Proenvironmental Attributes of Biogas Digestate-Based Potting Soil. Sustainability 2020, 12, 6405. [Google Scholar] [CrossRef]
- Guilayn, F.; Jimenez, J.; Martel, J.-L.; Rouez, M.; Crest, M.; Patureau, D. First fertilizing-value typology of digestates: A decision-making tool for regulation. Waste Manag. 2019, 86, 67–79. [Google Scholar] [CrossRef] [PubMed]
- Szymańska, M.; Szara, E.; Sosulski, T.; Wąs, A.; Van Pruissen, G.W.P.; Cornelissen, R.L.; Borowik, M.; Konkol, M. A Bio-Refinery Concept for N and P Recovery—A Chance for Biogas Plant Development. Energies 2019, 12, 155. [Google Scholar] [CrossRef]
- Maurer, C.; Seiler-Petzold, J.; Schulz, R.; Müller, J. Short-Term Nitrogen Uptake of Barley from Differently Processed Biogas Digestate in Pot Experiments. Energies 2019, 12, 696. [Google Scholar] [CrossRef]
- Guilayn, F.; Jimenez, J.; Rouez, M.; Crest, M.; Patureau, D. Digestate mechanical separation: Efficiency profiles based on anaerobic digestion feedstock and equipment choice. Bioresour. Technol. 2019, 274, 180–189. [Google Scholar] [CrossRef]
- Drosg, B.; Fuchs, W.; Al Seadi, T.; Madsen, M.; Linke, B. Nutrient Recovery by Biogas Digestate Processing; 2015. Available online: http://task37.ieabioenergy.com/files/daten-redaktion/download/Technical%20Brochures/NUTRIENT_RECOVERY_RZ_web1.pdf (accessed on 23 November 2020).
- Bauer, A.; Mayr, H.; Hopfner-Sixt, K.; Amon, T. Detailed monitoring of two biogas plants and mechanical solid–liquid separation of fermentation residues. J. Biotechnol. 2009, 142, 56–63. [Google Scholar] [CrossRef]
- Rehl, T.; Müller, J. Life cycle assessment of biogas digestate processing technologies. Resour. Conserv. Recycl. 2011, 56, 92–104. [Google Scholar] [CrossRef]
- Tambone, F.; Orzi, V.; D’Imporzano, G.; Adani, F. Solid and liquid fractionation of digestate: Mass balance, chemical characterization, and agronomic and environmental value. Bioresour. Technol. 2017, 243, 1251–1256. [Google Scholar] [CrossRef]
- Akhiar, A.; Torrijos, M.; Battimelli, A.; Carrère, H. Comprehensive characterization of the liquid fraction of digestates from full-scale anaerobic co-digestion. Waste Manag. 2017, 59, 118–128. [Google Scholar] [CrossRef] [PubMed]
- Xia, A.; Murphy, J.D. Microalgal Cultivation in Treating Liquid Digestate from Biogas Systems. Trends Biotechnol. 2016, 34, 264–275. [Google Scholar] [CrossRef] [PubMed]
- Baldi, M.; Collivignarelli, M.; Abbà, A.; Benigna, I. The Valorization of Ammonia in Manure Digestate by Means of Alternative Stripping Reactors. Sustainability 2018, 10, 3073. [Google Scholar] [CrossRef]
- Valentinuzzi, F.; Cavani, L.; Porfido, C.; Terzano, R.; Pii, Y.; Cesco, S.; Marzadori, C.; Mimmo, T. The fertilising potential of manure-based biogas fermentation residues: Pelleted vs. liquid digestate. Heliyon 2020, 6, e03325. [Google Scholar] [CrossRef]
- Guilayn, F.; Rouez, M.; Crest, M.; Patureau, D.; Jimenez, J. Valorization of digestates from urban or centralized biogas plants: A critical review. Rev. Environ. Sci. Biotechnol. 2020, 19, 419–462. [Google Scholar] [CrossRef]
- Tao, W.; Fattah, K.P.; Huchzermeier, M.P. Struvite recovery from anaerobically digested dairy manure: A review of application potential and hindrances. J. Environ. Manag. 2016, 169, 46–57. [Google Scholar] [CrossRef]
- Szymańska, M.; Sosulski, T.; Szara, E.; Wąs, A.; Sulewski, P.; van Pruissen, G.W.P.; Cornelissen, R.L. Ammonium Sulphate from a Bio-Refinery System as a Fertilizer—Agronomic and Economic Effectiveness on the Farm Scale. Energies 2019, 12, 4721. [Google Scholar] [CrossRef]
- Folino, A.; Zema, D.A.; Calabrò, P.S. Environmental and Economic Sustainability of Swine Wastewater Treatments Using Ammonia Stripping and Anaerobic Digestion: A Short Review. Sustainability 2020, 12, 4971. [Google Scholar] [CrossRef]
- Szymańska, M.; Szara, E.; Wąs, A.; Sosulski, T.; van Pruissen, G.; Cornelissen, R. Struvite—An Innovative Fertilizer from Anaerobic Digestate Produced in a Bio-Refinery. Energies 2019, 12, 296. [Google Scholar] [CrossRef]
- Gienau, T.; Ehrmanntraut, A.; Kraume, M.; Rosenberger, S. Influence of Ozone Treatment on Ultrafiltration Performance and Nutrient Flow in a Membrane Based Nutrient Recovery Process from Anaerobic Digestate. Membranes 2020, 10, 64. [Google Scholar] [CrossRef]
- Świątczak, P.; Cydzik-Kwiatkowska, A.; Zielińska, M. Treatment of Liquid Phase of Digestate from Agricultural Biogas Plant in a System with Aerobic Granules and Ultrafiltration. Water 2019, 11, 104. [Google Scholar] [CrossRef]
- Myllymäki, P.; Pesonen, J.; Romar, H.; Hu, T.; Tynjälä, P.; Lassi, U. The Use of Ca- and Mg-Rich Fly Ash as a Chemical Precipitant in the Simultaneous Removal of Nitrogen and Phosphorus—Recycling and Reuse. Recycling 2019, 4, 14. [Google Scholar] [CrossRef]
- Krzemińska, I.; Oleszek, M.; Wiącek, D. Liquid Anaerobic Digestate as a Source of Nutrients for Lipid and Fatty Acid Accumulation by Auxenochlorella Protothecoides. Molecules 2019, 24, 3582. [Google Scholar] [CrossRef] [PubMed]
- Kisielewska, M.; Zieliński, M.; Dębowski, M.; Kazimierowicz, J.; Romanowska-Duda, Z.; Dudek, M. Effectiveness of Scenedesmus sp. Biomass Grow and Nutrients Removal from Liquid Phase of Digestates. Energies 2020, 13, 1432. [Google Scholar] [CrossRef]
- Jimenez, R.; Markou, G.; Tayibi, S.; Barakat, A.; Chapsal, C.; Monlau, F. Production of Microalgal Slow-Release Fertilizer by Valorizing Liquid Agricultural Digestate: Growth Experiments with Tomatoes. Appl. Sci. 2020, 10, 3890. [Google Scholar] [CrossRef]
- Akhiar, A.; Zamri, M.F.M.A.; Torrijos, M.; Battimelli, A.; Roslan, E.; Hanif, M.; Shamsuddin, A.H.; Carrere, H. Current Technology on Nutrients Removal, Recovery and Reuse from Liquid Fraction of Digestate. TEST Eng. Manag. 2019, 81, 5861–5868. [Google Scholar]
- Theuerl, S.; Herrmann, C.; Heiermann, M.; Grundmann, P.; Landwehr, N.; Kreidenweis, U.; Prochnow, A. The Future Agricultural Biogas Plant in Germany: A Vision. Energies 2019, 12, 396. [Google Scholar] [CrossRef]
- Piwowar, A. Agricultural Biogas—An Important Element in the Circular and Low-Carbon Development in Poland. Energies 2020, 13, 1733. [Google Scholar] [CrossRef]
- Barros, M.V.; Salvador, R.; de Francisco, A.C.; Piekarski, C.M. Mapping of research lines on circular economy practices in agriculture: From waste to energy. Renew. Sustain. Energy Rev. 2020, 131, 109958. [Google Scholar] [CrossRef]
- Molina-Moreno, V.; Leyva-Díaz, J.; Llorens-Montes, F.; Cortés-García, F. Design of Indicators of Circular Economy as Instruments for the Evaluation of Sustainability and Efficiency in Wastewater from Pig Farming Industry. Water 2017, 9, 653. [Google Scholar] [CrossRef]
- Muradin, M.; Joachimiak-Lechman, K.; Foltynowicz, Z. Evaluation of Eco-Efficiency of Two Alternative Agricultural Biogas Plants. Appl. Sci. 2018, 8, 2083. [Google Scholar] [CrossRef]
- Vilardi, G.; Bassano, C.; Deiana, P.; Verdone, N. Exergy and energy analysis of three biogas upgrading processes. Energy Convers. Manag. 2020, 224, 113323. [Google Scholar] [CrossRef]
- Ziyang, L.; Youcai, Z. Size-fractionation and characterization of refuse landfill leachate by sequential filtration using membranes with varied porosity. J. Hazard. Mater. 2007, 147, 257–264. [Google Scholar] [CrossRef]
- American Public Health Association. Standard Methods for the Examination of Water and Wastewater, 22nd ed.; Rice, E.W., Baird, R.B., Eaton, A.D., Clesceri, L.S., Eds.; American Public Health Association: Washington, DC, USA, 2012. [Google Scholar]
- Battimelli, A.; Loisel, D.; Garcia-Bernet, D.; Carrere, H.; Delgenes, J.-P. Combined ozone pretreatment and biological processes for removal of colored and biorefractory compounds in wastewater from molasses fermentation industries. J. Chem. Technol. Biotechnol. 2010, 85, 968–975. [Google Scholar] [CrossRef]
- Uggetti, E.; Sialve, B.; Latrille, E.; Steyer, J.-P. Anaerobic digestate as substrate for microalgae culture: The role of ammonium concentration on the microalgae productivity. Bioresour. Technol. 2014, 152, 437–443. [Google Scholar] [CrossRef]
- Zheng, W.; Lü, F.; Phoungthong, K.; He, P. Relationship between anaerobic digestion of biodegradable solid waste and spectral characteristics of the derived liquid digestate. Bioresour. Technol. 2014, 161, 69–77. [Google Scholar] [CrossRef] [PubMed]
- Jimenez, J.; Gonidec, E.; Cacho Rivero, J.A.; Latrille, E.; Vedrenne, F.; Steyer, J.-P. Prediction of anaerobic biodegradability and bioaccessibility of municipal sludge by coupling sequential extractions with fluorescence spectroscopy: Towards ADM1 variables characterization. Water Res. 2014, 50, 359–372. [Google Scholar] [CrossRef] [PubMed]
- Ganesh, R.; Torrijos, M.; Sousbie, P.; Steyer, J.P.; Lugardon, A.; Delgenes, J.P. Anaerobic co-digestion of solid waste: Effect of increasing organic loading rates and characterization of the solubilised organic matter. Bioresour. Technol. 2013, 130, 559–569. [Google Scholar] [CrossRef]
- WTW GmbH. Supervision of BOD Measuring Systems According to DIN/ISO 9000 and GLP; WTW: Weilheim, Germany, 2010. [Google Scholar]
- WTW GmbH. System OxiTop® Control: Operating Manual; WTW: Weilheim, Germany, 2004. [Google Scholar]
- Hjorth, M.; Christensen, K.V.; Christensen, M.L.; Sommer, S.G. Solid–liquid separation of animal slurry in theory and practice. A review. Agron. Sustain. Dev. 2010, 30, 153–180. [Google Scholar] [CrossRef]
- R Core Team. R: A Language and Environment for Statistical Computing; R Foundation for Statistical Computing: Vienna, Austria, 2014. [Google Scholar]
- Husson, F.; Le, S.; Pages, J. Exploratory Multivariate Analysis by Example Using R. J. Stat. Softw. 2011, 40. [Google Scholar]
- Ward, J.H. Hierarchical grouping to optimize an objective function. J. Am. Stat. Assoc. 1963, 58, 236–244. [Google Scholar] [CrossRef]
- Oliveira, I.; Reed, J.P.; Abu-Orf, M.; Wilson, V.; Jones, D.; Esteves, S.R. The potential use of shear viscosity to monitor polymer conditioning of sewage sludge digestates. Water Res. 2016, 105, 320–330. [Google Scholar] [CrossRef]
- Banks, C.J.; Chesshire, M.; Heaven, S.; Arnold, R. Anaerobic digestion of source-segregated domestic food waste: Performance assessment by mass and energy balance. Bioresour. Technol. 2011, 102, 612–620. [Google Scholar] [CrossRef] [PubMed]
- Zirkler, D.; Peters, A.; Kaupenjohann, M. Elemental composition of biogas residues: Variability and alteration during anaerobic digestion. Biomass Bioenergy 2014, 67, 89–98. [Google Scholar] [CrossRef]
- Sibil, R.; Berkun, M.; Bekiroglu, S. The comparison of different mathematical methods to determine the BOD parameters, a new developed method and impacts of these parameters variations on the design of WWTPs. Appl. Math. Model. 2014, 38, 641–658. [Google Scholar] [CrossRef]
- Herrmann, C.; Idler, C.; Heiermann, M. Biogas crops grown in energy crop rotations: Linking chemical composition and methane production characteristics. Bioresour. Technol. 2016, 206, 23–35. [Google Scholar] [CrossRef] [PubMed]
- Dandikas, V.; Heuwinkel, H.; Lichti, F.; Drewes, J.E.; Koch, K. Correlation between biogas yield and chemical composition of energy crops. Bioresour. Technol. 2014, 174, 316–320. [Google Scholar] [CrossRef] [PubMed]
- Møller, H.B. Separation efficiency and particle size distribution in relation to manure type and storage conditions. Bioresour. Technol. 2002, 85, 189–196. [Google Scholar] [CrossRef]
- Ganesh, R.; Torrijos, M.; Sousbie, P.; Lugardon, A.; Steyer, J.P.; Delgenes, J.P. Effect of increasing proportions of lignocellulosic cosubstrate on the single-phase and two-phase digestion of readily biodegradable substrate. Biomass Bioenergy 2015, 80, 243–251. [Google Scholar] [CrossRef]
- Yang, X.; Shang, C.; Lee, W.; Westerhoff, P.; Fan, C. Correlations between organic matter properties and DBP formation during chloramination. Water Res. 2008, 42, 2329–2339. [Google Scholar] [CrossRef] [PubMed]
- Bieroza, M.Z.; Bridgeman, J.; Baker, A. Fluorescence spectroscopy as a tool for determination of organic matter removal efficiency at water treatment works. Drink. Water Eng. Sci. 2010, 3, 63–70. [Google Scholar] [CrossRef]


| Plants | Substrates Composition (% of Each Category Presented in Table A1) | Temperature Range | Type of Reactor | Reactor Volume (m3) | Post Reactor Volume (m3) | Feeding (Tonnes/d) | Retention Time (Days) | Methane Production (m3/d) | Solid–Liquid Separation | |||||||
|---|---|---|---|---|---|---|---|---|---|---|---|---|---|---|---|---|
| SS | Mnr | EnCr | CrR | Cer | FOG | AFW | Other | |||||||||
| A * | 36 | 16 | 7 | 22 | 19 | M | CSTR | 2800 | n.a | 120 | n.a | n.a | Screw press | |||
| B * | 81.6 | 10.2 | 8.2 | M | CSTR | 1370 | n.a | 15 | 60 | 1550 | Screw press | |||||
| C * | 100 | M | CSTR | 450 | 450 | 16.6 | 24 | 558 | Vibrating screen | |||||||
| E * | 40 | 30 | 30 | M | CSTR | 3300 | 1800 | 90 | 37 | 4500 | Centrifuge | |||||
| F * | 59.7 | 18.5 | 10.9 | 10.9 | M | CSTR | 1206 | n.a | 15 | 63 | 1230 | Screw press | ||||
| H * | 50 | 28 | 22 | M | CSTR | 930 | n.a | 30 | 31 | 1550 | Centrifuge | |||||
| I * | 100 | T | PF | 3150 | n.a | 100 | 30 | 10,000 | Screw press with coagulant + centrifuge | |||||||
| J * | 5 | 95 | T | PF | 1200 | n.a | 35 | 35 | 3500 | Screw press with coagulant | ||||||
| K * | 38.5 | 20 | 12.5 | 25 | 3.5 | 0.5 | M | CSTR | 2800 | 1360 | 80 | 30–35 | n.a | Screw press | ||
| L * | 5 | 64 | 5 | 5 | 9 | 11 | 1 | M | CSTR | 2350 | n.a | 55 | 46 | 1450 | Screw press | |
| M * | 50 | 50 | M | CSTR | 400 | 400 | 10 | 80 | 550 | Vibrating screen | ||||||
| N | 44.2 | 30.8 | 4.4 | 1.9 | 12.8 | 6 | M | CSTR | 1500 | 650 | 15.8 | 95 + 41 | 691 | Screw press | ||
| O | 75 | 8 | 17 | M | CSTR | 2 × 7500 | 2 × 3500 | 290 | 52 | 17,085 | Centrifuge with flocculant | |||||
| P | 5 | 75 | 10 | 5 | 5 | M | CSTR | 1000 | 1000 | 30.5 | 65 | n.a | Screw press | |||
| Q | 76.5 | 16.6 | 0.85 | 0.85 | 5.2 | M | CSTR | 3900 | 3900 | 30 | n.a | 3915 | Screw press | |||
| R | 53.6 | 10.7 | 10.7 | 10.7 | 14.3 | M | CSTR | 2300 | n.a | 28 | 85 | 1450 | Centrifuge | |||
| S | 50 | 28 | 22 | M | CSTR | 920 | 640 | 30–35 | 26 + 18 | n.a | Centrifuge | |||||
| T | 48 | 12 | 40 | M | CSTR | 2600 | n.a | 34.2 | 50 | 2381 | Rotary drum. Solid fraction was dried | |||||
| U | 55.5 | 42.1 | 2.4 | 40–45 | CSTR | 2 × 718.5 | 682 | 2 × 10.6 | (2 × 68) + 32.5 | n.a | Screw press | |||||
| V | 36.2 | 56.9 | 6.9 | T | CSTR | 2 × 1500 | 3000 | 29 | 37 | n.a | Screw press | |||||
| W | 87.5 | 12.5 | T | CSTR | 10,000 | n.a | 70–100 | 100–120 | 6240 | Screw press | ||||||
| X | 100 | 40–41 | CSTR | 2400 | n.a | 27–30 | 70–80 | n.a | Screw press | |||||||
| Y | 4.7 | 25.7 | 69.6 | M | CSTR | 3400 | 1600 | 57 + 35 recirculation | 37 | 12,400 | Screw press | |||||
| Z | 82 | 13 | 5 | M | CSTR | 1200 | 1200 | 31.3 | 66 | 1418 | Screw press | |||||
| I2 | 100 | T | PF | 3150 | n.a | 100–150 | 20–30 | 5500–8500 | Screw press with flocculant + centrifuge | |||||||
| AA | 60.1 | 17.9 | 6.2 | 15.8 | M | CSTR | 1300 | n.a | 65.9 | 45 | 2300 | Screw press | ||||
| AB | 33 | 20 | 20 | 27 | M | CSTR | 2900 | n.a | 50 | 57 | 3090 | Screw press | ||||
| AC | 100 | M | CSTR | 500 | n.a | 7–8 | 40 | n.a | Centrifuge | |||||||
| AD | 48 | 4 | 48 | M | CSTR | 1500 | 3000 | 75 | 20 + 40 | 2790 | Filter press (150 plates) + inorganic coagulant + polymer. Solid fraction was later dried | |||||
| G | 100 | M | CSTR | 10,000 | n.a | 19.1 | 20 | 5583 | Centrifuge with addition of polymer | |||||||
| Parameters | Unit | Strong (Anti-)Correlation | Moderate (Anti-)Correlation | ||
|---|---|---|---|---|---|
| |r| > 0.7 | r | 0.5 < |r| < 0.7 | r | ||
| Sewage Sludge a | w/w | TKN colloids | 0.74 | Alkalinity | 0.5 |
| IC | 0.51 | ||||
| TOC dissolved | 0.54 | ||||
| TKN total | 0.52 | ||||
| NH4+ | 0.52 | ||||
| EnCr a | w/w | VS/TS liquid | 0.51 | ||
| MS/TS liquid | −0.51 | ||||
| SUVA254 | 0.67 | ||||
| Cer a | w/w | CST | 0.67 | ||
| AFW a | w/w | MS/TS raw VS/TS raw | 0.70 −0.70 | VS/TS liquid | −0.52 |
| MS/TS liquid | 0.52 | ||||
| Load | t/day/m3 reactor | AFW | 0.54 | ||
| HRT | Days | SUVA254 | 0.72 | CST | 0.64 |
| TOC dissolved | −0.5 | ||||
| Turbidity | 0.5 | ||||
| C/N | 0.55 | ||||
| Methane production | m3 CH4/ton fed | TKN colloids | 0.67 | ||
| VS/TS raw digestate | w/w | VS/TS liquid | 0.63 | ||
| MS/TS liquid | −0.63 | ||||
| COD total | 0.57 | ||||
| COD suspended | 0.51 | ||||
| MS/TS raw digestate | w/w | VS/TS raw | −1 | VS/TS liquid | −0.63 |
| MS/TS liquid | 0.63 | ||||
| COD total | −0.57 | ||||
| COD suspended | −0.51 | ||||
| VS/TS solid fraction | w/w | MS/TS solids Separ. Efficiency | −0.99 −0.72 | MS/TS raw | −0.53 |
| VS/TS raw | 0.53 | ||||
| COD suspended | 0.51 | ||||
| COD dissolved | −0.51 | ||||
| Turbidity | 0.64 | ||||
| C/N | 0.5 | ||||
| Na+ | −0.60 | ||||
| MS/TS solid fraction | w/w | Separ. Efficiency | 0.74 | MS/TS raw | 0.5 |
| VS/TS raw | −0.5 | ||||
| COD dissolved | 0.52 | ||||
| Turbidity | −0.63 | ||||
| Turbidity | −0.63 | ||||
| Na+ | 0.60 | ||||
| VS/TS liquid fraction | w/w | MS/TS liquid COD total COD suspended | − 10.79 0.74 | CST | 0.57 |
| Turbidity | 0.61 | ||||
| C/N | 0.57 | ||||
| N organic dissolved | −0.51 | ||||
| Na+ | −0.63 | ||||
| Cl− | −0.56 | ||||
| Conductivity | −0.5 | ||||
| SUVA254 | 0.56 | ||||
| MS/TS liquid fraction | w/w | COD total COD suspended | −0.79 −0.74 | CST | −0.57 |
| Turbidity | −0.61 | ||||
| C/N | −0.57 | ||||
| N organic dissolved | 0.51 | ||||
| Na+ | 0.63 | ||||
| Cl− | 0.56 | ||||
| Conductivity | 0.5 | ||||
| SUVA254 | −0.56 | ||||
| Separation efficiency | w/w | COD dissolved Turbidity TKN dissolved Conductivity NH4+ | 0.77 −0.70 0.70 0.72 0.7 | CST | −0.60 |
| Alkalinity | 0.64 | ||||
| IC | 0.68 | ||||
| TOC dissolved | 0.61 | ||||
| C/N | −0.55 | ||||
| TKN total | 0.69 | ||||
| TKN colloids | 0.65 | ||||
| N organic dissolved | 0.57 | ||||
| CST | Seconds | COD suspended | 0.56 | ||
| Turbidity | 0.60 | ||||
| Conductivity | −0.56 | ||||
| SUVA254 | 0.68 | ||||
| pH | - | COD suspended | −0.53 | ||
| C/N | −0.51 | ||||
| Na+ | 0.57 | ||||
| Cl− | 0.63 | ||||
| Glycolated-like | 0.53 | ||||
| Humic acid-like | 0.54 | ||||
| Alkalinity | gCaCO3/gTS | IC | 0.97 | ||
| TOC dissolved | 0.71 | ||||
| C/N | −0.71 | ||||
| TKN total | 0.97 | ||||
| TKN suspended | 0.81 | ||||
| TKN colloids | 0.71 | ||||
| TKN dissolved | 0.94 | ||||
| N organic dissolved | 0.8 | ||||
| NH4+ | 0.93 | ||||
| Conductivity | 0.91 | ||||
| IC | gC/gTS | TOC dissolved | 0.79 | COD dissolved Turbidity SUVA254 | 0.55 −0.5 0.51 |
| C/N | −0.75 | ||||
| TKN total | 0.97 | ||||
| TKN suspended | 0.74 | ||||
| TKN colloids | 0.73 | ||||
| TKN dissolved | 0.95 | ||||
| N organic dissolved | 0.79 | ||||
| NH4+ | 0.94 | ||||
| Conductivity | 0.94 | ||||
| Conductivity | (mS/cm)/(gTS/kg) | SUVA254 | −0.5 | ||
| TOC dissolved | gC/gTS | COD dissolved | 0.52 | ||
| C/N | −0.61 | ||||
| TKN total | 0.67 | ||||
| TKN suspended | 0.62 | ||||
| TKN colloids | 0.66 | ||||
| TKN dissolved | 0.62 | ||||
| N organic dissolved | 0.52 | ||||
| NH4+ | 0.61 | ||||
| PO43- | 0.61 | ||||
| Conductivity | 0.66 | ||||
| SUVA254 | −0.65 | ||||
| COD total | gO2/gTS | COD suspended | 0.93 | Turbidity | 0.57 |
| Na+ | −0.64 | ||||
| Cl− | −0.67 | ||||
| BOD21 | 0.60 | ||||
| COD suspended | gO2/gTS | Turbidity Cl− | 0.76 −0.73 | C/N | 0.52 |
| Na+ | −0.66 | ||||
| Conductivity | −0.57 | ||||
| BOD21 | 0.5 | ||||
| COD colloids | gO2/gTS | COD dissolved | 0.66 | ||
| COD dissolved | gO2/gTS | Turbidity | −0.57 | ||
| C/N | −0.53 | ||||
| TKN total | 0.52 | ||||
| TKN dissolved | 0.53 | ||||
| N organic dissolved | 0.51 | ||||
| NH4+ | 0.5 | ||||
| K+ | 0.51 | ||||
| Conductivity | 0.57 | ||||
| Turbidity | NTU/(gTS/kg) | C/N | 0.57 | ||
| TKN total | −0.5 | ||||
| TKN dissolved | −0.55 | ||||
| N organic dissolved | −0.55 | ||||
| NH4+ | −0.53 | ||||
| Na+ | −0.62 | ||||
| Cl− | −0.69 | ||||
| Conductivity | −0.64 | ||||
| C/N | - | TKN total TKN dissolved NH4+Conductivity | −0.74 −0.73 −0.71 −0.78 | TKN suspended | −0.58 |
| TC/TN dissolved | 0.54 | ||||
| N organic dissolved | −0.67 | ||||
| Na+ | −0.55 | ||||
| SUVA254 | 0.54 | ||||
| TKN suspended | gN/gTS | TKN colloids | 0.52 | ||
| TKN dissolved | 0.62 | ||||
| N organic dissolved | 0.62 | ||||
| NH4+ | 0.59 | ||||
| Conductivity | 0.62 | ||||
| TKN total | gN/gTS | TKN suspended | 0.73 | ||
| TKN colloids | 0.76 | ||||
| TKN dissolved | 0.98 | ||||
| N organic nitrogen | 0.81 | ||||
| NH4+ | 0.97 | ||||
| Conductivity | 0.97 | ||||
| TKN colloids | gN/gTS | NH4+ | 0.74 | TKN dissolved | 0.69 |
| Conductivity | 0.71 | ||||
| TKN dissolved | gN/gTS | N organic dissolved | 0.83 | TC/TN dissolved Cl− | −0.51 0.5 |
| NH4+ | 0.99 | ||||
| Conductivity | 0.97 | ||||
| TC/TN dissolved | - | NH4+ | −0.51 | ||
| Protein-like | 0.56 | ||||
| Fulvic acid-like | −0.58 | ||||
| N organic dissolved | gN/gTS | NH4+ Conductivity | 0.74 0.84 | Na+ | 0.65 |
| K+ | 0.51 | ||||
| Cl− | 0.55 | ||||
| NH4+ | gN/gTS | Conductivity | 0.96 | ||
| Na+ | gNa/gTS | Cl− | 0.67 | ||
| PO43− | 0.55 | ||||
| Conductivity | 0.55 | ||||
| Humic acid-like | 0.54 | ||||
| Cl− | gCl/gTS | Conductivity | 0.58 | ||
| Protein-like | −0.61 | ||||
| Glycolated-like | 0.59 | ||||
| Mean Size | µm | Median size | 0.89 | ||
| BOD5 | gO2/TS | BOD21 | 0.85 | ||
| Protein-like | - | Fulvic acid-like | −0.88 | ||
| Glycolated-like | −0.84 | ||||
| Melanoidin-like | −0.72 | ||||
| Glycolated-like | - | Melanoidin-like | 0.71 | Humic acid-like | 0.5 |
| Fulvic acid-like | - | Glycolated-like | 0.5 | ||
Publisher’s Note: MDPI stays neutral with regard to jurisdictional claims in published maps and institutional affiliations. |
© 2021 by the authors. Licensee MDPI, Basel, Switzerland. This article is an open access article distributed under the terms and conditions of the Creative Commons Attribution (CC BY) license (http://creativecommons.org/licenses/by/4.0/).
Share and Cite
Akhiar, A.; Guilayn, F.; Torrijos, M.; Battimelli, A.; Shamsuddin, A.H.; Carrère, H. Correlations between the Composition of Liquid Fraction of Full-Scale Digestates and Process Conditions. Energies 2021, 14, 971. https://doi.org/10.3390/en14040971
Akhiar A, Guilayn F, Torrijos M, Battimelli A, Shamsuddin AH, Carrère H. Correlations between the Composition of Liquid Fraction of Full-Scale Digestates and Process Conditions. Energies. 2021; 14(4):971. https://doi.org/10.3390/en14040971
Chicago/Turabian StyleAkhiar, Afifi, Felipe Guilayn, Michel Torrijos, Audrey Battimelli, Abd Halim Shamsuddin, and Hélène Carrère. 2021. "Correlations between the Composition of Liquid Fraction of Full-Scale Digestates and Process Conditions" Energies 14, no. 4: 971. https://doi.org/10.3390/en14040971
APA StyleAkhiar, A., Guilayn, F., Torrijos, M., Battimelli, A., Shamsuddin, A. H., & Carrère, H. (2021). Correlations between the Composition of Liquid Fraction of Full-Scale Digestates and Process Conditions. Energies, 14(4), 971. https://doi.org/10.3390/en14040971