1. Introduction
The trend to reduce costs in offshore wind technology is leading to the development of innovative solutions. Currently, there are several projects in the demonstration phase, which are testing the viability of solutions based on weathervaning technology. That is, the ability of the entire floating structure (composed of floater and turbine) to be passively aligned so that the rotor is set perpendicular to the incoming wind direction. This is achieved by allowing the floating structure to rotate freely over a single point (the pivot point). This pivot point can be located in both, at a point far from this platform or on the same horizontal plane of the floating platform depending on the technological solution adopted, as shown schematically in
Figure 1.
This solution has the advantage of removing the active yaw system, which simplifies the complexity of the turbine by dismissing mechanical components and control systems. Additionally, some designs also exploit the opportunity of being able to orient the entire assembly to propose alternative nacelle support structures to those based on towers, since in this case it is not necessary to allow the turbine to rotate on the vertical axis of the support structure.
These simplifications can be especially relevant in the case of floating offshore wind power, where all the improvements in terms of weight and mechanical complexity have a positive impact on the need for a less bulky (and cheaper) floater, as well as having a positive impact on the operational expenditure (OpEx) by requiring less operation and maintenance actions.
On the contrary, this solution presents as a main disadvantage an increase in misalignment losses due to the absence of an active yaw system.
At present, there are different technological solutions that propose floating offshore turbines (FOWT) based on a passive yaw control by providing the floating system with freedom of rotation on a single point. WindBarge is a concept proposed by NTNU researchers currently in a state of development. The proposal consists of a floating platform solution using single line mooring and weathervaning. The anchor point is far from the platform, so that the whole assembly can pivot around the anchor depending on the length of the single line mooring [
1]. The TETRAFLOAT project carried out tests in a water tank to analyse the operation of a tetrahedral floating platform for offshore wind turbines that allowed the free-yawing of the whole assembly [
2]. Scotstream proposes a solution based on the so-called Spintral floating structure that weathervanes around a single mooring point. The design is made up of a submerged frame supported by four buoyant floats. The base of the tower and the pivot point are located along the longest axis of the structure, so that misalignment is minimized [
3]. The CoensHexicon joint venture is developing a multi-turbine floating platform based on weathervaning by means of a pivot point located at one of the vertices of the triangular-shaped platform, while two wind turbines are installed at the other two vertices [
4]. W2Power proposes a similar technological solution, also based on the assembly of two turbines on a triangular platform. W2Power demonstrated a 1:6 scale prototype in real operating conditions during 2019 [
5]. The company Saitec proposes a new platform concept consisting of two cylindrical hulls mounted on a frame structure with a single point mooring at one of the longitudinal edges of the platform, while the wind turbine tower is positioned at the opposite edge. This enables the passive alignment of the assembly according to the wind direction. This solution has been named by the company as SATH concept [
6] and has been validated by numerical simulations and wave tank tests. The concept is currently (mid-2020) in the study phase prior to the installation of a 2 MW prototype demonstrator under real operating conditions [
7]. X1Wind has developed a concept called PivotBuoy, which is based on a weathervaning downwind design and a single point mooring system, so that the whole assembly has the ability to rotate on the pivot point located at one extreme of the floating platform [
8]. The project has recently (mid-2019) received funding from the European Commission for the execution of a prototype demonstrator in real operating conditions [
9]. The company Eolink proposes a floater design anchored to a single point away from the platform by means of two mooring lines that allow the whole assembly to weathervane according to the direction of the wind. The concept has been successfully tested in a test tank, as well as in real operating conditions at sea with a 1:10 scale prototype operating for 6 months in 2018. The concept is currently under construction at full scale and is expected to be operational during 2021 [
10].
The optimal wind turbines micro-siting problem has been widely studied in the existing scientific literature. There are two main lines of research on this problem: (i) the development of new optimization methods based on already existing wind farm models to solve the optimal micro-siting problem; and (ii) the development of new and more realistic wind farm models concerning several features such as costs, energy production, uncertainty or environmental issues, among others. The authors would like to refer to, [
11,
12,
13,
14,
15,
16] for a thorough literature review of this problem.
In 2005, Grady et al. [
17] proposed a genetic algorithm (GA) for the minimization of the energy production cost by a simplified economic model based on economies of scale. In 2010 Serrano et al. [
18] proposed a complete wind farm economic to maximise the net present value of onshore wind farms by a GA. The same authors further improved this approach by particularising the economic model to offshore wind farms [
19]. In 2010, Wan et al. [
20] proposed a particles swarm optimization (PSO) algorithm considering a continuous computational domain. This work was further improved in 2012 by including a local search strategy [
21]. An iterative approach based on detailed economic aspects was introduce by Mirghaed and Roshandel in 2013 [
22]. In 2015 Gao et al. [
23] presented a multi-population GA to optimize a case study for an offshore wind farm in Hong Kong. Hou et al. [
24] proposed a PSO algorithm particularised to optimize large offshore wind farms. An innovative bio-inspired algorithm, the Coral Reefs Optimization algorithm, was presented by Salcedo et al. [
25] in order to maximize the energy production of offshore wind farms. Sun et al. [
26] proposed an approach for the optimization of offshore wind farms by analyzing the space restriction considering multiple types of turbines. Parada et al. [
27] introduced in 2017 an optimization approach including a Gaussian model for the evaluation of the wake effect. Nouri et al. [
28] analyzed the influence of Coriolis force on the wake effect under yaw misalignment conditions. Ju and Liu [
29] introduced in 2019 a new approach based on a self-reported genetic algorithm, identifying the influence of each chromosome on the efficiency of the wind farm, which allowed improving the efficiency of the optimization algorithm through more selective mutation and crossover operators. This work was further extended in 2020 [
30] by means of a bi-criteria mechanism for the identification and relocation of wind turbines to guide the genetic algorithm.
There are also several works focused on the development and implementation of more realistic models for the economic evaluation of wind farms. One of the aspects that has captured most interest is the integration of the sub-problem related to the optimal design of the electrical layout. Serrano et al. [
31] proposed in 2011 the integration of both problems (micro-siting and electricity infrastructure) by two nested optimization algorithms. Hou et al. [
32] proposed the joint optimization of the inner electricity infrastructure and the wind-turbine layout by means an integrated optimization approach for offshore wind farms. A multi-objective algorithm to simultaneously optimize the wind-turbine micro-siting and layout of the electricity infrastructure of offshore wind farms was presented by Rodrigues et al. [
33]. In the same line of work, Tao et al. [
34] introduced in 2021 an approach also aimed at the joint optimisation of both sub-problems through a bi-level multi-objective optimisation framework.
With regard to floating offshore wind farms (FOWF), there are also a number of studies that analyse specific aspects of this type of technology. Castro et al. [
35] proposed a life-cycle cost analysis for floating offshore wind farms in order to determine its economic feasibility. In the same line of work, Kausche et al. [
36] presented in 2018 a paper focused on the economic and environmental analysis of floating wind turbines, based on tension-leg platform sub-structures, comparing its suitability with other types of floating solutions. Other aspects such as the integrated aerodynamic behaviour of the turbine and floater by means of computational fluid dynamics has been studied in the paper presented by Liu et al. [
37]. It is also worth mentioning the work carried out on floating platform repositioning and orientation techniques. Han and Nagamune [
38] presented a strategy for repositioning the floating platform with the aim of minimizing the wake effect, by taking into account wind and wave profiles. Kheirabadi and Nagamune [
39] presented a wind farm control concept to passively reposition FOWT focused on the so-called yaw and induction-based turbine repositioning strategy.
Finally, with regard to the micro-siting problem for floating wind turbines, to the authors’ knowledge, there are currently only two published works that address this topic. Clark et al. [
40] developed a comprehensive model for the economic evaluation of hybrid projects consisting of floating wind turbines and wave energy converters on the same platform. The authors analyse a case study of a project located in the North Sea. However, the objective of the work is the validation of the proposed model so the work does not undertake the optimization of the problem. Rodrigues et al. [
41] presented a novel layout optimization framework for wind farms composed of moveable floating turbines to reduce overall losses due to wake effect. The objective was to determine the anchoring positions, as well as the positions that FOWTs can take, assuming that they can be moved in a controlled manner within a given area of movement around the anchoring location.
This work fills the existing gap in the literature by introducing for the first time (to the authors’ knowledge) a specific optimization tool for optimal micro-siting of floating wind farms focused on the novel weathervaning-based technology. In this way, this work provides a practical solution to a new need of the offshore wind sector. The optimization process is driven by maximizing a tailored levelized cost of energy (LCoE) for weathervaning-based technology. This LCoE realistically considers the calculation of the capital expenditure (CapEx) and the OpEx, as well as the annual energy produced (AEP). A specific AEP assessment module is introduced in this work, by considering the position changes of FOWTs due to the pivoting movement around the anchorage point depending on the incoming wind direction. Likewise, a new detailed and specific CapEx model is proposed, by considering realistic acquisition and installation costs (documented in the existing literature) for each of the substructures that make up the FOWF: wind turbine, floater, moorings, anchors, dynamic cables and bottom-fixed cables. A specific approach is also proposed for the calculation of the total length of the array cables, taking into consideration the layout of fixed-bottom cables between the substation and the anchorage points as well as the layout of dynamic cables (based on the typical lazy wave configuration) between anchorage points and their wind turbine assembly. Finally, several realistic constraints such as the maximum deployable area and the shape of the plot are taken into account. Thus, the proposed approach enables a realistic procedure for the optimization of the layout of FOWFs.
The methodology developed in this work can be of interest to researchers as well and offshore wind energy stakeholders, since it introduces for the first time a customized tool for the optimization of FOWFs based on a new and promising technology, which can contribute to the creation of new knowledge for its deployment in the global energy market.
After this introduction, the paper is organized as follows.
Section 2 presents the proposed economic model for floating offshore wind farms as well as the addressed problem formulation.
Section 3 describes the proposed methodology. The results obtained for the analysed test cases are presented in
Section 4. Finally, conclusions are discussed in
Section 5.
2. Economic Model for Floating Offshore Wind Farm and Problem Formulation
This paper aims at maximizing the LCoE of FOWFs based on weathervaning technology. The LCoE is a reference indicator, usually employed by both regulators and industry to evaluate the economic performance of renewable energy projects [
33,
42]. Considering a potential solution,
x, of the proposed problem, the LCoE of the FOWF can be calculated as shown in Equation (1):
where
L is the project life span;
AEP(
x) stands for the annual energy produced;
C(
x)
O&M stands for the annual cost of operation and maintenance;
r is the discount rate and
Ii(
x) is the initial investment for floating offshore wind farm, considering acquisition and installation costs of wind turbines, floating platforms, moorings, anchoring systems and array cables (both fixed-bottom cables among anchoring points and dynamic cables between anchoring points and floater for each FOWT).
The calculation of the layout of the fixed-bottom array cables is performed through a simplified approach, based on the Prim’s algorithm [
43] to determine the minimum spanning tree of a graph. This simplified method does not provide the optimal solution for this sub-problem, since it does not take into account the electrical losses. Nevertheless, a reasonably good solution is achieved by this approach at very low computational cost. Additionally, in this work it is assumed that the array cables are arranged by the usual lazy wave configuration which, as shown in
Figure 1, consists of attached buoyancy modules to provide lift at midwater cable section. In this way, the length of each of the array cables between the pivot point and the base of the turbine can be approximated by the following expression (adapted from [
44]):
where
LDyanmic_cable is the total cable length of dynamic cables,
depth is seabed depth and
Rw is the weathervaning radius. Thus, the total acquisition and installation investment in the inner electrical infrastructure is calculated as the total length of both fixed-bottom and dynamic cables multiplied, respectively, by their unitary (per unit length) acquisition and installation cost.
The length of the moorings for each wind turbine is approximated by the hypotenuse of the triangle that forms the sea depth and the horizontal distance between the anchoring point and mooring point at the platform (i.e., the weathervaning radius minus the distance between mooring point at the platform and wind turbine base). In this way, the total cost of the moorings is calculated as their unit cost (per unit length) multiplied by the number of moorings per FOWT and by the number of FOWT. The authors would like to refer to
Section 4 for further details on the costs considered in this paper on each of the FOWF substructures.
In order to calculate the wakes among FOWT (and consequently the AEP), it is necessary to take into account that the position of each wind turbine is variable depending on the incoming wind direction. As schematically shown in
Figure 2, each FOWT is able to move within a circle defined by the pivot point, whose geographical coordinates are determined by the optimization algorithm) and the weathervaning radius,
Rw. Therefore, the actual position of each FOWT depending on the incoming wind direction can be determined according to the following equation:
where (
X,
Y) are the geographical coordinates of each wind turbine depending on the wind direction, (
X0,
Y0) are the geographical coordinates of the pivot point for each FOWT obtained through the optimization routine and
is the angle of the incoming wind direction.
As usual in the characterisation of the statistical behaviour of the wind speed, yhe wind behaviour is modelled by the Weibull distribution parameters: the shape parameter,
K, (which defines how variable the wind speed is, the lower the value of the shape factor the greater the variability of the wind speed) and the scale parameter,
C; (which is directly related to average wind speed) which enable the calculation of the probability,
p(
u), of occurrence for a certain free-flow wind speed,
u, according to [
45]:
The wake effect produced by another FOWT located upwind can be calculated by means of the following expression [
46,
47]:
where
u’ is the resulting wind speed,
u stands for the free-flow speed,
D is the rotor diameter,
CT(
u0) is the thrust coefficient (whose dependence on wind speed is provided by the wind turbine manufacturer),
d is the downwind distance and
k is the wake decay constant (a reference value of
k = 0.05 is usually employed in case of offshore wind farms). It is worth noting that this wake model has also been used by the only previous work that (according to the authors’ knowledge) addresses the optimization of floating wind farms [
41]. Finally, the annual energy production is computed by considering the wind speed-power production characteristic of the wind turbine model,
PWT(
u), taking into account the actual wind speed,
u’, at the position of each FOWT and the occurrence probability,
p(
u’ij), for a certain wind speed, as obtained by Equation (4):
where sub-index
j refers to the
j-th FOWT, sub-index
i stands for the
i-th wind rose sector,
T is the number of hours in a year,
Ns is the number of sectors considered in the wind rose data,
pSi is the probability of occurrence for each sector of the wind rose,
NWT is the wind turbines number, and
uci and
uco are, respectively, the cut-in speed and cut-out speed of the wind turbine model. Finally,
klosses refers to the energy losses factor (
klosses < 1) due to several aspects such as yaw misalignment, dirt or unavailability of the FOWT due to operation and maintenance issues which in the case of offshore wind farms is usually in the range of 4–10% [
48,
49].
3. Proposed Methodology
In this work, the optimization of the position of each of the FOWTs that make up the project is addressed. For this purpose, a wind farm configuration composed by symmetrical/regular layouts is proposed. This kind of configuration has been proven to be less optimal than irregular layouts in terms of maximizing the energy yield [
50]. However, most already operational offshore projects use grid-like layouts. This is due to two main reasons: (i) in the case of near-shore wind facilities it enables to mitigate the visual impact; and (ii) the navigability of the area in order to perform operations and maintenance tasks and for the activities of fisheries is facilitated by grid-like layouts.
From the point of view of the mathematical modelling of the problem, grid-like layouts can be defined by just a few variables because of the existing geometrical relationships in this kind of configurations. However, the optimization problem proposed in this work cannot be completely defined in an analytical form, which prevents the use of classic analytical optimization techniques. Therefore, in this work a meta-heuristic procedure, a genetic algorithm, is proposed to maximize the objective function.
Figure 3 shows the flowchart of the optimisation scheme proposed in this work. The algorithm initially generates a population composed of a set of potential individuals/solutions generated randomly. Then, the algorithm proceeds to the evaluation of each of the individuals with the aim of determining the value of the objective function (the levelised cost of energy). However, with the aim of enhancing the convergence of the proposed method, a local search operator (based on a pattern search algorithm) is also proposed to locally improve each individual, that is, by iteratively modifying in small steps the value of each of the design variables and moving (in each iteration) towards the solution with the lowest LCoE. Next, the selection operator is computed to determine the individuals that will be applied in the crossover and mutation operators. The crossover operator is applied to two selected individuals to generate new potential solutions, with a mix of chromosomes from two individuals. The mutation operator is applied to selected potential solutions to generate a new individual by randomly changing one or more of the chromosomes. Finally, once the maximum number of generations is reached (convergence criterion considered in this work), the best solution obtained throughout the execution of the algorithm is considered as the optimal solution.
3.1. Formulation of the Problem
The formulation of the proposed problem to be optimized in this work can be formulated as defined by the following expression:
As it can be observed, the proposed objective function is the minimization of the LCoE, as defined by Equation (1). The values that this objective function can take along the optimization process depend on the design variables set for each individual by the array
x (as shown below in
Section 3.2). The first constraint shown in the formulation sets the maximum,
xmax, and minimum,
xmin, values on the design variables; the following constraint limits all possible positions that wind turbines can occupy during their weathervaning motion around their respective pivot point—as defined in Equation (3)—to lie inside the plot feasible surface {
X,
Y}
feasible; the third constraint concerns the minimum distance at which the pivot point of each FOWT can be located from each other for safety reasons. In this work it is considered that the minimum distance has to be higher than twice the weathervaning radius,
rw, (thus avoiding possible collisions in case of extreme misalignments); the following constraint implies that the number of wind turbines should be equal to the pre-defined number for the project; and finally, the fifth constrainnt limits the area occupied by FOWTs,
A(
x), during their weathervaning motion to not exceeding the maximum area occupied allowed for the project,
Amax.
3.2. Individual/Potential Solution Codification
The individual codification proposed in this work to model the wind turbines layout for each potential solution is defined by an array composed of eight elements where Nr and Nc are, respectively, the number of rows and columns for the i-th potential solution, α is the angle between rows and the horizontal axis, β is the angle between rows and columns, dr is the distance between consecutive FOWTs in the same row, dc is the distance between consecutive FOWTs in the same column, and, finally, dx and dy are, respectively, the horizontal and vertical distance from the centre of symmetry of the layout to the geographic centre of the plot feasible surface for the development of the FOWF.
Once the variables of the individual are defined, the layout is generated taking into account the relevant geometrical relationships, as shown in
Figure 4. The next step is to check that the layout is feasible by meeting all the constrains established in the formulation. Otherwise, the following actions are taken into account:
- -
If the number of FOWTs within the plot feasible surface (represented in
Figure 4 by the red lines) is greater than the pre-established number of wind turbines, the FOWTs closest to the plot boundary are successively eliminated until the required number is reached.
- -
On the contrary, if the number of FOWTs inside the plot is less than the pre-established number, the non-feasible wind turbines closest to the plot boundary are preserved, by penalizing the solution by a proportional factor to the total distance of the non-feasible wind turbines from the plot boundary. In this way, the convergence of the algorithm is improved by preserving solutions that initially do not meet this constrain but that in the next generations have the potential to derive in feasible solutions. For more details, the authors would like to refer to our previous work [
51].
- -
If the area occupied by the wind turbines is greater than the maximum area occupied (usually established by the authorities in the tender conditions and expressed in square kilometres for a given rated power of the project), the individual is proportionally penalized to the exceeding area. The occupied area is determined by taking into consideration the outer envelope of the FOWT positions during weathervaning motion, as schematically shown in
Figure 4 by the dotted surface. Otherwise, if the number of wind turbines is less than the predefined number, the individual is discarded. Finally, solutions that do not comply with the minimum safety distance constrain between two consecutive FOWTs are ruled out.
4. Results
The ability of the proposed methodology to achieve the optimal solution for the calculation of optimal layouts for floating offshore wind farms based on weathervaning technology is shown and verified in this section.
Three case studies are proposed for analysis. The first case study is the base case in which a floating offshore wind farm consisting of thirty 8 MW wind turbines can be deployed over an unlimited area (i.e., no constraint is considered in either the plot feasible surface or the maximum area occupied). In practical terms, it has been considered a large enough plot so that it does not impose a limitation on the area available, which in this case is a square-shaped plot 20 km × 20 km in size. Cases 2 and 3 start from the same base case but introducing constraints that allow the behaviour of the proposed methodology to be analysed under realistic conditions, by considering a limited maximum area occupied allowed for the construction of the FOWF (Case 2) and also considering the shape of the plot feasible surface (Case 3). In all cases, special attention is paid to the suitability of the solution obtained in terms of the area occupied, an issue of great importance for weathervaning turbines, as this technology requires greater space availability.
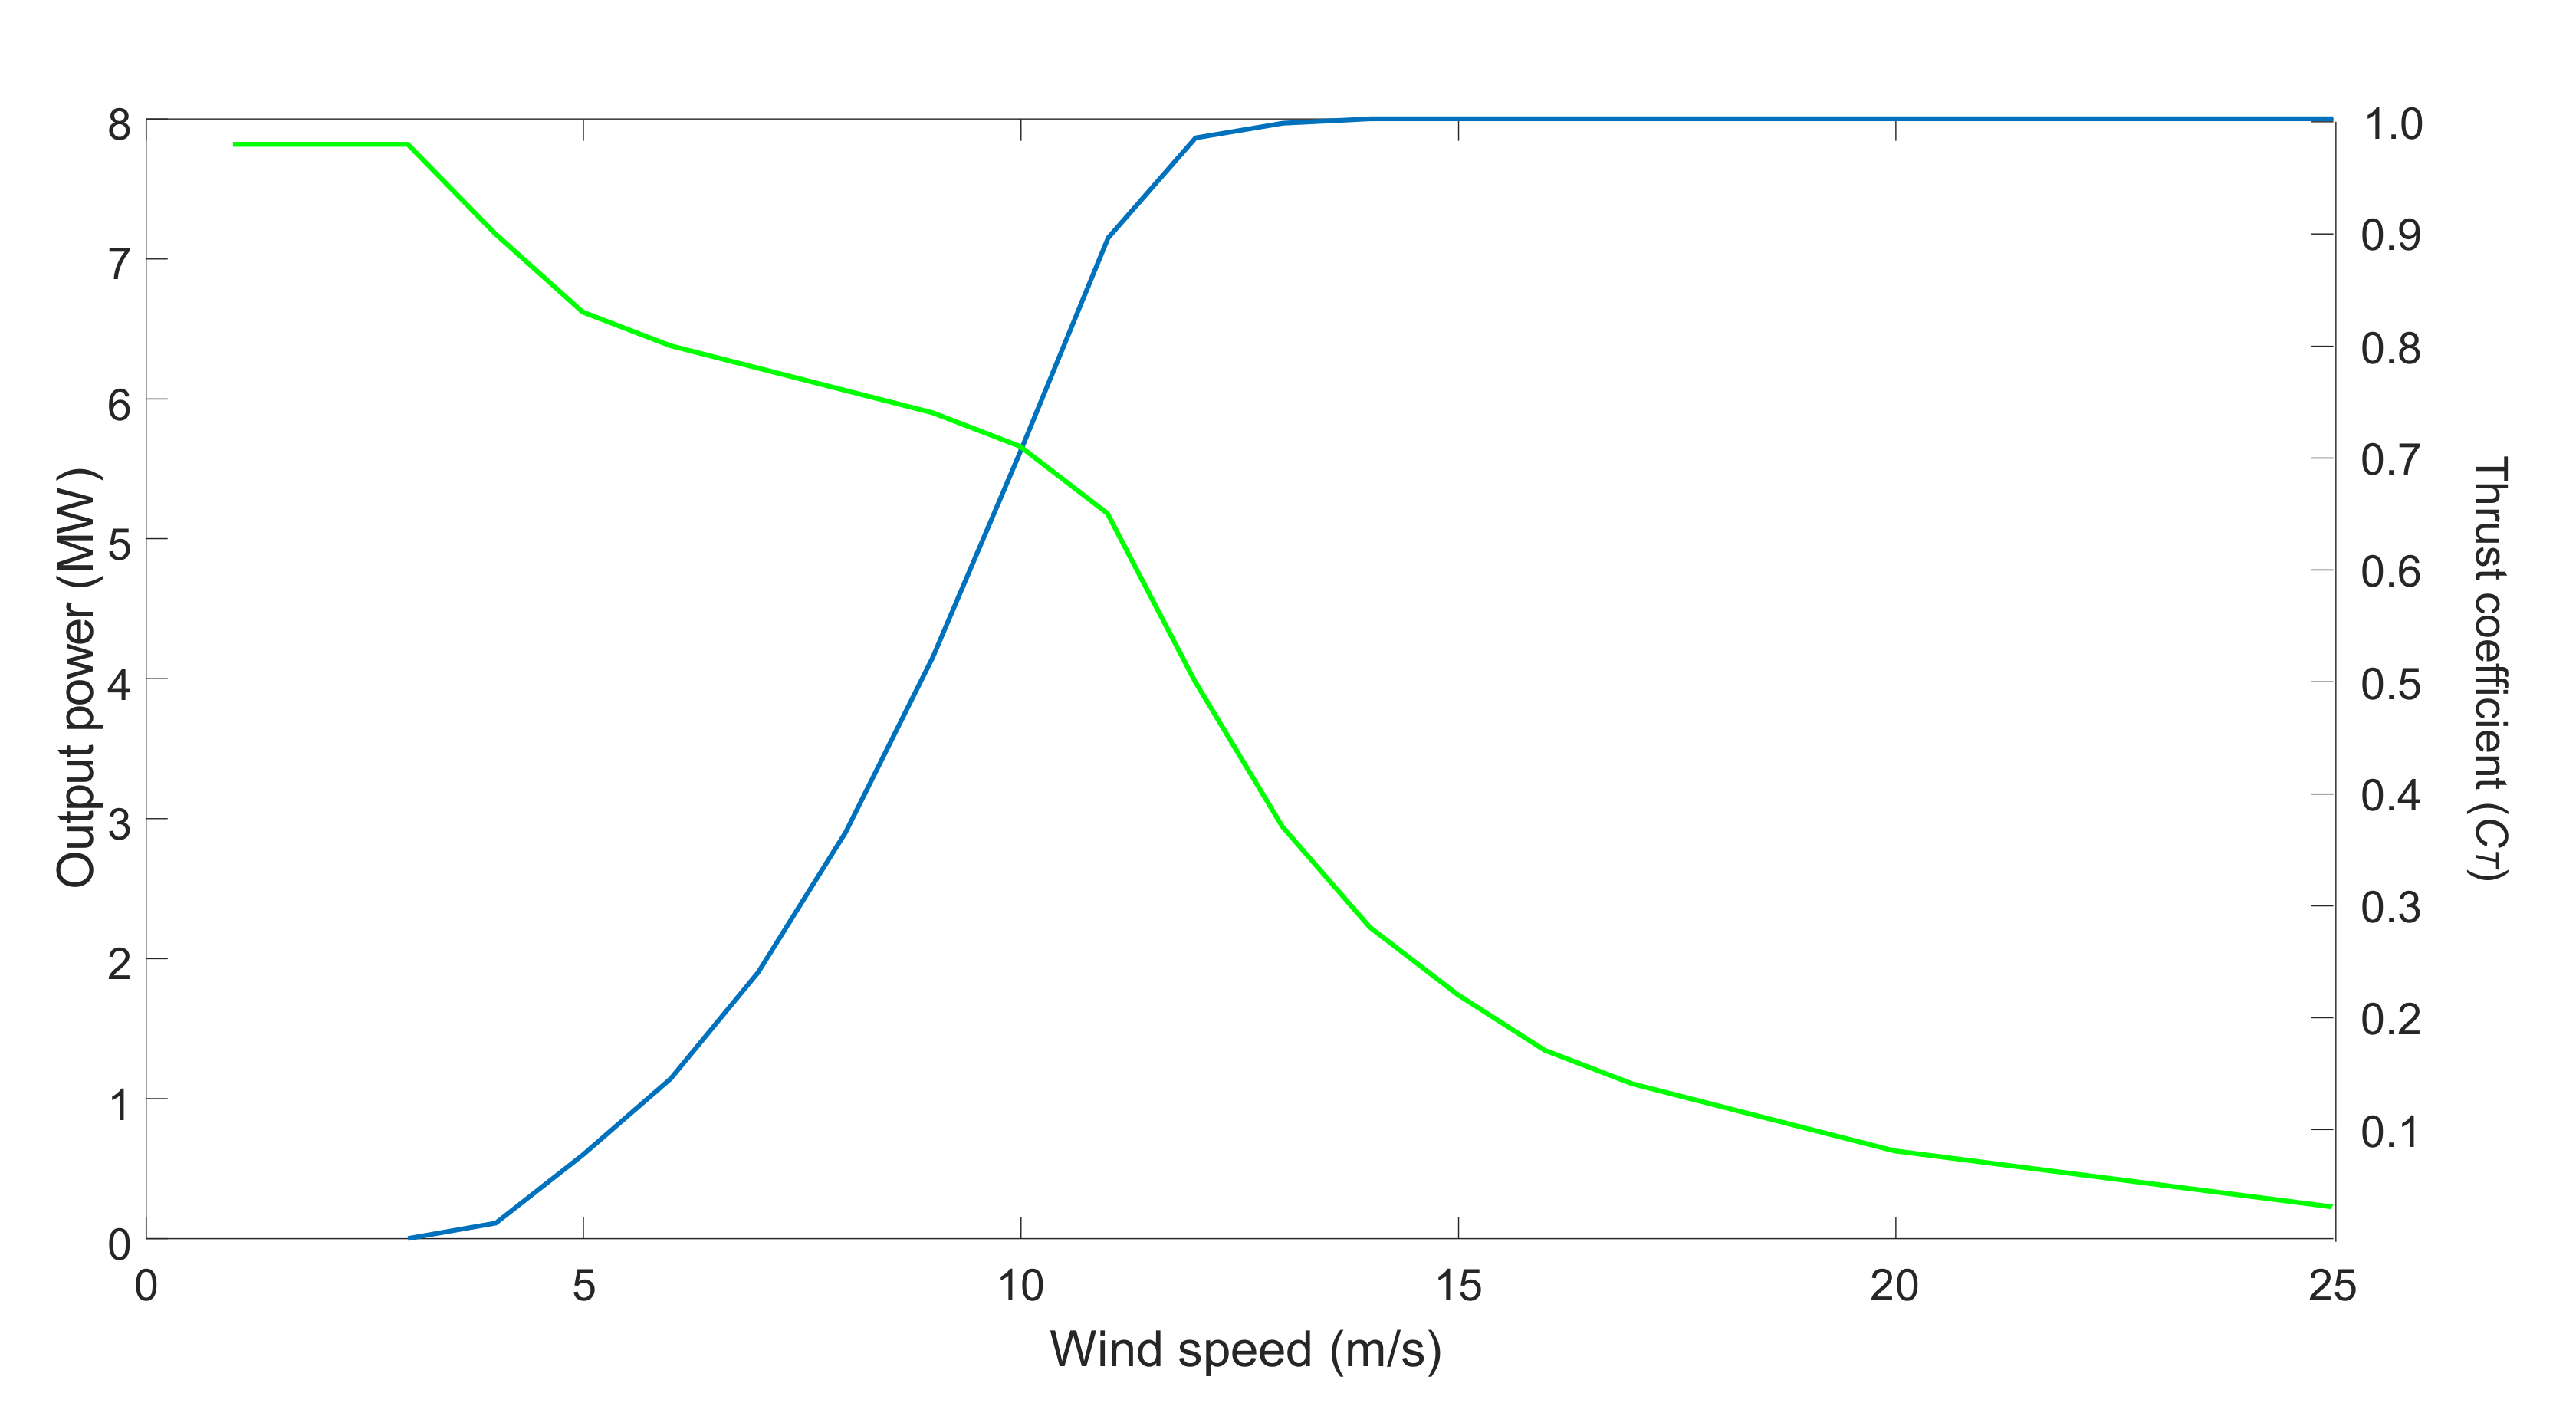
The probability of occurrence for each wind direction as well as the scale factors,
C, and shape factors,
K, of the Weibull distribution, used to model the wind behaviour are shown in
Table 1. The LEANWIND 8 MW reference turbine is the wind turbine model considered to run the test cases. This wind turbine has a rotor diameter of 164 m and the power curve and thrust coefficient curves are shown in
Figure 5.
Table 2 summarizes the techno-economic input data used in the test cases (nevertheless, it worth noting that the costs of floating wind vary greatly depending on the specific project, as it is a technology still in the demonstration and development phase). The origin and assumptions considered in this data are briefly described in the following lines. The cost of the wind turbine has been taken from [
53]. The acquisition cost of the floating platform has been obtained by performing a linear interpolation between the costs provided in [
54] for a 5 and 10 MW turbine. The anchors cost has been collected from [
55] assuming the same unit cost (M€/MW) as for the case of the Hywind II project. The cost of the moorings has also been taken from [
55], considering a steel wire mooring (it is also necessary to mention that FOWT assembly analysed in the present work considers that the mooring system is constituted by four mooring lines). The cost of the array cables both dynamic and fixed-bottom have been retrieved from [
56]. The installation cost of the wind turbine assembly has been taken from [
55] (again assuming the same unit cost as in the case of the Hywind II project). The installation cost of the array cables is also taken from [
55] (the same cost has been considered for the case of fixed-bottom and dynamic cables, since no specific costs for the latter have been found in the literature by the authors). The economic data concerning operating costs and discount rate have been taken from [
57] (assuming an exchange rate of 1 EUR = 1.2 USD).
The main optimization algorithm is run during 50 generations in order to obtain the optimal solution. The population size has been set to 40 individuals. Each one of these individuals generated by the Genetic Algorithm is locally optimized by the pattern search routine during 10 iterations. In the first iteration of this pattern search routine, the incremental step size to perform the search is initially set to 1 and it is doubled or halved, respectively, in successive iterations depending on whether the objective function improves or not in the corresponding iteration. The algorithms were implemented in MATLAB (The MathWorks, Inc., Natick, Massachusetts, United States) and all test cases were run on an Intel(R) CoreTM i7-7700 CPU, with 2.80 GHz and 16 GB RAM under Windows 10.
4.1. Case 1
This first test case considers that the thirty FOWTs (the number of turbines is considered a predefined parameter, since the nominal power of the project is established by the tendering process) can be freely installed without any constraints regarding the maximum occupied area or the plot feasible surface corresponding to the concession area. In this way, the distance between wind turbines will only be limited by the trade-off between maximising AEP by spacing the wind turbines and minimising the costs of the array cables, as the FOWTs are placed closer together.
Different variants of this case have been implemented by modifying the weathervaning radius from zero to a maximum value of three times the rotor diameter. In this manner, the lower values of the weathervaning radius (around 1
D) would correspond to the technological solutions that propose the pivot point be located on the same floating platform (as shown in the example in
Figure 1b), while longer weathervaning radius would correspond to the technological solutions that propose the pivot point be located outside the platform (as shown in the example in
Figure 1a). Additionally, in order to compare the characteristics of floating wind farms based on weathervaning with standard technology based on an active yaw control system, the assumption that weathervaning radius is zero has also been analysed (this would be equivalent to considering a turbine assembly plus floater with active yaw control).
Figure 6 shows the layouts obtained for the different values of
Rw analysed. It can be seen that the solutions obtained by the proposed algorithm are virtually identical. The pivot points (represented by the blue filled points) are virtually the same and the only noticeable difference in the figure consists in the possible positions that the FOWTs can reach as a consequence of the weathervaning motion (represented in the figure by the concentric blue circles with dotted lines). This similarity among the solutions can also be observed in the data shown in
Table 3, where it can be seen that the energy generated remain at very similar values for all the
Rw values analysed. This is due to the fact that, although the wind turbines can move around each pivot point, it is assumed that all of them do so in a solidary way according to the incoming wind direction, so the relative positions between the wind turbines are not affected by the length of the
Rw and, as a consequence, the effect of the wakes is also identical and independent of the weathervaning radius. However, it should be noted that in this Case 1 it is being assumed that there are no constraint for both the maximum area occupied and the plot feasible surface. As it can be seen in the table, the occupied area grows noticeably as
Rw increases. For example, for a value of
Rw = 1
D, the occupied area grows by 8% with respect to the classic solution based on active yaw control (
Rw = 0), while if the
Rw increases to 3
D, the occupied area is 34% higher. As shown below (in Case 2 and Case 3), the occupied area is a decisive issue in the problem of micro-siting for FOWT based on weathervaning, when constrains regading available area and shape of the plot are considered. On the other hand,
Table 3 also shows that the main difference between the obtained solutions lies in the initial investment as a consequence of the higher cost of the dynamic cables and moorings as the weathervaning radius increases. This difference in the initial investment is what makes the LCoE to moderately increase for higher values of
Rw.
4.2. Case 2
This second case reproduces all the conditions set out in Case 1, with the exception that a greater degree of realism is introduced by limiting the maximum area that the FOWF can occupy. For this purpose, the optimization algorithm has been executed in successive occasions by varying (in steps of 5 km2) the value of the maximum area occupied within the range 30–60 km2. Likewise, this analysis has been repeated for different weathervaning radius, from 0 to 3 times the diameter of the wind turbine rotor.
As a reference, it is interesting to note that for the case of already operating fixed-bottom offshore wind farms there is a great diversity in the relationship between the total power of the project and the area occupied, taking values within the range 4–20 MW/km
2 [
58]. Therefore, and assuming that the available area needs for weathervaning-based wind technology is higher than in the case of fixed-bottom offshore wind turbines, this paper has taken as reference the minimum values of this range (within 4–8 MW/km
2) which would lead to a maximum area occupied of around 30–60 km
2 for an offshore wind farm of 240 MW, as it is the case of the project analysed in this work.
Figure 7 and
Figure 8 show, respectively, the AEP and the LCoE corresponding to the optimal solution for each of the analysed situations. As can be seen in
Figure 7, the greater the available area, the higher the AEP. This is due to the higher energy production as a result of the lower wake effect, as the wind turbines have the option of spacing out more due to the higher area availability. On the contrary, as the area available to develop the project is smaller, the pivot points must be located closer together, which increases the wake effect losses. This aspect is even more critical as the weathervaning radius increases, since larger weathervaning radius implies more occupied area for the same number of FOWTs.
In addition, the influence of the maximum area occupied on the LCoE is uneven depending on the weathervaning radius. As can be seen in
Figure 8, for
Rw values between 0 and 1
D the differences between the LCoE are relatively small. For the case of
Rw = 2
D, it can be seen how by reducing the available area under 55 km
2 the AEP (and hence LCoE) is significantly affected, having an optimal solution with considerably lower AEP (as can be seen in
Figure 7) as a result of the greater space requirements for FOWTs to perform weathervaning motion in this situation. This same effect can be seen in
Figure 8 the case of
Rw = 3
D, for which a significantly lower LCoE is obtained than in the case of lower values of weathervaning radius, which is also a consequence of the higher cost of dynamic cables, but above all because of the lower energy produced.
Figure 9 shows the layouts obtained for
Rw = 3
D, depending on the maximum area allowed. As can be seen, this constrain has a considerable influence on the optimal layout, since as the area available is smaller, the optimization algorithm adapts the optimal solution so that it complies with the minimum safety distance constraint between FOWTs while maximizing the LCoE.
4.3. Case 3
The third case analysed in this paper also reproduces the conditions set in Case 1, but considering the realistic conditions established by the geographical coordinates that define the plot on which the FOWF can be developed, as is the case in the vast majority of offshore wind projects. Therefore, in this case the plot feasible surface is delimited by the vertices defined by the following geographical coordinates (units in meters): [0, 0], [5376, 200], [8040, 1200], [8712, 7665], and [400, 8832]. Again, the optimization algorithm has been executed for different values of Rw, within the range 0–3 D.
Figure 10 shows the layouts of the optimal solutions obtained for each of the
Rw values considered within the range 0–3
D for Case 3. As can be seen, the plot feasible surface limits the positions where FOWTs can be located, so as
Rw increases, the pivot points tend to be located closer together in order to avoid the wind turbines being located outside the plot during weathervaning motion. This fact leads to a lower AEP as
Rw growths (as can be seen in
Table 4), which is a consequence of the higher losses due to wake effect, since wind turbines are more concentrated geographically. On the other hand, this makes the cost of the fixed-bottom array cables lower as
Rw increases, which partially compensates the increase of the dynamic cables cost for longer weathervaning radius, making the initial investment increase moderately as a function of
Rw.
5. Conclusions
This paper introduces a novel approach aimed at optimizing the layout of floating offshore wind farms based on weathervaning technology, which is currently under development and close to commercial exploitation with several demonstration projects currently underway.
Therefore, in this work a specific optimization tool has been developed for this concept in order to solve the problem of optimal micro-siting of floating wind turbines with the aim of minimizing the levelised cost of the energy (which is the economic indicator most commonly used by offshore wind energy stakeholders and regulators). For this purpose, a complete model of the floating offshore wind farm has been developed, by taking into consideration the weathervaning motion of the wind turbines as a function of the incoming wind direction and also including realistic aspects such as wind behaviour, wake effect, or costs of wind turbine assembly and electricity infrastructure.
To solve the proposed problem, it has been implemented a genetic algorithm based on the optimization of layouts restricted to grid-like configurations, which are commonly used in commercial offshore wind farms. This is an advantage from the point of view of the optimization routine, since this type of grid-like layouts can be defined by only a few variables thanks to the geometrical relationships existing between the geographical positions of the floating offshore wind turbines.
The test cases analysed show the capacity of the proposed methodology to solve the problem presented in this paper. Three cases have been solved, by progressively increasing the degree of realism of the problem and paying special attention to the influence of maximum area occupied and the plot feasible area for the deployment of the project. This aspect has proved to be of great importance as the weathervaning radius increases, since it influences the annual energy produced and therefore the levelized cost of energy of the project.
The work presented in this paper also offers several future research avenues such as the application of new models for the evaluation of the wake effect, the implementation of models that consider more realistically the misalignment energy losses associated with the passive yaw control, especially in situations of strong currents or waves; or also the implementation of a detailed cost model for floating offshore wind turbines, considering the specifications of the moorings, anchors and floater subsystems.
Finally, the results and methodology presented in this work may be of interest to offshore wind energy stakeholders since the methodology introduces for the first time a practical and realistic tool for the optimization of floating offshore wind farms based on the novel weathervaning technology.


 ,
, 


